may 2009 daniel r. oros environmental scientist · may 2009 daniel r. oros environmental scientist...
TRANSCRIPT
USE INFORMATION AND AIR MONITORING RECOMMENDATION FOR APPLICATION OF THE PESTICIDE ACTIVE INGREDIENT PROPYZAMIDE
May 2009
Daniel R. Oros Environmental Scientist
ENVIRONMENTAL HAZARDS ASSESSMENT PROGRAM STATE OF CALIFORNIA
Environmental Protection Agency Department of Pesticide Regulation Environmental Monitoring Branch
1001 I Street Sacramento, California, 95814
2
TABLE OF CONTENTS A. BACKGROUND....................………………................................................................…......3 Physical and Chemical Properties......................................................................................……......3
Figure 1. The chemical structure of propyzamide..........................................................…3 Table 1. Physical and chemical properties of propyzamide……………………………...4
Environmental Fate Brief..........................................................................................................…...4 Toxicity Brief.............................……....................................................................................……..5 B. PROPYZAMIDE USE IN CALIFORNIA................................……….……………………5 Pesticide Use Data Summary.....................................................................................……...……...6
Table 2. Kerb 50-W label application rates for lettuce…………………………………...6 Table 3. Annual propyzamide use by county (2003-2007)...................................…….….7 Table 4. Monthly propyzamide use by top five counties (2003-2007)……..................….8 Table 5. Annual cropland use of propyzamide in California (2003-2007).......…………..9 Table 6. Propyzamide use by commodity in top five counties (2003-2007)...........…….10 Figure 2. Annual cropland use of propyzamide by top five counties (2003-2007)……..11
C. AIR MONITORING RECOMMENDATIONS.....................……………..............…..….11 Application Site Monitoring……………………………………………………………………..11
Figure 3. Propyzamide application methods used in top five counties (2003-2007)……12 Figure 4. Cumulative percentile distributions………………….………………………..14
Ambient Monitoring Study………………………………………………………………………15 Table 7. List of communities where propyzamide use was previously reported………..16 Table 8. Rating and monitoring evaluation by community……………………………..18 Figure 5. Propyzamide use in Monterey County 2007………………………………….20 Figure 6. Propyzamide use in Monterey County 2006………………………………….21 Figure 7. Propyzamide use in Santa Barbara County 2007……………………………..22 Figure 8. Propyzamide use in Santa Barbara County 2006……………………………..23 Figure 9. Propyzamide use in Imperial County 2007…………………………………...24 Figure 10. Propyzamide use in Imperial County 2006………………………………….25 Figure 11. Propyzamide use San Luis Obispo County 2007……………………………26 Figure 12. Propyzamide use San Luis Obispo County 2006……………………………27 Figure 13. Propyzamide use San Benito County 2007………………………………….28 Figure 14. Propyzamide use San Benito County 2006………………………………….29
D. SAFETY RECOMMENDATIONS.........................................................………………….30 E. REFERENCES..........................................................................................………………….30
3
USE INFORMATION AND AIR MONITORING RECOMMENDATION FOR APPLICATION OF THE PESTICIDE
ACTIVE INGREDIENT PROPYZAMIDE
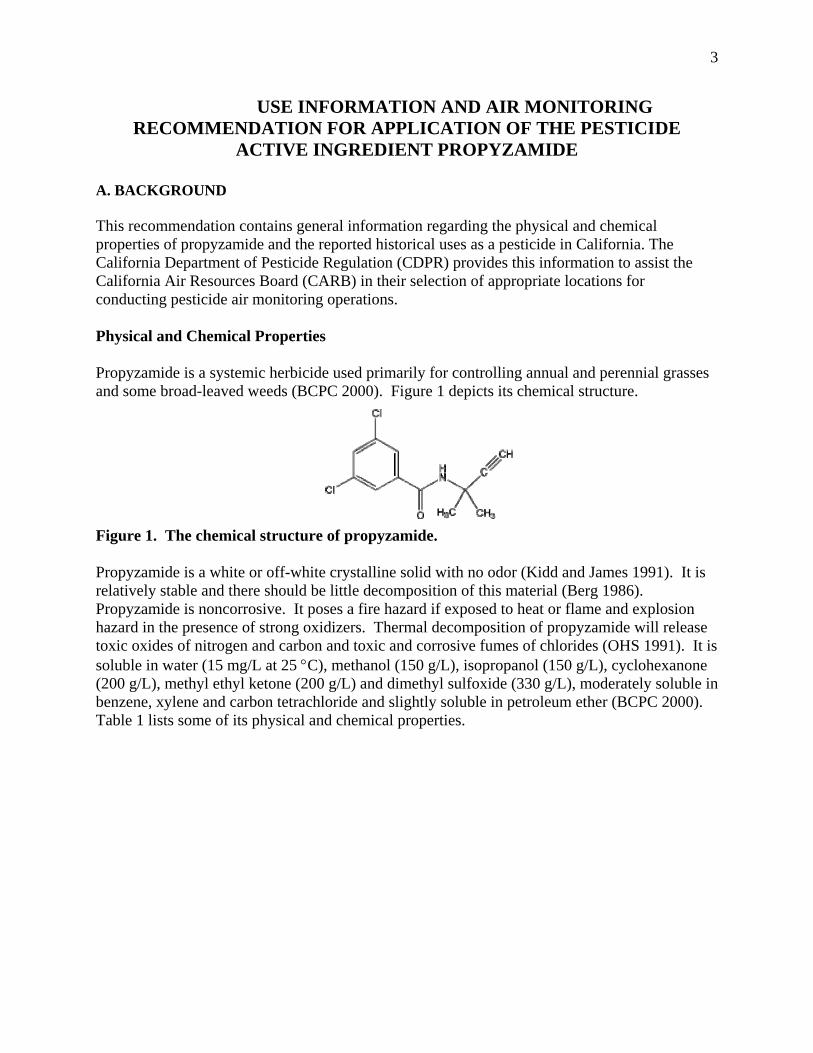
A. BACKGROUND This recommendation contains general information regarding the physical and chemical properties of propyzamide and the reported historical uses as a pesticide in California. The California Department of Pesticide Regulation (CDPR) provides this information to assist the California Air Resources Board (CARB) in their selection of appropriate locations for conducting pesticide air monitoring operations. Physical and Chemical Properties Propyzamide is a systemic herbicide used primarily for controlling annual and perennial grasses and some broad-leaved weeds (BCPC 2000). Figure 1 depicts its chemical structure.
Figure 1. The chemical structure of propyzamide. Propyzamide is a white or off-white crystalline solid with no odor (Kidd and James 1991). It is relatively stable and there should be little decomposition of this material (Berg 1986). Propyzamide is noncorrosive. It poses a fire hazard if exposed to heat or flame and explosion hazard in the presence of strong oxidizers. Thermal decomposition of propyzamide will release toxic oxides of nitrogen and carbon and toxic and corrosive fumes of chlorides (OHS 1991). It is soluble in water (15 mg/L at 25 °C), methanol (150 g/L), isopropanol (150 g/L), cyclohexanone (200 g/L), methyl ethyl ketone (200 g/L) and dimethyl sulfoxide (330 g/L), moderately soluble in benzene, xylene and carbon tetrachloride and slightly soluble in petroleum ether (BCPC 2000). Table 1 lists some of its physical and chemical properties.
4
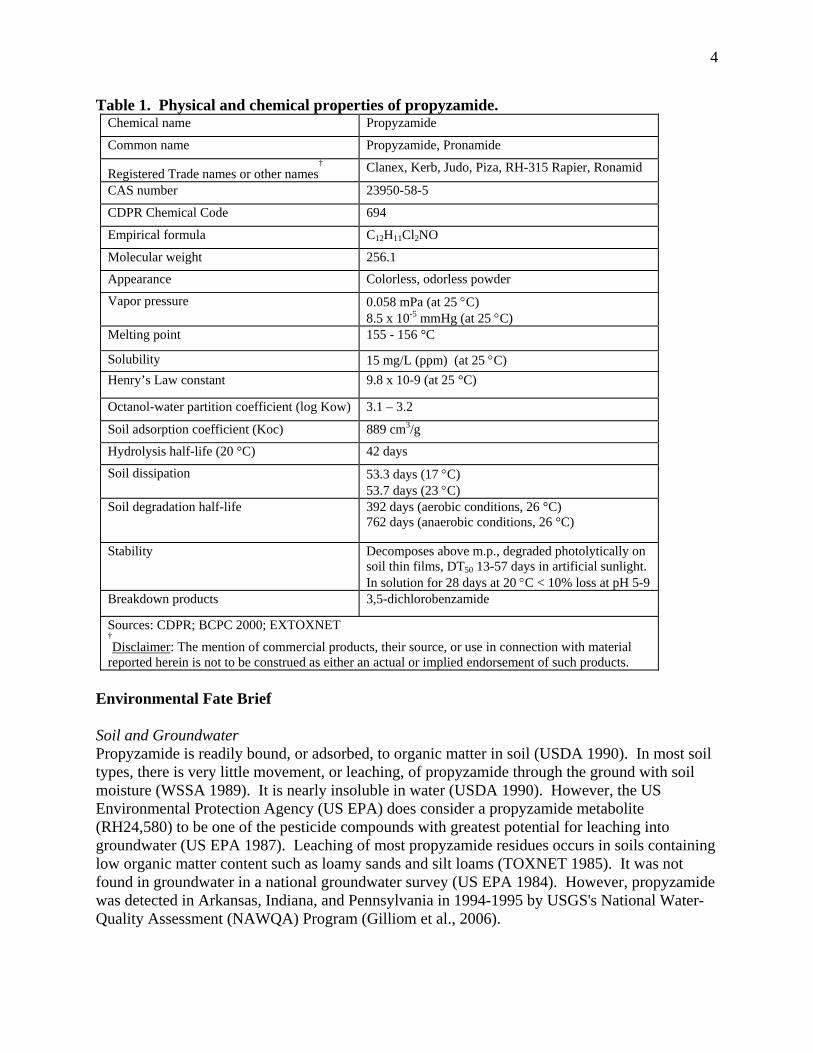
Table 1. Physical and chemical properties of propyzamide. Chemical name Propyzamide
Common name Propyzamide, Pronamide
Registered Trade names or other names† Clanex, Kerb, Judo, Piza, RH-315 Rapier, Ronamid
CAS number 23950-58-5
CDPR Chemical Code 694
Empirical formula C12H11Cl2NO
Molecular weight 256.1
Appearance Colorless, odorless powder
Vapor pressure 0.058 mPa (at 25 °C) 8.5 x 10⁻⁵ mmHg (at 25 °C)
Melting point 155 - 156 °C
Solubility 15 mg/L (ppm) (at 25 °C) Henry’s Law constant 9.8 x 10⁻⁹ (at 25 °C)
Octanol-water partition coefficient (log Kow) 3.1 – 3.2
Soil adsorption coefficient (Koc) 889 cm3/g
Hydrolysis half-life (20 °C) 42 days
Soil dissipation 53.3 days (17 °C) 53.7 days (23 °C)
Soil degradation half-life
392 days (aerobic conditions, 26 °C) 762 days (anaerobic conditions, 26 °C)
Stability Decomposes above m.p., degraded photolytically on soil thin films, DT50 13-57 days in artificial sunlight. In solution for 28 days at 20 °C < 10% loss at pH 5-9
Breakdown products 3,5-dichlorobenzamide
Sources: CDPR; BCPC 2000; EXTOXNET †Disclaimer: The mention of commercial products, their source, or use in connection with material
reported herein is not to be construed as either an actual or implied endorsement of such products. Environmental Fate Brief Soil and Groundwater Propyzamide is readily bound, or adsorbed, to organic matter in soil (USDA 1990). In most soil types, there is very little movement, or leaching, of propyzamide through the ground with soil moisture (WSSA 1989). It is nearly insoluble in water (USDA 1990). However, the US Environmental Protection Agency (US EPA) does consider a propyzamide metabolite (RH24,580) to be one of the pesticide compounds with greatest potential for leaching into groundwater (US EPA 1987). Leaching of most propyzamide residues occurs in soils containing low organic matter content such as loamy sands and silt loams (TOXNET 1985). It was not found in groundwater in a national groundwater survey (US EPA 1984). However, propyzamide was detected in Arkansas, Indiana, and Pennsylvania in 1994-1995 by USGS's National Water-Quality Assessment (NAWQA) Program (Gilliom et al., 2006).
5
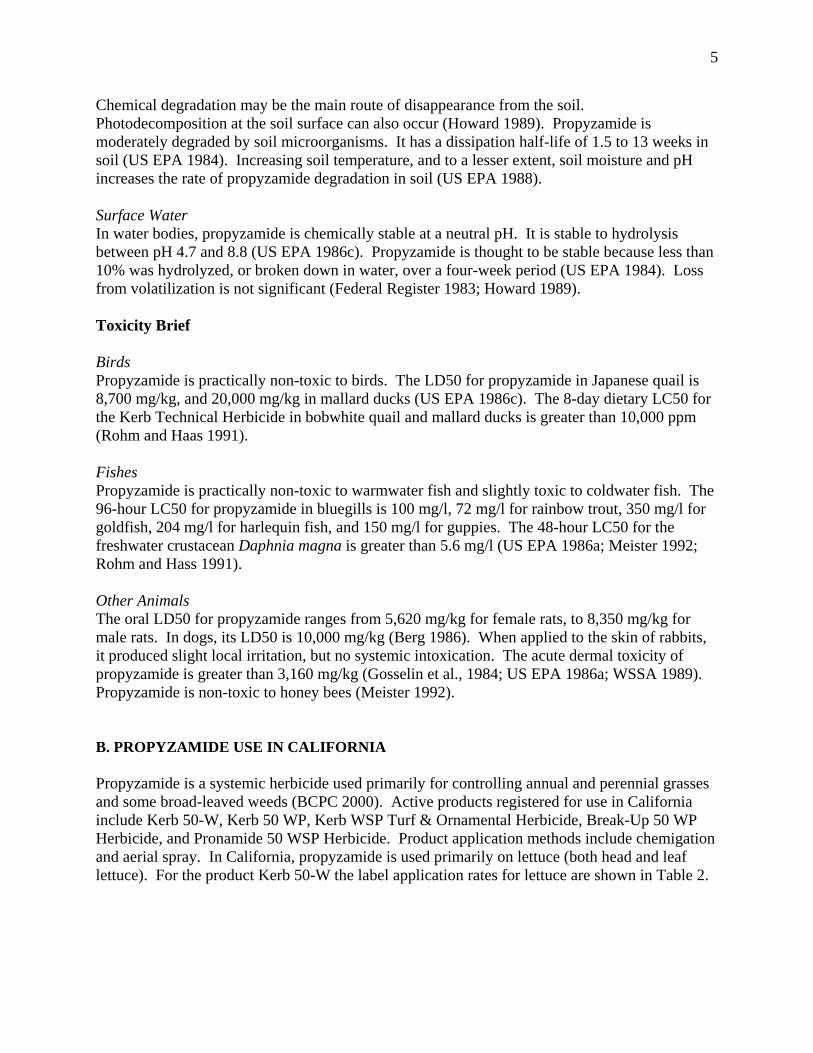
Chemical degradation may be the main route of disappearance from the soil. Photodecomposition at the soil surface can also occur (Howard 1989). Propyzamide is moderately degraded by soil microorganisms. It has a dissipation half-life of 1.5 to 13 weeks in soil (US EPA 1984). Increasing soil temperature, and to a lesser extent, soil moisture and pH increases the rate of propyzamide degradation in soil (US EPA 1988). Surface Water In water bodies, propyzamide is chemically stable at a neutral pH. It is stable to hydrolysis between pH 4.7 and 8.8 (US EPA 1986c). Propyzamide is thought to be stable because less than 10% was hydrolyzed, or broken down in water, over a four-week period (US EPA 1984). Loss from volatilization is not significant (Federal Register 1983; Howard 1989). Toxicity Brief Birds Propyzamide is practically non-toxic to birds. The LD50 for propyzamide in Japanese quail is 8,700 mg/kg, and 20,000 mg/kg in mallard ducks (US EPA 1986c). The 8-day dietary LC50 for the Kerb Technical Herbicide in bobwhite quail and mallard ducks is greater than 10,000 ppm (Rohm and Haas 1991). Fishes Propyzamide is practically non-toxic to warmwater fish and slightly toxic to coldwater fish. The 96-hour LC50 for propyzamide in bluegills is 100 mg/l, 72 mg/l for rainbow trout, 350 mg/l for goldfish, 204 mg/l for harlequin fish, and 150 mg/l for guppies. The 48-hour LC50 for the freshwater crustacean Daphnia magna is greater than 5.6 mg/l (US EPA 1986a; Meister 1992; Rohm and Hass 1991). Other Animals The oral LD50 for propyzamide ranges from 5,620 mg/kg for female rats, to 8,350 mg/kg for male rats. In dogs, its LD50 is 10,000 mg/kg (Berg 1986). When applied to the skin of rabbits, it produced slight local irritation, but no systemic intoxication. The acute dermal toxicity of propyzamide is greater than 3,160 mg/kg (Gosselin et al., 1984; US EPA 1986a; WSSA 1989). Propyzamide is non-toxic to honey bees (Meister 1992). B. PROPYZAMIDE USE IN CALIFORNIA Propyzamide is a systemic herbicide used primarily for controlling annual and perennial grasses and some broad-leaved weeds (BCPC 2000). Active products registered for use in California include Kerb 50-W, Kerb 50 WP, Kerb WSP Turf & Ornamental Herbicide, Break-Up 50 WP Herbicide, and Pronamide 50 WSP Herbicide. Product application methods include chemigation and aerial spray. In California, propyzamide is used primarily on lettuce (both head and leaf lettuce). For the product Kerb 50-W the label application rates for lettuce are shown in Table 2.
6
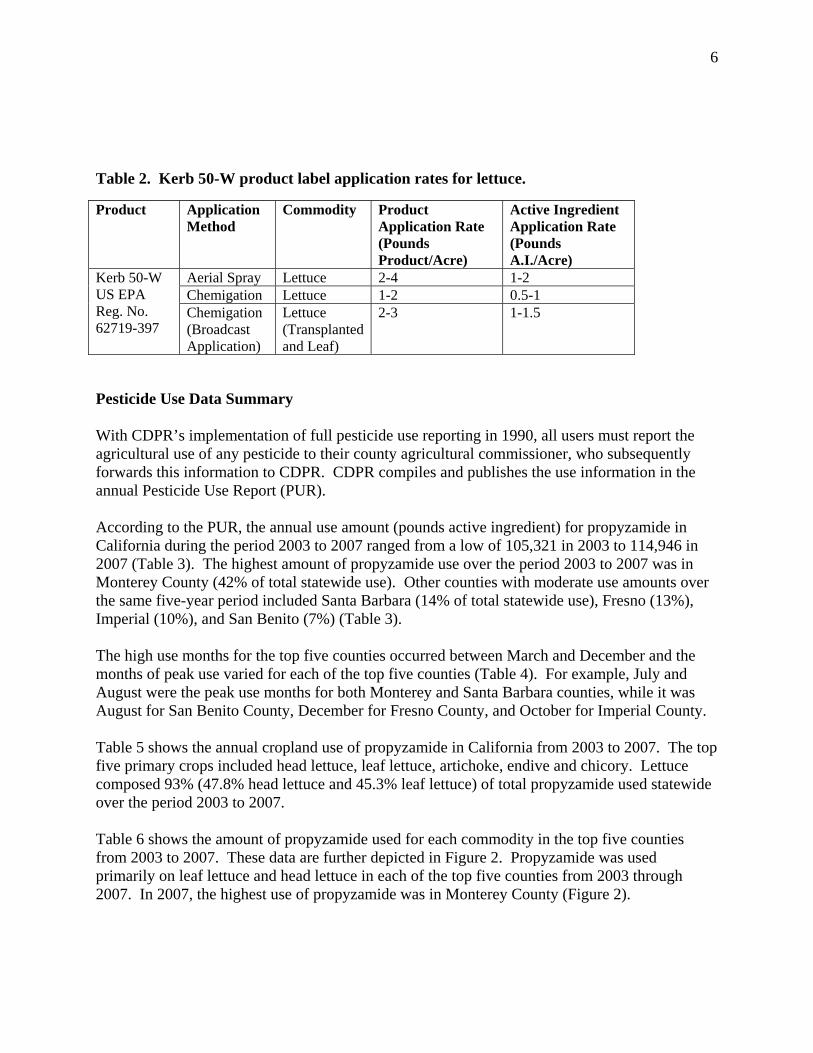
Table 2. Kerb 50-W product label application rates for lettuce.
Product Application
Method Commodity Product
Application Rate (Pounds Product/Acre)
Active Ingredient Application Rate (Pounds A.I./Acre)
Aerial Spray Lettuce 2-4 1-2 Chemigation Lettuce 1-2 0.5-1
Kerb 50-W US EPA Reg. No. 62719-397
Chemigation (Broadcast Application)
Lettuce (Transplanted and Leaf)
2-3
1-1.5
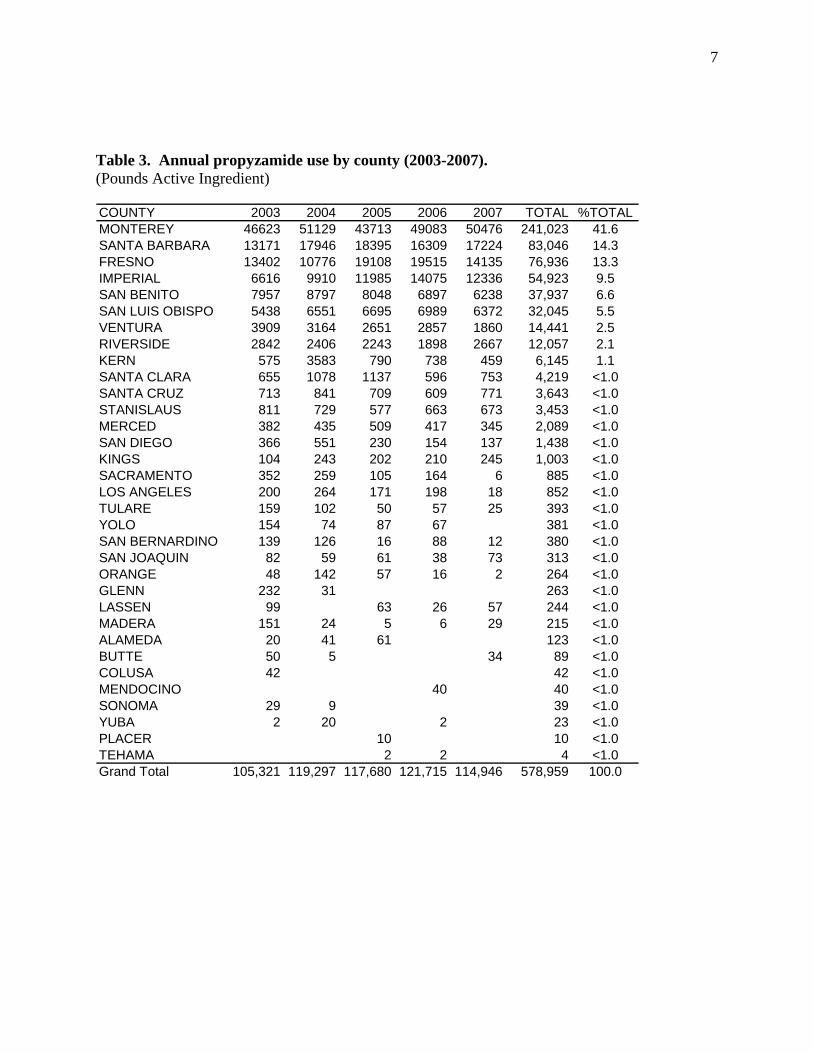
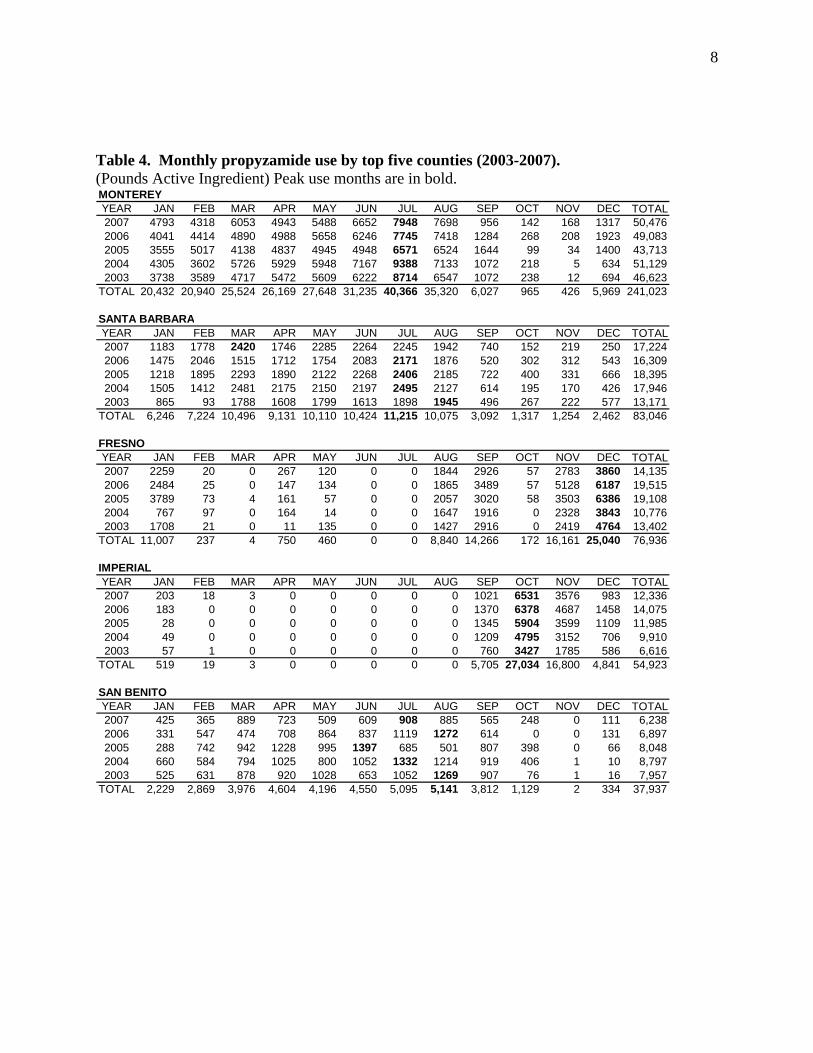
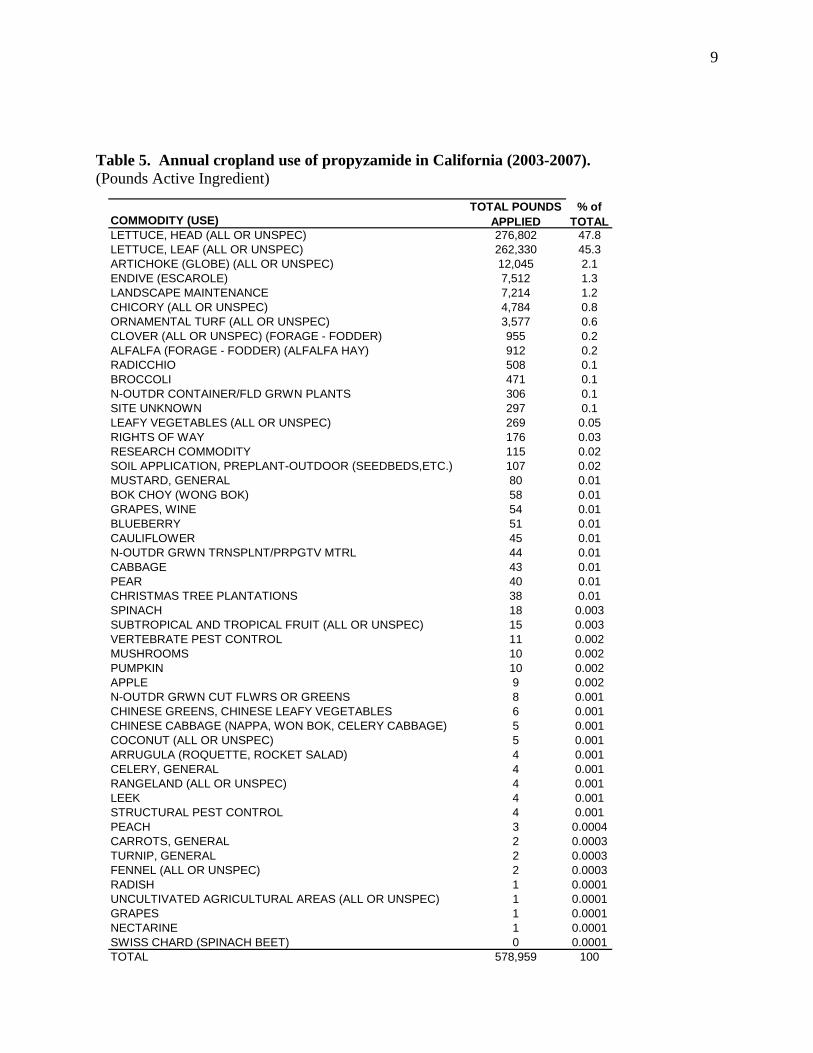
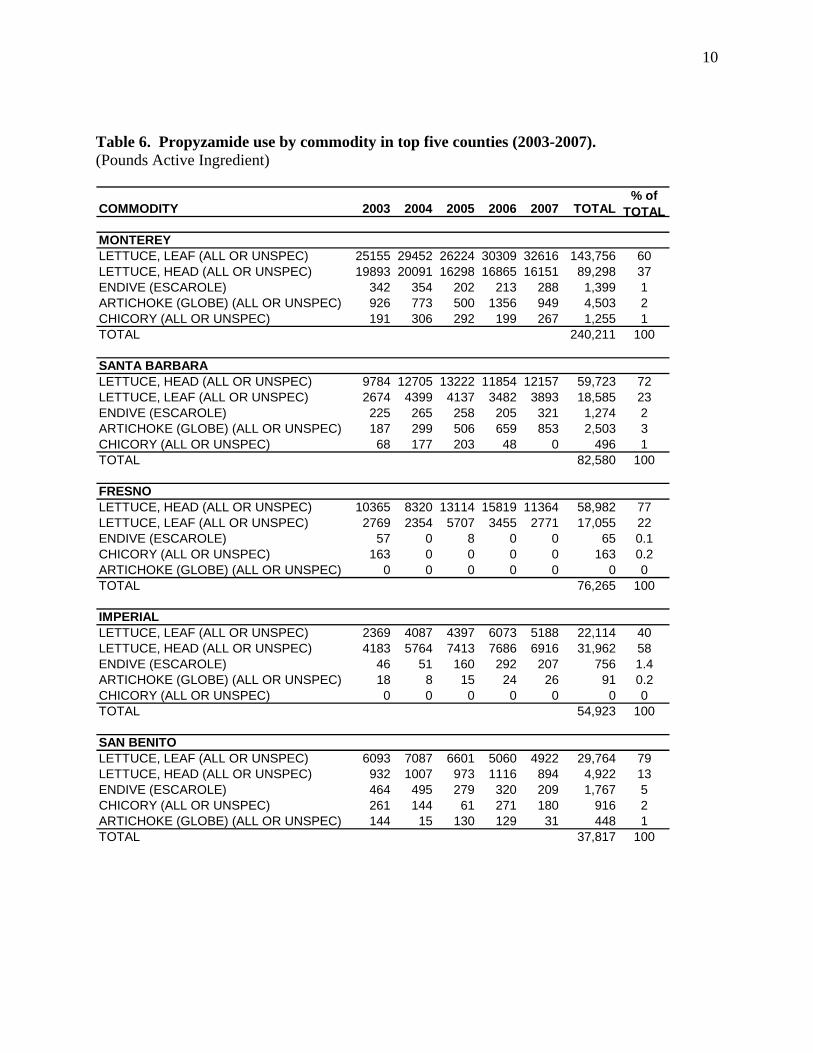
Pesticide Use Data Summary With CDPR’s implementation of full pesticide use reporting in 1990, all users must report the agricultural use of any pesticide to their county agricultural commissioner, who subsequently forwards this information to CDPR. CDPR compiles and publishes the use information in the annual Pesticide Use Report (PUR). According to the PUR, the annual use amount (pounds active ingredient) for propyzamide in California during the period 2003 to 2007 ranged from a low of 105,321 in 2003 to 114,946 in 2007 (Table 3). The highest amount of propyzamide use over the period 2003 to 2007 was in Monterey County (42% of total statewide use). Other counties with moderate use amounts over the same five-year period included Santa Barbara (14% of total statewide use), Fresno (13%), Imperial (10%), and San Benito (7%) (Table 3). The high use months for the top five counties occurred between March and December and the months of peak use varied for each of the top five counties (Table 4). For example, July and August were the peak use months for both Monterey and Santa Barbara counties, while it was August for San Benito County, December for Fresno County, and October for Imperial County. Table 5 shows the annual cropland use of propyzamide in California from 2003 to 2007. The top five primary crops included head lettuce, leaf lettuce, artichoke, endive and chicory. Lettuce composed 93% (47.8% head lettuce and 45.3% leaf lettuce) of total propyzamide used statewide over the period 2003 to 2007. Table 6 shows the amount of propyzamide used for each commodity in the top five counties from 2003 to 2007. These data are further depicted in Figure 2. Propyzamide was used primarily on leaf lettuce and head lettuce in each of the top five counties from 2003 through 2007. In 2007, the highest use of propyzamide was in Monterey County (Figure 2).
7
Table 3. Annual propyzamide use by county (2003-2007). (Pounds Active Ingredient)
COUNTY 2003 2004 2005 2006 2007 TOTAL %TOTALMONTEREY 46623 51129 43713 49083 50476 241,023 41.6SANTA BARBARA 13171 17946 18395 16309 17224 83,046 14.3FRESNO 13402 10776 19108 19515 14135 76,936 13.3IMPERIAL 6616 9910 11985 14075 12336 54,923 9.5SAN BENITO 7957 8797 8048 6897 6238 37,937 6.6SAN LUIS OBISPO 5438 6551 6695 6989 6372 32,045 5.5VENTURA 3909 3164 2651 2857 1860 14,441 2.5RIVERSIDE 2842 2406 2243 1898 2667 12,057 2.1KERN 575 3583 790 738 459 6,145 1.1SANTA CLARA 655 1078 1137 596 753 4,219 <1.0SANTA CRUZ 713 841 709 609 771 3,643 <1.0STANISLAUS 811 729 577 663 673 3,453 <1.0MERCED 382 435 509 417 345 2,089 <1.0SAN DIEGO 366 551 230 154 137 1,438 <1.0KINGS 104 243 202 210 245 1,003 <1.0SACRAMENTO 352 259 105 164 6 885 <1.0LOS ANGELES 200 264 171 198 18 852 <1.0TULARE 159 102 50 57 25 393 <1.0YOLO 154 74 87 67 381 <1.0SAN BERNARDINO 139 126 16 88 12 380 <1.0SAN JOAQUIN 82 59 61 38 73 313 <1.0ORANGE 48 142 57 16 2 264 <1.0GLENN 232 31 263 <1.0LASSEN 99 63 26 57 244 <1.0MADERA 151 24 5 6 29 215 <1.0ALAMEDA 20 41 61 123 <1.0BUTTE 50 5 34 89 <1.0COLUSA 42 42 <1.0MENDOCINO 40 40 <1.0SONOMA 29 9 39 <1.0YUBA 2 20 2 23 <1.0PLACER 10 10 <1.0TEHAMA 2 2 4 <1.0Grand Total 105,321 119,297 117,680 121,715 114,946 578,959 100.0
8
Table 4. Monthly propyzamide use by top five counties (2003-2007).
MONTEREYYEAR JAN FEB MAR APR MAY JUN JUL AUG SEP OCT NOV DEC TOTAL2007 4793 4318 6053 4943 5488 6652 7948 7698 956 142 168 1317 50,4762006 4041 4414 4890 4988 5658 6246 7745 7418 1284 268 208 1923 49,0832005 3555 5017 4138 4837 4945 4948 6571 6524 1644 99 34 1400 43,7132004 4305 3602 5726 5929 5948 7167 9388 7133 1072 218 5 634 51,1292003 3738 3589 4717 5472 5609 6222 8714 6547 1072 238 12 694 46,623
TOTAL 20,432 20,940 25,524 26,169 27,648 31,235 40,366 35,320 6,027 965 426 5,969 241,023
SANTA BARBAR
(Pounds Active Ingredient) Peak use months are in bold.
AYEAR JAN FEB MAR APR MAY JUN JUL AUG SEP OCT NOV DEC TOTAL2007 1183 1778 2420 1746 2285 2264 2245 1942 740 152 219 250 17,2242006 1475 2046 1515 1712 1754 2083 2171 1876 520 302 312 543 16,3092005 1218 1895 2293 1890 2122 2268 2406 2185 722 400 331 666 18,3952004 1505 1412 2481 2175 2150 2197 2495 2127 614 195 170 426 17,9462003 865 93 1788 1608 1799 1613 1898 1945 496 267 222 577 13,171
TOTAL 6,246 7,224 10,496 9,131 10,110 10,424 11,215 10,075 3,092 1,317 1,254 2,462 83,046
FRESNOYEAR JAN FEB MAR APR MAY JUN JUL AUG SEP OCT NOV DEC TOTAL2007 2259 20 0 267 120 0 0 1844 2926 57 2783 3860 14,1352006 2484 25 0 147 134 0 0 1865 3489 57 5128 6187 19,5152005 3789 73 4 161 57 0 0 2057 3020 58 3503 6386 19,1082004 767 97 0 164 14 0 0 1647 1916 0 2328 3843 10,7762003 1708 21 0 11 135 0 0 1427 2916 0 2419 4764 13,402
TOTAL 11,007 237 4 750 460 0 0 8,840 14,266 172 16,161 25,040 76,936
IMPERIALYEAR JAN FEB MAR APR MAY JUN JUL AUG SEP OCT NOV DEC TOTAL2007 203 18 3 0 0 0 0 0 1021 6531 3576 983 12,3362006 183 0 0 0 0 0 0 0 1370 6378 4687 1458 14,0752005 28 0 0 0 0 0 0 0 1345 5904 3599 1109 11,9852004 49 0 0 0 0 0 0 0 1209 4795 3152 706 9,9102003 57 1 0 0 0 0 0 0 760 3427 1785 586 6,616
TOTAL 519 19 3 0 0 0 0 0 5,705 27,034 16,800 4,841 54,923
SAN BENITOYEAR JAN FEB MAR APR MAY JUN JUL AUG SEP OCT NOV DEC TOTAL2007 425 365 889 723 509 609 908 885 565 248 0 111 6,2382006 331 547 474 708 864 837 1119 1272 614 0 0 131 6,8972005 288 742 942 1228 995 1397 685 501 807 398 0 66 8,0482004 660 584 794 1025 800 1052 1332 1214 919 406 1 10 8,7972003 525 631 878 920 1028 653 1052 1269 907 76 1 16 7,957
TOTAL 2,229 2,869 3,976 4,604 4,196 4,550 5,095 5,141 3,812 1,129 2 334 37,937
9
Table 5. Annual cropland use of propyzamide in California (2003-2007).
ounds Active Ingredient) (P
TOTAL POUNDS COMMODITY (USE) APPLIED
f TOTAL
01
% o
LETTUCE, HEAD (ALL OR UNSPEC) 276,802 47.8LETTUCE, LEAF (ALL OR UNSPEC) 262,330 45.3ARTICHOKE (GLOBE) (ALL OR UNSPEC) 12,045 2.1ENDIVE (ESCAROLE) 7,512 1.3LANDSCAPE MAINTENANCE 7,214 1.2CHICORY (ALL OR UNSPEC) 4,784 0.8ORNAMENTAL TURF (ALL OR UNSPEC) 3,577 0.6CLOVER (ALL OR UNSPEC) (FORAGE - FODDER) 955 0.2ALFALFA (FORAGE - FODDER) (ALFALFA HAY) 912 0.2RADICCHIO 508 0.1BROCCOLI 471 0.1N-OUTDR CONTAINER/FLD GRWN PLANTS 306 0.1SITE UNKNOWN 297 0.1LEAFY VEGETABLES (ALL OR UNSPEC) 269 0.05RIGHTS OF WAY 176 0.03RESEARCH COMMODITY 115 0.02SOIL APPLICATION, PREPLANT-OUTDOOR (SEEDBEDS,ETC.) 107 0.02MUSTARD, GENERAL 80 0.01BOK CHOY (WONG BOK) 58 0.01GRAPES, WINE 54 0.01BLUEBERRY 51 0.01CAULIFLOWER 45 0.01N-OUTDR GRWN TRNSPLNT/PRPGTV MTRL 44 0.01CABBAGE 43 0.01PEAR 40 0.01CHRISTMAS TREE PLANTATIONS 38 0.01SPINACH 18 0.003SUBTROPICAL AND TROPICAL FRUIT (ALL OR UNSPEC) 15 0.003VERTEBRATE PEST CONTROL 11 0.002MUSHROOMS 10 0.002PUMPKIN 10 0.002APPLE 9 0.002N-OUTDR GRWN CUT FLWRS OR GREENS 8 0.001CHINESE GREENS, CHINESE LEAFY VEGETABLES 6 0.001CHINESE CABBAGE (NAPPA, WON BOK, CELERY CABBAGE) 5 0.001COCONUT (ALL OR UNSPEC) 5 0.001ARRUGULA (ROQUETTE, ROCKET SALAD) 4 0.001CELERY, GENERAL 4 0.001RANGELAND (ALL OR UNSPEC) 4 0.001LEEK 4 0.0STRUCTURAL PEST CONTROL 4 0.001PEACH 3 0.0004CARROTS, GENERAL 2 0.0003TURNIP, GENERAL 2 0.0003FENNEL (ALL OR UNSPEC) 2 0.0003RADISH 1 0.0001UNCULTIVATED AGRICULTURAL AREAS (ALL OR UNSPEC) 1 0.0001GRAPES 1 0.0001NECTARINE 1 0.0001SWISS CHARD (SPINACH BEET) 0 0.0001TOTAL 578,959 100
10
Table 6. Propyzamide use by commodity in top five counties (2003-2007). (Pounds Active Ingredient)
COMMODITY 2003 2004 2005 2006 2007 TOTAL% of
TOTAL
MONTEREYLETTUCE, LEAF (ALL OR UNSPEC) 25155 29452 26224 30309 32616 143,756 60LETTUCE, HEAD (ALL OR UNSPEC) 19893 20091 16298 16865 16151 89,298 37ENDIVE (ESCAROLE) 342 354 202 213 288 1,399 1ARTICHOKE (GLOBE) (ALL OR UNSPEC) 926 773 500 1356 949 4,503 2CHICORY (ALL OR UNSPEC) 191 306 292 199 267 1,255 1TOTAL 240,211 100
SANTA BARBARALETTUCE, HEAD (ALL OR UNSPEC) 9784 12705 13222 11854 12157 59,723 72LETTUCE, LEAF (ALL OR UNSPEC) 2674 4399 4137 3482 3893 18,585 23ENDIVE (ESCAROLE) 225 265 258 205 321 1,274 2ARTICHOKE (GLOBE) (ALL OR UNSPEC) 187 299 506 659 853 2,503 3CHICORY (ALL OR UNSPEC) 68 177 203 48 0 496 1TOTAL 82,580 100
FRESNOLETTUCE, HEAD (ALL OR UNSPEC) 10365 8320 13114 15819 11364 58,982 77LETTUCE, LEAF (ALL OR UNSPEC) 2769 2354 5707 3455 2771 17,055 22ENDIVE (ESCAROLE) 57 0 8 0 0 65 0.1CHICORY (ALL OR UNSPEC) 163 0 0 0 0 163 0.2ARTICHOKE (GLOBE) (ALL OR UNSPEC) 0 0 0 0 0 0 0TOTAL 76,265 100
IMPERIALLETTUCE, LEAF (ALL OR UNSPEC) 2369 4087 4397 6073 5188 22,114 40LETTUCE, HEAD (ALL OR UNSPEC) 4183 5764 7413 7686 6916 31,962 58ENDIVE (ESCAROLE) 46 51 160 292 207 756 1.4ARTICHOKE (GLOBE) (ALL OR UNSPEC) 18 8 15 24 26 91 0.2CHICORY (ALL OR UNSPEC) 0 0 0 0 0 0 0TOTAL 54,923 100
SAN BENITOLETTUCE, LEAF (ALL OR UNSPEC) 6093 7087 6601 5060 4922 29,764 79LETTUCE, HEAD (ALL OR UNSPEC) 932 1007 973 1116 894 4,922 13ENDIVE (ESCAROLE) 464 495 279 320 209 1,767 5CHICORY (ALL OR UNSPEC) 261 144 61 271 180 916 2ARTICHOKE (GLOBE) (ALL OR UNSPEC) 144 15 130 129 31 448 1TOTAL 37,817 100
11
0
10000
20000
30000
40000
50000
60000
2003
2004
2005
2006
2007
2003
2004
2005
2006
2007
2003
2004
2005
2006
2007
2003
2004
2005
2006
2007
2003
2004
2005
2006
2007
MONTEREY SANTA BARBARA FRESNO IMPERIAL SAN BENITO
Poun
ds A
pplie
d
LETTUCE, LEAF (ALL OR UNSPEC)LETTUCE, HEAD (ALL OR UNSPEC)ENDIVE (ESCAROLE)CHICORY (ALL OR UNSPEC)ARTICHOKE (GLOBE) (ALL OR UNSPEC)
Sum of POUNDS_CHEMICAL_APPLIED
SITE_NAME
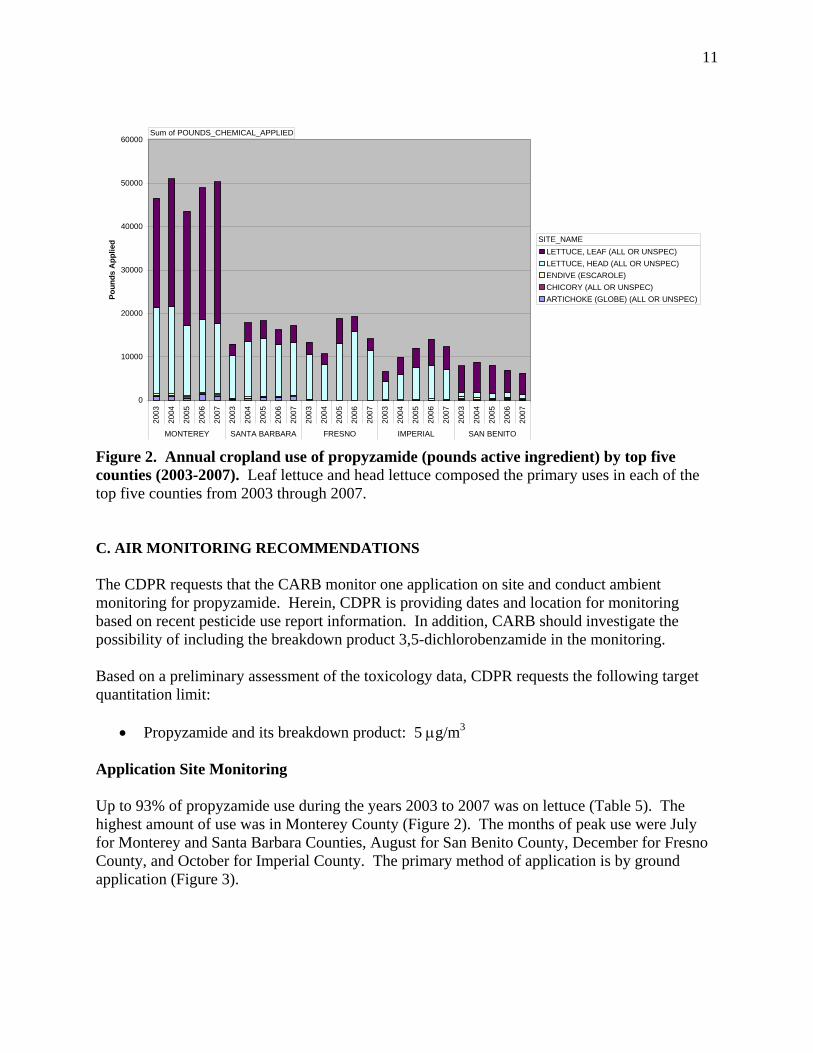
Figure 2. Annual cropland use of propyzamide (pounds active ingredient) by top five counties (2003-2007). Leaf lettuce and head lettuce composed the primary uses in each of the top five counties from 2003 through 2007. C. AIR MONITORING RECOMMENDATIONS The CDPR requests that the CARB monitor one application on site and conduct ambient monitoring for propyzamide. Herein, CDPR is providing dates and location for monitoring based on recent pesticide use report information. In addition, CARB should investigate the possibility of including the breakdown product 3,5-dichlorobenzamide in the monitoring. Based on a preliminary assessment of the toxicology data, CDPR requests the following target quantitation limit:
• Propyzamide and its breakdown product: 5 μg/m3 Application Site Monitoring Up to 93% of propyzamide use during the years 2003 to 2007 was on lettuce (Table 5). The highest amount of use was in Monterey County (Figure 2). The months of peak use were July for Monterey and Santa Barbara Counties, August for San Benito County, December for Fresno County, and October for Imperial County. The primary method of application is by ground application (Figure 3).
12
0
50000
100000
150000
200000
250000
A G A G A G A G A G
FRESNO IMPERIAL MONTEREY SAN BENITO SANTA BARBARA
LETTUCE, LEAF (ALL OR UNSPEC) LETTUCE, HEAD (ALL OR UNSPEC) ENDIVE (ESCAROLE) CHICORY (ALL OR UNSPEC) ARTICHOKE (GLOBE) (ALL OR UNSPEC
Sum of POUNDS_CHEMICAL_APPLIED
SITE_NAME
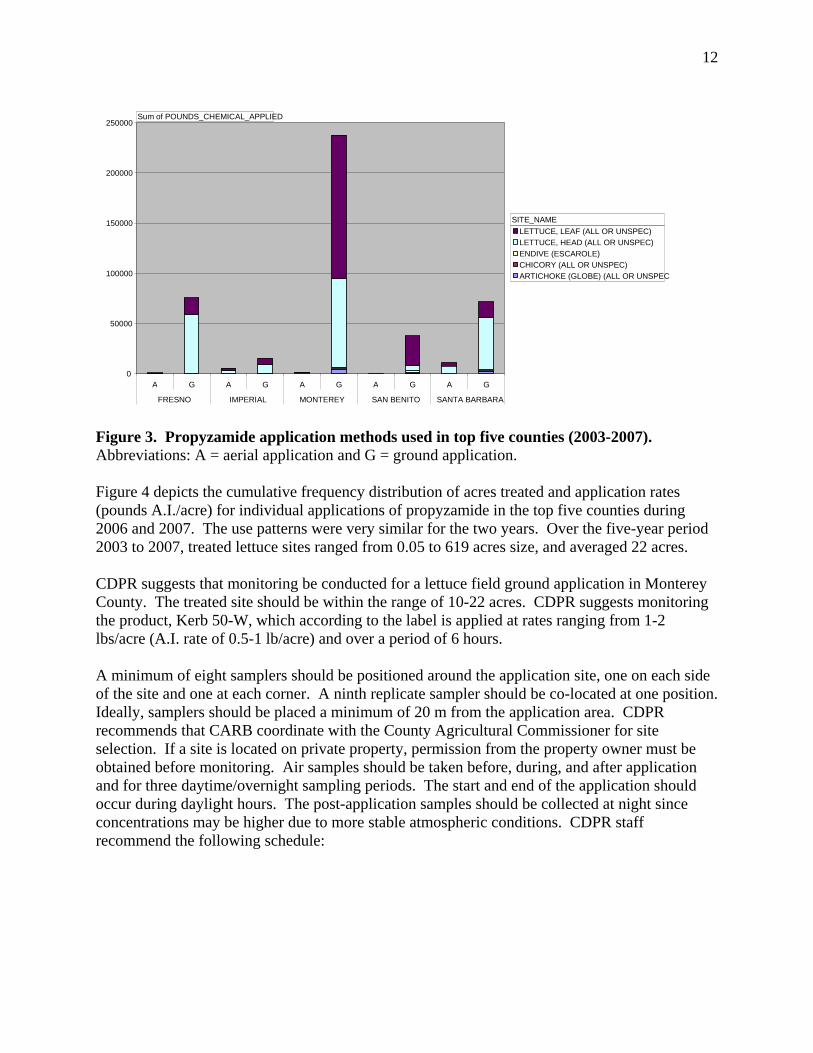
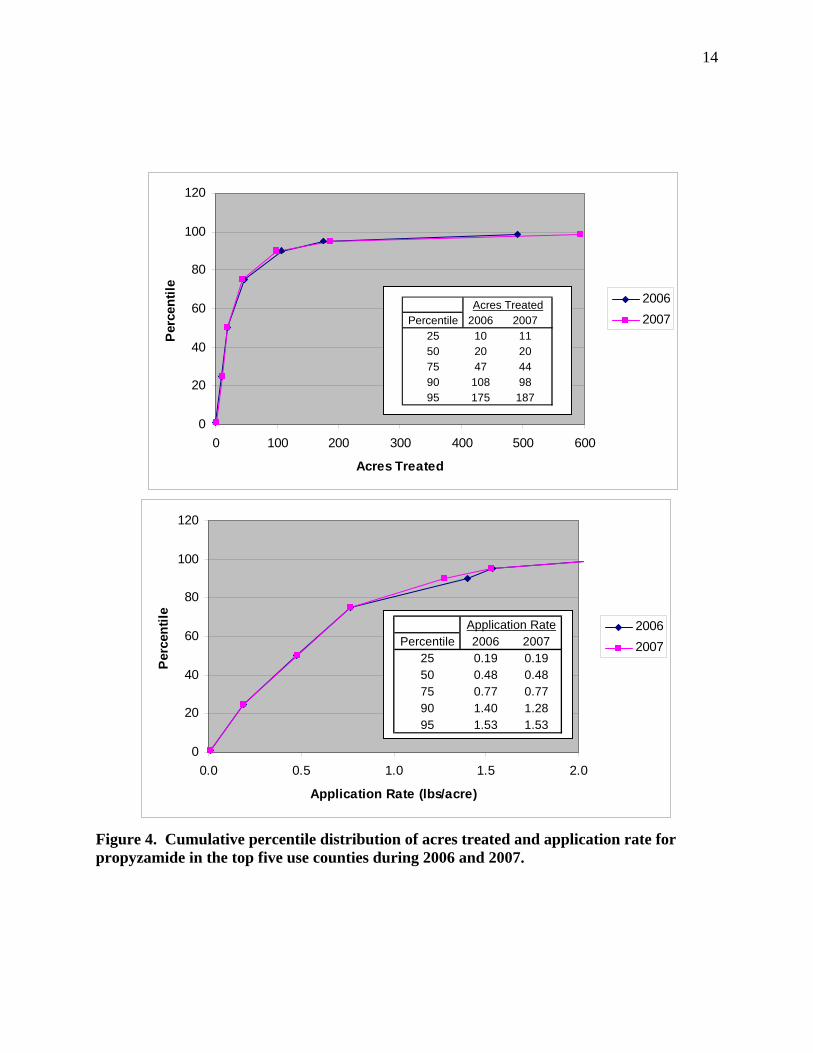
Figure 3. Propyzamide application methods used in top five counties (2003-2007). Abbreviations: A = aerial application and G = ground application. Figure 4 depicts the cumulative frequency distribution of acres treated and application rates (pounds A.I./acre) for individual applications of propyzamide in the top five counties during 2006 and 2007. The use patterns were very similar for the two years. Over the five-year period 2003 to 2007, treated lettuce sites ranged from 0.05 to 619 acres size, and averaged 22 acres. CDPR suggests that monitoring be conducted for a lettuce field ground application in Monterey County. The treated site should be within the range of 10-22 acres. CDPR suggests monitoring the product, Kerb 50-W, which according to the label is applied at rates ranging from 1-2 lbs/acre (A.I. rate of 0.5-1 lb/acre) and over a period of 6 hours. A minimum of eight samplers should be positioned around the application site, one on each side of the site and one at each corner. A ninth replicate sampler should be co-located at one position. Ideally, samplers should be placed a minimum of 20 m from the application area. CDPR recommends that CARB coordinate with the County Agricultural Commissioner for site selection. If a site is located on private property, permission from the property owner must be obtained before monitoring. Air samples should be taken before, during, and after application and for three daytime/overnight sampling periods. The start and end of the application should occur during daylight hours. The post-application samples should be collected at night since concentrations may be higher due to more stable atmospheric conditions. CDPR staff recommend the following schedule:
13
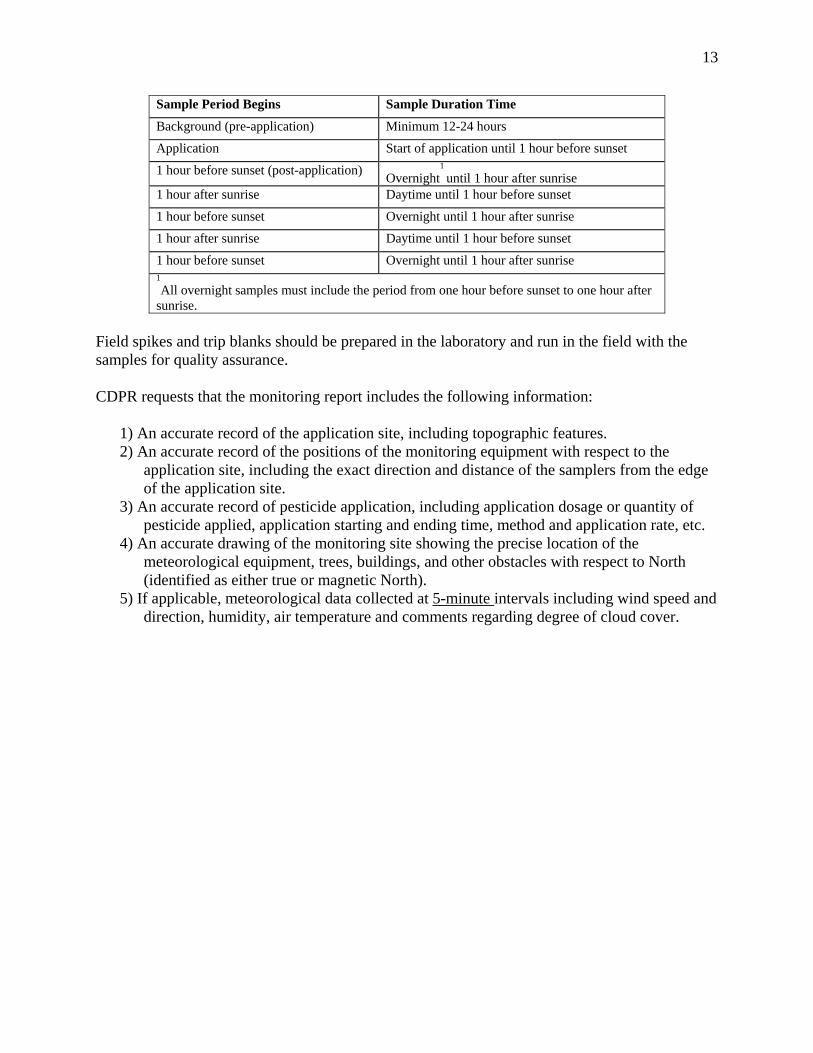
Sample Period Begins Sample Duration Time
Background (pre-application) Minimum 12-24 hours
Application Start of application until 1 hour before sunset
1 hour before sunset (post-application) Overnight1 until 1 hour after sunrise
1 hour after sunrise Daytime until 1 hour before sunset
1 hour before sunset Overnight until 1 hour after sunrise
1 hour after sunrise Daytime until 1 hour before sunset
1 hour before sunset Overnight until 1 hour after sunrise 1All overnight samples must include the period from one hour before sunset to one hour after
sunrise. Field spikes and trip blanks should be prepared in the laboratory and run in the field with the samples for quality assurance. CDPR requests that the monitoring report includes the following information:
1) An accurate record of the application site, including topographic features. 2) An accurate record of the positions of the monitoring equipment with respect to the
application site, including the exact direction and distance of the samplers from the edge of the application site.
3) An accurate record of pesticide application, including application dosage or quantity of pesticide applied, application starting and ending time, method and application rate, etc.
4) An accurate drawing of the monitoring site showing the precise location of the meteorological equipment, trees, buildings, and other obstacles with respect to North (identified as either true or magnetic North).
5) If applicable, meteorological data collected at 5-minute intervals including wind speed and direction, humidity, air temperature and comments regarding degree of cloud cover.
14
0
20
40
60
80
100
120
0 100 200 300 400 500 600
Acres Treated
Per
cent
ile 20062007
Percentile 2006 2007
25 10 1150 20 2075 47 4490 108 9895 175 187
Acres Treated
0
20
40
60
80
100
120
0.0 0.5 1.0 1.5 2.0
Application Rate (lbs/acre)
Perc
entil
e
20062007Percentile 2006 2007
25 0.19 0.1950 0.48 0.4875 0.77 0.7790 1.40 1.2895 1.53 1.53
Application Rate
Figure 4. Cumulative percentile distribution of acres treated and application rate for propyzamide in the top five use counties during 2006 and 2007.
15
Ambient Monitoring Study CDPR recommends ambient air monitoring of propyzamide in rural communities. Because propyzamide is primarily used on agricultural fields, California rural communities may have higher concentrations of propyzamide in ambient air compared to urban communities. The selection of communities is based on objective data, using criteria that can be quantified, validated, and verified, providing a more transparent and fair selection process. CDPR selected communities in Imperial, Monterey, Santa Barbara, San Benito and San Luis Obispo counties for monitoring site evaluation based on their proximity to propyzamide applications. The communities are identified by name in the 2000 U.S. Census, and are also included in a spatial dataset distributed by the U.S. Census Bureau for use in a Geographic Information System (GIS). Each of the communities was rated on the following two major categories and their subcategories:
I. Demographic Factors • Total community population • Population density of children under age 18 • Population density of people over age 65 • Population density of people over age 5 with disabilities • Median family income • Hispanic population percentage • Non-white population percentage II. Pesticide Use Factors • Regional (within 5 miles outside community boundary) propyzamide use density in 2007 • Regional (within 5 miles outside community boundary) propyzamide use density in 2006 • Local (within 1 mile outside community boundary) propyzamide use density in 2007 • Local (within 1 mile outside community boundary) propyzamide use density in 2006
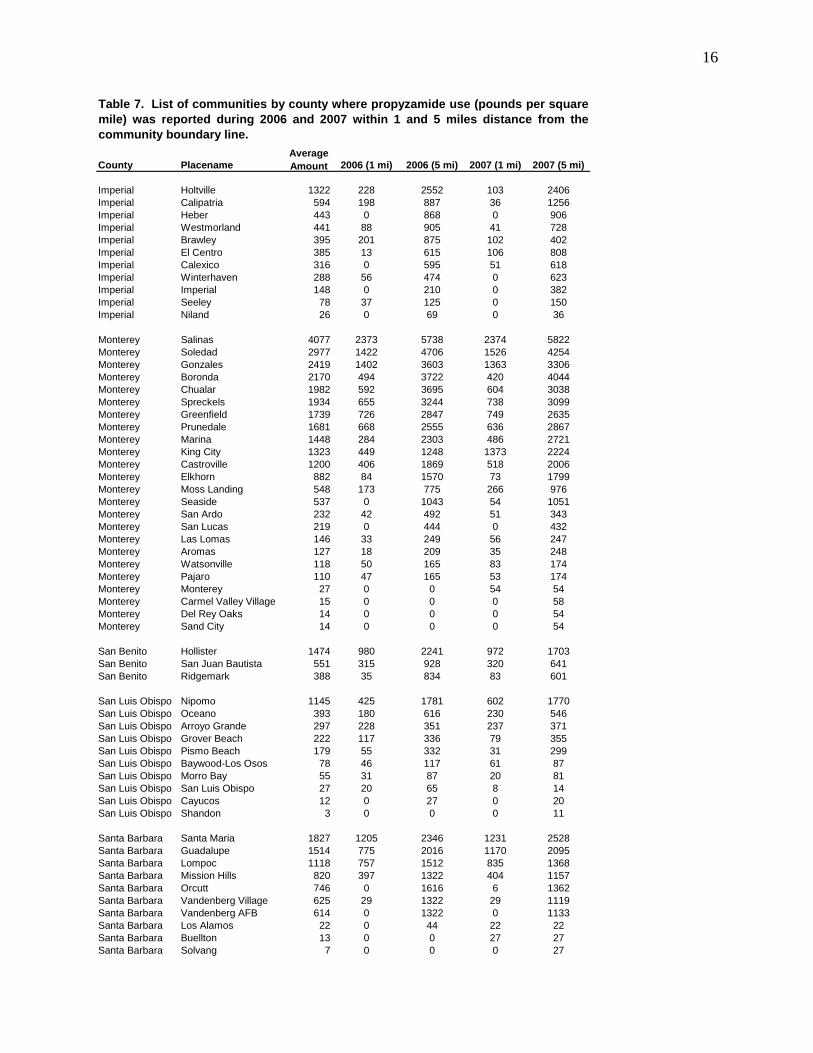
For the demographic factors, the subcategory ratings for Hispanic population and non-white population were based on percentage of total population in each community; but for children under age 18, it was based on density per square mile to minimize the effect of the community size in the ratings. These data plus total population and area of each community used in calculations are from the Census 2000 Demographic Profile Highlights (U.S. Census Bureau, 2000) and were delineated in the spatial dataset used in this study. For the pesticide use factors, regional and local uses were calculated as pounds of active ingredient of propyzamide applied in 2006 and 2007 within 1 mile and 5 miles of each community boundary, respectively, using a buffering algorithm in GIS (Table 7). In calculation of propyzamide use density (pounds/square mile) for each community, the use amount within 1 mile or 5 miles was divided by the community area plus 1 mile or 5 miles ring areas around each community. This calculation assumed that the shape of the community is round and no propyzamide was applied within the community.
16
County PlacenameAverage Amount 2006 (1 mi) 2006 (5 mi) 2007 (1 mi) 2007 (5 mi)
Imperial Holtville 1322 228 2552 103 2406Imperial Calipatria 594 198 887 36 1256Imperial Heber 443 0 868 0 906Imperial Westmorland 441 88 905 41 728Imperial Brawley 395 201 875 102 402Imperial El Centro 385 13 615 106 808Imperial Calexico 316 0 595 51 618Imperial Winterhaven 288 56 474 0 623Imperial Imperial 148 0 210 0 382Imperial Seeley 78 37 125 0 150Imperial Niland 26 0 69 0 36
Monterey Salinas 4077 2373 5738 2374 5822Monterey Soledad 2977 1422 4706 1526 4254Monterey Gonzales 2419 1402 3603 1363 3306Monterey Boronda 2170 494 3722 420 4044Monterey Chualar 1982 592 3695 604 3038Monterey Spreckels 1934 655 3244 738 3099Monterey Greenfield 1739 726 2847 749 2635Monterey Prunedale 1681 668 2555 636 2867Monterey Marina 1448 284 2303 486 2721Monterey King City 1323 449 1248 1373 2224Monterey Castroville 1200 406 1869 518 2006Monterey Elkhorn 882 84 1570 73 1799Monterey Moss Landing 548 173 775 266 976Monterey Seaside 537 0 1043 54 1051Monterey San Ardo 232 42 492 51 343Monterey San Lucas 219 0 444 0 432Monterey Las Lomas 146 33 249 56 247Monterey Aromas 127 18 209 35 248Monterey Watsonville 118 50 165 83 174Monterey Pajaro 110 47 165 53 174Monterey Monterey 27 0 0 54 54Monterey Carmel Valley Village 15 0 0 0 58Monterey Del Rey Oaks 14 0 0 0 54Monterey Sand City 14 0 0 0 54
San Benito Hollister 1474 980 2241 972 1703San Benito San Juan Bautista 551 315 928 320 641San Benito Ridgemark 388 35 834 83 601
San Luis Obispo Nipomo 1145 425 1781 602 1770San Luis Obispo Oceano 393 180 616 230 546San Luis Obispo Arroyo Grande 297 228 351 237 371San Luis Obispo Grover Beach 222 117 336 79 355San Luis Obispo Pismo Beach 179 55 332 31 299San Luis Obispo Baywood-Los Osos 78 46 117 61 87San Luis Obispo Morro Bay 55 31 87 20 81San Luis Obispo San Luis Obispo 27 20 65 8 14San Luis Obispo Cayucos 12 0 27 0 20San Luis Obispo Shandon 3 0 0 0 11
Santa Barbara Santa Maria 1827 1205 2346 1231 2528Santa Barbara Guadalupe 1514 775 2016 1170 2095Santa Barbara Lompoc 1118 757 1512 835 1368Santa Barbara Mission Hills 820 397 1322 404 1157Santa Barbara Orcutt 746 0 1616 6 1362Santa Barbara Vandenberg Village 625 29 1322 29 1119Santa Barbara Vandenberg AFB 614 0 1322 0 1133Santa Barbara Los Alamos 22 0 44 22 22Santa Barbara Buellton 13 0 0 27 27Santa Barbara Solvang 7 0 0 0 27
Table 7. List of communities by county where propyzamide use (pounds per squaremile) was reported during 2006 and 2007 within 1 and 5 miles distance from thecommunity boundary line.
17
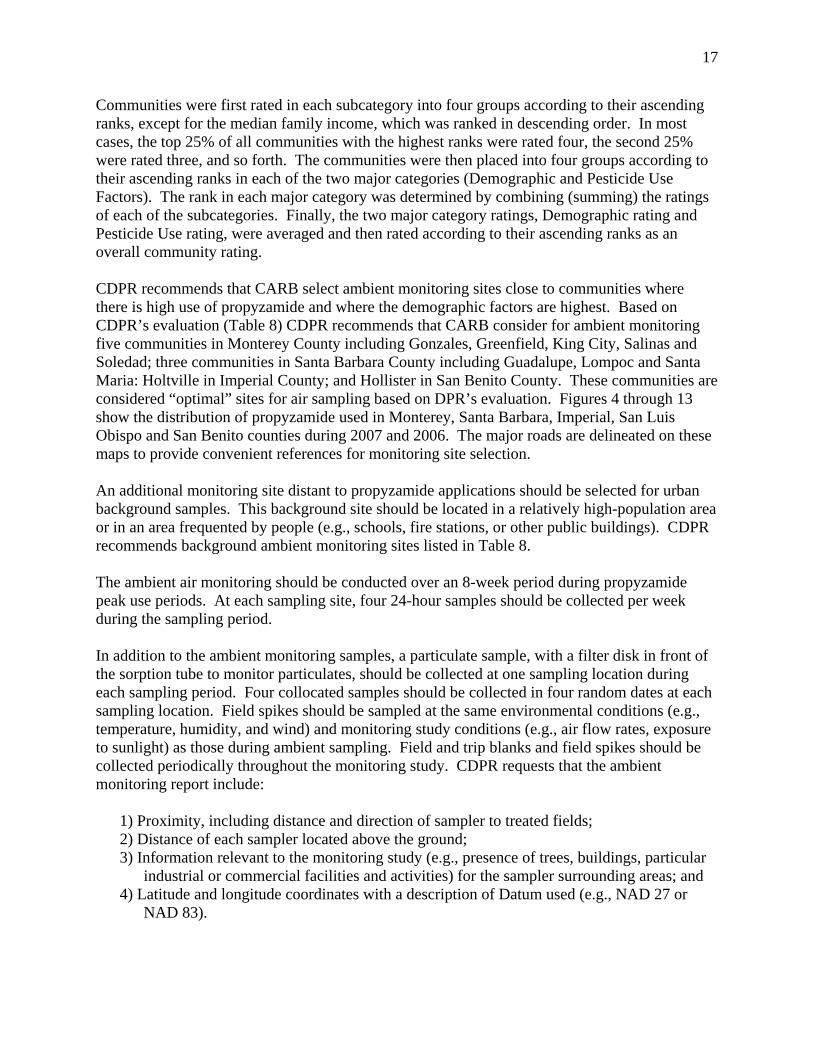
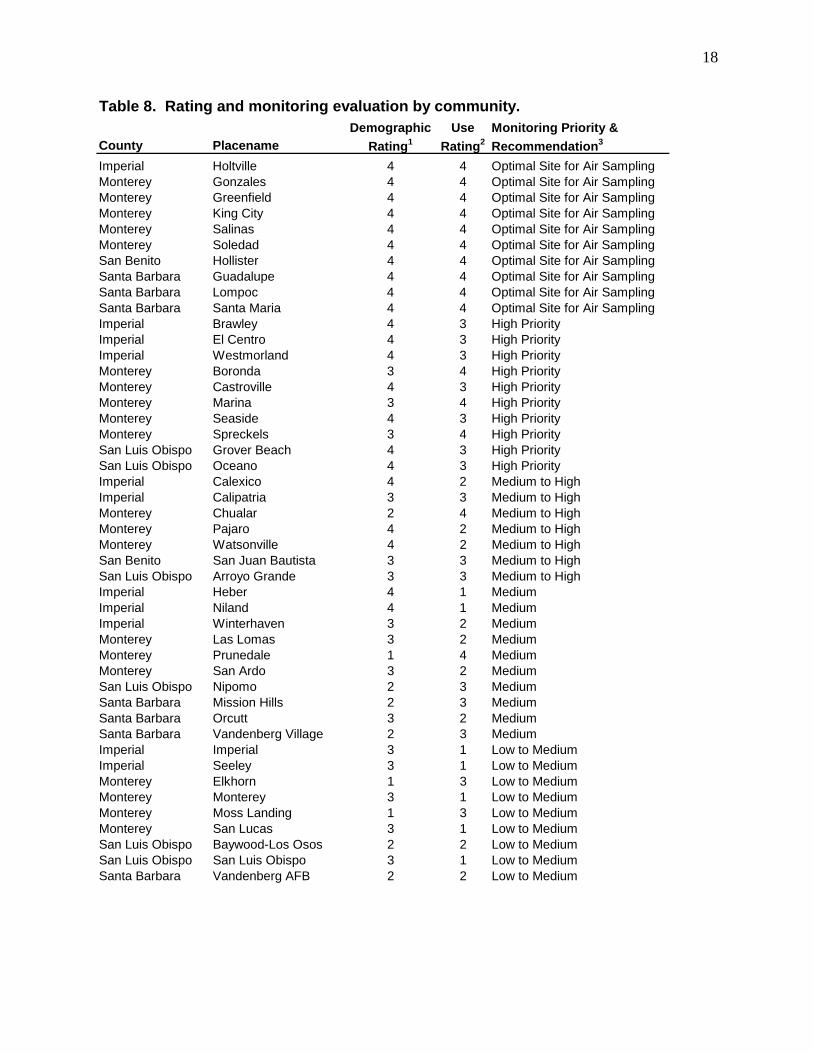
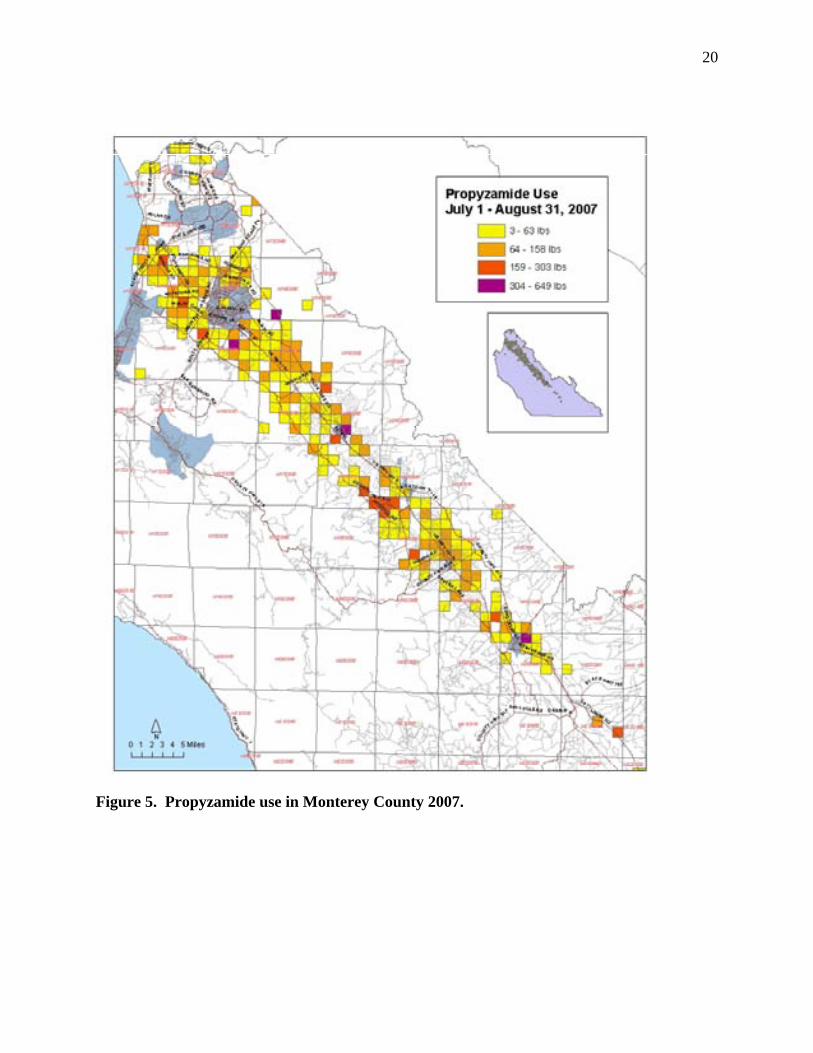
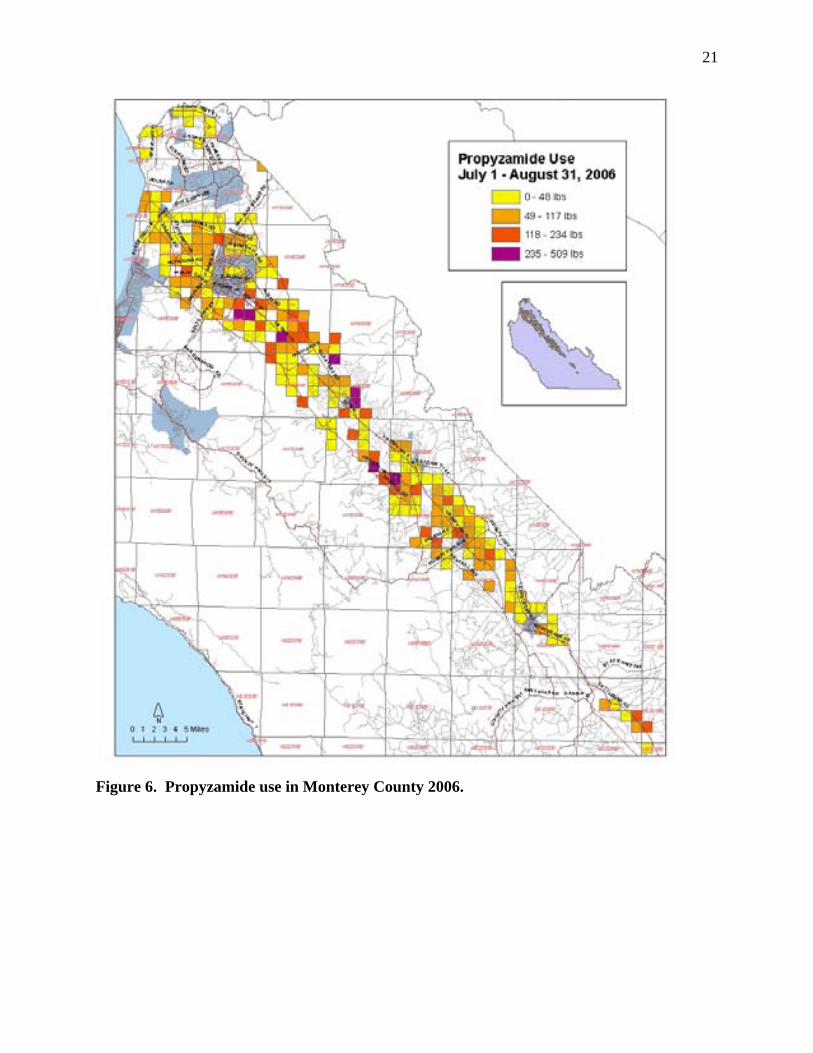
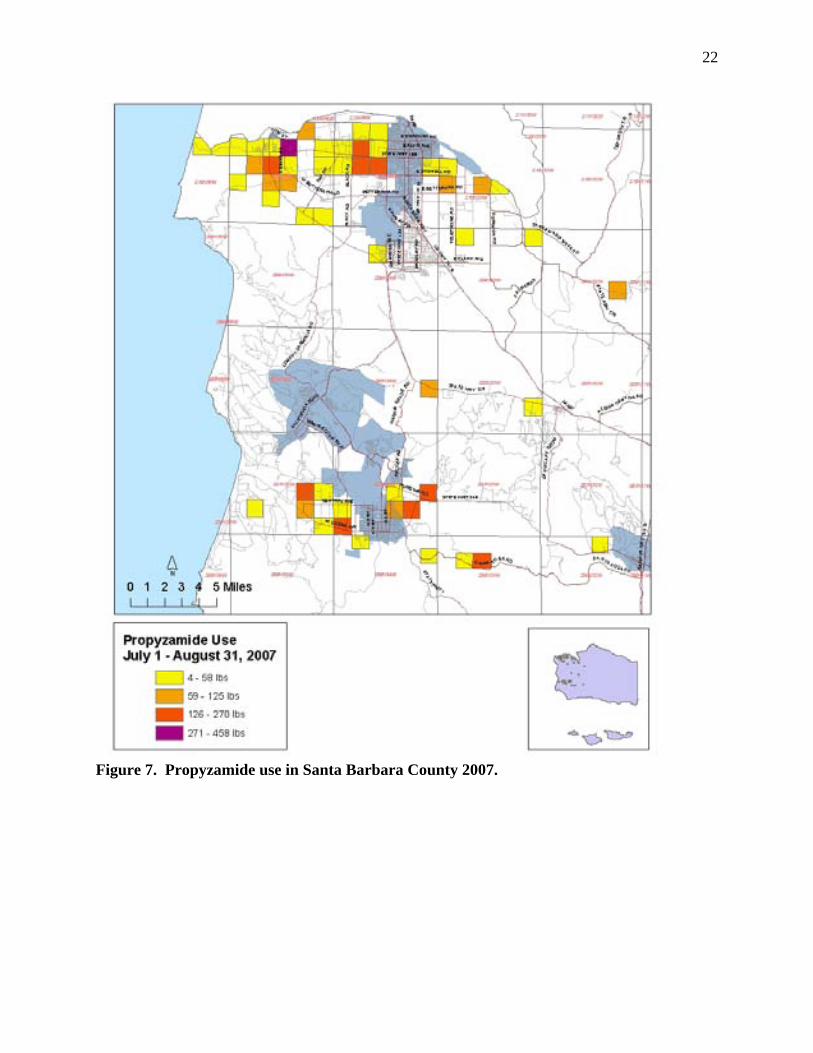
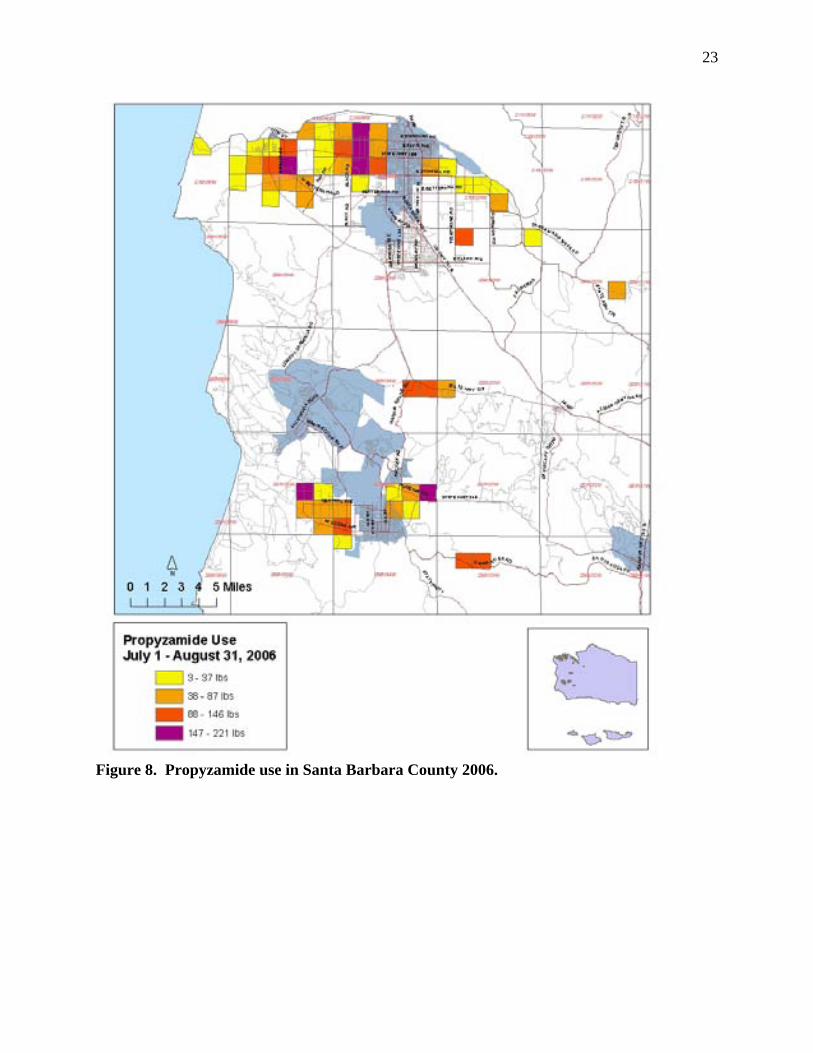
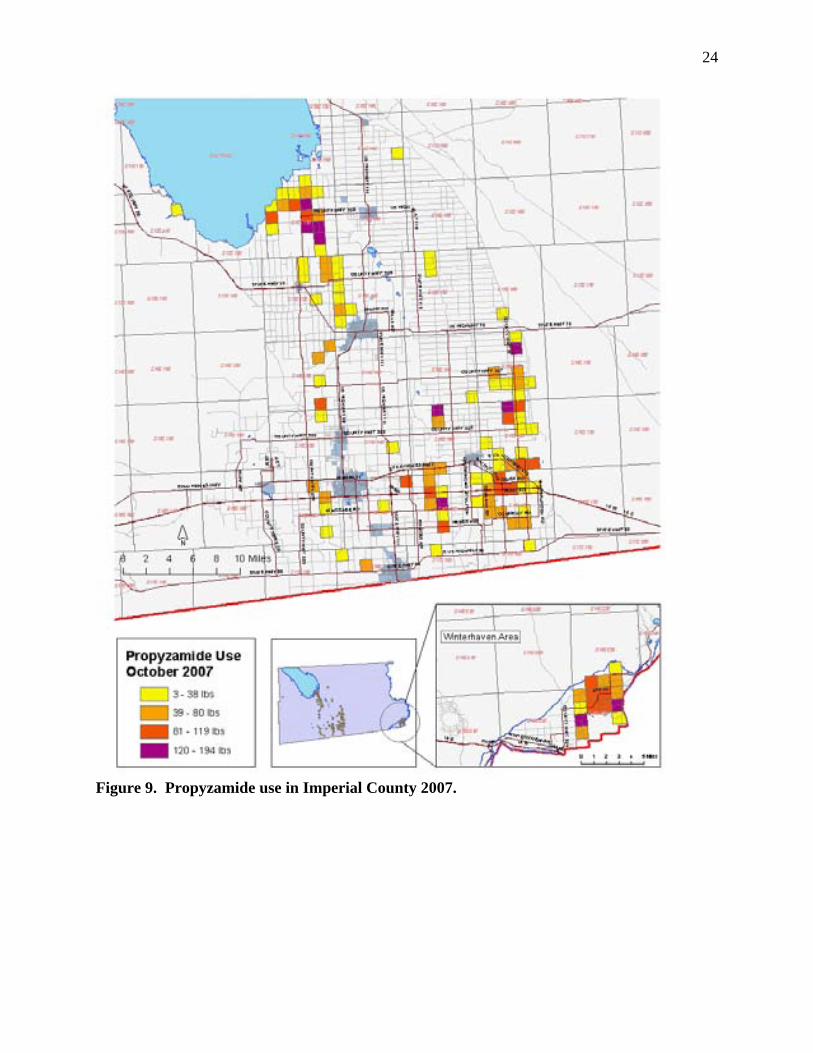
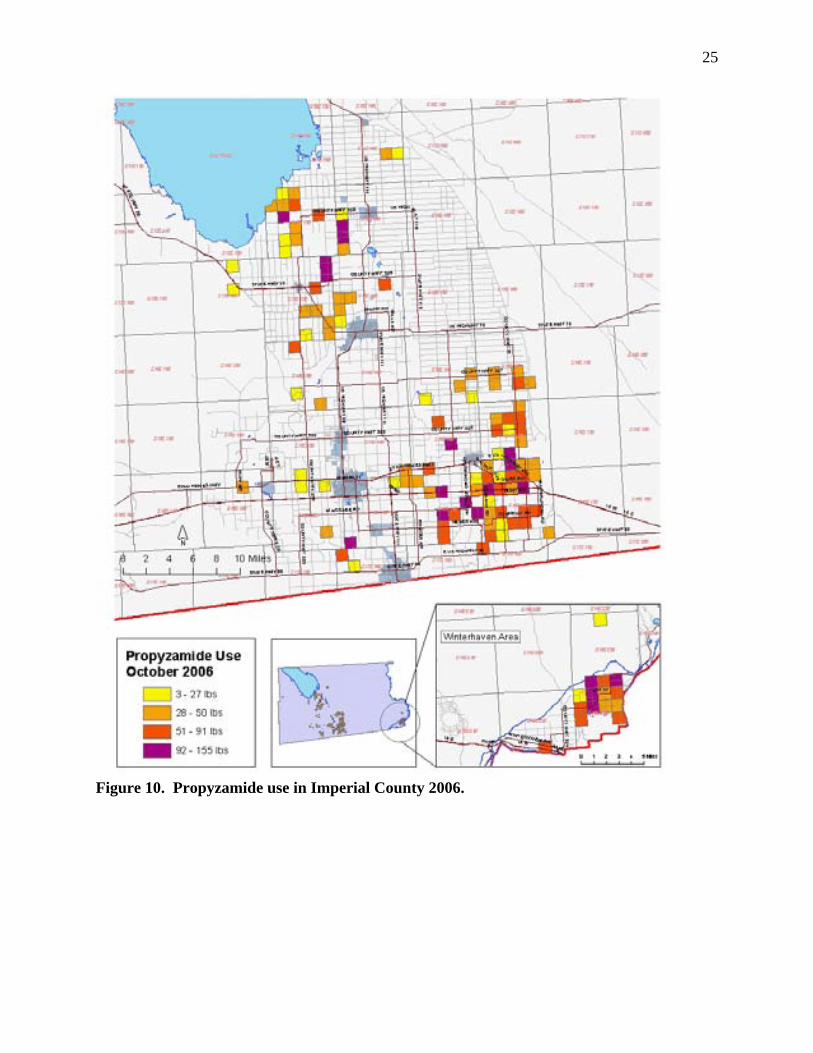
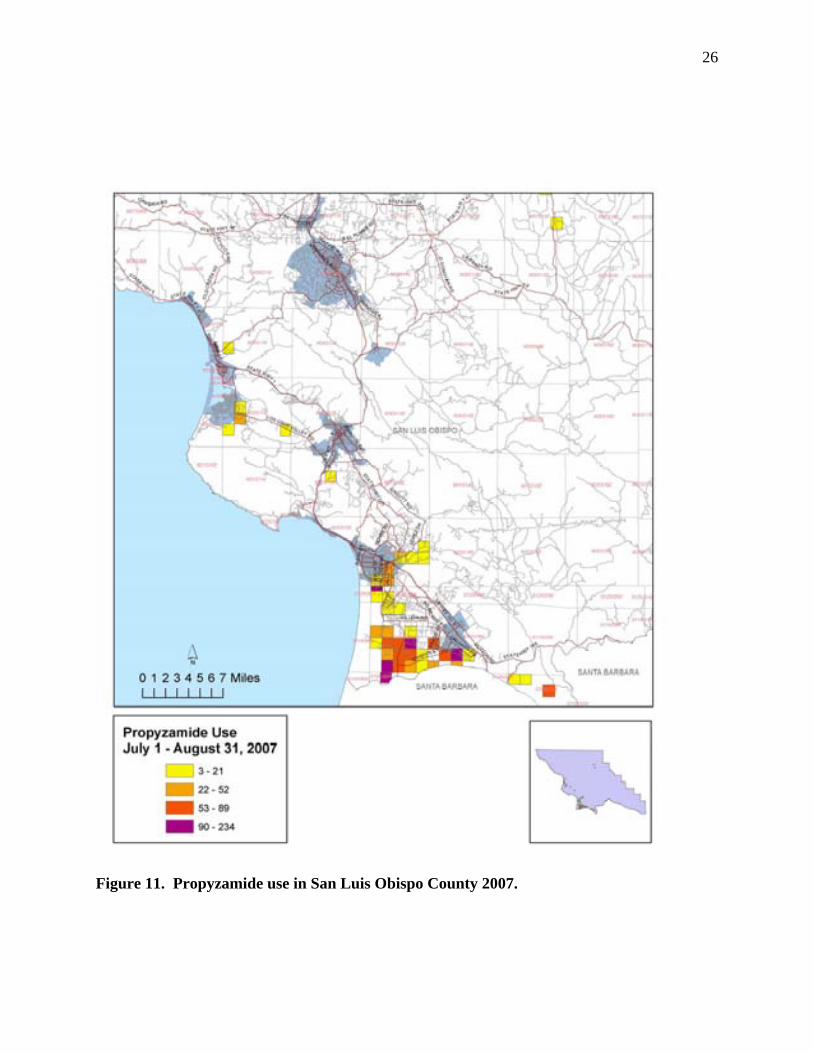
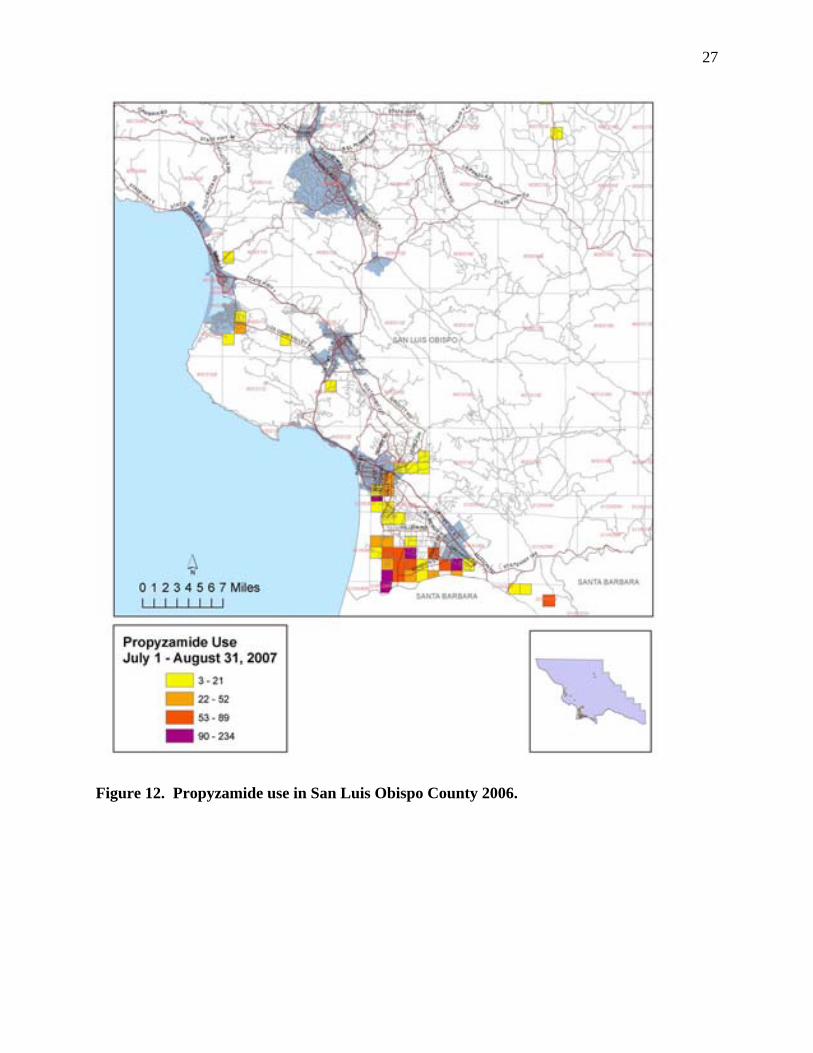
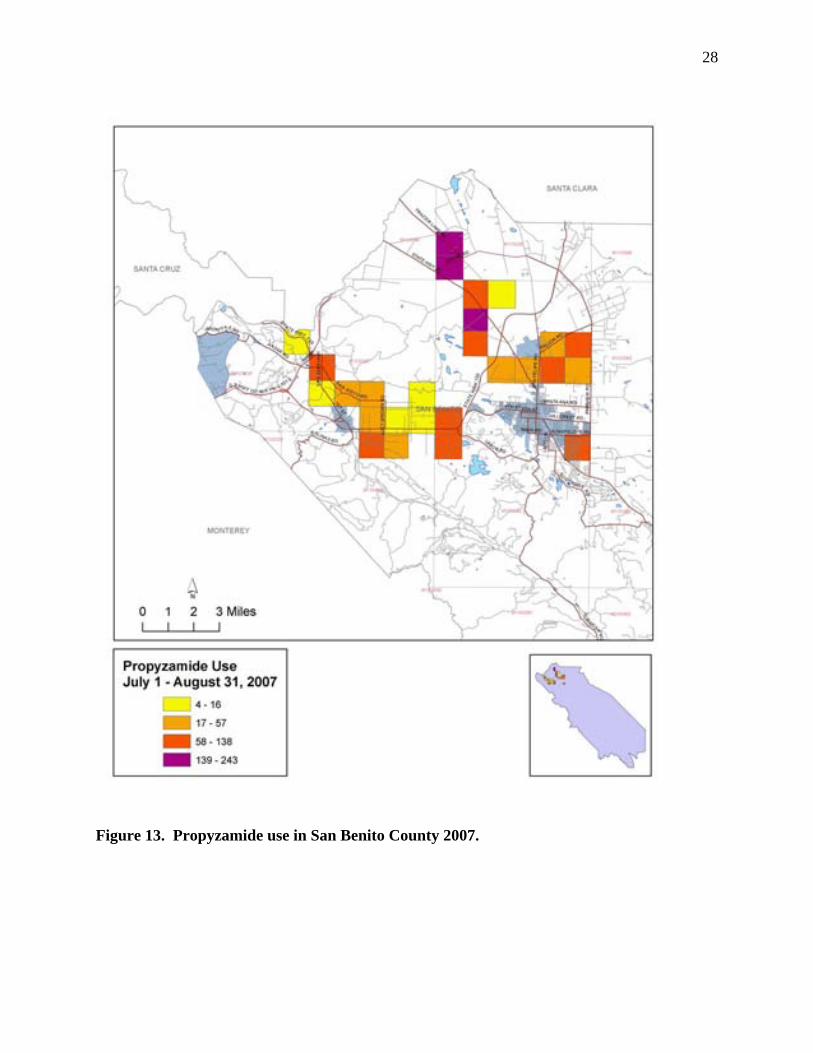
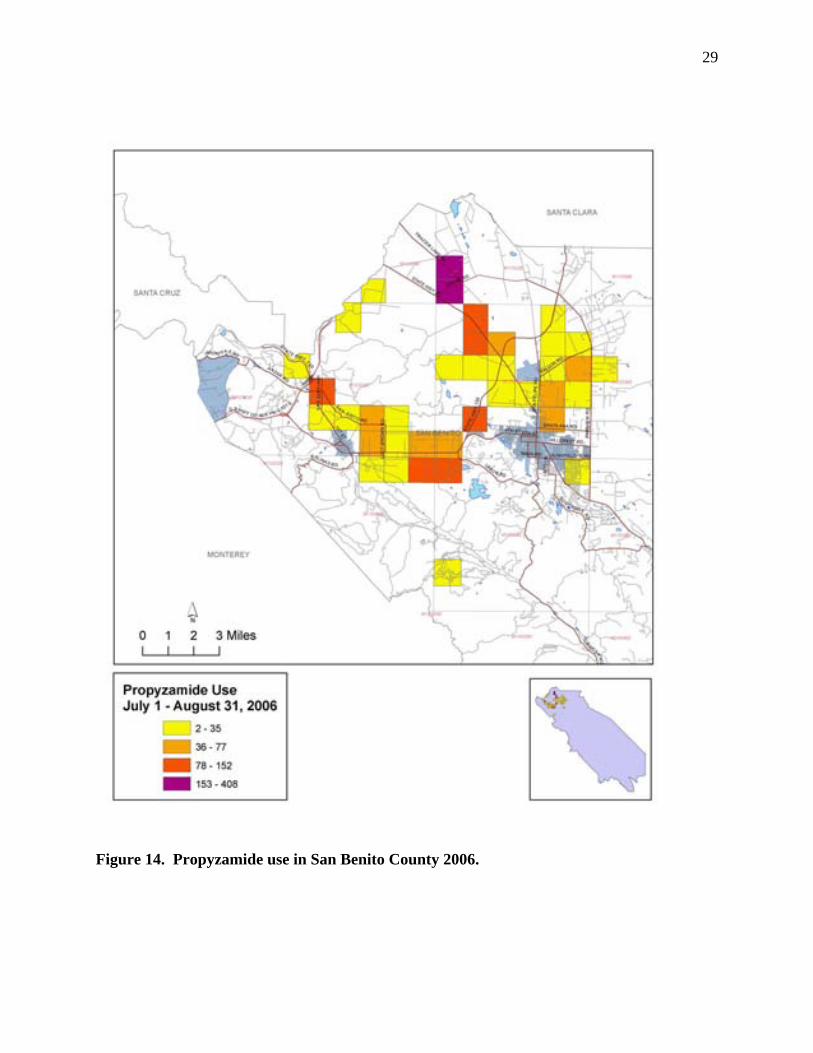
Communities were first rated in each subcategory into four groups according to their ascending ranks, except for the median family income, which was ranked in descending order. In most cases, the top 25% of all communities with the highest ranks were rated four, the second 25% were rated three, and so forth. The communities were then placed into four groups according to their ascending ranks in each of the two major categories (Demographic and Pesticide Use Factors). The rank in each major category was determined by combining (summing) the ratings of each of the subcategories. Finally, the two major category ratings, Demographic rating and Pesticide Use rating, were averaged and then rated according to their ascending ranks as an overall community rating. CDPR recommends that CARB select ambient monitoring sites close to communities where there is high use of propyzamide and where the demographic factors are highest. Based on CDPR’s evaluation (Table 8) CDPR recommends that CARB consider for ambient monitoring five communities in Monterey County including Gonzales, Greenfield, King City, Salinas and Soledad; three communities in Santa Barbara County including Guadalupe, Lompoc and Santa Maria: Holtville in Imperial County; and Hollister in San Benito County. These communities are considered “optimal” sites for air sampling based on DPR’s evaluation. Figures 4 through 13 show the distribution of propyzamide used in Monterey, Santa Barbara, Imperial, San Luis Obispo and San Benito counties during 2007 and 2006. The major roads are delineated on these maps to provide convenient references for monitoring site selection. An additional monitoring site distant to propyzamide applications should be selected for urban background samples. This background site should be located in a relatively high-population area or in an area frequented by people (e.g., schools, fire stations, or other public buildings). CDPR recommends background ambient monitoring sites listed in Table 8. The ambient air monitoring should be conducted over an 8-week period during propyzamide peak use periods. At each sampling site, four 24-hour samples should be collected per week during the sampling period. In addition to the ambient monitoring samples, a particulate sample, with a filter disk in front of the sorption tube to monitor particulates, should be collected at one sampling location during each sampling period. Four collocated samples should be collected in four random dates at each sampling location. Field spikes should be sampled at the same environmental conditions (e.g., temperature, humidity, and wind) and monitoring study conditions (e.g., air flow rates, exposure to sunlight) as those during ambient sampling. Field and trip blanks and field spikes should be collected periodically throughout the monitoring study. CDPR requests that the ambient monitoring report include:
1) Proximity, including distance and direction of sampler to treated fields; 2) Distance of each sampler located above the ground; 3) Information relevant to the monitoring study (e.g., presence of trees, buildings, particular
industrial or commercial facilities and activities) for the sampler surrounding areas; and 4) Latitude and longitude coordinates with a description of Datum used (e.g., NAD 27 or
NAD 83).
18
Table 8. Rating and monitoring evaluation by community.
County PlacenameDemographic
Rating1Use
Rating2Monitoring Priority & Recommendation3
Imperial Holtville 4 4 Optimal Site for Air SamplingMonterey Gonzales 4 4 Optimal Site for Air SamplingMonterey Greenfield 4 4 Optimal Site for Air SamplingMonterey King City 4 4 Optimal Site for Air SamplingMonterey Salinas 4 4 Optimal Site for Air SamplingMonterey Soledad 4 4 Optimal Site for Air SamplingSan Benito Hollister 4 4 Optimal Site for Air SamplingSanta Barbara Guadalupe 4 4 Optimal Site for Air SamplingSanta Barbara Lompoc 4 4 Optimal Site for Air SamplingSanta Barbara Santa Maria 4 4 Optimal Site for Air SamplingImperial Brawley 4 3 High PriorityImperial El Centro 4 3 High PriorityImperial Westmorland 4 3 High PriorityMonterey Boronda 3 4 High PriorityMonterey Castroville 4 3 High PriorityMonterey Marina 3 4 High PriorityMonterey Seaside 4 3 High PriorityMonterey Spreckels 3 4 High PrioritySan Luis Obispo Grover Beach 4 3 High PrioritySan Luis Obispo Oceano 4 3 High PriorityImperial Calexico 4 2 Medium to HighImperial Calipatria 3 3 Medium to HighMonterey Chualar 2 4 Medium to HighMonterey Pajaro 4 2 Medium to HighMonterey Watsonville 4 2 Medium to HighSan Benito San Juan Bautista 3 3 Medium to HighSan Luis Obispo Arroyo Grande 3 3 Medium to HighImperial Heber 4 1 MediumImperial Niland 4 1 MediumImperial Winterhaven 3 2 MediumMonterey Las Lomas 3 2 MediumMonterey Prunedale 1 4 MediumMonterey San Ardo 3 2 MediumSan Luis Obispo Nipomo 2 3 MediumSanta Barbara Mission Hills 2 3 MediumSanta Barbara Orcutt 3 2 MediumSanta Barbara Vandenberg Village 2 3 MediumImperial Imperial 3 1 Low to MediumImperial Seeley 3 1 Low to MediumMonterey Elkhorn 1 3 Low to MediumMonterey Monterey 3 1 Low to MediumMonterey Moss Landing 1 3 Low to MediumMonterey San Lucas 3 1 Low to MediumSan Luis Obispo Baywood-Los Osos 2 2 Low to MediumSan Luis Obispo San Luis Obispo 3 1 Low to MediumSanta Barbara Vandenberg AFB 2 2 Low to Medium
19
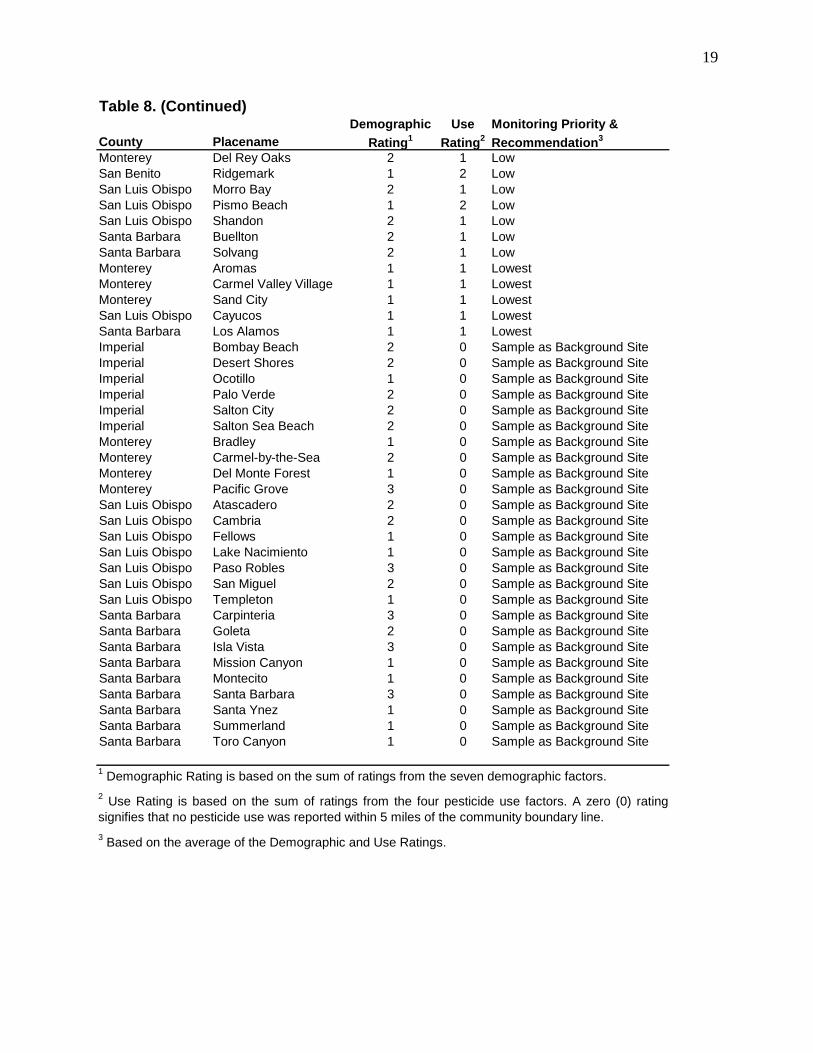
Table 8. (Continued)
County PlacenameDemographic
Rating1Use
Rating2Monitoring Priority & Recommendation3
Monterey Del Rey Oaks 2 1 LowSan Benito Ridgemark 1 2 LowSan Luis Obispo Morro Bay 2 1 LowSan Luis Obispo Pismo Beach 1 2 LowSan Luis Obispo Shandon 2 1 LowSanta Barbara Buellton 2 1 LowSanta Barbara Solvang 2 1 LowMonterey Aromas 1 1 LowestMonterey Carmel Valley Village 1 1 LowestMonterey Sand City 1 1 LowestSan Luis Obispo Cayucos 1 1 LowestSanta Barbara Los Alamos 1 1 LowestImperial Bombay Beach 2 0 Sample as Background SiteImperial Desert Shores 2 0 Sample as Background SiteImperial Ocotillo 1 0 Sample as Background SiteImperial Palo Verde 2 0 Sample as Background SiteImperial Salton City 2 0 Sample as Background SiteImperial Salton Sea Beach 2 0 Sample as Background SiteMonterey Bradley 1 0 Sample as Background SiteMonterey Carmel-by-the-Sea 2 0 Sample as Background SiteMonterey Del Monte Forest 1 0 Sample as Background SiteMonterey Pacific Grove 3 0 Sample as Background SiteSan Luis Obispo Atascadero 2 0 Sample as Background SiteSan Luis Obispo Cambria 2 0 Sample as Background SiteSan Luis Obispo Fellows 1 0 Sample as Background SiteSan Luis Obispo Lake Nacimiento 1 0 Sample as Background SiteSan Luis Obispo Paso Robles 3 0 Sample as Background SiteSan Luis Obispo San Miguel 2 0 Sample as Background SiteSan Luis Obispo Templeton 1 0 Sample as Background SiteSanta Barbara Carpinteria 3 0 Sample as Background SiteSanta Barbara Goleta 2 0 Sample as Background SiteSanta Barbara Isla Vista 3 0 Sample as Background SiteSanta Barbara Mission Canyon 1 0 Sample as Background SiteSanta Barbara Montecito 1 0 Sample as Background SiteSanta Barbara Santa Barbara 3 0 Sample as Background SiteSanta Barbara Santa Ynez 1 0 Sample as Background SiteSanta Barbara Summerland 1 0 Sample as Background SiteSanta Barbara Toro Canyon 1 0 Sample as Background Site
2 Use Rating is based on the sum of ratings from the four pesticide use factors. A zero (0) ratingsignifies that no pesticide use was reported within 5 miles of the community boundary line. 3 Based on the average of the Demographic and Use Ratings.
1 Demographic Rating is based on the sum of ratings from the seven demographic factors.
20
Figure 5. Propyzamide use in Monterey County 2007.
21
Figure 6. Propyzamide use in Monterey County 2006.
22
Figure 7. Propyzamide use in Santa Barbara County 2007.
23
Figure 8. Propyzamide use in Santa Barbara County 2006.
24
Figure 9. Propyzamide use in Imperial County 2007.
25
Figure 10. Propyzamide use in Imperial County 2006.
26
Figure 11. Propyzamide use in San Luis Obispo County 2007.
27
Figure 12. Propyzamide use in San Luis Obispo County 2006.
28
Figure 13. Propyzamide use in San Benito County 2007.
29
Figure 14. Propyzamide use in San Benito County 2006.
30
D. SAFETY RECOMMENDATIONS Propyzamide is a Restricted Use Pesticide. It is US EPA toxicity class III - slightly toxic. Products containing propyzamide have the Signal Word CAUTION. It may be purchased and used only by certified applicators. US EPA restricts the use of all propyzamide formulations, except those in water-soluble packets, due to their potential to cause tumor growth. Mixers and applicators are expected to receive the most exposure to this material through skin contact. To protect workers from potential eye and mucous membrane irritation, precautionary statements on manufacturing-use product labels warn: "Harmful if absorbed through the skin or inhaled. Causes moderate eye irritation. Avoid contact with the skin, eyes or clothing. Avoid breathing dust" (US EPA 1986a). The US EPA has established a Lifetime Health Advisory level of 50 μg/l for propyzamide in drinking water. US EPA has concluded that this herbicide poses a limited oncogenic risk for applicators, which can be reduced through the use of protective measures such as protective clothing and water-soluble packaging (US EPA 1986b). Occupational exposure limits have not been established (OHS 1991). E. REFERENCES BCPC, British Crop Protection Council. 2000. The Pesticide Manual, 12th edition, C.D.S. Tomlin (ed.). Farnham, Surry, UK. Berg, G.L. (ed.). 1986. Farm Chemicals Handbook. Willoughby, Ohio: Meister Publishing Co. EXTOXNET. 1996. Pesticide Information Profile, Pronamide. Extension Toxicology Network: http://pmep.cce.cornell.edu/profiles/extoxnet/metiram-propoxur/pronamide-ext.html Federal Register. 48 FR 34033. July 27, 1983. U.S. Government Printing Office, Washington, DC. Gilliom and others. 2006. The Quality of Our Nation’s Waters—Pesticides in the Nation’s Streams and Ground Water, 1992–2001: U.S. Geological Survey Circular 1291,172 p. Gosselin, R.E., et al., 1984. Clinical Toxicology of Commercial Products, 5th edition, Baltimore, MD: Williams and Wilkins. Howard, P.H. (ed.). 1989. Handbook of Environmental Fate and Exposure Data for Organic Chemicals, Vol. III: Pesticides. Lewis Publishers, Chelsea, MI. Kidd, H. and James, D.R. (eds.) The Agrochemicals Handbook, 3rd edition. Royal Society of Chemistry Information Services, Cambridge, UK, 1991. Meister, R.T. (ed.). 1992. Farm Chemicals Handbook 1992. Meister Publishing Company, Willoughby, OH.
31
OHS, Occupational Health Services, Inc. 1991 (Sept 16). Material Safety Data Sheet for Pronamide. OHS Inc., Secaucus, NJ. Rohm and Haas. 1991 (Nov 6). Product: Kerb Technical Herbicide (Key: 906750-0). Rohm and Haas Company, Philadelphia, PA. TOXNET. 1985. National library of medicine's toxicology data network. Hazardous Substances Data Bank (HSDB). Public Health Service. National Institute of Health, U.S. Department of Health and Human Services. Bethesda, MD: NLM. US Census Bureau. 2000. Census 2000 Demographic Profile Highlights. Website: http://www.census.gov/main/www/cen2000.html USDA. 1990 (Nov). SCS/ARS/CES Pesticide Properties Database: Version 2.0 (Summary). Soil Conservation Service, Syracuse, NY. US EPA. 1979. Pronamide: Position document. Office of Pesticide Programs. Washington, DC. US EPA. 1984. Memorandum from Stuart Z. Cohen. List of potential groundwater contaminants. Office of Pesticides and Toxic Substances, Washington, DC. US EPA. 1986a (Apr). Pesticide fact sheet for pronamide. Washington, DC. US EPA. 1986b (Apr). Guidance for reregistration of pesticide products containing pronamide as the active ingredient. Office of Pesticide Programs, Registration Division. Washington, DC. US EPA. 1986c. Memorandum from Ferial S. Bishop. List of federally restricted products. Registration Support and Emergency Response Branch (TS- 767). Washington, DC. US EPA. 1987 (Feb 4). Environmental News. Office of Public Affairs (A-107). Washington, DC. US EPA. 1988 (Jan 6). Pesticide tolerance for 3,5-dichloro-N-(1,1-dimethyl-2-propynyl)benzamide. Federal Register, 53(3):262-263. US EPA. 1988 (Aug). Health Advisory: Pronamide. Office of Drinking Water, US EPA, Washington, DC. US EPA. 1989 (Jan). Health Advisory Summary: Pronamide. US EPA, Washington, DC. WSSA Herbicide Handbook Committee. Herbicide Handbook of the Weed Science Society of America, 6th edition. Weed Science Society of America, Champaign, IL. 1989.