mapping the impact of crossbreeding in smallholder cattle systems
TRANSCRIPT
Mapping the impact of crossbreeding in smallholder
cattle systems in Indonesia
Tri Satya Mastuti Widi
Thesis committee Promotor Prof. Dr A.J. van der Zijpp Emeritus Professor of Animal Production Systems Wageningen University Co‐promotors Dr H.M.J. Udo Associate professor, Animal Production Systems Group Wageningen University Dr J.K. Oldenbroek Senior Researcher, Centre for Genetic Resources Wageningen University and Research Centre Other members Prof. Dr R.F. Veerkamp, Wageningen University
Prof. Dr G.C. Gandini, University of Milan, Italy
Dr I. Hoffmann, Food and Agriculture Organization, Rome, Italy
Dr C. Almekinders, Wageningen University
This research was conducted under the auspices of the Graduate School of Wageningen Institute of Animal Sciences (WIAS).
Mapping the impact of crossbreeding in smallholder
cattle systems in Indonesia
Tri Satya Mastuti Widi
Thesis
submitted in fulfillment of the requirements for the degree of doctor at Wageningen University
by the authority of the Academic Board, in the presence of the
Thesis Committee appointed by the Academic Board to be defended in public on Monday 29 June 2015 at 4 p.m. in the Aula.
Tri Satya Mastuti Widi Mapping the impact of crossbreeding in smallholder cattle systems in Indonesia 136 pages. PhD thesis, Wageningen University, Wageningen, NL (2015) With references, with summary in English ISBN: 978‐94‐6257‐324‐6
In memory of my mother, Koestinah Kadarwati (1937‐2005) and my father, Soeminto Hardjo (1931‐2013)
Dedicated to my dear sisters Trisna and Hetty, my beloved daughter Malya and my loving husband, Ika
“We need to shift the focus from doing research on farmers to doing research with farmers” (CGIAR, 2014)
CONTENTS
Chapter 1 General introduction
1
Chapter 2 Unique cultural values of Madura cattle: is crossbreeding a threat?
17
Chapter 3 Is crossbreeding of cattle beneficial for mixed farming systems in Central Java?
37
Chapter 4 Is crossbreeding of cattle beneficial for the environment? The case of mixed farming systems in Central Java, Indonesia
67
Chapter 5 Designing genetic impact methodology based on crossbreeding with exotic beef breeds in mixed farming systems in Indonesia
89
Chapter 6 General discussion
111
Summary
127
Acknowledgements 131
About the author 133
Publications 134
PhD education plan 135
Colophon 136
ABSTRACT
In response to increasing demand for meat, Indonesia’s government has been implementing
crossbreeding with European beef breeds to improve the meat production of local cattle.
The main objective of the present study was to evaluate the benefits and consequences of
crossbreeding in smallholder cattle farming systems in Madura and Central Java. The study
used participatory approaches, observations during cultural events in Madura, and
measurements of cattle performances, feeding practices and farm inputs and outputs. In
Madura, crossbreeding is not a threat to the two cultural events involving cattle, sonok (cow
conformation contest) and karapan (bull racing), nor to the sub‐populations of Madura
cattle in the specific areas where these events are organised. Farmers outside the sonok and
karapan areas, prefer Limousin crossbreds (madrasin) to conventional Madura cattle. The
current breeding and conservation approaches do not distinguish between different Madura
cattle types and do not consider the specific needs of the farmers in the sonok and karapan
areas. In Java, farmers perceive that crossbreeding of Simmental with local Ongole cattle is
beneficial for them. Crossbreeding was not accompanied with changes in the cattle farming
systems. Crossbred cattle reached a higher body weight and therefore had a higher market
price, but they also required more feed. This resulted in comparable Gross Margins for
farms with crossbred and Ongole stock. Farmers preferred the crossbreds because of their
nice appearance, high growth rate and the higher market price for progeny compared to
Ongole. Crossbreeding as a tool of intensification did not reduce the carbon footprint and
land use per kilogram liveweight produced. The advantage from the faster growth of
crossbreds was counteracted by the higher emissions and land use from feed production for
crossbreds. The dualism in crossbreeding is that policy makers promote crossbreeding to
meet the increasing demand for beef, whereas farmers are concerned with their livelihoods
and the multi‐functionality of cattle. Crossbreeding contributes to increased meat
production at the national level, however, it has limited possibilities to improve cattle
production at farm level. Crossbreeding is also not reducing rural poverty. Participatory
approaches should ensure that farmers’ views are considered in national crossbreeding
policies and practices. In Madura and Central Java, farmers identified economic benefits,
feed availability, cattle management, animal performances, additional functions of cattle,
and health and fertility as issues to be considered beforehand in a genetic impact
assessment of crossbreeding. Other stakeholders mentioned meat production,
environmental quality and diversity in farm animal genetic resources as important issues.
Crossbreeding will inevitably continue in Java and Madura. Breeding strategies, have to be
adjusted, however, as farmers do not want to upgrade their local cattle to Simmental or
Limousin. Viable populations of local cattle are needed to ensure sustainable crossbreeding
strategies.
Chapter 1
General introduction
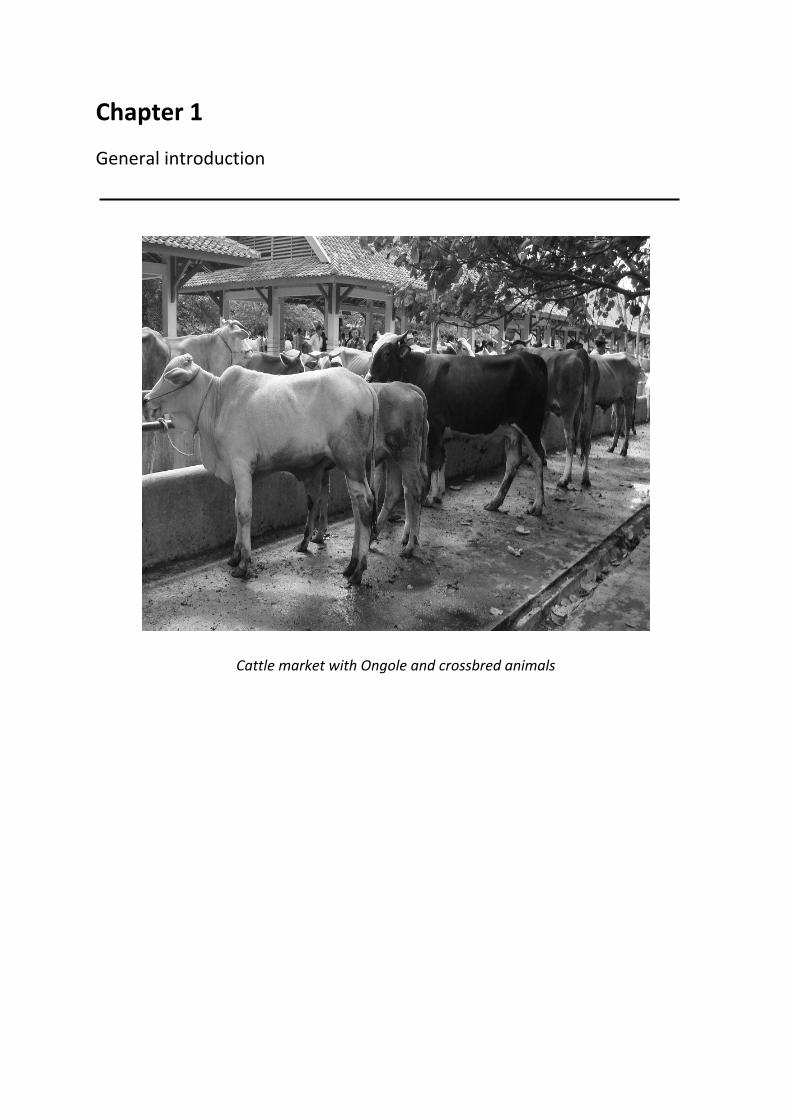
Cattle market with Ongole and crossbred animals
General introduction
2
1.1. General background
Population growth, urbanisation, economic progress and changing consumer
preferences boost the demand for livestock products in developing countries (Delgado et
al., 2001). Indonesia is an emerging economy, where high population growth and economic
progress are major driving forces for the rising demand for animal source foods. Red meat is
a traditional animal source food in Indonesia (Sullivan and Diwyanto, 2007). The average
meat consumption is 1.87 kg/capita per year (BPS, 2011) and is expected to increase to 3.72
kg/capita per year by 2020. The human population is expected to increase from the current
241 million to 274 million by 2020 (Agus et al., 2014). The highest production and
consumption of beef is in Java, the main island, where 57% of the human population live
(Kementan, 2013). To satisfy the demand for meat, the government has been importing
meat as well as live feeder and slaughter stock, a few breeding animals and semen. Since
the 1980’s, the government has been promoting artificial insemination (AI) using exotic Bos
taurus breeds, such as Simmental, Limousin, Aberdeen Angus and Hereford, to improve the
meat production of local cattle, especially in Java.
In Indonesia, cattle systems have developed for centuries in harmony with local
conditions for climate, vegetation, existing farming systems and social, cultural and religious
values. Smallholder cattle farms are characterised by keeping between two and four head of
cattle and integrating crop and livestock production (Djajanegara and Diwyanto, 2002;
Priyanti et al., 2012). This is done by gathering nutrients from waste lands, roadsides, home
gardens and crop residues, and using draught power for the cultivation of arable land
(Beets, 1990; Devendra, 1993; Rodriguez and Preston, 1997). In Java and Madura, which
have densely populated rural regions with limited grazing areas, cattle are universally kept
in a barn and fed forages, which are cut‐and‐carried from roadsides and field margins. The
cut‐and‐carry feeding system is labour intensive (Tanner et al., 2001).
The importance of livestock for smallholder livelihoods around the world is well
understood. For poor households, the non‐income functions of livestock keeping are
particularly important (Anderson, 2003). In Indonesia, farmers do not only keep cattle to
produce meat for the urban market. Cattle are also kept to support cropping with manure
and draught power, and as livelihood assets (Widi, 2004). The livelihood functions or
benefits include savings, buffering, insurance and cultural benefits (Anderson, 2003; Moll et
al., 2007). The introduction of crossbreeding in smallholder systems implies that the major
objectives of keeping cattle will change from multipurpose production to market‐oriented
production (Udo et al., 2011).
Cultural practices, in particular, are expected to require specific characteristics, which
might not be fulfilled by crossbred animals. Cattle breeds in Indonesia differ substantially in
their cultural values. In Bali Island, albino Bali cattle are treated as holy cattle and used in a
cultural ceremony (Panjono, 2014). Bali people (mostly Hindu) are not allowed to slaughter
‘white’ cattle (mostly Zebu, such as Ongole and Brahman), as they believe that a ‘white’ bull
is the mount of the god Wisnu. In mainland Java, the cultural values of cattle are much less
Chapter 1
3
pronounced. For a minority of Java people (usually rich farmers), Ongole bulls still have
socio‐cultural value as a hobby and expressing pride in keeping beautiful cattle. In Central
Java, traditional cart pulling festivities with Ongole males are organized every month.
Cultural values of cattle are most prominent in Madura. Crossbreeding was prohibited for a
long period, in order to protect the Madura cattle breed and traditional cultural practices.
However, since 2001, crossbreeding is allowed in Madura. In Bali crossbreeding is still
prohibited to protect the Bali breed (Bos banteng).
Exotic breeds have been introduced in many developing regions for crossbreeding
with local breeds. Bos taurus sires for beef cattle crossbreeding may result in higher growth
rates and larger carcasses, at least under improved management conditions (Said et al.,
2003; Scholtz et al., 2011). This requires more feed resources, improved marketing and a
better infrastructure. Crossbreeding has often failed to yield the desired and expected
results. Results from optimized testing facilities cannot be directly translated to mixed
farming systems, where institutional and infrastructural constraints are prominent. Scholtz
et al. (2011) claim that it is likely crossbreeding programs will never succeed in harsh
environments unless adequate fodder availability is assured. In Indonesia, especially Java,
lack of feed is a major constraint for cattle production. It is questionable whether farmers
could afford to grow or buy the feed and concentrates required by crossbred cattle.
Crossbreeding in smallholder systems is never done systematically (Wollny, 2003).
This is a major threat to the conservation of local genetic resources (Wollny, 2003). So, there
is general concern that genetic variation is disappearing through crossbreeding and breed
substitution (FAO, 2001; Köhler‐Rollefson et al., 2009). In addition, cultural and social
aspects can be important reasons for continuing to keep certain breeds that have become
economically unviable (Singh and Sansthan, 2003). The analysis of cultural values can be a
tool to add economic value to local breeds, and consequently might contribute to
maintaining local breeds (Gandini and Villa, 2003).
A recent pressing international issue is the emphasis on reducing the climate impact
of cattle (Steinfeld et al., 2006; Herrero et al., 2009; Gerber et al., 2013; Herrero and
Thornton, 2013). Increasing productivity is generally seen as an efficient climate change
mitigation strategy. In this context, local ruminant breeds are considered to be less efficient
in mitigating greenhouse gasses (GHG) emissions than improved breeds (Steinfeld et al.,
2006). Increasing productivity to reduce environmental impact could have an additional
negative effect on the future use of local farm animal genetic resources (Hoffmann, 2011).
There is often a gap between the objectives at national and global levels and the
objectives of smallholder farmers. The influence from the lower level (smallholder farmers)
to higher levels is very weak, whereas influences from national to regional and global levels
are often stronger (Giller et al., 2008). Public and private interests do not always match
(Hoffmannn, 2011). In Indonesia, the government is mainly concerned with the increasing
demand for meat by urban consumers, whereas smallholder farmers are mainly concerned
about their livelihoods.
Crossbreeding policies are implemented throughout the world without sufficient
General introduction
4
knowledge of the positive and negative effects on food production, genetic diversity,
environment, resource use and the social and economic sustainability of the majority of
farming systems and rural livelihoods (Pilling, 2007; Gandini and Oldenbroek, 1999; Samdup
et al., 2010; Marshall, 2014). In Indonesia, crossbreeding is also applied without sufficient
knowledge of its impact and without necessary changes in the institutional environment.
Hence, crossbreeding may influence not only the future availability of local farm animal
genetic resources but also (for better or worse) the farming systems and livelihoods of
livestock keepers. The major motivation for the research in this thesis is the current lack of
understanding about the consequences of the introduction of exotic breeds for
crossbreeding for specific mixed farming systems in Indonesia.
1.2. Cattle keeping in Indonesia Timeline of cattle breeds
Table 1.1. provides a timeline of the development of cattle breeds in Indonesia. The
timeline shows that crossbreeding is not a new approach in cattle production systems in
Indonesia. Martojo (2005) stated that in the 19th century, during the Dutch administration,
local breeds were upgraded using Ongole bulls from India. The pure Ongole from India was
brought to Sumba Island. This island, far from Java, was originally only a quarantine area, as
India had endemic rinderpest. However, Ongole cattle developed well in Sumba
(Hardjosubroto, personal communication) and became the pure Sumba‐Ongole (Sudardjat
and Pambudy, 2003). In Java, the Sumba Ongole was crossed with small Java cattle
(Barwegen, 2004), particularly in East Java. Further importation of Indian Bos indicus cattle,
such as Ongole, Hissar and other zebu cattle, occurred early in the 20th century. The purpose
of the importations was to provide Java with strong draught cattle to pull carts for the sugar
industry (Barwegen, 2004). The crossbreeding during this period resulted in Ongole‐grade
(in Indonesia called Peranakan Ongole, PO). The Dutch administration introduced Ongole‐
grade cattle in areas along a main concrete road, ‘Daendels road’, located along the south
coast in Central Java. This road was made to stimulate sugarcane production on large
plantations, and as a main road to connect Central Java with West Java. Ongole cattle
replaced the buffalo as draught animal, as they are humped and their hooves are better
suited to walking on concrete roads. From about the 1930’s onwards, the Ongole became
the prominent cattle breed in Java (Maule, 1990).
Starting in the 1980’s, the Ongole was upgraded using exotic breeds through an AI
program promoted by the Indonesian government (Sutresniwati, 2006). The government
introduced artificial insemination in 1952 in AI training centres. AI was applied for the first
time in the field in 1969 and since 1973 it has been widely applied in smallholder farms,
using frozen semen (Sudardjat and Pambudy, 2003). Martojo (2005) stated that frozen
semen from exotic cattle breeds began to be imported during the second five‐year plan in
the 1970’s. In 1976, the government built two AI centres, in West and East Java, to fulfil the
demand for frozen semen, and established local AI bureaus in almost every province. In the

Chapter 1
5
Table 1.1. Historical timeline for development of non‐dairy cattle breeds in Indonesia
Time line Breed History Location Population size
3,500 BC Bali (Bibos sondaicus)
Bali cattle were domesticated from Banteng (Bos banteng)
Bali, Nusa Tenggara, Sulawesi, and Javas
4,789,521 (Kementan, 2013)
Unknown Java (Bos javanicus)
Java cattle are presumably developed from a cross between an old mix of Indo‐Chinese cross of Zebu and Banteng (Barwegen, 2002) or indigenous hybrids with genes from the Bos indicus, Bos taurus and Bos (bibos) spp. (Payne and Hodges, 1997)
Java < 10,000 (Astuti et al., 2007)
Unknown Sumatera / Pesisir
Sumatera cattle are a result of crossing Bos indicus and Bos sondaicus. They are of the same origin as Java cattle (Deptan, 2003).
Sumatera Island 950,000 (Deptan, 2003)
About 1,500 years ago
Madura Crossbreeding of Banteng /Bali cattle (Bos (bibos) spp x Bos indicus (Ressang et al., 1959) or Bali cattle (Bos (bibos) spp x Bos indicus x Bos Taurus (Payne and Rollinson, 1976), resulted in Madura cattle.
Madura, Java, Sumatera, Kalimantan, Sulawesi, Nusa Tenggara Islands
1,285,690 (Kementan, 2013)
1900’s Sumba Ongole (SO)
In 1906, Ongole cattle (Bos indicus) were imported from Madras, India to Sumba Island (Hardjosubroto and Astuti, 1993).
Sumba Island 46,649 (Astuti et al., 2007)
1900’s Hissar Hissar cattle were imported from Punjab, India, in 1900’s and brought to Sumbawa Island (Astuti et al., 2007).
Sumbawa Island < 10,000
1930 Ongole‐grade (in Indonesia called Peranakan Ongole, PO)
Peranakan Ongole was developed around 1930 as a grading up of Java cattle and SO (Sudardjat and Pambudy, 2003; Astuti et al., 2007).
All around Indonesia, particularly Java, with the highest population in East and Central Java
4,281,602 (Kementan 2013)
1980’s Bos taurus crossbred
Crossbreeding of PO with Bos taurusbreeds such as Simmental, Limousin, Hereford, Angus, Santa Gertrudis, Droughtmaster, Charolais, and Shorthorn started in smallholder farms through artificial insemination (AI) (Hardjosubroto, 1994). Simmental, Limousin and Angus were favoured by farmers.
All around Indonesia, particularly Java
Unknown
1990’s Crossbreeding of Bali cattle with Bos taurus breeds such as Simmental, Limousin, and Angus through AI. Male crossbred progeny is sterile (Hardjosubroto, personal communication).
Nusa Tenggara Island Unknown
2000’s Crossbreeding of Madura cattle with Limousin through AI (Widi et al., 2014)
Madura except Sapudi (outer) Island
Unknown
General introduction
6
1980’s the government imported cattle of ten exotic breeds (Brahman, Santa Gertrudis,
Droughtmaster, Sahiwal, Charolais, Simmental, Limousin, Hereford, Shorthorn and Angus)
(Hardjosubroto, 1994), to provide semen. These cattle were kept on a central farm. Only
information about purebred performances of the Brahman, Simmental and Limousin is
available (Hardjosubroto, 1985; Baliarti, 1991). At present, the national AI organization
imports exotic AI bulls from Australia and buys bulls from smallholder and large‐scale farms
with upgraded cattle. AI bulls of local breeds originate from government owned local breed
breeding centres and private farmers.
Nowadays many different types of cattle exist in Indonesia as a result of the
crossbreeding policy. Bali, Madura, Ongole, Hissar, Aceh, Pesisir and Java are local cattle
breeds, which are kept both pure and crossed with exotic breeds, in particular Simmental,
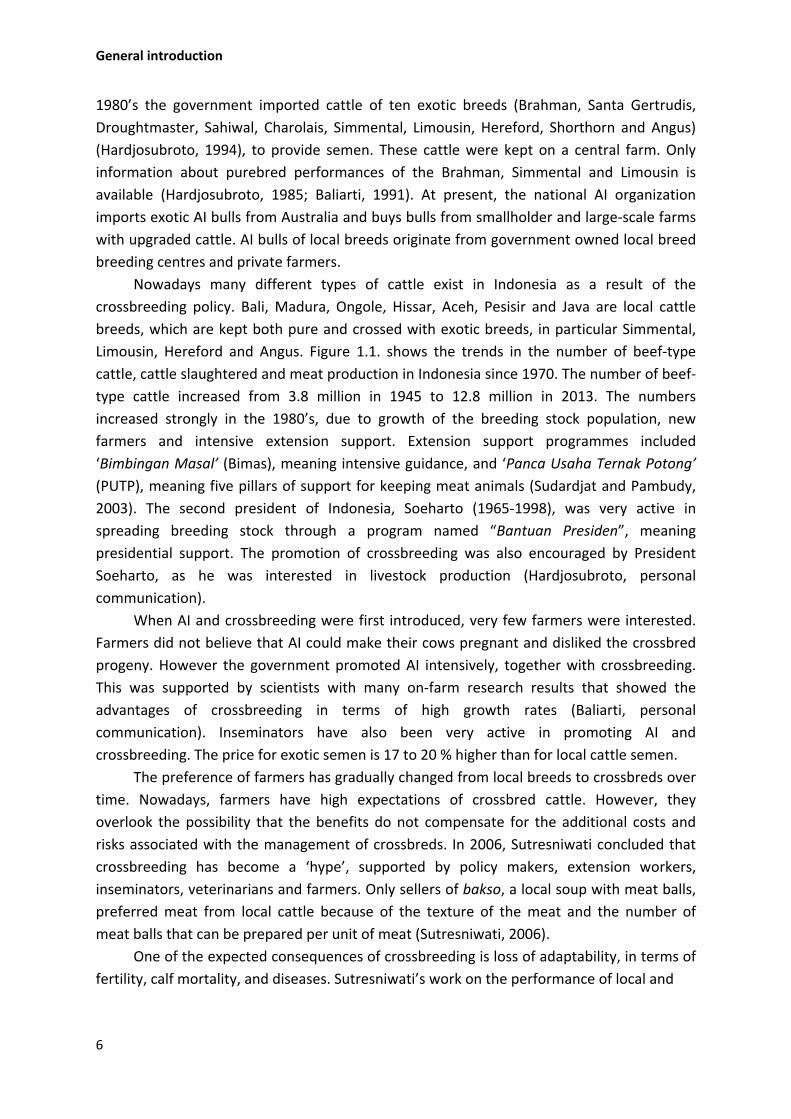
Limousin, Hereford and Angus. Figure 1.1. shows the trends in the number of beef‐type
cattle, cattle slaughtered and meat production in Indonesia since 1970. The number of beef‐
type cattle increased from 3.8 million in 1945 to 12.8 million in 2013. The numbers
increased strongly in the 1980’s, due to growth of the breeding stock population, new
farmers and intensive extension support. Extension support programmes included
‘Bimbingan Masal’ (Bimas), meaning intensive guidance, and ‘Panca Usaha Ternak Potong’
(PUTP), meaning five pillars of support for keeping meat animals (Sudardjat and Pambudy,
2003). The second president of Indonesia, Soeharto (1965‐1998), was very active in
spreading breeding stock through a program named “Bantuan Presiden”, meaning
presidential support. The promotion of crossbreeding was also encouraged by President
Soeharto, as he was interested in livestock production (Hardjosubroto, personal
communication).
When AI and crossbreeding were first introduced, very few farmers were interested.
Farmers did not believe that AI could make their cows pregnant and disliked the crossbred
progeny. However the government promoted AI intensively, together with crossbreeding.
This was supported by scientists with many on‐farm research results that showed the
advantages of crossbreeding in terms of high growth rates (Baliarti, personal
communication). Inseminators have also been very active in promoting AI and
crossbreeding. The price for exotic semen is 17 to 20 % higher than for local cattle semen.
The preference of farmers has gradually changed from local breeds to crossbreds over
time. Nowadays, farmers have high expectations of crossbred cattle. However, they
overlook the possibility that the benefits do not compensate for the additional costs and
risks associated with the management of crossbreds. In 2006, Sutresniwati concluded that
crossbreeding has become a ‘hype’, supported by policy makers, extension workers,
inseminators, veterinarians and farmers. Only sellers of bakso, a local soup with meat balls,
preferred meat from local cattle because of the texture of the meat and the number of
meat balls that can be prepared per unit of meat (Sutresniwati, 2006).
One of the expected consequences of crossbreeding is loss of adaptability, in terms of
fertility, calf mortality, and diseases. Sutresniwati’s work on the performance of local and
Chapter 1
7
Figure 1.1. Number of beef cattle and cattle slaughtered (000 heads) since 1945 ‐ 2013 (change in
census method for 2011 and 2012)
Source : Kementan (2013) and Sudardjat and Pambudy (2003)
crossbred cattle showed that crossbred cattle in Central Java had better growth rates but
lower fertility rates than local cattle (Sutresniwati, 2006). An adequate reproductive
performance is crucial to the financial success of smallholder farmers with only one or two
cows (Agyemang and Nkhonjera, 1990). Cunningham (1989) found that in tropical areas,
calving interval was poorer when the percentage of Bos taurus was more than 50%.
Veterinarians observe that disease resistance is better in local cattle than in crossbred cattle
(Putro, personal communication). The majority of crossbred cattle suffer from Cascado
disease, a disease caused by the parasite Stephanofilaria spp, which is spread by flies. It
affects the skin around the eyes, though farmers do not consider it to be a problem
(Sutresniwati, 2006). Widi and Widodo (2007) found that inadequate management (general
sanitary conditions in barns and absence of fly control) is the main cause of Cascado disease.
Perspectives of local breeds
The most dangerous threat for local breeds is the euphoria of most stakeholders
about crossbreeding, not only the government and cattle traders, but also farmers
themselves (Sutresniwati, 2006). The international call to maintain livestock biodiversity in a
country (FAO, 2001) prompted policy makers in Indonesia to contribute to the State of the
World’s Animal Genetic Resources process by preparing a strategic national report on
animal genetic resources (Anonymous, 2003). Increased awareness about the importance of
maintaining local genetic resources encouraged policy makers and scientists to support the
conservation of local breeds (Astuti et al., 2007). The local cattle breeds defined were Aceh,
General introduction
8
Bali, Ongole‐grade, Sumba‐Ongole, Madura, Java, Pesisir and Grati. A number of areas have
been designated as conservation areas for specific breeds, such as Sapudi in Madura for the
Madura cattle and Bali for the Bali cattle. A second measure is performance testing for local
breeds (Kementan, 2012). The best yearling calves are transferred to performance test
stations to select the best bulls as breeding bulls for AI and cows. Performance and progeny
testing in Bali cattle started earlier, around 1986. No exact data are available on the number
of test stations nor on the distribution of tested animals. Furthermore, data on pedigree and
on‐farm performances are not collected, and therefore cannot be used for the analysis of
inbreeding and the correlation of test station performance results with on‐farm
performance results.
Cattle value chains
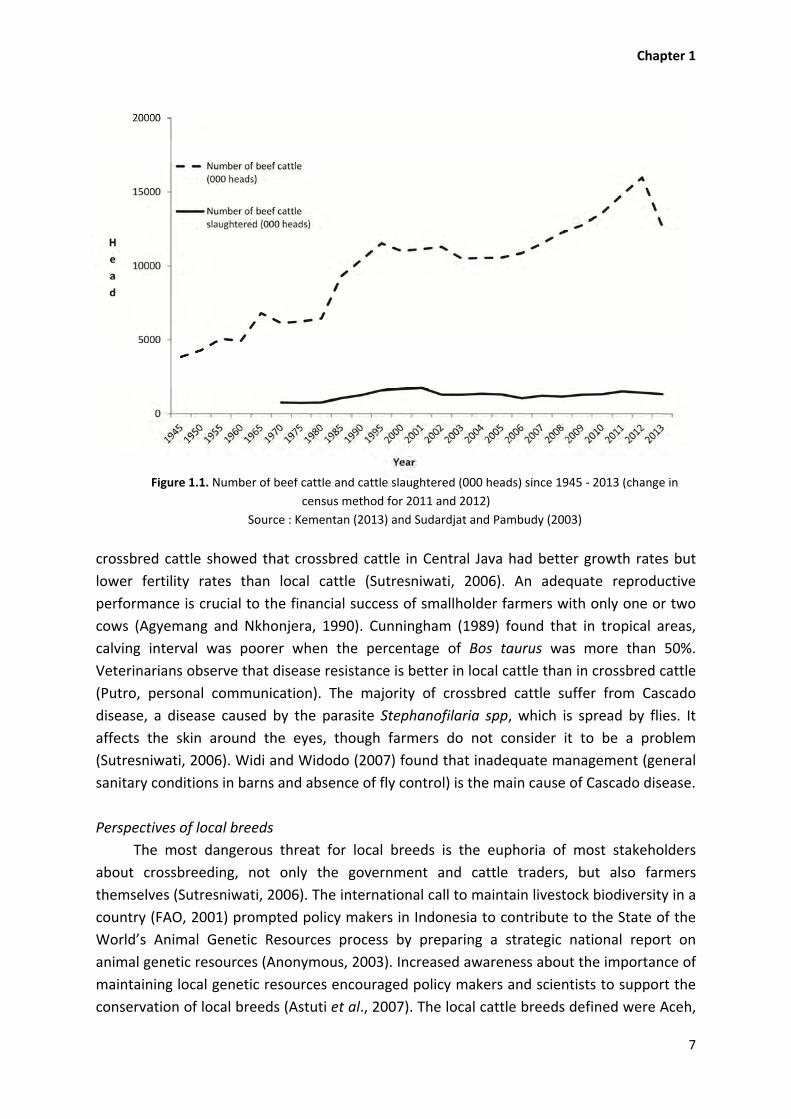
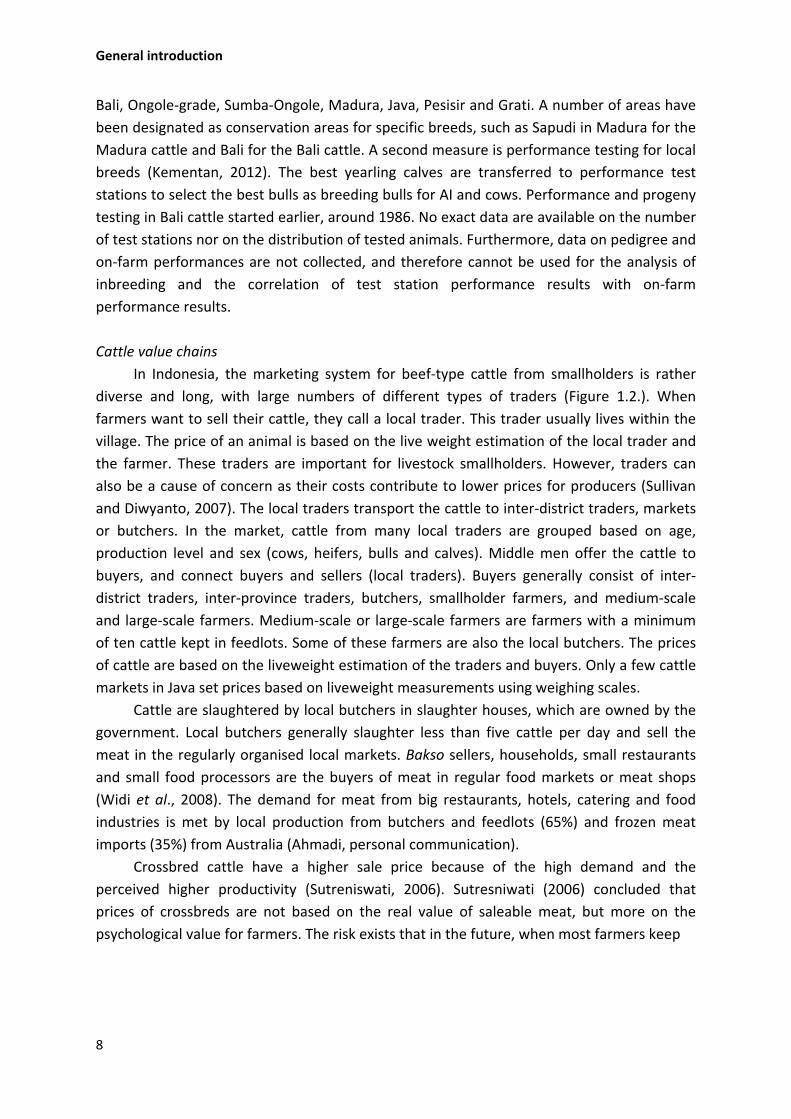
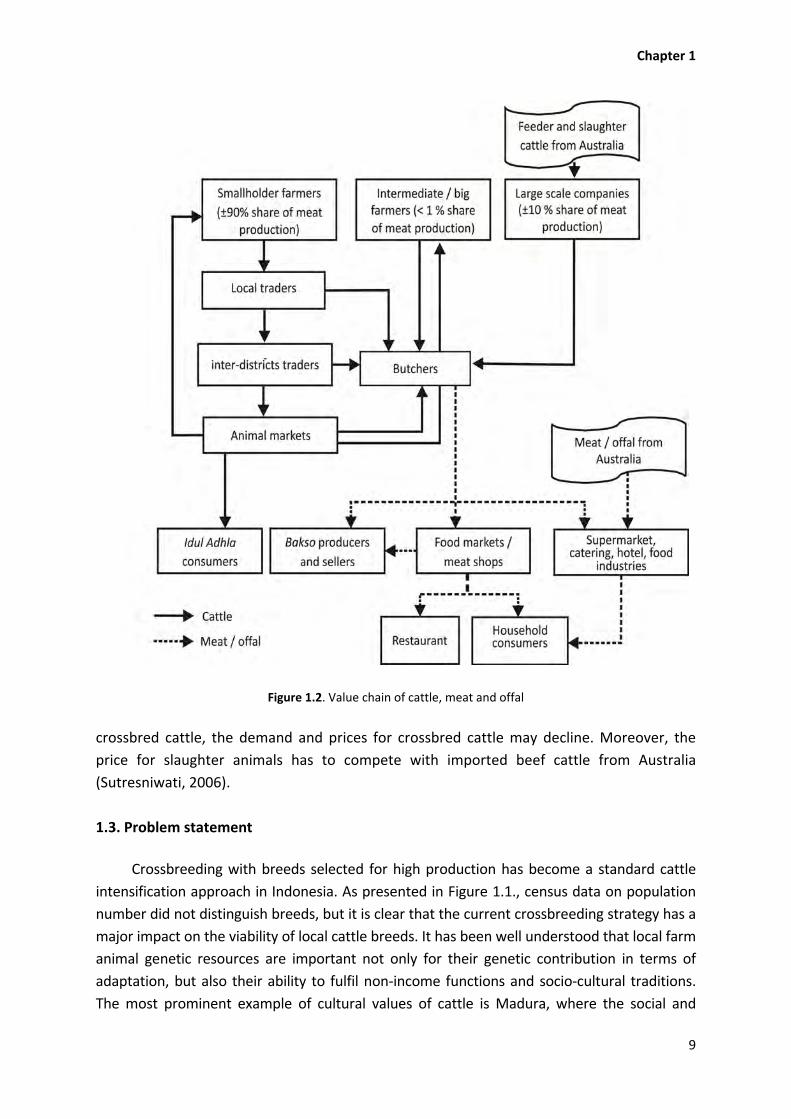
In Indonesia, the marketing system for beef‐type cattle from smallholders is rather
diverse and long, with large numbers of different types of traders (Figure 1.2.). When
farmers want to sell their cattle, they call a local trader. This trader usually lives within the
village. The price of an animal is based on the live weight estimation of the local trader and
the farmer. These traders are important for livestock smallholders. However, traders can
also be a cause of concern as their costs contribute to lower prices for producers (Sullivan
and Diwyanto, 2007). The local traders transport the cattle to inter‐district traders, markets
or butchers. In the market, cattle from many local traders are grouped based on age,
production level and sex (cows, heifers, bulls and calves). Middle men offer the cattle to
buyers, and connect buyers and sellers (local traders). Buyers generally consist of inter‐
district traders, inter‐province traders, butchers, smallholder farmers, and medium‐scale
and large‐scale farmers. Medium‐scale or large‐scale farmers are farmers with a minimum
of ten cattle kept in feedlots. Some of these farmers are also the local butchers. The prices
of cattle are based on the liveweight estimation of the traders and buyers. Only a few cattle
markets in Java set prices based on liveweight measurements using weighing scales.
Cattle are slaughtered by local butchers in slaughter houses, which are owned by the
government. Local butchers generally slaughter less than five cattle per day and sell the
meat in the regularly organised local markets. Bakso sellers, households, small restaurants
and small food processors are the buyers of meat in regular food markets or meat shops
(Widi et al., 2008). The demand for meat from big restaurants, hotels, catering and food
industries is met by local production from butchers and feedlots (65%) and frozen meat
imports (35%) from Australia (Ahmadi, personal communication).
Crossbred cattle have a higher sale price because of the high demand and the
perceived higher productivity (Sutreniswati, 2006). Sutresniwati (2006) concluded that
prices of crossbreds are not based on the real value of saleable meat, but more on the
psychological value for farmers. The risk exists that in the future, when most farmers keep
Chapter 1
9
Figure 1.2. Value chain of cattle, meat and offal
crossbred cattle, the demand and prices for crossbred cattle may decline. Moreover, the
price for slaughter animals has to compete with imported beef cattle from Australia
(Sutresniwati, 2006).
1.3. Problem statement
Crossbreeding with breeds selected for high production has become a standard cattle
intensification approach in Indonesia. As presented in Figure 1.1., census data on population
number did not distinguish breeds, but it is clear that the current crossbreeding strategy has a
major impact on the viability of local cattle breeds. It has been well understood that local farm
animal genetic resources are important not only for their genetic contribution in terms of
adaptation, but also their ability to fulfil non‐income functions and socio‐cultural traditions.
The most prominent example of cultural values of cattle is Madura, where the social and
General introduction
10
cultural values of Madurese depend on the existence of Madura cattle. There are two
traditional cultural festivities that involve Madura cattle, bull races and cow/heifer contests.
These are well identified markers of the Madurese throughout Indonesia. Crossbreeding may
be a threat not only to the existence of purebred Madura cattle, but also for cultural activities
involving cattle.
How beneficial is crossbreeding for the livelihoods of smallholders? Crossbreeding
requires resources; in particular the issue of feed resources is crucial. Cattle in Indonesia are
dependent on crop residues, road‐side grasses and forages. In general, the quality of these
feeds is not sufficient to support high production levels. The feeds available will differ in
different regions due to differences in cropping patterns (Zemmelink et al., 2003). There is
no recording of animal performances in Indonesia. Studying the impact of crossbreeding on
the livelihoods of smallholders therefore requires data collection methodologies at animal
and farm levels. These methodologies need to include the different motives for keeping
cattle.
International literature pays ample attention to the beneficial effect for the
environment of the intensification of cattle keeping (Steinfeld et al., 2006). However, it is
unclear whether crossbreeding is an appropriate intensification strategy in smallholder
farms to reduce the environment impact, in terms of GHG emissions and land use, of cattle
keeping. According to Marshall (2014), it is still an assumption that the adoption of more
productive breeds in smallholder farming systems will be beneficial for the environment.
Intensification requires more inputs, so only more efficient use of resources will result in
reduced impacts on the environment. It is unknown whether crossbreeding for beef
production in smallholder farming systems, such as those in Indonesia, will result in more
efficient use of resources and, if so, in less environmental impact per unit of production.
An impact assessment of the effects of the introduction of exotic cattle breeds on
indigenous cattle resources, cattle farming systems and livelihoods is needed to understand
the consequences of such introductions (Gandini and Oldenbroek, 2007). In literature on
farm animal genetic resources, the call for genetic impact assessments (GIA) arises primarily
because of concerns about the potential loss of genetic diversity through breed replacement
or ill‐considered crossing or upgrading (Hiemstra, 2003). However, the impact of using
different breed types in developing country livestock systems requires assessments from a
number of viewpoints and at different levels (Marshall, 2014). Ideally, a livestock impact
assessment should be made before the introduction of exotic animals is considered. In
practice, it is usually done after the introduction has already taken place. It is often not done
at all.
The gap between governments’ objectives and farmers’ practices calls for
participatory methodological approaches involving the key stakeholders, the farmers, to
understand their perceptions about crossbreeding, to assess the impact of crossbreeding,
and to design appropriate livestock development strategies for their farming systems.
Chapter 1
11
1.4. Objectives of the study
The main objective of the study described in this thesis was to evaluate the benefits
and consequences of crossbreeding in smallholder cattle farming systems, in order to develop
a genetic impact assessment (GIA) of exotic cattle breeds on cattle farming systems in
Indonesia. This analysis is expected to contribute to the design of feasible livestock
development strategies for smallholder farming systems. The specific objectives were:
1. To analyse the cultural values of local cattle and the effect of crossbreeding on
local traditions in Madura;
2. To assess the performance of local and crossbred cattle and the impact of
crossbreeding in smallholder farming systems in different agro‐ecological zones in
Central Java;
3. To assess the environmental impact, in terms of global warming potential (GWP)
and land use, of local and crossbred cattle in smallholder farming systems in
different agro‐ecological zones in Central Java;
4. To formulate a GIA design that shows the consequences of exotic crossbreeding.
1.5. Methodology
Research sites
Indonesia is located approximately between 6 to 110 north latitude and 95 to 1410
east longitude, covering 9.82 million square kilometres and consisting of 17,508 islands with
1.92 million sq.km of land and surrounded by 7.90 million sq.km of seawater. This study
took place in Central Java Province, Yogyakarta Province and Madura. Central Java and
Yogyakarta Provinces are located in Java, the most populated island in Indonesia, whereas
Madura is a small, densely populated island located off the northeast coast of Java. It is
administered as part of East Java Province. These provinces have relatively large cattle
numbers.
Madura was used to study the unique interaction between cattle and culture, and the
potential impact of crossbreeding on this interaction, as Madura is famous for cultural
events involving cattle (De Jonge, 1990). The study areas in Madura were determined by the
use of cattle for different cultural events: karapan bull race, sonok cow contest and
crossbred cattle (madrasin) contest.
In Central Java, the study areas represent Wet lowlands, Wet uplands, and Dry
uplands. These have different topography, soil types, soil fertility and agro‐climatic
conditions, and consequently different cropping patterns, land use management and feed
resources (Budisatria, 2006). Lowlands (less than 100 metres above sea level (m asl) are
characterised by irrigated paddy mixed with maize, ground nut, soy bean and cassava
growing. The main component of feed is locally grown grass (Ifar, 1996; Budisatria, 2006).
Uplands are found higher than 500 m asl. Here annual crop production systems are found.
The main crops are cassava, maize, groundnut and vegetables. Some perennial crops are
General introduction
12
also available, such as banana and coconut (Budisatria, 2006). Differences in the use of
natural resources between areas and consequently between animal production systems
might affect the type of animals that can be kept in the areas. The consequences for feed
quality and quantity in different areas and ecosystems are not predictable beforehand.
Farmers optimize resources around their homestead and cropping plots to feed their
livestock. Cattle are the predominant type of livestock in all study areas.
Research approach
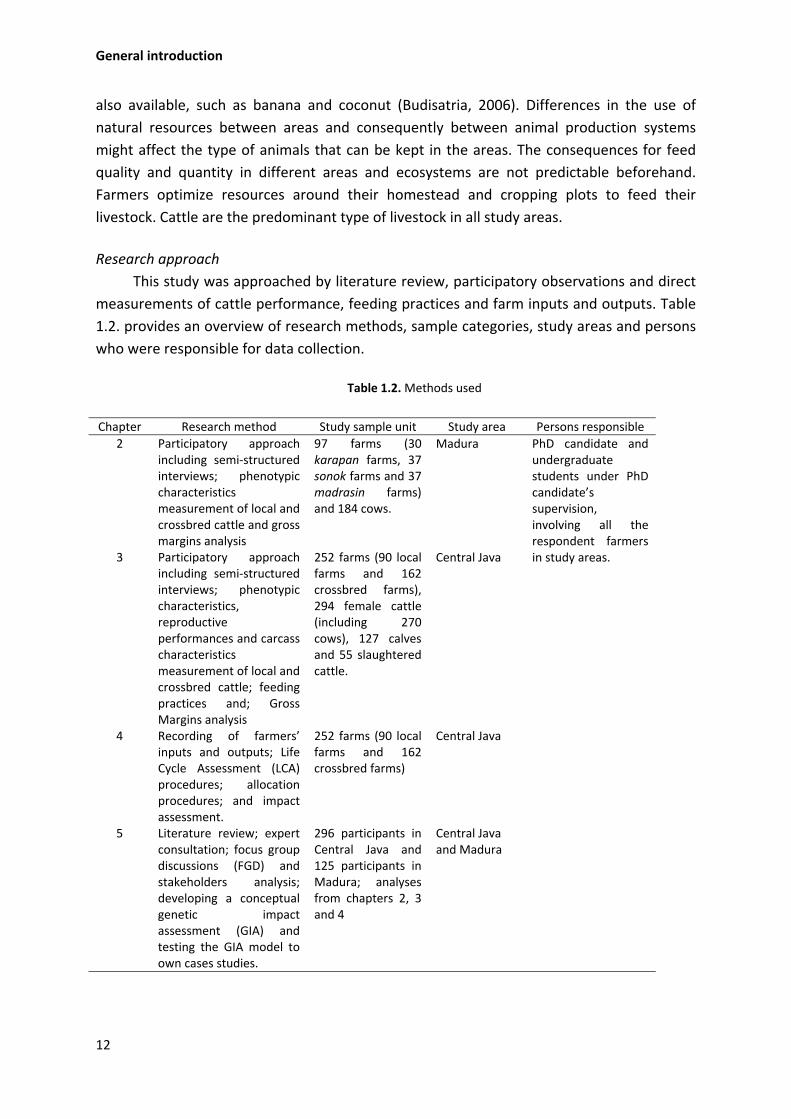
This study was approached by literature review, participatory observations and direct
measurements of cattle performance, feeding practices and farm inputs and outputs. Table
1.2. provides an overview of research methods, sample categories, study areas and persons
who were responsible for data collection.
Table 1.2. Methods used
Chapter Research method Study sample unit Study area Persons responsible
2 Participatory approach including semi‐structured interviews; phenotypic characteristics measurement of local and crossbred cattle and gross margins analysis
97 farms (30 karapan farms, 37 sonok farms and 37 madrasin farms) and 184 cows.
Madura PhD candidate and undergraduate students under PhD candidate’s supervision, involving all the respondent farmers in study areas. 3 Participatory approach
including semi‐structured interviews; phenotypic characteristics, reproductive performances and carcass characteristics measurement of local and crossbred cattle; feeding practices and; Gross Margins analysis
252 farms (90 local farms and 162 crossbred farms), 294 female cattle (including 270 cows), 127 calves and 55 slaughtered cattle.
Central Java
4 Recording of farmers’ inputs and outputs; Life Cycle Assessment (LCA) procedures; allocation procedures; and impact assessment.
252 farms (90 local farms and 162 crossbred farms)
Central Java
5 Literature review; expert consultation; focus group discussions (FGD) and stakeholders analysis; developing a conceptual genetic impact assessment (GIA) and testing the GIA model to own cases studies.
296 participants in Central Java and 125 participants in Madura; analyses from chapters 2, 3 and 4
Central Java and Madura
Chapter 1
13
Important issues related to the impact of crossbreeding on smallholders farming systems
were gathered through focus group discussions (FGDs) among stakeholders and literature
review. These issues were selected, measured and assessed using semi‐structured
interviews and measurements of cattle and farm performance, inputs and outputs, and
costs and benefits of cattle keeping.
1.6. Layout of the thesis
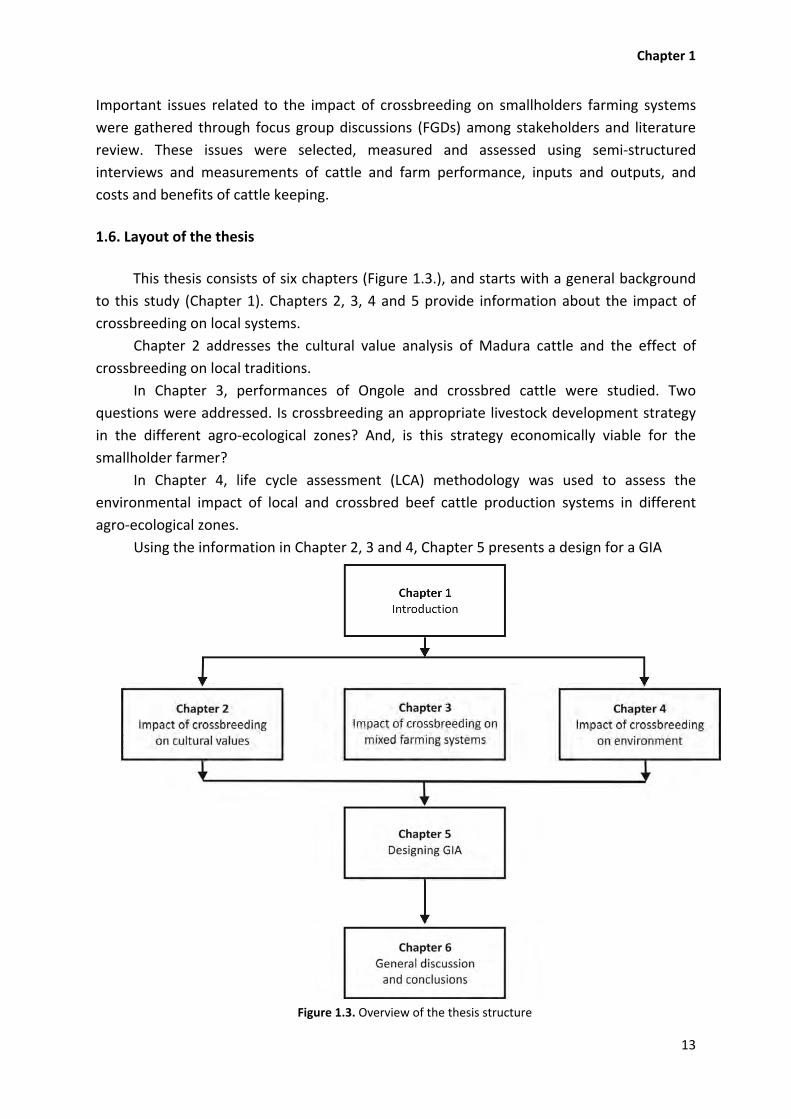
This thesis consists of six chapters (Figure 1.3.), and starts with a general background
to this study (Chapter 1). Chapters 2, 3, 4 and 5 provide information about the impact of
crossbreeding on local systems.
Chapter 2 addresses the cultural value analysis of Madura cattle and the effect of
crossbreeding on local traditions.
In Chapter 3, performances of Ongole and crossbred cattle were studied. Two
questions were addressed. Is crossbreeding an appropriate livestock development strategy
in the different agro‐ecological zones? And, is this strategy economically viable for the
smallholder farmer?
In Chapter 4, life cycle assessment (LCA) methodology was used to assess the
environmental impact of local and crossbred beef cattle production systems in different
agro‐ecological zones.
Using the information in Chapter 2, 3 and 4, Chapter 5 presents a design for a GIA
Figure 1.3. Overview of the thesis structure
General introduction
14
and uses the results of the crossbreeding practices in Central Java and Madura to test the
robustness of the design for future applications. Finally, Chapter 6 integrates the results in a
general discussion on developing a GIA and sustainable development strategies for beef
cattle in smallholder farming systems in Indonesia.
References
Agus, A., I.G.S. Budisatria, N. Ngadiyono, Sumadi, Rusman, N. Indarti, T.S.M. Widi, N. Suseno, M.D.E. Yulianto, D. Dyahjamayanti, and E. Wulandari. 2014. Road Map Industri Sapi Potong di Indonesia. APFINDO and Faculty of Animal Science, Universitas Gadjah Mada, Yogyakarta.
Agyemang, K. and L.P. Nkhonjera. 1990. Productivity of crossbred cattle on smallholder farms in Southern Malawi. Trop. Anim. Health Prod. 22: 9‐16.
Anderson, S. 2003. Animal genetic resources and sustainable livelihoods. Ecol. Econ. 45: 331‐339. Astuti, M., A. Agus, I.G.S. Budisatria, B. Ariyadi, L.M. Yusiati, and M.A.U. Muzayyanah. 2007. Peta
potensi plasma nutfah ternak nasional. Penerbit Ardana Media, Yogyakarta. Baliarti, E. 1991. Pertumbuhan anak sapi pra sapih hasil inseminasi buatan di Kabupaten Gunung
Kidul. Master Thesis. Universitas Gadjah Mada, Yogyakarta. Barwegen, M. 2004. Browsing in livestock history; large ruminants and the environment in Jawa,
1850‐2000. In: Smallholder and stockbreeders; histories of food crop and livestock farming in Southeast Asia. Boomgaard, P., David, H (eds). KITLV Press., Leiden.
Beets, W. C. 1990 Raising and Sustaining Productivity of Smallholder Farming Systems in the Tropics. A Handbook of Sustainable Agricultural Development. Alkmaar, Agbe Publishing.
BPS. 2011. Indonesia statistical data 2011. Statistics Indonesia (Available at www.bps.go.id). Budisatria, I.G.S. 2006. Dynamics of small ruminant development in Central Java, Indonesia. PhD
thesis. Wageningen University, Wageningen. Cunningham, E.P. 1989. The genetic improvement of cattle in developing countries. Therionology
31(1): 17‐28. De Jonge, H. 1990. Of bull and men: The Madurese aduan sapi. Bijdragen tot de Taal‐, Land‐en
Volkenkunde 146 (4): 423‐447. Delgado, C., M. Rosegrant, H. Steinfeld, S. Ehui and C. Courbuis. 2001. Livestock to 2020: the next
food revolution. Outlook on Agric. 30: 27 – 29. Devendra, C. 1993 Sustainable Animal Production from Small Farm Systems in South East Asia. FAO
Animal Production and Health Paper No. 106. FAO, Rome. Djajanegara, A and K. Diwyanto. 2002. Development Strategies for Genetic Evaluation of Beef
Production in Indonesia. In: Allen, J., Na‐Chiangmai, A., (Eds.). Development Strategies for Genetic Evaluation for Beef Production in Developing Countries. Proceedings of an International Workshop held in Khon Kaen Province, Thailand. ACIAR Proceedings No. 108, pp 40‐47.
FAO. 2001. Regional Training Workshop for Preparation of the Report on the State of the World Animal Genetic Resources. FAO, Rome.
Gandini, G.C. and E. Villa. 2003. Analyisis of the cultural values of local livestock breeds: a methodology. Anim. Breed. Genet. 120 (1): 1‐11.
Gandini, G.C and J.K. Oldenbroek. 1999. Choosing the conservation strategy. In: Genebanks and the conservation of farm animal gen resources. Oldenbroek J.K. (ed.). D‐DLO, Lelystad.
Gandini, G and K. Oldenbroek. 2007. Strategies for moving from conservation to utilization. Chapter 2 in : Utilization and conservation of farm animal genetic resources (Ed. Kor Oldenbroek). Wageningen Academic Publisher. ISBN 978‐90‐8686‐032‐6.
Gerber P.J., H. Steinfeld , B. Henderson, A. Mottet, C. Opio, J. Dijkman, A. Falcucci, and G. Tempio. 2013. Tackling climate change through livestock‐ A global assessment of emissions and mitigation opportunities. FAO, Rome.
Chapter 1
15
Giller, K.E., C. Leeuwis, J.A. Andersson, W. Andriesse, A. Brouwer, P. Frost, P. Hebinck, I. Heitkönig, M.K. van Ittersum, N. Koning, R. Ruben, M. Slingerland, H. Udo, T. Veldkamp, C. van de Vijver, M.T. van Wijk, and P. Windmeijer. 2008. Competing claims on natural resources: what role for science? Ecol. Soc. 13(2): 34.
Hardjosubroto, W. 1985. Beef cattle and goat production. Final report. Rockefeller Found‐Universitas Gadjah Mada, Yogyakarta.
Hardjosubroto, W. 1994. Aplikasi pemuliabiakan ternak di lapangan. Grasindo. Jakarta. Hardjosubroto, W. and M. Astuti. 1993. Buku Pintar Peternakan. Grasindo, Jakarta. Herrero,M., P.K. Thornton, P. Gerber, and R.S. Reid. 2009. Livestock, livelihoods and the environment
understanding the trade‐offs. Curr. Opin. Environ. Sust. 1(2): 111‐120. Herrero, M., and P.K. Thornton. 2013. Livestock and global change: emerging issues for sustainable food
systems. P. Natl. Acad. Sci. USA 110 (52): 20878‐20881. Hoffmann, I. 2010. Climate change and the characterization, breeding and conservation of animal
genetic resources. Anim. Genet. 41: 32‐46. Ifar, S. 1996. Relevance of ruminants in upland mixed‐farming systems in East Java, Indonesia. PhD
thesis. Wageningen University, Wageningen. Kementan. 2012. Pedoman pelaksanaan uji performan sapi potong tahun 2012. Ministry of Agriculture,
Jakarta. Kementan. 2013. Livestock statistics 2010. Ministry of Agriculture, Jakarta. Köhler‐Rollefson, I., H.S. Rathore and E. Mathias. 2009. Local breeds, livelihoods and livestock keepers’
right in South Asia. Trop. Anim. Health Pro. 41: 1061‐1070. Marshal, K. 2014. Optimising the use of breed types in developing country livestock production
systems: a neglected research area. Anim. Breed. Genet. 14: 1‐2. Martojo, H. 2005. Indigenous Bali Cattle: The Best Suited Cattle Breed for Sustainable Small Farms in
Indonesia. Laboratory of Animal Breeding and Genetics, Faculty of Animal Science, Bogor Agricultural University, Indonesia, 16 pp.
Maule, J. P. 1990. The cattle of the tropics. University of Edinburgh Centre for Tropical Veterinary Medicine, Edinburgh.
Moll, H.A.J., S.J. Staal, and M.N.M. Ibrahim. 2007. Smallholder dairy production and markets: a comparison of production systems in Zambia, Kenya and Sri Lanka. Agr. Syst. 94: 593‐603.
Panjono. 2014. Bangsa‐bangsa sapi. Penerbit Citra Aji Parama, Yogyakarta. Payne, W.J.A. and D.H.L. Rollison. 1976. Madura cattle. J. Z. Tierzücht Zuchtungsbiol. 93, 89‐100. Payne, W.J.A. and J. Hodges. 1997. Tropical cattle: Origin, breeds and breeding policies. Blackwell
Science. Pilling, D. 2007. Genetic impact assessment‐summary of a debate. Anim. Genet. Resour. Information
41: 101‐107. Priyanti, A., V.W. Hanifah, I.G.A.P. Mahendri, F. Cahyadi and R.A. Cramb. 2012. Small‐scale beef cattle
production in East Java. 56th AARES annual conference, Fremantle, Western Australia, February, 7‐10, 2012.
Ressang, A., A.H. Fischer and A. Muchlis, 1959. The Indonesian Veterinarian. His education, activities and problems. Commun. Vet. (Bogor) 3, 55.
Rodriguez, L and T.R. Preston. 1997. Local feed resources and indigenous breeds: fundamental issues in integrated farming systems. Livestock Research for Rural Development.
Said, R., M.J. Bryant and J.K.K. Msechu. 2003. The survival, growth and carcase characteristics of crossbred beef cattle in Tanzania. Trop. Anim. Health Prod. 35: 441‐454.
Samdup, T., H.M.J. Udo, C.H.A. M. Eilers, M.N.M. Ibrahim, and A.J. v.d. Zijpp. 2010. Crossbreeding and intensification of smallholder crop‐cattle farming systems in Bhutan. Livest. Sci. 131: 126‐134.
Scholtz, M.M., C. Mc Manus., A.M. Okeyo and A. Theunissen. 2011 Opportunities for beef production in developing countries of the southern hemisphere. Livest. Sci. 142: 195‐202.
Singh, H and L.P.P. Sansthan. 2003. Traditional practices on animal genetic resources management.
General introduction
16
In A Sourcebook of Conservation and Sustainable Use of Agricultural Biodiversity. CIP‐UPWARD, Metro Manila.
Steinfeld, H., P. Gerber, T. Wassenaar, V. Castel, M. Rosales and C. de Haan. 2006. Livestock's long shadow: environmental issues and options. FAO, Rome.
Sudardjat, S and R. Pambudy. 2003. Menjelang Dua Abad Sejarah Peternakan dan Kesehatan Hewan Indonesia : Peduli Peternak Rakyat. Yayasan Agrindo Mandiri, Jakarta.
Sullivan G.M. and K. Diwyanto. 2007. A value chain assessment of the livestock sector in Indonesia. Review for United States Agency for International Development, Jakarta.
Sutresniwati. 2006. The invasion of crossbred cattle; stakeholders' perspectives in Central Java, Indonesia in Animal Production Systems. MSc Thesis. Wageningen University, Wageningen.
Tanner, J.C., S.J. Holden, E. Owen, M. Winugroho, and M. Gill. 2001. Livestock sustaining intensive smallholder crop production through traditional feeding practices for generating high quality manure‐compost in upland Java. Agric. Ecosyst. Environ. 84: 21‐30.
Udo, H.M.J., H.A. Aklilu, L.T.Phong, R.H. Bosma, I.G.S. Budisatria, B.R. Patil, T. Samdup, and B.O. Bebe. 2011. Impact of intensification of different types of livestock production in smallholder crop‐livestock systems. Livest. Sci. 139: 22‐29.
Widi, T.S.M. 2004. Livestock sharing arrangements in the Province of Yogyakarta Special Region; perspectives from different stakeholders. MSc. Thesis. Wageningen University, Wageningen.
Widi, T.S.M. and D.P. Widodo. 2007. Prevalensi Infeksi Stephanofilaria sp pada Sapi Persilangan Bangsa Exotic dan Peranakan Ongole vs Peranakan Ongole di Kabupaten Gunung Kidul. Laporan Penelitian. Fakultas Peternakan UGM, Yogyakarta.
Widi, T.S.M, T. Yuwanta, A. Agus and A. Pertiwiningrum. 2008. Roadmap pengembangan ternak sapi potong Provinsi Daerah Istimewa Yogyakarta. Ardana Media, Yogyakarta.
Widi, T.S.M., H.M.J. Udo, K. Oldenbroek, I.G.S. Budisatria, E. Baliarti, and A.J. van der Zijpp. 2014. Unique cultural values of Madura cattle: is cross‐breeding a threat? Anim. Genet. Resour. 54: 141‐152.
Wollny, C.B.A. 2003. The need to conserve farm animal genetic resources in Africa: should policy makers be concerned ? Ecol. Econ. 45: 341‐351.
Zemmelink, G., S. Ifar, and S.J. Oosting. 2003: Optimum utilization of feed resources: model studies and farmers’ practices in two villages in East Java, Indonesia. Agric. Syst. 76: 77‐94.
17
Chapter 2
Unique cultural values of Madura cattle: is crossbreeding a threat?
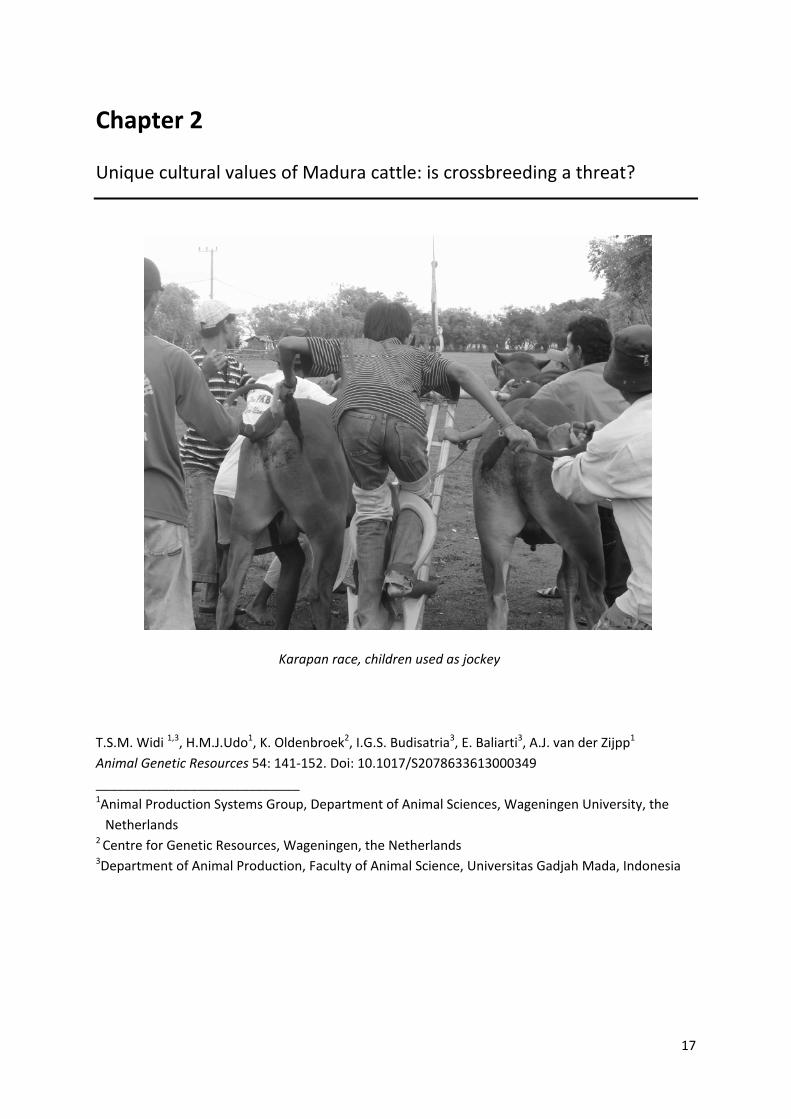
Karapan race, children used as jockey
T.S.M. Widi 1,3, H.M.J.Udo1, K. Oldenbroek2, I.G.S. Budisatria3, E. Baliarti3, A.J. van der Zijpp1
Animal Genetic Resources 54: 141‐152. Doi: 10.1017/S2078633613000349
____________________________ 1Animal Production Systems Group, Department of Animal Sciences, Wageningen University, the
Netherlands 2 Centre for Genetic Resources, Wageningen, the Netherlands 3Department of Animal Production, Faculty of Animal Science, Universitas Gadjah Mada, Indonesia
Unique cultural values of Madura cattle
18
ABSTRACT
In Indonesia, crossbreeding local cattle with European beef breeds is widely
promoted to stimulate beef production. This crossbreeding is threatening local breeds
which have often different functions, including cultural roles. This study analysed the
cultural values of Madura cattle and the impact of crossbreeding on local traditions in
Madura. Bull racing (karapan) and cow conformation contests (sonok) are traditional
cultural events on Madura. Since 2001, crossbreeding with Limousin is allowed. The local
government promotes also a conformation contest for crossbred (madrasin) cattle.
Quantitative and qualitative information was collected through participatory approaches
involving farmers (n=97), government officials, community groups, key informants, and
through direct observation of sonok, karapan and madrasin events. Phenotypic
characteristics were collected from 184 cows. The Madura cattle population and production
systems are not homogeneous. Four cattle types could be distinguished: karapan, sonok,
madrasin and conventional Madura cattle. These cattle were found in three discrete areas,
differing in land sizes, cropping, and cattle keeping in terms of management practices and
importance of specific cultural practices. Sonok and madrasin cows were significantly bigger
and had higher body condition scores than karapan cows and the conventional Madura
cows in the madrasin area. Madura cattle participating in cultural events were valued at
prices that were 2‐3.5 times higher than Madura cattle not participating in cultural events.
Crossbreeding will not directly influence the cultural events or the management practices of
Madura cattle in the karapan and sonok areas, however, outside the karapan and sonok
areas, crossbreds are rapidly replacing conventional Madura cattle. The present top‐down
approach towards conservation and breeding strategies has to be turned into bottom‐up
approaches that consider the needs of the sonok and karapan Madura cattle sub‐
populations. Monitoring and characterization studies have to collect information at different
aggregation levels and have to be aware of sub‐populations. The Madura example shows
that cultural values of livestock can be a main driver for maintaining relatively small
populations of local breeds.
Keywords: Madura; Bull racing; Cattle contests; Conservation; Cultural values

Chapter 2
19
2.1. Introduction
In Indonesia population increase is a major driving force for the rising demand for
animal products. To satisfy the demand for red meat, the government has been
implementing a policy to import meat and live exotic livestock. From the 1980’s the
government has also promoted an Artificial Insemination (AI) program using beef breeds
from temperate regions, such as Simmental, Limousin and Angus, to improve the beef
performances of local cattle. At present, the AI organisation uses almost exclusively exotic
semen. So crossbreeding is rapidly progressing.
Many publications state that crossbreeding leads to a loss of indigenous breeds and
loss of adaptation of livestock to local environments (Anderson, 2003; FAO, 2007). On
Indonesia’s Madura, until 2001, crossbreeding was not allowed to protect the local Madura
cattle breed. Madura cattle developed approximately 1500 years ago from crossing wild
banteng or Bali cattle and zebu (Payne and Rollinson, 1976). Continuous selection by the
farmers in Madura created a uniform breed population (Deptan, 2003). Its coat is reddish‐
brown with a non‐specific white pattern on the rump and legs (Deptan, 2003), see Figure
2.1. Madura cattle are extremely well adapted to the local conditions and traditional
management. They are reported to be one of the best draught animals in the world relative
to their size (Barwegen, 2004). Since the removal of import restrictions, the local
government has allowed crossing with the Limousin breed (which is also preferred by
Madura farmers) because of its red colour, similar to the Madura cattle. As a result the
crossbreeding through AI is threatening the survival of the Madura breed (Barwegen, 2004).
Currently, the number of cattle in Madura is about 600,000. It is not possible to obtain
accurate data about the population of pure Madura cattle as not all regional government
offices separate the data in terms of genetic group.
Understanding and assessing cultural values of livestock are important in the
implementation of interventions aiming at conservation and utilization of animal genetic
resources (FAO, 2012). Madurese people have strong cultural ties to their animals, caring for
their cattle as if they are their family members (De Jonge, 1990). The significance of cattle
within the culture is also evident from the appearance of bulls in local folk‐tales, proverbs,
and wood carvings depicting bulls, and from the horns on traditional houses. Bull racing
(karapan) and cow conformation contests (sonok), are important cultural events on the
island (De Jonge, 1990).
Crossbred cattle are kept primarily for meat production. So crossbreeding may be a
threat not only to the existence of purebred Madura cattle, but also for cultural activities
involving cattle in Madura. In Indonesia, Madura cattle offer a unique opportunity to study
cultural practices involving cattle and the impact of crossbreeding. This paper aims to
analyse the cultural values of Madura cattle and the impact of crossbreeding on these local
traditions.
Unique cultural values of Madura cattle
20
2.2. Materials and methods Study areas
Madura (Figure 2.2.) is a small, densely populated Indonesian island located off the
northeast coast of Java. It is administered as part of East Java Province and consists of four
districts: Bangkalan, Sampang, Pamekasan and Sumenep. Besides the mainland, Madura has
some small outer islands. The climate is tropical exhibiting defined wet (September to
February) and dry (March to August) seasons, with an average annual rainfall of 1500 – 2000
mm.
Two districts were used in this study (Figure 2.2.). One was Sumenep, within which is
Sapudi, an isolated island, that is demarcated by the national government as a conservation
area for Madura cattle, particularly as a source of karapan cattle. For the study, Nong
Gunong, one of two sub‐districts, was used. This study area will be described as the
‘karapan’ area. The second district was Pamekasan; Waru, Pasean, Larangan and
Pegantenan sub‐districts were used in this study. Waru and Pasean sub‐districts are famous
as the source of sonok cattle and are well‐known as areas where the sonok contest started.
This study area will be described as the ‘sonok’ area. Larangan and Pegantenan sub‐districts
were selected by local government as crossbreeding areas due to the abundance of crop by‐
products. Crossbred cattle are expected to have larger body sizes than Madura cattle and,
consequently, require more feed. Crossbred cattle are not used for draught purposes. All
crossbreds resulted from Madura cows being inseminated with semen of Limousin bulls.
The farmers named the crossbred cattle madrasin. This study area will be described as
‘madrasin’ area. From 2007 the local government promoted a conformation contest for
madrasin cattle. Madura cattle in the madrasin area will be described as conventional
Madura cattle.
The three study areas do not only differ in cattle keeping practices, they also differ in
cropping practices. In the karapan area, cropping conditions are difficult due to small farm
sizes and poor fertility of the soil. In the sonok area, tobacco is the main crop, which results
in a relatively good income (Smith, 2011). In the madrasin area more crop by‐products are
available mainly due to the large paddy growing areas in this lowland area.
Data collection
Secondary data collection
Secondary data were collected from the Agricultural Department of Indonesia, the
Animal Husbandry Office of East Java Province, Pamekasan and Sumenep District offices,
government websites, publications and institutional reports. These provided insights into
the local situation and policies.

Chapter 2
21
Figure 2.1. Colour pattern of the rump and legs of Bali vs Madura cattle
Figure 2.2. Map of Indonesia and Madura with the three study areas
Unique cultural values of Madura cattle
22
Participatory observations
Quantitative and qualitative information was collected through participatory
approaches involving farmers (cattle‐keepers), government officials, community groups and
other key informants, and through direct observation of sonok, karapan and madrasin
events. A historic overview of the cultural events was based on the secondary data and
open interviews with key informants, comprising of persons well‐versed in cattle keeping
and cultural events, such as heads of cultural event groups, experienced farmers or village
elders (three persons per study area).
Semi‐structured interviews were carried out with three categories of cattle‐keepers:
30 karapan farmers, 37 sonok farmers, and 30 madrasin farmers. Farmers were interviewed
about their background and motivation, technical aspects such as cattle management, and
the economics of cattle keeping. The input costs and the selling and buying prices of
individual cattle in a farm over a period of one year (February 2010 – January 2011) were
estimated by farmers. The input costs consisted of purchases of forage and supplements,
such as maize and rice bran, and additional feeds such as herbs, eggs and palm sugar for
animals participating in the cultural events, veterinary services, AI or natural mating,
training for and participating in the cultural events, and hired labour costs. The interviews
were used to evaluate the role of cattle in the livelihoods of Madurese people, and the
special characteristics of cattle that are important in maintaining local traditions.
Phenotypic characteristics of Madura and crossbred cattle
Phenotypic characteristics of cows in the study farms were determined by taking
height at withers, and estimation of body weight by measuring chest girth, using a
measurement tape (FHK Ogawa Seki Co. Ltd., Tokyo, Japan). The age of each animal (in
years) was determined by inspecting its teeth (Djanah, 1984).
Data analysis
The qualitative data were analysed descriptively. The quantitative data were analysed
using one‐way ANOVA to compare the different areas (Ott and Longnecker, 2001). Ranking
was used to determine the level of agreement of farmers’ motivations for keeping cattle.
General Linear Model (GLM) (Ott and Longnecker, 2001) was used to analyse ranking
preferences. The smallest score of rank meant the most important motivation and the
highest score of rank meant the least important motivation.
2.3. Results The history of cultural cattle events in Madura
Karapan
Karapan has a very long history. Noer and Maduratna (1975) noted that on Sapudi
Island, during the 12‐13th century, Prince Katandur wanted to make the soils more fertile.
He introduced ploughing using a pair of bulls. To encourage people to keep cattle, he
Chapter 2
23
created a bull racing game, karapan, in which pairs of bulls raced against each other in a
field. The equipment used in the race was similar to equipment used in ploughing (Figure
2.3).
Over time karapan became a favourite game for Madurese people, organized after
the harvest season. These are now held in nearly every village in the eastern sub‐districts. In
these karapan races, two or three pairs of bulls are raced over a course of 100 – 140 meters
pulling a sledge with a jockey. The winners and losers of the first round are assigned to
separate categories, after which the races continue according to the ‘cup system’: winners
go on, while losers drop out. A major competition is held each year in which all the island’s
districts are represented. Since 1982, races for tourists are organized in western Madura.
In the 1970’s, local government set some rules for karapan (Noer and Maduratna,
1975):
1. Karapan bulls have to be purebred Madura bulls;
2. The minimum height at the withers of the bulls is 120 cm and the maximum 130
cm;
3. The minimum age of the bulls is 2 years;
4. Mistreating bulls during racing is not allowed;
5. The minimum number of bull pairs having to participate in a sub‐district is 40. At
that time, there were 20 sub‐districts in Madura, so 1,600 bulls had to be used
every year.
Nowadays, some of the rules are not respected due to the limited availability of
Madura bulls that fulfill the physical and age criteria for karapan. In 2011, in the biggest
racing event, no more than 30 pairs of bulls competed.
The total number of bulls actually participating in karapan is about 400 pairs on
Sapudi Island and 200 pairs in Madura mainland (Kuswadi, 2010, personal communication).
Sonok
The key events in the sonok have resulted from the common practice in Madura that,
from about 9 am until 1 pm, cattle are tethered between two pillars, locally named tacek, in
view of the front veranda of the house. The cattle’s forefeet stand on a platform, a piece of
wood about 15 cm high, while they are tethered. This tethering practice gives farmers the
opportunity to show their great pride in caring for their cattle. In the meantime farmers
clean the cattle and the barn, and undertake other activities, such as foot care and horn
shaping. In 1963, a village head became particularly interested in farmers’ behaviour in
caring for their cattle. He showed cattle of good conformation tethered in the front of
farmers’ houses to high officials who were visiting his village. This idea to show cattle daily
became a routine activity in the area (Anonymous, 2007).
Unique cultural values of Madura cattle
24
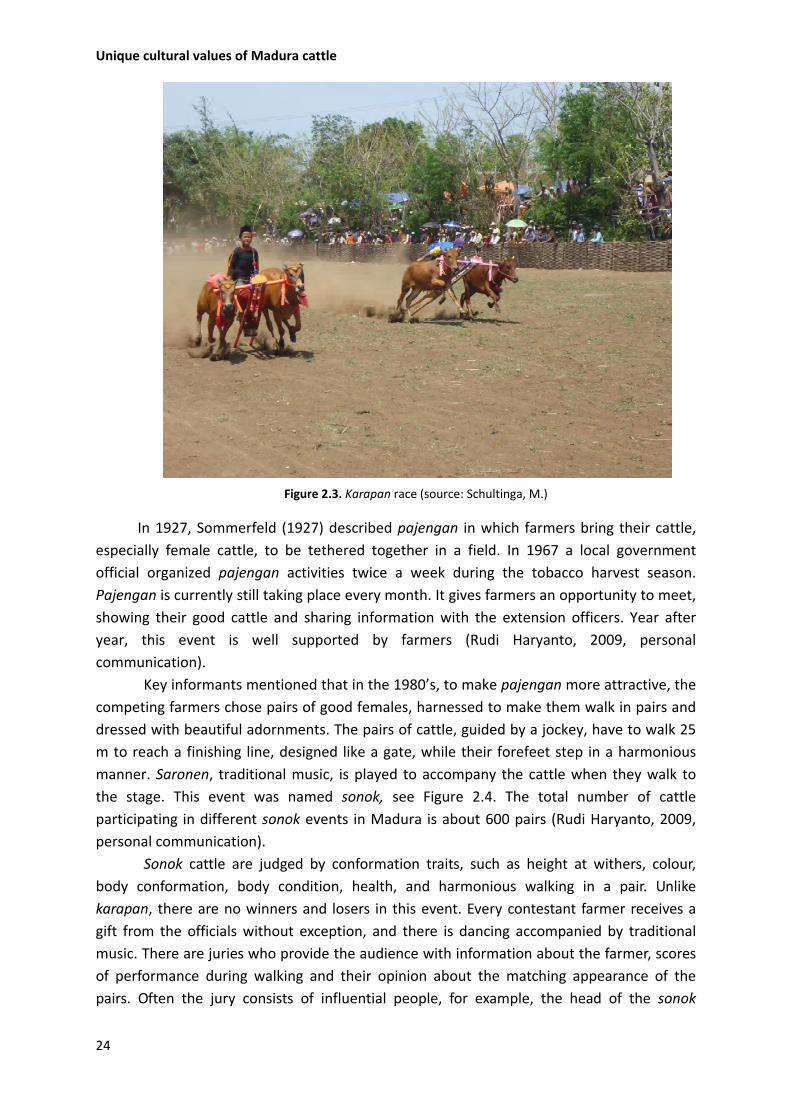
Figure 2.3. Karapan race (source: Schultinga, M.)
In 1927, Sommerfeld (1927) described pajengan in which farmers bring their cattle,
especially female cattle, to be tethered together in a field. In 1967 a local government
official organized pajengan activities twice a week during the tobacco harvest season.
Pajengan is currently still taking place every month. It gives farmers an opportunity to meet,
showing their good cattle and sharing information with the extension officers. Year after
year, this event is well supported by farmers (Rudi Haryanto, 2009, personal
communication).
Key informants mentioned that in the 1980’s, to make pajengan more attractive, the
competing farmers chose pairs of good females, harnessed to make them walk in pairs and
dressed with beautiful adornments. The pairs of cattle, guided by a jockey, have to walk 25
m to reach a finishing line, designed like a gate, while their forefeet step in a harmonious
manner. Saronen, traditional music, is played to accompany the cattle when they walk to
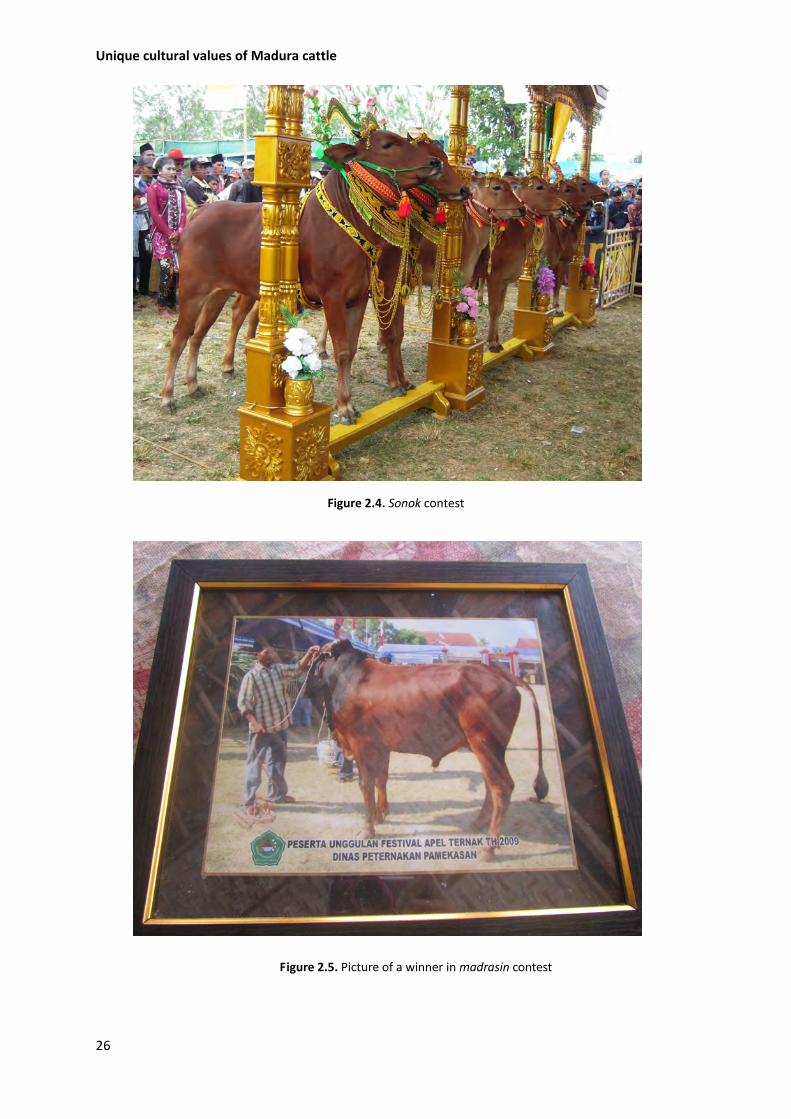
the stage. This event was named sonok, see Figure 2.4. The total number of cattle
participating in different sonok events in Madura is about 600 pairs (Rudi Haryanto, 2009,
personal communication).
Sonok cattle are judged by conformation traits, such as height at withers, colour,
body conformation, body condition, health, and harmonious walking in a pair. Unlike
karapan, there are no winners and losers in this event. Every contestant farmer receives a
gift from the officials without exception, and there is dancing accompanied by traditional
music. There are juries who provide the audience with information about the farmer, scores
of performance during walking and their opinion about the matching appearance of the
pairs. Often the jury consists of influential people, for example, the head of the sonok
Chapter 2
25
community group, the inseminator and the head of the district. Since there are no winners,
there is no gambling. Although there are no prizes, the contest is very important because
during the contest day many transactions amongst farmers take place; farmers can show
their cattle and trade them for good prices. The cows that perform well are very popular for
breeding.
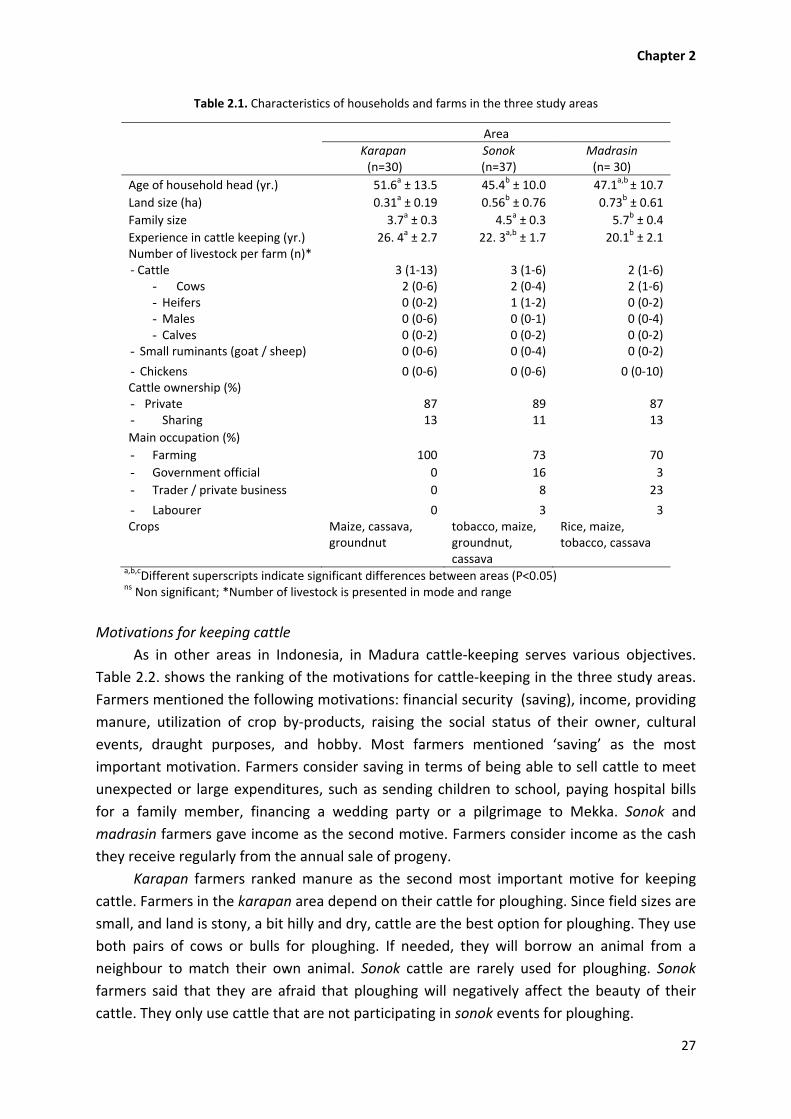
Madrasin
In the area where crossbreeding is practiced, farmers, encouraged by the government,
have organised the madrasin contest since 2007. The criteria are body size and body weight,
and, for cows, the conformation of their calves.
The cattle are tied up next to each other in the traditional way for Madura cattle: rope goes
through the nose of the cattle and is tied between two pillars, and cattle stand with their
front legs on a platform. In the madrasin contest the cattle do not parade and are not
harnessed or dressed with adornments, see Figure 2.5.
Responses from the interviews showed that the number of participants and the
number of participating cattle is growing every year, but that it is less attractive to spectators
than the karapan and sonok events.
Livestock farming systems
Table 2.1. gives selected household and farm characteristics for the livestock farming
systems in the three study areas. Karapan farmers were relatively older than farmers in the
other two areas. Most of the farmers have crop production as their main source of farm
income. Family size was significantly larger in the madrasin area. More than half of farmers
in the three study areas only completed elementary school. Farmers had a long experience
in cattle keeping, about 20 years or more; karapan farmers had significantly more
experience than madrasin farmers.
Cattle are the main livestock (Table 2.1.). Goats, sheep and chickens are of secondary
importance. Even though the land sizes of farmers in Sapudi Island were quite different
from those of farmers in the sonok area, the number of cattle was not much different.
Farmers kept about three head of cattle. Only in the madrasin area were the numbers of
cattle slightly smaller than in the two other areas.
Farmers in the sonok area will participate in the sonok contest only if they have pairs
of animals that meet the criteria for participation and if they have sufficient cash available
to pay for the fee to join the contest. If farmers in the karapan area have a pair of potential
racing bulls, they will first enter this pair in a village race. If this pair runs well, they will enter
the pair in a regional contest. Again a farmer will need sufficient cash to join the race and to
cover the additional costs. When farmers have insufficient cash to purchase cattle, farmers
join with other farmers. Around 12% of the farmers were sharing cattle (Table 2.1.). The
main occupation of the interviewees was farming, although in the madrasin area, 23% were
traders or businessmen.
Unique cultural values of Madura cattle
26
Figure 2.4. Sonok contest
Figure 2.5. Picture of a winner in madrasin contest
Chapter 2
27
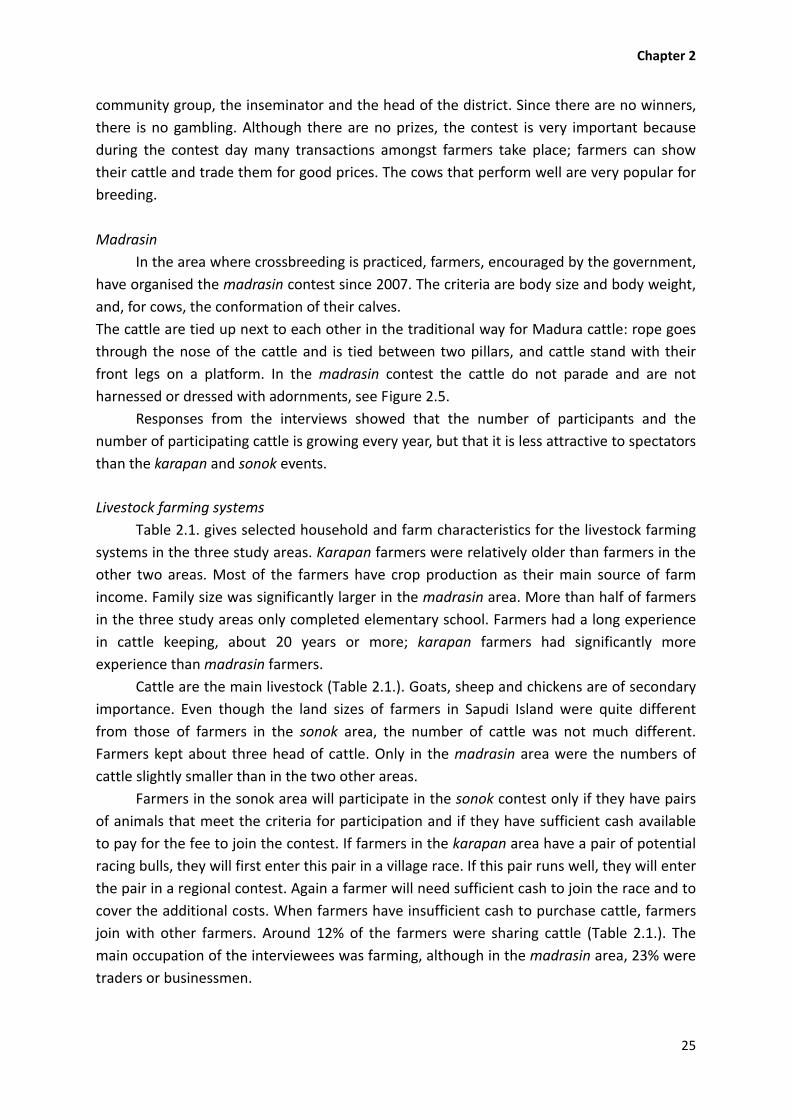
Table 2.1. Characteristics of households and farms in the three study areas
Area
Karapan (n=30)
Sonok(n=37)
Madrasin (n= 30)
Age of household head (yr.) 51.6a ± 13.5 45.4b ± 10.0 47.1a,b ± 10.7
Land size (ha) 0.31a ± 0.19 0.56b ± 0.76 0.73b ± 0.61
Family size 3.7a ± 0.3 4.5a ± 0.3 5.7b ± 0.4
Experience in cattle keeping (yr.) 26. 4a ± 2.7 22. 3a,b ± 1.7 20.1b ± 2.1 Number of livestock per farm (n)* ‐ Cattle 3 (1‐13) 3 (1‐6) 2 (1‐6)
- Cows 2 (0‐6) 2 (0‐4) 2 (1‐6)- Heifers 0 (0‐2) 1 (1‐2) 0 (0‐2)- Males 0 (0‐6) 0 (0‐1) 0 (0‐4)- Calves 0 (0‐2) 0 (0‐2) 0 (0‐2)
- Small ruminants (goat / sheep) 0 (0‐6) 0 (0‐4) 0 (0‐2)
- Chickens 0 (0‐6) 0 (0‐6) 0 (0‐10) Cattle ownership (%)- Private 87 89 87- Sharing 13 11 13
Main occupation (%)
- Farming 100 73 70
- Government official 0 16 3
- Trader / private business 0 8 23
- Labourer 0 3 3 Crops Maize, cassava,
groundnut tobacco, maize, groundnut, cassava
Rice, maize, tobacco, cassava
a,b,cDifferent superscripts indicate significant differences between areas (P<0.05) ns Non significant; *Number of livestock is presented in mode and range
Motivations for keeping cattle
As in other areas in Indonesia, in Madura cattle‐keeping serves various objectives.
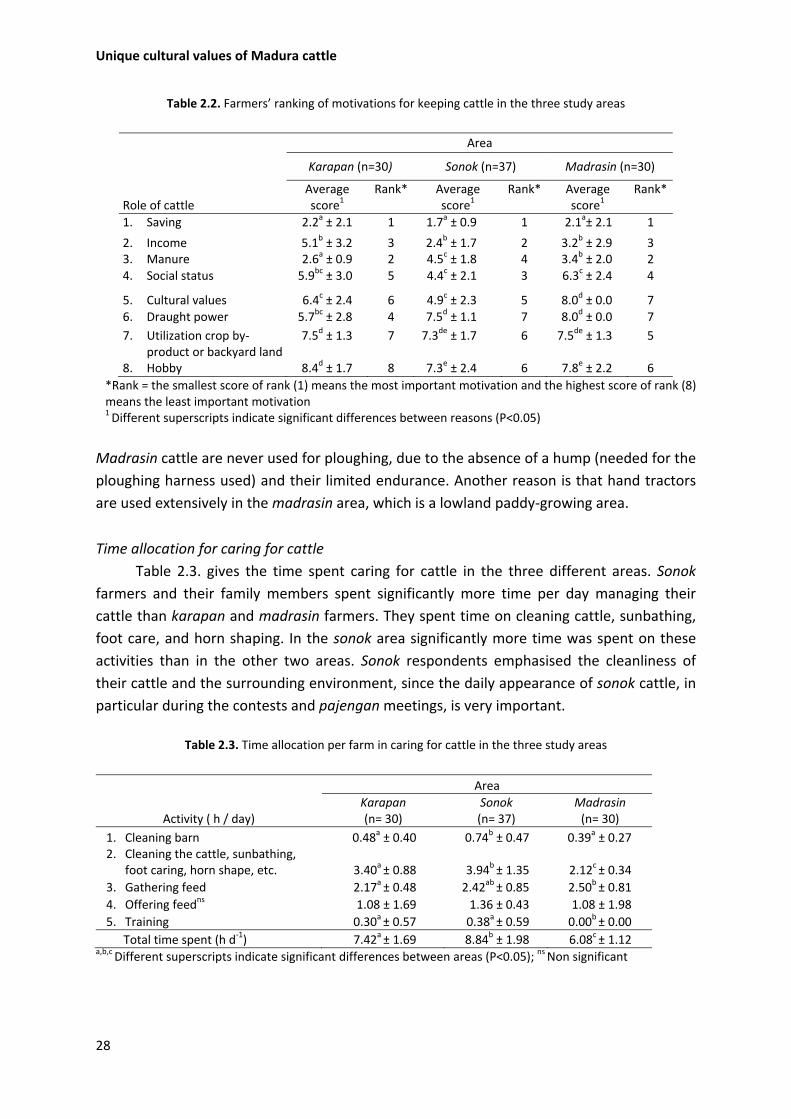
Table 2.2. shows the ranking of the motivations for cattle‐keeping in the three study areas.
Farmers mentioned the following motivations: financial security (saving), income, providing
manure, utilization of crop by‐products, raising the social status of their owner, cultural
events, draught purposes, and hobby. Most farmers mentioned ‘saving’ as the most
important motivation. Farmers consider saving in terms of being able to sell cattle to meet
unexpected or large expenditures, such as sending children to school, paying hospital bills
for a family member, financing a wedding party or a pilgrimage to Mekka. Sonok and
madrasin farmers gave income as the second motive. Farmers consider income as the cash
they receive regularly from the annual sale of progeny.
Karapan farmers ranked manure as the second most important motive for keeping
cattle. Farmers in the karapan area depend on their cattle for ploughing. Since field sizes are
small, and land is stony, a bit hilly and dry, cattle are the best option for ploughing. They use
both pairs of cows or bulls for ploughing. If needed, they will borrow an animal from a
neighbour to match their own animal. Sonok cattle are rarely used for ploughing. Sonok
farmers said that they are afraid that ploughing will negatively affect the beauty of their
cattle. They only use cattle that are not participating in sonok events for ploughing.
Unique cultural values of Madura cattle
28
Table 2.2. Farmers’ ranking of motivations for keeping cattle in the three study areas
*Rank = the smallest score of rank (1) means the most important motivation and the highest score of rank (8) means the least important motivation 1 Different superscripts indicate significant differences between reasons (P<0.05)
Madrasin cattle are never used for ploughing, due to the absence of a hump (needed for the
ploughing harness used) and their limited endurance. Another reason is that hand tractors
are used extensively in the madrasin area, which is a lowland paddy‐growing area.
Time allocation for caring for cattle
Table 2.3. gives the time spent caring for cattle in the three different areas. Sonok
farmers and their family members spent significantly more time per day managing their
cattle than karapan and madrasin farmers. They spent time on cleaning cattle, sunbathing,
foot care, and horn shaping. In the sonok area significantly more time was spent on these
activities than in the other two areas. Sonok respondents emphasised the cleanliness of
their cattle and the surrounding environment, since the daily appearance of sonok cattle, in
particular during the contests and pajengan meetings, is very important.
Table 2.3. Time allocation per farm in caring for cattle in the three study areas
Area
Activity ( h / day) Karapan(n= 30)
Sonok(n= 37)
Madrasin (n= 30)
1. Cleaning barn 0.48a ± 0.40 0.74b ± 0.47 0.39a ± 0.27 2. Cleaning the cattle, sunbathing,
foot caring, horn shape, etc. 3.40a ± 0.88 3.94b ± 1.35 2.12c ± 0.34
3. Gathering feed 2.17a ± 0.48 2.42ab ± 0.85 2.50b ± 0.81
4. Offering feedns 1.08 ± 1.69 1.36 ± 0.43 1.08 ± 1.98
5. Training 0.30a ± 0.57 0.38a ± 0.59 0.00b ± 0.00
Total time spent (h d‐1) 7.42a ± 1.69 8.84b ± 1.98 6.08c ± 1.12 a,b,c Different superscripts indicate significant differences between areas (P<0.05); ns Non significant
Role of cattle
Area
Karapan (n=30) Sonok (n=37) Madrasin (n=30)
Averagescore1
Rank* Averagescore1
Rank* Average score1
Rank*
1. Saving 2.2a ± 2.1 1 1.7a ± 0.9 1 2.1a± 2.1 1
2. Income 5.1b ± 3.2 3 2.4b ± 1.7 2 3.2b ± 2.9 33. Manure 2.6a ± 0.9 2 4.5c ± 1.8 4 3.4b ± 2.0 24. Social status 5.9bc ± 3.0 5 4.4c ± 2.1 3 6.3c ± 2.4 4
5. Cultural values 6.4c ± 2.4 6 4.9c ± 2.3 5 8.0d ± 0.0 76. Draught power 5.7bc ± 2.8 4 7.5d ± 1.1 7 8.0d ± 0.0 7
7. Utilization crop by‐ product or backyard land
7.5d ± 1.3 7 7.3de ± 1.7 6 7.5de ± 1.3 5
8. Hobby 8.4d ± 1.7 8 7.3e ± 2.4 6 7.8e ± 2.2 6
Chapter 2
29
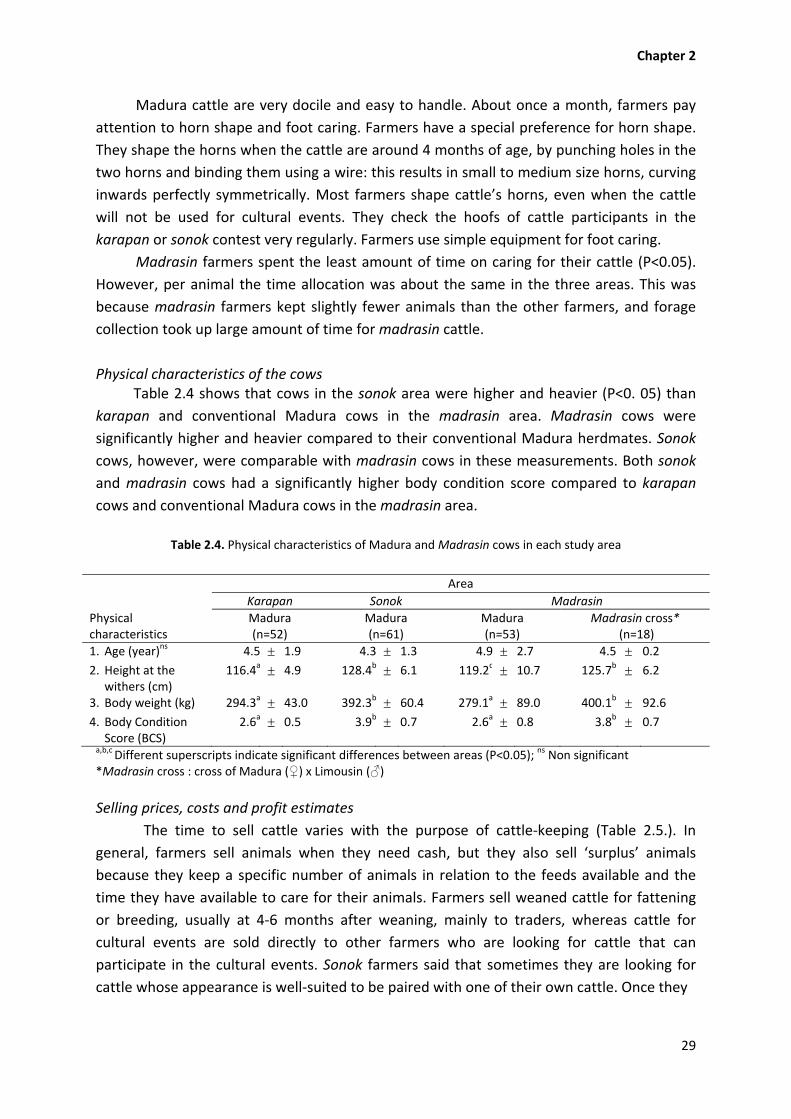
Madura cattle are very docile and easy to handle. About once a month, farmers pay
attention to horn shape and foot caring. Farmers have a special preference for horn shape.
They shape the horns when the cattle are around 4 months of age, by punching holes in the
two horns and binding them using a wire: this results in small to medium size horns, curving
inwards perfectly symmetrically. Most farmers shape cattle’s horns, even when the cattle
will not be used for cultural events. They check the hoofs of cattle participants in the
karapan or sonok contest very regularly. Farmers use simple equipment for foot caring.
Madrasin farmers spent the least amount of time on caring for their cattle (P<0.05).
However, per animal the time allocation was about the same in the three areas. This was
because madrasin farmers kept slightly fewer animals than the other farmers, and forage
collection took up large amount of time for madrasin cattle.
Physical characteristics of the cows Table 2.4 shows that cows in the sonok area were higher and heavier (P<0. 05) than
karapan and conventional Madura cows in the madrasin area. Madrasin cows were
significantly higher and heavier compared to their conventional Madura herdmates. Sonok
cows, however, were comparable with madrasin cows in these measurements. Both sonok
and madrasin cows had a significantly higher body condition score compared to karapan
cows and conventional Madura cows in the madrasin area.
Table 2.4. Physical characteristics of Madura and Madrasin cows in each study area
Physical characteristics
Area
Karapan Sonok Madrasin
Madura (n=52)
Madura (n=61)
Madura (n=53)
Madrasin cross* (n=18)
1. Age (year)ns 4.5 1.9 4.3 1.3 4.9 2.7 4.5 0.2
2. Height at the withers (cm)
116.4a 4.9 128.4b 6.1 119.2c 10.7 125.7b 6.2
3. Body weight (kg) 294.3a 43.0 392.3b 60.4 279.1a 89.0 400.1b 92.6
4. Body Condition Score (BCS)
2.6a 0.5 3.9b 0.7 2.6a 0.8 3.8b 0.7
a,b,c Different superscripts indicate significant differences between areas (P<0.05); ns Non significant *Madrasin cross : cross of Madura (♀) x Limousin (♂)
Selling prices, costs and profit estimates
The time to sell cattle varies with the purpose of cattle‐keeping (Table 2.5.). In
general, farmers sell animals when they need cash, but they also sell ‘surplus’ animals
because they keep a specific number of animals in relation to the feeds available and the
time they have available to care for their animals. Farmers sell weaned cattle for fattening
or breeding, usually at 4‐6 months after weaning, mainly to traders, whereas cattle for
cultural events are sold directly to other farmers who are looking for cattle that can
participate in the cultural events. Sonok farmers said that sometimes they are looking for
cattle whose appearance is well‐suited to be paired with one of their own cattle. Once they

Unique cultural values of Madura cattle
30
Table 2.5. Age, period of keeping, selling price, input costs and cash profit per period of keeping of
Madura and madrasin cattle based on the age group, area, purpose of keeping cattle and type of cattle
(Million IDR)*
Area / category of cattle
Karapan Sonok
Age group /
Animals in the event
Animals not in the event
Animals in the event
Animals not in the event
< 1.5 year n=13: ♂=13;♀=0
n= 22: ♂=10;♀=12
n=12: ♂=0;♀=12
n=18: ♂=6;♀=12
Age (year) 0.60 ± 0.29 0.36 ± 0.21 0.75 ± 0.29 0.51 ± 0.29
Period of keeping1 (year) 0.47 ± 0.27 0.37 ± 0.20 0.68 ± 0.30 0.48 ± 0.25
Selling price (Million IDR) 14.81a ± 8.1 2.85b ± 0.87 20.38a ± 5.27 5.88b ± 2.26
Total input cost per period of keeping (Million IDR)
0.90a ± 0.80 0.04b ± 0.11 2.83a ± 2.16 0.12b ± 0.25
Forage 0.04 ± 0.10 0.04 ± 0.09 0.09 ± 0.14 0.06 ± 0.41
Additional feed2 0.80 ± 0.69 (88.9%) 0.00 1.12 ± 0.93 (39.6%) 0.06 ± 0.11
Veterinarian 0.01 ± 0.02 0.00 0.01 ± 0.03 0.00
AI/mating 0.00 0.00 0.00 0.00
Training, racing /contest
0.07 ± 0.08 (7.8%) 0.00 1.50 ±1.29 (53.0%) 0.00
Labour 0.00 0.00 0.03 ± 0.09 0.00
Profit per period of keeping (Million IDR)
14.2a ± 8.1 2.6b ± 0.9 18.1a ± 4.3 5.8b ± 2.1
>1.5 year n=10: ♂=10;♀=0
n=6:♂=0;♀=6
n=10:♂=0;♀=10
n=11: ♂=0;♀=11
Age (year) 2.86 ± 1.21 3.00 ± 1.38 2.21 ± 0.94 2.85 ± 1.34
Period of keeping (year) 1.03 ±0.08 1.83 ± 0.91 1.27 ± 0.34 2.01 ± 0.70
Selling price (Million IDR) 21.90a± 8.70 6.17b± 0.68 25.44a± 4.40 11.59a± 4.43
Total annual input cost (Million IDR)
4.30a± 1.80 0.08b± 0.10 4.66a± 1.60 1.03b ± 0.50
Forage 0.34 ± 0.16 0.07 ± 0.10 0.24 ± 0.22 0.36 ± 0.23
Additional feed 3.70 ± 1.5 (86.0%) 0.00 2.35 ± 0.94(50.4%) 0.66 ± 0.37
Veterinarian 0.006 ± 0.02 0.004 ± 0.01 0.009 ± 0.02 0.00
AI/mating 0.01 ± 0.01 0.01 ± 0.01 0.006 ± 0.01 0.007 ± 0.01
Training, racing /contest
0.25 ± 0.20(5.8%) 0.00 2.07 ± 0.83 (44.4%) 0.00
Labour 0.00 0.00 0.00 0.00
Total input cost per period of keeping3 (Million IDR)
4.4 ± 1.8 0.17 ± 0.3 6.01 ± 3.1 2.1 ± 1.6
Estimated profit per period of keeping4 (Million IDR)
17.6 ± 7.8 5.9 ± 0.7 19.4 ± 5.5 9.4 ± 4.3
Annual profit5 15.9a ± 9.6 3.9b ± 1.6 17.8a ± 11.5 5.1b ± 2.5 a,bDifferent superscripts indicate significant difference between different categories of cattle within areas (P<0.05); 1Time needed to keep cattle from purchasing or born until sold; 2Feeds which are added into the basal diet (forage), such as concentrate, rice bran, maize bran, palm sugar, herbs, etc. 3Total input cost per period of keeping (Million IDR) for cattle with age group > 1.5 years was calculated by multiplying total annual input cost (Million IDR) and period of keeping (year); 4Profit per period of keeping (Million IDR) was calculated by deducting total input cost per period of keeping (Million IDR) from selling price (Million IDR); 5Annual profit (Million IDR) = Profit per period of keeping (Million IDR) / period of keeping (year); *One US $ = 9,200 IDR;
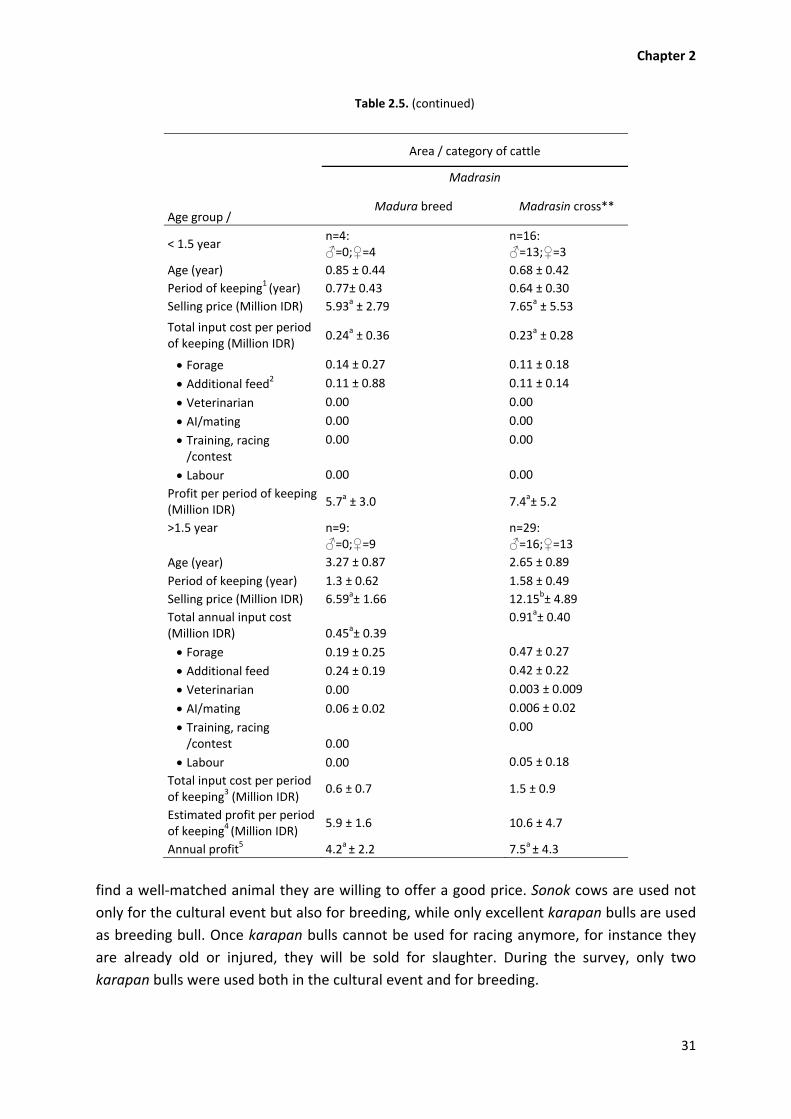
Chapter 2
31
Table 2.5. (continued)
Age group /
Area / category of cattle
Madrasin
Madura breed Madrasin cross**
< 1.5 year n=4:♂=0;♀=4
n=16:♂=13;♀=3
Age (year) 0.85 ± 0.44 0.68 ± 0.42
Period of keeping1 (year) 0.77± 0.43 0.64 ± 0.30
Selling price (Million IDR) 5.93a ± 2.79 7.65a ± 5.53
Total input cost per period of keeping (Million IDR)
0.24a ± 0.36 0.23a ± 0.28
Forage 0.14 ± 0.27 0.11 ± 0.18
Additional feed2 0.11 ± 0.88 0.11 ± 0.14
Veterinarian 0.00 0.00
AI/mating 0.00 0.00
Training, racing /contest
0.00 0.00
Labour 0.00 0.00
Profit per period of keeping (Million IDR)
5.7a ± 3.0 7.4a± 5.2
>1.5 year n=9:♂=0;♀=9
n=29:♂=16;♀=13
Age (year) 3.27 ± 0.87 2.65 ± 0.89
Period of keeping (year) 1.3 ± 0.62 1.58 ± 0.49
Selling price (Million IDR) 6.59a± 1.66 12.15b± 4.89
Total annual input cost (Million IDR) 0.45a± 0.39
0.91a± 0.40
Forage 0.19 ± 0.25 0.47 ± 0.27
Additional feed 0.24 ± 0.19 0.42 ± 0.22
Veterinarian 0.00 0.003 ± 0.009
AI/mating 0.06 ± 0.02 0.006 ± 0.02
Training, racing /contest 0.00
0.00
Labour 0.00 0.05 ± 0.18
Total input cost per period of keeping3 (Million IDR)
0.6 ± 0.7 1.5 ± 0.9
Estimated profit per period of keeping4 (Million IDR)
5.9 ± 1.6 10.6 ± 4.7
Annual profit5 4.2a ± 2.2 7.5a ± 4.3
find a well‐matched animal they are willing to offer a good price. Sonok cows are used not
only for the cultural event but also for breeding, while only excellent karapan bulls are used
as breeding bull. Once karapan bulls cannot be used for racing anymore, for instance they
are already old or injured, they will be sold for slaughter. During the survey, only two
karapan bulls were used both in the cultural event and for breeding.
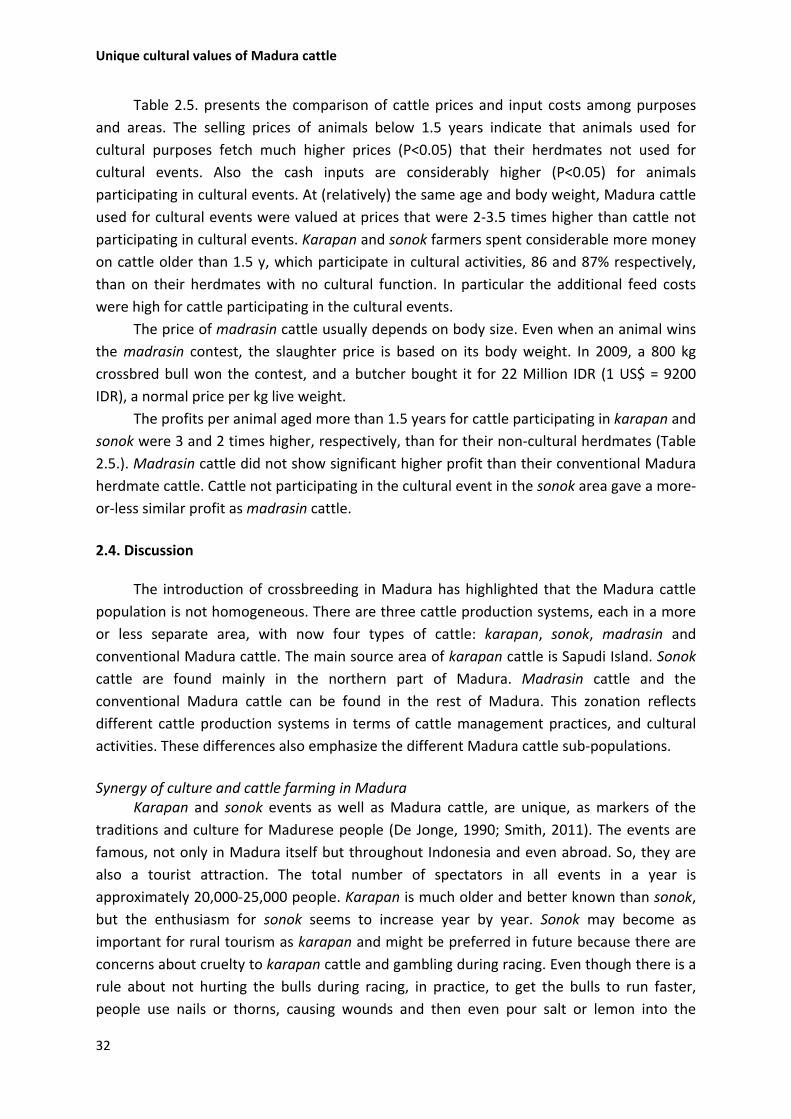
Unique cultural values of Madura cattle
32
Table 2.5. presents the comparison of cattle prices and input costs among purposes
and areas. The selling prices of animals below 1.5 years indicate that animals used for
cultural purposes fetch much higher prices (P<0.05) that their herdmates not used for
cultural events. Also the cash inputs are considerably higher (P<0.05) for animals
participating in cultural events. At (relatively) the same age and body weight, Madura cattle
used for cultural events were valued at prices that were 2‐3.5 times higher than cattle not
participating in cultural events. Karapan and sonok farmers spent considerable more money
on cattle older than 1.5 y, which participate in cultural activities, 86 and 87% respectively,
than on their herdmates with no cultural function. In particular the additional feed costs
were high for cattle participating in the cultural events.
The price of madrasin cattle usually depends on body size. Even when an animal wins
the madrasin contest, the slaughter price is based on its body weight. In 2009, a 800 kg
crossbred bull won the contest, and a butcher bought it for 22 Million IDR (1 US$ = 9200
IDR), a normal price per kg live weight.
The profits per animal aged more than 1.5 years for cattle participating in karapan and
sonok were 3 and 2 times higher, respectively, than for their non‐cultural herdmates (Table
2.5.). Madrasin cattle did not show significant higher profit than their conventional Madura
herdmate cattle. Cattle not participating in the cultural event in the sonok area gave a more‐
or‐less similar profit as madrasin cattle.
2.4. Discussion
The introduction of crossbreeding in Madura has highlighted that the Madura cattle
population is not homogeneous. There are three cattle production systems, each in a more
or less separate area, with now four types of cattle: karapan, sonok, madrasin and
conventional Madura cattle. The main source area of karapan cattle is Sapudi Island. Sonok
cattle are found mainly in the northern part of Madura. Madrasin cattle and the
conventional Madura cattle can be found in the rest of Madura. This zonation reflects
different cattle production systems in terms of cattle management practices, and cultural
activities. These differences also emphasize the different Madura cattle sub‐populations.
Synergy of culture and cattle farming in Madura
Karapan and sonok events as well as Madura cattle, are unique, as markers of the
traditions and culture for Madurese people (De Jonge, 1990; Smith, 2011). The events are
famous, not only in Madura itself but throughout Indonesia and even abroad. So, they are
also a tourist attraction. The total number of spectators in all events in a year is
approximately 20,000‐25,000 people. Karapan is much older and better known than sonok,
but the enthusiasm for sonok seems to increase year by year. Sonok may become as
important for rural tourism as karapan and might be preferred in future because there are
concerns about cruelty to karapan cattle and gambling during racing. Even though there is a
rule about not hurting the bulls during racing, in practice, to get the bulls to run faster,
people use nails or thorns, causing wounds and then even pour salt or lemon into the
Chapter 2
33
wounds (Kuswadi, 2009, personal communication). On Madura, spiritual leaders are already
criticizing these practices and the gambling during karapan events.
The cultural practices have a marked impact on cattle husbandry. Cattle used for
cultural events are well cared for and trained. This gives the owners an overall sense of well‐
being. Most writers about Madurese society emphasize the attention that is given to the
animals. The men are said to be more devoted to their animals than to their wives (De
Jonge, 1990). Karapan and sonok farmers give intensive daily care and exercise to their
animals (about 3 h d‐1 per animal) to improve their physical appearance and performances.
They also spend considerably more money (on average 46.5%) on better quality feeds for
the animals that participate in the cultural events.
Anderson (2003) mentioned that breed characteristics that are important for socio‐
cultural practices generally relate to the appearance of an animal, and traits that define the
market value of an animal. Also in Madura cultural values have a strong economic
component. Most karapan and sonok farmers argued that they like the race or contest
because it keeps the prices of cattle high. Karapan and sonok farmers received more than
50% higher prices for breeding stock than the normal market prices. Not only the prices of
karapan and sonok cattle that participate in the contests were high, but also the overall
input costs (Table 2.5.). In general, farmers in the sonok area are relatively well‐off due
mainly to the income generated from tobacco (Smith, 2011). Part of this income will be
invested in their sonok cattle and the participation in sonok events.
Effect of crossbreeding on culture and cattle farming
Farmers outside the karapan and sonok areas kept conventional Madura cattle before
the introduction of Limousin semen. These were relatively small in size. This made it easy for
the government to introduce Limousin semen at that time, as the farmers wanted cattle as
big as the sonok cattle. Almost all madrasin farmers said that they took more pride in
keeping madrasin cattle than conventional Madura cattle. Table 2.4. shows that
crossbreeding increased the body size of cows with about one‐third. The body condition
score of madrasin cows was also much higher than of their conventional Madura
herdmates. Crossbred animals were fed better, this resulted in higher feeding costs for
madrasin cattle (Table 2.5.). Nevertheless, the selling prices minus the total cash costs for
the period an animal is kept, show that the cash profits of madrasin animals were on
average, 55% higher than from conventional Madura herdmates (Table 2.5.). The economic
profit estimates in Table 2.5. ignore the other benefits cattle provide, such as manure,
draught power and security. A comprehensive economic analysis is needed to calculate the
overall benefits of the different types of cattle keeping (Smith, 2011).
Also crossbreeding contributes to the overall pride resulting from keeping cattle that
perform well. The madrasin contest was initiated by government and seems a top‐down
initiative. It attracts in particular farmers; no tourists attend. The main motivation of
farmers for enrolling their animals in the contest is the expectation that it can result in a fair
price for their animals, since all of the participants’ cattle are weighed and the price per
Unique cultural values of Madura cattle
34
animal is based on the actual weight. In general, when cattle are sold, the prices that traders
offer are based on visual appraisal only.
Crossbreeding is not only influencing the feeding practices and selling prices of cattle,
it also influences the cattle trade flows. Key informants explained that most of small‐scale
slaughter‐men in Madura do not like to slaughter crossbred animals as they cannot handle
and sell the products within one day. So, crossbred slaughter animals are transported as live
animals to the abattoir in Surabaya, the nearest major city in Java.
Conservation and breeding developments
The different farming systems and the different cultural events, and consequently the
different types of Madura cattle, show the importance of considering local variation when
developing conservation strategies. Government bodies that are concerned with livestock
conservation focus primarily on numerical factors (Alderson, 2009). Also, in Indonesia, the
inventory of animal genetic resources for the FAO World’s Animal Genetic Resources gives
only the total number of Madura cattle (Deptan, 2003). It does not distinguish between
different Madura types of cattle.
Although Sapudi is designated by the government as an in‐situ conservation area for
Madura cattle (Deptan, 2003), until now no specific conservation strategies have been
implemented, except that crossbreeding is not allowed. In the whole of Madura, there are
no reliable data on numbers of different cattle. There is urgency to correct that deficiency,
especially in the face of the rapid change in the genetic structure of the island’s cattle herd
because of the high adoption rate of crossbreeding in the major part of the island.
Field observations and the discussions with key stakeholders indicated that the
populations of cattle in the karapan and sonok areas are relatively small: about 45,000 and
50,000 animals, respectively. But there is no immediate threat that these populations will be
reduced by crossbreeding because of the continuing importance of the cultural values of the
karapan and sonok events. It is unlikely that the ban of importing other cattle, in particular
crossbreds, in Sapudi Island will be lifted. Nevertheless, the future of the karapan event is at
stake. There is no strict adherence of the government rules for the karapan race, and the
numbers of bulls that can join a karapan race is going down.
Inbreeding is strictly avoided in the sonok area, by circulating the bulls between
villages whereas, in the karapan area, which is an isolated island, selection to avoid
inbreeding is not done. This may have contributed to the small size of karapan cows. This
requires urgent attention, as it can be a threat to karapan as well as the capacity for
ploughing on Sapudi Island.
AI was introduced in the late 1990s in Sapudi Island, but it was never a success. The
main reasons were that infrastructure was poor, the availability of AI personnel limited,
farmers considered AI a sin and an abnormal way of mating their cattle, and farmers never
trusted the Madura semen used for AI was from a karapan bull.
The phenotypic performances of sonok cattle are comparable with the performances
of madrasin cattle. This shows that through good breeding practices, farmers have
Chapter 2
35
maintained good performances of sonok cattle. This guarantees successful conservation of
Madura cattle in the sonok area in the future.
It can be speculated that, in the future, the great majority of the conventional Madura
cattle will be crossbreds. Farmers outside the sonok and karapan areas prefer the madrasin
cattle over conventional Madura cattle due mainly to their heavier body weights and
consequently higher market prices, although farmers said that they are aware that there is a
risk that second and third generations of crossbred cattle will show poorer performances
than the present F1 crossbreds. Research is needed on performances of future generations
of crossbreds to inform farmers about potential losses in production with continuing
crossbreeding.
The governmental breeding centre is promoting crossbreeding in the south of Madura
and Madura cattle in the north. Unfortunately, it does not distinguish the sonok and
karapan sub‐populations. The present top‐down approach towards implementing the
conservation of Madura breed has to be turned into support approaches that involve the
livestock keepers themselves.
Assessment of cultural values
Gandini and Villa (2003) developed a framework for assessing different cultural
contributions of livestock breeds in Europe with the aim of strengthening their
conservation. The present study illustrates the complexity behind assessing cultural values
of local breeds in countries such as Indonesia. Cultural assessments should not be restricted
to identifying cultural functions and estimating market value of cultural products and
services; they have to include the impact of cultural functions on management and specific
requirements for animals that have cultural value, and the social and economic contribution
of these animals to the livelihoods of the households concerned.
The Madura example shows that the cultural value of a specific breed can be related
to a complex mix of area‐specific cultural functions that are associated with different animal
performances, management practices and economic benefits. Consequently, participatory
research approaches are needed to unravel such complexities, with information collection
at animal, farm and regional levels.
2.5. Conclusions
The Madura cattle example shows that cultural values of livestock can be a main
driver of maintaining a local breed. The enthusiasm of people and farmers for maintaining
the cultural values attached to Madura cattle, and consequently the high prices for cultural
cattle are key to conserve the Madura cattle within the areas where the cultural events are
maintained. The future of sonok cattle is better than karapan cattle in terms of
performances, and general preference of people. Crossbreeding will not directly influence
the cultural events and management practices of Madura cattle in the areas where the
cultural events are important. In the areas where the cultural events are not important,
Unique cultural values of Madura cattle
36
farmers, however, take more pride in keeping madrasin than conventional Madura cattle,
mainly due to their growth performance and the resulting financial benefits. So,
crossbreeding is an immediate threat to the future of conventional Madura cattle in a main
part of Madura. Monitoring and characterization of animal genetic resources studies have to
consider cultural values of livestock breeds and how these values interact with management
practices, animal performances and economic benefits.
References
Anderson, L. 2009. Breed at risk: Definition and measurement of the factors which determine endangerment. Livest. Sci. 123: 23‐27.
Anderson, S. 2003. Animal genetic resources and sustainable livelihoods. Ecol. Econ. 45: 331‐339. Anonymous. 2007. Riwayat singkat tentang kegiatan sapi cangkean/pajangan dan sapi sono di
kecamatan Waru. Kabupaten Pamekasan, Pamekasan. Barwegen, M. 2004. Browsing in livestock history; large ruminants and the environment in Jawa,
1850‐2000. In: Smallholder and stockbreeders; histories of food crop and livestock farming in Southeast Asia. Boomgaard, P., David, H. (eds.). KITLV Press. , Leiden.
De Jonge, H. 1990. Of bull and men: The Madurese aduan sapi. Bijdragen tot de Taal‐, Land‐en Volkenkunde, 146 (4): 423‐447.
Deptan. 2003. National report on animal genetic resources Indonesia; a strategic of policy document. Department of Agriculture, Jakarta.
Djanah, D. 1984. Menentukan umur trnak. CV Yasagyuna, Jakarta. FAO. 2007. Global Plan of Action for Animal Genetic Resources and the Interlaken Declaration. FAO,
Rome. FAO. 2012. Phenotypic characterization of animal genetic resources. FAO, Rome. Gandini, G. C. and E. Villa. 2003. Analysis of the cultural values of local livestock breeds: a
methodology. J. Anim. Breed. Genet. 120 (1): 1‐11. Noer, D. and Maduratna. 1975. Kerapan sapi: permainan dan kegemaran rakyat di kepulauan
Madura. Kinta, Jakarta. Ott, R.L. and M. Longnecker. 2001. An introduction to Statistical methods and data analysis.
Duxbury, Thomson Learning, Inc., Pacific Grove. Payne, W.J.A. and D. Rollinson. 1976. Madura cattle. J. Z. Tierzücht Zuchtsbiol. 93: 89‐100. Smith, W. 2011. Ecological anthropology of households in East Madura, Indonesia. PhD Thesis.
Wageningen University, Wageningen. Sommerfeld, K. 1927. Das Madurarind, ein hervorragender Typ der Java‐Madura‐Sumatra‐Rasse,
eine kombinationszuchtung zweier Rinderarten, des Balirindes (domestizierten Bantengs) und des vorderindischen Zebus und seine wirtschaftliche und sonstige Verwendung und Bedeutung. J. Z. Tierzüchtung und Zuchtungsbiologie 8: 65‐112.
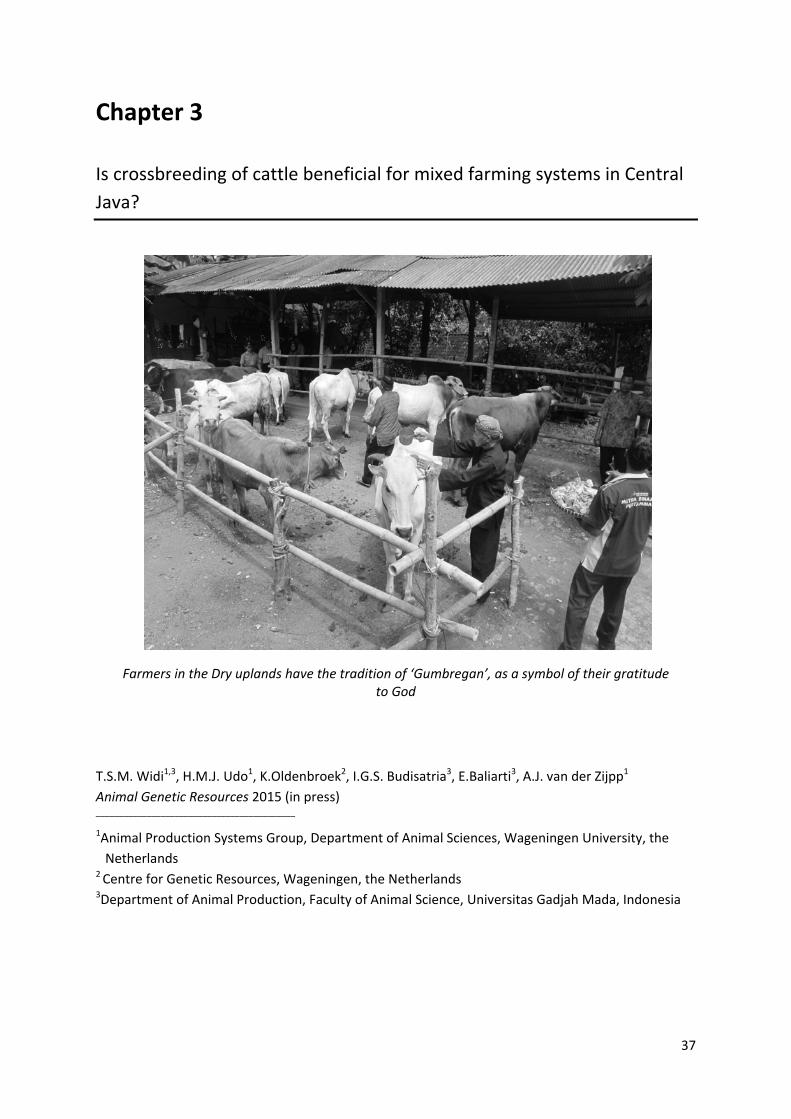
37
Chapter 3
Is crossbreeding of cattle beneficial for mixed farming systems in Central
Java?
Farmers in the Dry uplands have the tradition of ‘Gumbregan’, as a symbol of their gratitude to God
T.S.M. Widi1,3, H.M.J. Udo1, K.Oldenbroek2, I.G.S. Budisatria3, E.Baliarti3, A.J. van der Zijpp1
Animal Genetic Resources 2015 (in press) ___________________________________________
1Animal Production Systems Group, Department of Animal Sciences, Wageningen University, the
Netherlands 2 Centre for Genetic Resources, Wageningen, the Netherlands 3Department of Animal Production, Faculty of Animal Science, Universitas Gadjah Mada, Indonesia
Is crossbreeding of cattle beneficial for mixed farming systems?
38
ABSTRACT
From 1980’s onwards, Indonesia’s government has been implementing
crossbreeding with European beef breeds through artificial insemination to improve the
beef performance of local cattle, in response to the increasing demand for meat.
Crossbreeding is promoted and implemented throughout the country, regardless of the
various agro‐ecological zones, each endowed with different feed resources in the
smallholder farming systems. This study analyses the impact at farm level of crossbreeding
in the different mixed farming conditions in Central Java. Quantitative and qualitative
information was collected through participatory approaches involving farmers (n=252) in
four study areas representing three agro‐ecological zones: Wet lowlands (subdivided in two
areas based on the history of breeding local cattle and crossbreeding), Wet uplands and Dry
uplands. Phenotypic characteristics, reproductive performances, and carcass characteristics
of Ongole and crossbred cattle were assessed, together with farmers’ reasons for keeping
Ongole or crossbred breeding stock, the functions of cattle on the farms and the Gross
Margins (GM) of the cattle component on Ongole and crossbred farms. Across different
agro‐ecological zones, crossbreeding is not changing the farming systems: herd sizes, farm
types, experience in cattle keeping, and functions of cattle were about the same for Ongole
and crossbred farms. The agro‐ecological zones differed in cropping pattern and feed
resources, however they did not differ in amounts of dry matter and crude protein fed to
individual animals. Crossbreeding is changing the individual characteristics of cattle and
consequently the market prices of animals. In general, mature female crossbred cattle were
approximately 25% heavier than mature female local cattle. Male crossbred progeny was
16% heavier their local counterparts, whereas female crossbred progeny was 24% heavier
than female local cattle. In terms of reproduction performances, both local and crossbred
cows performed well with calf crops ranging between 73% and 86% per year. Most farmers
preferred crossbred over Ongole cattle. Simmental cross is the most preferred. GM for
crossbred and Ongole farms were comparable within the different study areas; selling prices
of crossbreds are higher, but feed costs too. Crossbreeding will continue. It is promoted by
government policies and farmers are motivated to keep crossbred cattle as body weights
and market prices are higher than for Ongole cattle, however farmers said that they do not
prefer upgrading to very high levels of Simmental. A viable Ongole population is needed to
reduce the risk of upgrading to too high levels of Simmental.
Keywords: Indonesia, Agro‐ecological zones, Ongole cattle, Simmental crossbreeding, Benefits
Chapter 3
39
3.1. Introduction
Crossbreeding with exotic breeds is a major driving force for livestock intensification
in developing countries (Udo et al., 2011). Most studies on the impact of crossbreeding are
focused on dairy cattle (Syrstad, 1996; Kahi et al., 2000; Samdup et al., 2010). Ideally,
crossbreeding strategies have to match the production environment, of which the feed
resources are a main determinant (Kahi et al., 2000; Wollny, 2003). In practice,
crossbreeding schemes are characterized by un‐systematic use of exotic semen, irrespective
of agro‐ecological and socio‐economic settings (Wollny, 2003).
In Indonesia, crossbreeding is widely applied for beef production. The high human
population increase and increased purchasing power are major factors driving the rising
demand for red meat from ruminants. In 2010 the human population was about 237 million
(BPS, 2010). More than 50% of all cattle are kept on Java, the main island with 57% of the
human population of Indonesia (Kementan, 2010). To satisfy the demand for meat, the
government has been importing meat and live animals. Particularly in Java, from the 1980’s
onwards, the government has been promoting artificial insemination (AI) using exotic
breeds from temperate regions, such as Simmental, Limousin, Aberdeen Angus and
Hereford to improve the beef performance of the local cattle.
In Indonesia, farmers keep cattle not only for meat production, but also for financial
security, manure for cropping, social status and draught power (Widi, 2004). About 90
percent of cattle are in smallholder crop‐livestock farmers’ hands, with fewer than five
cattle per farm.
During the colonial period the Dutch administration introduced Ongole cattle from
India to replace the indigenous Java cattle (Bos javanicus) (Barwegen, 2004). The male and
female Ongole cattle were bought from areas surrounding Madras. Ongole were considered
more suitable for carrying the heavy loads for the sugar industry. Javanese farmers initially
disliked the Ongole breed, because they could not work in forests like the Java cattle
(Barwegen, 2004). The pure Ongole was brought to Sumba Island and became the purebred
Sumba‐Ongole. In Java, the Sumba‐Ongole were crossed with Java cattle and formed the
Ongole‐grade (in Indonesia called Peranakan Ongole, PO). Added to this, the Dutch
administration introduced Ongole cattle in areas along a main concrete road, ‘Daendels
road’, located along the south coast in Central Java; the Ongole has been developed and
favoured by farmers in this area (Sudardjat and Pambudy, 2003). In the course of the 20th
century, Ongole became the prominent cattle breed in Java (Maule, 1990).
Characteristics of Ongole cattle are: a big body, strong power, docile and a quiet
temperament, good heat tolerance and ability to survive under restricted feed conditions
(Maule, 1990). This makes them good animals for draught power. Ongole cattle grow faster
than Madura or Bali cattle. However, they are less fertile than the indigenous Java cattle
(Barwegen, 2002; Widi et al., 2006), and Madura and Bali cattle (Maule, 1990). In 2003, the
Ongole population was estimated at about 4.4 million. About 90% of them are on Java
(Deptan, 2003). Their numbers are, however, rapidly decreasing, mainly because in the
Is crossbreeding of cattle beneficial for mixed farming systems?
40
period 2006‐2011, the percentages of semen from exotic and local breeds distributed by AI
centres all around Indonesia were 85 and 15%, respectively (BIB, 2011). In Java, AI is the
dominant breeding method for cows. About 85 % female cattle in Java has been served with
AI (Sudardjat and Pambudy, 2003).
The performance of breeds depends on environmental conditions and farming
systems (Frisch and Vercoe, 1978). In Java, there are broadly speaking two agro‐ecological
zones, based on the altitude: the Uplands and the Lowlands; and based on the annual
rainfall dry and wet subdivisions can be made. Each zone has a different topography, soil
type, soil fertility, and agro‐climatic conditions. The result is a different cropping pattern,
land use management, production potential and consequently variation in feed resources
(Budisatria, 2006). Crossbreeding is promoted and implemented throughout the country
regardless of the different resources in the various agro‐ecological zones and the different
functions of cattle in the smallholder farming systems.
Central Java is one of the prominent areas in Indonesia with beef cattle. Crossbreds
are already a major part of the cattle population, but also the original breeding areas of
Ongole cattle are found here (Widi et al., 2008). In Central Java, feeding conditions are
relatively good in the Lowlands and Wet uplands, and poor in the Dry uplands (Sutresniwati,
2006).
Given the large utilization of crossbreds, irrespective of the different mixed farming
conditions, we studied the relative performance of Ongole and crossbred cattle to address
the question: is crossbreeding an appropriate breeding strategy in the different agro‐
ecological zones endowed with different feed resources?
3.2. Materials and Methods
Study Areas
This study was conducted in Yogyakarta and Central Java Provinces, situated in the
southern part of Central Java (Figure 3.1.). Both provinces have large cattle numbers. The
study areas represented two agro‐ecological zones, the Lowlands and the Uplands, with
different rainfall patterns: Wet lowlands, Wet uplands, and Dry uplands. Wet lowlands are
found at less than 100 m above sea level (asl) and their annual rainfall ranges from 2400 –
3000 mm (BPS, 2009). Lowlands have fertile soils and are characterized by irrigated farming
systems with paddy and maize as the main crops. Wet uplands are defined as areas above
500 m asl with annual rainfall ranging from 3000‐3600 mm (BPS, 2009). This zone has fertile
soils and is characterised by both irrigated and rain fed farming systems, with paddy fields,
horticulture and forest. Dry uplands are also situated above 500 m asl but have less fertile
soils and low annual rainfall: 1800‐2400 mm (BPS, 2009). This zone is characterized by rain‐
fed farming systems with cassava and dry land paddy as the main crops.
There are two rainfall seasons over the year. The wet season usually begins in
September and lasts until about April. No grazing areas are available, as all land is used for
cropping. The types of forages used include improved grasses, such as Napier and Elephant
Chapter 3
41
grasses, rice straw, maize straw, many kinds of tree leaves, cassava leaves, and tree
legumes. Native forages, such as weeds and grasses, are collected from farmers’ own fields
and backyards, roadsides, riversides, and forest edges. During the dry season, when forage
sources are limited, farmers buy forages from other areas. The Dry uplands are relatively far
away from the input markets, approximately 60 km, 1.5 hours by truck.
For this study, Wet lowlands were divided into two areas, namely Wet lowlands I and
II (Figure 3.1.). In Wet lowlands I, located in Yogyakarta Province, crossbreeding is broadly
applied in contrast to Wet lowlands II, located in Central Java, where crossbreeding is
practiced less frequently. In this area, the local government allocated different locations for
maintaining Ongole and for crossbreeding in order to maintain the Ongole in this zone,
which is an original Ongole breeding area from colonial times onwards. In each zone, the
farmers could be divided into Ongole and crossbred farmers, based on the breed of cattle
they kept as breeding stock.
Before 1990, mostly Ongole cows were used for breeding; they were inseminated
with Simmental or Limousin semen which resulted in F1 Simmental or Limousin crossbreds.
From 1990 onwards the majority of F1 and F2 cows were inseminated using Simmental or
Limousin semen, which resulted in F2 and F3 Simmental and Limousin crossbreds.
Consequently, the number of Ongole cattle has been sharply decreasing since 1990 (Widi et
al., 2008).
Data Collection
Secondary data collection
Secondary data related to geographical situation of study areas, cattle population,
distribution of semen, and local implementation of national and local policies were collected
from The Agricultural Department of Indonesia, Animal Husbandry Office of Yogyakarta
Province and Central Java Province, government websites, publications, and reports from
institutes. Secondary data provided insight in the recent local situations.
Focus group discussions and farmers’ interviews
Participatory approaches started by conducting focus group discussions (FGDs)
amongst farmers and key persons such as head of farmers’ group and village elders in each
area. The purpose of the FGDs was to introduce the study and identify the issues regarding
the local and crossbred cattle keeping. All cattle farmers in the study areas were invited via
the heads of the farmers’ groups. In total 296 participants (60 in Wet lowlands I, 86 in Wet
lowlands II, 65 in Wet uplands and 85 in Dry uplands) joined the FGDs.
The issues which were obtained in the FGDs were used for making a checklist for
guidance of semi structured interviews for the farmers. In total 252 farmers from 296 FGDs’
participants in the four study areas (56 farmers in Wet lowlands I; 63 farmers in Wet
lowlands II; 59 farmers in Wet uplands and 74 farmers in Dry uplands) were purposively
selected based the criterion of minimum 10 years experience in keeping their own herd of
cattle. Most farmer respondents were men, only 4 of them were women, widows. Men are
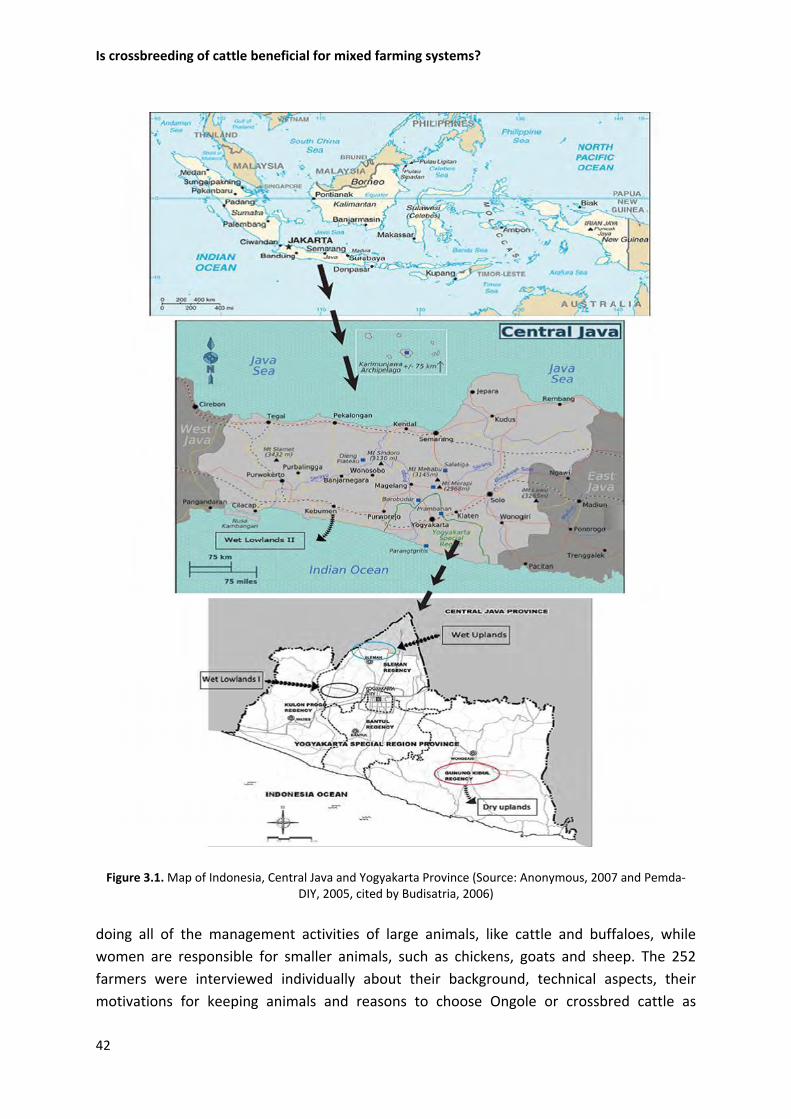
Is crossbreeding of cattle beneficial for mixed farming systems?
42
Figure 3.1. Map of Indonesia, Central Java and Yogyakarta Province (Source: Anonymous, 2007 and Pemda‐DIY, 2005, cited by Budisatria, 2006)
doing all of the management activities of large animals, like cattle and buffaloes, while
women are responsible for smaller animals, such as chickens, goats and sheep. The 252
farmers were interviewed individually about their background, technical aspects, their
motivations for keeping animals and reasons to choose Ongole or crossbred cattle as
Chapter 3
43
breeding stock. Household members contributed to recall information during the
interviews. These data were collected during the first farm visit in the period July –
November 2009.
Phenotypic characteristics of Ongole and crossbred cattle
Each animal on all 252 farms was characterised by observing the body, face, nose,
leg, tails’ hair and vulva colours; existence of dewlap, backline and hump; shape of horns
and the thickness of body and heads’ hairs. Ongole and crossbred cattle were
distinguished based on these characteristics, using a checklist (Maule, 1990; Supiyono,
1998; Triyono, 2003; Sumadi et al, 2003; Porter, 2007; Widayanti, 2008) with specific
conformation traits, and on information from the farmer on breeding background of the
animal concerned.
Quantitative phenotypic characteristics of 294 female cattle of the 252 farms were
collected by taking length of the body (LB), girth of chest (GC), height at withers (HW),
height at hip (HH), head index (HI) and estimation of body weight (BWe), using a
measurement tape with cm and the transformation of chest girth in cm into weight in kg
(developed by FHK Ogawa Seki Co. Ltd, Tokyo, Japan), over the period January 2010 to July
2011. Body score condition (BCS) was visually assessed (Ferguson et al., 1994 cited by
Lassen et al., 2003). The age of each animal (in years) was determined by inspecting its
teeth (Djanah, 1984). Similar measurements were done for calves (n=127) at weaning and
at approximately 11 months of age. Eleven months of age was chosen because most calves
are sold before they reach the age of one year.
Feeding practices
Many different feeds were offered. The feeds were categorized in fresh forages, dry
forages and supplementary feeds. The proportions of the different fresh forages were
estimated by separating the fresh forages again in its components. Feed inputs were
calculated based on farmers’ estimates and direct observation on kinds and amounts of
feeds offered to each individual adult animal, over one year (January 2011‐January 2012).
The estimations of kind and amount of fresh and dry forages offered were recorded by
farmers every day. Enumerators checked the farm recording once a month. Dry forages and
supplementary feeds that were bought were estimated from the amounts bought. These
estimates were translated into kg dry matter (DM) and crude protein (CP) intake per animal,
applying the feed composition tables for feeds available in Central Java of Hartadi et al.
(2005).
Reproductive performances
Reproductive data were collected over the period January 2010 to July 2011. This
recording was done by farmers, guided and assisted by enumerators (n=8) at the start of the
monitoring period. Enumerators visited the farmers every month to collect and check the
recorded information. Reproductive performances determined were days to postpartum
Is crossbreeding of cattle beneficial for mixed farming systems?
44
estrus (PPE) days to postpartum mating (PPM), services per conception (S/C), calving
interval (CI), weaning age and calf crop. Calving interval estimates were based on calving
dates of animals with two calvings in the reporting period or on calving date in the reporting
period and a previous calving from before the recording started derived from recall
information. Calf crop per study area was calculated as follows:
Calf crop in each study area =
∑ calves born ‐ ∑ pre‐weaning calves dead x
(365 / CI)
∑cows
The reproductive performances of 114 Ongole and 156 crossbred cows were
recorded. Cows were defined as female cattle that had calved at least once. The farmers
observed and recorded the reproduction cycle of their cows over a period of 1.5 years.
Farmers in all study areas have relatively similar knowledge on reproductive management.
They obtained it through information sharing amongst farmers, farmers’ community groups
and formal training from the local extension officer. Farmers do not routinely record
reproductive information. For this survey, we asked farmers to fill in a recording sheet for
the reproductive data of their cattle. They were explained beforehand and enumerators
visited them every month to assist them in recording the reproductive activities.
Information on age at first estrus and calving (if available) were also collected by recall. The
number of infertile female cattle was very small, not more than 2%. Farmers immediately
sold infertile heifers and the cows which are failing to have a next calving (S/C > 5). AI is
applied in all the study areas, particularly to crossbred cows.
Carcass characteristics of Ongole and crossbred cattle
We visited the biggest slaughter house in Yogyakarta, and measured the slaughter
cattle belonging to two butchers over a period of 15 days. Carcass weight and meat bone
ratio (MBR) were measured on 55 cattle (13 Ongole, 29 Simmental cross and 13 Limousin
cross). They consisted of 14 female and 41 male cattle. The scales to weigh the cattle and
carcasses had an accuracy of 1 kg and the scale to weigh the meat had an accuracy of 20 g.
Gross Margins Analysis
Farmers recorded the inputs and outputs of their cattle over a period of 1.5 year
(January 2011 – July 2012). Enumerators (n=8) visited the farmers every month to collect
and check the recorded information. This particular period was representative of an average
period in terms of rainfall and perceptions of farmers that the revenues from their cattle
covered their financial requirements. Only 184 of the 252 farmers sold cattle during the
monitoring period. Most farmers used only family labour, only few farmers (n=20) used
hired labour, either regularly or on an ad hoc basis.
The Gross Margins analysis was done for each farm for the reporting period. It was
based on financial revenues minus variable costs. Procedures in the Gross Margins
calculations included:
Chapter 3
45
- Fresh forage costs comprising cultivated grasses and maize foliage bought
from forage sellers in the livestock markets or alongside roads
- Dry forage costs comprising rice and maize straws bought from dry forage
sellers or collected from the fields and loaded on trucks, involving costs for
the fuel, or hiring the trucks and drivers
- Supplementary feeds costs comprising concentrates, rice bran, cassava meal,
cassava, tofu (soybean curd) waste and soy bean hulls bought from poultry
shops, markets and soy processing factories
- Costs for veterinary services and medicines
- Costs for AI or mating services
- Hired labour costs
- Feeds collected by farmers from communal sources (road sides, forests,
communal lands) and transported on the back of farmers or on bicycles were
not valued
- Revenues of cattle sales; local traders buy the cattle
- Revenues from the sale of manure; manure in the form of compost is sold to
horticulture farmers, ornamental plants farmers, producers of organic
fertilizer, or plantations.
- Opportunity value of manure used for crops was not included
- Actual farm gate prices were used for accounting in IDR (Indonesian Rupiah;
US $ 1 = 9,200 IDR in 2011).
Data analysis
The qualitative data were analysed descriptively. Ranking was used to determine the
level of agreement of farmers’ motivations for keeping cattle. Frequency distribution was
used to analyse the reasons of the farmers in choosing Ongole or crossbred breeding stock.
The quantitative data were analysed using analysis of variance (ANOVA) with breed nested
within areas (Ott and Longnecker, 2010). The model was simplified to compare breeds
within areas, because for most parameters no interaction was found between breed and
area.
3.3. Results and Discussion
Phenotypic characteristics of Ongole and crossbred cattle
By observing the phenotypic characteristics in the study areas, the cattle were
identified as Ongole or crossbred, while the crossbred cattle were Simmental or Limousin
crosses. The diversity in phenotypic characteristics of crossbred cattle is presented in Figure
3.2. There was not sufficient information to distinguish subsequent crossbred generations,
since there is no pedigree recording system kept by farmers nor inseminators. Farmers
could also not distinguish subsequent crossbred generations; they purchased their animals
from the market or middle men without any pedigree information.
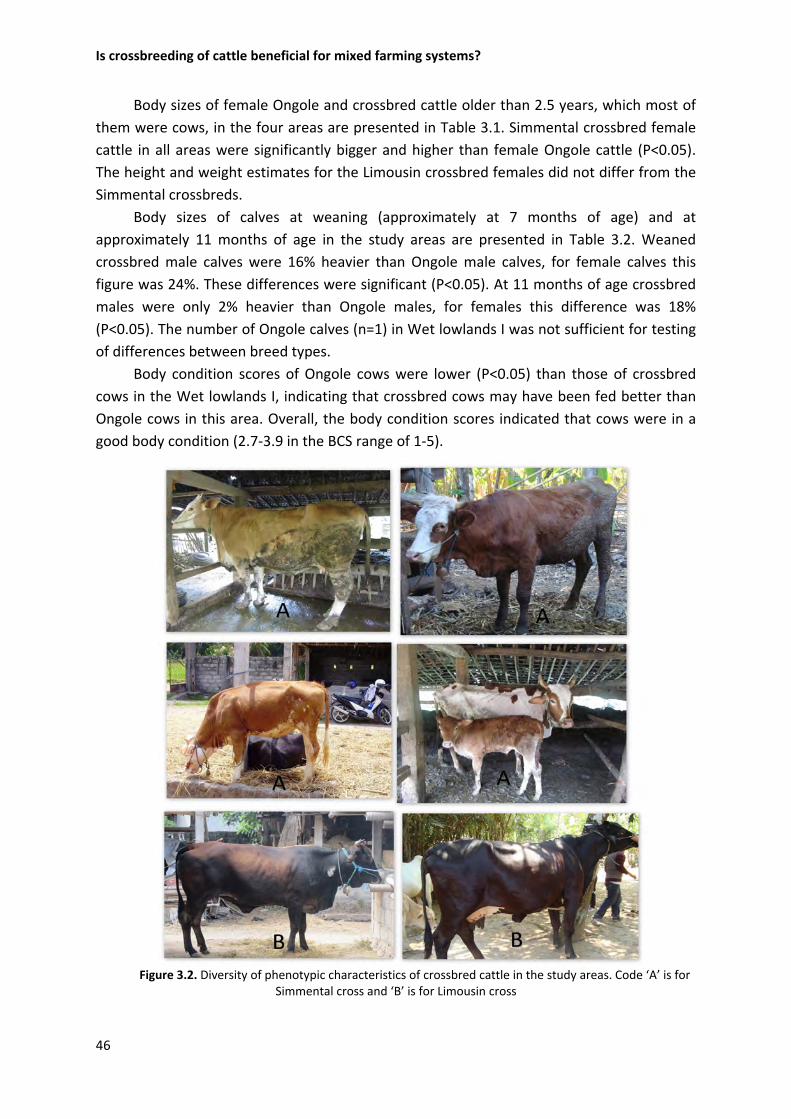
Is crossbreeding of cattle beneficial for mixed farming systems?
46
Body sizes of female Ongole and crossbred cattle older than 2.5 years, which most of
them were cows, in the four areas are presented in Table 3.1. Simmental crossbred female
cattle in all areas were significantly bigger and higher than female Ongole cattle (P<0.05).
The height and weight estimates for the Limousin crossbred females did not differ from the
Simmental crossbreds.
Body sizes of calves at weaning (approximately at 7 months of age) and at
approximately 11 months of age in the study areas are presented in Table 3.2. Weaned
crossbred male calves were 16% heavier than Ongole male calves, for female calves this
figure was 24%. These differences were significant (P<0.05). At 11 months of age crossbred
males were only 2% heavier than Ongole males, for females this difference was 18%
(P<0.05). The number of Ongole calves (n=1) in Wet lowlands I was not sufficient for testing
of differences between breed types.
Body condition scores of Ongole cows were lower (P<0.05) than those of crossbred
cows in the Wet lowlands I, indicating that crossbred cows may have been fed better than
Ongole cows in this area. Overall, the body condition scores indicated that cows were in a
good body condition (2.7‐3.9 in the BCS range of 1‐5).
Figure 3.2. Diversity of phenotypic characteristics of crossbred cattle in the study areas. Code ‘A’ is for Simmental cross and ‘B’ is for Limousin cross
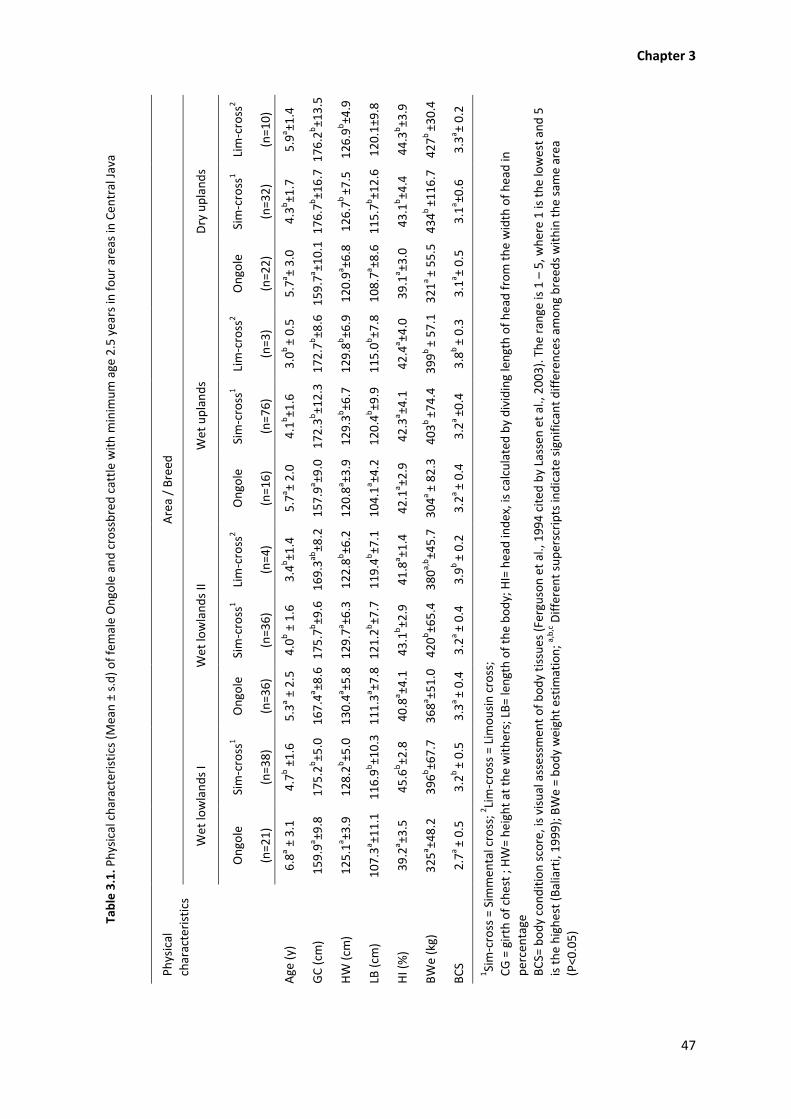
Chapter 3
47
Table 3.1. Physical characteristics (M
ean ± s.d) of female Ongole and crossbred cattle with m
inim
um age 2.5 years in
four areas in Cen
tral Java
Area / Breed
Dry uplands
Lim‐cross
2
(n=10)
5.9
a ±1.4
176.2
b±13.5
126.9
b±4.9
120.1±9.8
44.3
b±3.9
427b ±30.4
3.3
a ± 0.2
1Sim‐cross = Sim
men
tal cross; 2Lim‐cross = Lim
ousin cross;
CG = girth of chest ; H
W= height at the withers; LB= length of the body; HI= head index, is calculated by dividing length of head from the width of head in
percentage
BCS= body condition score, is visual assessm
ent of body tissues (Ferguson et al., 1994 cited
by Lassen
et al., 2003). The range is 1 – 5, w
here 1 is the lowest and 5
is the highest (Baliarti, 1999); BWe = body weight estimation; a
,b,c Different superscripts indicate significant differences am
ong breed
s within the same area
(P<0.05)
Sim‐cross
1
(n=32)
4.3
b±1.7
176.7
b±16.7
126.7
b ±7.5
115.7
b±12.6
43.1
b±4.4
434b ±116.7
3.1
a ±0.6
Ongole
(n=22)
5.7
a ± 3.0
159.7
a ±10.1
120.9
a ±6.8
108.7
a ±8.6
39.1
a ±3.0
321a ± 55.5
3.1
a ± 0.5
Wet uplands
Lim‐cross
2
(n=3)
3.0
b ± 0.5
172.7
b±8.6
129.8
b±6.9
115.0
b±7.8
42.4
a ±4.0
399b ± 57.1
3.8
b ± 0.3
Sim‐cross
1
(n=76)
4.1
b±1.6
172.3
b±12.3
129.3
b±6.7
120.4
b±9.9
42.3
a ±4.1
403b ±74.4
3.2
a ±0.4
Ongole
(n=16)
5.7
a ± 2.0
157.9
a ±9.0
120.8
a ±3.9
104.1
a ±4.2
42.1
a ±2.9
304a ± 82.3
3.2
a ± 0.4
Wet lowlands II Lim‐cross
2
(n=4)
3.4
b±1.4
169.3
ab±8.2
122.8
b±6.2
119.4
b±7.1
41.8
a ±1.4
380a,b±45.7
3.9
b ± 0.2
Sim‐cross
1
(n=36)
4.0
b ± 1.6
175.7
b±9.6
129.7
a ±6.3
121.2
b±7.7
43.1
b±2.9
420b±65.4
3.2
a ± 0.4
Ongole
(n=36)
5.3
a ± 2.5
167.4
a ±8.6
130.4
a ±5.8
111.3
a ±7.8
40.8
a ±4.1
368a ±51.0
3.3
a ± 0.4
Wet lowlands I
Sim‐cross
1
(n=38)
4.7
b ±1.6
175.2
b±5.0
128.2
b±5.0
116.9
b±10.3
45.6
b±2.8
396b±67.7
3.2
b ± 0.5
Ongole
(n=21)
6.8
a ± 3.1
159.9
a ±9.8
125.1
a ±3.9
107.3
a ±11.1
39.2
a ±3.5
325a ±48.2
2.7
a ± 0.5
Physical
characteristics
Age (y)
GC (cm
)
HW (cm
)
LB (cm
)
HI (%)
BWe (kg)
BCS
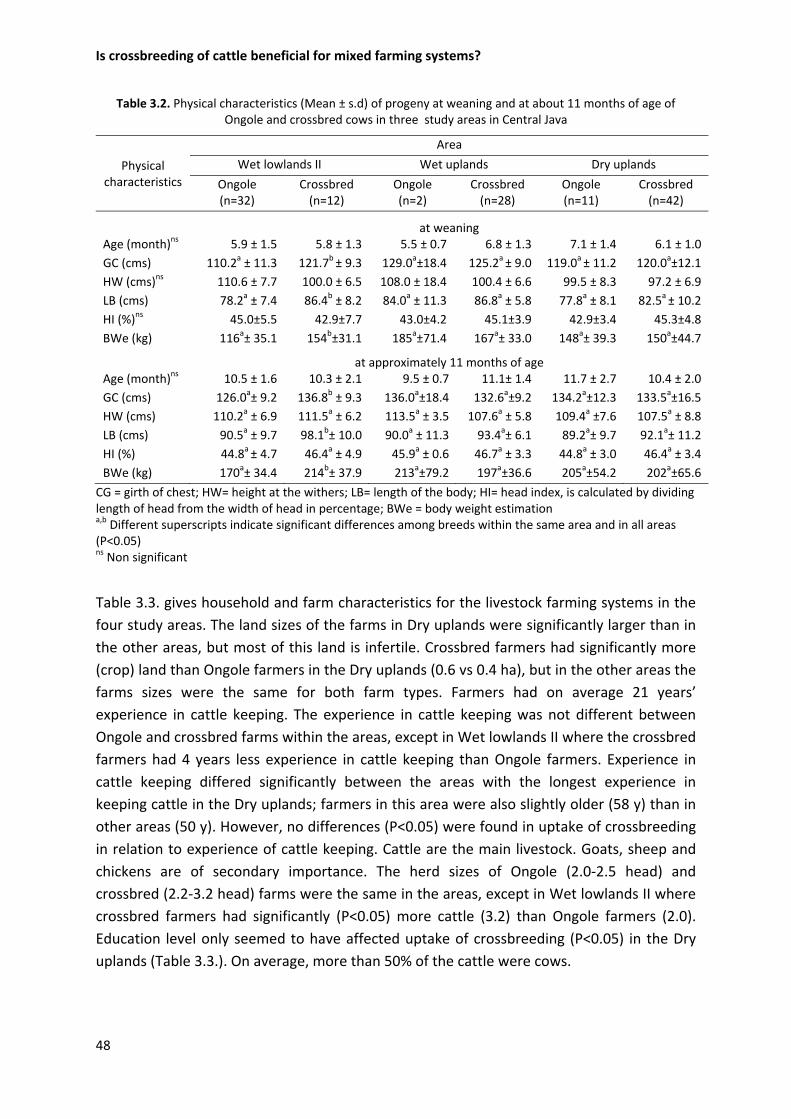
Is crossbreeding of cattle beneficial for mixed farming systems?
48
Table 3.2. Physical characteristics (Mean ± s.d) of progeny at weaning and at about 11 months of age of Ongole and crossbred cows in three study areas in Central Java
Physical characteristics
Area
Wet lowlands II Wet uplands Dry uplands
Ongole (n=32)
Crossbred (n=12)
Ongole(n=2)
Crossbred(n=28)
Ongole (n=11)
Crossbred (n=42)
at weaning
Age (month)ns 5.9 ± 1.5 5.8 ± 1.3 5.5 ± 0.7 6.8 ± 1.3 7.1 ± 1.4 6.1 ± 1.0
GC (cms) 110.2a ± 11.3 121.7b ± 9.3 129.0a±18.4 125.2a ± 9.0 119.0a ± 11.2 120.0a±12.1
HW (cms)ns 110.6 ± 7.7 100.0 ± 6.5 108.0 ± 18.4 100.4 ± 6.6 99.5 ± 8.3 97.2 ± 6.9
LB (cms) 78.2a ± 7.4 86.4b ± 8.2 84.0a ± 11.3 86.8a ± 5.8 77.8a ± 8.1 82.5a ± 10.2
HI (%)ns 45.0±5.5 42.9±7.7 43.0±4.2 45.1±3.9 42.9±3.4 45.3±4.8
BWe (kg) 116a± 35.1 154b±31.1 185a±71.4 167a± 33.0 148a± 39.3 150a±44.7
at approximately 11 months of age Age (month)ns 10.5 ± 1.6 10.3 ± 2.1 9.5 ± 0.7 11.1± 1.4 11.7 ± 2.7 10.4 ± 2.0
GC (cms) 126.0a± 9.2 136.8b ± 9.3 136.0a±18.4 132.6a±9.2 134.2a±12.3 133.5a±16.5
HW (cms) 110.2a ± 6.9 111.5a ± 6.2 113.5a ± 3.5 107.6a ± 5.8 109.4a ±7.6 107.5a ± 8.8
LB (cms) 90.5a ± 9.7 98.1b± 10.0 90.0a ± 11.3 93.4a± 6.1 89.2a± 9.7 92.1a± 11.2
HI (%) 44.8a ± 4.7 46.4a ± 4.9 45.9a ± 0.6 46.7a ± 3.3 44.8a ± 3.0 46.4a ± 3.4
BWe (kg) 170a± 34.4 214b± 37.9 213a±79.2 197a±36.6 205a±54.2 202a±65.6
CG = girth of chest; HW= height at the withers; LB= length of the body; HI= head index, is calculated by dividing length of head from the width of head in percentage; BWe = body weight estimation a,b Different superscripts indicate significant differences among breeds within the same area and in all areas (P<0.05) ns Non significant
Table 3.3. gives household and farm characteristics for the livestock farming systems in the
four study areas. The land sizes of the farms in Dry uplands were significantly larger than in
the other areas, but most of this land is infertile. Crossbred farmers had significantly more
(crop) land than Ongole farmers in the Dry uplands (0.6 vs 0.4 ha), but in the other areas the
farms sizes were the same for both farm types. Farmers had on average 21 years’
experience in cattle keeping. The experience in cattle keeping was not different between
Ongole and crossbred farms within the areas, except in Wet lowlands II where the crossbred
farmers had 4 years less experience in cattle keeping than Ongole farmers. Experience in
cattle keeping differed significantly between the areas with the longest experience in
keeping cattle in the Dry uplands; farmers in this area were also slightly older (58 y) than in
other areas (50 y). However, no differences (P<0.05) were found in uptake of crossbreeding
in relation to experience of cattle keeping. Cattle are the main livestock. Goats, sheep and
chickens are of secondary importance. The herd sizes of Ongole (2.0‐2.5 head) and
crossbred (2.2‐3.2 head) farms were the same in the areas, except in Wet lowlands II where
crossbred farmers had significantly (P<0.05) more cattle (3.2) than Ongole farmers (2.0).
Education level only seemed to have affected uptake of crossbreeding (P<0.05) in the Dry
uplands (Table 3.3.). On average, more than 50% of the cattle were cows.
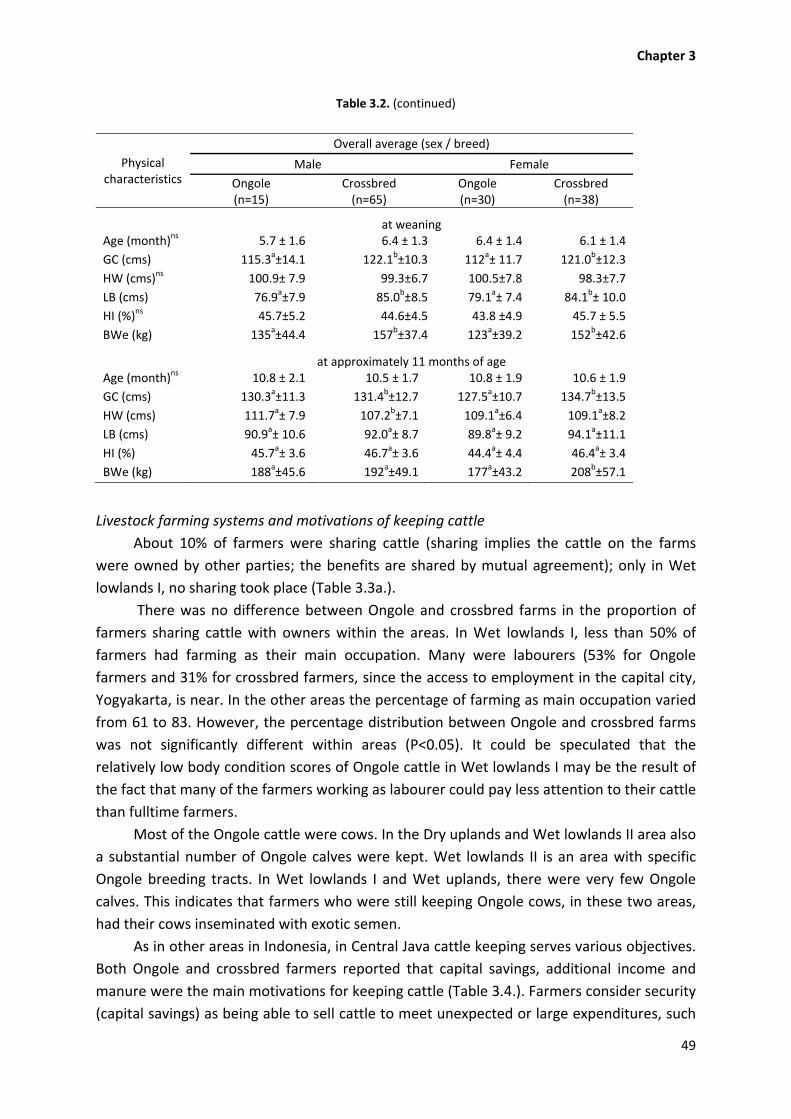
Chapter 3
49
Table 3.2. (continued)
Physical characteristics
Overall average (sex / breed)
Male Female
Ongole (n=15)
Crossbred (n=65)
Ongole (n=30)
Crossbred (n=38)
at weaning
Age (month)ns 5.7 ± 1.6 6.4 ± 1.3 6.4 ± 1.4 6.1 ± 1.4
GC (cms) 115.3a±14.1 122.1b±10.3 112a± 11.7 121.0b±12.3
HW (cms)ns 100.9± 7.9 99.3±6.7 100.5±7.8 98.3±7.7
LB (cms) 76.9a±7.9 85.0b±8.5 79.1a± 7.4 84.1b± 10.0
HI (%)ns 45.7±5.2 44.6±4.5 43.8 ±4.9 45.7 ± 5.5
BWe (kg) 135a±44.4 157b±37.4 123a±39.2 152b±42.6
at approximately 11 months of age
Age (month)ns 10.8 ± 2.1 10.5 ± 1.7 10.8 ± 1.9 10.6 ± 1.9
GC (cms) 130.3a±11.3 131.4b±12.7 127.5a±10.7 134.7b±13.5
HW (cms) 111.7a± 7.9 107.2b±7.1 109.1a±6.4 109.1a±8.2
LB (cms) 90.9a± 10.6 92.0a± 8.7 89.8a± 9.2 94.1a±11.1
HI (%) 45.7a± 3.6 46.7a± 3.6 44.4a± 4.4 46.4a± 3.4
BWe (kg) 188a±45.6 192a±49.1 177a±43.2 208b±57.1
Livestock farming systems and motivations of keeping cattle
About 10% of farmers were sharing cattle (sharing implies the cattle on the farms
were owned by other parties; the benefits are shared by mutual agreement); only in Wet
lowlands I, no sharing took place (Table 3.3a.).
There was no difference between Ongole and crossbred farms in the proportion of
farmers sharing cattle with owners within the areas. In Wet lowlands I, less than 50% of
farmers had farming as their main occupation. Many were labourers (53% for Ongole
farmers and 31% for crossbred farmers, since the access to employment in the capital city,
Yogyakarta, is near. In the other areas the percentage of farming as main occupation varied
from 61 to 83. However, the percentage distribution between Ongole and crossbred farms
was not significantly different within areas (P<0.05). It could be speculated that the
relatively low body condition scores of Ongole cattle in Wet lowlands I may be the result of
the fact that many of the farmers working as labourer could pay less attention to their cattle
than fulltime farmers.
Most of the Ongole cattle were cows. In the Dry uplands and Wet lowlands II area also
a substantial number of Ongole calves were kept. Wet lowlands II is an area with specific
Ongole breeding tracts. In Wet lowlands I and Wet uplands, there were very few Ongole
calves. This indicates that farmers who were still keeping Ongole cows, in these two areas,
had their cows inseminated with exotic semen.
As in other areas in Indonesia, in Central Java cattle keeping serves various objectives.
Both Ongole and crossbred farmers reported that capital savings, additional income and
manure were the main motivations for keeping cattle (Table 3.4.). Farmers consider security
(capital savings) as being able to sell cattle to meet unexpected or large expenditures, such
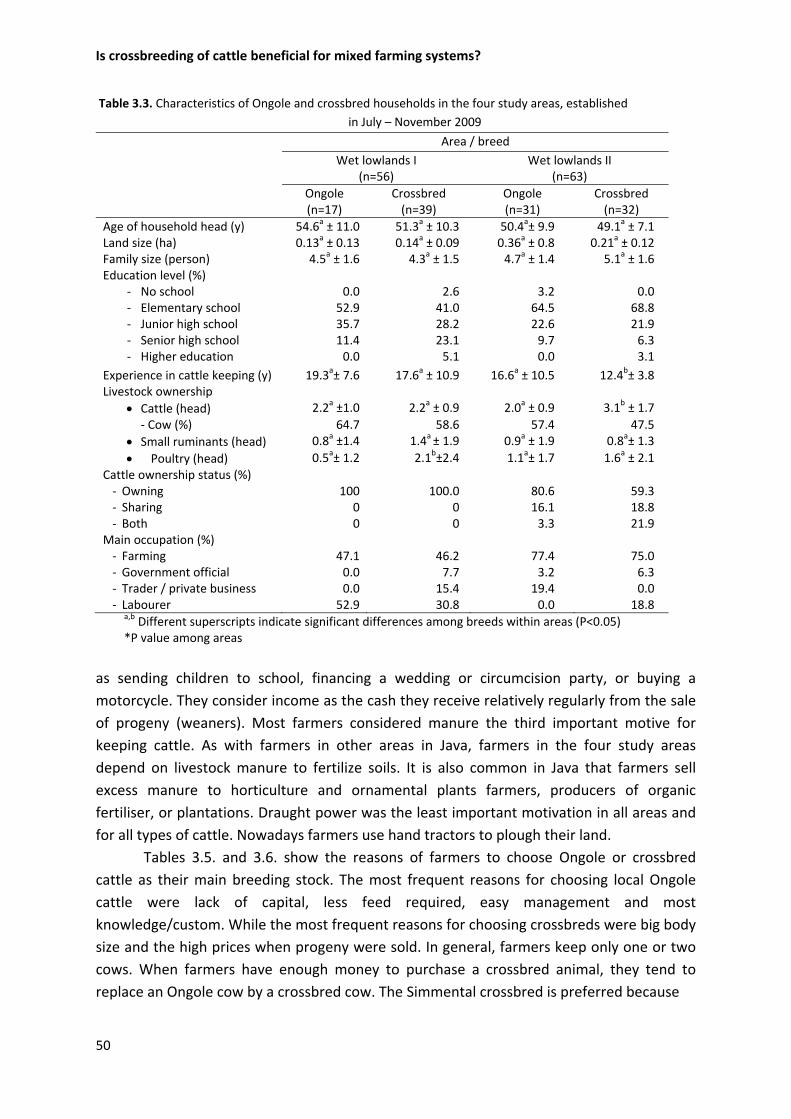
Is crossbreeding of cattle beneficial for mixed farming systems?
50
Table 3.3. Characteristics of Ongole and crossbred households in the four study areas, established
in July – November 2009 Area / breed
Wet lowlands I (n=56)
Wet lowlands II (n=63)
Ongole(n=17)
Crossbred (n=39)
Ongole(n=31)
Crossbred (n=32)
Age of household head (y) 54.6a ± 11.0 51.3a ± 10.3 50.4a± 9.9 49.1a ± 7.1Land size (ha) 0.13a ± 0.13 0.14a ± 0.09 0.36a ± 0.8 0.21a ± 0.12Family size (person) 4.5a ± 1.6 4.3a ± 1.5 4.7a ± 1.4 5.1a ± 1.6Education level (%)
‐ No school 0.0 2.6 3.2 0.0‐ Elementary school 52.9 41.0 64.5 68.8‐ Junior high school 35.7 28.2 22.6 21.9‐ Senior high school 11.4 23.1 9.7 6.3‐ Higher education 0.0 5.1 0.0 3.1
Experience in cattle keeping (y) 19.3a± 7.6 17.6a ± 10.9 16.6a ± 10.5 12.4b± 3.8Livestock ownership
Cattle (head) 2.2a ±1.0 2.2a ± 0.9 2.0a ± 0.9 3.1b ± 1.7
‐ Cow (%) 64.7 58.6 57.4 47.5
Small ruminants (head) 0.8a ±1.4 1.4a ± 1.9 0.9a ± 1.9 0.8a± 1.3 Poultry (head) 0.5a± 1.2 2.1b±2.4 1.1a± 1.7 1.6a ± 2.1
Cattle ownership status (%) ‐ Owning 100 100.0 80.6 59.3‐ Sharing 0 0 16.1 18.8‐ Both 0 0 3.3 21.9
Main occupation (%) ‐ Farming 47.1 46.2 77.4 75.0‐ Government official 0.0 7.7 3.2 6.3‐ Trader / private business 0.0 15.4 19.4 0.0‐ Labourer 52.9 30.8 0.0 18.8
a,b Different superscripts indicate significant differences among breeds within areas (P<0.05) *P value among areas
as sending children to school, financing a wedding or circumcision party, or buying a
motorcycle. They consider income as the cash they receive relatively regularly from the sale
of progeny (weaners). Most farmers considered manure the third important motive for
keeping cattle. As with farmers in other areas in Java, farmers in the four study areas
depend on livestock manure to fertilize soils. It is also common in Java that farmers sell
excess manure to horticulture and ornamental plants farmers, producers of organic
fertiliser, or plantations. Draught power was the least important motivation in all areas and
for all types of cattle. Nowadays farmers use hand tractors to plough their land.
Tables 3.5. and 3.6. show the reasons of farmers to choose Ongole or crossbred
cattle as their main breeding stock. The most frequent reasons for choosing local Ongole
cattle were lack of capital, less feed required, easy management and most
knowledge/custom. While the most frequent reasons for choosing crossbreds were big body
size and the high prices when progeny were sold. In general, farmers keep only one or two
cows. When farmers have enough money to purchase a crossbred animal, they tend to
replace an Ongole cow by a crossbred cow. The Simmental crossbred is preferred because
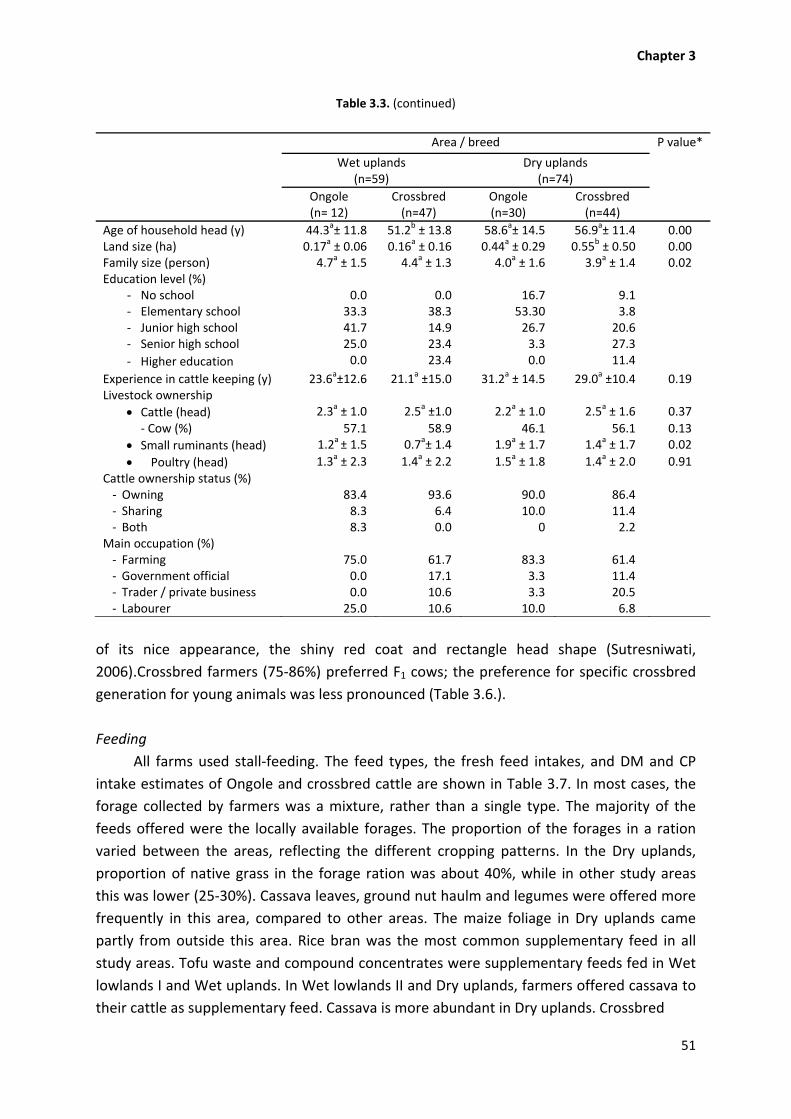
Chapter 3
51
Table 3.3. (continued)
Area / breed P value*
Wet uplands (n=59)
Dry uplands (n=74)
Ongole(n= 12)
Crossbred(n=47)
Ongole(n=30)
Crossbred (n=44)
Age of household head (y) 44.3a± 11.8 51.2b ± 13.8 58.6a± 14.5 56.9a± 11.4 0.00Land size (ha) 0.17a ± 0.06 0.16a ± 0.16 0.44a ± 0.29 0.55b ± 0.50 0.00Family size (person) 4.7a ± 1.5 4.4a ± 1.3 4.0a ± 1.6 3.9a ± 1.4 0.02Education level (%)
‐ No school 0.0 0.0 16.7 9.1 ‐ Elementary school 33.3 38.3 53.30 3.8 ‐ Junior high school 41.7 14.9 26.7 20.6 ‐ Senior high school 25.0 23.4 3.3 27.3
‐ Higher education 0.0 23.4 0.0 11.4
Experience in cattle keeping (y) 23.6a±12.6 21.1a ±15.0 31.2a ± 14.5 29.0a ±10.4 0.19Livestock ownership
Cattle (head) 2.3a ± 1.0 2.5a ±1.0 2.2a ± 1.0 2.5a ± 1.6 0.37
‐ Cow (%) 57.1 58.9 46.1 56.1 0.13
Small ruminants (head) 1.2a ± 1.5 0.7a± 1.4 1.9a ± 1.7 1.4a ± 1.7 0.02
Poultry (head) 1.3a ± 2.3 1.4a ± 2.2 1.5a ± 1.8 1.4a ± 2.0 0.91
Cattle ownership status (%) ‐ Owning 83.4 93.6 90.0 86.4 ‐ Sharing 8.3 6.4 10.0 11.4 ‐ Both 8.3 0.0 0 2.2
Main occupation (%) ‐ Farming 75.0 61.7 83.3 61.4 ‐ Government official 0.0 17.1 3.3 11.4 ‐ Trader / private business 0.0 10.6 3.3 20.5 ‐ Labourer 25.0 10.6 10.0 6.8
of its nice appearance, the shiny red coat and rectangle head shape (Sutresniwati,
2006).Crossbred farmers (75‐86%) preferred F1 cows; the preference for specific crossbred
generation for young animals was less pronounced (Table 3.6.).
Feeding
All farms used stall‐feeding. The feed types, the fresh feed intakes, and DM and CP
intake estimates of Ongole and crossbred cattle are shown in Table 3.7. In most cases, the
forage collected by farmers was a mixture, rather than a single type. The majority of the
feeds offered were the locally available forages. The proportion of the forages in a ration
varied between the areas, reflecting the different cropping patterns. In the Dry uplands,
proportion of native grass in the forage ration was about 40%, while in other study areas
this was lower (25‐30%). Cassava leaves, ground nut haulm and legumes were offered more
frequently in this area, compared to other areas. The maize foliage in Dry uplands came
partly from outside this area. Rice bran was the most common supplementary feed in all
study areas. Tofu waste and compound concentrates were supplementary feeds fed in Wet
lowlands I and Wet uplands. In Wet lowlands II and Dry uplands, farmers offered cassava to
their cattle as supplementary feed. Cassava is more abundant in Dry uplands. Crossbred
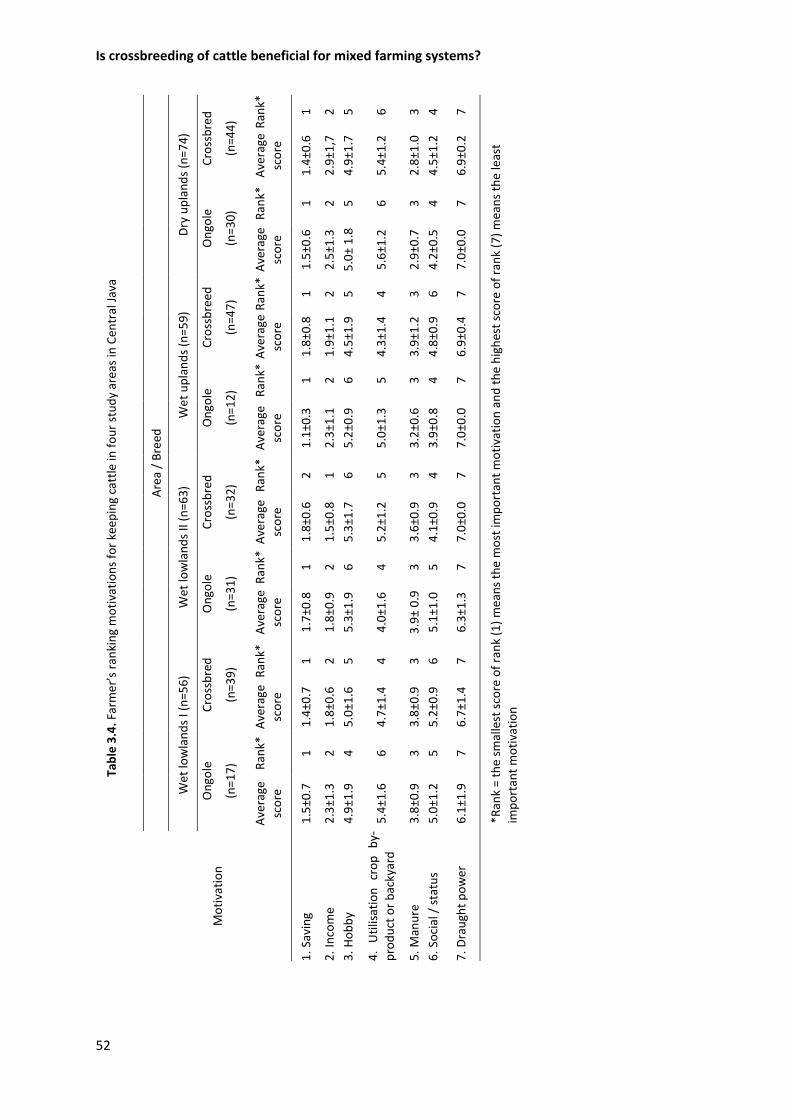
Is crossbreeding of cattle beneficial for mixed farming systems?
52
Table 3.4. Farmer’s ranking motivations for keep
ing cattle in
four study areas in Cen
tral Java
Area / Breed
Dry uplands (n=74)
Crossbred
(n=44) Rank*
1
2
5
6
3
4
7
*Rank = the sm
allest score of rank (1) means the most im
portant motivation and the highest score of rank (7) means the least
important motivation
Average
score
1.4±0.6
2.9±1,7
4.9±1.7
5.4±1.2
2.8±1.0
4.5±1.2
6.9±0.2
Ongole
(n=30) Rank*
1
2
5
6
3
4
7
Average
score
1.5±0.6
2.5±1.3
5.0± 1.8
5.6±1.2
2.9±0.7
4.2±0.5
7.0±0.0
Wet uplands (n=59)
Crossbreed
(n=47)
Rank*
1
2
5
4
3
6
7
Average
score
1.8±0.8
1.9±1.1
4.5±1.9
4.3±1.4
3.9±1.2
4.8±0.9
6.9±0.4
Ongole
(n=12) Rank*
1
2
6
5
3
4
7
Average
score
1.1±0.3
2.3±1.1
5.2±0.9
5.0±1.3
3.2±0.6
3.9±0.8
7.0±0.0
Wet lowlands II (n=63)
Crossbred
(n=32) Rank*
2
1
6
5
3
4
7
Average
score
1.8±0.6
1.5±0.8
5.3±1.7
5.2±1.2
3.6±0.9
4.1±0.9
7.0±0.0
Ongole
(n=31) Rank*
1
2
6
4
3
5
7
Average
score
1.7±0.8
1.8±0.9
5.3±1.9
4.0±1.6
3.9± 0.9
5.1±1.0
6.3±1.3
Wet lowlands I (n=56)
Crossbred
(n=39) Rank*
1
2
5
4
3
6
7
Average
score
1.4±0.7
1.8±0.6
5.0±1.6
4.7±1.4
3.8±0.9
5.2±0.9
6.7±1.4
Ongole
(n=17) Rank*
1
2
4
6
3
5
7
Average
score
1.5±0.7
2.3±1.3
4.9±1.9
5.4±1.6
3.8±0.9
5.0±1.2
6.1±1.9
Motivation
1. Saving
2. Income
3. H
obby
4. Utilisation crop by‐
product or backyard
5. M
anure
6. Social / status
7. D
raught power
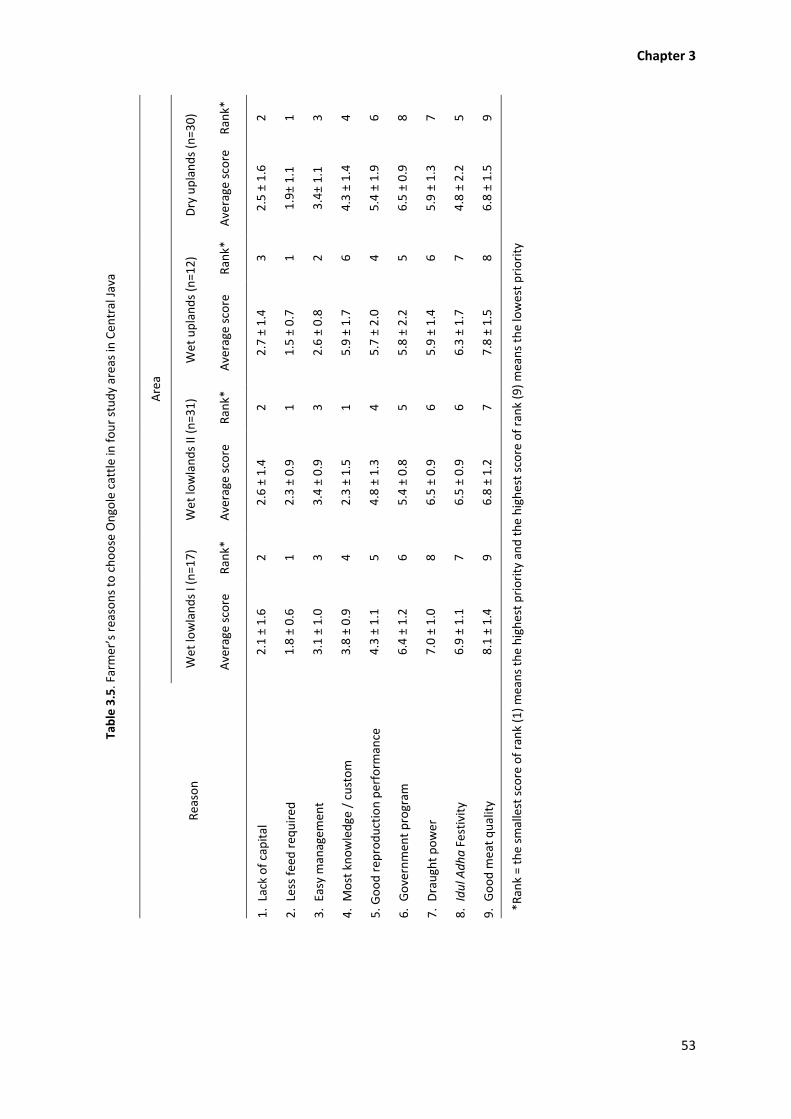
Chapter 3
53
Table 3.5. Farmer’s reasons to choose Ongole cattle in four study areas in Cen
tral Java
Area
Dry uplands (n=30)
Rank*
2
1
3
4
6
8
7
5
9
*Rank = the sm
allest score of rank (1) means the highest priority and the highest score of rank (9) means the lowest priority
Average score
2.5 ± 1.6
1.9± 1.1
3.4± 1.1
4.3 ± 1.4
5.4 ± 1.9
6.5 ± 0.9
5.9 ± 1.3
4.8 ± 2.2
6.8 ± 1.5
Wet uplands (n=12)
Rank*
3
1
2
6
4
5
6
7
8
Average score
2.7 ± 1.4
1.5 ± 0.7
2.6 ± 0.8
5.9 ± 1.7
5.7 ± 2.0
5.8 ± 2.2
5.9 ± 1.4
6.3 ± 1.7
7.8 ± 1.5
Wet lowlands II (n=31)
Rank*
2
1
3
1
4
5
6
6
7
Average score
2.6 ± 1.4
2.3 ± 0.9
3.4 ± 0.9
2.3 ± 1.5
4.8 ± 1.3
5.4 ± 0.8
6.5 ± 0.9
6.5 ± 0.9
6.8 ± 1.2
Wet lowlands I (n=17)
Rank*
2
1
3
4
5
6
8
7
9
Average score
2.1 ± 1.6
1.8 ± 0.6
3.1 ± 1.0
3.8 ± 0.9
4.3 ± 1.1
6.4 ± 1.2
7.0 ± 1.0
6.9 ± 1.1
8.1 ± 1.4
Reason
1. Lack of capital
2. Less feed req
uired
3. Easy m
anagem
ent
4. Most knowledge / custom
5. G
ood rep
roduction perform
ance
6. Governmen
t program
7. Draught power
8. Idul A
dha Festivity
9. Good m
eat quality
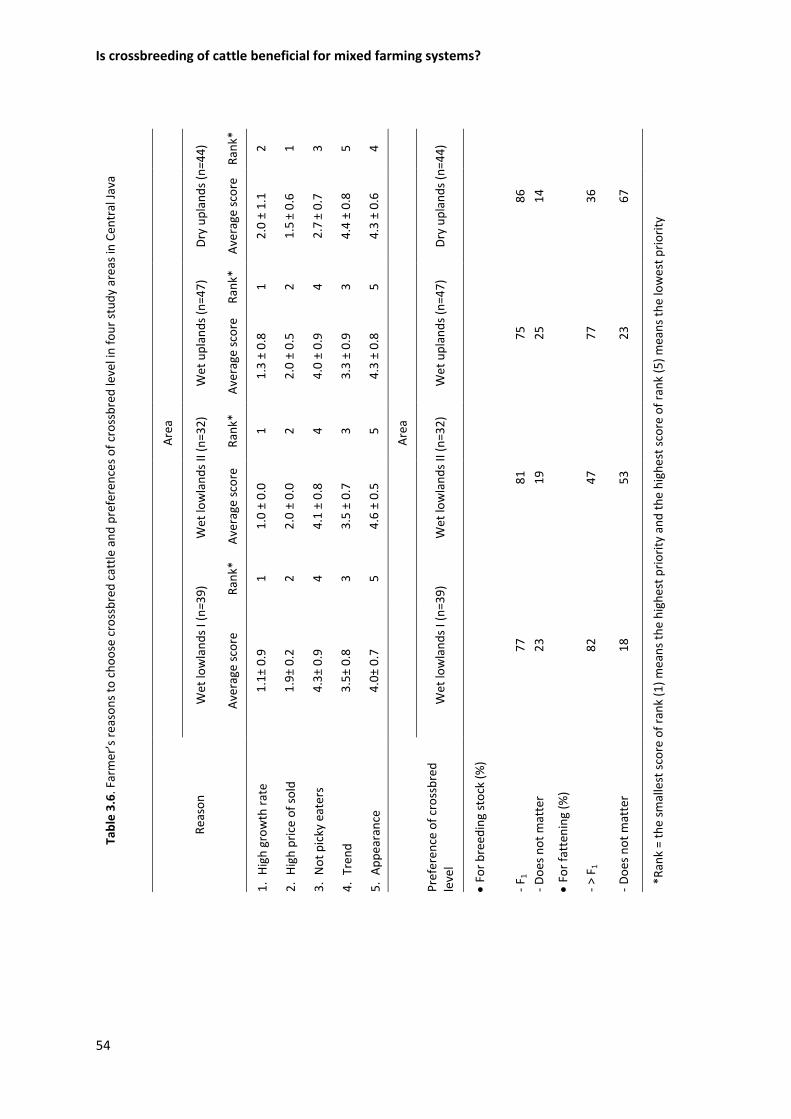
Is crossbreeding of cattle beneficial for mixed farming systems?
54
Table 3.6. Farmer’s reasons to choose crossbred cattle and preferences of crossbred level in four study areas in Cen
tral Java
Area
Dry uplands (n=44)
Rank*
2
1
3
5
4
Area
Dry uplands (n=44)
86
14
36
67
*Rank = the sm
allest score of rank (1) means the highest priority and the highest score of rank (5) means the lowest priority
Average score
2.0 ± 1.1
1.5
± 0.6
2.7
± 0.7
4.4 ± 0.8
4.3 ± 0.6
Wet uplands (n=47)
Rank*
1
2
4
3
5
Wet uplands (n=47)
75
25
77
23
Average score
1.3 ± 0.8
2.0 ± 0.5
4.0 ± 0.9
3.3 ± 0.9
4.3 ± 0.8
Wet lowlands II (n=32)
Rank*
1
2
4
3
5
Wet lowlands II (n=32)
81
19
47
53
Average score
1.0 ± 0.0
2.0 ± 0.0
4.1 ± 0.8
3.5 ± 0.7
4.6 ± 0.5
Wet lowlands I (n=39) Rank*
1
2
4
3
5
Wet lowlands I (n=39)
77
23
82
18
Average score
1.1± 0.9
1.9± 0.2
4.3± 0.9
3.5± 0.8
4.0± 0.7
Reason
1. High growth rate
2. High price of sold
3. Not picky eaters
4. Tren
d
5. Appearance
Preference of crossbred
level
For breed
ing stock (%)
‐ F 1
‐ Does not matter
For fatten
ing (%
)
‐ > F 1
‐ Does not matter
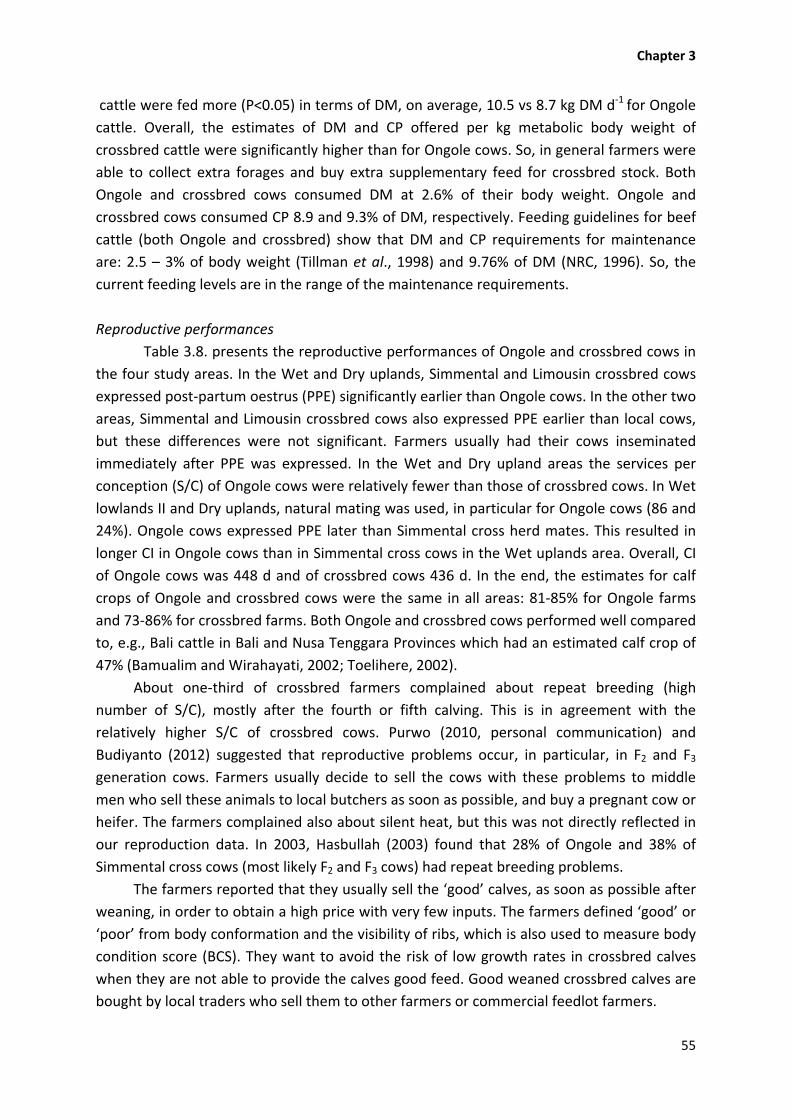
Chapter 3
55
cattle were fed more (P<0.05) in terms of DM, on average, 10.5 vs 8.7 kg DM d‐1 for Ongole
cattle. Overall, the estimates of DM and CP offered per kg metabolic body weight of
crossbred cattle were significantly higher than for Ongole cows. So, in general farmers were
able to collect extra forages and buy extra supplementary feed for crossbred stock. Both
Ongole and crossbred cows consumed DM at 2.6% of their body weight. Ongole and
crossbred cows consumed CP 8.9 and 9.3% of DM, respectively. Feeding guidelines for beef
cattle (both Ongole and crossbred) show that DM and CP requirements for maintenance
are: 2.5 – 3% of body weight (Tillman et al., 1998) and 9.76% of DM (NRC, 1996). So, the
current feeding levels are in the range of the maintenance requirements.
Reproductive performances
Table 3.8. presents the reproductive performances of Ongole and crossbred cows in
the four study areas. In the Wet and Dry uplands, Simmental and Limousin crossbred cows
expressed post‐partum oestrus (PPE) significantly earlier than Ongole cows. In the other two
areas, Simmental and Limousin crossbred cows also expressed PPE earlier than local cows,
but these differences were not significant. Farmers usually had their cows inseminated
immediately after PPE was expressed. In the Wet and Dry upland areas the services per
conception (S/C) of Ongole cows were relatively fewer than those of crossbred cows. In Wet
lowlands II and Dry uplands, natural mating was used, in particular for Ongole cows (86 and
24%). Ongole cows expressed PPE later than Simmental cross herd mates. This resulted in
longer CI in Ongole cows than in Simmental cross cows in the Wet uplands area. Overall, CI
of Ongole cows was 448 d and of crossbred cows 436 d. In the end, the estimates for calf
crops of Ongole and crossbred cows were the same in all areas: 81‐85% for Ongole farms
and 73‐86% for crossbred farms. Both Ongole and crossbred cows performed well compared
to, e.g., Bali cattle in Bali and Nusa Tenggara Provinces which had an estimated calf crop of
47% (Bamualim and Wirahayati, 2002; Toelihere, 2002).
About one‐third of crossbred farmers complained about repeat breeding (high
number of S/C), mostly after the fourth or fifth calving. This is in agreement with the
relatively higher S/C of crossbred cows. Purwo (2010, personal communication) and
Budiyanto (2012) suggested that reproductive problems occur, in particular, in F2 and F3
generation cows. Farmers usually decide to sell the cows with these problems to middle
men who sell these animals to local butchers as soon as possible, and buy a pregnant cow or
heifer. The farmers complained also about silent heat, but this was not directly reflected in
our reproduction data. In 2003, Hasbullah (2003) found that 28% of Ongole and 38% of
Simmental cross cows (most likely F2 and F3 cows) had repeat breeding problems.
The farmers reported that they usually sell the ‘good’ calves, as soon as possible after
weaning, in order to obtain a high price with very few inputs. The farmers defined ‘good’ or
‘poor’ from body conformation and the visibility of ribs, which is also used to measure body
condition score (BCS). They want to avoid the risk of low growth rates in crossbred calves
when they are not able to provide the calves good feed. Good weaned crossbred calves are
bought by local traders who sell them to other farmers or commercial feedlot farmers.
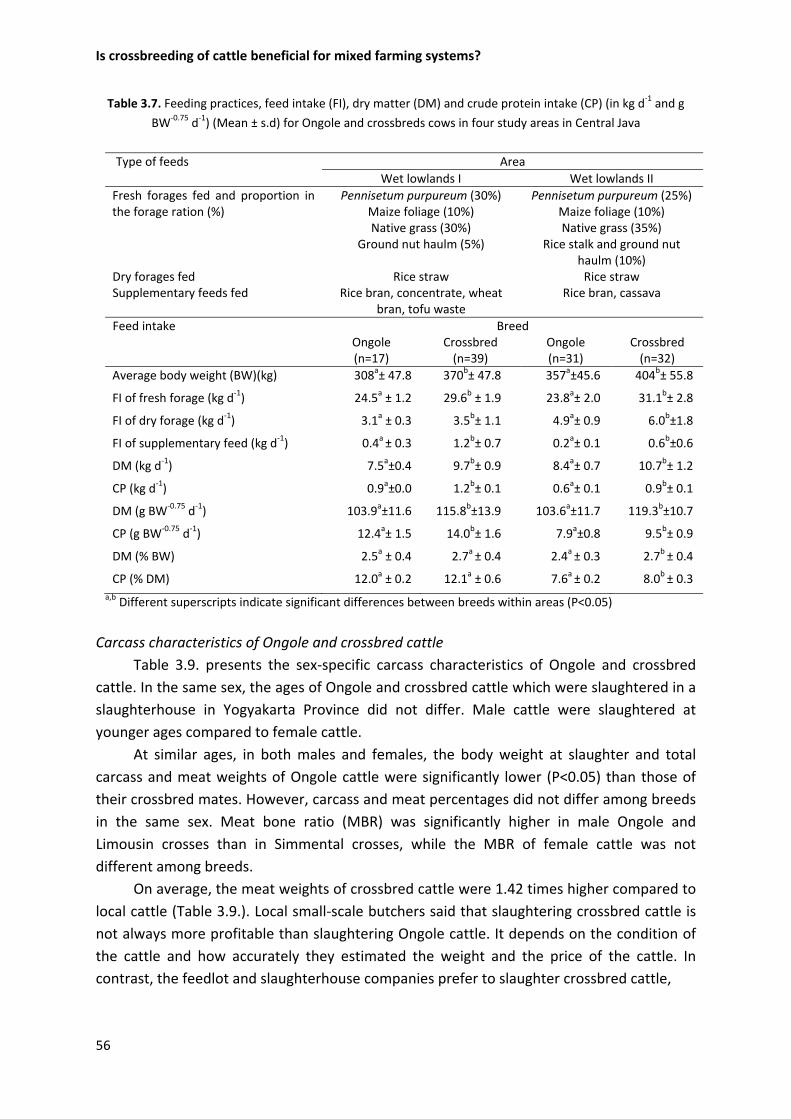
Is crossbreeding of cattle beneficial for mixed farming systems?
56
Table 3.7. Feeding practices, feed intake (FI), dry matter (DM) and crude protein intake (CP) (in kg d‐1 and g
BW‐0.75 d‐1) (Mean ± s.d) for Ongole and crossbreds cows in four study areas in Central Java
Type of feeds Area
Wet lowlands I Wet lowlands II
Fresh forages fed and proportion in the forage ration (%)
Pennisetum purpureum (30%) Pennisetum purpureum (25%)Maize foliage (10%) Maize foliage (10%)Native grass (30%) Native grass (35%)
Ground nut haulm (5%) Rice stalk and ground nut haulm (10%)
Dry forages fed Rice straw Rice straw Supplementary feeds fed Rice bran, concentrate, wheat
bran, tofu waste Rice bran, cassava
Feed intake BreedOngole(n=17)
Crossbred(n=39)
Ongole (n=31)
Crossbred (n=32)
Average body weight (BW)(kg) 308a± 47.8 370b± 47.8 357a±45.6 404b± 55.8
FI of fresh forage (kg d‐1) 24.5a ± 1.2 29.6b ± 1.9 23.8a± 2.0 31.1b± 2.8
FI of dry forage (kg d‐1) 3.1a ± 0.3 3.5b± 1.1 4.9a± 0.9 6.0b±1.8
FI of supplementary feed (kg d‐1) 0.4a ± 0.3 1.2b± 0.7 0.2a± 0.1 0.6b±0.6
DM (kg d‐1) 7.5a±0.4 9.7b± 0.9 8.4a± 0.7 10.7b± 1.2
CP (kg d‐1) 0.9a±0.0 1.2b± 0.1 0.6a± 0.1 0.9b± 0.1
DM (g BW‐0.75 d‐1) 103.9a±11.6 115.8b±13.9 103.6a±11.7 119.3b±10.7
CP (g BW‐0.75 d‐1) 12.4a± 1.5 14.0b± 1.6 7.9a±0.8 9.5b± 0.9
DM (% BW) 2.5a ± 0.4 2.7a ± 0.4 2.4a ± 0.3 2.7b ± 0.4
CP (% DM) 12.0a ± 0.2 12.1a ± 0.6 7.6a ± 0.2 8.0b ± 0.3
a,b Different superscripts indicate significant differences between breeds within areas (P<0.05)
Carcass characteristics of Ongole and crossbred cattle
Table 3.9. presents the sex‐specific carcass characteristics of Ongole and crossbred
cattle. In the same sex, the ages of Ongole and crossbred cattle which were slaughtered in a
slaughterhouse in Yogyakarta Province did not differ. Male cattle were slaughtered at
younger ages compared to female cattle.
At similar ages, in both males and females, the body weight at slaughter and total
carcass and meat weights of Ongole cattle were significantly lower (P<0.05) than those of
their crossbred mates. However, carcass and meat percentages did not differ among breeds
in the same sex. Meat bone ratio (MBR) was significantly higher in male Ongole and
Limousin crosses than in Simmental crosses, while the MBR of female cattle was not
different among breeds.
On average, the meat weights of crossbred cattle were 1.42 times higher compared to
local cattle (Table 3.9.). Local small‐scale butchers said that slaughtering crossbred cattle is
not always more profitable than slaughtering Ongole cattle. It depends on the condition of
the cattle and how accurately they estimated the weight and the price of the cattle. In
contrast, the feedlot and slaughterhouse companies prefer to slaughter crossbred cattle,
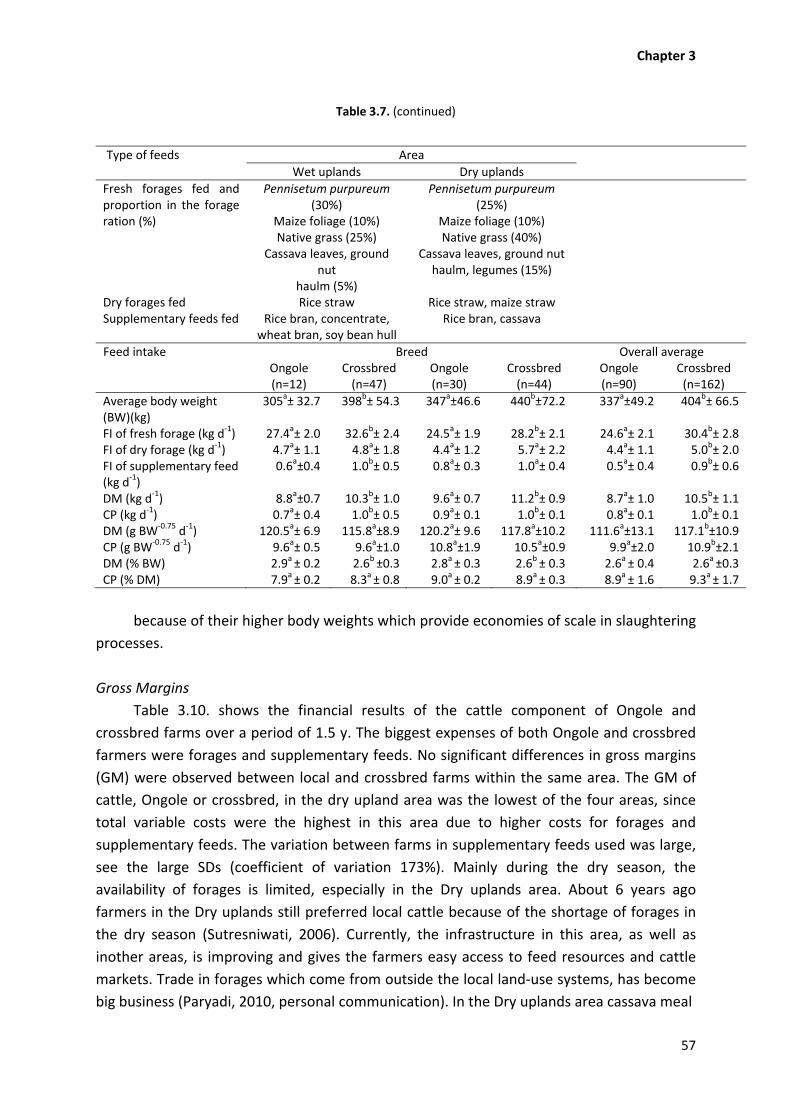
Chapter 3
57
Table 3.7. (continued)
Type of feeds Area
Wet uplands Dry uplands
Fresh forages fed and proportion in the forage ration (%)
Pennisetum purpureum (30%)
Pennisetum purpureum (25%)
Maize foliage (10%) Maize foliage (10%)Native grass (25%) Native grass (40%)
Cassava leaves, ground nut
haulm (5%)
Cassava leaves, ground nut haulm, legumes (15%)
Dry forages fed Rice straw Rice straw, maize strawSupplementary feeds fed Rice bran, concentrate,
wheat bran, soy bean hull Rice bran, cassava
Feed intake Breed Overall average Ongole
(n=12) Crossbred(n=47)
Ongole(n=30)
Crossbred (n=44)
Ongole (n=90)
Crossbred(n=162)
Average body weight (BW)(kg)
305a± 32.7 398b± 54.3 347a±46.6 440b±72.2 337a±49.2 404b± 66.5
FI of fresh forage (kg d‐1) 27.4a± 2.0 32.6b± 2.4 24.5a± 1.9 28.2b± 2.1 24.6a± 2.1 30.4b± 2.8FI of dry forage (kg d‐1) 4.7a± 1.1 4.8a± 1.8 4.4a± 1.2 5.7a± 2.2 4.4a± 1.1 5.0b± 2.0FI of supplementary feed (kg d‐1)
0.6a±0.4 1.0b± 0.5 0.8a± 0.3 1.0a± 0.4 0.5a± 0.4 0.9b± 0.6
DM (kg d‐1) 8.8a±0.7 10.3b± 1.0 9.6a± 0.7 11.2b± 0.9 8.7a± 1.0 10.5b± 1.1CP (kg d‐1) 0.7a± 0.4 1.0b± 0.5 0.9a± 0.1 1.0b± 0.1 0.8a± 0.1 1.0b± 0.1DM (g BW‐0.75 d‐1) 120.5a± 6.9 115.8a±8.9 120.2a± 9.6 117.8a±10.2 111.6a±13.1 117.1b±10.9CP (g BW‐0.75 d‐1) 9.6a± 0.5 9.6a±1.0 10.8a±1.9 10.5a±0.9 9.9a±2.0 10.9b±2.1DM (% BW) 2.9a ± 0.2 2.6b ±0.3 2.8a ± 0.3 2.6b ± 0.3 2.6a ± 0.4 2.6a ±0.3CP (% DM) 7.9a ± 0.2 8.3a ± 0.8 9.0a ± 0.2 8.9a ± 0.3 8.9a ± 1.6 9.3a ± 1.7
because of their higher body weights which provide economies of scale in slaughtering
processes.
Gross Margins
Table 3.10. shows the financial results of the cattle component of Ongole and
crossbred farms over a period of 1.5 y. The biggest expenses of both Ongole and crossbred
farmers were forages and supplementary feeds. No significant differences in gross margins
(GM) were observed between local and crossbred farms within the same area. The GM of
cattle, Ongole or crossbred, in the dry upland area was the lowest of the four areas, since
total variable costs were the highest in this area due to higher costs for forages and
supplementary feeds. The variation between farms in supplementary feeds used was large,
see the large SDs (coefficient of variation 173%). Mainly during the dry season, the
availability of forages is limited, especially in the Dry uplands area. About 6 years ago
farmers in the Dry uplands still preferred local cattle because of the shortage of forages in
the dry season (Sutresniwati, 2006). Currently, the infrastructure in this area, as well as
inother areas, is improving and gives the farmers easy access to feed resources and cattle
markets. Trade in forages which come from outside the local land‐use systems, has become
big business (Paryadi, 2010, personal communication). In the Dry uplands area cassava meal

Is crossbreeding of cattle beneficial for mixed farming systems?
58
Table 3.8. R
eproductive perform
ances (M
ean ± s.d) of Ongole and crossbred cows in four study areas in Cen
tral Java, over the period January 2010 – July 2011
Area / Breed
Dry uplands
(n=67)
Lim‐cross
2
(n=9)
97.8
b ± 50.5
140.7
a,b ± 55.4
2.0
a ± 0.9
447.8
a ± 56.2
2.9
b ± 0.6
6.0
a ± 0.9
73.0 ± 22.3
100
0
0
1Sim‐cross = Sim
men
tal cross; 2Lim‐cross= Limousin cross; PPE=
post‐partum estrus; PPM= post‐partum m
ating; S/C= services per conception; C
I=calving
interval; W
A=w
eaning age
BCS= Body condition score, is visual assessm
ent of body tissues (Ferguson et al., 1994 cited
by Lassen
et al., 2003). The range is 1 – 5, w
here 1 is the lowest
and 5 is the highest (Baliarti, 1999)
AI = artificial insemination; a
,b different superscripts indicate significant differences am
ong breed
s within the same area (P<0.05); ns non‐significant
Sim‐cross
(n=33)
112.7
b ± 49.6
119.5
b ± 52.4
3.1
b ± 2.2
446.2
a ± 73.7
2.8
b± 0.4
6.1
a ± 1.0
75.5 ± 26.7
98
0
2
Ongole
(n=25)
151.2
a ± 63.8
153.2
a ± 62.3
2.0
a ± 0.9
459.5
a ± 64.3
2.4
a ± 0.3
5.9
a ± 2.3
80.8 ± 10.6
40
24
36
Wet uplands
(n=62) Sim‐cross
1
(n=43)
103.0
b ± 45.8
115.7
b ±43.5
2.4
b ± 1.3
428.2
b ± 48.1
2.7
b ± 0.5
4.3
b ± 1.2
86.2 ± 8.7
100
0
0
Ongole
(n=19)
151.2
a ± 61.6
155.6
a ± 58.3
1.9
a ± 0.9
457.7
a ± 65.8
2.0
a ± 0.3
4.9
a ± 2.0
81.2 ± 10.8
100
0
0
Wet lowlands II
(n=80) Sim‐cross
1
(n=32)
117.2
a ± 29.4
123.8
a ± 31.6
2.3
a ± 1.1
435.0
a ± 38.7
2.9
a ± 0.3
3.9
a ± 0.7
84.6 ± 7.8
100
0
0
Ongole
(n=48)
121.9
a ± 37.8
130.0
a ± 36.3
1.9
a ± 1.3
433.3
a ± 47.4
2.6
a ± 0.4
4.0
a ± 0.7
85.3 ± 10.1
8
86
6
Wet lowlands I
(n=61) Si
m‐cross
1
(n=39)
99.2
b ± 36.0
101.1
a ± 35.8
2.8
a ± 1.9
422.1
a ± 53.3
2.9
a ± 0.5
5.1
a ± 1.6
85.8 ± 17.2
100
0
0
Ongole
(n=22)
122.7
a ± 52.9
128.2
a ± 51.5
2.2
a ± 1.0
440.2
a ± 58.9
2.8
a ±0.4
4.6
a ± 0.6
84.5 ± 12.1
100
0
0
Rep
roductive
perform
ance param
eter
PPE (days)
PPM (days)
S/C
CI (days)
BCS
WA (months)
Calf crop (%/y)ns
Methods of mating (%
)
AI
Natural
Mix (AI and natural)
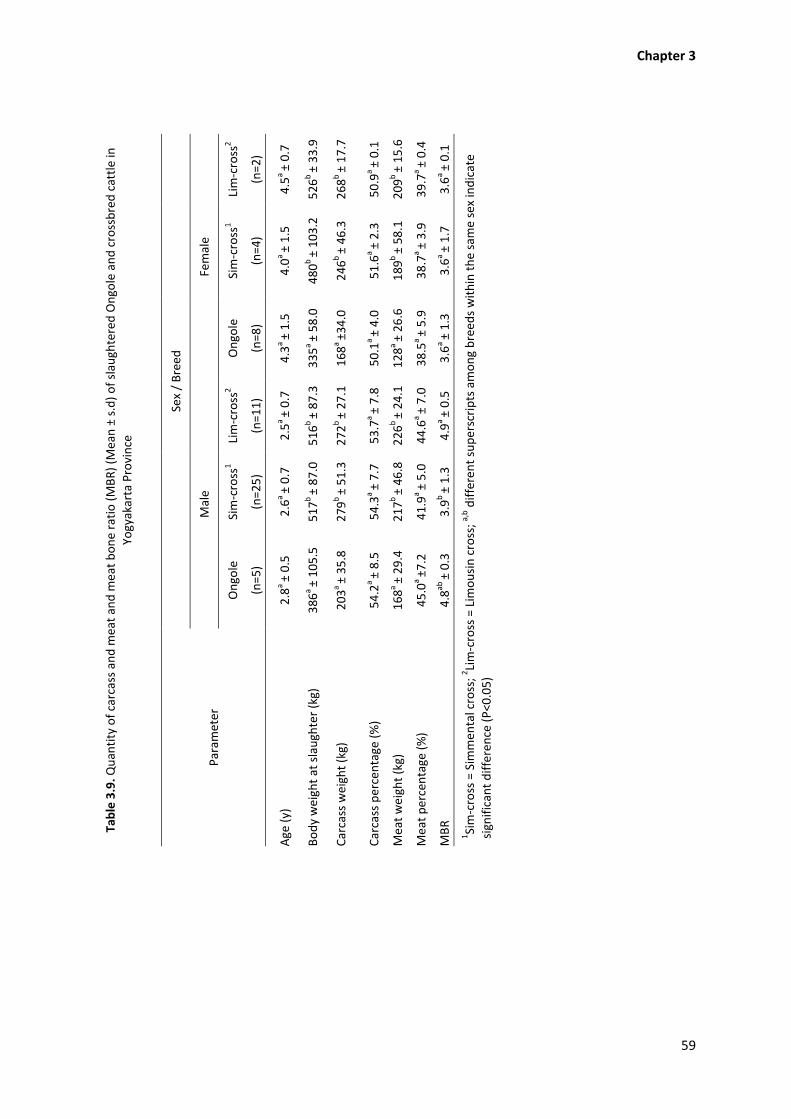
Chapter 3
59
Table 3.9. Q
uantity of carcass and m
eat and m
eat bone ratio (MBR) (M
ean ± s.d) of slaughtered Ongole and crossbred cattle in
Yogyakarta Province
Sex / Breed
Female
Lim‐cross
2
(n=2)
4.5
a ± 0.7
526b ± 33.9
268b ± 17.7
50.9
a ± 0.1
209b ± 15.6
39.7
a ± 0.4
3.6
a ± 0.1
1Sim‐cross = Sim
men
tal cross; 2Lim‐cross = Lim
ousin cross; a
,b different superscripts among breed
s within the same sex indicate
significant difference (P<0.05)
Sim‐cross
1
(n=4)
4.0
a ± 1.5
480b ± 103.2
246b ± 46.3
51.6
a ± 2.3
189b ± 58.1
38.7
a ± 3.9
3.6
a ± 1.7
Ongole
(n=8)
4.3
a ± 1.5
335a ± 58.0
168a ±34.0
50.1
a ± 4.0
128a ± 26.6
38.5
a ± 5.9
3.6
a ± 1.3
Male
Lim‐cross
2
(n=11)
2.5
a ± 0.7
516b ± 87.3
272b ± 27.1
53.7
a ± 7.8
226b ± 24.1
44.6
a ± 7.0
4.9
a ± 0.5
Sim‐cross
1
(n=25)
2.6
a ± 0.7
517b ± 87.0
279b ± 51.3
54.3
a ± 7.7
217b ± 46.8
41.9
a ± 5.0
3.9
b ± 1.3
Ongole
(n=5)
2.8
a ± 0.5
386a ± 105.5
203a ± 35.8
54.2
a ± 8.5
168a ± 29.4
45.0
a ±7.2
4.8
ab ± 0.3
Param
eter
Age (y)
Body weight at slaughter (kg)
Carcass weight (kg)
Carcass percentage (%)
Meat weight (kg)
Meat percentage (%)
MBR
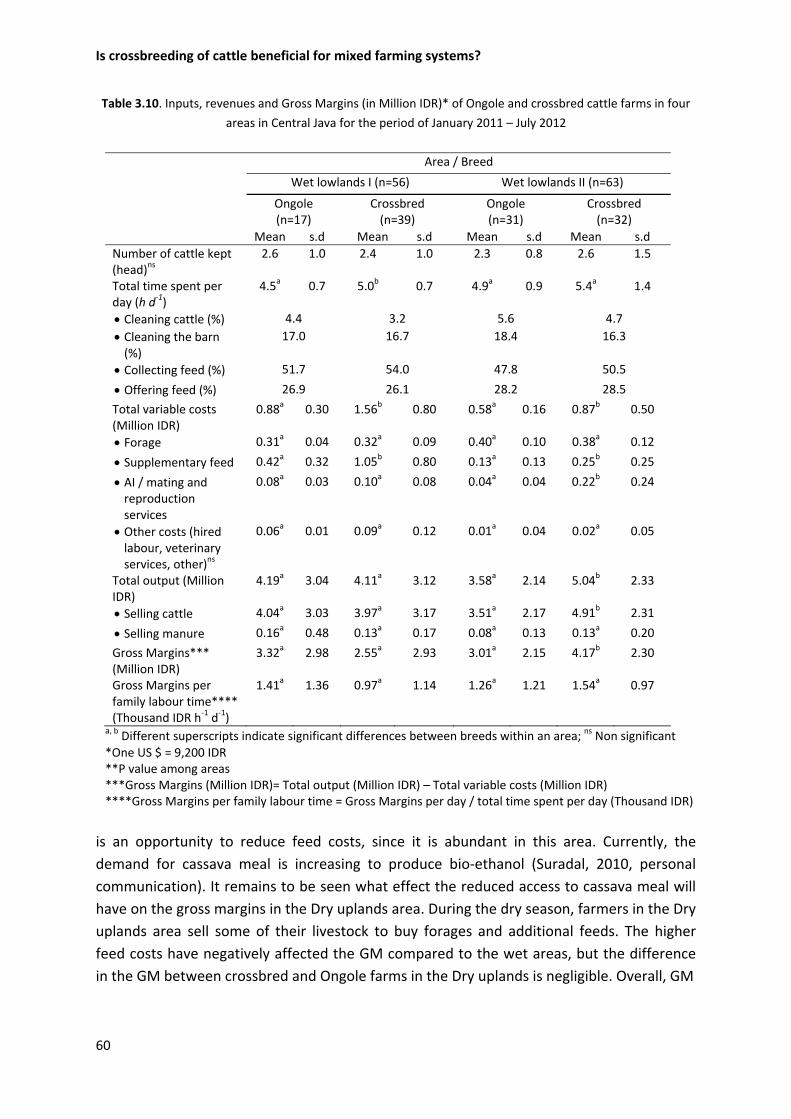
Is crossbreeding of cattle beneficial for mixed farming systems?
60
Table 3.10. Inputs, revenues and Gross Margins (in Million IDR)* of Ongole and crossbred cattle farms in four
areas in Central Java for the period of January 2011 – July 2012
Area / Breed
Wet lowlands I (n=56) Wet lowlands II (n=63)
Ongole (n=17)
Crossbred(n=39)
Ongole(n=31)
Crossbred (n=32)
Mean s.d Mean s.d Mean s.d Mean s.d
Number of cattle kept (head)ns
2.6 1.0 2.4 1.0 2.3 0.8 2.6 1.5
Total time spent per day (h d‐1)
4.5a 0.7 5.0b 0.7 4.9a 0.9 5.4a 1.4
Cleaning cattle (%) 4.4 3.2 5.6 4.7
Cleaning the barn (%)
17.0 16.7 18.4 16.3
Collecting feed (%) 51.7 54.0 47.8 50.5
Offering feed (%) 26.9 26.1 28.2 28.5
Total variable costs (Million IDR)
0.88a 0.30 1.56b 0.80 0.58a 0.16 0.87b 0.50
Forage 0.31a 0.04 0.32a 0.09 0.40a 0.10 0.38a 0.12
Supplementary feed 0.42a 0.32 1.05b 0.80 0.13a 0.13 0.25b 0.25
AI / mating and reproduction services
0.08a 0.03 0.10a 0.08 0.04a 0.04 0.22b 0.24
Other costs (hired labour, veterinary services, other)ns
0.06a 0.01 0.09a 0.12 0.01a 0.04 0.02a 0.05
Total output (Million IDR)
4.19a 3.04 4.11a 3.12 3.58a 2.14 5.04b 2.33
Selling cattle 4.04a 3.03 3.97a 3.17 3.51a 2.17 4.91b 2.31
Selling manure 0.16a 0.48 0.13a 0.17 0.08a 0.13 0.13a 0.20
Gross Margins*** (Million IDR)
3.32a 2.98 2.55a 2.93 3.01a 2.15 4.17b 2.30
Gross Margins per family labour time**** (Thousand IDR h‐1 d‐1)
1.41a 1.36 0.97a 1.14 1.26a 1.21 1.54a 0.97
a, b Different superscripts indicate significant differences between breeds within an area; ns Non significant *One US $ = 9,200 IDR **P value among areas ***Gross Margins (Million IDR)= Total output (Million IDR) – Total variable costs (Million IDR) ****Gross Margins per family labour time = Gross Margins per day / total time spent per day (Thousand IDR)
is an opportunity to reduce feed costs, since it is abundant in this area. Currently, the
demand for cassava meal is increasing to produce bio‐ethanol (Suradal, 2010, personal
communication). It remains to be seen what effect the reduced access to cassava meal will
have on the gross margins in the Dry uplands area. During the dry season, farmers in the Dry
uplands area sell some of their livestock to buy forages and additional feeds. The higher
feed costs have negatively affected the GM compared to the wet areas, but the difference
in the GM between crossbred and Ongole farms in the Dry uplands is negligible. Overall, GM

Chapter 3
61
Table 3.10.(continued)
Area / Breed
P value**
Wet uplands (n=59) Dry uplands (n=74)
Ongole (n=12)
Crossbred (n=47)
Ongole(n=30)
Crossbred (n=44)
Mean s.d Mean s.d Mean s.d Mean s.d
Number of cattle kept (head)ns
3.2 1.1 2.6 0.9 2.0 0.7 2.8 2.4 0.70
Total time spent per day (h d‐1)
4.9a 0.9 4.8a 1.0 4.0a 1.5 4.4a 1.4 0.03
Cleaning cattle (%) 5.7 4.2 3.2 4.2
Cleaning the barn (%)
15.8 17.5 3.3 4.8
Collecting feed (%) 45.0 47.4 65.8 60.4
Offering feed (%) 33.5 30.9 27.7 30.6
Total variable costs (Million IDR)
1.46a 0.72 1.92a 1.50 1.00a 0.58 2.42b 3.62 0.01
Forage 0.40a 0.07 0.43a 0.07 0.66a 0.48 1.28b 0.94 0.00
Supplementary feed 0.89a 0.69 1.33a 1.67 0.27a 0.20 0.91a 2.03 0.00
AI / mating and reproduction services
0.09a 0.03 0.11a 0.02 0.07a 0.03 0.11a 0.16 0.32
Other costs (hired labour, veterinary services, other)ns
0.08a 0.13 0.13a 0.26 0.002a
0.009 0.12a 0.56 0.18
Total output (Million IDR)
5.17a 3.18 3.48a 3.41 3.48a 2.47 4.20a 5.16 0.84
Selling cattle 4.94a 3.12 3.37a 3.38 3.48a 2.47 4.20a 5.16 0.86
Selling manure 0.23a 0.19 0.11b 0.17 0.00 0.00 0.00 0.00 0.00
Gross Margins*** (Million IDR)
3.71a 2.87 1.56a 3.68 2.47a 2.34 1.78a 3.22 0.01
Gross Margins per family labour time**** (Thousand IDR h‐1 d‐1)
1.43a 1.02 0.53b 0.14 1.29a 1.49 0.69a 1.59 0.03
per h of family labour input was significantly higher for Ongole farms than for crossbred
farms (1319 vs 880 IDR per h d‐1).
Future of crossbreeding
Government started to promote crossbreeding in the 1980’s in order to improve the
meat production of Ongole cattle and the productivity of smallholder farmers (Deptan,
2003). Only exotic semen was provided; there was no assistance in terms of feeding and
breeding management.
In the early years of crossbreeding crossbred animals fetched a much higher price than
the meat value, as there was a big demand for crossbred breeding stock (Barwegen, 2004;
Sutresniwati, 2006). This gave a big boost to crossbreeding. When the importation of frozen
meat and live cattle from Australia was high, however, the price of cattle, both local and
Is crossbreeding of cattle beneficial for mixed farming systems?
62
crossbreds decreased. For example, during 2009‐2011, the volume of imported frozen meat
was high, and it was distributed to the wet market which depressed the sale price of cattle.
Farmers were disappointed that the prices of crossbred cattle decreased more than of local
cattle (40% vs 25%) (Suseno, 2011, personal communication). This was either due to their
high price expectation or high initial price paid for crossbred cattle. Crossbreeding is now a
routine practice and prices for both crossbred and local cattle are based on body weight
estimates, being their actual meat value in the market.
Good fertility of the cows, high survival of calves and good quality weaned calves are
very important for the farmers. The productivity of the herds can be expressed by
combining the calf crop estimates with the weaning weight estimates. On average the
Ongole farms produced 129 kg weaner weight per year, whereas the crossbred farms are
more productive from this point of view: 154 kg weaner weight per year. Most farmers said
they prefer crossbreds over Ongole, because of bigger body sizes and higher selling prices.
Prices of crossbred weaners are in the range of approximately 5.0 – 7.5 million IDR, whereas
Ongole weaners are sold for prices in the range of 3.5 ‐ 4.5 million IDR.
Most farmers do not consider the higher feed requirements of crossbreds (Table
3.10.). The higher selling prices are much more tangible than the economic evaluation in
terms of GM. So, crossbreeding will continue.
The crossbreeding of ‘beef’ cattle in smallholder mixed farms in Java confirms the
general trend of crossbreeding in dairy type animals by smallholders in many different
areas, that it is done rather un‐controlled (Wollny, 2003). Systemic crossbreeding seems not
possible, as there is no reliable pedigree information available and Simmental semen is
used, irrespective of the crossbred generation type of the cows (Widi et al., 2008). Farmers
in all zones said they do not prefer upgrading to very high levels of Simmental, as they
expect poorer growth and less optimal reproductive performances of high levels of
upgraded cattle. They are already satisfied with the performance of existing crossbred
cattle. This implies that in future Ongole semen has to be used on higher grade crossbred
animals. The local government has started a breeding initiative ‘Return to Ongole’. The main
aim of this programme is to contribute to maintaining a viable Ongole population. In this
programme farmers get a subsidy for every pregnant Ongole cow. This programme is only
carried out in the Wet lowlands II and Dry uplands. The Return to Ongole breeding plan was
set up in areas with a minimum Ongole productive cow population of 2000 head. The
selection goal is growth rate from weaning to one year of age. The best yearling calves are
transferred to a Performance Test Station from which the best bulls and cows are selected.
This programme has resulted in an increasing demand for Ongole cattle.
In Indonesia meat production has increased from 399.7 tonnes in 2005 to 593.5
tonnes in 2013 (BPS, 2013). In the same period the total number of cattle has increased
from 10.6 million to 12.8 million (BPS, 2013). Crossbreeding has certainly contributed to the
increase in meat production. In Central Java the majority of the cattle are already
crossbreds. The productivity of crossbreds in terms of the productivity parameter weaned
Chapter 3
63
weight per farm is higher than in Ongole farms. The number of cows per farm was the same
for Ongole and crossbred farms.
The assumption in literature that the introduction of more productive breeds will
result in keeping fewer animals and so lessening the impact on the environment (Steinfeld
et al., 2006; Marshall, 2014) is not confirmed by the cattle herd sizes in the smallholder
mixed farming systems in Central Java. The herds at the farms have always been very small,
crossbreeding will not change that situation. Farmers keep a specific number of animals in
relation to their limited resources. There is no information of numbers of specific
crossbreeding generations and Ongole cattle in Indonesia. Marshall (2014) concludes that
the impact of the introduction of new breed types on indigenous populations should be
monitored by regular census. Such information is needed to support informed decision
making on future (cross) breeding strategies. In Indonesia, census data on livestock numbers
are available, however, unfortunately census data do not distinguish different breed or
crossbred generation types.
Limitations of the impact analysis used
Marshall (2014) suggests that strategic research is needed to assess the impact of
different breed types from a range of viewpoints: household level, food and nutrition
security at different scales and environmental sustainability. The present analysis of the
impact of crossbred animals on smallholder cattle keeping in Central Java considers only
farm level developments, such as animal performances, herd sizes, objectives of keeping
cattle and financial results. These data helped to understand why crossbred farmers opt for
crossbreds. Research at other levels is needed to complete the picture of the impact of
crossbreeding. Our farm level data on animal weights and feed intakes might lack in
accuracy, as detailed measurements are not possible on large numbers of animals in the
field. The GM analysis only included the financial flows on the farms, the additional benefits
of cattle in terms of manure use on own crop land and the security function of the cattle are
not included. We expect no differences between the farm types in manure use, however the
security function of crossbred cattle might be slightly higher than for Ongole, as estimates of
this are generally based on financial value of the cattle kept and sold (Udo et al., 2011). So,
crossbred cattle present a higher capital asset value than Ongole cattle.
3.4. Conclusions
In Indonesia, crossbreeding has become a common practise over a period of about
30 years. The question whether or not crossbreeding is beneficial for the mixed farming
systems in Central Java can be looked at from farmers’ points of view and from national
level point of view. The comparisons of households with Ongole and crossbred cattle in
different agro‐ecological zones in Central Java show that crossbreeding is not changing such
farming systems: household and farm characteristics, and herd sizes and structures were
not really different between farmers keeping Ongole or crossbred breeding stock.
Is crossbreeding of cattle beneficial for mixed farming systems?
64
Crossbreeding has also not changed the basic motives of keeping cattle. The main motives
for keeping cattle, either Ongole or crossbred, were the capital asset function (saving),
income and manure production. The reasons for choosing either type of breeding stock,
however, differed: lack of feed and capital are reasons for not choosing crossbreds, whereas
expectations of better growth and better selling prices trigger keeping crossbreds.
In all agro‐ecological areas included in this study, the crossbreds reached considerably
higher body weights and consequently fetched higher sale prices, but they also required
more feed resulting in comparable gross margins for farmers with crossbred or Ongole
breeding stock. So, crossbreeding is not bringing financial gains for the farmers.
Nevertheless, in all study areas, farmers prefer Simmental crosses because of their nice
appearance, high growth rate and high price of progeny sold compared to Ongole.
At national level crossbreeding is contributing to increased meat production. The
amount of weaned weight per farm was 20% higher on crossbred farms than on Ongole
farms. Hence, crossbreeding will continue in Indonesia, since farmers are satisfied with the
performances of crossbred cattle, such as their higher body weights and consequently
higher market prices across agro‐ecological zones. Government bodies continue to promote
crossbreeding, however, at the same time conservation of Ongole has started three years
ago in its original breeding area and is supported by a structured breeding program. There is
no breeding strategy to maintain current crossbred levels. A viable Ongole population is
needed to reduce the risk of upgrading to too high levels of Simmental.
References Anonymous. 2007. Map of Indonesia. (Available at geography.about.com/library/cia/
blcindonesia.htm). Baliarti, E. 1999. Penggunaan daun lamtoro dan vitamin A pada ransum basal jerami padi:
pengaruhnya terhadap kinerja induk dan anak sapi Peranakan Ongole. PhD Thesis. Universitas Gadjah Mada, Yogyakarta.
Bamualim, A. and R.B. Wirahayati. 2002. Nutrition and management strategies to improve Bali cattle productivity in Nusa Tenggara. Pp 17‐22. In: Strategies to improve Bali cattle in eastern Indonesia. Vol. 10. K. Entwistle and D.R.Lindsay, ed. ACIAR, Denpasar, Indonesia.
Barwegen, M. 2002. Persistent livestock shortages? Livestock developments 1850 ‐ 2002. In: ESSHC Conference. The Hague.
Barwegen, M. 2004. Browsing in livestock history; large ruminants and the environment in Java, 1850 ‐ 2000. In: Smallholders and stockbreeders; histories of food crop and livestock farming in Southeast Asia. P. B. a. D. Henley, ed. KITLV Press., Leiden.
BIB. 2011. Peta Distribusi Semen Beku Balai Inseminasi Buatan Lembang Tahun 2009. Bandung. BPS. 2009. Indonesia statistical data 2009. Statistics Indonesia. BPS (Available at www.bps.go.id). BPS. 2010. Indonesia statistical data 2010. Statistics Indonesia. BPS (Available at www.bps.go.id). BPS. 2013. Indonesia statistical data 2013. Statistics Indonesia. BPS (Available at www.bps.go.id). Budisatria, I.G.S. 2006. Dynamics of small ruminant development in Central Java,Indonesia. Ph.D.
Thesis. Wageningen University, Wageningen. Budiyanto, A. 2012. Urgensi penanganan masalah reproduksi untuk mempertahankan PSDSK.
(Available at www.dokterhewanjogja.com/urgensi‐penanganan‐masalah‐reproduksi‐untuk‐mempertahankan‐psdsk/).
Chapter 3
65
Deptan. 2003. National report on animal genetic resources Indonesia; a strategic of policy document. Department of Agriculture, Jakarta.
Djanah, D. 1984. Menentukan umur ternak. CV Yasaguna, Jakarta. Frisch, J.E. and J.E. Vercoe. 1978. Utilizing breed differences in growth of cattle in the tropics. World
Anim. Rev. (25): 8‐12. Hartadi, H., S. Reksohadiprodjo, and A.D. Tillman. 2005. Tabel Komposisi Pakan untuk Indonesia.
Gadjah Mada University Press, Yogyakarta. Hasbullah, E.J. 2003. Kinerja pertumbuhan dan reproduksi sapi persilangan Simmental dengan
Peranakan Ongole dan sapi PO di Kabupaten Bantul,DIY. M.Sc. Thesis. Fakultas Peternakan Universitas Gadjah Mada, Yogyakarta.
Kahi, A.K., G. Nitter, W. Thorpe, and C.F. Gall. 2000. Crossbreeding for dairy production in the lowlands tropics of Kenya: II. Prediction of performance of alternative crossbreeding strategies. Livest. Prod. Sci. 63:55‐63.
Kementan. 2010. Livestock Statistics 2010. Ministry of Agriculture, Jakarta. Lassen, J., M. Hansen, M.K. Sorensen and G.P. Aamand. 2003. Genetic relationship between body
condition score, dairy character, mastitis and diseases other than mastitis in first‐parity Danish Holstein Cows. J. Dairy Sci. 86: 3730 ‐ 3735.
Marshall, K. 2014. Optimizing the use of breed types in developing country livestock production systems: a neglected research area. J. Anim. Breed. Genet.131 (5): 329‐340.
Maule, J.P. 1990. The cattle of the tropics. University of Edinburgh Centre for Tropical Veterinary Medicine, Edinburgh.
NRC. 1996. Nutrient Requirements of Beef Cattle. 7th revised edition. National Academy Press. Washington, D.C.: 216.
Ott, R.L. and M. Longnecker. 2010. An introduction to statistical methods and data analysis. Sixth edition. Brooks/Cole, Cengage Learning. Belmont, California.
Porter, V. 1991. Cattle: a handbook to the breeds of world. Christopher Helm (Publishers) Ltd., London.
Samdup, T., H.M.J. Udo, C.H.A.M. Eilers, M.N.M. Ibrahim, and A.J. v.d. Zijpp. 2010. Crossbreeding and intensification of smallholder crop‐cattle farming systems in Bhutan. Livest. Sci. 131: 126‐134.
Steinfeld, H., P. Gerber, T. Wassenaar, V. Castel, M. Rosales and C. de Haan. 2006. Livestock's long shadow: environmental issues and options. FAO, Rome.
Sudardjat, S., and R. Pambudy. 2003. Menjelang Dua Abad Sejarah Peternakan dan Kesehatan Hewan Indonesia: Peduli Peternak Rakyat. Yayasan Agrindo Mandiri,Jakarta.
Sumadi, W. Hardjosubroto and Purnoatmojo. 2003. Penyusunan program breeding sapi potong di Daerah Istimewa Yogyakarta. Dinas Pertanian Propinsi Daerah Istimewa Yogyakarta and Fakultas Peternakan Universitas Gadjah Mada, Yogyakarta.
Supiyono. 1998. Ilmu Tilik Ternak. Fakultas Peternakan. Universitas Gadjah Mada,Yogyakarta. Sutresniwati. 2006. The invasion of crossbred cattle; stakeholders' perspectives in Central Java,
Indonesia in Animal Production Systems. MSc Thesis. Wageningen University, Wageningen. Syrstad, O. 1996. Dairy cattle crossbreeding in the tropics: choice of crossbreeding strategy. Trop.
Anim. Health Prod. 28: 223‐229. Tillman, A.D., H. Hartadi, S. Reksohadiprodjo, S. Prawirokusumo and S. Lebdosoekojo. 1998. Imu
Makanan Ternak Dasar. 2nd edition. Gadjah Mada University Press, Yogyakarta. Toelihere, M.R. 2002. Increasing the success rate and adoption of AI for genetic improvement of Bali
cattle. Pp 48‐53. In: Strategies to improve Bali cattle in eastern Indonesia. Vol. 10. K. Entwistle and D.R.Lindsay, ed. ACIAR, Denpasar.
Triyono. 2003. Studi perbandingan ciri‐ciri eksterior, ukuran tubuh dan status fisiologi antara sapi Simmental‐Peranakan Ongole dan sapi Peranakan Ongole. B.Sc. Thesis. Fakultas Peternakan Universitas Gadjah Mada, Yogyakarta.
Is crossbreeding of cattle beneficial for mixed farming systems?
66
Udo, H.M.J., H.A. Aklilu, L.T. Phong, R.H. Bosma, I.G.S. Budisatria, B.R. Patil, T. Samdup, and B.O. Bebe. 2011. Impact of intensification of different types of livestock production in smallholder crop‐livestock systems. Livest. Sci. 139: 22‐29.
Widayanti, H. 2008. Perbedaan eksterior, ukuran tubuh dan status fisiologi sapi betina Ongole dan SimPO di Kabupaten Bantul. BSc Thesis. Fakultas Peternakan Universitas Gadjah Mada, Yogyakarta.
Widi, T.S.M. 2004. Livestock sharing arrangements in the Province of Yogyakarta Special Region; perspectives from different stakeholders. MSc Thesis. Wageningen University, Wageningen.
Widi, T.S.M., A.M. Abdurachman, T. Hartatik, and Panjono. 2006. The existence and performance of Javanese cattle. In: Proceeding of The 4th International Seminar on Tropical Animal Production (4th ISTAP). Yogyakarta.
Widi, T.S.M., T. Yuwanta, A. Agus, and A. Pertiwiningrum. 2008. Roadmap pengembangan ternak sapi potong Provinsi Daerah Istimewa Yogyakarta. Ardana Media, Yogyakarta.
Widi, T.S.M., H.M.J. Udo, K. Oldenbroek, I.G.S. Budisatria, E. Baliarti, and A.J. van der Zijpp. 2014. Unique cultural values of Madura cattle: is cross‐breeding a threat? Anim. Genet. Resour. 54: 141‐152.
Wollny, C.B.A. 2003. The need to conserve farm animal genetic resources in Africa: should policy makers be concerned? Ecol. Econ. 45: 341‐351.
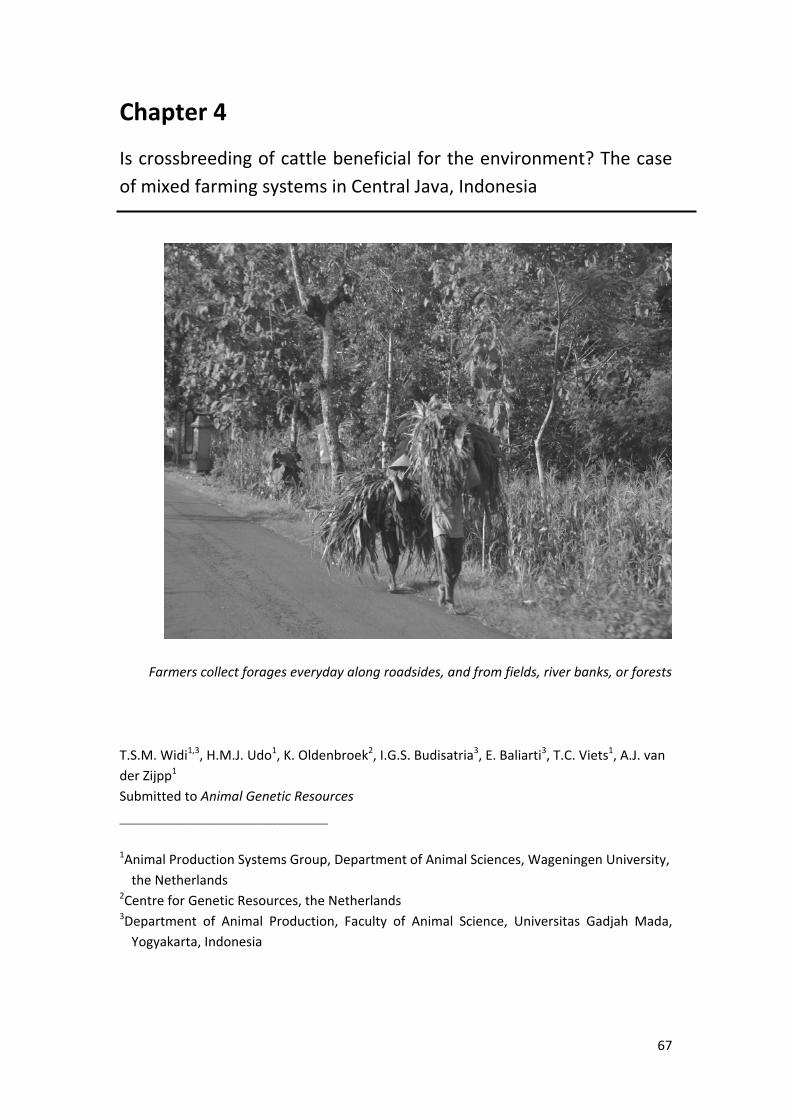
67
Chapter 4
Is crossbreeding of cattle beneficial for the environment? The case
of mixed farming systems in Central Java, Indonesia
T.S.M. Widi1,3, H.M.J. Udo1, K. Oldenbroek2, I.G.S. Budisatria3, E. Baliarti3, T.C. Viets1, A.J. van
der Zijpp1
Submitted to Animal Genetic Resources
_____________________________________________
1Animal Production Systems Group, Department of Animal Sciences, Wageningen University,
the Netherlands 2Centre for Genetic Resources, the Netherlands 3Department of Animal Production, Faculty of Animal Science, Universitas Gadjah Mada,
Yogyakarta, Indonesia
Farmers collect forages everyday along roadsides, and from fields, river banks, or forests

Is crossbreeding of cattle beneficial for the environment?
68
ABSTRACT
Crossbreeding with European beef breeds has become a standard approach for the
intensification of smallholder cattle production in Indonesia. It is often suggested that
intensification will mitigate the negative environmental impact of livestock. However little is
known about the environmental impact of the intensification of cattle keeping in a
smallholder setting. This study assessed the environmental impact of crossbreeding, in
terms of Global Warming Potential (GWP) and land use. We sampled 90 local Ongole and
162 crossbred cattle farms in four study areas representing three agro‐ecological zones: Wet
lowlands (subdivided into two areas), Wet uplands and Dry uplands. Expressed per kilogram
of live weight of young stock produced, GWP (26.9 kg CO2–equivalents) and land use (34.2
m2) of Ongole cattle were not significantly different from the GWP (28.9 kg CO2–
equivalents) and land use (37.4 m2) of crossbred cattle. Crossbred young stock grew faster,
but in general crossbred cattle required more feed. GWP per kilogram of live weight
produced was highest in the Dry uplands; this area had different forage feeding practices
(more native grasses and dry forages were fed than in the other areas) and higher emissions
due to transportation of forages than other areas. Land use per kilogram of live weight
tended to be higher in the Wet lowlands I and Wet uplands, the two most fertile areas, than
in the other two areas, as more local fresh forages were fed in these areas. In the current
smallholder production system, the dominant crossbreeding practice of using Simmental
semen on Ongole and F1 crossbred cows does not result in lower greenhouse gas emissions
or land use per kilogram of live weight produced compared to farms with Ongole cows. The
advantage from the faster growth of crossbreds is counteracted by the higher emissions and
land use from feed production for crossbreds.
Keywords: Crossbreeding, Mixed farming systems, Ongole, Simmental, Life Cycle Assessment, Multi‐functionality, Indonesia
Chapter 4
69
4.1. Introduction
Intensification of livestock production is widely promoted as a strategy to meet the
increasing demand for animal source foods and to improve the livelihoods of smallholder
livestock farmers (Delgado et al., 2000; Otte and Upton, 2005; Pica‐Ciamarra, 2007).
Intensification of livestock production is also seen as an important way of reducing the
environmental impact of livestock, in particular in smallholder production systems (Steinfeld
et al., 2006; Gerber et al., 2013). Various global studies suggest that intensification of
livestock production will reduce emissions of greenhouse gasses (GHG) per unit of
production (Steinfeld et al., 2006; Gerber et al., 2013). Intensification is also expected to
reduce the pressure on land, resulting in less cultivation of natural areas and destruction of
woodlands (Steinfeld et al., 2006).
In resource‐poor environments, crossbreeding with breeds selected for high
production has become a standard intensification approach for cattle husbandry. Field
studies on the impact of intensification through crossbreeding have mainly been undertaken
for dairy cattle. These studies showed that smallholder dairying using crossbreds resulted in
economic gains for the households involved (McDermott et al., 2010; Samdup et al., 2010;
Udo et al., 2011), although it was not feasible for really resource‐poor households (Udo et
al., 2011). Weiler et al. (2014) showed, however, that intensification of dairy farming does
not necessarily lead to lower emissions per kilogram of milk produced. Consideration of how
off‐farm feed production contributes to environmental impact is particularly important.
Production levels may be higher in more intensive production systems but more feed
supplements are also being used.
Little is known about the impact of the intensification of beef cattle systems in
smallholder settings on GHG emissions. Wall et al. (2009) and Scholtz et al. (2012) suggest
that genetic improvement and crossbreeding may be sustainable ways of reducing the
carbon footprint of beef cattle, but no results from field studies support this hypothesis.
Intensification will require increased use of inputs, which may offset any beneficial impact of
increased production on the environmental impact per unit of production.
In Indonesia, crossbreeding with European breeds has been promoted as a strategy to
intensify its beef production. It is implemented throughout the country, regardless of
differences in agro‐ecology, of which the variation in available feed resources is a main
element (Widi et al., 2015). About 90% of cattle in Indonesia are owned by smallholder
farmers with fewer than five head of cattle per farm and about 0.1 to 0.4 ha of crop land.
The population pressure in the main island Java means that all agricultural land is used for
cropping. As a consequence, the cattle management systems are predominantly based on
cut‐and‐carry (stall) feeding (Palte, 1989).
In Java, crossbreeding is mainly practised by using Simmental semen on the local
Ongole population (Widi et al., 2015). Indonesian farmers, in common with smallholders in
developing countries, keep cattle not only for meat production, but also for financial
security, draught power, manure for cropping and social status (Widi, 2004). Comparisons of
Is crossbreeding of cattle beneficial for the environment?
70
crossbred and Ongole cattle production systems in different agro‐ecological zones in Central
Java have shown that the reasons for keeping cattle are similar for both systems (Widi et al.,
2015). Reproductive performances were not different between the two types of breeding
stock. But at comparable ages, crossbred cows and progeny reached approximately 25% and
17% heavier body weights than Ongole cows and progeny. Crossbred cattle fetched higher
sale prices, but they were fed more supplementary feed (Widi et al., 2015). Consequently,
no differences in the Gross Margins from cattle keeping were observed between farms with
Ongole cattle and farms with crossbred cattle within the same agro‐ecological zone (Widi et
al., 2015).
Is intensification through crossbreeding indeed beneficial for the environment? There
is a lack of field studies to substantiate the claims about the environmental benefits of
intensification. Life cycle assessment (LCA) is commonly used to assess the environmental
impact of producing livestock products (de Vries and de Boer, 2010; de Boer et al., 2011).
Environmental impacts from beef cattle production have mainly been estimated for
intensive systems in Europe and America (Casey and Holden, 2006; de Vries and de Boer,
2010; Nguyen et al., 2010). In such studies the impacts are generally expressed per unit of
meat produced. In resource‐poor cattle keeping systems, the different livelihood functions
should be included when assessing impacts per unit of production and mitigation
opportunities (Weiler et al., 2014). This will not only give a more realistic picture of the
impacts but will also reflect farmers’ realities when considering mitigation options. The
objective of this study was to assess the environmental impact, in terms of GWP and land
use, of Ongole and crossbred beef cattle production systems in different agro‐ecological
zones in Central Java. This was achieved by applying the LCA methodology.
4.2. Materials and methods
Study areas
The study areas were situated in the southern part of Central Java. They represented
two agro‐ecological zones, the Uplands and the Lowlands, with three different rainfall
patterns. Wet lowlands, Wet uplands and Dry uplands could be distinguished. The study
areas differ in topography, soil types, soil fertility and agro‐climatic conditions. Wet
lowlands (lower than 100 m above sea level; annual rainfall of 2400‐3000 mm; BPS, 2009)
have fertile soils and are characterised by irrigated farming systems with paddy and maize
as the main crops. Wet uplands (higher than 500 m above sea level with annual rainfall of
3000‐3600 mm; BPS, 2009) also have fertile soils and are characterised by both irrigated and
rain‐fed farming systems, with paddy fields, horticulture and forest. Dry uplands (higher
than 500 m above sea level) have less fertile soils and low annual rainfall (1800‐2400 mm;
BPS, 2009). This zone has rain‐fed farming systems with mainly cassava and dry land paddy.
Wet lowlands were divided into Wet lowlands I, located in Yogyakarta Province, where
crossbreeding is broadly applied, and Wet lowlands II, located in Central Java Province,
where crossbreeding is less frequently applied. Wet lowlands II is a traditional breeding area
Chapter 4
71
of local cattle (Ongole, in Indonesia called Peranakan Ongole, PO). In this area, the local
government allocated several districts (an administration unit within an area) for
maintaining Ongole cattle.
All farms apply stall‐feeding. The feed resources for cattle production are mainly cut
native grasses and crop by‐products. Rice straw is more frequently available in the lowlands
than in the uplands. Supplementary feeds, such as wheat bran, fresh cassava, dried cassava,
cassava waste, tofu (soybean curd) waste and soybean hulls are available locally. Cassava
and legumes are available more frequently in the Dry uplands. Rice bran is produced by the
local milling factories. Compounded concentrates are usually produced by feed mill
companies, which are located outside the study areas, particularly in areas where dairy
farming is practised. Compounded concentrates are distributed to cooperatives and local
shops selling farming supplies.
Most smallholder farmers in Central Java keep cattle for capital savings and additional
income and to produce manure, which is beneficial for their crops. Farmers consider capital
savings as security to be able to meet unexpected or large expenses. They consider income
as the cash they receive from the sale of progeny (Widi et al., 2015). They usually sell calves
after weaning, which is around seven months, until approximately one year of age. The
smallholder farmers can be regarded as cattle breeders, they sell animals to traders and
middle men. These intermediaries sell stock to other farmers, feedlots or butchers. Butchers
either slaughter the animals immediately or fatten them for several months before
slaughtering. The farmers store the manure in or close to the barns for several months and
utilise all manure to fertilise soils for crop production.
Data collection
We sampled data from mixed farms owning cattle for ten years or longer and owning
at least one cow. In total, 252 farms were purposively selected, for monitoring inputs,
outputs and on‐farm resource flows: 56 (17 Ongole and 39 crossbred) farms in Wet
lowlands I, 63 (31 Ongole and 32 crossbred) farms in Wet lowlands II, 59 (12 Ongole and 47
crossbred) farms in Wet uplands and 74 (30 Ongole and 44 crossbred) farms in Dry uplands
(Widi et al., 2015). Farmers could not distinguish subsequent crossbred generations.
LCA calculations were based on the inputs and outputs of the cattle component of the
study farms during the period from January 2011 until January 2012. Feed was the major
input. Many different feeds were offered to the cattle. The feeds were categorised as fresh
forages, dry forages and supplementary feeds. The proportions of the different fresh
forages were estimated by separating the fresh forage into its components. Feed inputs
were calculated based on farmers’ estimates and direct observation of the types and
amounts of feeds offered to each individual animal during one year. The estimates of the
types and amounts of fresh forages offered were recorded by farmers each day. Trained
enumerators (n=8) checked the farm recording once a month. Young animals,
approximately 6 to 12 months, were fed only fresh forages, and it was assumed that they
get a half portion compared to adult animals. The amounts of dry forages and
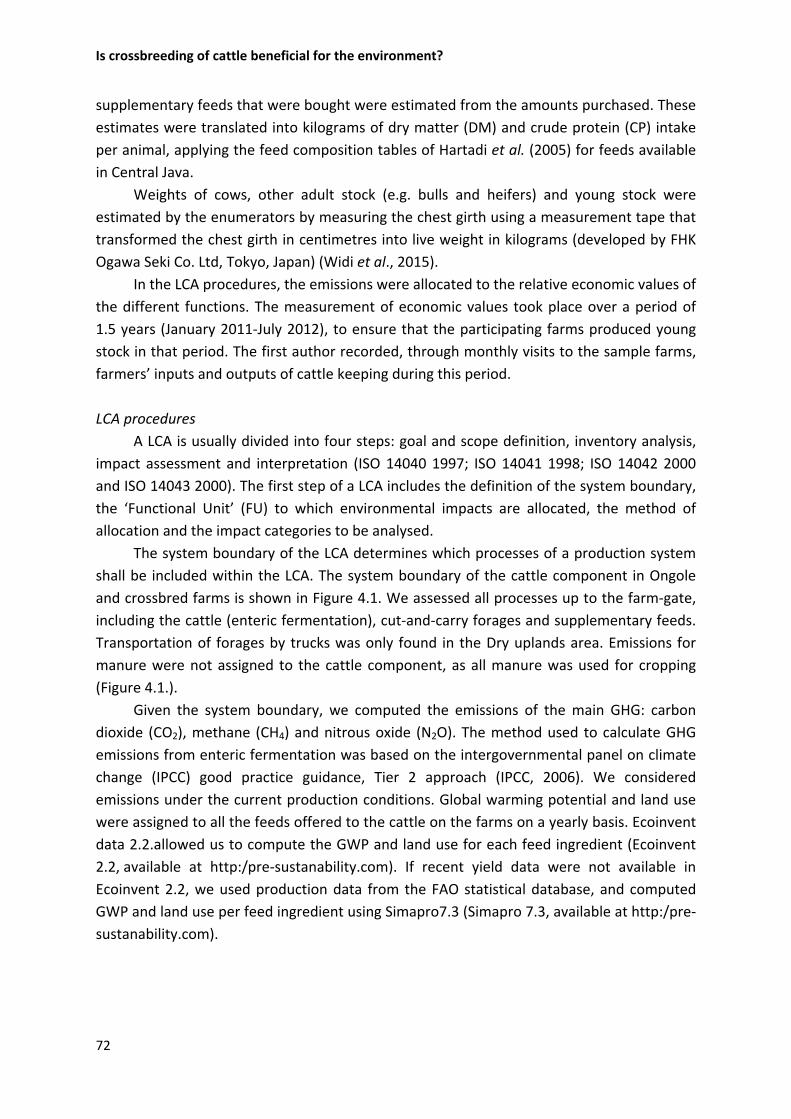
Is crossbreeding of cattle beneficial for the environment?
72
supplementary feeds that were bought were estimated from the amounts purchased. These
estimates were translated into kilograms of dry matter (DM) and crude protein (CP) intake
per animal, applying the feed composition tables of Hartadi et al. (2005) for feeds available
in Central Java.
Weights of cows, other adult stock (e.g. bulls and heifers) and young stock were
estimated by the enumerators by measuring the chest girth using a measurement tape that
transformed the chest girth in centimetres into live weight in kilograms (developed by FHK
Ogawa Seki Co. Ltd, Tokyo, Japan) (Widi et al., 2015).
In the LCA procedures, the emissions were allocated to the relative economic values of
the different functions. The measurement of economic values took place over a period of
1.5 years (January 2011‐July 2012), to ensure that the participating farms produced young
stock in that period. The first author recorded, through monthly visits to the sample farms,
farmers’ inputs and outputs of cattle keeping during this period.
LCA procedures
A LCA is usually divided into four steps: goal and scope definition, inventory analysis,
impact assessment and interpretation (ISO 14040 1997; ISO 14041 1998; ISO 14042 2000
and ISO 14043 2000). The first step of a LCA includes the definition of the system boundary,
the ‘Functional Unit’ (FU) to which environmental impacts are allocated, the method of
allocation and the impact categories to be analysed.
The system boundary of the LCA determines which processes of a production system
shall be included within the LCA. The system boundary of the cattle component in Ongole
and crossbred farms is shown in Figure 4.1. We assessed all processes up to the farm‐gate,
including the cattle (enteric fermentation), cut‐and‐carry forages and supplementary feeds.
Transportation of forages by trucks was only found in the Dry uplands area. Emissions for
manure were not assigned to the cattle component, as all manure was used for cropping
(Figure 4.1.).
Given the system boundary, we computed the emissions of the main GHG: carbon
dioxide (CO2), methane (CH4) and nitrous oxide (N2O). The method used to calculate GHG
emissions from enteric fermentation was based on the intergovernmental panel on climate
change (IPCC) good practice guidance, Tier 2 approach (IPCC, 2006). We considered
emissions under the current production conditions. Global warming potential and land use
were assigned to all the feeds offered to the cattle on the farms on a yearly basis. Ecoinvent
data 2.2.allowed us to compute the GWP and land use for each feed ingredient (Ecoinvent
2.2, available at http:/pre‐sustanability.com). If recent yield data were not available in
Ecoinvent 2.2, we used production data from the FAO statistical database, and computed
GWP and land use per feed ingredient using Simapro7.3 (Simapro 7.3, available at http:/pre‐
sustanability.com).
Chapter 4
73
Figure 4.1. System boundaries for the LCA of local and crossbred cattle production systems
Allocation procedures
The FU in a LCA analysis should represent the main function of the analysed system.
Because of the multi‐functionality of cattle keeping in the study areas, two allocation
approaches were used: (i) allocation to live weight of young stock produced in the farms,
and (ii) allocation to live weight of young stock produced taking into account the other
functions of cattle keeping. ISO 14044 (2006) provides guidelines on how to allocate the
environmental impact of a process or production system in the case of multiple functions. In
this study we used economic allocation, which implies the allocation of GWP and land use to
the different functions based on their economic values. When crop by‐products were used
as feed, economic allocation was applied based on the economic value of the crop for
human food consumption and the value of its by‐products for animal feed.
Economic allocation to the different functions of cattle keeping
Live weight of young stock sold has a direct market value, whereas young stock not
sold represent an opportunity value. The economic value of cattle as a means of finance and
insurance and the use of manure as fertiliser can only be assessed indirectly.
The economic value of live weight produced was calculated as follows:
LCk = SCk x head price,
where LCk is the total economic value of live weight produced during one year in Indonesian
Rupiah (IDR), SCk is the number of cattle produced in one year (head) and head price is the
cattle price (IDR), which is determined by body weight estimation.
The head prices of cattle sold were provided by the individual farmers. Village traders
or middle men buy cattle from farmers. Prices are based on exterior appearance of the
cattle. We interviewed farmers regarding the price of young stock produced at the farms.
Is crossbreeding of cattle beneficial for the environment?
74
The opportunity values of weaners still present on the farms were based on estimates of the
farmers or traders.
The economic value of manure used as fertiliser was estimated based on synthetic N
fertiliser equivalents, in this case urea (CO(NH2)2), which was the common fertiliser that
farmers used. The economic value of manure used was calculated as follows:
MANURE = Nmanurex fertiliser price,
where, MANURE is the total economic value of manure used as fertiliser during one year
(IDR), Nmanure is kilograms N in manure used as fertiliser and fertiliser price is economic value
of N in urea (CO(NH2)2) expressed as (IDR/kg N). Manure production in terms of kilograms
per day (kg d‐1) of DM was calculated by multiplying the estimated weight of fresh manure
produced per animal per day and the DM content of fresh manure. We assumed that an
adult Ongole produces 15 kg d‐1 of fresh manure and an adult crossbred 20 kg d‐1, and that
the DM content is 15% (Pertiwinigrum, personal communication). We assumed that cattle
manure has a N content of 1.7%, based on Moore and Gamroth (1993) and that 50% of N
was lost during storage (Moore and Gamroth, 1993). The price of fertiliser (urea) was
estimated at 1,600 IDR per kilogram in 2011, and therefore we estimated the price of N at
3,478 IDR per kilogram (N content of urea is 46%; Hartadi et al., 2005).
Estimation of the intangible benefits of cattle was based on Bosman et al. (1997), Moll
(2005) and Moll et al. (2007). The intangible benefit from financing is related to not having
to pay interest when borrowing money from a bank or an informal money lender (Moll,
2005; Moll et al., 2007). The benefit of financing was estimated as:
Fk = LCk x f,
where Fk is benefit of financing, LCk is total economic value of live cattle sold in a farm in one
year (IDR) and f is financing factor. The total economic value of live cattle sold, LCk, refers to
the direct economic value of the cattle. The formal interest rate of credit in the study areas
was 12% (Bank BNI Yogyakarta, 2013, personal communication).
Bosman et al. (1997) described the intangible insurance benefit of livestock as the
economic value of the stock as insurance for the household, i.e. to pay premium in case of
health insurance or another type of insurance. The intangible insurance benefit was
estimated as:
Ik = SFkx s,
where Ik is insurance benefit, SFk is number of cattle on farm multiplied by estimates of price
per head (IDR), and s is insurance factor. The factor s was set at 9% (Asuransi Prudential –
Yogyakarta, 2003, personal communication). This represents the human health insurance
premium that would have to be paid for health insurance.
Impact assessment
The impact categories considered were Global Warming Potential (GWP) and land
use. The carbon footprint, GWP in CO2‐equivalents (CO2‐eq) per kilogram animal product, is
Chapter 4
75
widely used to assess the climate change impact of cattle (Steinfeld et al., 2006; Gerber et
al., 2013). In Java, land use is very much under pressure as almost all agricultural land is
used for crop production. Grazing lands have disappeared and cattle are kept in a cut‐and‐
carry management system. To assess the GWP of Ongole and crossbred cattle farms,
emissions of CO2, CH4 and N2O were summed based on their equivalence factors in terms of
kilograms of CO2‐equivalents: 1 for CO2, 25 for CH4 and 298 for N2O (IPCC, 2007). Land used
for producing the different types of feed was expressed in square metres (m2) (Phong et al.,
2011). Interpretation of the results is based on the FU, live weight produced in the study
period.
We compared the emission intensities and farm characteristics of the 25th percentile
of Ongole farms, representing farms with lower emission intensities, with the emission
intensities and farm management characteristics of all the other Ongole farms. The same
analysis was conducted for crossbred farms. This analysis was conducted to explore why
some farms had lower emission intensities than others, analogous with Gerber et al. (2013).
Data analysis
One‐way ANOVA was performed to analyse the variation in GWP and land use per
kilogram live weight produced among areas, with breed nested within areas (Ott and
Longnecker, 2010). The model was simplified to compare breeds within areas, because for
most parameters no interaction was found between breed and area.
4.3. Results
Characteristics of Ongole and crossbred cattle farms
Table 4.1. presents the farm characteristics for the four study areas. Land size was not
significantly different between the two types of farms within the four study areas. Most of
the land was used for crop production. Farmers usually planted forages along the
boundaries of their fields. Cut‐and‐carry feeding was practised in all study areas. Forages
were collected from the fields, riversides, roadsides, forest edges and backyards.
Supplementary feeds were offered irregularly. In Lowlands II, rice bran was only offered
during the rice harvesting period, because farmers utilised the by‐product of their own
harvested rice, whereas in the other areas rice bran was offered independent of the
harvesting period.
Table 4.2. presents the inventory results for cattle herds, feeding practices and
manure estimates for Ongole and crossbred farms. The total number of cattle did not differ
between Ongole (2.4) and crossbred (2.6) farms within the four study areas. The amounts of
the different feed types fed differed significantly amongst areas. More fresh forages were
fed on Wet uplands farms than in the other three areas. More dry forages were fed on Wet
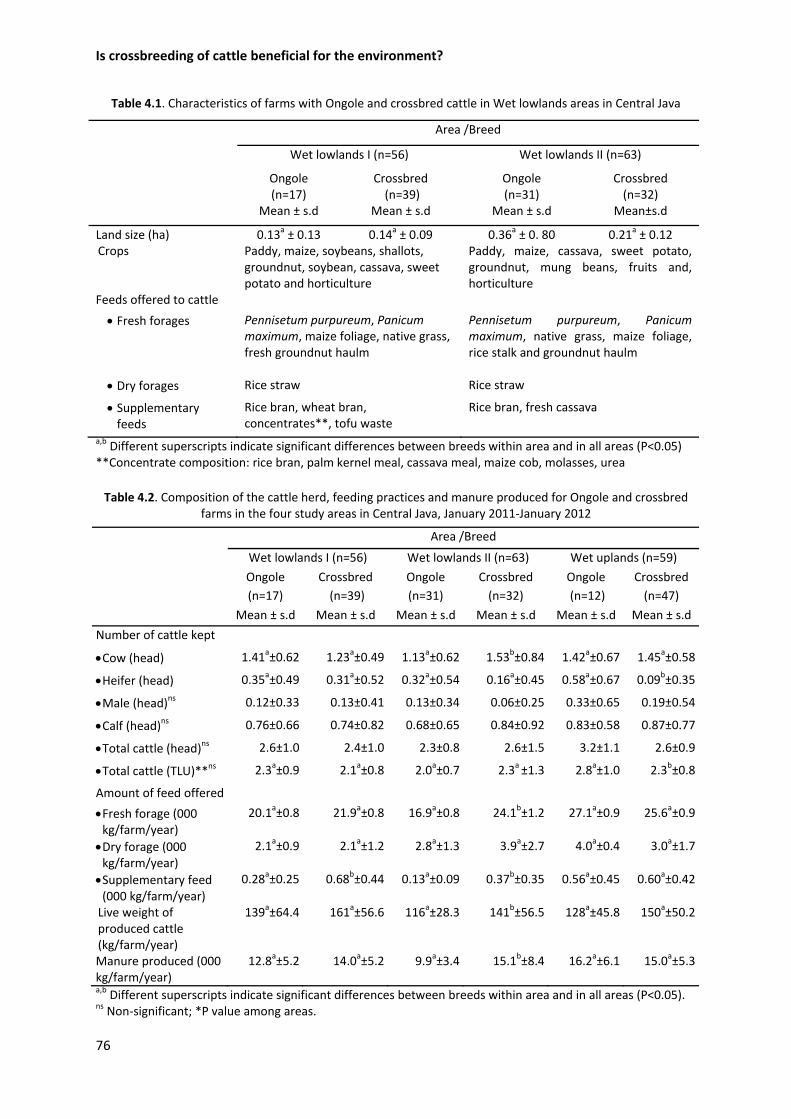
Is crossbreeding of cattle beneficial for the environment?
76
Table 4.1. Characteristics of farms with Ongole and crossbred cattle in Wet lowlands areas in Central Java
Area /Breed
Wet lowlands I (n=56) Wet lowlands II (n=63)
Ongole (n=17)
Crossbred (n=39)
Ongole(n=31)
Crossbred (n=32)
Mean ± s.d Mean ± s.d Mean ± s.d Mean±s.d
Land size (ha) 0.13a ± 0.13 0.14a ± 0.09 0.36a ± 0. 80 0.21a ± 0.12 Crops Paddy, maize, soybeans, shallots,
groundnut, soybean, cassava, sweet potato and horticulture
Paddy, maize, cassava, sweet potato, groundnut, mung beans, fruits and, horticulture
Feeds offered to cattle
Fresh forages Pennisetum purpureum, Panicum maximum, maize foliage, native grass, fresh groundnut haulm
Pennisetum purpureum, Panicum maximum, native grass, maize foliage, rice stalk and groundnut haulm
Dry forages Rice straw Rice straw
Supplementary feeds
Rice bran, wheat bran, concentrates**, tofu waste
Rice bran, fresh cassava
a,b Different superscripts indicate significant differences between breeds within area and in all areas (P<0.05) **Concentrate composition: rice bran, palm kernel meal, cassava meal, maize cob, molasses, urea
Table 4.2. Composition of the cattle herd, feeding practices and manure produced for Ongole and crossbred farms in the four study areas in Central Java, January 2011‐January 2012
Area /Breed
Wet lowlands I (n=56) Wet lowlands II (n=63) Wet uplands (n=59)
Ongole
(n=17)
Crossbred
(n=39)
Ongole
(n=31)
Crossbred
(n=32)
Ongole
(n=12)
Crossbred
(n=47)
Mean ± s.d Mean ± s.d Mean ± s.d Mean ± s.d Mean ± s.d Mean ± s.d
Number of cattle kept
Cow (head) 1.41a±0.62 1.23a±0.49 1.13a±0.62 1.53b±0.84 1.42a±0.67 1.45a±0.58
Heifer (head) 0.35a±0.49 0.31a±0.52 0.32a±0.54 0.16a±0.45 0.58a±0.67 0.09b±0.35
Male (head)ns 0.12±0.33 0.13±0.41 0.13±0.34 0.06±0.25 0.33±0.65 0.19±0.54
Calf (head)ns 0.76±0.66 0.74±0.82 0.68±0.65 0.84±0.92 0.83±0.58 0.87±0.77
Total cattle (head)ns 2.6±1.0 2.4±1.0 2.3±0.8 2.6±1.5 3.2±1.1 2.6±0.9
Total cattle (TLU)**ns 2.3a±0.9 2.1a±0.8 2.0a±0.7 2.3a ±1.3 2.8a±1.0 2.3b±0.8
Amount of feed offered
Fresh forage (000 kg/farm/year)
20.1a±0.8 21.9a±0.8 16.9a±0.8 24.1b±1.2 27.1a±0.9 25.6a±0.9
Dry forage (000 kg/farm/year)
2.1a±0.9 2.1a±1.2 2.8a±1.3 3.9a±2.7 4.0a±0.4 3.0a±1.7
Supplementary feed (000 kg/farm/year)
0.28a±0.25 0.68b±0.44 0.13a±0.09 0.37b±0.35 0.56a±0.45 0.60a±0.42
Live weight of produced cattle (kg/farm/year)
139a±64.4 161a±56.6 116a±28.3 141b±56.5 128a±45.8 150a±50.2
Manure produced (000 kg/farm/year)
12.8a±5.2 14.0a±5.2 9.9a±3.4 15.1b±8.4 16.2a±6.1 15.0a±5.3
a,b Different superscripts indicate significant differences between breeds within area and in all areas (P<0.05). ns Non‐significant; *P value among areas.
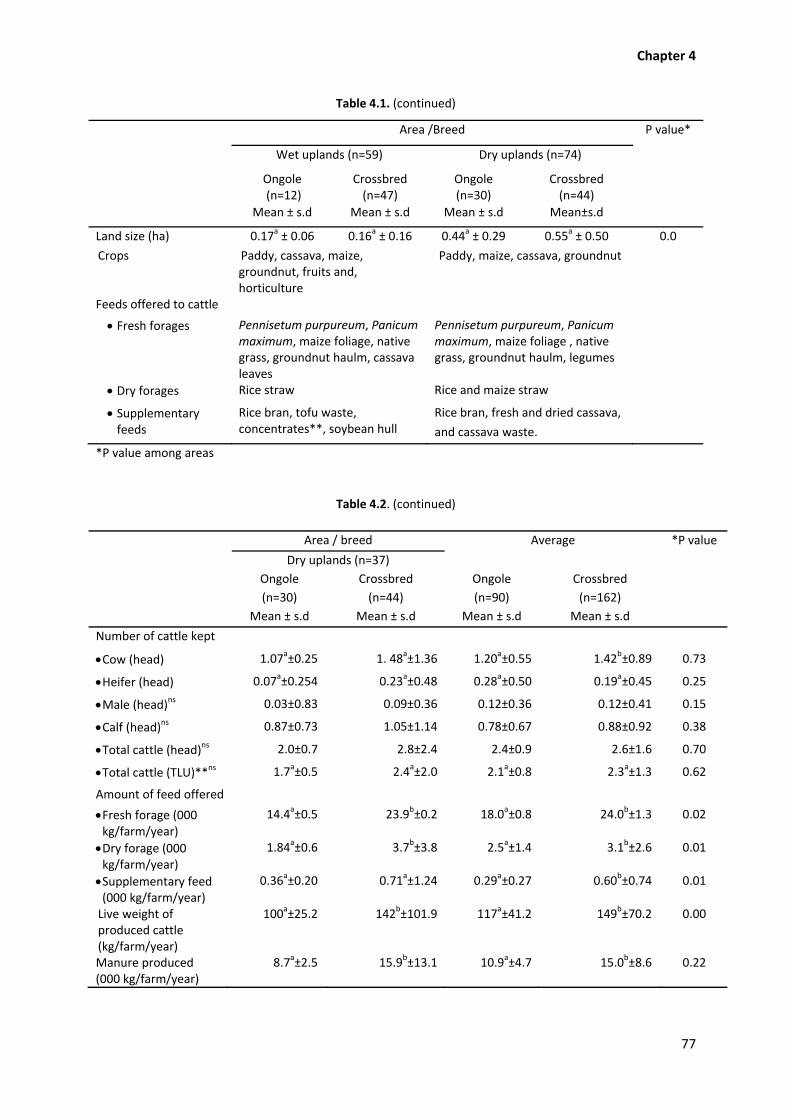
Chapter 4
77
Table 4.1. (continued)
Area /Breed P value*
Wet uplands (n=59) Dry uplands (n=74)
Ongole (n=12)
Crossbred (n=47)
Ongole(n=30)
Crossbred (n=44)
Mean ± s.d Mean ± s.d Mean ± s.d Mean±s.d
Land size (ha) 0.17a ± 0.06 0.16a ± 0.16 0.44a ± 0.29 0.55a ± 0.50 0.0
Crops Paddy, cassava, maize, groundnut, fruits and, horticulture
Paddy, maize, cassava, groundnut
Feeds offered to cattle
Fresh forages Pennisetum purpureum, Panicum maximum, maize foliage, native grass, groundnut haulm, cassava leaves
Pennisetum purpureum, Panicum maximum, maize foliage , native grass, groundnut haulm, legumes
Dry forages Rice straw Rice and maize straw
Supplementary feeds
Rice bran, tofu waste, concentrates**, soybean hull
Rice bran, fresh and dried cassava,
and cassava waste.
*P value among areas
Table 4.2. (continued)
Area / breed Average *P value
Dry uplands (n=37)
Ongole
(n=90)
Crossbred
(n=162)
Ongole
(n=30)
Crossbred
(n=44)
Mean ± s.d Mean ± s.d Mean ± s.d Mean ± s.d
Number of cattle kept
Cow (head) 1.07a±0.25 1. 48a±1.36 1.20a±0.55 1.42b±0.89 0.73
Heifer (head) 0.07a±0.254 0.23a±0.48 0.28a±0.50 0.19a±0.45 0.25
Male (head)ns 0.03±0.83 0.09±0.36 0.12±0.36 0.12±0.41 0.15
Calf (head)ns 0.87±0.73 1.05±1.14 0.78±0.67 0.88±0.92 0.38
Total cattle (head)ns 2.0±0.7 2.8±2.4 2.4±0.9 2.6±1.6 0.70
Total cattle (TLU)**ns 1.7a±0.5 2.4a±2.0 2.1a±0.8 2.3a±1.3 0.62
Amount of feed offered
Fresh forage (000 kg/farm/year)
14.4a±0.5 23.9b±0.2 18.0a±0.8 24.0b±1.3 0.02
Dry forage (000 kg/farm/year)
1.84a±0.6 3.7b±3.8 2.5a±1.4 3.1b±2.6 0.01
Supplementary feed (000 kg/farm/year)
0.36a±0.20 0.71a±1.24 0.29a±0.27 0.60b±0.74 0.01
Live weight of produced cattle (kg/farm/year)
100a±25.2 142b±101.9 117a±41.2 149b±70.2 0.00
Manure produced (000 kg/farm/year)
8.7a±2.5 15.9b±13.1 10.9a±4.7 15.0b±8.6 0.22
Is crossbreeding of cattle beneficial for the environment?
78
lowlands II and Wet uplands farms than in the other two areas and less supplementary
feeds were fed in Wet lowlands II than in the other three areas. Overall, the amounts fed of
fresh forages, dry forages and concentrates were significantly higher for crossbred farms
than for Ongole farms. In Wet lowlands I the amount of fresh forages fed hardly differed
between Ongole and crossbred farms, but the amount of concentrates fed was significantly
higher for crossbred farms (680 kg per farm per year for crossbred farms versus 280 kg for
Ongole farms). Overall, live weight produced was also significantly higher for crossbred
farms (149 kg) than for Ongole farms (117 kg). In all areas, crossbred farms produced more
kilograms of live weight of young stock than Ongole farms, but the variation between farms
was high, so the differences between breeds within areas were only significant in Wet
lowlands II.
Economic allocation of the multiple functions for Ongole and crossbred cattle farms
Cattle have multiple economic functions. Table 4.3. shows the relative contributions of
the different functions that could be quantified. The biggest contribution was from live cattle
produced; this accounted for 71.8% of total value for Ongole cattle and 71.4% for crossbred
cattle. The contribution of live weight produced was not significantly different (P<0.05)
between the two types of cattle farms within the different study areas. The insurance function
of cattle comprised 18% of the total value of Ongole cattle, and 19% of the total value of
crossbred cattle. The additional two functions, which we quantified contributed little to the
total value of cattle, an average contribution of 8.1% for financing and 1.1% for manure used
as fertiliser.
Global warming potential of Ongole and crossbred cattle production systems
Table 4.4. shows the total GWP and the GWP per kilogram of live weight produced for
the cattle component of the two farm types in the four study areas. Ongole farms tended to
have a significantly lower GWP than crossbred farms (4,000 versus 5,600 kg CO2‐eq per year,
P<0.05). On average, 76% of GWP was due to methane emissions from enteric
fermentation. The remaining 24% came from feeds and transport of forages. Use of fresh
home‐produced forages in crossbred farms resulted in significantly higher GWP per farm
compared to Ongole farms. Among areas, emissions from the use of forages was
significantly higher in the Dry uplands than in other areas (P<0.05). Most of the forages in
the Dry uplands were native grasses.
Ongole and crossbred cattle did not have a significantly different impact in terms of GWP
per kilogram of live weight produced. When all the GWP was allocated to live weight
produced, the average GWP per kilogram of live weight produced was 38.7 kg CO2‐eq for
Ongole farms and 42.3 kg CO2‐eq for crossbred farms. The GWP per kilogram of live weight
based on economic allocation to the different functions of cattle averaged 26.9 kg CO2‐eq
for Ongole cattle farms and 28.9 kg CO2‐eq for crossbred farms (Table 4.4.).

Chapter 4
79
Tab
le 4.3. Economic allocation of the multiple functions (IDR/year) and allocation factor (%
) forOngole and crossbred farms in the four study areas in Cen
tral
Java, January 2011‐July 2012
*P value
0.01
0.01
0.19
0.01
0.00
0.02
a,b Different superscripts indicate significant differences between breed
s within area and in
all areas (P<0.05).
*P value for differences betweenareas.
**Total value = Live weight produced + Financing + Manure + Insurance.
***A
llocation factor = (Live cattle sold / total value) x 100.
Average
Crossbred
(n=162)
Mean ± s.d
4.67b±2.48
0.52b±0.26
0.07b±0.04
1.2
b±0.8
6.49b±3.21
71.4
a ±8.1
Ongole
(n=90)
Mean ± s.d
3.21a ±1.10
0.36a ±0.11
0.05a ±0.02
0.8
a ±0.5
4.47a ±1.45
71.8
a ±6.8
Area/Breed
Dry uplands (n=74)
Crossbred
(n=44)
Mean ± s.d
4.76b±3.79
0.54b±0.41
0.06b±0.06
1.30b±1.17
6.68b±0.51
70.9
a ±8.4
Ongole
(n=30)
Mean ± s.d
3.02a ±0.73
0.33b±0.07
0.04a ±0.01
0.70a ±0.24
4.10a ±0.55
73.7
a ±3.6
Wet uplands (n=59)
Crossbred
(n=47)
Mean ± s.d
5.09b±2.01
0.51a ±0.20
0.07a ±0.02
1.43a ±0.61
7.16a ±2.44
70.7
b±7.2
Ongole
(n=12)
Mean ± s.d
3.43a ±1.30
0.34a ±0.13
0.07a ±0.03
1.30a ±0.59
5.22a ±1.94
66.0
a ±5.6
Wet lowlands II (n=63)
Crossbred
(n=32)
Mean ± s.d
3.62b±1.31
0.43b±0.13
0.06b±0.04
1.16b±0.70
5.27b±1.70
68.8
a ±9.3
Ongole
(n=31)
Mean ± s.d
2.91a ± 0.93
0.33a ±0.07
0.04a ±0.01
0.68a ±0.33
3.96a ±0.97
72.8
a ±8.2
Wet lowlands I (n=56)
Crossbred
(n=39)
Mean ±s.d
4.91b±1.5
0.54b±0.15
0.06a ±0.02
0.97a ±0.05
6.49a ±1.82
75.3
b±7.5
Ongole
(n=17)
Mean ± s.d
3.93a ±1.5
0.44a ±0.15
0.06a ±0.02
1.10a ±0.51
5.53a ±1.84
70.8
a ±7.2
Cattle function
Live weight produced (Million
IDR)
Financing (M
illion ID
R)
Manure (Million ID
R)
Insurance (Million ID
R)
Total value** (M
illion ID
R)
Allocation factor***
(%)
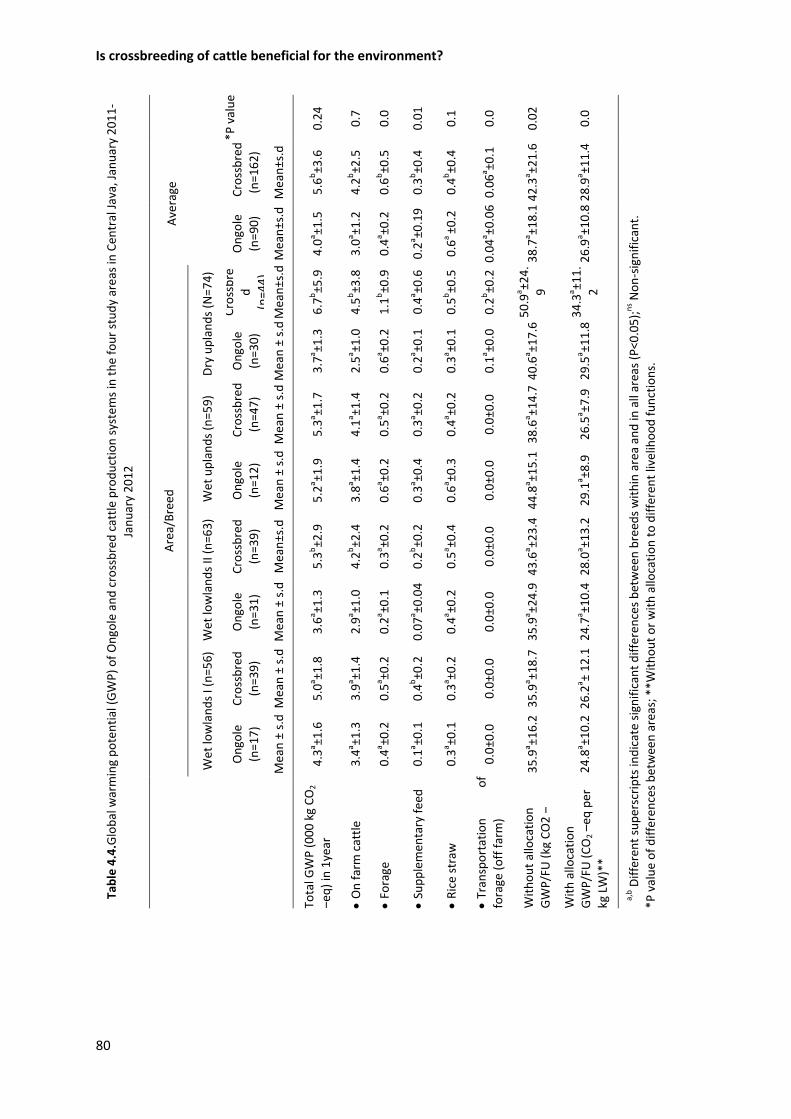
Is crossbreeding of cattle beneficial for the environment?
80
Table 4.4.Global warming potential (GWP) of Ongole and crossbred cattle production systems in the four study areas in Cen
tral Java, January 2011‐
January 2012
*P value
0.24
0.7
0.0
0.01
0.1
0.0
0.02
0.0
a,b Different superscripts indicate significant differences between breed
s within area and in
all areas (P<0.05);ns N
on‐significant.
*P value of differences between areas; **W
ithout or with allocation to different livelihood functions.
Average
Crossbred
(n=162)
Mean±s.d
5.6
b±3.6
4.2
b±2.5
0.6
b±0.5
0.3
b±0.4
0.4
b±0.4
0.06a ±0.1
42.3
a ±21.6
28.9
a ±11.4
Ongole
(n=90)
Mean±s.d
4.0
a ±1.5
3.0
a ±1.2
0.4
a ±0.2
0.2
a ±0.19
0.6
a ±0.2
0.04a ±0.06
38.7
a ±18.1
26.9
a ±10.8
Area/Breed
Dry uplands (N=74)
Crossbre
d
(n=44)
Mean±s.d
6.7
b±5.9
4.5
b±3.8
1.1
b±0.9
0.4
a ±0.6
0.5
b±0.5
0.2
b±0.2
50.9
a ±24.
9
34.3
a ±11.
2
Ongole
(n=30)
Mean ± s.d
3.7
a ±1.3
2.5
a ±1.0
0.6
a ±0.2
0.2
a ±0.1
0.3
a ±0.1
0.1
a ±0.0
40.6
a ±17.6
29.5
a ±11.8
Wet uplands (n=59)
Crossbred
(n=47)
Mean ± s.d
5.3
a ±1.7
4.1
a ±1.4
0.5
a ±0.2
0.3
a ±0.2
0.4
a ±0.2
0.0±0.0
38.6
a ±14.7
26.5
a ±7.9
Ongole
(n=12)
Mean ± s.d
5.2
a ±1.9
3.8
a ±1.4
0.6
a ±0.2
0.3
a ±0.4
0.6
a ±0.3
0.0±0.0
44.8
a ±15.1
29.1
a ±8.9
Wet lowlands II (n=63)
Crossbred
(n=39)
Mean±s.d
5.3
b±2.9
4.2
b±2.4
0.3
a ±0.2
0.2
b±0.2
0.5
a ±0.4
0.0±0.0
43.6
a ±23.4
28.0
a ±13.2
Ongole
(n=31)
Mean ± s.d
3.6
a ±1.3
2.9
a ±1.0
0.2
a ±0.1
0.07a ±0.04
0.4
a ±0.2
0.0±0.0
35.9
a ±24.9
24.7
a ±10.4
Wet lowlands I (n=56)
Crossbred
(n=39)
Mean ± s.d
5.0
a ±1.8
3.9
a ±1.4
0.5
a ±0.2
0.4
b±0.2
0.3
a ±0.2
0.0±0.0
35.9
a ±18.7
26.2
a ± 12.1
Ongole
(n=17)
Mean ± s.d
4.3
a ±1.6
3.4
a ±1.3
0.4
a ±0.2
0.1
a ±0.1
0.3
a ±0.1
0.0±0.0
35.9
a ±16.2
24.8
a ±10.2
Total G
WP (000 kg CO
2
–eq) in 1year
On farm cattle
Forage
Supplemen
tary feed
Rice straw
Transportation
of
forage (off farm)
Without allocation
GWP/FU (kg CO2 –
With allocation
GWP/FU (CO
2 –eq per
kg LW)**
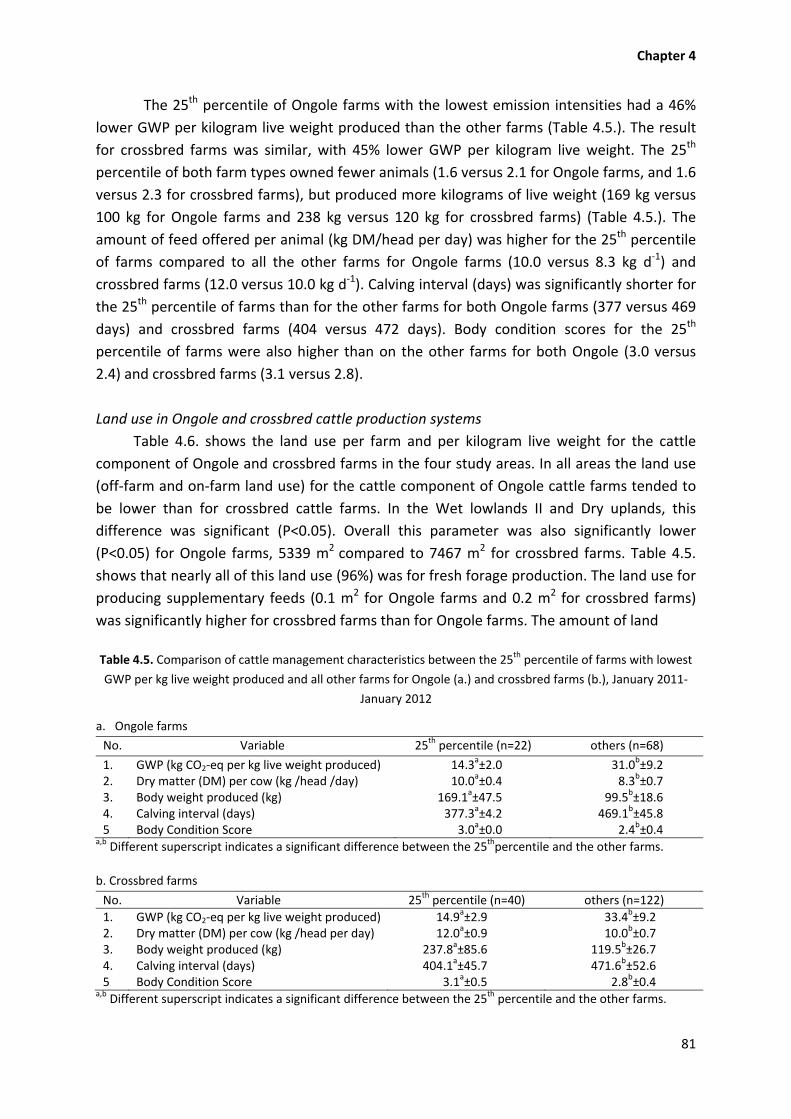
Chapter 4
81
The 25th percentile of Ongole farms with the lowest emission intensities had a 46%
lower GWP per kilogram live weight produced than the other farms (Table 4.5.). The result
for crossbred farms was similar, with 45% lower GWP per kilogram live weight. The 25th
percentile of both farm types owned fewer animals (1.6 versus 2.1 for Ongole farms, and 1.6
versus 2.3 for crossbred farms), but produced more kilograms of live weight (169 kg versus
100 kg for Ongole farms and 238 kg versus 120 kg for crossbred farms) (Table 4.5.). The
amount of feed offered per animal (kg DM/head per day) was higher for the 25th percentile
of farms compared to all the other farms for Ongole farms (10.0 versus 8.3 kg d‐1) and
crossbred farms (12.0 versus 10.0 kg d‐1). Calving interval (days) was significantly shorter for
the 25th percentile of farms than for the other farms for both Ongole farms (377 versus 469
days) and crossbred farms (404 versus 472 days). Body condition scores for the 25th
percentile of farms were also higher than on the other farms for both Ongole (3.0 versus
2.4) and crossbred farms (3.1 versus 2.8).
Land use in Ongole and crossbred cattle production systems
Table 4.6. shows the land use per farm and per kilogram live weight for the cattle
component of Ongole and crossbred farms in the four study areas. In all areas the land use
(off‐farm and on‐farm land use) for the cattle component of Ongole cattle farms tended to
be lower than for crossbred cattle farms. In the Wet lowlands II and Dry uplands, this
difference was significant (P<0.05). Overall this parameter was also significantly lower
(P<0.05) for Ongole farms, 5339 m2 compared to 7467 m2 for crossbred farms. Table 4.5.
shows that nearly all of this land use (96%) was for fresh forage production. The land use for
producing supplementary feeds (0.1 m2 for Ongole farms and 0.2 m2 for crossbred farms)
was significantly higher for crossbred farms than for Ongole farms. The amount of land
Table 4.5. Comparison of cattle management characteristics between the 25th percentile of farms with lowest
GWP per kg live weight produced and all other farms for Ongole (a.) and crossbred farms (b.), January 2011‐
January 2012
a. Ongole farms
No. Variable 25th percentile (n=22) others (n=68)
1. GWP (kg CO2‐eq per kg live weight produced) 14.3a±2.0 31.0b±9.22. Dry matter (DM) per cow (kg /head /day) 10.0a±0.4 8.3b±0.73. Body weight produced (kg) 169.1a±47.5 99.5b±18.64. Calving interval (days) 377.3a±4.2 469.1b±45.85 Body Condition Score 3.0a±0.0 2.4b±0.4
a,b Different superscript indicates a significant difference between the 25thpercentile and the other farms.
b. Crossbred farms
No. Variable 25th percentile (n=40) others (n=122)
1. GWP (kg CO2‐eq per kg live weight produced) 14.9a±2.9 33.4b±9.22. Dry matter (DM) per cow (kg /head per day) 12.0a±0.9 10.0b±0.73. Body weight produced (kg) 237.8a±85.6 119.5b±26.74. Calving interval (days) 404.1a±45.7 471.6b±52.65 Body Condition Score 3.1a±0.5 2.8b±0.4
a,b Different superscript indicates a significant difference between the 25th percentile and the other farms.
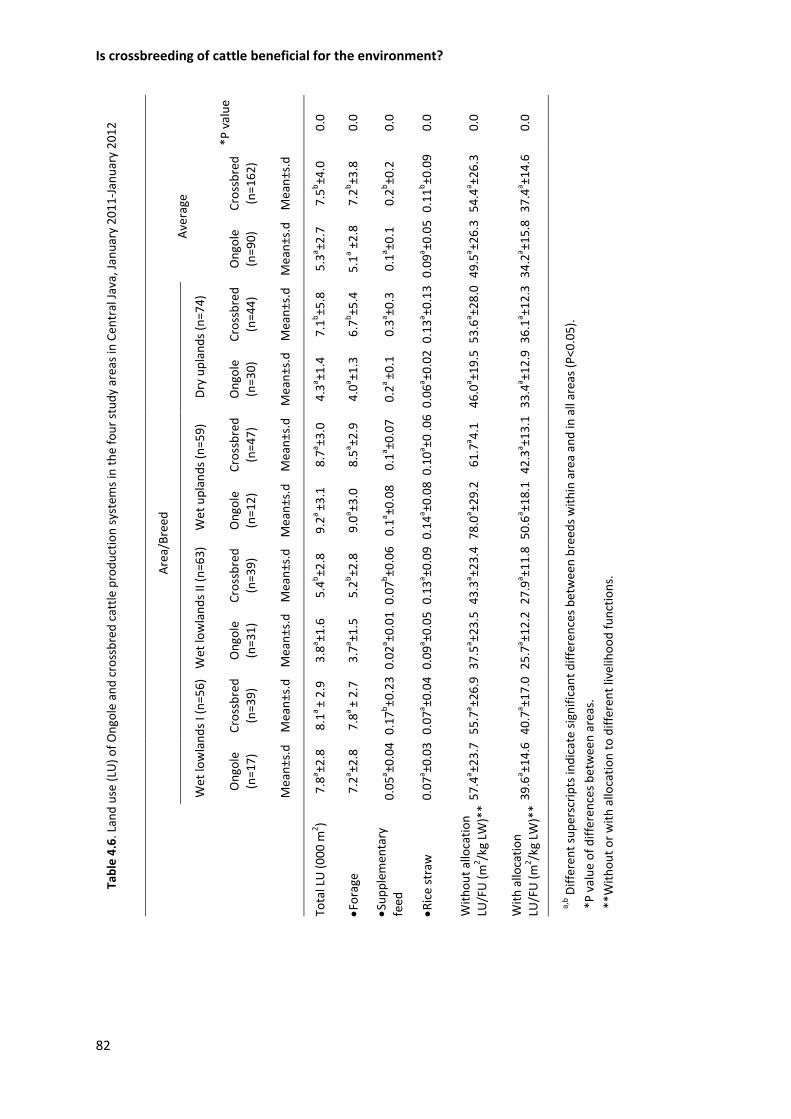
Is crossbreeding of cattle beneficial for the environment?
82
Table 4.6. Land use (LU
) of Ongole and crossbred cattle production systems in the four study areas in Cen
tral Java, January 2011‐January 2012
*P value
0.0
0.0
0.0
0.0
0.0
0.0
Average
Crossbred
(n=162)
Mean±s.d
7.5
b±4.0
7.2
b±3.8
0.2
b±0.2
0.11b±0.09
54.4
a ±26.3
37.4
a ±14.6
Ongole
(n=90)
Mean±s.d
5.3
a ±2.7
5.1
a ±2.8
0.1
a ±0.1
0.09a ±0.05
49.5
a ±26.3
34.2
a ±15.8
a,b Different superscripts indicate significant differences between breed
s within area and in
all areas (P<0.05).
*P value of differences between areas.
**Without or with allocation to different livelihood functions.
Area/Breed
Dry uplands (n=74)
Crossbred
(n=44)
Mean±s.d
7.1
b±5.8
6.7
b±5.4
0.3
a ±0.3
0.13a ±0.13
53.6
a ±28.0
36.1
a ±12.3
Ongole
(n=30)
Mean±s.d
4.3
a ±1.4
4.0
a ±1.3
0.2
a ±0.1
0.06a ±0.02
46.0
a ±19.5
33.4
a ±12.9
Wet uplands (n=59)
Crossbred
(n=47)
Mean±s.d
8.7
a ±3.0
8.5
a ±2.9
0.1
a ±0.07
0.10a ±0 .06
61.7
a 4.1
42.3
a ±13.1
Ongole
(n=12)
Mean±s.d
9.2
a ±3.1
9.0
a ±3.0
0.1
a ±0.08
0.14a ±0.08
78.0
a ±29.2
50.6
a ±18.1
Wet lowlands II (n=63)
Crossbred
(n=39)
Mean±s.d
5.4
b±2.8
5.2
b±2.8
0.07b±0.06
0.13a ±0.09
43.3
a ±23.4
27.9
a ±11.8
Ongole
(n=31)
Mean±s.d
3.8
a ±1.6
3.7
a ±1.5
0.02a ±0.01
0.09a ±0.05
37.5
a ±23.5
25.7
a ±12.2
Wet lowlands I (n=56)
Crossbred
(n=39)
Mean±s.d
8.1
a ± 2.9
7.8
a ± 2.7
0.17b±0.23
0.07a ±0.04
55.7
a ±26.9
40.7
a ±17.0
Ongole
(n=17)
Mean±s.d
7.8
a ±2.8
7.2
a ±2.8
0.05a ±0.04
0.07a ±0.03
57.4
a ±23.7
39.6
a ±14.6
Total LU (000 m
2)
Forage
Supplemen
tary
feed
Rice straw
Without allocation
LU/FU (m
2 /kg LW)**
With allocation
LU/FU (m
2 /kg LW)**
Chapter 4
83
required to produce one kilogram of live weight was slightly higher for crossbred cattle (37.4
m2) than for Ongole cattle (34.2 m2) (Table 4.6.). Amongst areas, the Wet lowlands I and
Wet uplands showed higher (P<0.05) total land use and land use per kilogram live weight
produced than the other two areas, both without and with economic allocation to the
different livelihoods functions. More home‐produced forage is used in these areas.
4.4. Discussion
Methodology: multi‐functionality
In this study, the cattle were components of mixed farming systems and served
multiple functions that were linked to each other. Including the various functions of cattle in
our LCA calculations resulted in approximately 30% lower emissions per unit of live weight
produced compared to the calculations in which multiple functions were not considered.
The estimate for the insurance function of cattle was relatively small (approximately 20%)
relative to the total value of cattle. This is in contrast with the finding of Widi et al. (2015)
that farmers regarded ‘saving’ as the most important motive for keeping cattle When
farmers need cash for big expenses, they sell one of their cattle. It seems likely that our
method of valuing the insurance function of cattle still underestimates the true value of this
function of keeping cattle in Indonesia. The function of security will remain important in the
future, as farmers regard cattle as an attractive way to accumulate capital (Widi et al.,
2015).
Farmers considered manure as the third most important motive for keeping cattle
(Widi et al., 2015). Our estimation of the economic value of manure (1.1% of the total
economic value of cattle keeping) seems to underestimate its real value. This estimate was
based only on the synthetic fertiliser N‐equivalent and therefore excludes the P and K values
of manure, and the positive effects of manure on soil organic matter and water‐holding
capacity (Hiernaux and Diawara, 2014). Manure production will be valued higher in the
future because farmers appreciate its effect on soil fertility and structure and because of the
rising cost of fertilisers.
The effect of crossbreeding on GWP and land use
Global studies have estimated that emission intensities for beef are highest in
developing regions, e.g. South Asia, Sub‐Saharan Africa, Latin America and the Caribbean,
and East and Southeast Asia (Gerber et al., 2013). Gerber et al. (2013) mention that the high
emissions in these regions are largely caused by low feed digestibility (leading to higher
enteric and manure emissions), poorer animal husbandry and lower slaughter weights (slow
growth rates leading to more emissions per kilogram of meat produced), and higher age at
slaughter (longer life leading to more emissions).
It is difficult to compare our results with other studies in the literature because the FU
differs. Our results are expressed as GWP per kilogram of live weight produced because the
weaners were sold to other farmers as breeding stock or to feedlot companies for fattening.

Is crossbreeding of cattle beneficial for the environment?
84
Other studies in the literature use a different FU, especially kilogram of carcass weight. Our
estimates of 27 to 29 kg CO2‐equivalents per kilogram of live weight are slightly higher
compared with the estimate of 46 kg CO2‐equivalents per kilogram carcass weight
(equivalent to 23 kg CO2‐eq per kilogram live weight at slaughter) in South Asia of Gerber et
al. (2013). Suckler beef systems in Ireland, United Kingdom (UK) and Canada have much
lower emissions, ranging from 5.6 to 11.2 kg CO2‐equivalents per kilogram of live weight
produced (de Vries and de Boer, 2010).
The global call for the intensification of livestock production to improve productivity in
order to reduce GHG emission intensities (Steinfeld et al., 2006; Herrero et al., 2010; Gerber
et al., 2013) is not supported by the results of our field research on the environmental
impact of crossbreeding in mixed farming systems of Central Java. The postulated paradigm
that breeding strategies, such as crossbreeding, can reduce the carbon footprint of cattle
production (Scholtz et al., 2012) is not straightforward in complex mixed farming systems. In
our case, intensification through crossbreeding resulted in increased production: 25% higher
body weights for adult crossbred cows and about 20% higher body weights for weaners
compared to local Ongole cattle (Widi et al., 2015). However there were no differences in
GWP per kilogram live weight produced between local Ongole and crossbred cattle
production systems. Crossbreds required more feed; they were fed more forages, which
were collected from the farm and communal sources or bought, and more supplementary
feeds, such as rice bran, pollard, compound concentrates, tofu (soybean curd) waste, and
soybean hulls (Table 4.2.). The advantage from the faster growth of crossbreds in terms of
reduced GWP per kilogram liveweight produced is counteracted by the higher emissions
from feed production for crossbreds. Thus the expectation that local breeds in local
production systems would have higher emissions per unit product than “improved” breeds,
in this case crossbred of Ongole and Simmental cattle, was not substantiated.
Crossbreeding did not result in lower land use. The Ongole and crossbred beef cattle
farms in the study areas had the same land use, approximately 36 m2 per kilogram of live
weight produced. Forages contributed the most to total land use. The use of supplementary
feeds was low. Crop by‐products, such as rice bran and maize cobs, have a low financial
value. Therefore only a small fraction of land use for crops is allocated to crop by‐products
for beef production.
Crossbreeding is not done in a systematic way. The majority of crossbred farmers keep
F1 stock, however, this is gradually changing towards F2 stock. Farmers do not prefer to
upgrade to higher levels of Simmental (Widi et al., 2015). The current crossbreeding
practices have not improved the environmental performance of cattle production in Central
Java. However, our estimates do not include the impact of crossbreeding on the final
fattening stage. This fattening is often done by butchers, large scale farmers (>50 heads) or
feedlots (>1,000 heads). Their feeding practices are comparable to those of the smallholders
in the present study. The only component in the crossbreeding strategy is the use of exotic
semen. Farmers do not receive any assistance in feeding and breeding management. Thus,
crossbreeding has not changed the farming systems in the study areas; herd sizes and

Chapter 4
85
management practices did not differ between farms with crossbred or Ongole breeding
stock. Crossbreeding has also not affected the motives for keeping cattle, which were
similar between Ongole and crossbred cattle farms (Widi et al., 2015).
Increasing animal productivity requires both better quality and greater quantities of
feed (Steinfeld et al., 2006; Gerber et al., 2013). Growing more feed crops might conflict
with other land uses, given the limited availability of land in Java. A current regulation
stipulates that farmers are not allowed to plant non‐food crops on productive lands (Setneg
RI, 1999). Farmers do not have sufficient cash to buy more forages and supplements. These
constraints suggest that there is little scope to increase the quality and quantity of feed.
Nevertheless, there is large heterogeneity among farmers; the coefficients of variation for
the overall emission intensities and land use are approximately 40 to 45%. The driving force
behind the differences between farmers is the difference in kilograms of live weight
produced. The 25thpercentiles of Ongole and crossbred farms with the lowest GWP per
kilogram live weight produced fed their animals more in terms of DM compared to other
farms. They also had lower calving intervals and higher body condition scores for their cows,
indicating that they managed their animals in a more efficient way (Table 4.4.).
Conservation of genetic resources and the relation with emissions and land use
In Indonesia, the policy of crossbreeding and the increasing demand for meat are
putting considerable pressure on local farm animal genetic resources. Policies that promote
crossbreeding run concurrently with more recent policies promoting breeding programmes
for local cattle (Widi et al., 2015). This paradox is also found in the international literature.
There is a large global literature on livestock biodiversity and the need for conserving local
farm animal genetic resources (Hall, 2004; FAO, 2007; FAO, 2010a). On the other hand, the
global literature considers local ruminant breeds as less efficient in their potential for
mitigating GHG emissions than improved breeds. Local ruminant breeds are expected to
have higher emission intensities than improved breeds as they are usually fed roughages
and crop residues only, and have low outputs (Steinfeld et al., 2006; FAO, 2010b).
Hoffmannn (2010) expressed concern that the pressure to reduce GHG emissions from
ruminants may disadvantage local breeds. In two of the study areas, Wet lowlands II and Dry
uplands, the local government has started a ‘Return to Ongole’ breeding programme. Our
results indicate that the promotion of local breeds does not necessarily conflict with efforts
to reduce the intensity of GHG emissions from cattle keeping in mixed farms in Java.
4.5. Conclusions
Crossbreeding (as a tool for intensification) was not more efficient in mitigating GHG
emissions and reducing land use per kilogram of live weight produced than local breeds in
the current smallholder farming systems in Central Java. The biggest contribution to GWP
was from enteric fermentation, which is closely related to the low quality of feeds available.
The advantage from the faster growth of crossbreds in terms of GWP and land use per
Is crossbreeding of cattle beneficial for the environment?
86
kilogram live weight produced was counteracted by the higher emissions and land use from
feed production for crossbreds.
Crossbreeding has not changed current cattle keeping practices. Only exotic semen is
provided; sustainable crossbreeding will require assistance in terms of feeding and breeding
management. This could improve environmental performance, as the farms with lower
emission intensities had, on average, lower calving intervals and higher body condition scores.
References
Bosman, H.G., H.A.J. Moll and H.M.J.Udo. 1997. Measuring and interpreting the benefits of goat keeping in tropical farm systems. Agr. Syst. 53: 349‐372.
BPS. 2009. Indonesia statistical data 2009. Statistics Indonesia. BPS (Available at www.bps.go.id).
Casey, J.W. and N.M. Holden. 2006. Quantification of GHG emissions from sucker‐beef production in Ireland. Agr. Syst. 90: 79 – 98.
Cederbeg, C., D. Meyer and A. Flysjö. 2009. Life Cycle Inventory of Greenhouse Emissions and Land Use of Land and Energy in Brazilian Beef Production. SIK Report No. 792.
Delgado, C., M.Rosegrant, H. Steinfeld, S. Ehui and C. Courbuis. 2000. Livestock to 2020: the next food revolution. Outlook Agr. 30: 27–29.
de Boer, I.J.M. 2003. Environmental impact assessment of conventional and organic milk production. Livest. Prod. Sci. 80: 69–77.
de Vries, M. and I.J.M de Boer. 2010. Comparing environmental impacts for livestock products: a review of life cycle assessments. Livest. Sci. 128: 1–11.
Ecoinvent v.2. available at www.pre.nl FAO. 2007.The State of World's Animal Genetic Resources for Food And Agriculture.FAO. Rome. FAO. 2010a. Breeding Strategies for Sustainable Management of Animal Genetic Resources. FAO
Animal Production and Health Guidelines. FAO, Rome. FAO. 2010b. Greenhouse Gas Emissions from the Dairy Sector: A Life Cycle Assessment. FAO, Rome. Gerber, P.J., H. Steinfeld, B. Henderson, A. Mottet, C. Opio, J. Dijkman, A. Falcucci and G. Tempio.
2013.Tackling Climate Change through Livestock‐ A Global Assessment of Emissions and Mitigation Opportunities. FAO. Rome.
Hall S.J.G. 2004.Livestock Biodiversity. Genetic Resources for theFarming of the Future. Blackwell, Oxford.
Hardjosubroto, W. 1994. AplikasiPemuliabiakanTernak di Lapangan. Grasindo. Jakarta. Hartadi, H., S. Reksohadiprodjo and A.D. Tillman.2005. Tabel Komposisi Pakan untuk Indonesia.
GadjahMada University Press, Yogyakarta. Herrero, M., P.K. Thornton, A.M. Notenbaert, S. Wood, S. Masangi, H.A. Freeman, D. Bossio, J. Dixon,
M. Peters, J. van de Steeg, J. Lynam, P. Parthasarathy Rao, S. MacMillan, B. Gerard, J. McDermott, C. Sereand M. Rosegrant. 2010. Smart investments in sustainable food production: revisiting mixed crop‐livestock systems. Science 327: 822‐825.
Hiernaux, P and M.O. Diawara. 2014. Livestock: recyclers that promote the sustainability of smallholders farms. Rural 21: 9‐11.
Hoffmannn, I. 2010. Climate change and the characterization, breeding and conservation of animal genetic resources. Anim. Genet. 41: 32‐46
IPCC. 2006. Intergovernmental Panel of Climate Change Vol. 4. Guidelines for National Greenhouse Gas Inventories IGES, Japan.
IPCC. 2007. Climate change. IPCC Fourth Assessment Report. UK: CambridgeUniversity Press, Cambridge.
ISO 14040. 1997. Environmental Management‐Life Cycle Assessment:Principles and Framework.International Organzation for Standardization, Geneva.
Chapter 4
87
ISO 14041. 1998. Environmental Management‐Life Cycle Assessment: Goal and Scope Definition and Inventory Analysis. International Organzation for Standardization, Geneva.
ISO 14042. 2000. Environmental Management ‐ Life cycle Assessment: Life Cylce Impact Assessment. International Organzation for Standardization, Geneva.
ISO 14044. 2006. Environmental Management‐Life Cycle Assessment: Requirements and Guidelines.International Organzation for Standardization, Geneva.
Kahi, A.K., G. Nitter, W. Thorpe and C.F.Gall. 2000. Crossbreeding for dairy production in the lowlands tropics of Kenya: II. Prediction of performance of alternative crossbreeding strategis.Livest. Prod. Sci. 63: 55‐63.
McDermott,J.J., S.J. Staal, H.A. Freeman, M.Herrero and J.A. van de Steeg. 2010. Sustaining intensification of smallholder livestock systems in the tropics. Livest. Sci. 130: 95‐109.
Moll, H.A.J. 2005. Cost and benefits of livestock systems and the role of market and non‐market relationships.J. Agr. Econ. 32: 181‐193.
Moll, H.A.J., S.J. Staal, and M.N.M. Ibrahim.2007. Smallholder dairy production and markets: a comparison of production systems in Zambia, Kenya and Sri Lanka. Agr. Syst. 94: 593‐603.
Moore, J.A. and M.J. Gamroth. 1993. Calculating the Fertilizer Value of Manure from Livestock Operations. Oregon State University Extension Service.
Nguyen, T.L.T., J.E.Hermansen and L. Mogensen. 2010. Environmental concequences of different beef production system in the EU. J. Clean. Prod. 18: 756‐766.
Ott, R.L. and M. Longnecker. 2010. An Introduction to Statistical Methods and Data Analysis. Sixth edition. Brooks/Cole, Cengage Learning. Belmont, Ca.
Otte, J. and M. Upton. 2005. Poverty and livestock agriculture. In : Animal Production and Animal Science Worldwide. WAAP book of the year.Wageningen Academic Publisher, The Netherlands, pp 281‐285.
Palte, J.G.L. 1989. Upland farming on Java, Indonesia: a socio‐economic study of upland agriculture and subsistence under population pressure. Nederlanse Geografische Studies no. 97, Utrecht.
Phong, L.T., I.J.M. de Boer and H.M.J. Udo. 2011. Life cycle assessment of food production in integrated agricultire‐aquaculture systems of Mekong Delta. Livest. Sci. 139: 80‐90.
Pica‐Ciamarra, U. 2007. Livestock Policies for Poverty Alleviation: Theory and Practical Evidence from Africa, Asia and Latin America. FAO / PRLPI Working Paper No. 27, FAO, Rome.
Samdup, T., H.M.J. Udo, M.N.M. Ibrahim and A.J. van der Zijpp.Crossbreeding and intensification of smallholder crop‐cattle farming systems in Bhutan. Livest. Sci. 132: 126‐134.
Scholtz, M.M., Y. Steyn, E.v. Marle‐Koster, and H.E.Theron. 2012. Improved production efficiency in cattle to reduce their carbon footprint for beef production. S. Afr. J. Anim. Sci. 42(5): 450‐453
Setneg, RI. 1999. UU No. 41: Perlindungan Lahan Pertanian Pangan Berkelanjutan. Sekretariat Negara Republik Indonesia (Available at http://perundangan.pertanian.go.id/admin/uu/UU‐41‐09.pdf).
Simapro 7.3. Amersfoort. PRé Consultants. Available at www.pre.nl. Steinfeld, H., P. Gerber, T. Wassenaar, V. Castel, M. Rosales and C. de Haan. 2006. Livestock's Long
Shadow: Environmental Issues and Options. FAO. Syrstard, O. 1996. Dairy cattle crossbreeding in the tropics: choice of crossbreeding strategy. Trop.
Anim. Health. Prod. 28: 223‐229. Udo,H.M.J., H.A. Aklilu, L.T. Phong, R.H. Bosma, I.G.S. Budisatria, B.R.Patil, T. Samdup, and B.O. Bebe.
2011. Impact of intensification of different types of livestock production in smallholder crop‐livestock systems. Livest. Sci. 139: 22‐29.
Wall, E., G. Simm, and D. Moran. 2009. Developing breeding schemes to assist mitigation of greenhouse gas emissions. Animal 4(3): 336 ‐ 376.
Weiler, V., H.M.J.Udo, T. Viets, T.Crane, and I.J.M. de Boer. 2014. Handling multi‐functionality of livestock in a life cycle assessment: The case of smallholder dairying in Kenya. Curr. Opin. Environ. Sustain. 8: 29‐38.
Is crossbreeding of cattle beneficial for the environment?
88
Widi, T.S.M. 2004. Livestock sharing arrangements in the Province of Yogyakarta Special Region; perspectives from different stakeholders. MSc Thesis. Wageningen University, Wageningen.
Widi, T.S.M., H.M.J. Udo, K. Oldenbroek, I.G.S. Budisatria, E. Baliarti & A.J. van der Zijpp. 2015. Is crossbreeding beneficial for mixed farming systems in Central Java? Anim. Genet. Resour. (in press).
Williams, A.G., E. Audsley and D.L. Sandars. 2006. Determining the Environmental Burdens and Resource Use in the Production of Agricultural and Horticultural Commodities. Main ReportDefra Research Project ISO205, Cranfield University and Defra, Bedford.
Woldegebriel, D. 2013. Life cycle assessment of milk production in Mekelle, Ethiopia. MSc Thesis. Wageningen University.
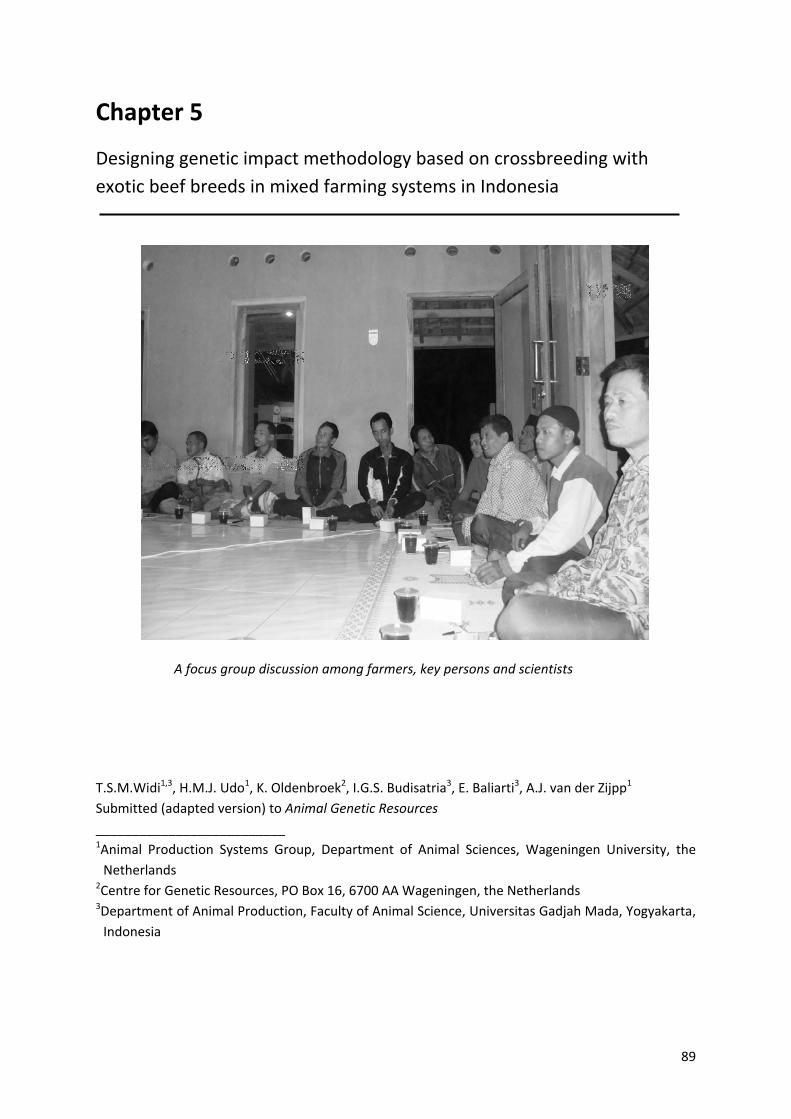
89
Chapter 5
Designing genetic impact methodology based on crossbreeding with
exotic beef breeds in mixed farming systems in Indonesia
T.S.M.Widi1,3, H.M.J. Udo1, K. Oldenbroek2, I.G.S. Budisatria3, E. Baliarti3, A.J. van der Zijpp1
Submitted (adapted version) to Animal Genetic Resources
__________________________ 1Animal Production Systems Group, Department of Animal Sciences, Wageningen University, the
Netherlands 2Centre for Genetic Resources, PO Box 16, 6700 AA Wageningen, the Netherlands 3Department of Animal Production, Faculty of Animal Science, Universitas Gadjah Mada, Yogyakarta,
Indonesia
A focus group discussion among farmers, key persons and scientists
Designing impact methodology
90
ABSTRACT
A genetic impact assessment is developed based on identification of issues and
indicators for two case studies on crossbreeding with exotic beef breeds in mixed farming
systems in Indonesia. The Indonesian government is stimulating the country’s beef
production by crossbreeding with exotics. In Madura the locally adapted Madura cattle are
crossed with Limousin sires, and in Java the locally adapted Ongole cattle are crossed with
Simmental sires. The Madura case study explores the impact of crossbreeding on the
cultural values of cattle and their productivity. The Central Java case study explores the
impact of crossbreeding on beef production, the mixed farming systems and the
environment for different agro‐ecological zones. During focus group discussions, farmers
and other stakeholders mentioned relevant crossbreeding issues. Farmers identified
economic benefits, feed availability, cattle management, animal performance, additional
functions of cattle, and health and fertility as issues. Other stakeholders mentioned meat
production, environmental quality and diversity in farm animal genetic resources as
important issues. Indicators were chosen for these issues at farm level. The indicators were
tested with data from the two case studies. The Madura case shows that crossbreeding for
meat yield may not be competitive with income from cultural values of cattle. The case
study on the crossbreeding of Ongole and Simmental in Java shows, meat production has
increased with crossbreeding, but labour productivity was negatively affected and
environmental performance not improved. Therefore crossbreeding may not always be an
automatic choice to improve cattle production.
Keywords: Genetic impact, Crossbreeding, Mixed farming systems, Java, Madura
Chapter 5
91
5.1. Introduction
Indonesia is an emerging economy with an increasing demand for beef. To meet this
demand, the Indonesian government has adopted a strategy of importing exotic breeds
since 1980. The locally adapted native breeds, (for this FAO definition see Martyniuk et al.,
2010), which are usually the Bos indicus or Bos sondaicus type, are crossed with exotic Bos
taurus cattle, such as Simmental and Limousin. In the last decade, this has become the
dominant breeding strategy on smallholder farms in densely populated areas (Sudardjat and
Pambudy, 2003; Sutresniwati, 2006). Many different types of cattle currently exist in
Indonesia as a result of the crossbreeding policy and the locally adapted native breeds are
declining in numbers.
Worldwide, the introduction of exotic livestock is an important element in the
intensification of farming systems. Intensification is expected to contribute to the required
increased production of animal source foods, to improve the livelihoods of rural households
and to reduce the environmental impacts of the production of animal source foods
(Steinfeld et al., 2006; Gerber et al., 2013). The introduction of exotic stock is often done
unsystematically and this threatens the existence of locally adapted native breeds (Mathias
and Mundy, 2005). In addition, exotic genes are often introduced without prior
consideration of the consequences for the farming systems concerned (Wollny, 2003;
Marshall, 2014).
According to the CBD (Convention on Biological Diversity) regulations, the national
government is responsible for its farm animal genetic resources. This genetic diversity
comprises locally adapted native breeds that were developed in the past in a certain
(isolated) area and are, by natural selection, adapted to a specific local environment (feed
availability, climate, disease threats). These adaptations to different circumstances have led
to a wide variety of breeds worldwide. Selection by farmers for specific breeding goals
related to their specific production systems has enhanced the farm animal genetic diversity,
i.e. breeds and subpopulations of breeds.
Threats to the loss of local farm animal genetic diversity from breeding strategies
should be assessed and eliminated before the strategies are implemented. Breeding
strategies, such as crossbreeding and importation of exotic breeds, are traditionally
evaluated at the level of the individual animal (Syrstad, 1996); only the impact of the
strategy on the characteristics of the animals is assessed. New breeding strategies, which
involve exotic breeds, should be evaluated, however, at different levels in the food
production chain and across a range of technical, socio‐economic and environmental issues
(Hall and Bradley, 1995; Gandini and Oldenbroek, 2007; Samdup et al., 2010; Marshall,
2014). Hall and Bradley (1995) state that, in analogy with the ‘environmental impact
statement’ for infrastructural projects, livestock development proposals should be
evaluated beforehand with a ‘genetic impact assessment’ (GIA).
No exact definitions nor methodologies have been proposed for a GIA. In this study, a
GIA is defined as an assessment that establishes the effect of a change in the genetic make‐
Designing impact methodology
92
up of a population on its performance in the actual socio‐economic and ecological context.
A GIA can help to ensure that initiatives for livestock development include the conservation
and sustainable use of biodiversity. GIA provides opportunities to ensure that other values
(such as cultural values) are also recognised and to ensure that only livestock development
initiatives are introduced, which are socio‐economically and ecologically appropriate in the
given context. The objective of a GIA is to make farmers, policy makers and other
stakeholders aware of the consequences of introducing exotic breeds in local production
systems, and to identify the changes that are required to ensure a successful introduction.
Such changes may include: availability of concentrates to improve the quality of diets,
management of fertility and disease, and performance recording. In an ideal situation,
breeding policies are established based on the outcomes of a GIA and comprise the relevant
aspects and opportunities of the breed(s), farming systems and livelihoods.
This study aims to develop a GIA that identifies and assesses the consequences for the
different stakeholders, especially farmers, of crossbreeding with exotic beef breeds in mixed
farming systems in Indonesia. The GIA is developed for two specific situations. Firstly, a
comparison of the Madura cattle breeding systems versus the exotic crossbreeding system
in Madura. Secondly, a comparison of the Ongole breed (in Indonesia called Peranakan
Ongole) with the exotic crossbreeding system in Java.
5.2. Conceptual framework
Impact assessments
Comprehensive impact assessments of livestock innovations, including introductions
of new breeding strategies, require indicators at several levels varying from the global level
(e.g. climate change impact) to farm level (e.g. contributions to livelihoods) (Oosting, 2002;
Udo et al., 2011; Marshall, 2014). Sustainability analysis, sustainable livelihoods approaches,
and life cycle assessment (LCA) are examples of methods or approaches for conducting
comprehensive assessments of innovations at different aggregation levels (Chambers and
Conway, 1992; Ellis, 2000; de Boer, 2003; Mollenhorst, 2005). These approaches include the
agro‐ecological impact at regional level and the socio‐economic impact at household level.
Studies using these approaches have inspired the current study and the development of a
GIA and its implementation in the context of the introduction of exotic genes in smallholder
cattle systems in Indonesia. Common steps in the approaches mentioned above are:
identification of stakeholders and issues using a participatory approach, literature review
and expert consultation, selection of indicators and integrative assessment (Bell and Morse,
2003; Mollenhorst, 2005). The issues and indicators are placed in the different aggregation
levels with which they are associated (Oosting, 2002; Cornelissen, 2003). In this study we
focus on the farm level. Our approach to developing a GIA is shown in Figure 5.1.

Chapter 5
93
Figure 5.1. Process of developing a GIA model, based on two case studies
Identification of stakeholders
Stakeholders are individuals or groups who participate in the value chain of cattle to
realise their own goals and on whom the production system depends. Different
stakeholders may have different goals and different perceptions about the relative
importance of the various components of the system (Eilers et al., 2001). Oldenbroek (2007)
concludes that many stakeholders are involved in the introduction of exotic genes and the
conservation and use of animal genetic resources: national governments, institutes for
research and education (including universities), non‐governmental organisations, breeders’
associations, farmers and pastoralists, part‐time farmers and hobbyists, and breeding
companies. In Indonesia, traders and butchers also play an important role in the value chain
of cattle, but do not have much influence on Indonesian agricultural policy, which is
dominated by governmental authorities.
Sutresniwati (2006) divides the stakeholders of crossbreeding in Indonesia into
primary (farmers and government) and secondary (scientists, inseminators, vets, cattle
traders, butchers and food sellers) stakeholders. Ultimately, livestock keepers are the key

Designing impact methodology
94
actors in managing the different types and breeds of animals. Therefore the farm and
household level is the level where most changes caused by breeding policies will occur, such
as changes in feeding, reproduction, growth, livelihood, income, environmental effects and
food safety (Marshall, 2014). For this reason and because our data were sampled and
analysed at farm level, we emphasise the impacts of crossbreeding at farm level and the
implications of these impacts for policy makers.
Identification and determination of issues
Participatory methods involving a heterogeneous group of stakeholders maximise the
chance of obtaining a complete list of relevant issues (Mollenhorst, 2005). Participatory
methods facilitate the exchange of ideas, experiences and knowledge of relevant
stakeholders and create a basis for implementation of the final results (Chambers et al.,
1989; Mollenhorst, 2005). A SWOT (strengths and weaknesses, opportunities and threats)
analysis is often used for the identification of issues (Mollenhorst, 2005) and this method is
also used in this study.
Selection of indicators
For each selected issue, indicators have to be defined and selected. Relevance
(appropriate for the context and objectives), realism (data are available and easy to
measure) and end user value (easy for the users to interpret) are often mentioned as the
selection criteria for indicators (Hiemstra et al., 2006; Lebacq et al., 2013). Data will not
always be available for a GIA, in particular when comparable data do not exist or when the
environment in which the exotic breed is raised differs significantly from the environment of
the local breed. If data are unavailable, qualitative estimations can be used for indicators.
Integrative assessment and GIA overview
Once the stakeholders and issues have been identified and selected, the indicator
scores need to be determined. Following this step, a GIA overview can be developed.
Assessment of the impacts can be done by appraising the positive and negative impacts for
the qualitative indicators and by normalising the quantitative indicators and comparing the
different indicator types. A useful device for visualising and communicating outputs is an
amoeba (often called a spider web) diagram. Each arm represents an indicator and this
enables the comparison of indicators (ISPC, 2014). The results are inevitably context specific
with regard to time and location. For this study, the results are specific to the current
situation in Indonesia. The final model depends on the relevance and importance of the
issues, the quantitative and qualitative indicators and the accessibility of data. Application
of the GIA model to different cases can provide information about the generic applicability
of the model.
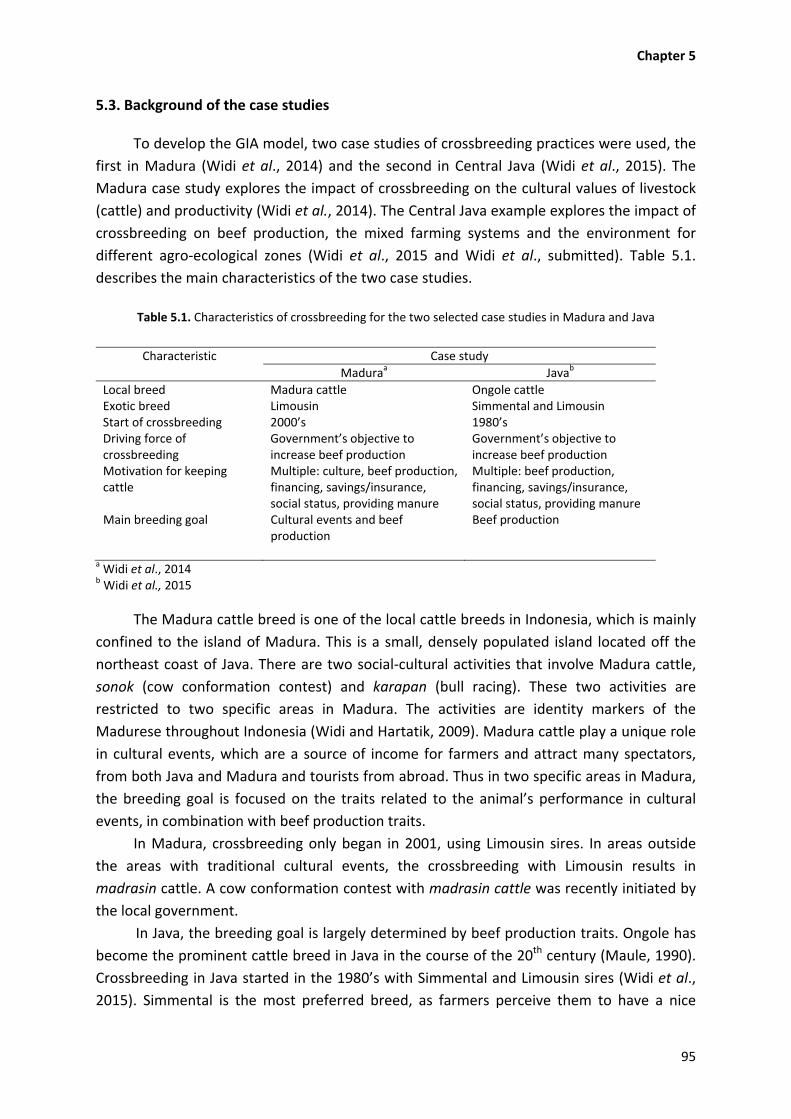
Chapter 5
95
5.3. Background of the case studies
To develop the GIA model, two case studies of crossbreeding practices were used, the
first in Madura (Widi et al., 2014) and the second in Central Java (Widi et al., 2015). The
Madura case study explores the impact of crossbreeding on the cultural values of livestock
(cattle) and productivity (Widi et al., 2014). The Central Java example explores the impact of
crossbreeding on beef production, the mixed farming systems and the environment for
different agro‐ecological zones (Widi et al., 2015 and Widi et al., submitted). Table 5.1.
describes the main characteristics of the two case studies.
Table 5.1. Characteristics of crossbreeding for the two selected case studies in Madura and Java
Characteristic Case study
Maduraa Javab
Local breed Madura cattle Ongole cattleExotic breed Limousin Simmental and Limousin Start of crossbreeding 2000’s 1980’sDriving force of crossbreeding
Government’s objective to increase beef production
Government’s objective to increase beef production
Motivation for keeping cattle
Multiple: culture, beef production, financing, savings/insurance, social status, providing manure
Multiple: beef production, financing, savings/insurance, social status, providing manure
Main breeding goal Cultural events and beef production
Beef production
a Widi et al., 2014 b Widi et al., 2015
The Madura cattle breed is one of the local cattle breeds in Indonesia, which is mainly
confined to the island of Madura. This is a small, densely populated island located off the
northeast coast of Java. There are two social‐cultural activities that involve Madura cattle,
sonok (cow conformation contest) and karapan (bull racing). These two activities are
restricted to two specific areas in Madura. The activities are identity markers of the
Madurese throughout Indonesia (Widi and Hartatik, 2009). Madura cattle play a unique role
in cultural events, which are a source of income for farmers and attract many spectators,
from both Java and Madura and tourists from abroad. Thus in two specific areas in Madura,
the breeding goal is focused on the traits related to the animal’s performance in cultural
events, in combination with beef production traits.
In Madura, crossbreeding only began in 2001, using Limousin sires. In areas outside
the areas with traditional cultural events, the crossbreeding with Limousin results in
madrasin cattle. A cow conformation contest with madrasin cattle was recently initiated by
the local government.
In Java, the breeding goal is largely determined by beef production traits. Ongole has
become the prominent cattle breed in Java in the course of the 20th century (Maule, 1990).
Crossbreeding in Java started in the 1980’s with Simmental and Limousin sires (Widi et al.,
2015). Simmental is the most preferred breed, as farmers perceive them to have a nice
Designing impact methodology
96
appearance. Due to the change in breeding policy in recent decades, crossbreds currently
form a major part of the cattle population in Central Java. In this case study, Ongole cattle
are compared to Simmental crossbred cattle in four agro‐ecological zones, namely Wet
lowlands I and II (the difference between I and II is the attention given to Ongole breeding in
II), Wet uplands, and Dry uplands (Widi et al., 2015).
5.4. Materials and methods
The Madura case study and the Central Java case study were used to identify issues
and to determine indicators. These studies focused at the farm level and were based on in‐
depth investigation of groups of farmers, their cattle and cultural events.
Stakeholders and the strengths and weaknesses of crossbreeding
We identified the different stakeholders from a literature review and from prior
discussions with experts who are involved in crossbreeding. We categorised the
stakeholders as primary or secondary stakeholder groups. The key primary stakeholders are
smallholder farmers. Large‐scale commercial farmers, feedlot companies, and farmers’
groups were also asked for their opinions about crossbreeding. In the Madura case study,
farmers were divided into conventional farmers and cultural (karapan and sonok) farmers.
The cultural farmer groups play an important role in maintaining cultural events with
Madura cattle, and in determining the direction of breeding goals.
Other primary stakeholders in crossbreeding are policy makers. The policy makers
consulted in this study were representatives from central government and their supporting
team of scientists and experts from universities.
Secondary stakeholders are representatives of local government and services, such as
AI companies, inseminators, veterinarians and extension workers. Traders (including middle
men), butchers and meat retailers are also secondary stakeholders.
Seven focus group discussions (FGDs) amongst farmers and key persons, such as the
heads of farmers’ groups and village elders, were held in the period from July to December
2009. In total, 296 participants (60 in wet lowlands I, 86 in wet lowlands II, 65 in wet uplands
and 85 in dry uplands) in Central Java, and 125 participants (40 in karapan, 45 in sonok and
40 in madrasin areas) in Madura were involved in the FGDs. A SWOT analysis was done
during each FGD. Each FGD took between three and five hours. Most of the stakeholders,
particularly farmers, found it difficult to distinguish between strength and opportunity and
between weakness and threat. We therefore chose not to distinguish between internal and
external factors and the SWOT analysis is in effect a SW analysis. The FGDs were rather
informal; they were led by the first author of this paper, assisted by undergraduate
students.
Two workshops with other stakeholders were held in July 2009 and March 2010. The
aim of the first workshop (July 2009) was to identify the critical issues and the indicators, by
brainstorming and using SW analysis. In total, 145 participants were involved in this
Chapter 5
97
workshop. The second workshop (March 2010), with a similar purpose as the first workshop,
involved 32 inseminators and reproduction service staff from AI companies and 7 scientists.
During the two workshops, scientists gave presentations on crossbreeding issues; the
presentations covered problems with crossbreeding and provided evidence of the
advantages and disadvantages. The animal scientists were also actively involved in the
discussions with farmers in such a way that their critical overview helped to clearly
formulate the farmers’ issues.
Identification of issues, selection of indicators, and indicator scores
Relevant issues were selected on the basis of the participatory SW analysis, literature
review and expert consultation. The main issues from the case studies were chosen based
on the frequencies of the issues raised in the SW‐analysis. For each selected issue, we
defined potential indicators, which fulfilled the required criteria such as relevance, realism,
and end user values. The indicators were defined and selected based on the differences
found between the locally adapted native breeds and crossbred cattle in the two case
studies. Qualitative or quantitative indicators were selected.
When crossbreeding gave a positive impact compared to the locally adapted native
breeds, it was judged as positive. Neutral was given in the situation when crossbreeding
gave a similar result or no change compared to the locally adapted native breeds. Negative
was given when the result of crossbreeding was lower (gives a decrease) compared to the
locally adapted native breeds. For quantitative indicators, the assessments of positive,
neutral and negative were given based on statistically significant differences between the
results of crossbreds and local breeds.
Amoeba diagrams were used to visualise the GIA at farm level. For each selected
quantitative indicator, we defined minimum (Bmin) and maximum (Bmax) benchmarks,
enabling us to rescale indicator values into scores between 0, indicating a worst‐case
situation, and 100, indicating an optimal situation. This rescaling enables the comparison of
indicators for different aspects of sustainability (Meul et al., 2008). To normalise the score
for each indicator, the performance was converted into a scale from 0 through 100, using
formulas (1) and (2).
Score = 100 (y‐Bmin)/(Bmax‐Bmin) (1)
Score = ‐100 (y+Bmax) / (Bmax – Bmin) (2)
where y is the observed value, Bmax is the 90
th percentile observation and Bmin is the 10th
percentile observation. Formula (1) was applied when the desirable situation is the
maximum value, e.g. growth rate, phenotypic and reproductive performances and feed
consumption. Otherwise, formula (2) was applied, e.g. for environmental impact indicators.
The tenth percentile of best performing farms within our data were given a score of
100, whereas the tenth percentile of worst performing farms were given a value of 0.
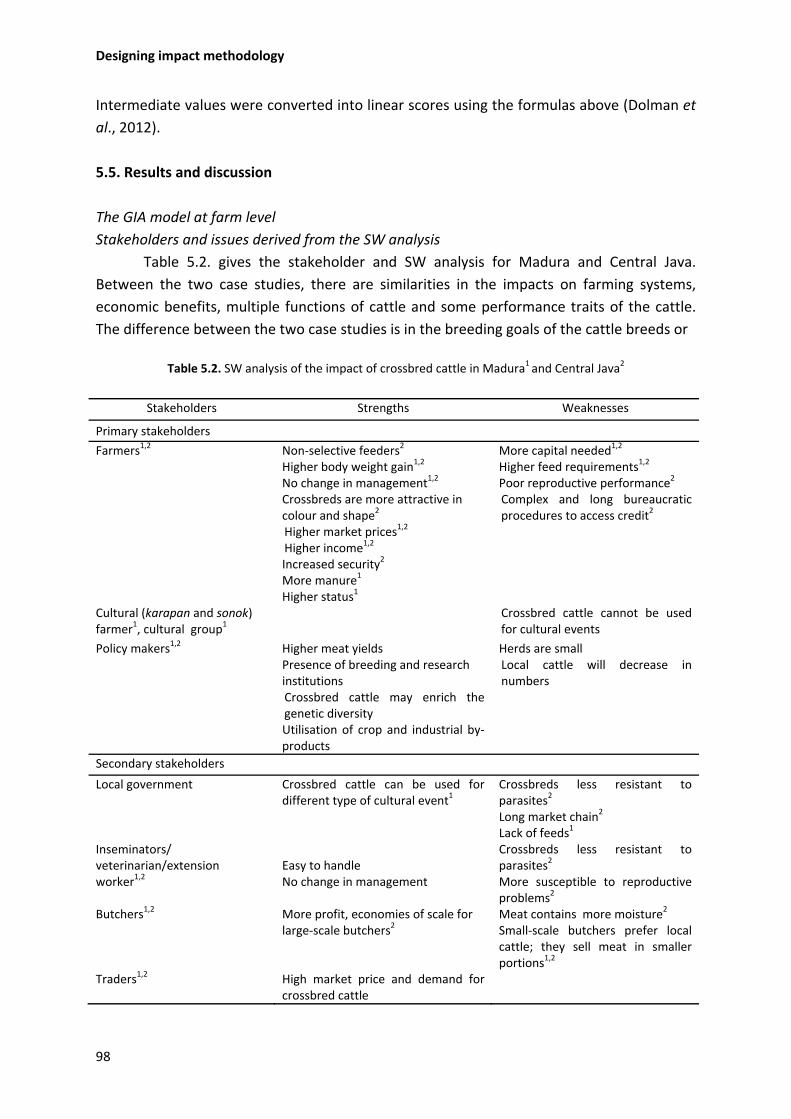
Designing impact methodology
98
Intermediate values were converted into linear scores using the formulas above (Dolman et
al., 2012).
5.5. Results and discussion
The GIA model at farm level
Stakeholders and issues derived from the SW analysis
Table 5.2. gives the stakeholder and SW analysis for Madura and Central Java.
Between the two case studies, there are similarities in the impacts on farming systems,
economic benefits, multiple functions of cattle and some performance traits of the cattle.
The difference between the two case studies is in the breeding goals of the cattle breeds or
Table 5.2. SW analysis of the impact of crossbred cattle in Madura1 and Central Java2
Stakeholders Strengths Weaknesses
Primary stakeholders
Farmers1,2 Non‐selective feeders2 More capital needed1,2 Higher body weight gain1,2 Higher feed requirements1,2 No change in management1,2 Poor reproductive performance2
Crossbreds are more attractive in colour and shape2
Complex and long bureaucratic procedures to access credit2
Higher market prices1,2
Higher income1,2
Increased security2
More manure1
Higher status1
Cultural (karapan and sonok) farmer1, cultural group1
Crossbred cattle cannot be used for cultural events
Policy makers1,2 Higher meat yields Herds are small Presence of breeding and researchinstitutions
Local cattle will decrease in numbers
Crossbred cattle may enrich the genetic diversity Utilisation of crop and industrial by‐products
Secondary stakeholders
Local government Crossbred cattle can be used for different type of cultural event1
Crossbreds less resistant to parasites2 Long market chain2 Lack of feeds1
Inseminators/ veterinarian/extension worker1,2
Easy to handle No change in management
Crossbreds less resistant to parasites2 More susceptible to reproductive problems2
Butchers1,2 More profit, economies of scale for large‐scale butchers2
Meat contains more moisture2
Small‐scale butchers prefer local cattle; they sell meat in smaller portions1,2
Traders1,2 High market price and demand for crossbred cattle
Chapter 5
99
sub‐populations of breeds. In Java, cattle are kept mainly for meat production and growth
determines the breeding goal. In Madura, cultural aspects strongly affect the decision of
farmers to keep local cattle with specific characteristics, which fulfil the performance
requirements in the areas with traditional cultural events. Because the sonok and madrasin
cultural events require well developed animals, this does not conflict with the second
breeding goal, beef production. Farmers in both case study areas, with the exception of
sonok farmers, consider the high growth rate of crossbred cattle as their major strength. As
a consequence of the higher growth rate, higher market prices for crossbred progeny are
expected. Farmers mentioned that when they want to purchase and keep crossbreds, they
need more capital and the crossbred’s requirements for feed are higher. Farmers consider
the opportunities to access cash and to obtain the required credit to purchase and keep
crossbred cattle to be limited. For example, after selling an animal to a butcher or trader, it
may take a long time before the money is transferred to the farmer. Cultural farmers in
Madura do not like crossbreds, as crossbreds cannot be used for traditional cultural events.
In Central Java, farmers like the non‐selective feeding habits of crossbreds; crossbreds
consume whatever is available, irrespective of the quality of the feed. Farmers are worried
about the reproductive performance of crossbreds, in particular crossbreds with a high
percentage of exotic genes. This concern was confirmed by the veterinarians.
Policy makers perceived ‘high meat yield’ as the greatest strength of crossbreds. This
was also the most important reason for their promotion of crossbreeding. Policy makers
appeared to neglect the higher feed requirements, reproductive failure and higher land use
of crossbreds. Traders and butchers were also in favour of crossbreds, except the small‐
scale butchers and bakso sellers. The latter prefer to slaughter local cattle, as they sell meat
in small portions (Widi et al., 2014). Scientists mentioned preservation of local breeds,
cultural events and environmental impacts as areas of concern in the case of uncontrolled
crossbreeding or upgrading with exotic breeds.
Limitations of the SW analysis
SW‐analysis was a useful tool in our case studies and facilitated the next step of
exploring issues at farm level. In these discussions, it was very difficult for the stakeholders
to distinguish between strengths and opportunities and between weaknesses and threats.
Opportunities were also considered as strengths and threats as weaknesses. This proved not
to be a problem for the identification of issues in this study. However, when the ultimate
goal of the SWOT analysis would have been the establishment of action plans for individual
stakeholders, this approach would have been less appropriate.
Issues
The following issues were identified in the SW analysis and considered to be relevant
at farm level: economic benefits, feed availability, cattle management, performance of the
animals, additional functions of cattle including the cultural value, health, fertility and
environmental effects. The issues are included in Figure 5.2. and may impact on more than
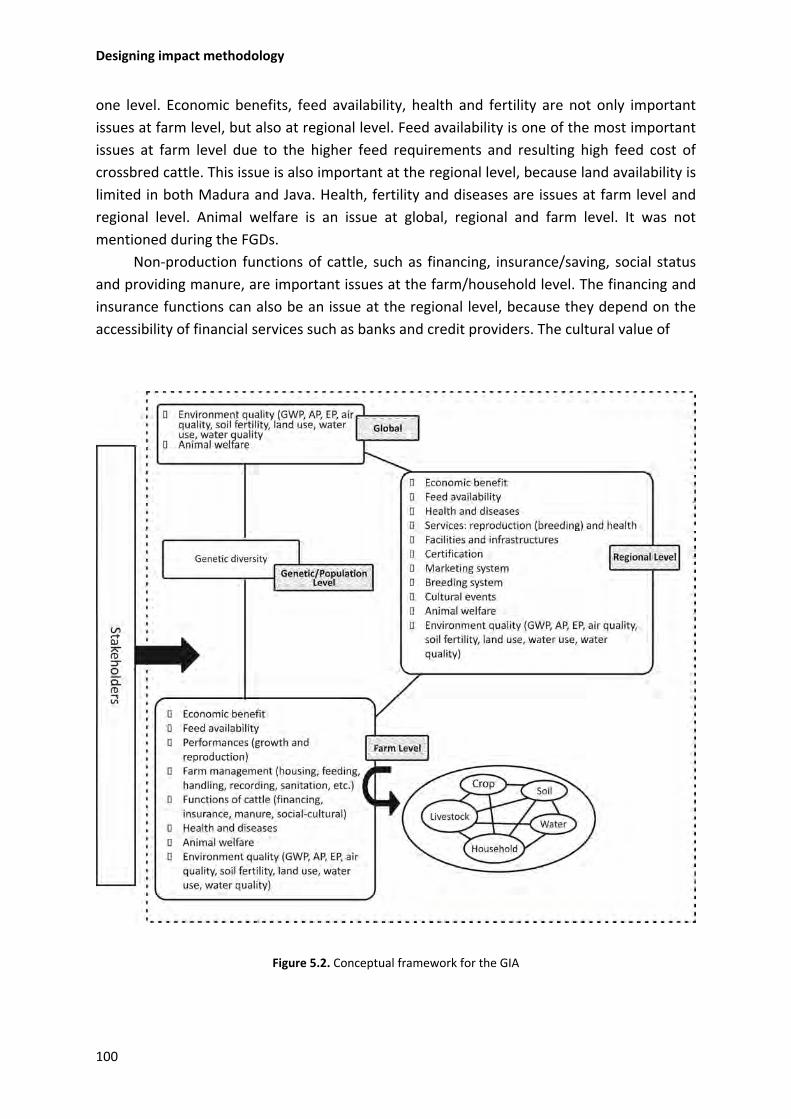
Designing impact methodology
100
one level. Economic benefits, feed availability, health and fertility are not only important
issues at farm level, but also at regional level. Feed availability is one of the most important
issues at farm level due to the higher feed requirements and resulting high feed cost of
crossbred cattle. This issue is also important at the regional level, because land availability is
limited in both Madura and Java. Health, fertility and diseases are issues at farm level and
regional level. Animal welfare is an issue at global, regional and farm level. It was not
mentioned during the FGDs.
Non‐production functions of cattle, such as financing, insurance/saving, social status
and providing manure, are important issues at the farm/household level. The financing and
insurance functions can also be an issue at the regional level, because they depend on the
accessibility of financial services such as banks and credit providers. The cultural value of
Figure 5.2. Conceptual framework for the GIA
Chapter 5
101
local cattle can be an issue at regional level, as is the case in Madura, where traditional
events attract tourists from abroad and create economic benefits for non‐farmers.
Indicators
The quantification of indicators for the different issues in the Madura and Central
Java case studies was based on Widi et al. (2014) and Widi et al. (2015). For the Madura
case study, we selected indicators for the following issues: economic benefit, cattle
management, performance and additional functions of cattle. Economic benefit was
represented by labour productivity, expressed as GM per family labour hour per day (IDR
per h d‐1) (Moll, 2005; Moll et al., 2007). Performance was represented by an indicator for
the live weight of cows, expressed in kilograms (kg), and an indicator for the appearance of
cows, represented by the selling price of cows at 1.5 years of age, expressed in thousands of
Indonesian Rupiah per cow (000 IDR). The additional functions of cattle were represented
by a qualitative indicator which gave the relative importance (ranking) of the following
functions: cultural, financing, insurance/saving, social status, draught power and providing
manure.
We defined indicators for the following issues at farm level for the Central Java case:
economic benefit, feed availability, cattle management, performance, additional functions
of cattle, health and environmental quality. The economic benefit and cattle management
issues were represented by the same indicators as in the Madura case study. Two
quantitative indicators were used to measure feed availability, daily consumption of dry
matter (DM) and crude protein (CP), both expressed as grams per kilogram of live body
weight per day (g BW‐0.75 d‐1). The cattle management issue was represented by five
indicators: farm size, feeding system, housing system, recording of breeding and
reproduction. Farm size was measured as the number of cattle owned by the farmer. The
feeding system was a qualitative indicator that represented the types of feed provided
(foraging and supplementary feeds). Housing system and recording of breeding were both
qualitative indicators. Reproduction was measured by the percentage of artificial
insemination used in breeding (% AI). Five quantitative indicators were chosen for the
performance issue: live weight of cows, weaners and young stock at 11 months of age, all
expressed in kilograms (kg); calf crop, expressed as the percentage of weaned calves per
cow per year (% per year); and meat yield, expressed as kilograms of meat per slaughtered
animal (kg) (Toelihere, 2002; Charvalho et al., 2010). The qualitative indicator for the
additional functions of cattle was the same as for the Central Java case study. The health
issue was represented by an indicator for the prevalence of diseases or health problems,
expressed as a percentage (%). Lastly, two indicators represented the environmental
quality. Global warming potential (GWP) was expressed as kilograms of CO2‐equivalents per
kilogram of body weight (kg CO2‐eq per kg body weight) and land use was expressed as
square metres per kilogram of body weight (m2 per kg BW) (de Vries and de Boer, 2010; de
Boer et al., 2011).
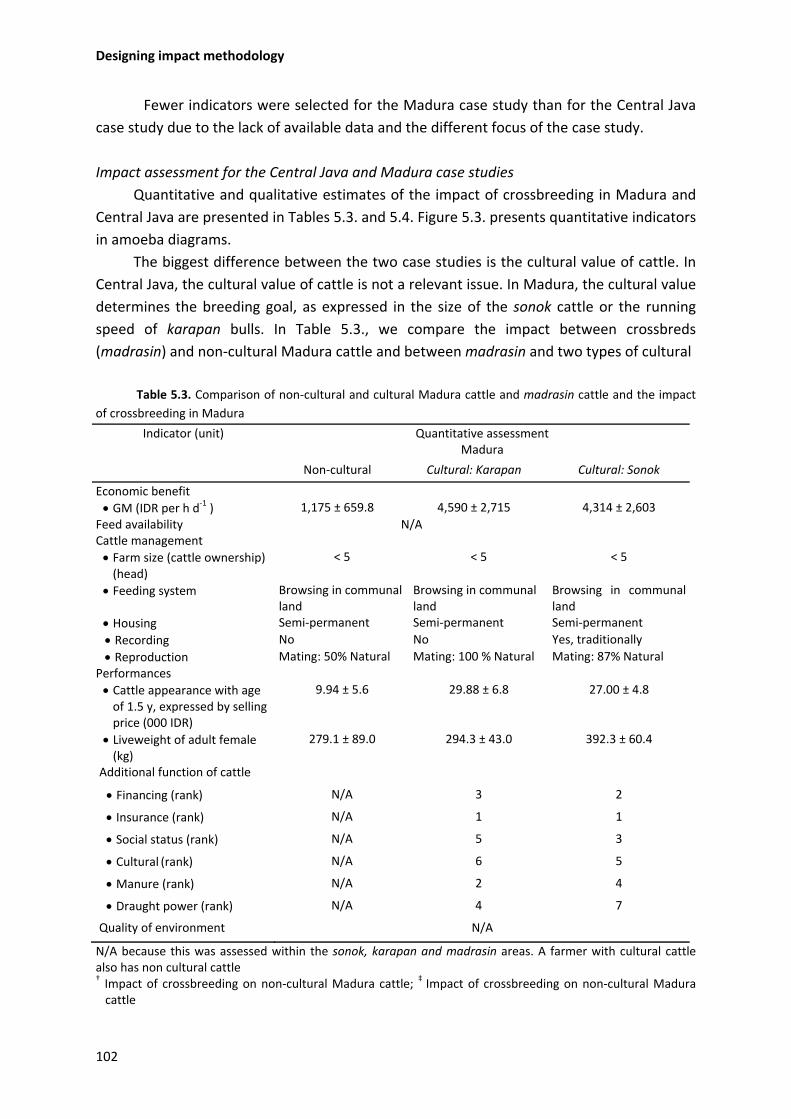
Designing impact methodology
102
Fewer indicators were selected for the Madura case study than for the Central Java
case study due to the lack of available data and the different focus of the case study.
Impact assessment for the Central Java and Madura case studies
Quantitative and qualitative estimates of the impact of crossbreeding in Madura and
Central Java are presented in Tables 5.3. and 5.4. Figure 5.3. presents quantitative indicators
in amoeba diagrams.
The biggest difference between the two case studies is the cultural value of cattle. In
Central Java, the cultural value of cattle is not a relevant issue. In Madura, the cultural value
determines the breeding goal, as expressed in the size of the sonok cattle or the running
speed of karapan bulls. In Table 5.3., we compare the impact between crossbreds
(madrasin) and non‐cultural Madura cattle and between madrasin and two types of cultural
Table 5.3. Comparison of non‐cultural and cultural Madura cattle and madrasin cattle and the impact
of crossbreeding in Madura
Indicator (unit) Quantitative assessment Madura
Non‐cultural Cultural: Karapan Cultural: Sonok
Economic benefit
GM (IDR per h d‐1 ) 1,175 ± 659.8 4,590 ± 2,715 4,314 ± 2,603
Feed availability N/A Cattle management
Farm size (cattle ownership) (head)
< 5 < 5 < 5
Feeding system Browsing in communal land
Browsing in communal land
Browsing in communal land
Housing Semi‐permanent Semi‐permanent Semi‐permanent
Recording No No Yes, traditionally
Reproduction Mating: 50% Natural Mating: 100 % Natural Mating: 87% Natural
Performances
Cattle appearance with age of 1.5 y, expressed by selling price (000 IDR)
9.94 ± 5.6 29.88 ± 6.8 27.00 ± 4.8
Liveweight of adult female (kg)
279.1 ± 89.0 294.3 ± 43.0 392.3 ± 60.4
Additional function of cattle
Financing (rank) N/A 3 2
Insurance (rank) N/A 1 1
Social status (rank) N/A 5 3
Cultural (rank) N/A 6 5
Manure (rank) N/A 2 4
Draught power (rank) N/A 4 7
Quality of environment N/A
N/A because this was assessed within the sonok, karapan and madrasin areas. A farmer with cultural cattle also has non cultural cattle † Impact of crossbreeding on non‐cultural Madura cattle; ‡ Impact of crossbreeding on non‐cultural Madura cattle
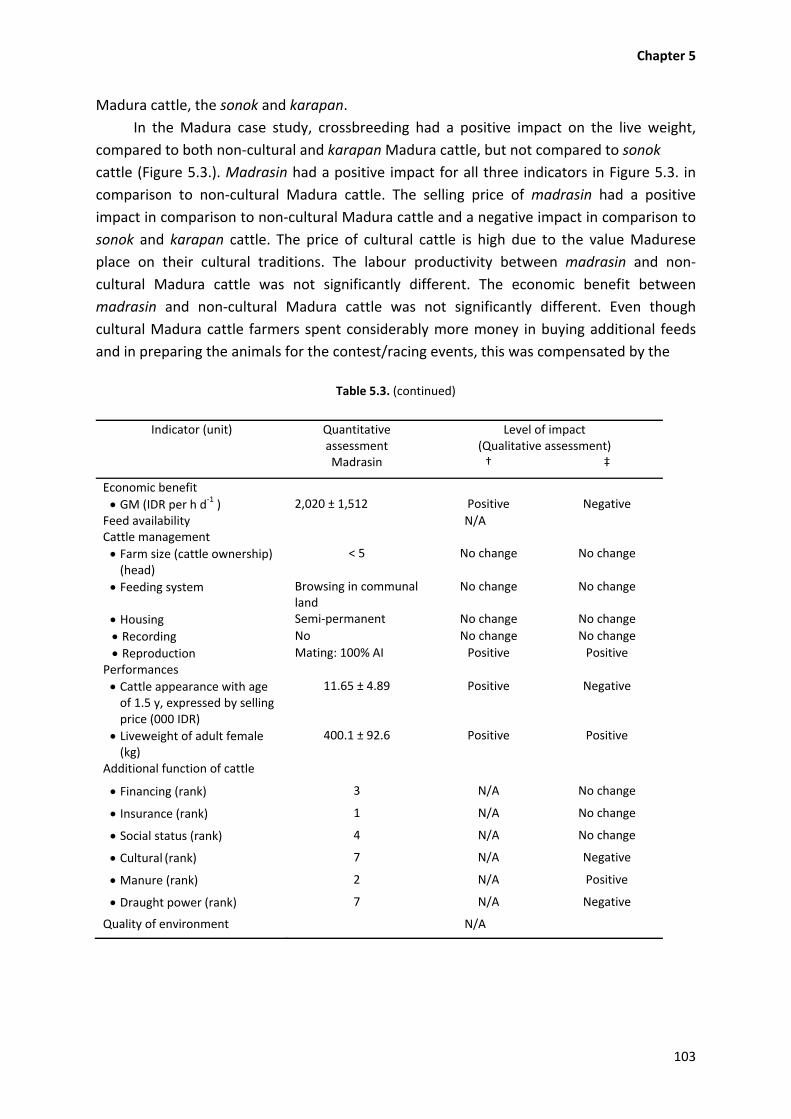
Chapter 5
103
Madura cattle, the sonok and karapan.
In the Madura case study, crossbreeding had a positive impact on the live weight,
compared to both non‐cultural and karapan Madura cattle, but not compared to sonok
cattle (Figure 5.3.). Madrasin had a positive impact for all three indicators in Figure 5.3. in
comparison to non‐cultural Madura cattle. The selling price of madrasin had a positive
impact in comparison to non‐cultural Madura cattle and a negative impact in comparison to
sonok and karapan cattle. The price of cultural cattle is high due to the value Madurese
place on their cultural traditions. The labour productivity between madrasin and non‐
cultural Madura cattle was not significantly different. The economic benefit between
madrasin and non‐cultural Madura cattle was not significantly different. Even though
cultural Madura cattle farmers spent considerably more money in buying additional feeds
and in preparing the animals for the contest/racing events, this was compensated by the
Table 5.3. (continued)
Indicator (unit) Quantitative assessment
Level of impact (Qualitative assessment)
Madrasin † ‡
Economic benefit
GM (IDR per h d‐1 ) 2,020 ± 1,512 Positive Negative
Feed availability N/ACattle management
Farm size (cattle ownership) (head)
< 5 No change No change
Feeding system Browsing in communal land
No change No change
Housing Semi‐permanent No change No change
Recording No No change No change
Reproduction Mating: 100% AI Positive Positive
Performances
Cattle appearance with age of 1.5 y, expressed by selling price (000 IDR)
11.65 ± 4.89 Positive Negative
Liveweight of adult female (kg)
400.1 ± 92.6 Positive Positive
Additional function of cattle
Financing (rank) 3 N/A No change
Insurance (rank) 1 N/A No change
Social status (rank) 4 N/A No change
Cultural (rank) 7 N/A Negative
Manure (rank) 2 N/A Positive
Draught power (rank) 7 N/A Negative
Quality of environment N/A
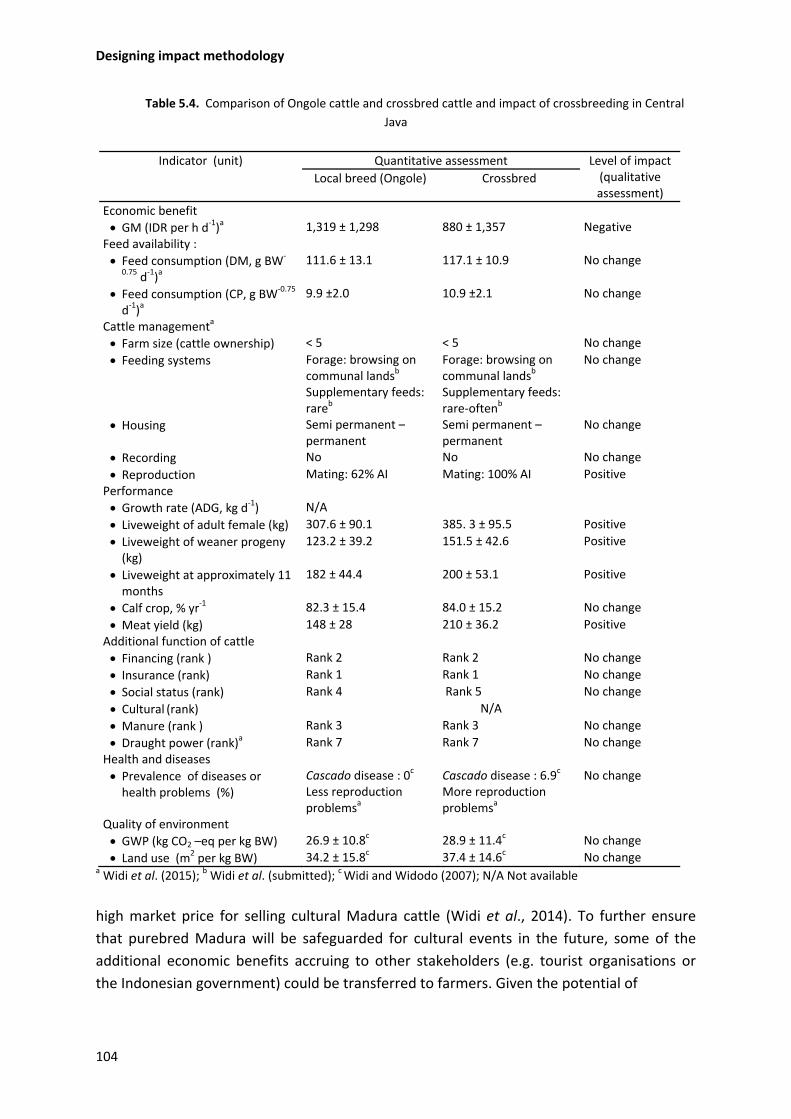
Designing impact methodology
104
Table 5.4. Comparison of Ongole cattle and crossbred cattle and impact of crossbreeding in Central
Java
Indicator (unit) Quantitative assessment Level of impact (qualitative assessment)
Local breed (Ongole) Crossbred
Economic benefit
GM (IDR per h d‐1)a 1,319 ± 1,298 880 ± 1,357 Negative
Feed availability :
Feed consumption (DM, g BW‐
0.75 d‐1)a
111.6 ± 13.1 117.1 ± 10.9 No change
Feed consumption (CP, g BW‐0.75 d‐1)a
9.9 ±2.0 10.9 ±2.1 No change
Cattle managementa
Farm size (cattle ownership) < 5 < 5 No change
Feeding systems Forage: browsing on communal landsb Supplementary feeds: rareb
Forage: browsing on communal landsb Supplementary feeds: rare‐oftenb
No change
Housing Semi permanent –permanent
Semi permanent –permanent
No change
Recording No No No change
Reproduction Mating: 62% AI Mating: 100% AI Positive
Performance
Growth rate (ADG, kg d‐1) N/A
Liveweight of adult female (kg) 307.6 ± 90.1 385. 3 ± 95.5 Positive
Liveweight of weaner progeny (kg)
123.2 ± 39.2 151.5 ± 42.6 Positive
Liveweight at approximately 11 months
182 ± 44.4 200 ± 53.1 Positive
Calf crop, % yr‐1 82.3 ± 15.4 84.0 ± 15.2 No change
Meat yield (kg) 148 ± 28 210 ± 36.2 Positive
Additional function of cattle
Financing (rank ) Rank 2 Rank 2 No change
Insurance (rank) Rank 1 Rank 1 No change
Social status (rank) Rank 4 Rank 5 No change
Cultural (rank) N/A
Manure (rank ) Rank 3 Rank 3 No change
Draught power (rank)a Rank 7 Rank 7 No change
Health and diseases
Prevalence of diseases or health problems (%)
Cascado disease : 0c
Less reproduction problemsa
Cascado disease : 6.9c
More reproduction problemsa
No change
Quality of environment
GWP (kg CO2 –eq per kg BW) 26.9 ± 10.8c 28.9 ± 11.4c No change
Land use (m2 per kg BW) 34.2 ± 15.8c 37.4 ± 14.6c No change a Widi et al. (2015); b Widi et al. (submitted); c Widi and Widodo (2007); N/A Not available
high market price for selling cultural Madura cattle (Widi et al., 2014). To further ensure
that purebred Madura will be safeguarded for cultural events in the future, some of the
additional economic benefits accruing to other stakeholders (e.g. tourist organisations or
the Indonesian government) could be transferred to farmers. Given the potential of
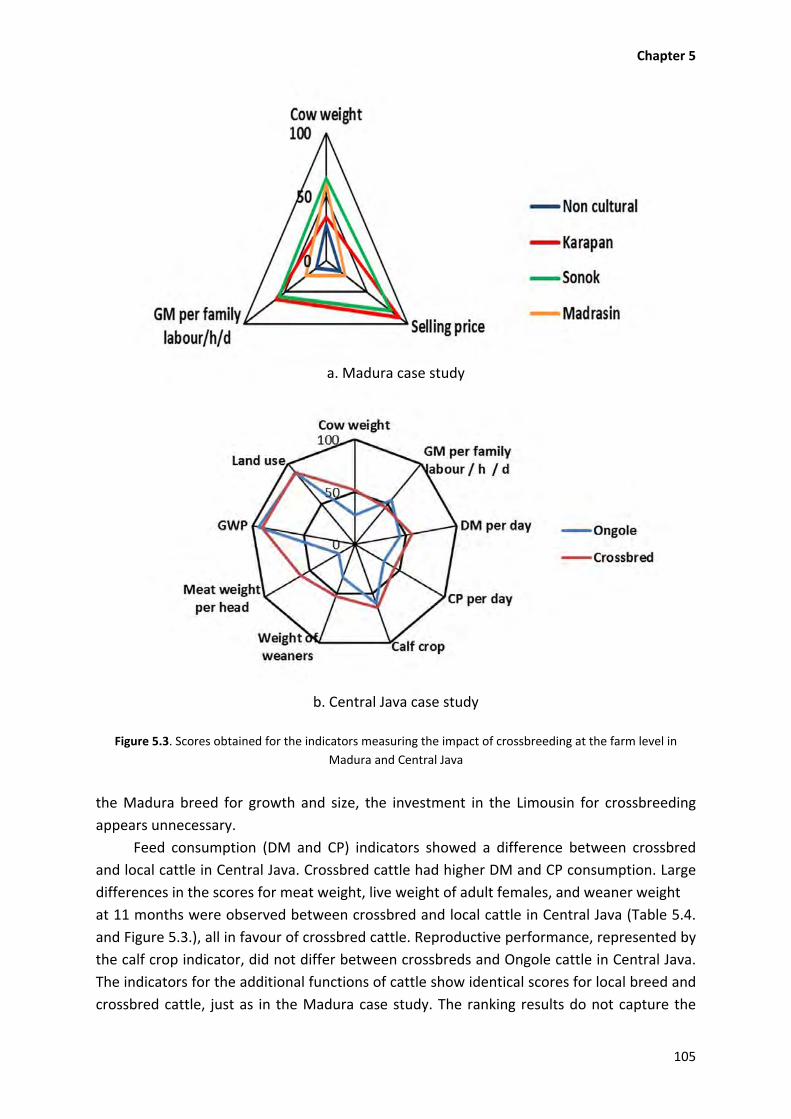
Chapter 5
105
a. Madura case study
b. Central Java case study
Figure 5.3. Scores obtained for the indicators measuring the impact of crossbreeding at the farm level in
Madura and Central Java
the Madura breed for growth and size, the investment in the Limousin for crossbreeding
appears unnecessary.
Feed consumption (DM and CP) indicators showed a difference between crossbred
and local cattle in Central Java. Crossbred cattle had higher DM and CP consumption. Large
differences in the scores for meat weight, live weight of adult females, and weaner weight
at 11 months were observed between crossbred and local cattle in Central Java (Table 5.4.
and Figure 5.3.), all in favour of crossbred cattle. Reproductive performance, represented by
the calf crop indicator, did not differ between crossbreds and Ongole cattle in Central Java.
The indicators for the additional functions of cattle show identical scores for local breed and
crossbred cattle, just as in the Madura case study. The ranking results do not capture the
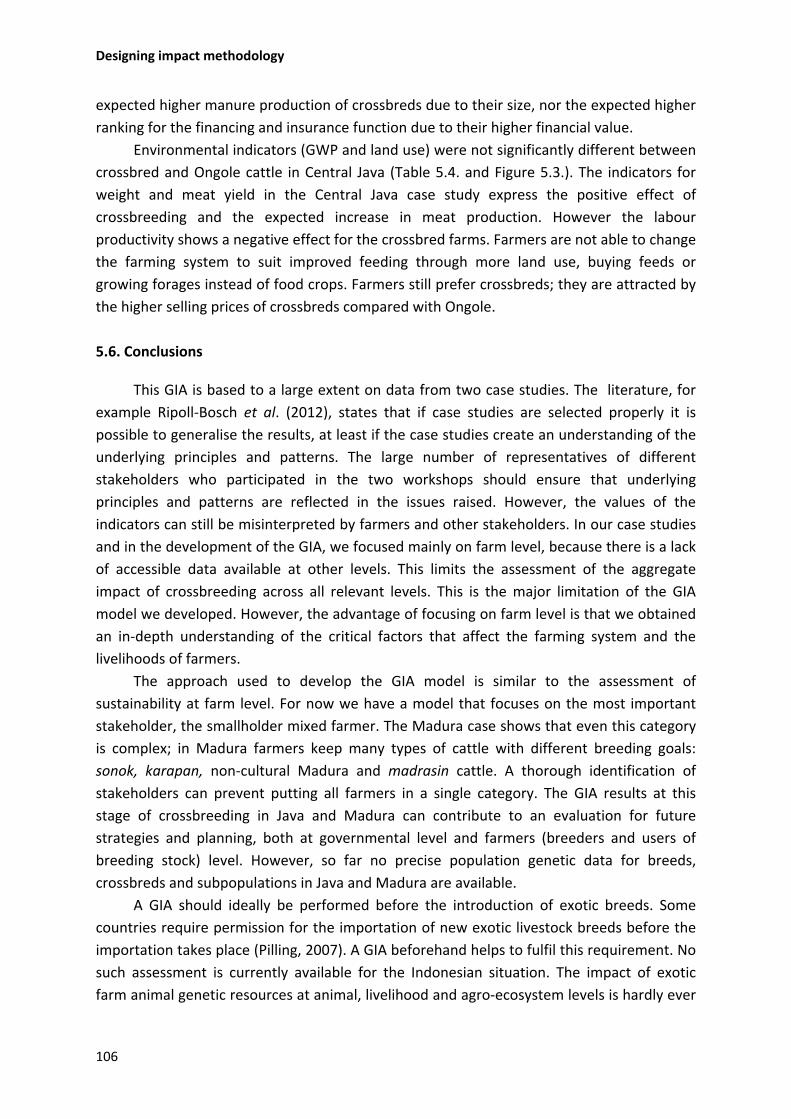
Designing impact methodology
106
expected higher manure production of crossbreds due to their size, nor the expected higher
ranking for the financing and insurance function due to their higher financial value.
Environmental indicators (GWP and land use) were not significantly different between
crossbred and Ongole cattle in Central Java (Table 5.4. and Figure 5.3.). The indicators for
weight and meat yield in the Central Java case study express the positive effect of
crossbreeding and the expected increase in meat production. However the labour
productivity shows a negative effect for the crossbred farms. Farmers are not able to change
the farming system to suit improved feeding through more land use, buying feeds or
growing forages instead of food crops. Farmers still prefer crossbreds; they are attracted by
the higher selling prices of crossbreds compared with Ongole.
5.6. Conclusions
This GIA is based to a large extent on data from two case studies. The literature, for
example Ripoll‐Bosch et al. (2012), states that if case studies are selected properly it is
possible to generalise the results, at least if the case studies create an understanding of the
underlying principles and patterns. The large number of representatives of different
stakeholders who participated in the two workshops should ensure that underlying
principles and patterns are reflected in the issues raised. However, the values of the
indicators can still be misinterpreted by farmers and other stakeholders. In our case studies
and in the development of the GIA, we focused mainly on farm level, because there is a lack
of accessible data available at other levels. This limits the assessment of the aggregate
impact of crossbreeding across all relevant levels. This is the major limitation of the GIA
model we developed. However, the advantage of focusing on farm level is that we obtained
an in‐depth understanding of the critical factors that affect the farming system and the
livelihoods of farmers.
The approach used to develop the GIA model is similar to the assessment of
sustainability at farm level. For now we have a model that focuses on the most important
stakeholder, the smallholder mixed farmer. The Madura case shows that even this category
is complex; in Madura farmers keep many types of cattle with different breeding goals:
sonok, karapan, non‐cultural Madura and madrasin cattle. A thorough identification of
stakeholders can prevent putting all farmers in a single category. The GIA results at this
stage of crossbreeding in Java and Madura can contribute to an evaluation for future
strategies and planning, both at governmental level and farmers (breeders and users of
breeding stock) level. However, so far no precise population genetic data for breeds,
crossbreds and subpopulations in Java and Madura are available.
A GIA should ideally be performed before the introduction of exotic breeds. Some
countries require permission for the importation of new exotic livestock breeds before the
importation takes place (Pilling, 2007). A GIA beforehand helps to fulfil this requirement. No
such assessment is currently available for the Indonesian situation. The impact of exotic
farm animal genetic resources at animal, livelihood and agro‐ecosystem levels is hardly ever
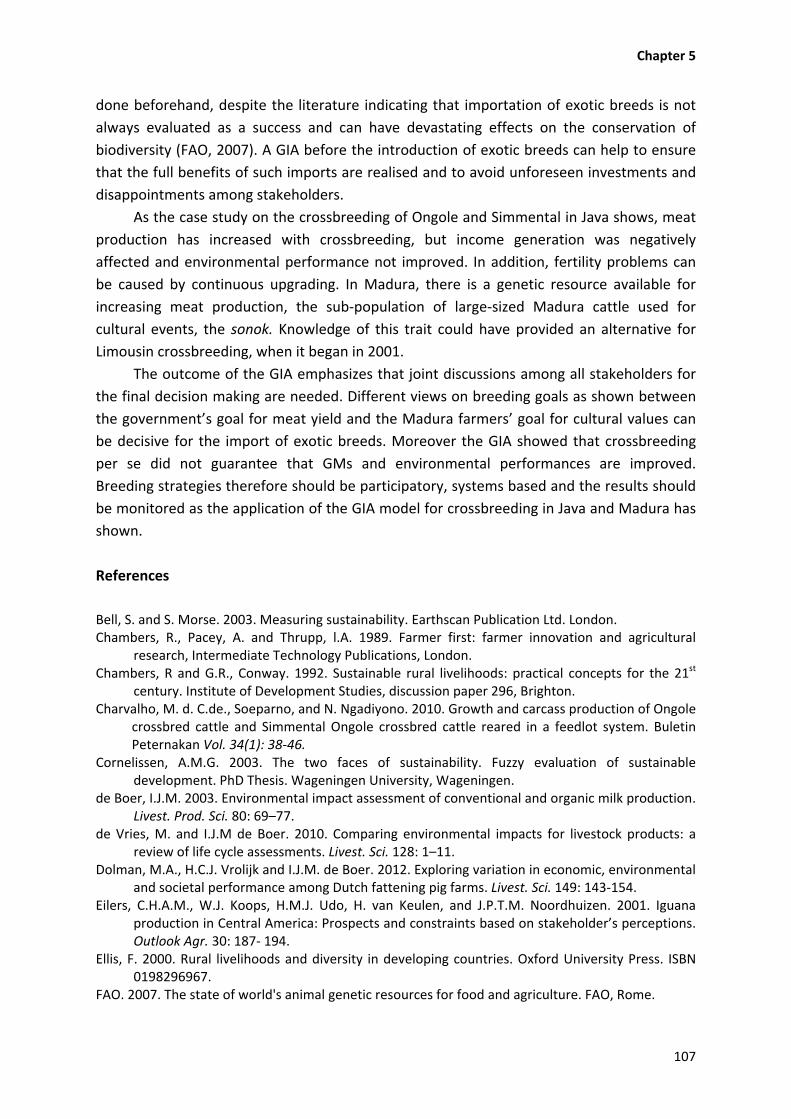
Chapter 5
107
done beforehand, despite the literature indicating that importation of exotic breeds is not
always evaluated as a success and can have devastating effects on the conservation of
biodiversity (FAO, 2007). A GIA before the introduction of exotic breeds can help to ensure
that the full benefits of such imports are realised and to avoid unforeseen investments and
disappointments among stakeholders.
As the case study on the crossbreeding of Ongole and Simmental in Java shows, meat
production has increased with crossbreeding, but income generation was negatively
affected and environmental performance not improved. In addition, fertility problems can
be caused by continuous upgrading. In Madura, there is a genetic resource available for
increasing meat production, the sub‐population of large‐sized Madura cattle used for
cultural events, the sonok. Knowledge of this trait could have provided an alternative for
Limousin crossbreeding, when it began in 2001.
The outcome of the GIA emphasizes that joint discussions among all stakeholders for
the final decision making are needed. Different views on breeding goals as shown between
the government’s goal for meat yield and the Madura farmers’ goal for cultural values can
be decisive for the import of exotic breeds. Moreover the GIA showed that crossbreeding
per se did not guarantee that GMs and environmental performances are improved.
Breeding strategies therefore should be participatory, systems based and the results should
be monitored as the application of the GIA model for crossbreeding in Java and Madura has
shown.
References
Bell, S. and S. Morse. 2003. Measuring sustainability. Earthscan Publication Ltd. London. Chambers, R., Pacey, A. and Thrupp, l.A. 1989. Farmer first: farmer innovation and agricultural
research, Intermediate Technology Publications, London. Chambers, R and G.R., Conway. 1992. Sustainable rural livelihoods: practical concepts for the 21st
century. Institute of Development Studies, discussion paper 296, Brighton. Charvalho, M. d. C.de., Soeparno, and N. Ngadiyono. 2010. Growth and carcass production of Ongole
crossbred cattle and Simmental Ongole crossbred cattle reared in a feedlot system. Buletin Peternakan Vol. 34(1): 38‐46.
Cornelissen, A.M.G. 2003. The two faces of sustainability. Fuzzy evaluation of sustainable development. PhD Thesis. Wageningen University, Wageningen.
de Boer, I.J.M. 2003. Environmental impact assessment of conventional and organic milk production. Livest. Prod. Sci. 80: 69–77.
de Vries, M. and I.J.M de Boer. 2010. Comparing environmental impacts for livestock products: a review of life cycle assessments. Livest. Sci. 128: 1–11.
Dolman, M.A., H.C.J. Vrolijk and I.J.M. de Boer. 2012. Exploring variation in economic, environmental and societal performance among Dutch fattening pig farms. Livest. Sci. 149: 143‐154.
Eilers, C.H.A.M., W.J. Koops, H.M.J. Udo, H. van Keulen, and J.P.T.M. Noordhuizen. 2001. Iguana production in Central America: Prospects and constraints based on stakeholder’s perceptions. Outlook Agr. 30: 187‐ 194.
Ellis, F. 2000. Rural livelihoods and diversity in developing countries. Oxford University Press. ISBN 0198296967.
FAO. 2007. The state of world's animal genetic resources for food and agriculture. FAO, Rome.
Designing impact methodology
108
Gandini, G. and K. Oldenbroek. 2007. Strategies for moving from conservation to utilization. Chapter 2 in : Utilization and conservation of farm animal genetic resources (Ed. Kor Oldenbroek). Wageningen Academic Publisher, Wageningen.
Hall, J.G.S. and D.E. Bradley. 1995. Conserving livestock breed biodiversity. Trends Ecol. Evol. 10: 267‐270.
Hiemstra, S.J., D. Eaton, N.X. Trach., P.X. Hao, B.H. Doan, and J.J. Windig. 2006. Indicators to monitor livestock genetic diversity. In: 8th World Congress on Genetic Applied to Livestock Production. Belo Horizonte, MG.
ISPC, 2014. Data, metrics and monitoring in CGIAR – a strategic study. CGIAR Independent Science and Partnership Council (ISPC), Rome.
Lebacq, T., P.V. Baret and D. Stilmant. 2013. Sustainability indicators for livestock farming: A review. Agron. Sustain. Dev. 33: 311‐327.
Marshal, K. 2014. Optimizing the use of breed types in developing country livestock production systems: a neglected research area. J. Anim. Breed. Genet. 131(5): 329‐340.
Martyniuk, E., D. Pilling and B. Scherf. Indicators: Do we have effective tools to measure trends in genetic diversity of domesticated animals? Anim. Genet. Resour. 47: 31‐43.
Mathias, E. & Mundy, P. 2005. Herd movement: the exchange of livestock breeds and genes between North and South. League for pastoral peoples and endogenous livestock development, Ober‐Ramstadt.
Maule, J. P. 1990. The cattle of the tropics. University of Edinburgh Centre for Tropical Veterinary Medicine, Edinburgh.
Meul, M., S. van Passel, F. Nevens, J. Dessein, E. Rogge, A. Mulier, and A. van Hauwermeiren. 2008. MOTIFS: a monitoring tool for integrated farm sustainability. Agron. Sustain. Dev. 28: 321 ‐332.
Moll, H.A.J. 2005. Cost and benefits of livestock systems and the role of market and non‐market relationships. J. Agr. Econ. 32: 181‐193.
Moll, H.A.J., S.J. Staal, and M.N.M. Ibrahim. 2007. Smallholder dairy production and markets: a comparison of production systems in Zambia, Kenya and Sri Lanka. Agric. Syst. 94: 593‐603.
Mollenhorst, H. 2005. How to house a hen: assessing sustainable development of egg production systems. PhD Thesis. Wageningen University, Wageningen.
Oldenbroek, K. 2007. Introduction. in Utilization and conservation farm animal genetic resources. K. Oldenbroek, ed. Wageningen Academic Publishers, Wageningen.
Oosting, S.J. 2002. System hierarchy and sustainable farming system development. In : Organic meat and milk from ruminants. Kyriazakis, I and Zervas, G. (eds.). Publication of EAAP, 4th – 6th October, Athens.
Pilling, D. 2007. Genetic impact assessment ‐ summary of a debate. Anim. Genet. Resour. Bull. 41: 101‐107.
Ripoll Bosch, R., B. Dìez‐Unquera, R. Ruiz, D. Villalba, E. Molina, M. Joy and A. Olaizola. 2012. An integrated sustainability assessment of mediterranean sheep farms with different degrees of intensification. Agr. Syst. 105: 46‐56.
Sudardjat, S. and R. Pambudy. 2003. Menjelang Dua Abad Sejarah Peternakan dan Kesehatan Hewan Indonesia: Peduli Peternak Rakyat. Yayasan Agrindo Mandiri, Jakarta.
Samdup, T., H.M.J. Udo, C.H.A. M. Eilers, M.N.M. Ibrahim, and A. J. van der Zijpp. 2010. Crossbreeding and intensification of smallholder crop‐cattle farming systems in Bhutan. Livest. Sci. 131: 126‐134.
Steinfeld, H., P. Gerber, T. Wassenaar, V. Castel, M. Rosales and C. de Haan. 2006. Livestock's Long Shadow: Environmental Issues and Options. FAO, Rome.
Sutresniwati.2006. The invasion of crossbred cattle; stakeholders' perspectives in Central Java, Indonesia in Animal Production Systems. MSc Thesis. Wageningen University, Wageningen.
Syrstad, O. 1996. Dairy cattle crossbreeding in the tropics: choice of crossbreeding strategy. Trop. Anim. Health Prod 28: 223‐229.
Chapter 5
109
Toilehere, M.R. 1993. Inseminasi Buatan pada Ternak. Penerbit Angkasa, Bandung. Toelihere, M.R. 2002. Increasing the success rate and adoption of artificial insemination for genetic
improvement of Bali cattle. Workshop on Strategies to Improve Bali Cattle in Eastern Indonesia. Udayana Eco Lodge Denpasar Bali 4‐7 February 2002.
Udo, H.M.J., H.A. Aklilu, L.T. Phong, R.H. Bosma, I.G.S. Budisatria, B.R. Patil, T. Samdup, and B.O. Bebe. 2011. Impact of intensification of different types of livestock production in smallholder crop‐livestock systems. Livest. Sci. 139: 22‐29.
Widi, T.S.M., and T. Hartatik. 2009. The characteristics and performances of sonok compared to karapan cows as important consideration for conservation of Madura cattle. In: Biophysical and socio‐economic frame conditions for the sustainable management of natural resources. E. Tiekels (ed.). Proceeding of Tropentag 2009. Hamburg, 6th ‐8th October, Hamburg.
Widi, T.S.M., H.M.J. Udo, K. Oldenbroek, I.G.S. Budisatria, E. Baliarti, and A.J. van der Zijpp. 2015. Is crossbreeding beneficial for mixed farming systems in Central Java? Anim. Genet. Resour (in press).
Widi, T.S.M., H.M.J. Udo, K. Oldenbroek, I.G.S. Budisatria, T. Viets, and A.J. van der Zijpp. Is crossbreeding beneficial for the environment? Field study on cattle production in mixed farming systems in Central Java, Indonesia. Submitted.
Wollny, C.B.A. 2003. The need to conserve farm animal genetic resources in Africa: should policy makers be concerned? Ecol. Econ. 45: 341‐351.
Designing impact methodology
110
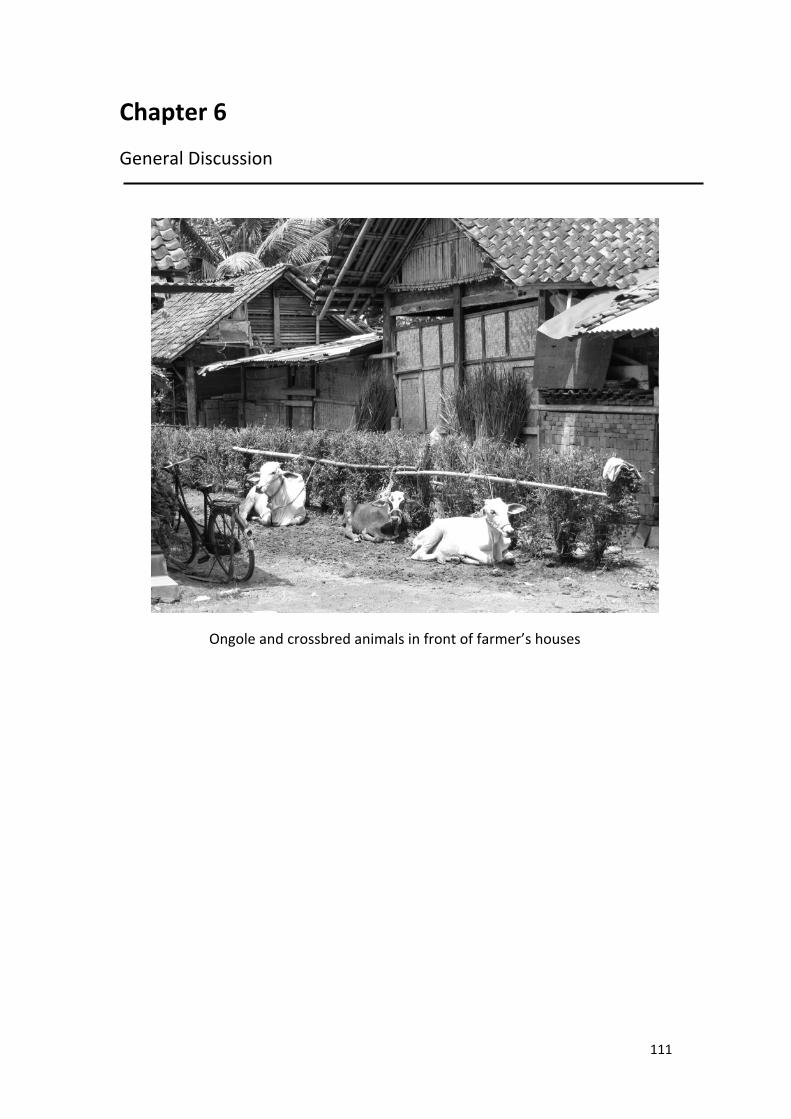
111
Chapter 6
General Discussion
Ongole and crossbred animals in front of farmer’s houses
General discussion
112
6.1. Introduction
Crossbreeding is rapidly changing several of the local cattle populations in
Indonesia. The Indonesian government started with the importation of semen from
exotic beef breeds about 30 years ago. Farmers initially disliked crossbred animals,
but this gradually changed and crossbreds currently account for about 40% of the
total number of 12.8 million cattle. Crossbreeding is supported by a wide range of
stakeholders, varying from policy makers, extension workers and traders to large‐
scale slaughter operations. More than 90% of the cattle are kept by smallholder
farmers. Smallholders keep cattle not only for meat production, but also for financial
security, manure for cropping, social‐cultural reasons and draught power. The
primary objective of the crossbreeding policy is to increase beef production for the
growing urban population. The wider implications of crossbreeding are rarely
discussed. There is a lack of reliable field data that can be used to assess the
advantages and disadvantages of crossbreeding. This chapter discusses the impacts
of crossbreeding on rural livelihoods, the environment and the future of local
breeds. It critically reviews the methodologies used in this study and the diversity in
cattle breeds in Indonesia, and explores feasible breeding strategies and policies for
local and crossbred cattle in smallholder farming systems in Madura and Central
Java, Indonesia.
6.2. Reflection on methodology
Information on cattle breeding systems and breeding decisions in Indonesia is
difficult to access both within and outside governmental institutions. The research
questions in this study were answered by gathering data from different sources:
studying grey literature, organising focus group discussions and SWOT analysis,
interviewing farmers and key persons, field observations, monitoring feeding
practices and reproduction performance, and measuring animal performances.
Secondary data were taken from a statistical database published by the government.
Data on the size of the populations of local cattle and crossbreds and their
contribution to meat production in Indonesia are not available. There is also no
information about the specific crossbreeding generations of crossbred cattle,
because no systematic pedigree registration exists. As Marshal (2014) suggested, the
impact of the introduction of new breed types on indigenous populations should be
monitored by regular census.
Obtaining accurate data at farm level was complicated and time consuming
(Chapters 2, 3 and 4). Our farm level data on animal weights and feed intakes may
lack accuracy, as detailed measurements are not possible for large numbers of
animals in the field and for such a large research area. The Gross Margins
calculations used in Chapters 2 and 3 only included the financial flows on farms, the
additional benefits of cattle in terms of the use of manure on own crop land and the
Chapter 6
113
security function of the cattle were not included in this figure. In Chapter 4 we also
quantified additional benefits of keeping cattle: manure, insurance and financing. For
Central Java these additional benefits accounted for approximately 30% of the total
economic value of cattle keeping. Our very low estimation of the economic value of
manure (1% of total economic value) seemed to underestimate its real value, as it
was only based on the synthetic fertiliser N‐equivalent. It excluded the P and K
values of manure, and the positive effects manure has on the organic matter and
water holding capacity of soil. Farmers valued manure as one of the most important
assets, in addition to capital saving and additional income (Tables 2.2. and 3.4.). As
cattle are part of the cropping system, the impact of local and crossbred cattle on
crop production has to be further investigated. Finding accurate methods to value
these functions remains a challenge. The methods used to value insurance and
finance, likely underestimate the true values of these functions in Indonesia. Farmers
regarded ‘saving’ as the most important motive for keeping cattle, but our
estimations showed that insurance and financing accounted for only 30% of the total
economic value of cattle keeping. So, the economic analysis of the additional
functions was not in line with the ranking of motives of the farmers (Tables 2.2. and
3.4.).
The impact assessment of crossbreeding on the environment (Chapter 4) only
focused on GWP and land use. Other aspects of environmental impact, such as
eutrophication, acidification and water use, also need to be assessed to understand
the total impact of smallholder cattle production on the environment. For example,
in Central Java, the storage of manure of small ruminants caused high contamination
with total and faecal coliform in the water sources adjacent to small ruminant
houses (Budisatria et al., 2007). The impact of cattle manure storage systems on
water sources is not known, but it will not differ between crossbred and local cattle
farms.
Chapters 2, 3 and 4 and the resulting GIA were mainly focused on assessing
the consequences of crossbreeding at farm level. Indicators at higher aggregation
levels were not assessed because a lot of the required information was not available.
However, farmers and other stakeholders mentioned some of the important issues
at higher aggregation levels in the focus group discussions. Finding methods to
assess the impacts at the higher levels is a great challenge. This challenge arises
mainly because of the poor availability of baseline data of all actors in the cattle
value chain.
The field data from Madura and Central Java were collected during a period
of 1 to 1.5 years. Variation between years was therefore not included. The
monitoring years 2010‐2012 were, however, average years in terms of climate and
price developments.
General discussion
114
6.3. Impact of crossbreeding on mixed farming systems
In Indonesia, the initial reluctance of farmers to switch to crossbreeding has
been replaced by high expectations of crossbreeding (Table 5.2.). Crossbreeding
practices differ between areas. The differences in importance of cultural traditions
are a main reason for the differences crossbreeding practices. The variation in
cultural values of cattle does not only occur between Java and Madura; Chapter 2
shows that cultural values also differ between areas in Madura, which results in sub‐
populations of Madura cattle and different management and breeding practices
within the island. Since 2001, crossbreeding with Limousin has been promoted in
Madura. Prior to 2001, crossbreeding was prohibited to protect the local Madura
cattle breed. Crossbreeding using Simmental semen is practised for a much longer
period in Java. It is implemented in Central Java irrespective of the existing farming
systems.
Crossbreeding and cultural values
Understanding and assessing cultural values of livestock are important in the
implementation of interventions aimed at the conservation and utilisation of animal
genetic resources (Gandini and Villa, 2003; FAO, 2012). Although the cultural value of
local breeds is much discussed, very few studies have actually assessed this value.
Chapter 2 was motivated by the concern that crossbreeding would have a negative
effect on the preservation of local traditions involving cattle in Madura, an area with
strong cultural ties between cattle and people (De Jonge, 1990). Chapter 2 assessed
cultural values using the following methods: observation of cultural events,
interviews with stakeholders who participated in cultural events and on‐farm
recording of cattle performance and management practices on farms. On‐farm
recording was conducted for farms that participated in cultural events and also for
farms that did not participate in these events. The assessment showed that the two
cultural traditions involving cattle, sonok (cow contests) and karapan (bull racing),
are found in different areas and that Madura cattle in these areas are bred
specifically for these events. Management practices, in terms of caring and feeding,
are also focused on the cultural events. This has resulted in marked differences in
body measurements and live weights between these two sub‐populations. The
cultural events are a strong driver for the preservation of the two sub‐populations of
Madura cattle in these areas, but the populations are relatively small (45 000‐50 000
in each sub‐population). In the sonok area, inbreeding is controlled by circulating
bulls between villages; no efforts are made to control inbreeding in the karapan
area. Farmers in the sonok area select bulls on the basis of their pedigree or they use
semen from the nine sonok bulls in the AI centre. Inseminators in the sonok area are
very motivated to improve sonok cattle keeping. To avoid inbreeding, inseminators
record the distribution of semen and the use of natural mating. In Sapudi Island, the
centre of karapan, only four bulls were used for breeding during the period of the
Chapter 6
115
field observations. Farmers in Sapudi Island perceive AI as unnatural. The AI centre
had only two karapan bulls. Farmers from areas outside Sapudi usually buy young
promising bulls from Sapudi farmers for racing events all over Madura.
Crossbreeding is not a threat to the two cultural events nor to the Madura
cattle sub‐populations in the specific areas where these events are organised. Both
sonok and karapan farmers are very proud of their cattle and cattle that perform
well in cultural events have a high market value. Therefore sonok and karapan
farmers will not switch to crossbreeding with Limousin. Crossbreeding is, however, a
threat to the majority of conventional Madura cattle outside the areas where the
cultural events are organised.
In Central Java, there is no strong link between cattle keeping and specific
cultural traditions. However, farmers do have traditional motives, like the Madurese
farmers, for keeping cattle, such as cattle as security, providers of manure and social
status. There was no difference in the motives for keeping cattle between farmers
who kept Ongole and crossbred cattle (Tables 3.4.). Hence, culture is not a main
driver for maintaining the Ongole breed in Java.
Keeping crossbreds also has positive social‐cultural implications. Farmers in
Java prefer crossbreeding with Simmental, not only because of their higher growth
rates but also because of their red shiny coats, yellow lips and their unselective
feeding habits (Sutresniwati, 2006). In Madura, crossbred cattle that perform well
are the pride of their owners. The local government in Madura makes use of this by
organising the madrasin contest, in which crossbred cows are judged for their body
conformation, weight and conformation of their calves. This contest, like the sonok
contest and karapan races, contributes to a high market value for stock. So, cultural
values represent an economic value (Gandini and Villa, 2003). Karapan is a main
tourist attraction for Madura. This justifies attention to solve the risk of inbreeding in
the karapan population.
Is crossbreeding beneficial for farmers?
Chapter 3 addressed whether crossbreeding is beneficial for the mixed farming
systems in Central Java. The results show that crossbreeding has not changed the
farming systems, in terms of herd size, farm types and experience in cattle keeping,
and this finding was consistent across different agro‐ecological zones. No difference
was found in the motives for keeping cattle between farms keeping crossbred cattle
and farms with Ongole cattle. Although the agro‐ecological zones differed in
cropping patterns and feed sources, they did not differ in the amounts of dry matter
(DM) and crude protein (CP) fed to individual animals. Crossbred cows were about
25% heavier than Ongole cows and their progeny were 16 to 24% heavier than
Ongole progeny. Farmers appreciated the resulting higher market prices for
crossbred stock. The FDGs (focus group discussions) showed that farmers were
aware of the higher feed requirements of crossbreds (Table 5.2.), but were less
General discussion
116
aware that crossbreeding does not necessarily bring financial gains (Table 3.10.). In
the lowlands of Madura, the financial results tended to be slightly higher for
crossbred farms than for conventional Madura cattle farms, but the differences were
not significant.
In smallholder dairying, crossbreeding has proved to be a good means to
increase household incomes in various countries (Udo et al, 2011). A main advantage
of dairying is that milk sales give a regular income, whereas beef type cattle are an
irregular cash source, in particular in farms with only 2‐3 cattle. The present results
show that crossbreeding for beef production is not reducing rural poverty for
smallholders. This leaves a question open. If it is not the smallholders, who actually is
gaining from crossbreeding in the cattle production value chain in Indonesia (Figure
1.2.)? Answering this question will require research at different aggregation levels
than was done in this study.
Is crossbreeding beneficial for the environment?
Increasing productivity is generally seen as an efficient strategy to reduce the
climate impact of livestock and to reduce the land use for livestock in densely
populated areas, such as Java and Madura (Steinfeld et al., 2006; Herrero et al.,
2009; Gerber et al., 2013; Herrero and Thornton, 2013). Chapter 4 addressed
whether intensification through crossbreeding is beneficial for the environment in a
smallholder setting.
The main finding is that there were no differences in global warming potential
(GWP) and land use per kilogram live weight produced between local and crossbred
cattle production systems in the four study areas in Central Java. This is in line with
the finding that the financial results of crossbred farms were not different from
Ongole farms in Central Java. Crossbreds were fed more fresh forages, either home‐
produced or bought, and supplements (Table 3.7.). This resulted in extra emissions,
extra land use, just as extra costs compared to Ongole. The results show that
crossbreeding has led to increased production but not to more efficient use of
resources.
Keeping fewer but more productive cattle is a paradigm within the
intensification approach to reducing environmental impact. Keeping fewer cattle is
expected to lead to lower greenhouse gas emissions, as the biggest contribution to
climate impact is from enteric fermentation (Steinfeld et al., 2006; Gerber et al.,
2013). Reducing the number of animals and feeding only the better feeds available is
theoretically beneficial for productivity, animal growth rates and environmental
impact per unit of production. However, this will interfere with the multiple
objectives of keeping cattle (Zemmelink et al., 2003; Oosting et al., 2014). Tables 2.1
and 3.3 show that farms with crossbred cattle in Madura and Central Java have not
reduced the numbers of animals held. Farmers kept an average of 2.5 cows, with a
range of 1 to 13; the number of animals they keep is related to their resources of
Chapter 6
117
feed, cash and family labour. Farmers use all their land for cropping activities and the
animals have to rely on crop by‐products, which are usually of low quality.
Possibilities to improve the feed situation, and so, to intensify cattle production, are
limited. In Java, farmers do not have sufficient resources to invest in better feeding.
Farmers have no access to land for forage production, and they lack cash to buy
good quality supplements or concentrates. Although there appear to be few options
available for improvement, large differences were observed among farmers. The
25thpercentile of farms with the lowest GWP per kilogram live weight produced, fed
their animals more in terms of DM and CP and had better performance (calving
intervals, body condition scores and live weight produced) compared to the other
farms. Farmers’ groups are an appropriate tool to implement changes in farming
practices in Indonesia. In such groups, farmers could learn how to improve the
management of their cattle from farmers that have better cattle management
practices.
6.4. Genetic Impact Assessment
In literature on farm animal genetic resources, the call for genetic impact
assessments (GIA) arises primarily because of concerns about the potential loss of
genetic diversity through crossbreeding or upgrading (Hiemstra, 2003). Marshall
(2014), however, states that the impact of using different breed types in livestock
systems in developing countries requires assessments from a number of viewpoints
and at different levels. In Chapter 5, an integrative assessment (GIA) was conducted
by identifying relevant technical, economic, ecological and societal issues using
participatory techniques and involving various stakeholder groups. This type of
approach makes farmers a partner in assessing the consequences of crossbreeding
by valuing their knowledge and experience (Mollenhorst, 2005).
The main users of a GIA are policy makers and farmers. These users need a
certain level of aggregation of the results. The amoeba diagrams summarized the
main results at farm level. This showed that crossbreeding in Central Java was
negative in terms of labour productivity and positive for live weight with no change
for the carbon footprint and land use. The Madura case showed that crossbreeding
for increase in body weight may not be competitive with cultural values of Madura
sub‐populations. Focus group discussions were held in 2012 with the aim of
obtaining feedback on the integrative assessments of consequences of crossbreeding
from farmers and other stakeholders in Central Java and Madura. These FGDs were
attended by 64 persons: farmers, policy makers, local government representatives, a
representative of a breeding centre and scientists. Local representatives of
governmental institutions in Madura were still not very concerned with different
breeding requirements of sub‐populations of Madura cattle. Avoiding crossbreeding
in Sapudi Island was considered sufficient in maintaining cultural traditions. From the
General discussion
118
farmers’ perspective, the most important issue was the financial impact of the higher
market prices for crossbred cattle. Farmers also emphasized the stability of cattle
prices. Farmers often face the dilemma of selling young stock for a low price or
keeping the young stock and waiting until prices increase again. Farmers were of the
opinion that they lose much more when they decide to sell crossbred cattle in a low
price situation. On the other hand, keeping crossbred cattle is costly due to the
higher feed costs. Scientists were concerned about maintaining sufficient good
quality cattle of local breeds for crossbreeding. This is particularly important in order
to be able to back‐cross higher generations of crossbred cows. Policy makers were
still concerned with increasing meat production, but were also required to recognise
the global concern about conserving the diversity of animal genetic resources. Policy
makers opted for zonation for local breeds, such as the ‘Return to Ongole’
programme in Central Java (Chapter 3).
The focus in the case studies and the development of the GIA was mainly on
farm level because there was a lack of accessible data at other levels. Relevant issues
at regional level mentioned by various stakeholders were reproduction and health
services, facilities (slaughter house, market building and presence of a research
centre), certification of products, recording and identification by breeding
organisations, organisation of the marketing system and value chain, and the
presence of a breeding programme. Facilities were assumed to be improved
automatically when crossbred animals are used (Table 5.2.). But these improvements
require serious investments and should also be considered beforehand.
6.5. Genetic diversity in Indonesian cattle
Genetic diversity is a prerequisite for the survival of the different breeds and
for breeding opportunities in the future. According to the CBD (Convention on
Biological Diversity) regulations, the national government is responsible for farm
animal genetic resources in Indonesia. Many countries have developed national
strategies and policies addressing the conservation and sustainable use of farm
animal genetic resources. Such policies and strategies require indicators to monitor
their effects. For agrobiodiversity, the genetic level (the genetic diversity within the
relevant species) is the most relevant level (Hiemstra et al., 2006). Initiatives and
policies of the Indonesian governments determine which (male) breeding material is
available for individual farmers and the extent to which this breeding material fits
with the farmer’s breeding goals. It is difficult to assess the genetic diversity of cattle,
as suggested by Hiemstra et al. (2006), because much of the information (e.g.
population sizes, share of different breeds, use of breeding strategies) needed for
the assessment at country level is not currently available. Another obstacle is the
lack of knowledge and awareness about differences in breeding goals. In this
situation, unlimited and non‐systematic crossing with exotics can easily lead to

Chapter 6
119
upgrading with exotic breeds and the extinction of a locally adapted native breed
(locally adapted native breed is the official definition for local breeds; Martyniuk et
al., 2010). This all enhances the risk that a valuable locally adapted native breed will
disappear without being noticed by the responsible authorities. Thus, the
development and implementation of a monitoring system, including controls on the
level of upgrading, for cattle populations in Indonesia is strongly advised.
Deptan (2003) and Astuti et al. (2007) approximated the population sizes of
locally adapted native breeds (Bali, Madura, Sumba Ongole, Ongole (Peranakan
Ongole), Brahman, Hissar, Pesisir, Aceh, Rambon, Katingan and Sahiwal) and
crossbred cattle at nine million and five million, respectively. Bali, Madura and
Ongole are the three main locally adapted native cattle breeds. Given these
approximations, it seems that the three major locally adapted native breeds are still
safe according to FAO standards. The share of these three breeds decreased from 80
percent in 1980‐1990 to 50 percent at present. In the meantime, the share of
crossbred cattle has increased towards 50 percent (Deptan, 2003; Astuti et al.,
2007). Given the speed at which the number of animals of locally adapted native
breeds is decreasing and the crossbreeding policy, almost all locally adapted native
breeds will be threatened in their existence within 10 to 15 years. Then, the
opportunities for using heterosis in systematic crossbreeding programs will be lost.
Breeding programmes using highly selective breeding methods for beef production
are needed for the locally adapted native breeds as well as for crossbreeding.
Structured breeding programmes, involving the recording of performance traits,
estimation of breeding values and a programme for the selection of potential
parents (FAO, 2013), do not exist in Indonesia. Such breeding programmes require
organisational efforts of farmers and government to enable systematic performance
recording, planned mating and genetic evaluation.
6.6. Future breeding systems
The higher market value of crossbred stock is the main reason for the euphoria
of farmers about crossbreeding. Crossbreeding will inevitably continue, but the lack
of a systematic approach poses risks for its sustainability. Added to this, most
farmers do not want to completely upgrade their cattle to Simmental or Limousine.
The two basic requirements to prevent a complete upgrading of local cattle are 1) an
efficient identification and registration (I&R) system so that farmers know the
crossbred generation of their cows and can decide to back‐cross with a local breed;
and 2) an efficient breeding programme for local breeds, so that bulls will be
available for pure breeding and for back‐crossing. A more straightforward alternative
could be to stop using semen from Simmental or Limousin bulls on crossbred cows
and start using crossbred bulls or semen for breeding. Syrstad (1996) suggested this
‘new breed’ formation as the most simple breeding strategy for smallholder dairy
General discussion
120
farming. Crossbreeding, however, is not only an issue of applying logical breeding
decisions, it is also a psychological issue. Farmers nor AI centres might be willing to
use semen of crossbred bulls.
In Indonesia, breeding programmes are limited to promotion of crossbreeding
and selection programmes in governmental breeding stations for Bali, Aceh, Madura
and Ongole breeds. The breeding station programmes aim to conserve these local
breeds; they produce certified breeding stock for farmers interested in these
animals. The ‘Return to Ongole’ programme is an example of a nucleus breeding
programme. It uses village breeding centres. This programme is carried out in the
Wet lowlands II and Dry uplands study sites in Central Java. The selection goal is the
growth rate from weaning until one year. Participating farmers get a subsidy for a
pregnant cow. The best yearling calves are reared in a central test station. There are
no data on how effective this programme is. Collection of data should be supported
by scientists in order to be able to monitor the programme and to evaluate the
perceptions of the participating farmers.
The cultural values of Madura cattle are being maintained by the farmers. The
breeding goals of these farmers are defined by the requirements of the cultural
events, which are body conformation traits in sonok cattle and the racing speed of
bulls in karapan cattle. The national breeding strategies and conservation efforts for
local breeds do not concern the differences in traditions across areas and therefore
the differences in sub‐populations of Madura cattle. The only conservation strategy
is for Sapudi Island, where crossbreeding is prohibited. The national database,
Indonesia’s contribution to the National Report on Animal Genetic Resources for
FAO (Deptan, 2003), should also include data at the sub‐population level. So, there is
an urgent need for reliable data on the numbers and performances of different types
of cattle in Madura.
In Madura, sonok cows were comparable with madrasin cows in body weight
and body condition scores. This shows that the AI organisation could also have used
bulls from the sonok area to improve the meat production of Madura cattle in the
major part of Madura, instead of propagating crossbreeding. Unfortunately,
performance data from the different sub‐populations were not known at the start of
the crossbreeding programme. It should also be noted that farmers in the sonok area
are very passionate about managing their cattle and participating in the sonok event.
Therefore, the sonok farmers represent a specific sub‐group of dedicated cattle
breeders. Their cattle performance results may not be achieved by madrasin
farmers. Madrasin farmers give priority to their cropping. Nevertheless, the AI
organisation could promote the use of semen of sonok bulls, also for the farmers in
the madrasin area. The first priority for the karapan area is the control of inbreeding.
There are two requirements to achieve the control of inbreeding, an accurate
recording of the use of bulls for breeding and the use of more breeding bulls than is
currently practised.
Chapter 6
121
6.7. Policy implications
Crossbreeding is increasing in Indonesia, but it has not yet been able to reduce
the gap between the supply and demand of meat (Agus et al., 2014). In the last
decade meat production has increased by 49%. Crossbreeding has probably
contributed to this remarkable increase, as Chapter 3 shows that the amount of
weaned weight per farm was about 20 % higher on crossbred farms than on Ongole
farms. Crossbreeding is therefore beneficial for increasing meat production at the
national level. Despite this, the national cattle production was still only able to
satisfy 51% of meat demand in 2014; this is predicted to decrease to 43% in 2024
(Agus et al., 2014). The Indonesian government plans to import breeding cows from
Australia in the next five years to increase the cattle population. Fattened cattle and
frozen meat will still be imported to fulfil the deficit. The expansion of livestock
production to other islands, such as Kalimantan, Sumatera, Sulawesi and Papua, is
also a major policy objective. In the outer islands, extensive large‐scale beef
production systems are propagated (Agus et al., 2014). The ‘road map’ towards
increased beef production in Indonesia proposes cow‐calf operations outside Java
and fattening in feedlots near the major cities (Agus et al., 2014). Cow‐calf
operations outside Java are suggested to be integrated systems, with food crops,
palm oil plantations and other plantations, and belonging to big private companies
(Agus et al., 2014). The major problems for cattle production in other islands are the
lack of human resources, regulations from companies that do not support
integration with livestock, and the large distances from livestock source areas to the
markets (Java) for final products. To support the distribution of live cattle and cattle
products across islands, the infrastructure needs to be improved or developed. This
infrastructure includes harbours, ships, roads, refrigerator containers in the harbours
and cold storages.
Local cattle, such as Bali, Madura and Ongole, seem the most appropriate
breeds to be kept in areas outside of Java (Baliarti, personal communication),
considering their good fertility and ability to cope with harsh conditions and poor
management (Hardjosubroto, personal communication). Crossbreds and Brahman
crosses from Australia are also possible for experienced farmers. Java is the biggest
market for cattle production. In the past several feedlots existed in Java. Such
feedlots rented or bought marginal lands for growing forages. Supplements and
concentrates were bought from local suppliers. Many of feedlots collapsed because
of the economic crisis in the late 1990s, long distances to markets, and long and risky
marketing systems. The future perspective of feedlots depends to a large extent on
the macro‐economic conditions in Indonesia.
Genetic improvement and intensification remain high on the policy agenda for
smallholders in Java. The GIA developed on base of the two case studies give clear
indications for the Indonesian farmers and the Indonesian government. At Madura,
General discussion
122
the Madura sub‐populations should be conserved for their high cultural value and, in
particular the sonok Madura cattle still has opportunities to be improved in beef
production traits. This is valuable for farmers and government. At Java the GIA shows
that crossbreeding with exotics has limited possibilities to improve cattle production
and environmental performances at farm level.
Intensification implies the increased use of external inputs and services to
increase the output quantity and/or the value per unit (Bebe et al., 2002).
Crossbreeding as tool of intensification has to be supported by better feeding and
management and requires a package of innovations on the basis of external inputs,
such as feeds, health and breeding services, credits and marketing (Udo et al., 2011).
In practice, crossbreeding has been limited to providing exotic semen. Consequently
the cattle keeping systems have not become more efficient through crossbreeding.
Nevertheless, crossbreeding will be continuing. The higher market value of
crossbred cattle encourages farmers to produce crossbreds. However, farmers do
not want to completely upgrade their Ongole cattle to Simmental or Limousine
(Chapters 2 and 3). This means that breeding activities for Ongole cattle have to be
supported by the necessary institutions and facilities (section 6.6.). A first priority is a
I&R system. Farmers need to know the crossbred generation of their breeding cows,
so they can plan the use of semen from exotic or local bulls.
In Indonesia, the current top‐down approach, which is focused on increasing
meat production has to be adjusted towards breeding activities that support the
objectives of the farmers themselves. The gap between governments’ objectives and
farmers’ practices calls for participatory methodological approaches involving the
key stakeholders, the farmers, to understand their perceptions about sustainable
livestock development strategies for their farming systems. Monitoring of cattle
production performance and trends in numbers per breed and sub‐populations and
area is needed to conduct impact assessments. Such information can be used by
policy makers for decision making about future breeding strategies. Information
should flow to stakeholders through training, education and extension. Policy
makers should actively support the collection of such information by providing
funding and setting up appropriate infrastructure. Research institutes and national
universities could play an important role in the communication of research results.
Without these changes, unstructured crossbreeding will continue.
6.8. Conclusions
1. In Indonesia, cattle fulfil livelihood needs in smallholder mixed farming
systems; they provide security, support cropping activities, contribute to
social status, and are involved in cultural events in specific areas. 2. The Madura cattle breed and the cattle production systems in Madura are
not homogenous. Crossbreeding is not a threat to the two cultural events
Chapter 6
123
involving cattle, sonok (cow conformation contest) and karapan (bull racing),
nor to the sub‐populations of Madura cattle in the specific areas where these
events are organised. The future of sonok cattle is brighter than for karapan
cattle in terms of performance and the future perspective of the cultural
event. Farmers outside the sonok and karapan areas, prefer Limousin
crossbreds (madrasin) to conventional Madura cattle.
3. Madura cattle participating in the cultural events had a market price 2 to 3.5
times higher than Madura cattle not participating in these events. Sonok and
madrasin cows were heavier and had higher body condition scores than
karapan cows and conventional Madura cows in the madrasin area.
4. In Madura, the current breeding and conservation approaches do not
distinguish between different Madura cattle types and do not consider the
specific needs of the farmers in the sonok and karapan areas.
5. Monitoring and characterisation of animal genetic resources with well‐
identified cultural values can be used to quantify these cultural values and
should consider the interaction of cultural values with management
practices, animal performance and economic benefits.
6. In Java, farmers perceive that crossbreeding is beneficial for them.
Crossbreeding is not changing the farming systems in terms of household and
farm characteristics and management. Crossbred cattle reached a higher
body size and weight and therefore had a higher market price, but they also
required more feed. This resulted in comparable GM for farms with crossbred
and Ongole stock. Although the financial benefits were not higher for
crossbreds compared to Ongole, farmers preferred the crossbreds because of
their nice appearance, high growth rate and the higher market price for
progeny compared to Ongole.
7. Crossbreeding contributes to increased meat production at the national level.
The amount of weaned weight per farm was 20% higher on crossbred farms
than on Ongole farms.
8. The expectation that crossbreeding would reduce the carbon footprint and
land use per kilogram of beef was not confirmed in Central Java. The
advantage for GWP and land use per kilogram live weight produced arising
from the faster growth of crossbreds was counteracted by the higher
emissions and land use from feed production for crossbreds. The biggest
contribution to GWP was from enteric fermentation, which is closely related
to lower quality feeds.
9. Better feeding is generally advised to reduce the environmental impact of
livestock. Smallholder mixed farmers do not have sufficient cash to buy more
forages and supplements. Growing more feed crops is restricted by the
limited land availability in Java. Keeping fewer cattle and feeding them the

General discussion
124
better quality feeds available contradicts with the multi‐functionality of
cattle.
10. The dualism in crossbreeding is that policy makers promote crossbreeding to
meet the increasing demand for beef, whereas farmers are concerned with
their livelihoods and the multi‐functionality of cattle.
11. Participatory approaches can ensure that farmers’ views are considered in
crossbreeding policies and practices. In Madura and Central Java, farmers
identified economic benefits, feed availability, cattle management, animal
performances, additional functions of cattle, and health and fertility as issues
to be considered in a genetic impact assessment of crossbreeding. Other
stakeholders mentioned meat production, environmental quality and
diversity in farm animal genetic resources as important issues.
12. Crossbreeding will inevitably continue in Java, as farmers are satisfied with
the performance and appearance of crossbred cattle, and the higher market
value. Breeding strategies have to be adjusted, however, as farmers do not
want to completely upgrade their Ongole cattle to Simmental or Limousin.
13. Viable populations of local cattle are needed to ensure sustainable
crossbreeding strategies. Farmers need continuous support and
encouragement from policy makers and scientists to conserve local breeds.
References Agus, A., I.G.S. Budisatria, N. Ngadiyono, Sumadi, Rusman, N. Indarti, T.S.M. Widi, N. Suseno,
M.D.E. Yulianto, D. Dyahjamayanti, and E. Wulandari. 2014. Road Map Industri Sapi Potong di Indonesia. APFINDO and Faculty of Animal Science, Universitas Gadjah Mada, Yogyakarta.
Astuti, M., A. Agus, I.G.S. Budisatria, B. Ariyadi, L.M. Yusiati, and M.A.U. Muzayyanah. 2007. Peta potensi plasma nutfah ternak nasional. Penerbit Ardana Media, Yogyakarta.
Bebe, B.O., H.M.J. Udo, and W. Thorpe. 2002. Development of smallholder dairy systems in the Kenya highlands. Outlook Agric. 31: 113‐120.
Budisatria, I.G.S., H.M.J. Udo, A.J. van der Zijpp, T.W. Murti, and E. Baliarti. 2007. Air and water qualities around small ruminant houses in Central Java, Indonesia. Small Rumin. Res. 67: 55‐63.
De Jonge, H. 1990. Of bull and men: The Madurese aduan sapi. Bijdragen tot de Taal‐, Land‐en Volkenkunde 146 (4): 423‐447.
Deptan. 2003. National Report on Animal Genetic Resources Indonesia; a Strategy of Development. Department of Agriculture, Jakarta.
FAO. 2012. Phenotypic characterization of animal genetic resources. FAO, Rome. FAO. 2013. In‐vivo conservation of animal genetic resources. FAO Animal Production and
Health Guidelines. No 14, FAO, Rome. Gandini, G. C. and E. Villa. 2003. Analysis of the cultural values of local livestock breeds: a
methodology. J. Anim. Breed. Genet. 120 (1): 1‐11. Gerber P.J, H. Steinfeld, B. Henderson, A. Mottet, C. Opio, J. Dijkman, A. Falcucci, and G.
Tempio. 2013. Tackling climate change through livestock‐ A global assessment of emissions and mitigation opportunities. FAO, Rome.
Chapter 6
125
Herrero, M., P.K. Thornton, P. Gerber, and R.S. Reid. 2009. Livestock, livelihoods and the environment understanding the trade‐offs. Curr. Opin. Environ. Sust. 1(2): 111‐120.
Herrero, M., and P.K. Thornton. 2013. Livestock and global change: emerging issues for sustainable food systems. P. Natl. Acad. Sci. USA 110 (52): 20878‐20881.
Hiemstra, S.J., D. Eaton, N.X. Trach, P.X. Hao, B.H. Doan, and J.J. Windig. 2006. Indicators to monitor livestock genetic diversity. 8th World Congress on Genetic Applied to Livestock Production. August 13‐18, 2006. Belo Horizonte, MGl.
Marshal, K. 2014. Optimising the use of breed types in developing country livestock production systems: a neglected research area. Anim. Breed. Genet. 14: 1‐2.
Martyniuk, E., D. Pilling and B. Scherf. 2010. Indicators: Do we have effective tools to measure trends in genetic diversity of domesticated animals? Anim. Genet. Resour. 47, 31‐43. Doi:10.1017/S2078633610001013
Steinfeld, H., P. Gerber, T. Wassenaar, V. Castel, M. Rosales and C. de Haan. 2006. Livestock's long shadow: environmental issues and options. FAO.
Sutresniwati. 2006. The invasion of crossbred cattle; stakeholders' perspectives in Central Java, Indonesia in Animal Production Systems. MSc Thesis. Wageningen University, Wageningen.
Syrstad, O. 1996. Dairy cattle crossbreeding in the tropics: choice of crossbreeding strategy. Trop. Anim. Hlth Prod. 28:223‐229.
Udo, H.M.J., H.A. Aklilu, L.T. Phong, R.H. Bosma, I.G.S. Budisatria, B.R. Patil, T. Samdup, and B.O. Bebe. 2011. Impact of intensification of different types of livestock production in smallholder crop‐livestock systems. Livest. Sci. 139:22‐29.
Zemmelink G., Ifar S. and S.J. Oosting. 2003: Optimum utilization of feed resources: model studies and farmers’ practices in two villages in East Java, Indonesia. Agric. Syst. 76, 77‐94.
General discussion
126
127
SUMMARY
In response to increasing demand for meat, Indonesia’s government has been
implementing crossbreeding with European beef breeds to improve the performance of
local cattle. Starting in the 1980’s, the Indonesian government started with importations of
semen of exotic beef breeds. About 90% of the 12.8 million cattle are in hands of
smallholder farmers. They keep cattle not only for meat production, but also for financial
security, manure for cropping, social‐cultural reasons, and draught power. At first,
crossbreeding was not very successful, but the preference of farmers for crossbreds has
changed over time. Nowadays, farmers have high expectations of crossbred cattle.
Crossbreeding is supported by a wide range of stakeholders, varying from policy makers,
extension workers and traders to butchers ranged from small‐large scale. The primary
objective of the crossbreeding policy is to increase beef production. Major concerns are the
impact of crossbreeding on rural livelihoods, the environment, the viability of the local
breeds, and the organization of breeding strategies. There is a lack of reliable field data that
can be used to support or deny cattle crossbreeding. Crossbreeding may influence not only
the future availability of local farm animal genetic resources but also (for better or worse)
the farming systems and livelihoods of livestock keepers. The main objective of the present
study was to evaluate the benefits and consequences of crossbreeding in smallholder cattle
farming systems, in order to develop a genetic impact assessment (GIA) of exotic cattle
breeds on cattle farming systems in Indonesia.
This study used different research methodologies, including literature review,
participatory observations and direct measurements of cattle performances, feeding
practices and farm inputs and outputs. Important issues related to the impact of
crossbreeding on smallholders farming systems were gathered through focus group
discussions (FGDs) among stakeholders. These issues were selected, measured and assessed
using semi‐structured interviews and measurements of cattle and farm performance, inputs
and outputs, and costs and benefits of cattle keeping. This study took place in Central Java
Province, Yogyakarta Province and Madura. Central Java and Yogyakarta Provinces are
located in Java, one of the largest islands and most populated island in Indonesia, whereas
Madura is a small, densely populated island located off the northeast coast of Java. Madura
was used to study the unique interaction between cattle and culture, and the potential
impact of crossbreeding on this interaction, as Madura is famous for cultural events
involving cattle. The study areas in Madura were determined by the use of cattle for
different cultural events: karapan bull racing, sonok cow contests and crossbred (madrasin:
LimousinxMadura) cattle contest. In Central Java, the study areas represent wet lowlands,
wet uplands, and dry uplands. These have different topography, soil types, soil fertility and
agro‐climatic conditions, and consequently different cropping patterns, land use
management and feed resources.
Summary
128
Chapter 2 was motivated by the concern that crossbreeding would have a negative
effect on the preservation of local traditions in Madura. Quantitative and qualitative
information was collected through participatory approaches involving farmers (n=97),
government officials, community groups, key informants, and through direct observation of
sonok, karapan and madrasin events. Phenotypic characteristics were collected from 184
cows. The Madura cattle breed and production systems are not homogenous. Four cattle
types could be distinguished: karapan, sonok, madrasin and conventional Madura cattle.
These cattle were found in three different areas: karapan, sonok and madrasin area. Sonok
and madrasin cows were significantly bigger and had higher body condition scores than
karapan cows and the conventional Madura cows. Madura cattle participating in cultural
events were valued at prices that were 2‐3.5 times higher than Madura cattle not
participating in cultural events. Crossbreeding will not directly influence the cultural events
or the management practices of Madura cattle in the karapan and sonok areas, however,
outside the karapan and sonok areas, crossbreds are rapidly replacing conventional Madura
cattle. It was concluded that cultural values of livestock can be a main driver for maintaining
relatively small populations of local breeds.
Chapter 3 addressed whether SimmentalxOngole crossbreeding is beneficial for the
mixed farming systems in four different agro‐ecological zones in Central Java. Chapter 4
addressed whether intensification through crossbreeding is beneficial for the environment,
in terms of the carbon footprint and land use. in Central Java. Both chapters used
quantitative and qualitative information collected through participatory approaches
involving 252 farmers in the four study areas. Phenotypic characteristics, reproductive
performances, and carcass characteristics of Ongole and crossbred cattle were assessed,
together with farmers’ reasons for keeping Ongole or crossbred breeding stock, and the
functions of cattle on the farms. All inputs and outputs of the cattle component on Ongole
and crossbred farms were determined to calculate Gross Margins. In chapter 4 these inputs
and outputs were used for a Life Cycle Assessment to compute emissions of the main
greenhouse gases, and land use for the crossbred and Ongole farms.
Across different agro‐ecological zones, crossbreeding was not changing the farming
systems: herd sizes, farm types, experience in cattle keeping, and functions of cattle were
about the same for Ongole and crossbred farms. Farmers were able to collect or buy extra
forages and concentrates for crossbreds. Crossbred cows were approximately 25% heavier
than Ongole cows. In terms of reproduction performances, both local and crossbred cows
performed well with calf crops ranging between 73% and 86% per year in the different
areas. Farmers are motivated to keep crossbred cattle as body weights and market prices
were higher than for Ongole cattle, although crossbreds required more feed resulting in
comparable Gross Margins for farmers with crossbred or Ongole breeding stock. So,
crossbreeding is not bringing financial gains for the farmers.
At national level crossbreeding is contributing to increased meat production. The
amount of weaned weight per farm was 20% higher on crossbred farms than on Ongole
farms.
Summary
129
Chapter 4 showed that crossbreeding (as a tool for intensification) was not more
efficient in mitigating GHG emissions and reducing land use per kg live weight produced
than Ongole in the present smallholder farming systems in Central Java. Expressed per kg
live weight of young stock produced, GWP and land use of Ongole and crossbred cattle were
not different. The advantage of the faster growth of crossbreds in GWP and land use per kg
live weight produced is counteracted by the higher emissions from feed production for
crossbreds. The biggest contribution to GWP was from enteric fermentation, which is closely
related with low quality of feeds available. Possibilities to improve the feed situation are
limited. Farmers do not have sufficient resources to invest in better feeding. Farmers have
no access to land for forage production, and they lack cash to buy good quality supplements
or concentrates.
In literature on farm animal genetic resources, the call for genetic impact assessments
(GIA) arises primarily because of concerns about the potential loss of genetic diversity
through crossbreeding or upgrading. Chapters two, three and four show that the impact of
crossbreeding has to be evaluated from a variety of issues. In Chapter 5, an integrative
assessment (Genetic Impact Assessment, GIA) was conducted, including identification of
stakeholders, identification of the issues, selection of indicators and development of GIA.
Based on seven focus group discussions with in total 296 participants, farmers and other
stakeholders mentioned relevant crossbreeding issues. Indicators at farm level were
selected for these issues. The indicators were tested with data from the Madura and Central
Java case‐studies and with population size data of Indonesian breeds. Farmers identified
economic benefits, feed availability, cattle management, animal performances, additional
functions of cattle, and health and fertility as issues. Other stakeholders mentioned meat
production, environmental quality and diversity in farm animal genetic resources as
important issues. The GIA developed on base of the two case studies gives clear indications
for the Indonesian farmers and the Indonesian government. At Madura, the Madura sub‐
populations should be conserved for their high cultural value and, in particular the sonok
Madura cattle still have opportunities to be improved in beef production traits. This is
valuable for farmers and government. At Java the GIA shows that crossbreeding with exotics
has limited possibilities to improve cattle production at farm level. Crossbreeding is also not
reducing rural poverty.
The dualism in crossbreeding is that policy makers promote crossbreeding to meet
the increasing demand for beef, whereas farmers are concerned with their livelihoods and
the multi‐functionality of cattle. Participatory approaches can ensure that farmers’ views
are considered in crossbreeding policies and practices. Crossbreeding has led to increased
beef production but not to more efficient use of resources. In practice, however,
crossbreeding will continue. Crossbreeding is limited to supply of exotic semen and is done
rather un‐controlled. Breeding strategies have to be adjusted, however, as farmers do not
want to completely upgrade their cattle to Simmental or Limousin. In Java, a viable Ongole
population is needed to reduce the risk of upgrading to too high levels of Simmental. The
cultural values of the different sub‐populations of Madura cattle are being maintained by
the farmers. The current breeding and conservation approaches do not consider the specific
Summary
130
needs of the farmers in the karapan and sonok areas. The future of sonok cattle is better
than for karapan cattle in terms of the risk of inbreeding, performances and the future
perspective of the cultural event. Sonok cows were comparable with madrasin cows in body
weight and body condition scores. This shows that crossbreeding for meat yield may not be
competitive with income from cultural values of sonok cattle and may not always be an
automatic choice. Farmers need continuous support and encouragement from policy
makers and scientists to conserve local breeds. There is an urgent need for reliable data on
the numbers and performances of different types of cattle in Indonesia. Farmers need to
know the crossbred generation of their breeding cows, so they can plan the use of semen
from exotic or local bulls.
The locally adapted Indonesian cattle breeds, that have many well appreciated
functions, deserve well designed and implemented conservation and breeding plans as a
guarantee to maintain their functions and increase beef production.
131
ACKNOWLEDGEMENTS
Conducting a participatory study, I had invaluable support and contributions from
many people and institutions that made my research and this thesis possible. So, let me
express my gratitude to those who contributed to completing this thesis.
This PhD research was possible with the financial support from the Directorate
General of Higher Education (DGHE), Ministry of Research, Technology and Higher Education
Republic of Indonesia, Universitas Gadjah Mada, Animal Production Systems Group,
Wageningen University, the Netherlands, and the Faculty of Animal Science, Universitas
Gadjah Mada. I wish to thank the Rector and former Rector of Universitas Gadjah Mada and
former Dean of Faculty of Animal Sciences, Prof. Dr. Ir. Tri Yuwanta, S.U., D.E.A who
supported me in undertaking a PhD program. My special thanks go to the current Dean,
Prof. Dr. Ir. Ali Agus, D.E.A, for his support.
I would like to express my sincere gratitude to my promotor, Prof. Dr. Akke van der
Zijpp, my co‐promotors Dr. Henk Udo and Dr. Kor Oldenbroek, who agreed to pursue my
PhD program in September 2008. Our discussions about this topic were started in 2004
when I finished my MSc Program. You always supported me in very positive ways and
guided me patiently to a good end. Akke, I appreciate your patience and kind hospitality, I
felt at home when you often invited me (and friends) to spend time for dinner and enjoyed
the view from your beautiful house. My great thanks to you, Henk, for your patience in
guiding me with your bright ideas and revising the messy drafts. I learned from you a lot.
My deep thanks go to Dr. Kor Oldenbroek, you gave me many different points of view.
Thanks for in‐depth discussions and guiding me in writing. I am proud to have three of you
as my promotors. Special credits must go to Dr. William Thorpe (Bill) for correcting my
manuscripts and giving his constructive comments.
I am indebted to the farmers, inseminators, extension and government staffs who
took part in this research and shared with me their knowledge, time and experience. In
Madura, I was fortunate to meet Pak Rudy Haryanto and Pak H. Zaenudin, who maintain
Sonok cattle conserved in an appropriate way. I admire your dedication to cultural Sonok
event and breeding in Waru sub‐district. Huge thanks to you and your family for your kind
hospitality to us and our students during field work. I thank Pak Chaeru Ahmadi and Pak
Kuswadi in Sumenep for your help during the field work in Sapudi Island. Pak Kuswadi, you
also took care of us during our stay. In Central Java and Yogyakarta, I am grateful for support
of contact persons: Pak Heru in Kebumen, Pak Paryadi and Pak Suradal in Gunung Kidul and
Pak Bibit in Sleman.
During field research, I was fortunate to find young, enthusiastic, hardworking field
assistants, among them Febri, Adit, Tessa, Bowo, Amir, Rozi, Adam, Endy, Muyas, Cahyadi,
Yoshi, Lilik, Hasan, Tiwi and others too numerous to name individually. All deserve thanks
and recognition. Special thanks to Febri and Tiwi for sending many data and taking charge of
administrative matters when I was in Wageningen.
Acknowledgements
132
My gratitude goes to Prof. Dr. Ir. Endang Baliarti (Bu Endang) and Prof. Ir. I Gede
Suparta Budisatria, PhD (Pak Gede) who not only advised and supervised me during the
fieldwork, but provided me invaluable help and personal encouragement. I extend thanks to
my colleagues in our laboratory, Prof. Nono Ngadiyono, Ir. Gatot Murdjito, Panjono, PhD,
and Danang MSc Pak Panjono, thanks for the nice pictures in the field and informal
discussion. Thanks also goes to Bu Tety Hartatik, PhD for good collaboration during field
work in Madura.
To all the staff at Animal Production Systems, thank you for your encouragement and
providing me a warm environment during my work. Dear Fokje, thank you for your
friendship and for time devoted to editing the drafts. Thanks for sharing your beautiful
pictures for the cover. Ymkje, thanks for your kindness and willingness to respond to my
queries. Theo Viets, thanks for your help on IT and LCA. I want to express my gratitude to
the head of the chair group, Prof. Dr. Imke de Boer, who facilitated me appropriately in the
group and cared about my progress. My PhD friends, David‐Eliza, thanks for your friendship,
encouraging me in many ways. Special thanks to Corina, for being my paranymph and
helping me to prepare the booklet. Marion, Marielle, Wenjuan, Aart, Iris and many others,
thanks for warm interactions during my PhD period in Wageningen. It was an unforgettable
experience to be part of this dynamic and intellectually engaging group.
To my Indonesian friends who made me feeling at home in Wageningen: Mbak Adian‐
Mas Hadi, thank you for sharing your house during my first stay in 2008. Diah ‘Dichan’, for
your kindness for sharing your house for two years. I have fond memories of Puspita, Esti,
Rani, Mbak Eva, Mbak Rini, Bu Elly, Kiki, Astri and Sacha. Mbak Sylvie and Yessie, we started
and finished our PhD in the same years, thanks to encouraging each other until the end of
our studies. Special thanks to Tika for being my paranymph and helping me for the defence.
Thanks to Nuzul, Pak Yonky, Novi, Teh Ais‐Kang Asep, Indraningrat, Bu Rina, Mbak Yuni,
Dianika, Jimmy, Twan Gevers – Mbak Yuni and many other Indonesian friends.
My friends at home, Eka, thanks for supporting me. Sidiq, thanks for helping me to
solve many IT problems; Dwi Nugroho for contributing the maps; Ayu, for sharing problems
as a PhD.
Last, but by no means the least, my deepest appreciation goes to my elder sisters,
Trisna Kumala Satya Dewi (Mbak Ning) and brother in law, Sholeh Dasuki for taking care of
Malya when I was away. Without both of you this PhD work would not have been possible.
Satya Alam Prihatini (Mbak Hetty) and brother in law, Sujiranto, for taking care of our ailing
(belated) father with all your patience. Terimakasih Bapak dan Ibu, untuk memberiku dua
kakak yang sangat menyayangiku tanpa pamrih. My dear beloved daughter Malya Cetta
Parahita, thanks for your understanding and sacrifices. Semoga engkau menjadi anak yang
kuat dan teguh karena tempaan ini. Special thanks for my loving husband, Ika Sumantri.
Several times, I called on you to assist with editing my draft thesis, thanks for being patient.
Through the tough times I have passed, the answer is you, true friend of my life. Cinta dan
hormatku terpatri untukmu. Widi
133
ABOUT THE AUTHOR
Widi was born on March 29th, 1975 in
Wonosobo, Central Java, Indonesia. During the period
1980‐1992 she completed her Elementary – High
school in Ambarawa, a small old‐town in Central Java.
She entered the Faculty of Animal Science, Universitas
Gadjah Mada, Yogyakarta and graduated in 1998. She
worked in a livestock private company before
continuing her studies to Master degree in Universitas
Gadjah Mada in 2000 and finishing in 2002.
In 2002, she was awarded a Wageningen
University scholarship to study an MSc in Animal
Sciences at Wageningen University, and obtained the
MSc degree in 2004. During her MSc study period, in
2003, she was formally admitted as a staff member in
the Faculty of Animal Science, Universitas Gadjah
Mada, Yogyakarta, Indonesia, where she has been working since. She is responsible for
lecturing of subjects related to livestock production, primarily on meat, draught and
companion animals. Apart from lecturing, she has research and public service obligations
related to the aforementioned subjects.
She started her PhD program in September 2008, funded by Directorate of Higher
Education (DGHE), Ministry of Research, Technology and Higher Education, Republic of
Indonesia. She has been involved in farm animal genetic resources biodiversity research
since 2004.
134
PUBLICATIONS
PEER REVIEWED
Widi, T.S.M., H.M.J. Udo, K. Oldenbroek, I.G.S. Budisatria, E. Baliarti, A.J. van der Zijpp
(2014). Unique cultural values of Madura cattle: is crossbreeding a threat? Animal
Genetic Resources 54: 141‐152.
Widi, T.S.M., H.M.J. Udo, K. Oldenbroek, I.G.S. Budisatria, T. Viets, E. Baliarti, A.J. van der
Zijpp (2015). Is crossbreeding of cattle beneficial for mixed farming systems in Central
Java. Animal Genetic Resources (in press).
Widi, T.S.M., H.M.J. Udo, K. Oldenbroek, I.G.S. Budisatria, E. Baliarti, A.J. van der Zijpp
(2015, has been submitted to Animal Genetic Resources). Is crossbreeding of cattle
beneficial for the environment? The case study of mixed farming systems in Central Java,
Indonesia.
Widi, T.S.M., H.M.J. Udo, K. Oldenbroek, I.G.S. Budisatria, E. Baliarti, A.J. van der Zijpp
(2015, has been submitted to Animal Genetic Resources). Designing genetic impact
methodology based on crossbreeding with exotic beef breeds in mixed farming systems
in Indonesia.
Hartatik, T., T.S.M. Widi, S.D. Volkandari, D. Maharani, Sumadi. 2014. Analysis of DNA
polymorphism in SRY gene of Madura cattle populations. Procedia Environmental
Sciences 20 (2014): 365‐369.
ABSTRACTS IN SCIENTIFIC MEETINGS
Widi, T.S.M., and T. Hartatik. The characteristics and performances of sonok compared to
karapan cows as important consideration for conservation of Madura cattle. Tropentag
2009 Conference. Hamburg, Germany, 6th – 8th October, 2009.
Widi, T.S.M., T. Hartatik, and H.M.J. Udo. Traditional art contest of sonok as an
alternative selection for Madura cattle. Tropentag 2010 Conference. Zurich, Switzerland,
14th – 16th September, 2010.
Widi, T.S.M., I.G.S. Budisatria, E. Baliarti, H.M.J. Udo. Diversity on the exterior
performance of crossbred cattle kept by farmers in Central Java. The 5th International
Seminar of Tropical Animal Production. Yogyakarta, Indonesia, 19th – 21st October, 2010.
Widi, T.S.M., H.M.J. Udo, K. Oldenbroek, I.G.S. Budisatria, E. Baliarti, and A.J. van der
Zijpp. Impact of crossbreeding on social and cultural values of Madura cattle; a unique
case study on Madura Island. Wageningen Institute of Animal Science (WIAS Science
Day). Wageningen, the Netherlands, 2nd February 2012.
Widi, T.S.M., H.M.J. Udo, K. Oldenbroek, I.G.S. Budisatria, T. Viets and A.J. van der Zijpp.
Life cycle assessment of local and crossbred cattle production systems in Central Java,
Indonesia. The 16th Asian Australasian Animal Production Congress. Yogyakarta,
Indonesia, 10th ‐14th November, 2014.
135
PhD EDUCATION PLAN
With the educational activities listed below the PhD candidate has complied with the educational requirements set by the graduate school Wageningen Institute of Animal Science (WIAS) at Wageningen University, which comprises a minimum of 30 ECTS, which equals a workload of 21 weeks. Each ECTS (An European Credit Transfer and Accumulation System) equals a workload of 28 hours.
BASIC PACKAGE (3.0 ECTS)
WIAS Introduction Course
Course of philosophy of science and / or ethics SCIENTIFIC EXPOSURE (11.0 ECTS)
Four International conferences: (1) TROPENTAG 2009, (2) TROPENTAG 2010, (3) The 5th International Seminar on Tropical Animal Production (ISTAP 5), Yogyakarta (4) The 16th Asian‐Australasian Association of Animal Production Societies Congress
Four symposium and workshops
Four oral / poster presentations at international conferences Two oral presentations at seminar and workshop
IN‐DEPTH STUDIES (7.0 ECTS)
Experimental methods in social science and inter‐disciplinary research, 5th – 9th January 2009
Advanced statistics, 11th – 13th February 2009 Genetic resource policies and conservation strategies for plant and animal genetic
resources, 12th – 30th April 2010
Data analysis, 2nd – 8th June 2010 PROFESSIONAL SKILLS SUPPORT COURSES (4.0 ECTS)
Techniques for writing and presenting scientific papers PhD competence assessment
Project time management
English course (CENTA), October 2008 – February 2009 RESEARCH SKILLS TRAINING (6.0 ECTS)
Preparing own PhD research proposal, September 2008 – March 2009 DIDACTIC SKILLS TRAINING (11.0)
Lecturing Supervising theses : Local supervisor for thesis of Marjon Schultinga, Wageningen University
Supervision planned for students at Universitas Gadjah Mada: Aditya Kurniawan, Febri Ariyanti, Tesa Riatnawati and Adam Khoerul Anam
MANAGEMENT SKILLS TRAINING (1.0 ECTS)
Official of Lustrum Seminar at Universitas Gadjah Mada
TOTAL ECTS 43.0
136
COLOPHON
This research was generously funded by Directorate General of Higher Education (DGHE),
Ministry of Research, Technology and Higher Education, Republic Indonesia.
Cover design by Tri Satya Mastuti Widi and Fokje Steenstra.
Photos in Figure 2.3. are from Marjon Schultinga, in front cover Chapter 1 and 4 from
Panjono, and some in thesis cover and front cover Chapter 6 from Fokje Steenstra. The not‐
specified photos are from Tri Satya Mastuti Widi.
This thesis was printed by GVO drukkers & vormgevers B.V. Ede, the Netherlands.