maine highway safety facts 2016 - the · pdf filemaine highway safety facts 2016. the bureau...
TRANSCRIPT

Maine Highway Safety Facts 2016

The Bureau of Highway Safety and the Maine Department of Transportation are pleased to present the 2016 edition of Maine Highway Safety Facts. This publication provides Maine crash data facts through 2015 giving a view of traffic crashes and their factors. It can be a valuable tool in problem identification, safety education and community activities. Since it is intended to provide a general information overview, the data is presented in a very basic format. Trend lines reflect five-year annual averages. Topics covered represent the most frequently requested information. Data sources are from the Maine Fatal Analysis Reporting System (FARS) and MaineDOT’s crash data system. Any comments or questions you may have about the information are welcome.
Lauren StewartMaine Bureau of Highway [email protected]
Duane BrunellMaine Department of [email protected] themtsc.org
Contacts:
2016 MAINE HIGHWAY SAFETY FACTS
MaineDOT

Statewide Crash OverviewMaine Quick Crash Facts ...........................................................................................................................................4-5Crashes and Crash Rates ...........................................................................................................................................6-7Fatalities and Fatality Rates .....................................................................................................................................8-9Incapacitating Injuries ................................................................................................................................................ 10Snapshot Look at Focus Areas - Maine Top Crash Types ................................................................................ 11Crashes and Fatalities by Jurisdiction .............................................................................................................12-13Crashes and Fatalities by Federal Functional Class ....................................................................................14-15Crashes and Fatalities by Type ...........................................................................................................................16-17Crashes and Fatalities by Month ......................................................................................................................18-19Crashes and Fatalities by Day of Week ...........................................................................................................20-21Crashes and Fatalities by Time of Day ............................................................................................................22-23
Road SettingsLane Departure .......................................................................................................................................................24-25Head-On ....................................................................................................................................................................26-27Went-Off-Road ........................................................................................................................................................28-29Intersections ............................................................................................................................................................30-31Road Surface Conditions ........................................................................................................................................... 32Fixed Object Struck ..................................................................................................................................................... 33
BehaviorDriver Actions ..........................................................................................................................................................34-35Seat Belt Usage .......................................................................................................................................................36-37Speed .........................................................................................................................................................................38-39Impaired ....................................................................................................................................................................40-41Distracted .................................................................................................................................................................42-43Operating After Suspension .................................................................................................................................... 44Fatalities by Selected Categories by Year ............................................................................................................ 45
Road User GroupsCrash and Fatality Rates by Driver Age ..........................................................................................................46-47Younger Drivers ......................................................................................................................................................48-53Mature Drivers.........................................................................................................................................................54-55Bicyclists ....................................................................................................................................................................56-57Pedestrians ...............................................................................................................................................................58-59
Special Vehicle ClassesLarge Trucks and Commercial Vehicles ..........................................................................................................60-63Motorcycles ..............................................................................................................................................................64-65
Large Animals (Deer and Moose)Crashes and Fatalities ...........................................................................................................................................66-67Crashes by County ....................................................................................................................................................... 68Crashes by Month ........................................................................................................................................................ 69Crashes by Light Condition ................................................................................................................................70-71
Table Of Contents
Stat
ewid
e Cr
ash
Ove
rvie
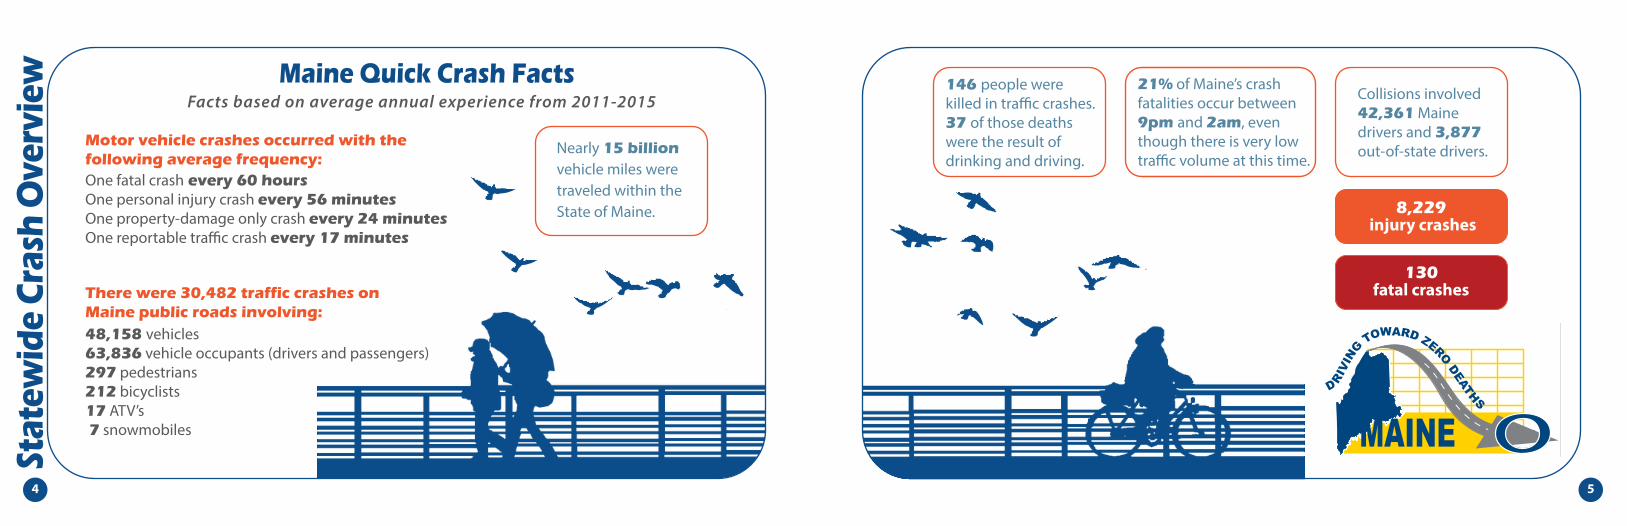
w Maine Quick Crash Facts
Motor vehicle crashes occurred with the following average frequency:
Facts based on average annual experience from 2011-2015
One fatal crash every 60 hoursOne personal injury crash every 56 minutesOne property-damage only crash every 24 minutesOne reportable tra�c crash every 17 minutes
48,158 vehicles63,836 vehicle occupants (drivers and passengers)297 pedestrians212 bicyclists17 ATV’s 7 snowmobiles
There were 30,482 traffic crashes on Maine public roads involving:
Nearly 15 billion vehicle miles were traveled within the State of Maine.
21% of Maine’s crash fatalities occur between 9pm and 2am, even though there is very low tra�c volume at this time.
130 fatal crashes
8,229 injury crashes
Collisions involved 42,361 Maine drivers and 3,877 out-of-state drivers.
oDRI
VING
TOWARD ZERO DEATHS
MAINE
146 people were killed in tra�c crashes. 37 of those deaths were the result of drinking and driving.
54

0
5,000
10,000
15,000
20,000
25,000
30,000
35,000
40,000
20062007
20082009
20102011
20122013
20142015
Cras
hes
Maine Crashes
Total reportable crashes on Maine’s public roads.
5YAACrashes = 30,480
Crashes
5 Year Rolling Avg.
0.0
50.0
100.0
150.0
200.0
250.0
Cras
h R
ate
(Per
HM
VM)
Maine Crash Rates
Crashes per estimated hundred million vehicle miles traveled.
20062007
20082009
20102011
20122013
20142015
5YAARates = 209.1
Rates
5 Year Rolling Avg.
76

166
187
175
204
192
169
188
155
161
136
164
131
156
100
120
140
160
180
200
220
1996
1997
1998
1999
2000
2001
2002
2003
2004
2005
2006
2007
2008
2009
2010
2011
2012
2013
2014
2015
Fata
litie
sMaine Annual Fatalities
Maine fatalities as identi�ed in Fatal Analysis Reporting System (www.nhtsa.gov/FARS)
5YAAFatalities = 146.4
Fatalities
5 Year Rolling Avg.
1.31
1.36
1.22
1.16
1.34
1.36
1.13
1.251.22
1.07
1.11
0.95
1.14
1.01 0.91
1.05
0.50
0.60
0.70
0.80
0.90
1.00
1.10
1.20
1.30
1.40
1.50
1996
1997
1998
1999
2000
2001
2002
2003
2004
2005
2006
2007
2008
2009
2010
2011
2012
2013
2014
2015
Fata
lity
Rat
e (P
er H
MVM
)
Maine Fatality Rates
Fatalities per estimated hundred million vehicle miles traveled.
5YAARates = 1.01
Fatality Rate
5 Year Rolling Avg.
98

0
200
400
600
800
1000
1200In
juri
esMaine Incapacitating Injury Outcomes
5YAAIncapacitatingInjuries = 868.4
IncapacitatingInjuries
5 Yr. Rolling Avg.
20062007
20082009
20102011
20122013
20142015
1110
SNAPSHOT LOOK AT FOCUS AREASMaine Top Crash Types Based On Annual Average Of Last 5 Years’ Experience
(2011-2015)2006-2010 Experience
LEAD FOCUS AREAS
5 Year Average 5 Year Average Severity Comparison 5 Year Average
Annual Crashes Annual Fatalities Fatalities/1000 Crashes Annual Crashes Annual Fatalities
(2011-2015) (2011-2015) (2011-2015) (2006-2010) (2006-2010)
All Crash Types 30,482 146.4 4.8 30,750 169.2
Lane Departure 9,177 99.2 10.8 8,727 118.8
Speed 4,449 59 13.3 5,670 67.6
Unbelted 55.6 55.4
16-18 Year Old 2,943 11.4 3.9 3,334 14.8
16-20 Year Old 5,330 18.2 3.4 6,597 27.2
21-24 Year Old 4,551 20.2 4.4 4,587 24.4
Alcohol 1,197 37.6 31.4 1,566 55.0
*Distracted/Inattentive 3,092 12.75 4.1 11,348 42.6
65-98 Year Old 5,335 35.4 6.6 5,010 33.1
Motorcycles 577 19 32.9 624 20.6
Winter 6,030 15 2.5 6,215 16.4
Intersections 8,732 17.4 2.0 9,058 21.6
Large Trucks 518 5.2 10.0 749 12
Pedestrians 297 11.8 39.7 249 12.2
Moose 365 0.8 2.2 561 2.2
Bicycles 208 1.4 6.7 192 2.0
*NOTE: The significant variance in this area is due to the 2011 Maine Crash Reporting System (MCRS) change in distracted driving reporting definition. Distracted driving results are for 2012-2015.
Overall results from 2011-2015 (white) have shown improvement over the earlier five-year study period of 2006-2010 (blue).
Severity comparison (orange column) shows relative potential for a fatal outcome - the higher the number, the higher the chance of a fatality in that crash type.

0
2000
4000
6000
8000
10000
12000
14000
16000
18000
20000
Cras
hes
Crashes by Road Jurisdiction
20062007
20082009
20102011
20122013
20142015
State Highway TownwayState Aid Toll Highway
0
20
40
60
80
100
120
Fata
litie
s
Fatalities by Road Jurisdiction
20062007
20082009
20102011
20122013
20142015
State Highway TownwayState Aid Toll Highway1312
Miles of Road 2015State Highway 4,083State Aid 4,267Townway 13,457Toll Highway 112( not including seasonal )100 Million VehicleMiles Traveled 2015State Highway 86.0State Aid 28.6Townway 18.5Toll Highway 14.5

0
1000
2000
3000
4000
5000
6000
7000
8000
9000
Cras
hes
Crashes by Federal Functional Class
20062007
20082009
20102011
20122013
20142015
Major/Urban Collector Local Principal Arterial Interstate
Minor CollectorMinor Arterial Other Principal Arterial
0
10
20
30
40
50
60
Fata
litie
s
Fatalities by Federal Functional Class
20062007
20082009
20102011
20122013
20142015
Major/Urban Collector Local Principal Arterial Interstate
Minor CollectorMinor Arterial Other Principal Arterial1514
Miles of RoadMajor/Urban Collector 3,800Minor Arterial 1,188Local 13,456Other Principal Arterial 923Principal Arterial Interstate 365Minor Collector 2,167100 Million Vehicle Miles TraveledMajor/Urban Collector 32.3Minor Arterial 27.6Local 18.5Other Principal Arterial 25.7Principal Arterial Interstate 33.2Minor Collector 8.7

Went-O�-Road
Head-On
Rear-End
Moose
Bicycle
Intersection
Rollover
Pedestrians
All Other Animals
Deer
Maine Crashes by Type (2006-2015)
29%
3%
33%
18%
10%
Lane Departure
Went-O�-Road
Head-On
Rear-End
Moose
Bicycle
Intersection
Rollover
Pedestrians
All Other Animals
Deer
Fire
Maine Fatalities by Type (2006-2015)
49%
23%
4%
10%7%
Lane Departure
1716

0%
2%
4%
6%
8%
10%
12%
14%Pe
rcen
t of T
otal
Cra
shes
Crashes by Month (2006-2015)
January
FebruaryMarch
AprilMay
JuneJuly
August
September
October
November
December
Trend Line
0%
2%
4%
6%
8%
10%
12%
14%
Perc
ent o
f Tot
al F
atal
itie
s
Fatalities by Month (2006-2015)
January
FebruaryMarch
AprilMay
JuneJuly
August
September
October
November
December
Trend Line1918

0%
2%
4%
6%
8%
10%
12%
14%
16%
18%Pe
rcen
t of T
otal
Cra
shes
Crashes by Day of the Week (2006-2015)
Monday
Tuesday
Wednesday
Thursday
Friday
Saturday
Sunday0%
2%
4%
6%
8%
10%
12%
14%
16%
18%
20%
Perc
ent o
f Tot
al F
atal
itie
s
Fatalities by Day of the Week (2006-2015)
Monday
Tuesday
Wednesday
Thursday
Friday
Saturday
Sunday
2120

0%
1%
2%
3%
4%
5%
6%
7%
8%
9%
Mid
nigh
t1:
00 A
M2:
00 A
M3:
00 A
M4:
00 A
M5:
00 A
M6:
00 A
M7:
00 A
M8:
00 A
M9:
00 A
M10
:00
AM11
:00
AMN
oon
1:00
PM
2:00
PM
3:00
PM
4:00
PM
5:00
PM
6:00
PM
7:00
PM
8:00
PM
9:00
PM
10:0
0 PM
11:0
0 PM
Crashes by Time of Day (2006-2015)Pe
rcen
t of T
otal
Cra
shes
0%
1%
2%
3%
4%
5%
6%
7%
Mid
nigh
t1:
00 A
M2:
00 A
M3:
00 A
M4:
00 A
M5:
00 A
M6:
00 A
M7:
00 A
M8:
00 A
M9:
00 A
M10
:00
AM11
:00
AMN
oon
1:00
PM
2:00
PM
3:00
PM
4:00
PM
5:00
PM
6:00
PM
7:00
PM
8:00
PM
9:00
PM
10:0
0 PM
11:0
0 PM
Fatalities by Time of Day (2006-2015)
Perc
ent o
f Tot
al F
atal
itie
s
2322
0
2000
4000
6000
8000
10000
12000Cr
ashe
sLane Departure Crashes
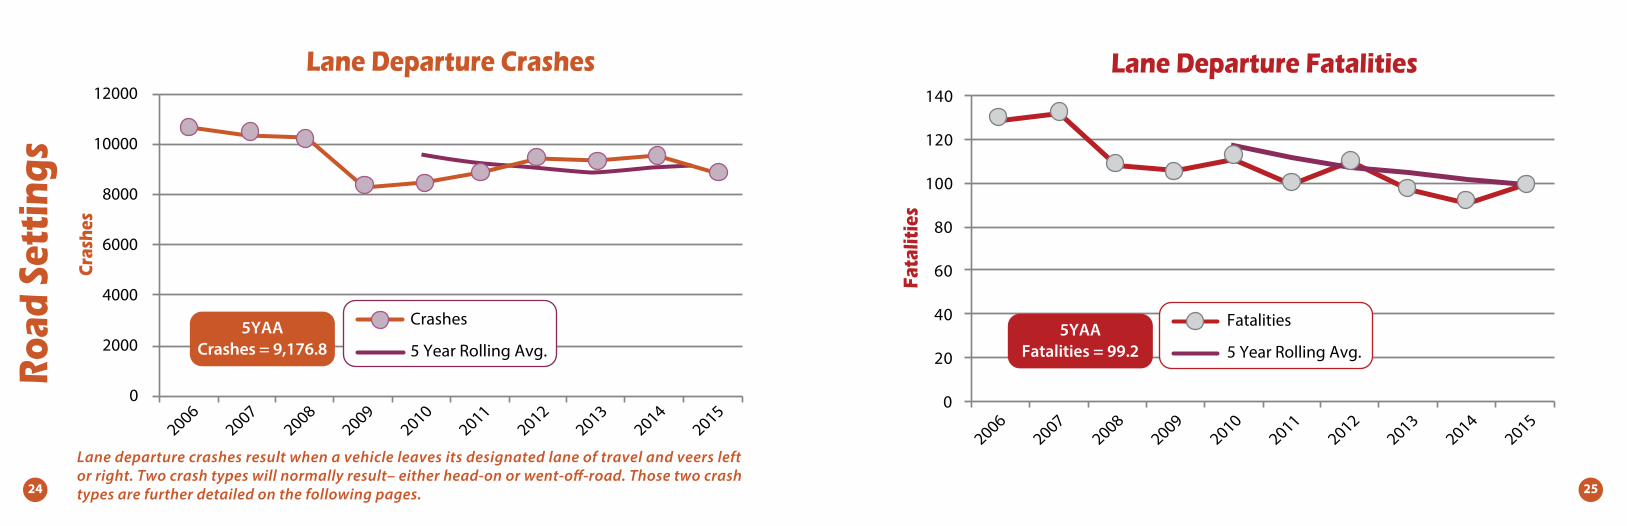
Lane departure crashes result when a vehicle leaves its designated lane of travel and veers left or right. Two crash types will normally result– either head-on or went-o�-road. Those two crash types are further detailed on the following pages.
Roa
d Se
ttin
gs
20062007
20082009
20102011
20122013
20142015
5YAACrashes = 9,176.8
Crashes
5 Year Rolling Avg.
0
20
40
60
80
100
120
140
Fata
litie
s
Lane Departure Fatalities
5YAAFatalities = 99.2
Fatalities
5 Year Rolling Avg.
20062007
20082009
20102011
20122013
20142015
2524

Cras
hes
Head-On Crashes
Head-on crashes are much more severe than went-o�-road. There is an average of 42 fatalities/1,000 crashes for head-on compared to 8.3 fatalities/1,000 crashes in went-o�-road crashes.
5YAACrashes = 820
Crashes
5 Yr. Rolling Avg.
0
200
100
300
400
500
600
700
800
900
1000
20062007
20082009
20102011
20122013
20142015
0
5
10
15
20
25
30
35
40
45
50
Fata
litie
s
Head-On Fatalities
20062007
20082009
20102011
20122013
20142015
5YAAFatalities = 34.8
Fatalities
5 Yr. Rolling Avg.
2726
0
2000
4000
6000
8000
10000
12000Cr
ashe
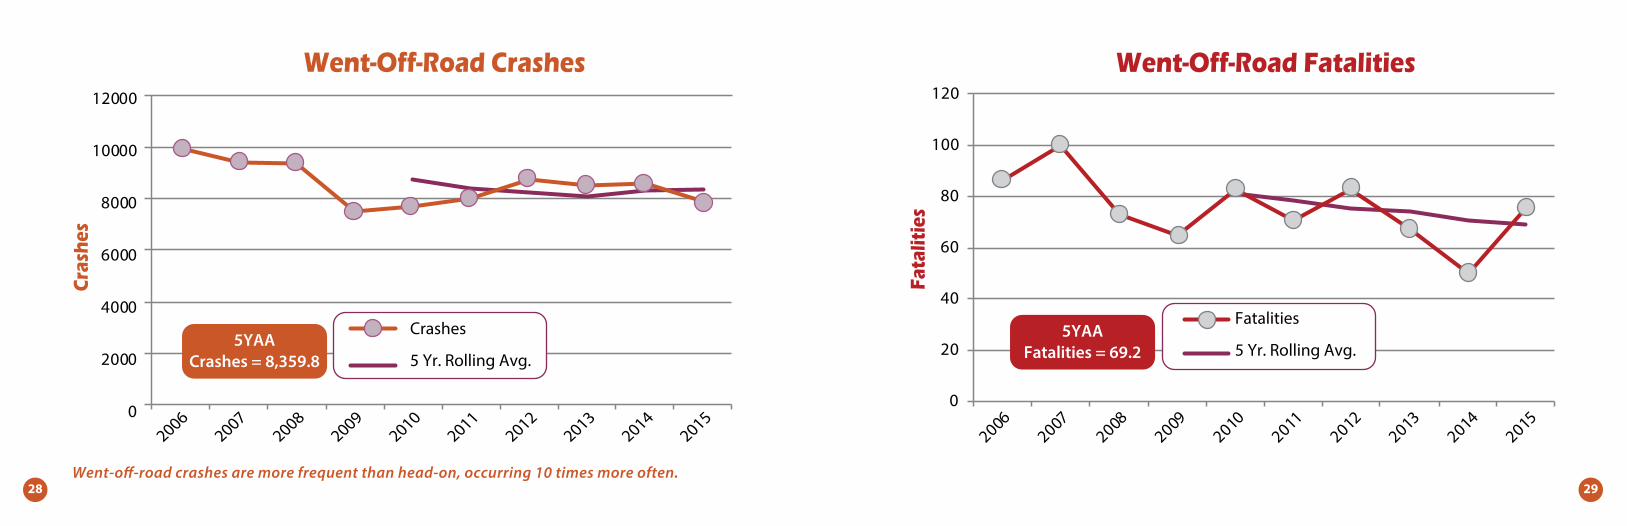
sWent-Off-Road Crashes
Went-o�-road crashes are more frequent than head-on, occurring 10 times more often.
5YAACrashes = 8,359.8
20062007
20082009
20102011
20122013
20142015
Crashes
5 Yr. Rolling Avg.
0
20
40
60
80
100
120
Fata
litie
s
Went-Off-Road Fatalities
20062007
20082009
20102011
20122013
20142015
5YAAFatalities = 69.2
Fatalities
5 Yr. Rolling Avg.
2928

0
2000
4000
6000
8000
10000
12000
Cra
shes
Intersection Crashes(Three-, Four- and Five-Leg Intersections)
20062007
20082009
20102011
20122013
20142015
5YAACrashes = 8,732
Crashes
5 Year Rolling Avg.
0
5
10
15
20
25
30
Fata
litie
s
Intersection Fatalities(Three-, Four- and Five-Leg Intersections)
20062007
20082009
20102011
20122013
20142015
5YAAFatalities = 17.4
Fatalities
5 Year Rolling Avg.
3130

0
5000
10000
15000
20000
Maine Crashes by Road Surface Condition (2011-2015)
January
February
March AprilMay
June
July
August
September
October
November
December
Wet Dry
Snow, Slush, Ice, Frost
0%5%
10%15%20%25%30%35%40%
Perc
ent o
f Tot
al C
rash
es a
nd F
atal
itie
s
Top Fixed Objects Struck (2012-2015)
Fixed objects struck data, as currently de�ned, has only been available since 2012.
Tree (standing)
Ditch
Utility Pole/Light S
upport
Embankment
Guardrail Face
Mailbox
Tra�c Sign Support
Guardrail End
Culvert
Bridge Rail
Cable Guardrail Barrie
r
CrashesFatalities
3332

0500
100015002000250030003500400045005000
Failed to
Yield Right-of -W
ay
Followed Too Closely
Exceeded Poste
d Speed Limit
Drove Too Fast For C
onditions
Ran O� Roadway
Improper B
acking
Failed to
Keep in Proper L
ane
Improper T
urn
Improper P
assing
Erratic
, Reckless, and Careless
Driving
Ave
rage
Ann
ual
Cras
hes
Top Driver Actions in Crashes (2006-2015)B
ehav
ior
0
10
20
30
40
50
60
Ave
rage
Ann
ual F
atal
itie
s
Top Driver Actions in Fatal Crashes (2006-2015)
Failed to
Yield Right-of -W
ay
Followed Too Closely
Exceeded Poste
d Speed Limit
Drove Too Fast For C
onditions
Ran O� Roadway
Improper B
acking
Failed to
Keep in Proper L
ane
Improper T
urn
Improper P
assing
Erratic
, Reckless, and Careless
Driving
3534

59.0%
83.0% 84.4%85.0% 85.5%
75%
82%83% 85% 84%
86%87% 89%
50%
55%
60%
65%
70%
75%
80%
85%
90%
95%
100%
Seat Belt Usage – Maine and United States
Seat belt usage numbers are developed by local observational studies.
20052002
20042006
20072008
20092010
20112012
20132014
2015
Perc
ent o
f Sea
t Bel
t Usa
ge
MaineUS
30%
40%
50%
60%
70%
80%
90%
100%
100
120
140
160
180
200
220
240
2002
2003
2004
2005
2006
2007
2008
2009
2010
2011
2012
2013
2014
2015
Pe
rcen
t of U
sag
e
Fa
tali
tie
s
Maine Fatalities vs. Seat Belt Usage
Seat Belt UseLinear (Seat Belt Use)
FatalitiesLinear (Fatalities)
3736

0
10
20
30
40
50
60
70
80
90
Fata
litie
s
Illegal/Unsafe Speed Fatalities
20062007
20082009
20102011
20122013
20142015
5YAAFatalities = 59.2
Fatalities
5 Year Rolling Avg.
0
1000
2000
3000
4000
5000
6000
7000Cr
ashe
sIllegal/Unsafe Speed Crashes
20062007
20082009
20102011
20122013
20142015
5YAACrashes = 4,448.6
Crashes
5 Year Rolling Avg.
3938

0
200
400
600
800
1000
1200
1400
1600
1800
2000C
rash
esImpaired Crashes
20062007
20082009
20102011
20122013
20142015
5YAACrashes = 1,197.2
Crashes
5 Year Rolling Avg.
0
20
40
60
80
100
120
140
160
180
200
2011 2012 2013 2014 2015
Fata
litie
s
Alcohol and Non-Alcohol Related Fatalities
5YAAFatalities = 37.6
Non-Alcohol Fatalities
Fatalities Involving Alcohol
4140

0
2000
4000
6000
8000
10000
12000
14000Cr
ashe
sDistracted Driving Crashes
Prior to 2011, police crash reports captured general distracted/inattentive driving factors, and 10,000+ distraction/inattention related crashes were reported annually. During 2011, Maine switched to an updated crash report in line with national guidance that now reports on speci�c distracted practices, but does not include generic inattention, greatly reducing the reported number of distracted crashes. Distracted driving behaviors are usually self-reported.
20062007
20082009
20102011
20122013
20142015
Old Report Format
New Report Format
0
10
20
30
40
50
60
Fata
litie
s
Distracted Driving Fatalities
20062007
20082009
20102011
20122013
20142015
Old Report Format
New Report Format
4342

4544
Crashes Involving Drivers with Suspended LicensesYear All
CrashesSuspended Crashes
% of Suspended Crashes
AllFatalities
Suspended Fatalities
% of Suspended Fatalities
2003 35,208 795 2.26% 207 9 4.35%2004 35,014 854 2.44% 194 20 10.31%2005 35,047 707 2.02% 169 17 10.06%2006 32,067 679 2.12% 188 18 9.57%2007 33,386 789 2.36% 183 16 8.74%2008 31,779 584 1.84% 155 4 2.58%2009 28,980 613 2.12% 159 14 8.81%2010 27,893 581 2.08% 161 8 4.97%2011 28,654 577 2.01% 136 11 8.09%2012 28,522 661 2.32% 164 16 9.76%2013 30,510 630 2.06% 145 19 13.10%2014 31,880 667 2.09% 131 14 10.69%2015 32,845 677 2.06% 156 15 9.62%5 Year Annual Average 642.4 2.11% 15 9.91%
Fatalities by Selected Categories by Year (2011-2015)
Year Pedestrian Bicycle Motorcycle Impaired % Impaired TotalFatalities
2011 11 0 15 23 17 1362012 9 1 24 50 30 1642013 11 4 14 35 24 1452014 9 2 10 33 25 1312015 19 0 32 47 30 1565 Year Avg. 11.8 1.4 19 37.6 25.2 146.4
This table shows the relationship between the various classifications of fatalities and the total number of fatalities.

0
200
400
600
800
1000
1200
1400
1600
1800
16 17 18 19 20 21 22 23 24
25-2
9
30-3
4
35-3
9
40-4
4
45-4
9
50-5
4
55-5
9
60-6
4
65-6
9
70+
Cras
hes
(Per
HM
VM)
Driver Age
Crash Rates by Driver Age (2011-2015)
The rates on the next two pages are estimates, based on Maine’s licensed driver population and national estimates on annual mileage driven by age group. Any crash-involved driver is included in this data, regardless of fault.
Roa
d U
ser G
roup
s Crash Rate
Trend Line
0
1
2
3
4
5
6
7
8
16 17 18 19 20 21 22 23 24
25-2
9
30-3
4
35-3
9
40-4
4
45-4
9
50-5
4
55-5
9
60-6
4
65-6
9
70+
Fata
litie
s (P
er H
MVM
)
Driver Age
Fatal Crash Rates by Driver Age (2011-2015)
Fatal Rate
Trend Line
4746

0
5
10
15
20
25
30
Fata
litie
s
20062007
20082009
20102011
20122013
20142015
5YAAFatalities= 11.4
Fatalities
5 Yr. Rolling Avg.
Driver Fatalities (Ages 16-18)
0
500
1000
1500
2000
2500
3000
3500
4000
4500
5000
Cras
hes
Driver Crashes (Ages 16-18)
20062007
20082009
20102011
20122013
20142015
5YAACrashes = 2,943.4
Crashes
5 Yr. Rolling Avg.
4948
Licensed Drivers(Ages 16-18)
2004 30,6612005 30,5222006 30,8362007 30,1822008 28,7702009 28,0302010 27,1932011 26,2432012 25,2032013 24,3832014 23,9722015 23,240

0
1000
2000
3000
4000
5000
6000
7000
8000Cr
ashe
s
20062007
20082009
20102011
20122013
20142015
Crashes
5 Yr. Rolling Avg.5YAA
Crashes = 5,329.6
Driver Crashes (Ages 16-20)
0
5
10
15
20
25
30
35
40
45
50
Fata
litie
s
20062007
20082009
20102011
20122013
20142015
Fatalities
5 Yr. Rolling Avg.5YAA
Fatalities = 18.2
Driver Fatalities (Ages 16-20)
5150
0
1000
2000
3000
4000
5000
6000Cr
ashe
s
20062007
20082009
20102011
20122013
20142015
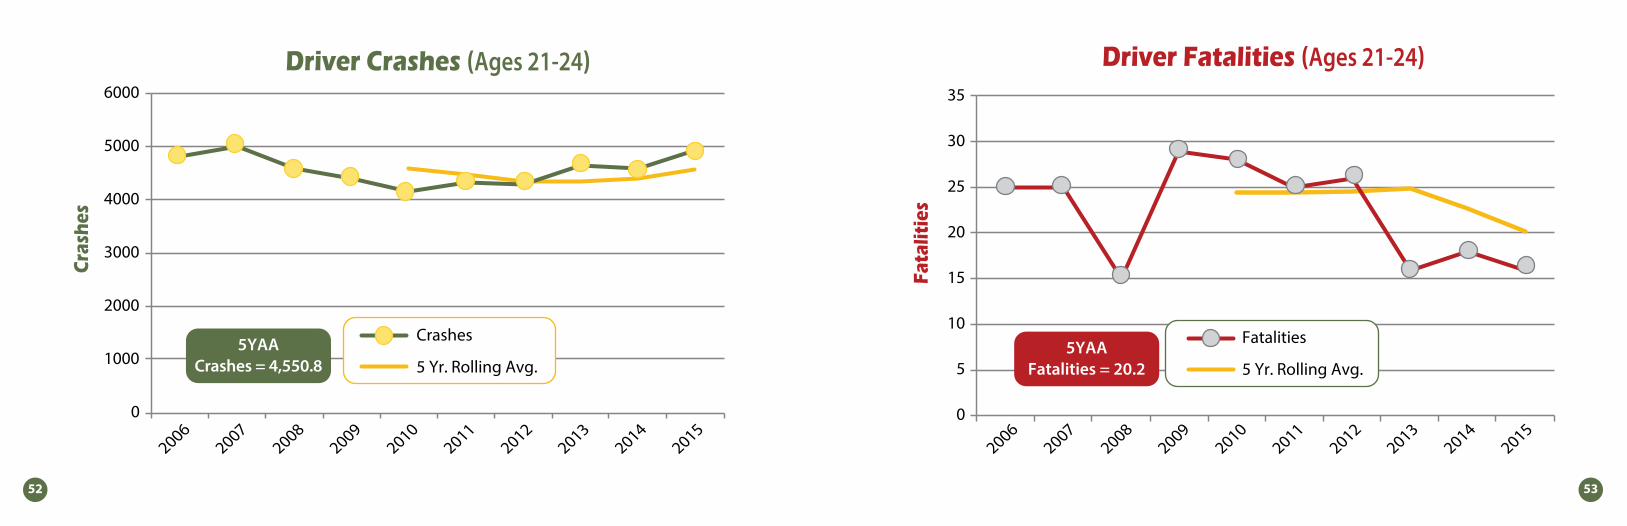
5YAACrashes = 4,550.8
Crashes
5 Yr. Rolling Avg.
Driver Crashes (Ages 21-24)
0
5
10
15
20
25
30
35
Fata
litie
s
20062007
20082009
20102011
20122013
20142015
Fatalities
5 Yr. Rolling Avg.5YAA
Fatalities = 20.2
Driver Fatalities (Ages 21-24)
5352
0
5
10
15
20
25
30
35
40
45
Fata
litie
s
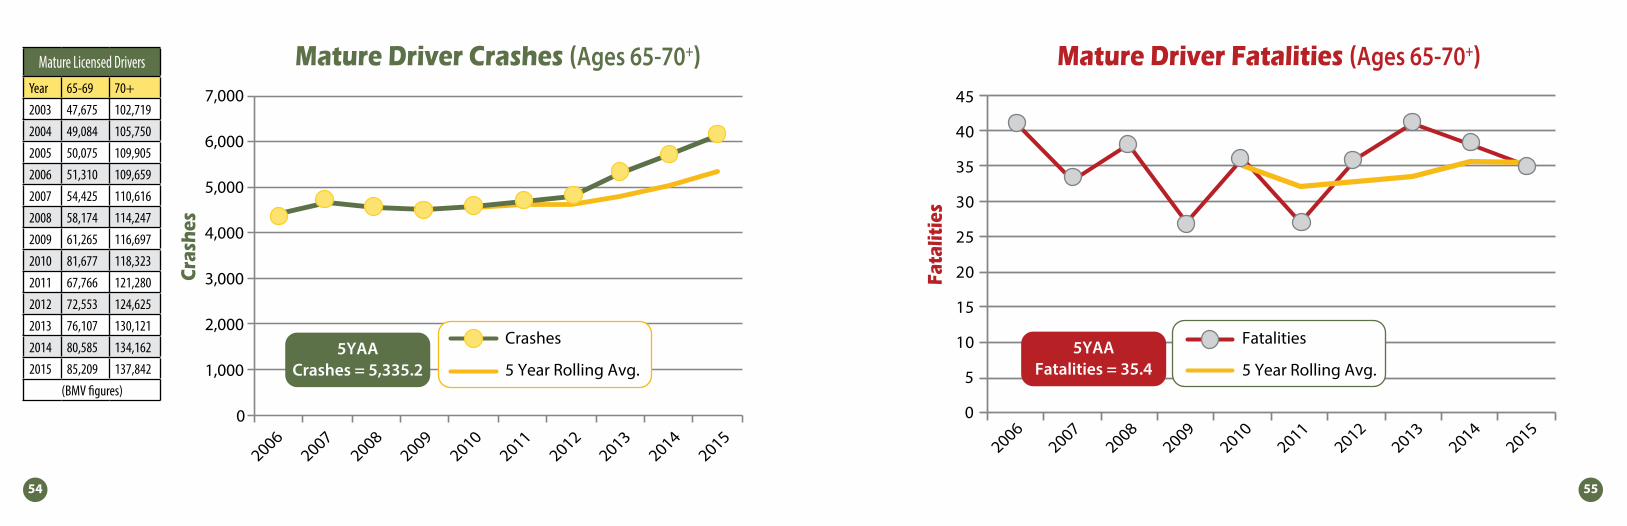
Mature Driver Fatalities (Ages 65-70+)
20062007
20082009
20102011
20122013
20142015
Fatalities
5 Year Rolling Avg.5YAA
Fatalities = 35.4
0
1,000
2,000
3,000
4,000
5,000
6,000
7,000
Cras
hes
Mature Driver Crashes (Ages 65-70+)
20062007
20082009
20102011
20122013
20142015
5YAACrashes = 5,335.2
Crashes
5 Year Rolling Avg.
5554
Mature Licensed DriversYear 65-69 70+2003 47,675 102,7192004 49,084 105,7502005 50,075 109,9052006 51,310 109,6592007 54,425 110,6162008 58,174 114,2472009 61,265 116,6972010 81,677 118,3232011 67,766 121,2802012 72,553 124,6252013 76,107 130,1212014 80,585 134,1622015 85,209 137,842
(BMV figures)

0
50
100
150
200
250Cr
ashe
sBike Crashes
20062007
20082009
20102011
20122013
20142015
5YAACrashes = 207.8
Crashes
5 Year Rolling Avg.0
1
2
3
4
5
Fata
litie
s
Bike Fatalities
20062007
20082009
20102011
20122013
20142015
5YAAFatalities = 1.4
5756

220
230
240
250
260
270
280
290
300Cr
ashe
sPedestrian Crashes
20062007
20082009
20102011
20122013
20142015
5YAACra s hes = 279.4
Crashes
5 Year Rolling Avg.
0
5
10
15
20
Fata
litie
s
Pedestrian Fatalities
20062007
20082009
20102011
20122013
20142015
5YAAFatalities = 11.8
Fatalities
5 Year Rolling Avg.
5958

0
100
200
300
400
500
600
700
800Cr
ashe
sTruck Crashes (Units With Five Axles or More)
Spec
ial V
ehic
le C
lass
es
20062007
20082009
20102011
20122013
20142015
5YAACrashes = 524.8
Crashes
5 Year Rolling Avg.
0
2
4
6
8
10
12
14
16
Fata
litie
s
Trucking Fatalities (Units With Five Axles or More)
20062007
20082009
20102011
20122013
20142015
5YAAFatalities = 5.2
Fatalities
5 Year Rolling Avg.
6160

0
200
400
600
800
1000
1200
1400
1600
1800Cr
ashe
sCommercial Vehicle Crashes
This category includes large trucks and buses with a seating capacity of 15 or more(including the driver) that result in an injury.
20062007
20082009
20102011
20122013
20142015
5YAACrashes = 1,021.6
Crashes
5 Year Rolling Avg.
0
5
10
15
20
25
30
Fata
litie
s
Commercial Vehicle Fatalities
20062007
20082009
20102011
20122013
20142015
5YAAFatalities = 15.8
Fatalities
5 Year Rolling Avg.
6362

0
100
200
300
400
500
600
700
Cras
hes
Motorcycle Crashes
20062007
20082009
20102011
20122013
20142015
5YAACrashes = 587.6
Crashes
5 Year Rolling Avg.
0
5
10
15
20
25
30
35
Fata
litie
s
Motorcycle Fatalities
20062007
20082009
20102011
20122013
20142015
5YAAFatalities = 19
Fatalities
5 Year Rolling Avg.
6564
MotorcycleRegistrations2005 92,5192006 94,3312007 96,9982008 99,7832009 102,7632010 105,3922011 106,6332012 108,4772013 110,6992014 112,4282015 113,512

0
500
1000
1500
2000
2500
3000
3500
4000
4500
5000
Cras
hes
Deer and Moose CrashesLa
rge
Ani
mal
s (D
eer a
nd M
oose
)
5YAADeer Crashes = 3,656.4Moose Crashes = 365
Deer
Moose
Trend Line
Trend Line
20062007
20082009
20102011
20122013
20142015
0
1
2
3
4
5
6
Fata
litie
s
Deer and Moose Fatalities
Note: Of the �ve deer fatalities shown, all were collisions with motorcycles.
20062007
20082009
20102011
20122013
20142015
5YAADeer Fatalities = 1
Moose Fatalities = 0.8
Deer
Moose
5 Year Rolling Avg.
5 Year Rolling Avg.
6766

0
100
200
300
400
500
600
700
800
900
1000
0
1000
2000
3000
4000
5000
6000
7000
8000M
oose CrashesDee
r Cra
shes
Deer and Moose Crashes by Month (2006-2015)
January
February
March AprilMay
June
July
August
September
October
November
December
Deer
Moose
6968
Maine Deer and Moose Crashes by County (2006-2015)COUNTY DEER CRASHES MOOSE CRASHESAndroscoggin 1,807 55Aroostook 1,704 1,774Cumberland 4,724 138Franklin 1,121 460Hancock 2,569 83Kennebec 3,339 126Knox 893 22Lincoln 639 23Oxford 1,616 332Penobscot 4,566 626Piscataquis 833 176Sagadahoc 822 10Somerset 2,166 300Waldo 1,688 44Washington 1,374 234York 3,061 153
TOTAL 32,922 4,556

Deer Crashes by Light Conditions (2006-2015)
Dusk
Dark
Dawn
Daylight
66%
4%23%
7%
Moose Crashes by Light Conditions (2006-2015)
Dusk
Dark
Dawn
Daylight
13%7%
77%
3%
7170

themtsc.org
12.2016/500