list of content structural reliability and risk analysis ... mare wint sept.20131 structural...
TRANSCRIPT
T.Moan MARE WINT Sept.20131
Structural reliability and risk analysisof «offshore structures»By Torgeir Moan, CeSOS and Department of Marine Technology, NTNU
T.Moan MARE WINT Sept.20132
List of content Introduction - Facilities- Regulatory framework - Accident/failure experiences
- Safety ManagementStructural Reliability Analysis
- Introduction- Estimation of failure probability of components- Uncertainties in Load effect (S) and Resistance (R)- System reliability- Time variant Reliability- Summary of Reliability methods- Practical use of Structural Reliability Analysis- Guidelines for Reliability Analysis
Reliability-base-Calibration of codes for new applications - Relation between prob. Of failure and safert factors- Reliability based Calibration of safety factorsFatigue reliability- Background- Fatigue life models (based on SN- and Fracture Mechanics)- Reliability updating approaches
T.Moan MARE WINT Sept.20133
List of content - continuedFatigue reliability - continued- Inspection scheduling - Calibration of fatigue design criteria- Fatigue reliability of gear components
Quantitative risk assessment- Risk Analysis Framework- Internal and external hazards- ALS design check- Ship Collision risk- Accidental Actions on wind turbines
T.Moan MARE WINT Sept.20134Wind turbines vs other marine structures
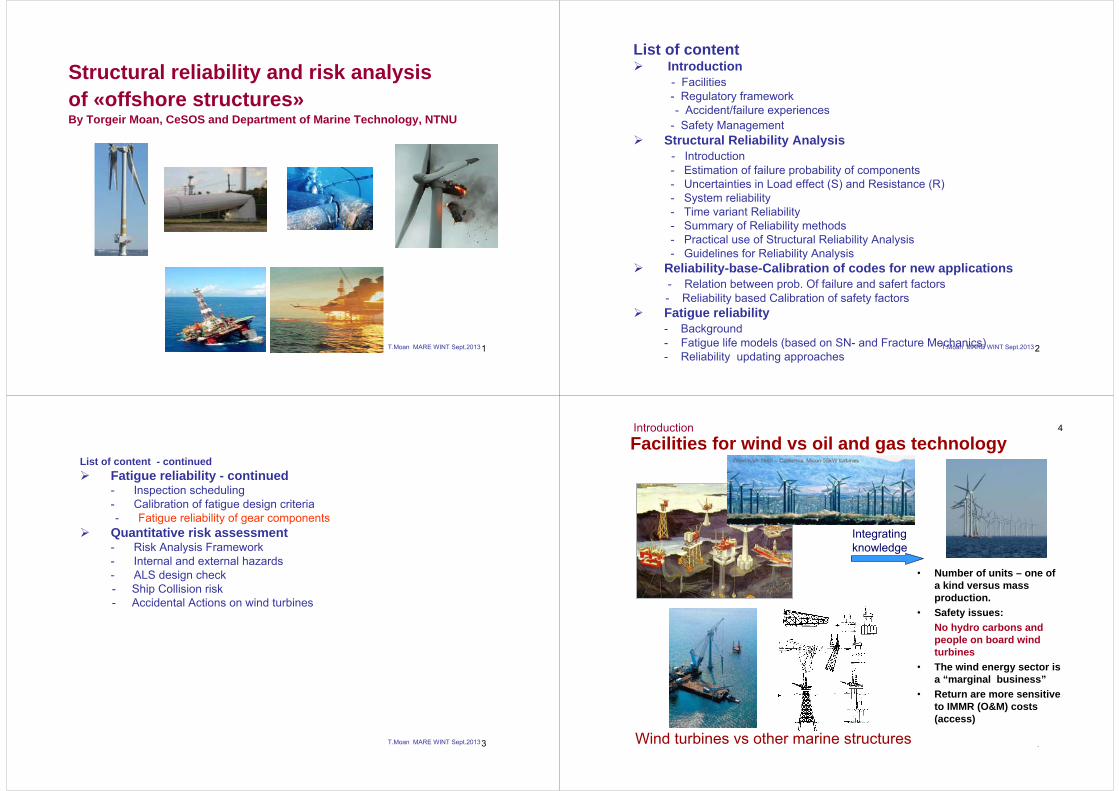
Facilities for wind vs oil and gas technology
• Number of units – one of a kind versus mass production.
• Safety issues:No hydro carbons and people on board wind turbines
• The wind energy sector is a “marginal business”
• Return are more sensitive to IMMR (O&M) costs (access)
Integratingknowledge
4Introduction
T.Moan MARE WINT Sept.20135
Regulatory framework - general
5
to avoid:• Fatalities or injury• Environmental damage• Property damage
Regulatory regime (depends on economy; accident potential):
Regulatory principles- Goal-setting viz. prescriptive- Probabilistic viz. deterministic- First principles viz.
purely experientialOverall stability Strength Escapeways/ lifeboats
Offshore oil and gas Wind turbines- National regulatory
bodies; - Industry: API, NORSOK, - Classification soc. - ISO/IMO
- National Regulatorybodies
- Classification societies ??- IEC
Introduction
T.Moan MARE WINT Sept.20136
Introduction
ExperiencesOil and gas platforms- significance of the oil and gas industry to the world econmy- need for technology development for deeper water, challengingnatural and industrial environment,…
- ageing facilitiesWind turbines
CeSOS NTNU
Gathering of experiences – development of procedures/methods/data
Failure - and accident dataSafety management procedure- safety criteria, (limit states) – including accidental limit state- risk and reliability analysis of design, inspection/monitoring
Methods (hydrodynamics, structural analysis)Data (strength data for tubular joints)
5
T.Moan MARE WINT Sept.20137
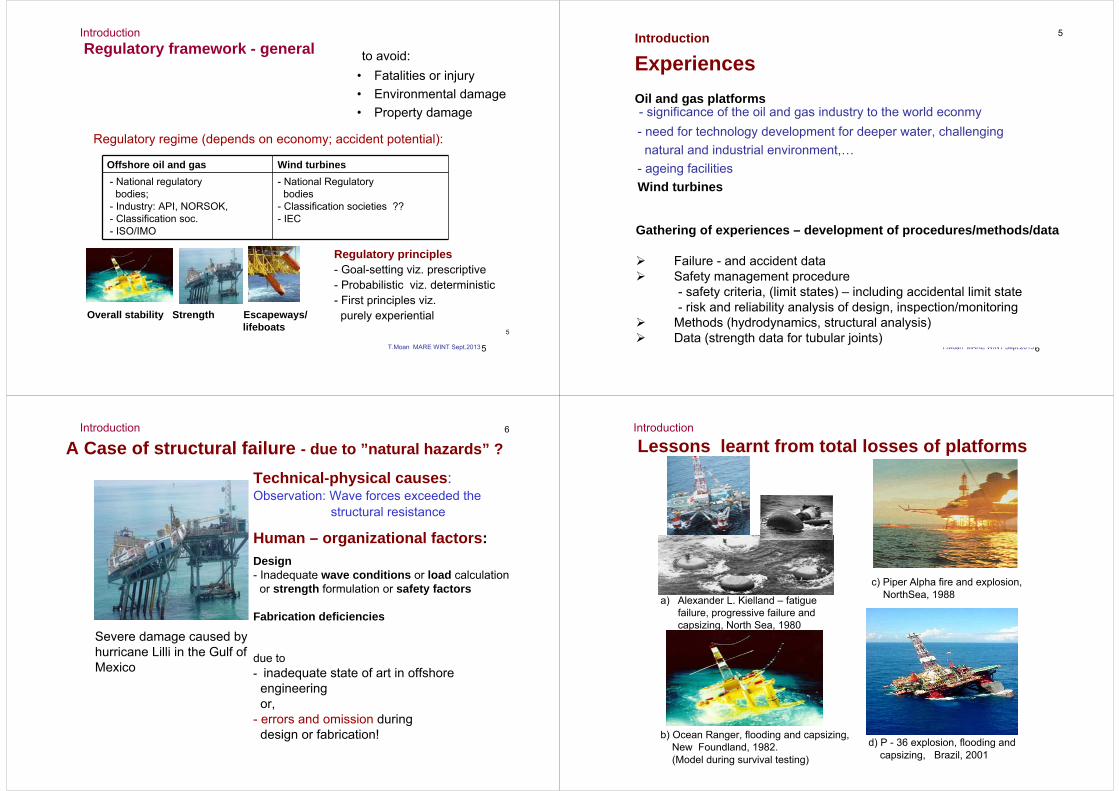
A Case of structural failure - due to ”natural hazards” ?
Severe damage caused by hurricane Lilli in the Gulf ofMexico
Technical-physical causes:Observation: Wave forces exceeded the
structural resistance
Human – organizational factors:Design- Inadequate wave conditions or load calculationor strength formulation or safety factors
Fabrication deficiencies
due to- inadequate state of art in offshoreengineeringor,
- errors and omission during design or fabrication!
CeSOS NTNU
6Introduction
T.Moan MARE WINT Sept.20138
a) Alexander L. Kielland – fatigue failure, progressive failure and capsizing, North Sea, 1980
c) Piper Alpha fire and explosion, NorthSea, 1988
b) Ocean Ranger, flooding and capsizing, New Foundland, 1982.(Model during survival testing)
d) P - 36 explosion, flooding and capsizing, Brazil, 2001
Lessons learnt from total losses of platformsIntroduction
T.Moan MARE WINT Sept.20139
0
2
4
6
8
10
12
14
16
18
20
Blow
out
Colis
ion/co
ntac
tDr
oppe
d ob
ject
Explo
sion
Fire
Grou
ndin
gSp
ill/re
lease
Stru
ctur
al da
mag
eCa
psize
/foun
derin
g/lis
t
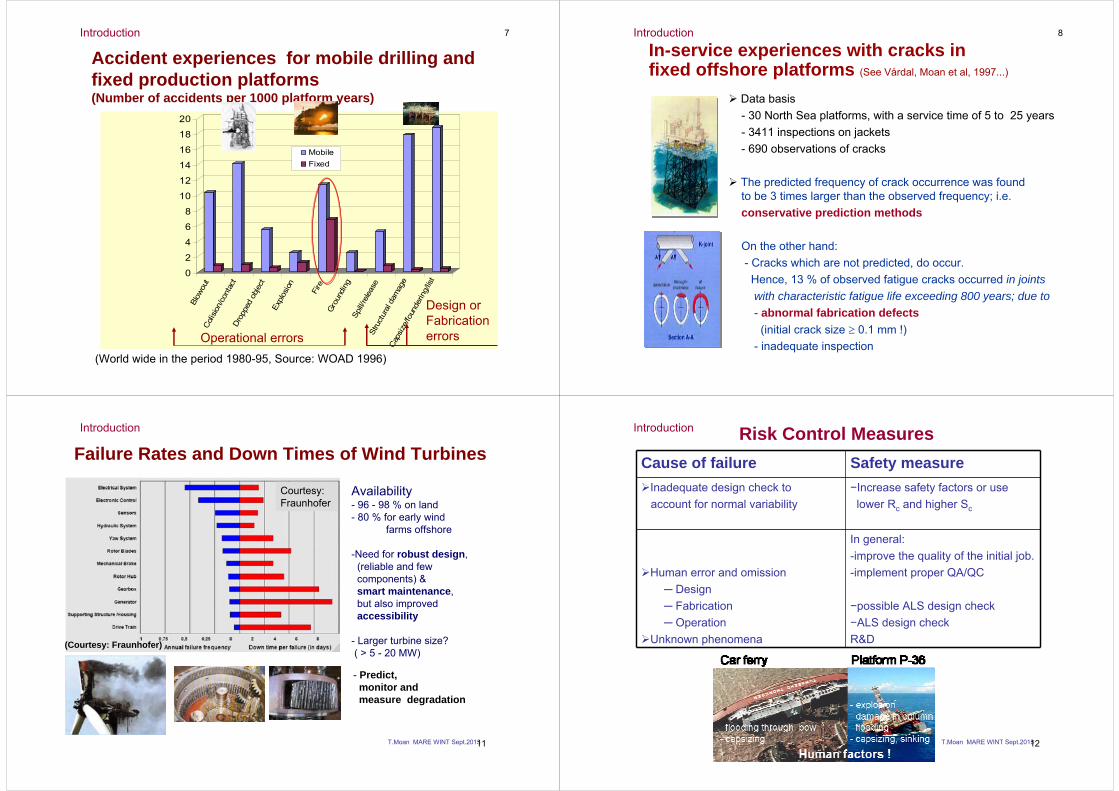
MobileFixed
(World wide in the period 1980-95, Source: WOAD 1996)
Accident experiences for mobile drilling and fixed production platforms(Number of accidents per 1000 platform years)
Operational errors
Design orFabricationerrors
CeSOS NTNU
7Introduction
T.Moan MARE WINT Sept.201310
In-service experiences with cracks in fixed offshore platforms (See Vårdal, Moan et al, 1997...)
Data basis- 30 North Sea platforms, with a service time of 5 to 25 years- 3411 inspections on jackets- 690 observations of cracks
The predicted frequency of crack occurrence was foundto be 3 times larger than the observed frequency; i.e.conservative prediction methods
On the other hand:- Cracks which are not predicted, do occur. Hence, 13 % of observed fatigue cracks occurred in jointswith characteristic fatigue life exceeding 800 years; due to - abnormal fabrication defects(initial crack size ≥ 0.1 mm !)
- inadequate inspectionCeSOS NTNU
8Introduction
T.Moan MARE WINT Sept.201311
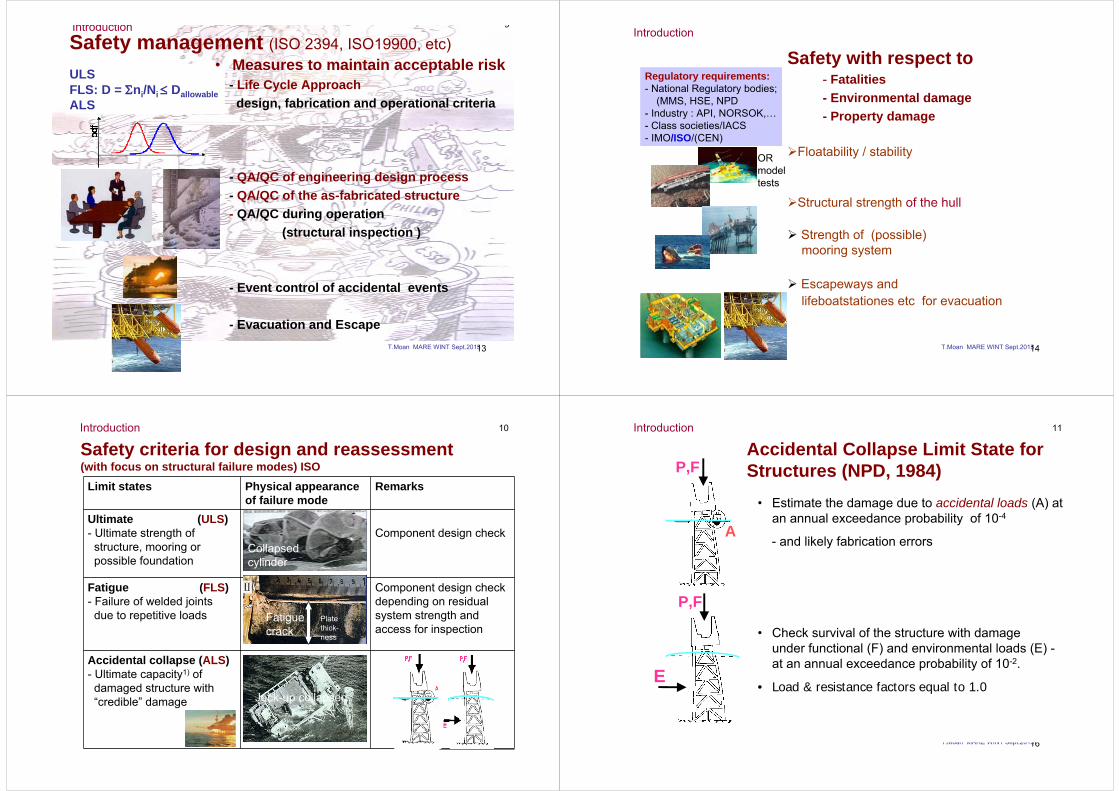
Failure Rates and Down Times of Wind Turbines
Availability- 96 - 98 % on land- 80 % for early wind
farms offshore
-Need for robust design,(reliable and fewcomponents) & smart maintenance, but also improvedaccessibility
- Larger turbine size? ( > 5 - 20 MW)
Courtesy: Fraunhofer
- Predict, monitor and measure degradation
(Courtesy: Fraunhofer)
Introduction
T.Moan MARE WINT Sept.201312
Risk Control MeasuresCause of failure Safety measure
Inadequate design check toaccount for normal variability
−Increase safety factors or uselower Rc and higher Sc
Human error and omission─ Design─ Fabrication─ Operation
Unknown phenomena
In general:-improve the quality of the initial job.-implement proper QA/QC
−possible ALS design check−ALS design checkR&D
Introduction
T.Moan MARE WINT Sept.201313
Safety management (ISO 2394, ISO19900, etc)
ULSFLS: D = Σni/Ni ≤ DallowableALS
• Measures to maintain acceptable risk- Life Cycle Approachdesign, fabrication and operational criteria
- QA/QC of engineering design process- QA/QC of the as-fabricated structure- QA/QC during operation
(structural inspection )
- Event control of accidental events
- Evacuation and Escape
CeSOS NTNU
9Introduction
T.Moan MARE WINT Sept.201314
Safety with respect to - Fatalities- Environmental damage- Property damage
Floatability / stability
Structural strength of the hull
Strength of (possible) mooring system
Escapeways and lifeboatstationes etc for evacuation
Regulatory requirements: - National Regulatory bodies;
(MMS, HSE, NPD- Industry : API, NORSOK,…- Class societies/IACS- IMO/ISO/(CEN)
OR modeltests
Introduction
T.Moan MARE WINT Sept.201315
Safety criteria for design and reassessment(with focus on structural failure modes) ISO
Limit states Physical appearance of failure mode
Remarks
Ultimate (ULS)- Ultimate strength of structure, mooring or possible foundation
Component design check
Fatigue (FLS)- Failure of welded jointsdue to repetitive loads
Component design check depending on residual system strength andaccess for inspection
Accidental collapse (ALS)- Ultimate capacity1) of damaged structure with “credible” damage
Plate thick-ness
Collapsedcylinder
Jack-up collapsed
Fatiguecrack
CeSOS NTNU
10Introduction
T.Moan MARE WINT Sept.201316
Accidental Collapse Limit State for Structures (NPD, 1984)
• Estimate the damage due to accidental loads (A) at an annual exceedance probability of 10-4
- and likely fabrication errors
• Check survival of the structure with damage under functional (F) and environmental loads (E) -at an annual exceedance probability of 10-2.
• Load & resistance factors equal to 1.0E
P,F
P,F
A
CeSOS NTNU
11Introduction
T.Moan MARE WINT Sept.201317
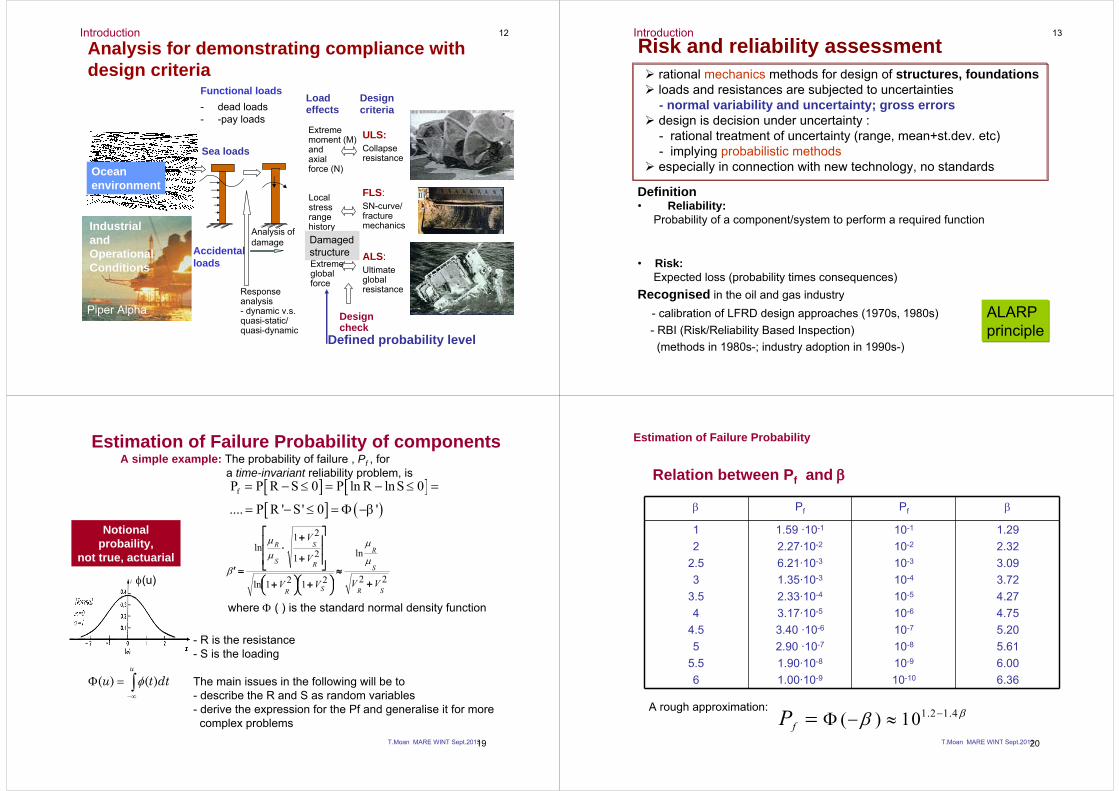
Ocean environment
Analysis for demonstrating compliance with design criteria
Functional loads- dead loads- -pay loads
Accidentalloads
Piper AlphaResponseanalysis- dynamic v.s.quasi-static/quasi-dynamic
Sea loads
Design criteria
Load effects
Collapseresistance
SN-curve/fracturemechanics
Ultimateglobalresistance
Extrememoment (M)andaxial force (N)
Localstressrangehistory
Extremeglobalforce
Designcheck
ULS:
FLS:
ALS:Damagedstructure
Analysis ofdamage
IndustrialandOperationalConditions
CeSOS NTNU
Defined probability level
12Introduction
T.Moan MARE WINT Sept.201318
Risk and reliability assessment
Definition• Reliability:
Probability of a component/system to perform a required function
• Risk: Expected loss (probability times consequences)
Recognised in the oil and gas industry- calibration of LFRD design approaches (1970s, 1980s)- RBI (Risk/Reliability Based Inspection)
(methods in 1980s-; industry adoption in 1990s-)
rational mechanics methods for design of structures, foundationsloads and resistances are subjected to uncertainties- normal variability and uncertainty; gross errorsdesign is decision under uncertainty :- rational treatment of uncertainty (range, mean+st.dev. etc)- implying probabilistic methodsespecially in connection with new technology, no standards
CeSOS NTNU
ALARPprinciple
13Introduction
T.Moan MARE WINT Sept.201319
Estimation of Failure Probability of componentsA simple example: The probability of failure , Pf , for
a time-invariant reliability problem, is
- R is the resistance - S is the loading
The main issues in the following will be to- describe the R and S as random variables- derive the expression for the Pf and generalise it for more complex problems
Notionalprobaility,
not true, actuarial
[ ] [ ][ ] ( )
fP P R S 0 P ln R ln S 0
.... P R ' S' 0 '
= − ≤ = − ≤ =
= − ≤ = Φ −β
22
ln
2121ln
21
21ln
SR
S
R
SR
R
S
S
R
VVVV
V
V
+≈
⎟⎠⎞⎜
⎝⎛ +⎟
⎠⎞⎜
⎝⎛ +
⎥⎥⎥
⎦
⎤
⎢⎢⎢
⎣
⎡
+
+⋅
=′μ
μμμ
β
where Φ ( ) is the standard normal density function
φ(u)
( ) ( )u
u t dtφ−∞
Φ = ∫
T.Moan MARE WINT Sept.201320
β Pf Pf β
12
2.53
3.54
4.55
5.56
1.59 ·10-1
2.27·10-2
6.21·10-3
1.35·10-3
2.33·10-4
3.17·10-5
3.40 ·10-6
2.90 ·10-7
1.90·10-8
1.00·10-9
10-1
10-2
10-3
10-4
10-5
10-6
10-7
10-8
10-9
10-10
1.292.323.093.724.274.755.205.616.006.36
Relation between Pf and β
1.2 1.4( ) 10 ββ −Φ − ≈=fPA rough approximation:
Estimation of Failure Probability
T.Moan MARE WINT Sept.201321
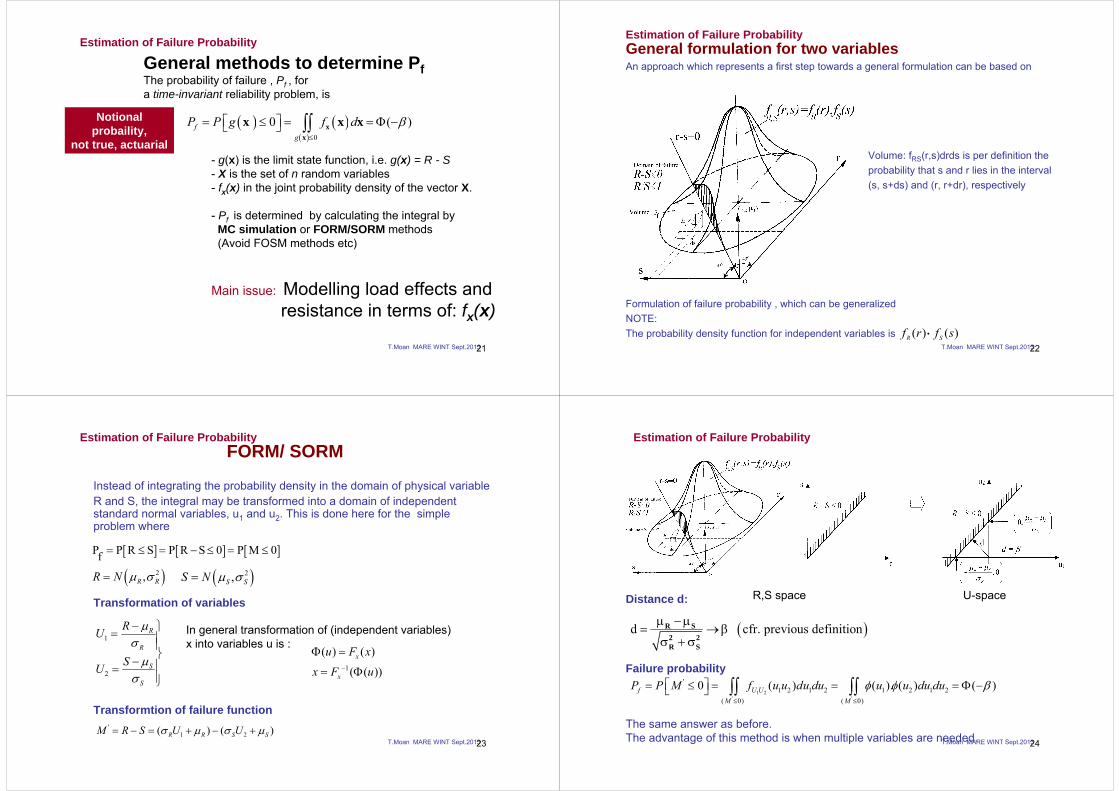
General methods to determine Pf The probability of failure , Pf , for a time-invariant reliability problem, is
( ) ( )( ) 0
0 ( )≤
⎡ ⎤= ≤ = = Φ −⎣ ⎦ ∫∫fg
P P g f d βxx
x x x
- g(x) is the limit state function, i.e. g(x) = R - S - X is the set of n random variables - fx(x) in the joint probability density of the vector X.
- Pf is determined by calculating the integral byMC simulation or FORM/SORM methods (Avoid FOSM methods etc)
Main issue: Modelling load effects andresistance in terms of: fx(x)
Notionalprobaility,
not true, actuarial
Estimation of Failure Probability
T.Moan MARE WINT Sept.201322
General formulation for two variablesAn approach which represents a first step towards a general formulation can be based on
Volume: fRS(r,s)drds is per definition the probability that s and r lies in the interval(s, s+ds) and (r, r+dr), respectively
Formulation of failure probability , which can be generalizedNOTE: The probability density function for independent variables is )()( sfrf SR ⋅
Estimation of Failure Probability
T.Moan MARE WINT Sept.201323
FORM/ SORM
Instead of integrating the probability density in the domain of physical variable R and S, the integral may be transformed into a domain of independent standard normal variables, u1 and u2. This is done here for the simple problem where
Transformation of variables
Transformtion of failure function
1
2
R
R
S
S
RU
SU
μσ
μσ
− ⎫= ⎪⎪⎬− ⎪=⎪⎭
[ ] [ ] [ ]P P R S P R S 0 P M 0 f = ≤ = − ≤ = ≤
( )2,R RR N μ σ= ( )2,S SS N μ σ=
'1 2( ) ( )R R S SM R S U Uσ μ σ μ= − = + − +
1
( ) ( )
( ( ))−
Φ =
= Φx
x
u F xx F u
In general transformation of (independent variables) x into variables u is :
Estimation of Failure Probability
T.Moan MARE WINT Sept.201324
( )d cfr. previous definitionμ − μ= → β
σ + σR S
2 2R S
1 2' '
'1 2 1 2 1 2 1 2
( 0) ( 0)
0 ( ) ( ). ( ) ( )f U UM M
P P M f u u du du u u du duφ φ β≤ ≤
⎡ ⎤= ≤ = = = Φ −⎣ ⎦ ∫∫ ∫∫
Distance d:
Failure probability
The same answer as before.The advantage of this method is when multiple variables are needed.
R,S space U-space
Estimation of Failure Probability
T.Moan MARE WINT Sept.201325
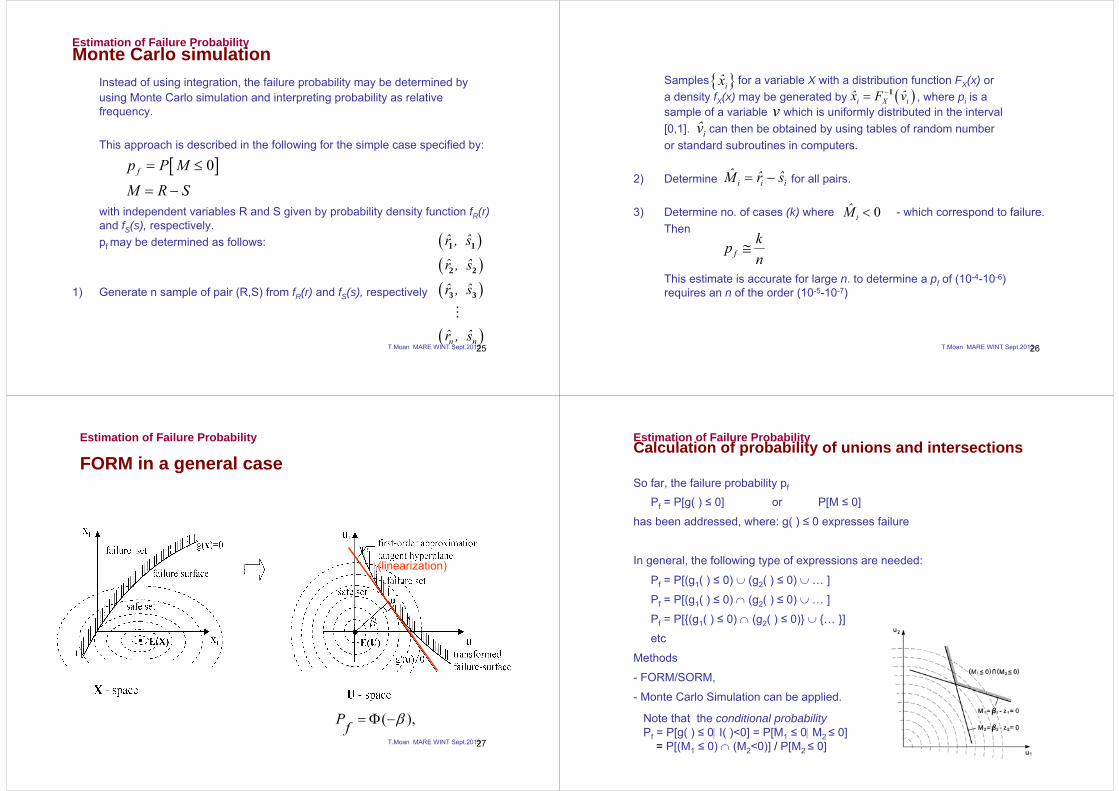
Monte Carlo simulationInstead of using integration, the failure probability may be determined by using Monte Carlo simulation and interpreting probability as relative frequency.
This approach is described in the following for the simple case specified by:
with independent variables R and S given by probability density function fR(r)and fS(s), respectively.pf may be determined as follows:
1) Generate n sample of pair (R,S) from fR(r) and fS(s), respectively
[ ]0= ≤
= −fp P M
M R S
( )( )( )
( )
1 1
2 2
3 3
n n
ˆ ˆr , sˆ ˆr , sˆ ˆr , s
ˆ ˆr , s
Estimation of Failure Probability
T.Moan MARE WINT Sept.201326
Samples for a variable X with a distribution function FX(x) ora density fX(x) may be generated by , where pi is asample of a variable which is uniformly distributed in the interval[0,1]. can then be obtained by using tables of random number or standard subroutines in computers.
2) Determine for all pairs.
3) Determine no. of cases (k) where - which correspond to failure.Then
This estimate is accurate for large n. to determine a pf of (10-4-10-6) requires an n of the order (10-5-10-7)
{ }ix̂( )1−=i X iˆ ˆx F v
iv̂
= −i i iˆ ˆ ˆM r s
0<iM̂
fkpn
≅
v
T.Moan MARE WINT Sept.201327
FORM in a general case
(linearization)
( ),= Φ −Pf β
Estimation of Failure Probability
T.Moan MARE WINT Sept.201328
Calculation of probability of unions and intersections
So far, the failure probability pf
Pf = P[g( ) ≤ 0] or P[M ≤ 0]
has been addressed, where: g( ) ≤ 0 expresses failure
In general, the following type of expressions are needed:
Pf = P[(g1( ) ≤ 0) ∪ (g2( ) ≤ 0) ∪ … ]
Pf = P[(g1( ) ≤ 0) ∩ (g2( ) ≤ 0) ∪ … ]
Pf = P[{(g1( ) ≤ 0) ∩ (g2( ) ≤ 0)} ∪ {… }]
etc
Methods
- FORM/SORM,
- Monte Carlo Simulation can be applied.
Note that the conditional probabilityPf = P[g( ) ≤ 0| I( )<0] = P[M1 ≤ 0| M2 ≤ 0]
= P[(M1 ≤ 0) ∩ (M2<0)] / P[M2 ≤ 0]
Estimation of Failure Probability
T.Moan MARE WINT Sept.201329
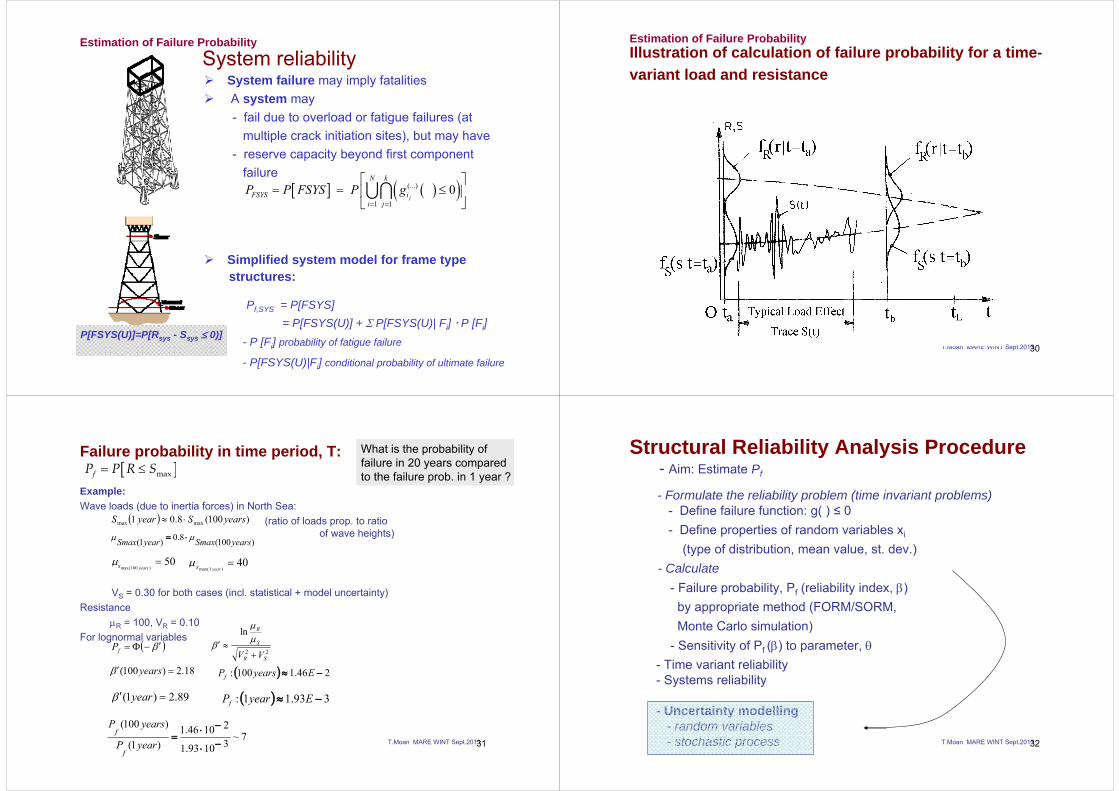
System reliabilitySystem failure may imply fatalitiesA system may - fail due to overload or fatigue failures (at
multiple crack initiation sites), but may have - reserve capacity beyond first component
failure
Simplified system model for frame type structures:
Pf,SYS = P[FSYS] = P[FSYS(U)] + Σ P[FSYS(U)| Fi] P [Fi]
- P [Fi] probability of fatigue failure
- P[FSYS(U)|Fi] conditional probability of ultimate failure
[ ] ( )( )(...)
1 1
0= =
⎡ ⎤= = ≤⎢ ⎥
⎣ ⎦∪∩ j
N k
FSYS ii j
P P FSYS P g
P[FSYS(U)]=P[Rsys - Ssys ≤ 0)]
Estimation of Failure Probability
T.Moan MARE WINT Sept.201330
Illustration of calculation of failure probability for a time-variant load and resistance
Estimation of Failure Probability
T.Moan MARE WINT Sept.201331
Failure probability in time period, T:
Example:Wave loads (due to inertia forces) in North Sea:
(ratio of loads prop. to ratio of wave heights)
VS = 0.30 for both cases (incl. statistical + model uncertainty)Resistance
μR = 100, VR = 0.10 For lognormal variables
[ ]= ≤ maxfP P R S
( ) )100(8.01 maxmax yearsSyear S ⋅≈
)100(8.0)1( yearsSmaxyearSmax μμ ⋅=
μs yearsmax( )10050= 40
)1max(=
yearsμ
( )β ′−Φ=fP ln
22SR
S
R
VV +≈′ μ
μ
β
18.2)100( =′ yearsβ ( ) 246.1100: −≈ EyearsPf
89.2)1( =′ yearβ ( ) 393.11: −≈ EyearPf
7~31093.1
21046.1)1(
)100(
−⋅
−⋅=
yearP
yearsP
f
f
What is the probability offailure in 20 years comparedto the failure prob. in 1 year ?
T.Moan MARE WINT Sept.201332
Structural Reliability Analysis Procedure- Aim: Estimate Pf
- Formulate the reliability problem (time invariant problems) - Define failure function: g( ) ≤ 0- Define properties of random variables xi
(type of distribution, mean value, st. dev.)- Calculate
- Failure probability, Pf (reliability index, β) by appropriate method (FORM/SORM, Monte Carlo simulation)
- Sensitivity of Pf (β) to parameter, θ- Time variant reliability- Systems reliability
- Uncertainty modelling- random variables- stochastic process
T.Moan MARE WINT Sept.201333
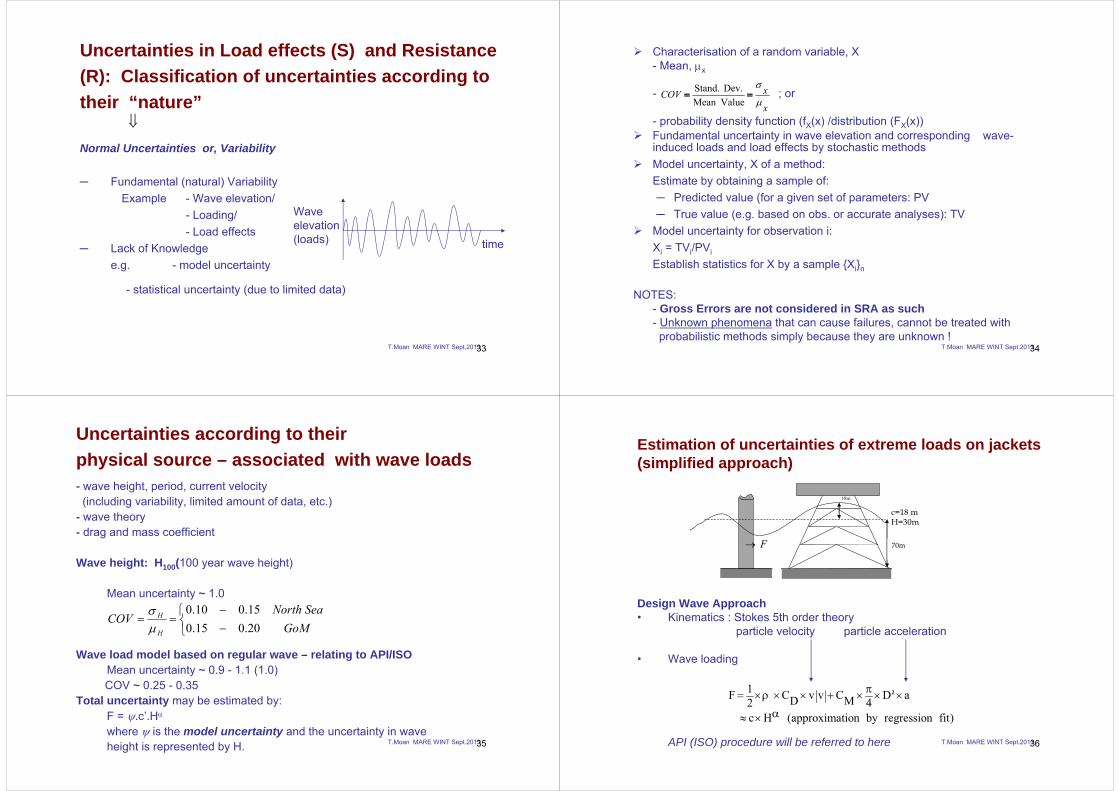
Uncertainties in Load effects (S) and Resistance(R): Classification of uncertainties according to their “nature”
Normal Uncertainties or, Variability
─ Fundamental (natural) VariabilityExample - Wave elevation/
- Loading/- Load effects
─ Lack of Knowledge e.g. - model uncertainty
- statistical uncertainty (due to limited data)
⇓
Wave elevation (loads) time
T.Moan MARE WINT Sept.201334
Characterisation of a random variable, X- Mean, μx
- ; or
- probability density function (fX(x) /distribution (FX(x))Fundamental uncertainty in wave elevation and corresponding wave-induced loads and load effects by stochastic methods Model uncertainty, X of a method:Estimate by obtaining a sample of:─ Predicted value (for a given set of parameters: PV─ True value (e.g. based on obs. or accurate analyses): TV
Model uncertainty for observation i: Xi = TVi/PVi
Establish statistics for X by a sample {Xi}n
NOTES:- Gross Errors are not considered in SRA as such- Unknown phenomena that can cause failures, cannot be treated withprobabilistic methods simply because they are unknown !
x
xCOVμ
σ==
ValueMean Dev. Stand.
T.Moan MARE WINT Sept.201335
Uncertainties according to theirphysical source – associated with wave loads- wave height, period, current velocity (including variability, limited amount of data, etc.)
- wave theory- drag and mass coefficient
Wave height: H100(100 year wave height)
Mean uncertainty ~ 1.0
Wave load model based on regular wave – relating to API/ISOMean uncertainty ~ 0.9 - 1.1 (1.0)COV ~ 0.25 - 0.35
Total uncertainty may be estimated by:F = ψ.c’.Hα
where ψ is the model uncertainty and the uncertainty in waveheight is represented by H.
⎩⎨⎧
−−
==GoM
SeaNorthCOV
H
H
20.015.015.010.0
μσ
T.Moan MARE WINT Sept.201336
Estimation of uncertainties of extreme loads on jackets (simplified approach)
Design Wave Approach• Kinematics : Stokes 5th order theory
particle velocity particle acceleration
• Wave loading
API (ISO) procedure will be referred to here
18m
→ F
c=18 m H=30m
70m
1F C v v C D aD M2 4 c H (approximation by regression fit)
π= ×ρ × × + × × ×
α≈ ×
2
T.Moan MARE WINT Sept.201337
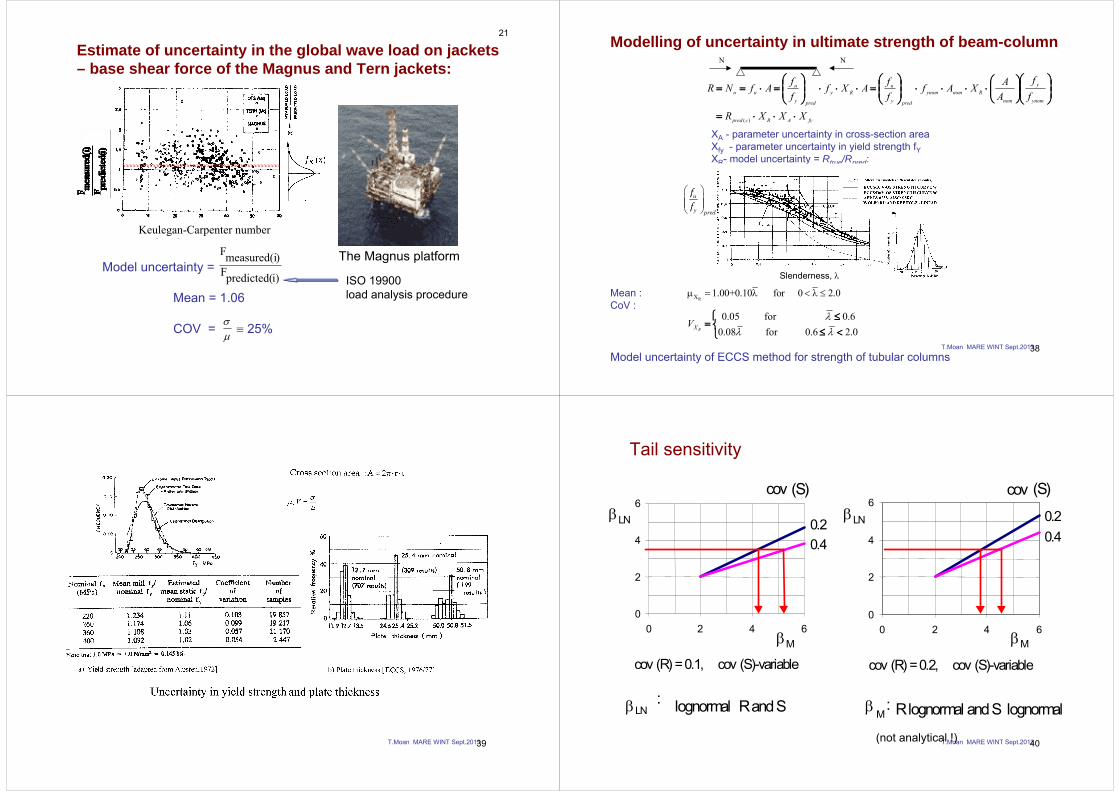
Estimate of uncertainty in the global wave load on jackets – base shear force of the Magnus and Tern jackets:
i)predicted(F)measured(iF
μσ
Model uncertainty =
Mean = 1.06
COV = ≡ 25%
The Magnus platform
CeSOS NTNU
Keulegan-Carpenter number
ISO 19900load analysis procedure
21
T.Moan MARE WINT Sept.201338
Modelling of uncertainty in ultimate strength of beam-column
XA - parameter uncertainty in cross-section area Xfy - parameter uncertainty in yield strength fYXR- model uncertainty = Rtrue/Rpred:
Mean : CoV :
Model uncertainty of ECCS method for strength of tubular columns
N N
fyARcpred
ynom
y
nomRnomynom
predy
uRy
predy
uuu
XXXR
ff
AAXAf
ffAXf
ffAfNR
⋅⋅⋅=
⎟⎟⎠
⎞⎜⎜⎝
⎛⎟⎟⎠
⎞⎜⎜⎝
⎛⋅⋅⋅⋅⎟
⎟⎠
⎞⎜⎜⎝
⎛=⋅⋅⋅⎟
⎟⎠
⎞⎜⎜⎝
⎛=⋅==
)(
RX 1.00+0.10 for 0 2.0μ = λ < λ ≤
⎩⎨⎧
<≤≤
=0.26.0 for 08.0
6.0 for05.0λλλ
RXV
Slenderness, λ
u
y pred
ff
⎛ ⎞⎜ ⎟⎜ ⎟⎝ ⎠
T.Moan MARE WINT Sept.201339 T.Moan MARE WINT Sept.201340
0
2
4
6
0 2 4 60
2
4
6
0 2 4 6
β LN
β M
β LN
β M
cov (S) cov (S)
0.2 0.4
0.2 0.4
cov (R) = 0.1, cov (S)-variable cov (R) = 0.2, cov (S)-variable
β LN : lognormal R and S β M : R lognormal and S lognormal
Tail sensitivity
(not analytical !)
T.Moan MARE WINT Sept.201341
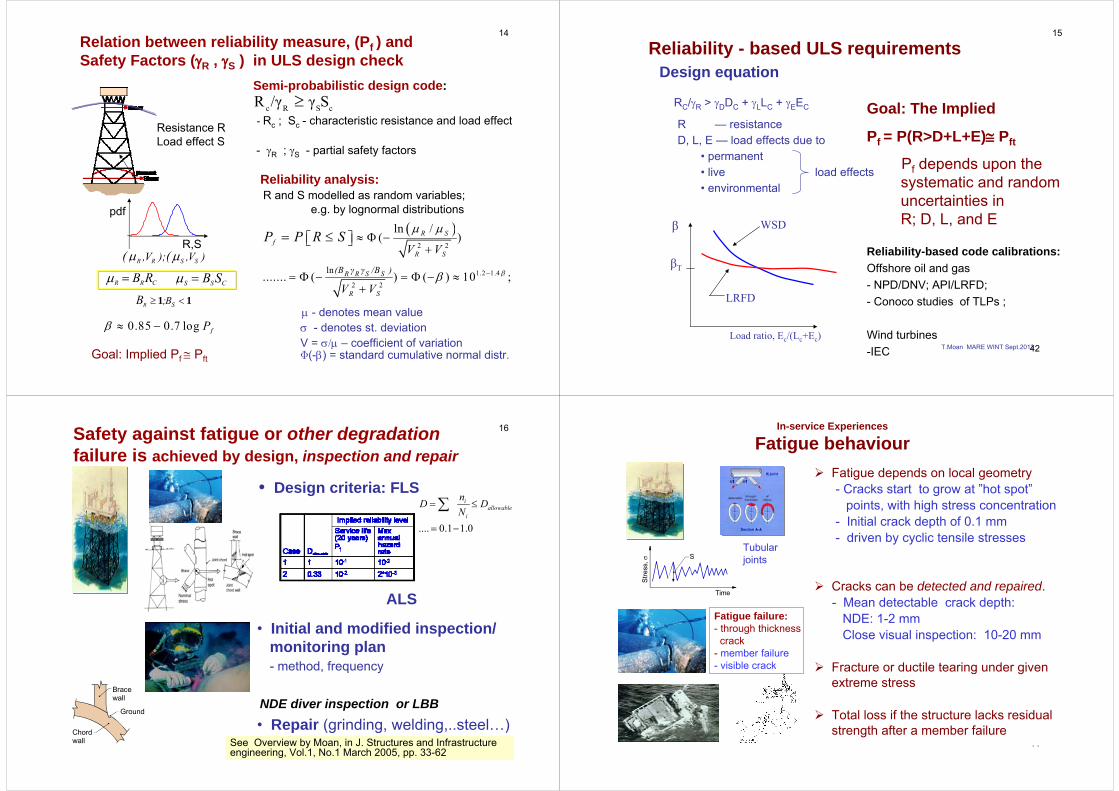
Relation between reliability measure, (Pf ) and Safety Factors (γR , γS ) in ULS design check
( )2 2
1.2 1.4
2 2
ln
ln /( )
....... ( ) ( ) 10 ;β
μ μ
β −
≈ Φ −⎡ ⎤⎣ ⎦+
= Φ − = Φ − ≈+
= ≤ R Sf
R S
R R S S
R S
(B γ γ /B )
V V
V V
P P R S
Resistance R Load effect S
- Rc ; Sc - characteristic resistance and load effect
- γR ; γS - partial safety factors
Reliability analysis:R and S modelled as random variables;
e.g. by lognormal distributions
Semi-probabilistic design code:c R S cR /γ γ S≥
Goal: Implied Pf ≅ Pft
R,S
μ - denotes mean valueσ - denotes st. deviationV = σ/μ – coefficient of variationΦ(-β) = standard cumulative normal distr.
R R CB Rμ = S S CB Sμ =
μ μR R S S,V ); ,V )( (
≥ <R S;BB 1 1
14
0.85 0.7 logβ ≈ − fPT.Moan MARE WINT Sept.201342
Reliability - based ULS requirements
R — resistanceD, L, E — load effects due to
• permanent• live load effects• environmental
Reliability-based code calibrations:Offshore oil and gas- NPD/DNV; API/LRFD;- Conoco studies of TLPs ;
Wind turbines-IEC
RC/γR > γDDC + γLLC + γEEC Goal: The Implied
Pf = P(R>D+L+E)≅ Pft
Pf depends upon thesystematic and randomuncertainties in R; D, L, and E
Design equation
CeSOS NTNU
β
βT
WSD
LRFD
Load ratio, Ec/(Lc+Ec)
15
T.Moan MARE WINT Sept.201343
• Initial and modified inspection/monitoring plan- method, frequency
Safety against fatigue or other degradationfailure is achieved by design, inspection and repair
• Design criteria: FLS
ALS
.... 0.1 1.0
= ≤
= −
∑ iallowable
i
nD DN
Bracewall
Ground
Chordwall
CeSOS NTNU
NDE diver inspection or LBB• Repair (grinding, welding,..steel…)
16
See Overview by Moan, in J. Structures and Infrastructure engineering, Vol.1, No.1 March 2005, pp. 33-62
T.Moan MARE WINT Sept.201344
In-service Experiences
Fatigue behaviourFatigue depends on local geometry- Cracks start to grow at ”hot spot”
points, with high stress concentration- Initial crack depth of 0.1 mm - driven by cyclic tensile stresses
Cracks can be detected and repaired.- Mean detectable crack depth:
NDE: 1-2 mm Close visual inspection: 10-20 mm
Fracture or ductile tearing under given extreme stress
Total loss if the structure lacks residualstrength after a member failure
Tubularjoints
Time
Stre
ss, σ
S
Fatigue failure:- through thickness
crack- member failure- visible crack
T.Moan MARE WINT Sept.201345
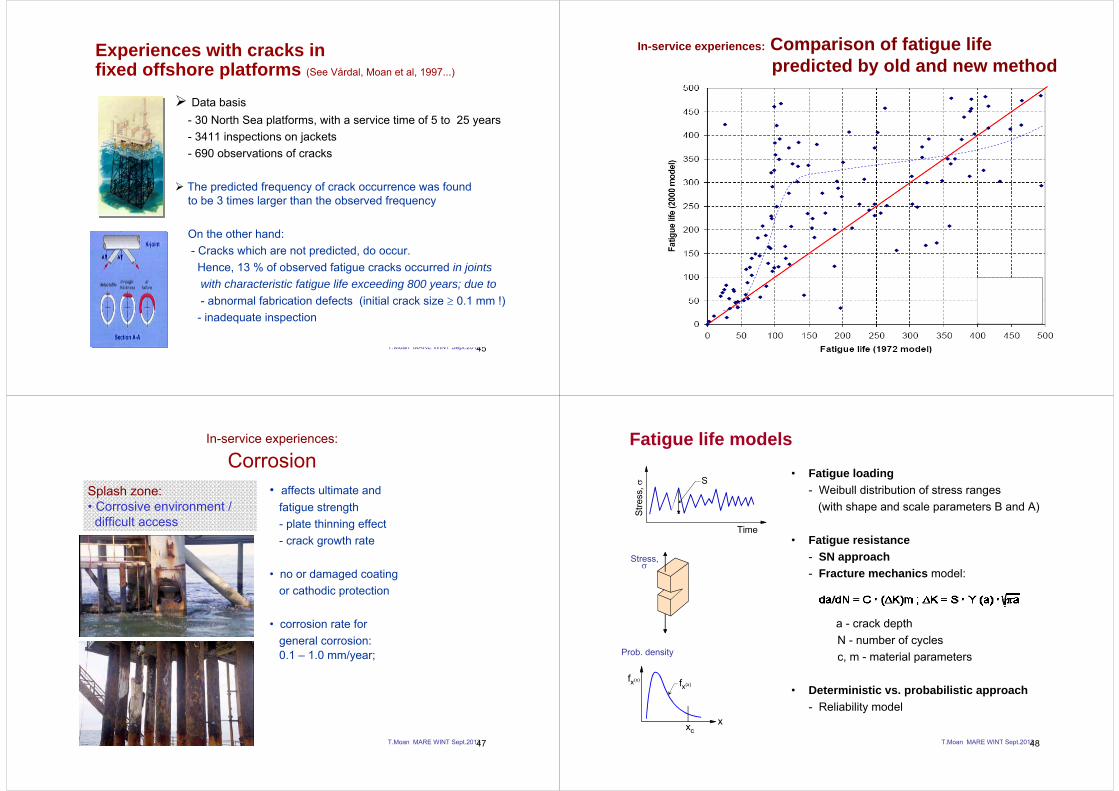
Experiences with cracks in fixed offshore platforms (See Vårdal, Moan et al, 1997...)
Data basis- 30 North Sea platforms, with a service time of 5 to 25 years- 3411 inspections on jackets- 690 observations of cracks
The predicted frequency of crack occurrence was foundto be 3 times larger than the observed frequency
On the other hand:- Cracks which are not predicted, do occur. Hence, 13 % of observed fatigue cracks occurred in jointswith characteristic fatigue life exceeding 800 years; due to - abnormal fabrication defects (initial crack size ≥ 0.1 mm !)
- inadequate inspection
T.Moan MARE WINT Sept.201346
In-service experiences: Comparison of fatigue lifepredicted by old and new method
T.Moan MARE WINT Sept.201347
In-service experiences:
Corrosion• affects ultimate and
fatigue strength- plate thinning effect- crack growth rate
• no or damaged coatingor cathodic protection
• corrosion rate for general corrosion:0.1 – 1.0 mm/year;
Splash zone:• Corrosive environment / difficult access
T.Moan MARE WINT Sept.201348
• Fatigue loading- Weibull distribution of stress ranges
(with shape and scale parameters B and A)
• Fatigue resistance- SN approach- Fracture mechanics model:
a - crack depthN - number of cyclesc, m - material parameters
• Deterministic vs. probabilistic approach- Reliability model
Time
Stre
ss, σ
S
Stress,σ
fx(x)fx(x)
xcx
Prob. density
Fatigue life models
T.Moan MARE WINT Sept.201349
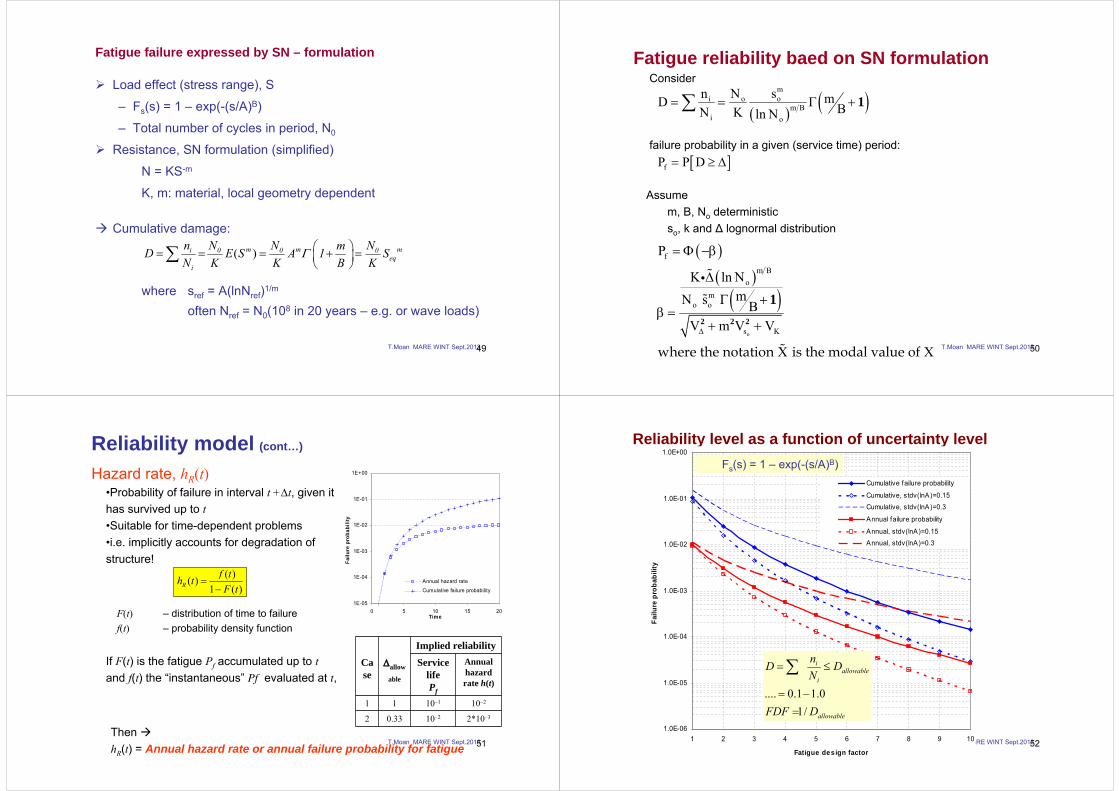
Fatigue failure expressed by SN – formulation
Load effect (stress range), S
– Fs(s) = 1 – exp(-(s/A)B)
– Total number of cycles in period, N0
Resistance, SN formulation (simplified)
N = KS-m
K, m: material, local geometry dependent
Cumulative damage:
where sref = A(lnNref)1/m
often Nref = N0(108 in 20 years – e.g. or wave loads)
( ) Γ ⎛ ⎞= = = + =⎜ ⎟⎝ ⎠
∑ m m mi 0 0 0eq
i
n N N NmD E S A 1 SN K K B K
T.Moan MARE WINT Sept.201350
Fatigue reliability baed on SN formulationConsider
failure probability in a given (service time) period:
Assumem, B, No deterministicso, k and Δ lognormal distribution
( ) ( )m
i o om B
i o
n N s mD BN K ln N= = Γ +∑ 1
[ ]fP P D= ≥ Δ
( )( )
( )o
f
m Bo
mo o
s K
P
K ln NmN s B
V m V V
X X
where the notation is the modal value of Δ
= Φ −β
Δ
Γ +β =
+ +
i
2 2 2
1
T.Moan MARE WINT Sept.201351
1E-05
1E-04
1E-03
1E-02
1E-01
1E+00
0 5 10 15 20Time
Failu
re p
roba
bilit
y
Cumulative failure probability
•Probability of failure in interval t +Δt, given it has survived up to t•Suitable for time-dependent problems•i.e. implicitly accounts for degradation of structure!
Reliability model (cont…)
Hazard rate, hR(t)
Implied reliabilityCase
Δallow
able
Service lifePf
Annualhazardrate h(t)
1 1 10–1 10–2
2 0.33 10–2 2*10–3
1E-05
1E-04
1E-03
1E-02
1E-01
1E+00
0 5 10 15 20Time
Failu
re p
roba
bilit
y
Annual hazard rate
Cumulative failure probability
( )( )1 ( )R
f th tF t
=−
F(t) – distribution of time to failuref(t) – probability density function
If F(t) is the fatigue Pf accumulated up to tand f(t) the “instantaneous” Pf evaluated at t,
Then hR(t) = Annual hazard rate or annual failure probability for fatigue
T.Moan MARE WINT Sept.201352
Reliability level as a function of uncertainty level
1.0E-06
1.0E-05
1.0E-04
1.0E-03
1.0E-02
1.0E-01
1.0E+00
1 2 3 4 5 6 7 8 9 10
Fatigue design factor
Failu
re p
roba
bilit
y
Cumulative failure probability
Cumulative, stdv(lnA)=0.15Cumulative, stdv(lnA)=0.3
Annual failure probability
Annual, stdv(lnA)=0.15Annual, stdv(lnA)=0.3
Fs(s) = 1 – exp(-(s/A)B)
.... 0.1 1.01/
= ≤
= −=
∑ iallowable
i
allowable
nD DN
FDF D
T.Moan MARE WINT Sept.201353
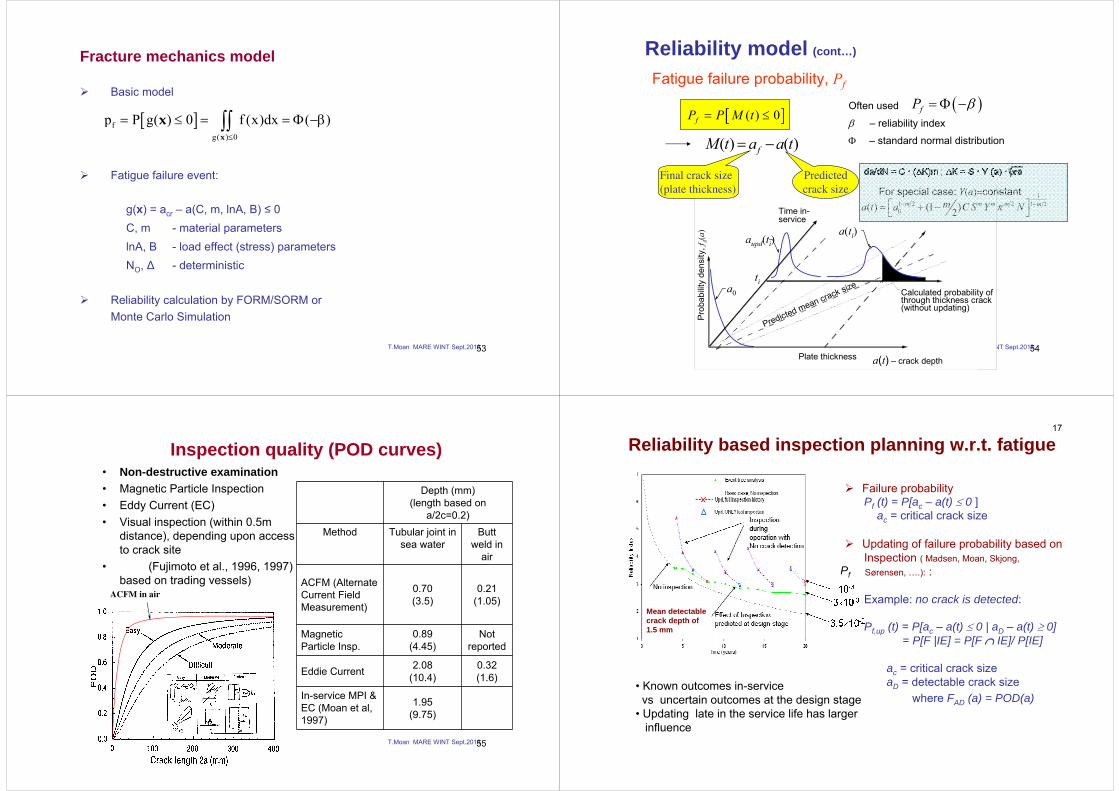
Fracture mechanics model
Basic model
Fatigue failure event:
g(x) = acr – a(C, m, lnA, B) ≤ 0C, m - material parameterslnA, B - load effect (stress) parametersNO, Δ - deterministic
Reliability calculation by FORM/SORM or Monte Carlo Simulation
[ ]fg( ) 0
p P g( ) 0 f (x)dx ( )≤
= ≤ = = Φ −β∫∫x
x
T.Moan MARE WINT Sept.201354
Reliability model (cont…)
Prob
abili
ty d
ensi
ty, f
A(a)
Plate thickness a(t) – crack depth
Time in-service
Calculated probability ofthrough thickness crack(without updating)
aupd(ti)
a0
ti
a(ti)
Predicted mean crack size
Prob
abili
ty d
ensi
ty, f
A(a)
Plate thickness a(t) – crack depth
Time in-service
Calculated probability ofthrough thickness crack(without updating)
aupd(ti)
a0
ti
a(ti)
Predicted mean crack size
[ ]( ) 0fP P M t= ≤
Fatigue failure probability, Pf
( ) ( )fM t a a t= −
Often used
β – reliability index
Φ – standard normal distribution
( )fP β= Φ −
Predicted crack size
Final crack size (plate thickness)
11 2 2 1 20( ) (1 )2
m m m m mma t a C S Y Nπ− −⎡ ⎤= + −⎣ ⎦
For special case: Y(a)=constant
T.Moan MARE WINT Sept.201355
Inspection quality (POD curves)• Non-destructive examination• Magnetic Particle Inspection• Eddy Current (EC)• Visual inspection (within 0.5m
distance), depending upon accessto crack site
• (Fujimoto et al., 1996, 1997) based on trading vessels)
ACFM in air
Depth (mm)(length based on
a/2c=0.2)Method Tubular joint in
sea waterButt
weld in air
ACFM (Alternate Current Field Measurement)
0.70(3.5)
0.21(1.05)
Magnetic Particle Insp.
0.89(4.45)
Not reported
Eddie Current 2.08(10.4)
0.32(1.6)
In-service MPI & EC (Moan et al, 1997)
1.95(9.75)
T.Moan MARE WINT Sept.201356
Failure probabilityPf (t) = P[ac – a(t) ≤ 0 ]
ac = critical crack size
Updating of failure probability based onInspection ( Madsen, Moan, Skjong,Sørensen, ….): :
Example: no crack is detected:
Pf,up (t) = P[ac – a(t) ≤ 0 | aD – a(t) ≥ 0]= P[F |IE] = P[F ∩ IE]/ P[IE]
ac = critical crack sizeaD = detectable crack size
where FAD (a) = POD(a)• Known outcomes in-service vs uncertain outcomes at the design stage
• Updating late in the service life has largerinfluence
Reliability based inspection planning w.r.t. fatigue
Mean detectable crack depth of1.5 mm
Pf
CeSOS NTNU
17
T.Moan MARE WINT Sept.201357
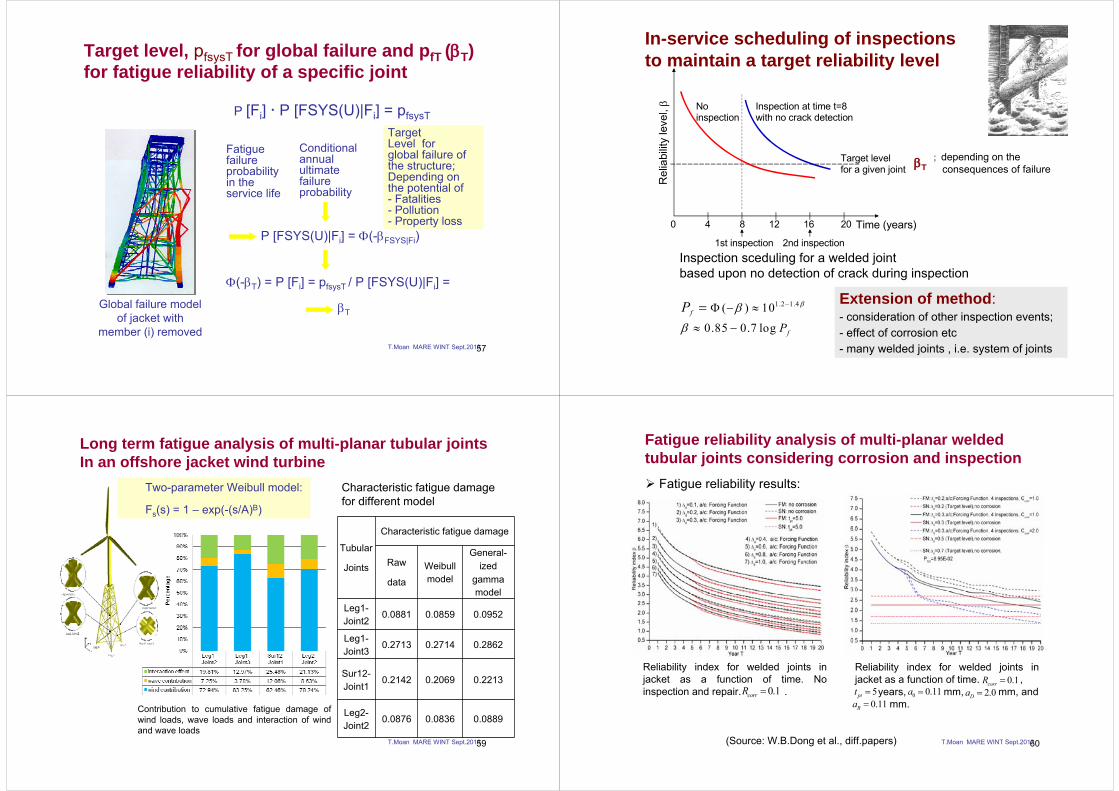
Target level, pfsysT for global failure and pfT (βT) for fatigue reliability of a specific joint
P [Fi] P [FSYS(U)|Fi] = pfsysT
Fatiguefailureprobabilityin theservice life
Conditional annual ultimate failure probability
TargetLevel for global failure of the structure;Depending on the potential of- Fatalities- Pollution- Property loss
P [FSYS(U)|Fi] = Φ(-βFSYS|Fi)
Φ(-βT) = P [Fi] = pfsysT / P [FSYS(U)|Fi] =
βTGlobal failure model
of jacket withmember (i) removed
T.Moan MARE WINT Sept.201358
Inspection sceduling for a welded joint based upon no detection of crack during inspection
0 4 8 12 16 20
Inspection at time t=8with no crack detection
No inspection
Rel
iabi
lity
leve
l, β
Time (years) 1st inspection 2nd inspection
Target levelfor a given joint
In-service scheduling of inspectionsto maintain a target reliability level
Extension of method:- consideration of other inspection events;- effect of corrosion etc- many welded joints , i.e. system of joints
; depending on theconsequences of failure
1.2 1.4( ) 10
0.85 0.7 log
ββ
β
−Φ − ≈
≈ −
=f
fPP
CeSOS NTNU
18
βT
T.Moan MARE WINT Sept.201359
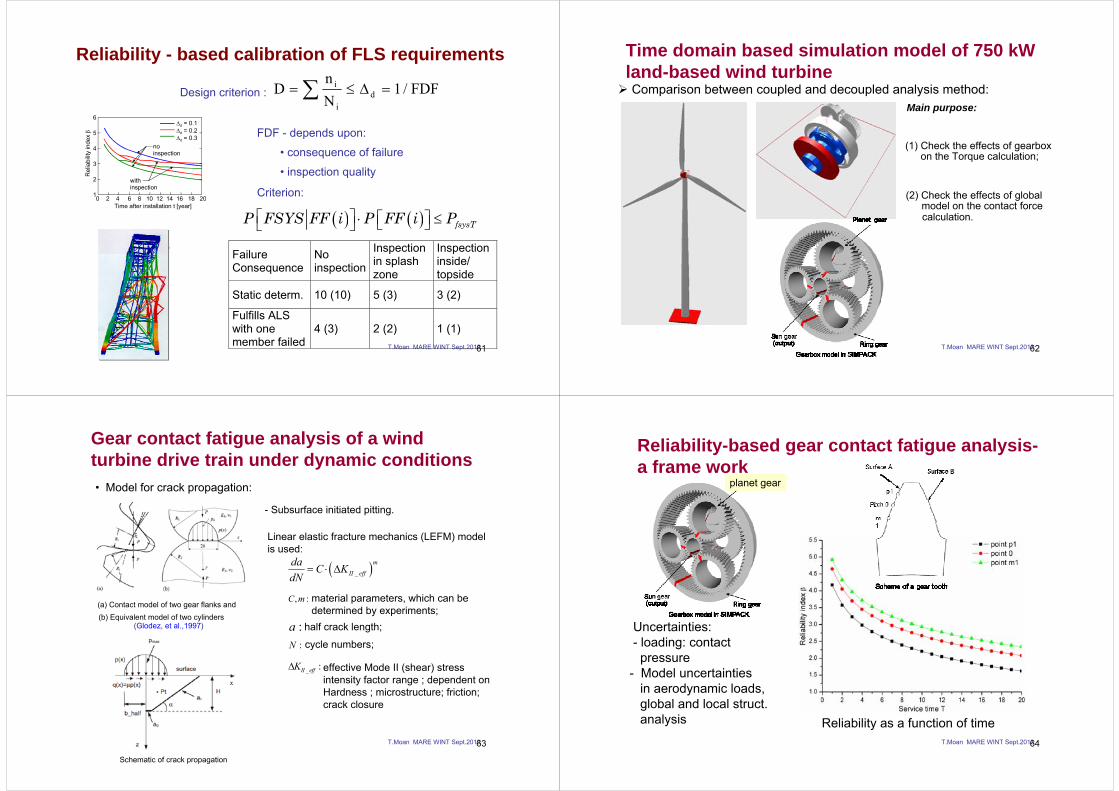
Contribution to cumulative fatigue damage of wind loads, wave loads and interaction of wind and wave loads
Tubular
Joints
Characteristic fatigue damage
Raw
data
Weibullmodel
General-ized
gamma model
Leg1-Joint2
0.0881 0.0859 0.0952
Leg1-Joint3
0.2713 0.2714 0.2862
Sur12-Joint1
0.2142 0.2069 0.2213
Leg2-Joint2
0.0876 0.0836 0.0889
Characteristic fatigue damage for different model
Long term fatigue analysis of multi-planar tubular jointsIn an offshore jacket wind turbine
Two-parameter Weibull model:
Fs(s) = 1 – exp(-(s/A)B)
T.Moan MARE WINT Sept.201360
Fatigue reliability results:
Reliability index for welded joints in jacket as a function of time. No inspection and repair. .0.1corrR =
Reliability index for welded joints in jacket as a function of time. ,
years, mm, mm, andmm.
0.1corrR =5ptt =0.11Ra =
0 0.11a = 2.0Da =
Fatigue reliability analysis of multi-planar welded tubular joints considering corrosion and inspection
(Source: W.B.Dong et al., diff.papers)
T.Moan MARE WINT Sept.201361
Reliability - based calibration of FLS requirements
Design criterion :
FDF - depends upon:
• consequence of failure
• inspection quality
Criterion:
( ) ( ) fsysTP FSYS FF i P FF i P⎡ ⎤ ⎡ ⎤⋅ ≤⎣ ⎦⎣ ⎦
FailureConsequence
Noinspection
Inspectionin splashzone
Inspectioninside/topside
Static determ. 10 (10) 5 (3) 3 (2)
Fulfills ALSwith onemember failed
4 (3) 2 (2) 1 (1)
0 2 4 6 8 10 12 14 16 18 20
6
5
4
3
2
1
withinspection
noinspection
Δd = 0.1Δd = 0.2Δd = 0.3
Time after installation t [year]
Rel
iabi
lity
inde
x β
∑ =Δ≤= FDF/1Nn
D di
i
T.Moan MARE WINT Sept.201362
Main purpose:
(1) Check the effects of gearboxon the Torque calculation;
(2) Check the effects of global model on the contact forcecalculation.
Time domain based simulation model of 750 kW land-based wind turbineComparison between coupled and decoupled analysis method:
T.Moan MARE WINT Sept.201363
• Model for crack propagation:
Linear elastic fracture mechanics (LEFM) model is used:
( )_
m
II effda C KdN
= ⋅ Δ
, :C m material parameters, which can be determined by experiments;
:a half crack length;
:N cycle numbers;
_ :II effKΔ effective Mode II (shear) stress intensity factor range ; dependent onHardness ; microstructure; friction; crack closure
- Subsurface initiated pitting.
Gear contact fatigue analysis of a wind turbine drive train under dynamic conditions
(a) Contact model of two gear flanks and(b) Equivalent model of two cylinders
(Glodez, et al.,1997)
Schematic of crack propagation
T.Moan MARE WINT Sept.201364
Reliability-based gear contact fatigue analysis-a frame work
Reliability as a function of time
Uncertainties:- loading: contact pressure
- Model uncertaintiesin aerodynamic loads, global and local struct.analysis
planet gear
T.Moan MARE WINT Sept.201365
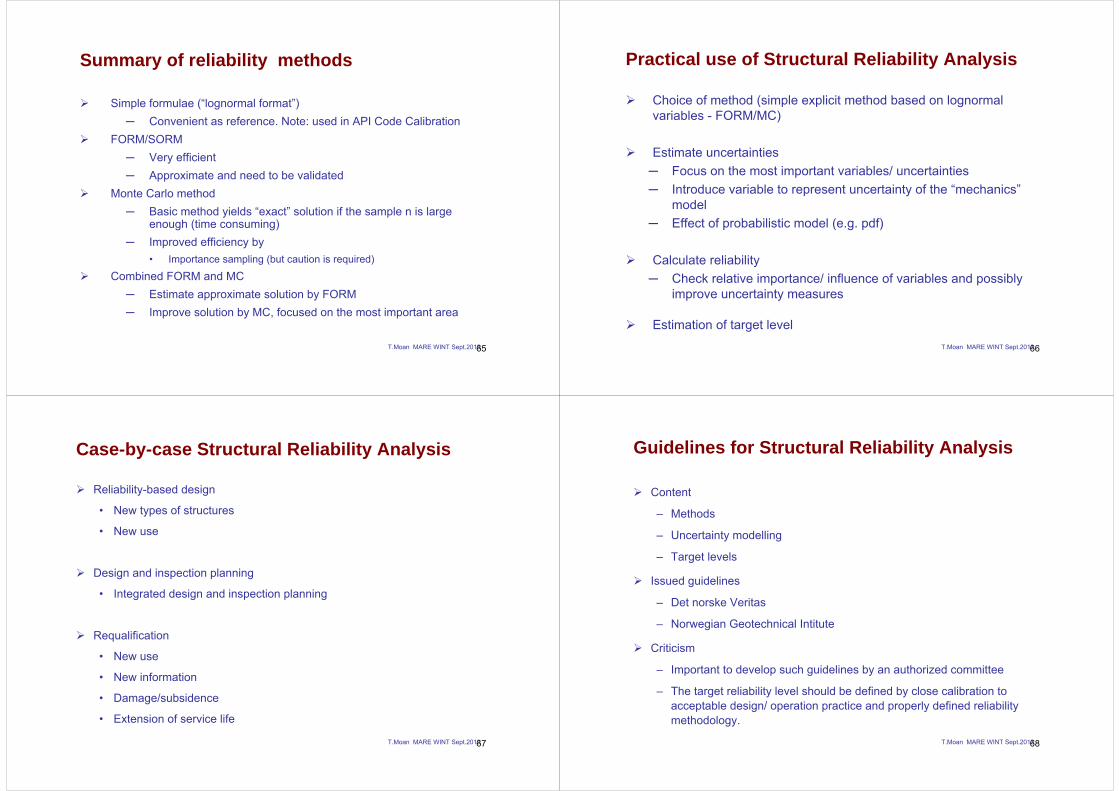
Summary of reliability methods
Simple formulae (“lognormal format”)─ Convenient as reference. Note: used in API Code Calibration
FORM/SORM─ Very efficient─ Approximate and need to be validated
Monte Carlo method─ Basic method yields “exact” solution if the sample n is large
enough (time consuming)─ Improved efficiency by
• Importance sampling (but caution is required)
Combined FORM and MC ─ Estimate approximate solution by FORM─ Improve solution by MC, focused on the most important area
T.Moan MARE WINT Sept.201366
Practical use of Structural Reliability Analysis
Choice of method (simple explicit method based on lognormal variables - FORM/MC)
Estimate uncertainties─ Focus on the most important variables/ uncertainties─ Introduce variable to represent uncertainty of the “mechanics”
model─ Effect of probabilistic model (e.g. pdf)
Calculate reliability─ Check relative importance/ influence of variables and possibly
improve uncertainty measures
Estimation of target level
T.Moan MARE WINT Sept.201367
Case-by-case Structural Reliability Analysis
Reliability-based design
• New types of structures
• New use
Design and inspection planning
• Integrated design and inspection planning
Requalification
• New use
• New information
• Damage/subsidence
• Extension of service life
T.Moan MARE WINT Sept.201368
Guidelines for Structural Reliability Analysis
Content
– Methods
– Uncertainty modelling
– Target levels
Issued guidelines
– Det norske Veritas
– Norwegian Geotechnical Intitute
Criticism
– Important to develop such guidelines by an authorized committee
– The target reliability level should be defined by close calibration to acceptable design/ operation practice and properly defined reliability methodology.
T.Moan MARE WINT Sept.201369
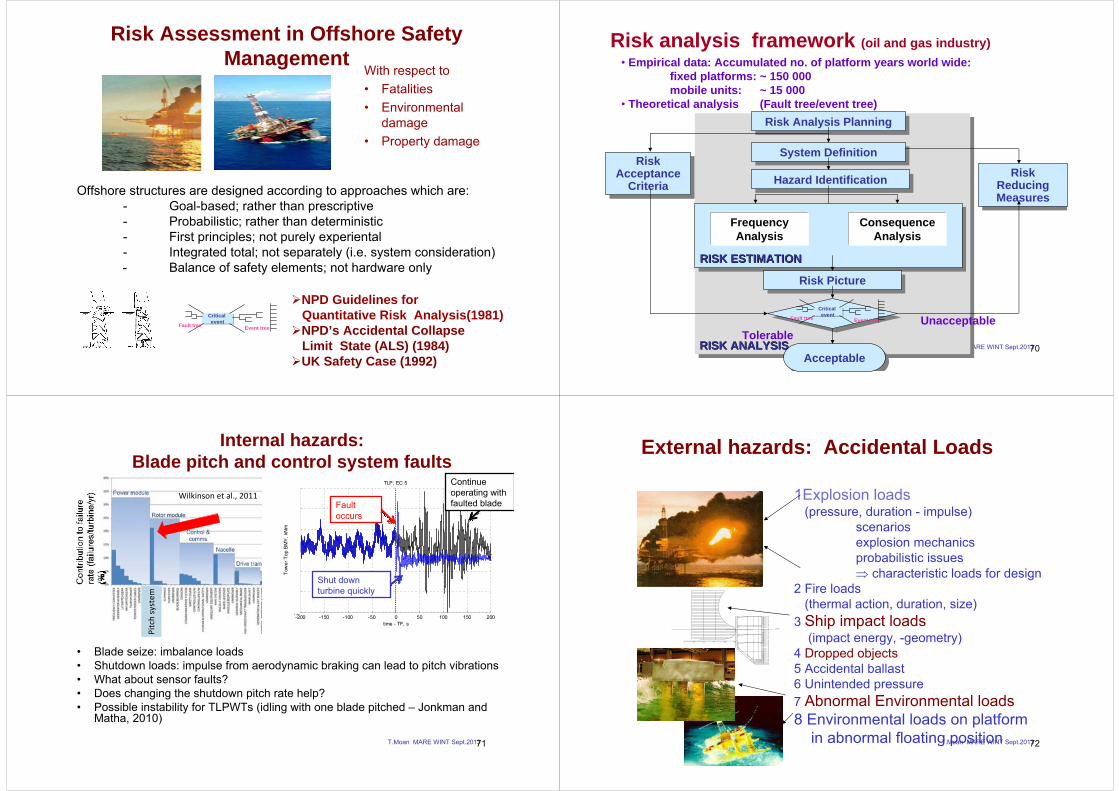
Risk Assessment in Offshore Safety Management
With respect to • Fatalities• Environmental
damage• Property damage
Offshore structures are designed according to approaches which are: - Goal-based; rather than prescriptive- Probabilistic; rather than deterministic- First principles; not purely experiental- Integrated total; not separately (i.e. system consideration)- Balance of safety elements; not hardware only
Critical eventFault tree Event tree
NPD Guidelines for Quantitative Risk Analysis(1981)NPD’s Accidental CollapseLimit State (ALS) (1984)UK Safety Case (1992)
T.Moan MARE WINT Sept.201370RISK ANALYSISRISK ANALYSISRISK ANALYSIS
RISK ESTIMATIONRISK ESTIMATIONRISK ESTIMATION
Risk Analysis PlanningRisk Analysis Planning
System DefinitionSystem Definition
Hazard IdentificationHazard Identification
Risk PictureRisk Picture
Risk Reducing Measures
Risk Reducing Measures
Frequency Analysis
Consequence Analysis
Risk Acceptance
Criteria
Risk Acceptance
Criteria
AcceptableAcceptable
UnacceptableTolerable
Critical eventFault tree Event tree
Risk analysis framework (oil and gas industry)• Empirical data: Accumulated no. of platform years world wide:
fixed platforms: ~ 150 000mobile units: ~ 15 000
• Theoretical analysis (Fault tree/event tree)
T.Moan MARE WINT Sept.201371
Internal hazards:Blade pitch and control system faults
• Blade seize: imbalance loads• Shutdown loads: impulse from aerodynamic braking can lead to pitch vibrations• What about sensor faults?• Does changing the shutdown pitch rate help?• Possible instability for TLPWTs (idling with one blade pitched – Jonkman and
Matha, 2010)
Wilkinson et al., 2011
Pitch system
-200 -150 -100 -50 0 50 100 150 200-1.5
-1
-0.5
0
0.5
1
1.5x 10
4
Tow
er T
op B
MY
, kN
m
TLP, EC 5
time - TF, s
BC
Shut down turbine quickly
Fault occurs
Continue operating with faulted blade
T.Moan MARE WINT Sept.201372
External hazards: Accidental Loads
1Explosion loads (pressure, duration - impulse)
scenariosexplosion mechanics probabilistic issues⇒ characteristic loads for design
2 Fire loads (thermal action, duration, size)
3 Ship impact loads(impact energy, -geometry)
4 Dropped objects 5 Accidental ballast6 Unintended pressure7 Abnormal Environmental loads8 Environmental loads on platform
in abnormal floating position
T.Moan MARE WINT Sept.201373
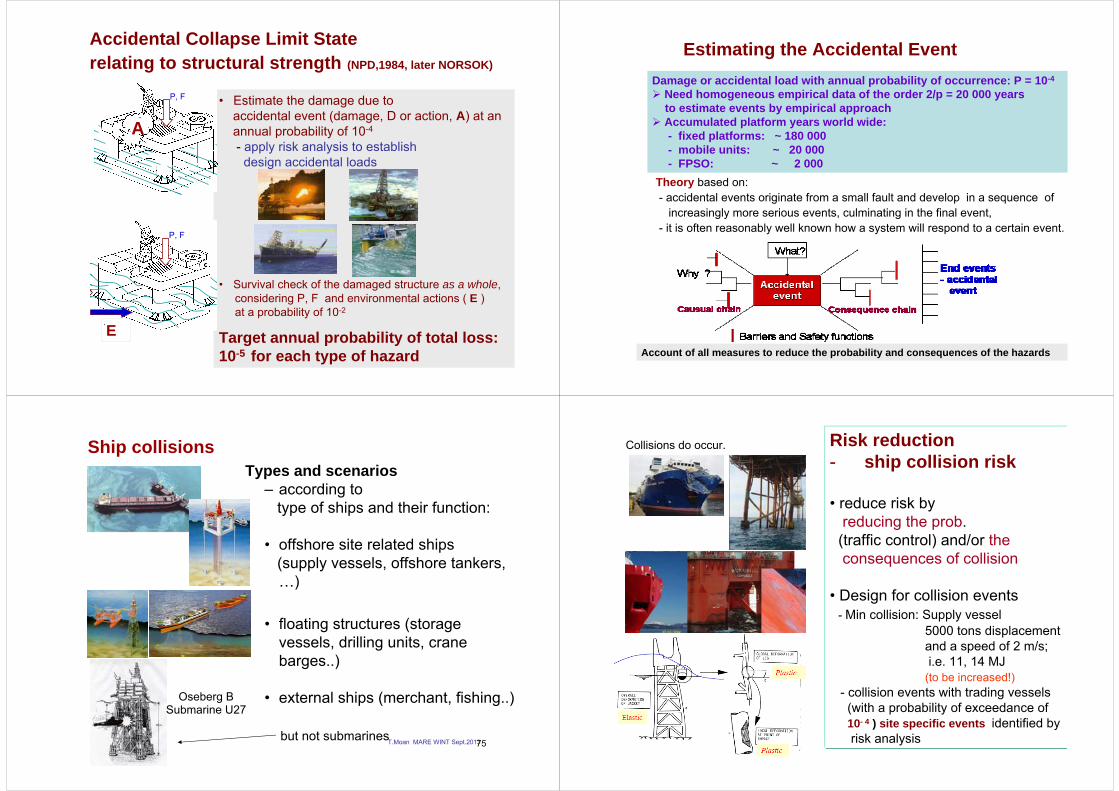
Accidental Collapse Limit State relating to structural strength (NPD,1984, later NORSOK)
• Estimate the damage due to accidental event (damage, D or action, A) at an annual probability of 10-4
- apply risk analysis to establish design accidental loads
• Survival check of the damaged structure as a whole, considering P, F and environmental actions ( E ) at a probability of 10-2
Target annual probability of total loss: 10-5 for each type of hazard
P, F
A
P, F
A
P, FP, F
E
A
T.Moan MARE WINT Sept.201374
Estimating the Accidental Event
Theory based on: - accidental events originate from a small fault and develop in a sequence of
increasingly more serious events, culminating in the final event, - it is often reasonably well known how a system will respond to a certain event.
Damage or accidental load with annual probability of occurrence: P = 10-4
Need homogeneous empirical data of the order 2/p = 20 000 yearsto estimate events by empirical approach Accumulated platform years world wide:- fixed platforms: ~ 180 000- mobile units: ~ 20 000- FPSO: ~ 2 000
Account of all measures to reduce the probability and consequences of the hazards
T.Moan MARE WINT Sept.201375
Ship collisions Types and scenarios
– according to type of ships and their function:
• offshore site related ships (supply vessels, offshore tankers, …)
• floating structures (storage vessels, drilling units, crane barges..)
• external ships (merchant, fishing..)Oseberg BSubmarine U27
but not submarines T.Moan MARE WINT Sept.201376
Risk reduction- ship collision risk
• reduce risk by reducing the prob. (traffic control) and/or theconsequences of collision
• Design for collision events- Min collision: Supply vessel
5000 tons displacementand a speed of 2 m/s; i.e. 11, 14 MJ
(to be increased!)- collision events with trading vessels(with a probability of exceedance of10- 4 ) site specific events identified byrisk analysis
Collisions do occur.
T.Moan MARE WINT Sept.201377
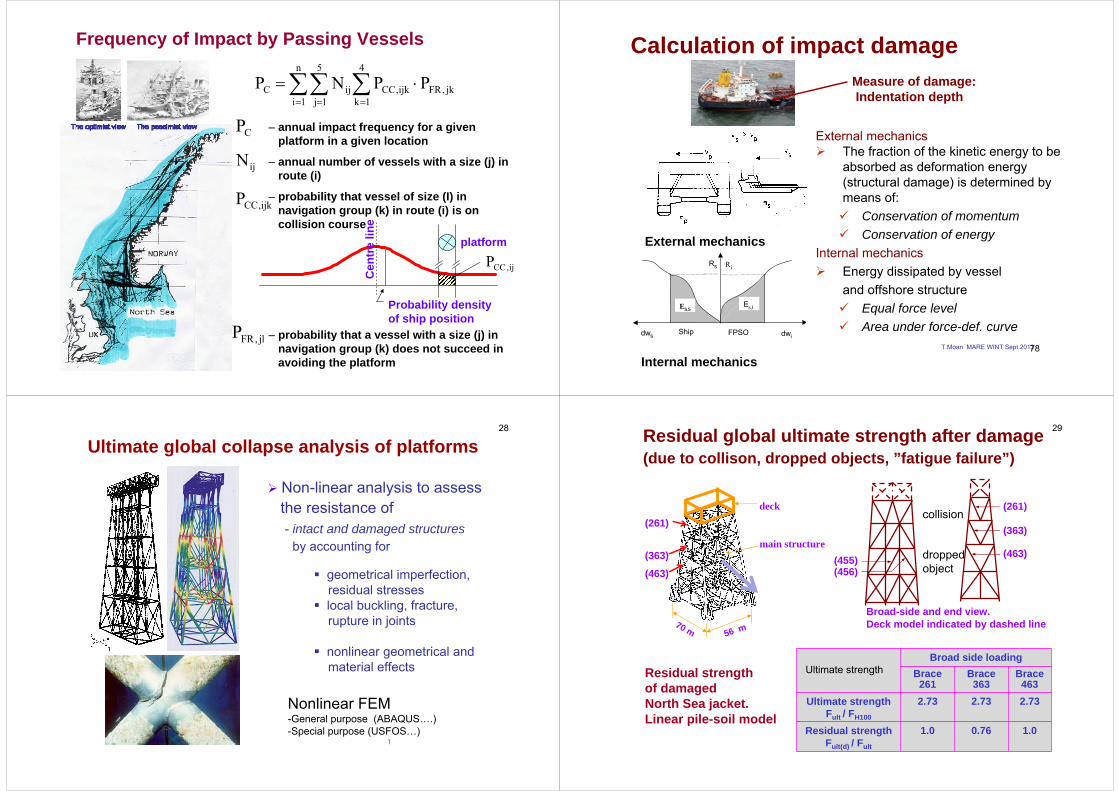
– annual impact frequency for a given platform in a given location
– annual number of vessels with a size (j) in route (i)
– probability that vessel of size (I) in navigation group (k) in route (i) is on collision course
Frequency of Impact by Passing Vessels
∑ ∑∑= ==
⋅=n
1i
4
1kjk,FRijk,CC
5
1jijC PPNP
CP
ijN
ijk,CCP
jk,FRPProbability density of ship position
ij,CCPplatform
Cen
tre
line
– probability that a vessel with a size (j) in navigation group (k) does not succeed in avoiding the platform
T.Moan MARE WINT Sept.201378
Calculation of impact damage
External mechanicsThe fraction of the kinetic energy to be absorbed as deformation energy (structural damage) is determined by means of:
Conservation of momentumConservation of energy
Internal mechanicsEnergy dissipated by vesseland offshore structure
Equal force levelArea under force-def. curvedws dwi
RiRs
Ship FPSO
Es,sEs,i
External mechanics
Internal mechanics
Measure of damage: Indentation depth
T.Moan MARE WINT Sept.201379
Ultimate global collapse analysis of platforms
Non-linear analysis to assessthe resistance of - intact and damaged structures
by accounting for
geometrical imperfection,residual stresseslocal buckling, fracture,rupture in joints
nonlinear geometrical and material effects
Nonlinear FEM-General purpose (ABAQUS….)-Special purpose (USFOS…)
28
T.Moan MARE WINT Sept.201380
Residual global ultimate strength after damage(due to collison, dropped objects, ”fatigue failure”)
Residual strength of damaged North Sea jacket. Linear pile-soil model
Ultimate strengthBroad side loading
Brace 261
Brace 363
Brace 463
Ultimate strength Fult / FH100
2.73 2.73 2.73
Residual strength Fult(d) / Fult
1.0 0.76 1.0
70 m 56 m
main structure
deck(261)
(363)
(463)
Broad-side and end view.Deck model indicated by dashed line
(261)
(363)
(463)(455)(456)
collision
droppedobject
29
T.Moan MARE WINT Sept.201381
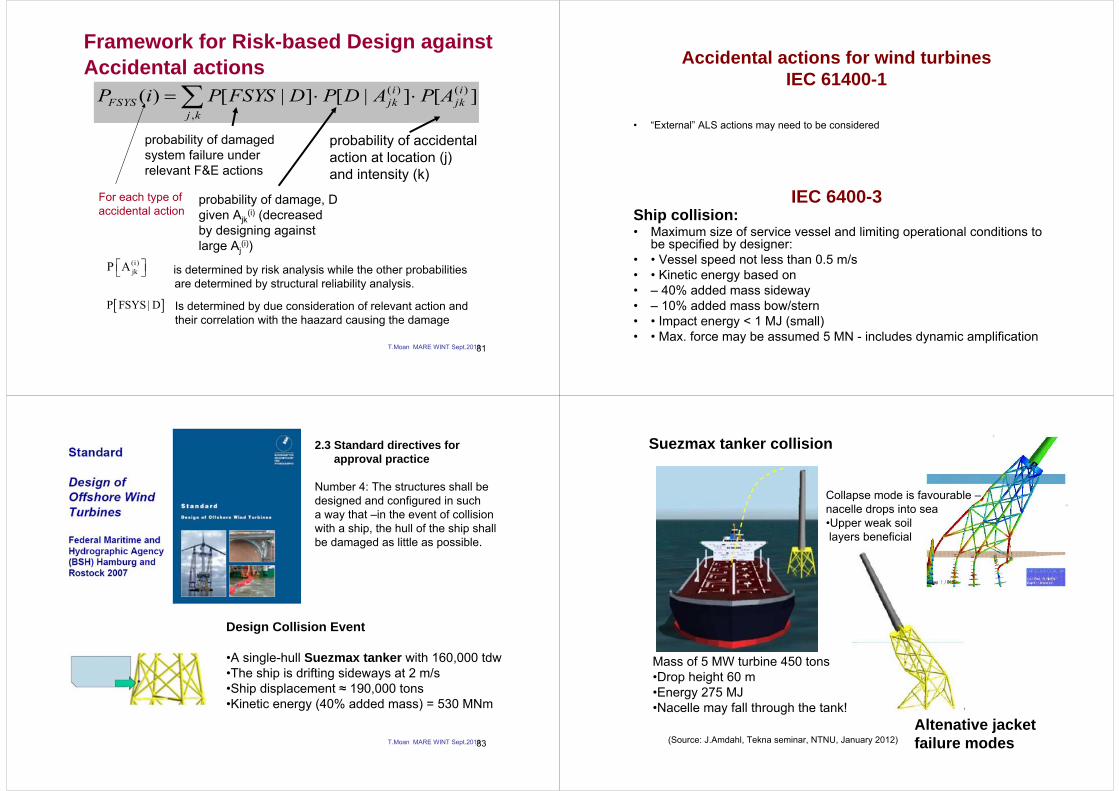
Framework for Risk-based Design against Accidental actions
][]|[]|[)( )(
,
)( ijk
kj
ijkFSYS APADPDFSYSPiP ∑ ⋅⋅=
probability of damaged system failure under relevant F&E actions
probability of damage, D given Ajk
(i) (decreased by designing against large Aj
(i))
probability of accidental action at location (j) and intensity (k)
(i)jkP A⎡ ⎤⎣ ⎦ is determined by risk analysis while the other probabilities
are determined by structural reliability analysis.
[ ]P FSYS | D Is determined by due consideration of relevant action and their correlation with the haazard causing the damage
For each type ofaccidental action
T.Moan MARE WINT Sept.201382
Accidental actions for wind turbinesIEC 61400-1
• “External” ALS actions may need to be considered
Ship collision:• Maximum size of service vessel and limiting operational conditions to
be specified by designer: • • Vessel speed not less than 0.5 m/s • • Kinetic energy based on• – 40% added mass sideway• – 10% added mass bow/stern• • Impact energy < 1 MJ (small) • • Max. force may be assumed 5 MN - includes dynamic amplification
IEC 6400-3
T.Moan MARE WINT Sept.201383
2.3 Standard directives for approval practice
Number 4: The structures shall be designed and configured in sucha way that –in the event of collisionwith a ship, the hull of the ship shallbe damaged as little as possible.
Design Collision Event
•A single-hull Suezmax tanker with 160,000 tdw•The ship is drifting sideways at 2 m/s •Ship displacement ≈ 190,000 tons•Kinetic energy (40% added mass) = 530 MNm
T.Moan MARE WINT Sept.201384
Mass of 5 MW turbine 450 tons•Drop height 60 m •Energy 275 MJ •Nacelle may fall through the tank!
Suezmax tanker collision
Altenative jacket failure modes(Source: J.Amdahl, Tekna seminar, NTNU, January 2012)
Collapse mode is favourable –nacelle drops into sea•Upper weak soillayers beneficial
T.Moan MARE WINT Sept.201385
Concluding remarks
Experiences regarding- failures and accidents and- life cycle safety managementfor oil and gas installations can serve as a basis for structuresin other offshore industries, notably wind turbines, - when the differences betweenthe oil and gas and the other industriesare recognised
In particular- normal uncertainty and variability in structuralperformance as well as possible “gross errors” in fabrication and operation should be properly considered in the decisionprocess
CeSOS NTNU
Thank you!
30
T.Moan MARE WINT Sept.201386
Selected references – which include more complete reference listsDesign codes: ISO 2394 (Reliability of structures); ISO 19900- (Offshore structures)
Emami, M.R., and Moan, T.: “Ductility demand of simplified pile-soil-jacket system under extreme sea waves and earthquakes”, Third European Conf. on Structural Dynamics, Balkema Publ. G. Augusti et al. (eds.) Rotterdam, 1996, pp. 1029 – 1038.
Moan, T. and Amdahl, J.: “Catastrophic Failure Modes of Marine Structures”, in Structural Failure, Wierzbiecki, T. (Ed.), John Wiley & Sons, Inc., New York, 1989.
Moan, T., Vårdal, O.T., Hellevig, N.C. and Skjoldli, K. “Initial Crack Dept. and POD Values inferred from in-service Observations of Cracks in North Sea Jackets”, J. OMAE, Vol. 122, August 2000, pp. 157-162.
Moan, T. and Amdahl, J.: “ Nonlinear Analysis for Ultimate and Accidental Limit State. Design and Requalification of Offshore Platforms” WCCM V. Fifth World Congress on Computational Mechanics (Eds.: H.A. Mang, F.G. Rammerstorfer, J. Eberhardsteiner) July 7-12, 2002, Vienna, Austria.
Moan, T. “Reliability-based management of inspection, maintenance and repair of offshore structures”. Structure and Infrastructure Engineering. Vol.1, No.1, 2005, pp. 33-62.
Moan, T. Reliability of aged offshore structures. In: "Condition Assessment of Aged Structures", 2008, Ed. Paik, J. K. and Melchers R. E., Woodhead Publishing.
Moan, T. Development of accidental collapse limit state criteria for offshore structures. J. Structural Safety, 2009, Vol. 31, No. 2, pp. 124-135.
Vinnem, J.E.: “Offshore Risk Assessment”, Kluwer Academic Publishers, Doordrecht, 1999.