lipotoxic endoplasmic reticulum stress … · lipotoxic endoplasmic reticulum stress-associated...
TRANSCRIPT
LIPOTOXIC ENDOPLASMIC RETICULUM
STRESS-ASSOCIATED INFLAMMATION:
MOLECULAR MECHANISMS AND
MODIFICATION BY A BIOACTIVE LIPOKINE
A THESIS
SUBMITTED TO THE DEPARTMENT OF MOLECULAR
BIOLOGY AND GENETICS AND THE GRADUATE
SCHOOL OF ENGINEERING AND SCIENCE OF
BILKENT UNIVERSITY IN PARTIAL FULFILLMENT OF
THE REQUIREMENTS FOR THE DEGREE OF MASTER
OF SCIENCE
BY
ŞEYMA DEMIRSOY
SEPTEMBER 2012

ii
I certify that I have read this thesis and that in my opinion it is fully adequate,
in scope and in quality, as a thesis for the degree of Master of Science.
Assist.Prof.Dr. Ebru ERBAY
I certify that I have read this thesis and that in my opinion it is fully adequate,
in scope and in quality, as a thesis for the degree of Master of Science.
Assist. Prof. Dr. Uygar TAZEBAY
I certify that I have read this thesis and that in my opinion it is fully adequate,
in scope and in quality, as a thesis for the degree of Master of Science.
Assist. Prof. Dr. Çağdaş D. SON
Approved for the Graduate School of Engineering and Science
Prof. Dr. Levent Onural
Director of the Graduate School
iii
ABSTRACT
Lipotoxic endoplasmic reticulum stress-associated inflammation:
molecular mechanisms and modification by a bioactive lipokine
Şeyma Demirsoy
M.Sc.in Molecular Biology and Genetics
Supervisor Assist. Prof. Dr. Ebru Erbay
September 2012, 127 Pages
Physiologic or pathologic processes that disturb protein folding in the endoplasmic
reticulum (ER) activate a signaling pathway named the unfolded protein response
(UPR). UPR promotes cell survival by reducing misfolded protein levels. The three
proximal stress sensors of the UPR are known as PKR-resemble like ER kinase
(PERK), inositol-requiring enzyme-1 (IRE1) and activating transcription factor 6
(ATF6), which monitor the quality of protein folding in the ER membrane and relay that
information to the rest of the cell. If ER homeostasis can not be restored, prolonged
UPR signaling can lead to cell death.
Recent studies have shown metabolic overload, particularly high levels of fatty acids
and cholesterol can induce ER stress and activate UPR signaling. These studies also
demonstrated ER stress is a central mechanism that underlies the pathogenesis of
metabolic diseases including obesity, type 2 diabetes, insulin resistance, atherosclerosis
and hepatosteatosis. Understanding how nutrient excess activates the UPR and its novel
molecular mechanisms of operation during metabolic stress could facilitate the
development of novel and effective future therapeutics aiming to restore ER
homeostasis.

iv
The molecular mechanisms of lipid induced activation of UPR and how the three
proximal UPR stress sensors are linked to lipid metabolism and inflammation is not
well understood. One of the UPR stress sensors, PERK, is a trans-membrane
serine/threonine kinase with only two known downstream substrates, the eukaryotic
translation initiation factor (eIF2) that controls translation initiation, and an anti-
oxidant transcription factor, Nuclear factor eryhthroid-2-related factor-2 (Nrf2), that
keeps redox homeostasis. One of the existing road blocks in studying PERK signaling
has been the lack of molecular or chemical tools to regulate its activity. For my thesis
studies, I developed a chemical-genetic approach to specifically modify PERK’s kinase
activity. In this approach, the ATP binding pocket of a particular kinase is altered via
site-directed mutagenesis in order to accommodate a bulky ATP analog that is not an
effective substrate for the wild type kinase. Thus, only the mutated kinase can be
targeted by the activatory or inhibitory bulky ATP analogs and this form of the kinase is
referred to as ATP analog sensitive kinase (ASKA). Furthermore, I identified specific
siRNA sequences that can be efficiently delivered to mouse macrophages and
significantly reduce PERK expression. Both of these methods can be applied to study
the direct impact of PERK activity on lipotoxic ER stress- associated inflammation. The
results of the siRNA mediated PERK expression silencing experiments showed that
PERK has a direct contribution to lipid-induced pro-inflammatory response in
macrophages.
Finally, I examined whether palmitoleate, a bioactive monounsaturated fatty acid
previously shown to reduce lipid-induced ER stress and death, could also modify
lipotoxic ER stress-associated inflammation. Based on the results from my experiments,
v
palmitoleate is highly effective in preventing lipid induce inflammation. Unexpectedly,
I also observed that palmitoleate could significantly block LPS-induced inflammation,
too.
In summary, during my thesis study I generated several useful tools including siRNA
mediated knock-down of PERK and a novel chemical-genetic tool to directly and
specifically modify PERK kinase activity. The findings from my studies demonstrate
that PERK plays a significant role in lipid-induced inflammation, suggesting
modification of PERK activity or its direct pro-inflammatory substrates could become
desirable approaches to inhibit obesity-induced inflammation that contributes to the
pathogenesis of diabetes and atherosclerosis. The outcome of my studies also showed
that palmitoleate can significantly reduce lipotoxic-ER stress associated inflammation,
which may explain its beneficial impact on both insulin resistance and atherosclerosis.
Furthermore, the ATP-analog sensitive PERK mutant developed in my thesis can be
coupled with proteomics to identify the full repertoire of PERK substrates during
metabolic stress. In conclusion, the findings and tools developed in my thesis studies
can form the basis of future studies to identify the molecular details of PERK’s
involvement in lipid induced inflammation, the identification of novel PERK substrates
during metabolic stress and the development of new therapeutic strategies against
metabolically induced inflammation in obesity, diabetes and atherosclerosis.
Key words: UPR, ER stress, PERK, Palmitate, Palmitoleate
vi
ÖZET
Lipotoksik endoplazmik retikulum stresine bağlı inflamasyon: Bir
biyoaktif lipokine tarafından gerçekleştirilen moleküler mekanizmalar
ve modifikasyonlar
Şeyma Demirsoy
Moleküler Biyoloji ve Genetik Yüksek Lisansı
Tez Yöneticisi: Yrd.Doç. Dr. Ebru Erbay
Eylül 2012, 127 Sayfa
Endoplazmik retikulumdaki (ER) protein katlanmasını bozan fizyolojik ya da patolojik
süreçler katlanmamış protein yanıtı (KPY) adı verilen bir sinyal yolağını aktifleştirir.
KPY yanlış katlanmış protein seviyelerini düşürerek hücre kurtuluşunu sağlar. KPY’nin
3 yakınsal sensörü PKR’yi anımsatan ER kinazı (PERK), inositol-gerektiren enzim-1
(IRE1) ve aktifleştiren transkripsiyon faktör 6’dır. Bunlar ER zarındaki protein
katlanmasının kalitesini gözlemler ve bu bilgiyi hücrenin geri kalanına yayar. Eğer ER
dengesi yeniden sağlanamazsa, uzun süre devam eden KPY hücre ölümüne neden
olabilir.
Son zamanlarda yapılan çalışmalar göstermiştir ki metabolik aşırı yüklenme, özellikle
yüksek seviyede bulunan yağ asitleri ve kolesterol, ER stresi tetikleyebilir ve KPY
sinyal yolağını aktifleştirebilir. Bu çalışmalar aynı zamanda ER stresinin obezite, tip 2
diyabet, insülin direnci, aterozkleroz ve karaciğer yağlanması da dâhil olmak üzere
metabolik hastalıkların patolojilerinin temelinde yatan merkezi bir mekanizma olduğunu
da göstermiştir. Besin maddelerinin fazlasının KPY’yi nasıl aktifleştirdiğini ve buna
vii
bağlı özgün stres mekanizmalarının metabolik stres sürecinde nasıl çalıştığını anlamak,
gelecekte ER dengesini yeniden sağlamaya yönelik özgün ve etkili tedavi yöntemlerinin
gelişimini kolaylaştıracaktır. Yağ fazlasının, bu stres sensörlerini nasıl aktive ettiği ve
özellikle de yağ metabolizması ve inflamasyon olmak üzere değişmiş hücresel yanıtlarla
nasıl ilişkilendirileceği konusu halen araştırılmayı gerektirmektedir.
KPY’nin yağlarla aktifleştirilen moleküler mekanizması, ve KPY’nin üç yakınsal
sensörünün yağ metabolizması ve inflamasyonla olan bağlantısı henüz anlaşılamamıştır.
KPY’nin sensörlerinden biri olan PERK, translasyon mekanizmasının başlayışını
kontrol eden ökaryotik translasyon başlatan faktör α (eIF2α) ve redoks dengesini
sağlayan bir antioksidan transkripsiyon faktörü olan çekirdeksel faktör eritroid-2-ilgili
faktör-2 (Nrf2) olmak üzere yalnızca iki bilinen substrata sahip hücre zarına gömülü
serine/threonin kinazdır. PERK’den kaynaklanan sinyal yolağını çalışmadaki var olan
en büyük engellerden biri onun aktivitesini düzenleyen kimyasal ve moleküler bir
tekniğin eksikliği olmuştur. Bu çalışmada PERK’ün özellikle kinaz aktivitesini
modifiye eden kimyasal-genetik bir yaklaşım geliştirdim. Bu yaklaşıma göre belirli bir
kinazın ATP bağlayan paketi, mutasyona uğratılmamış doğal kinaz için etkin bir
substrat olmayan iri hacimli ATP analoğuna uyum sağlayabilmesi için mutasyona
uğratılır. Böylece sadece mutasyona uğramış kinaz, aktive edici veya engelleyici
özelliğe sahip iri hacimli ATP analogları tarafından hedeflenebilir ve buna da ATP
analoğuna duyarlı kinaz (AZKA) denilmektedir. Bunun dışında fare makrofajlarına
etkili bir şekilde ulaştırılabilecek ve PERK ifadesini önemli ölçüde azaltabilecek özel
siRNA dizileri tespit ettim. Bu iki metot da PERK aktivitesinin, lipotoksik ER stresine-
bağlı inflamasyon üzerindeki doğrudan etkisinin araştırılması için kullanılabilir. PERK
viii
ifadesini azaltmaya yönelik siRNA deney sonuçları, makrofajlarda palmitat uyarısına
bağlı pro-inflamatuvar yanıta PERK’ün doğrudan bir katkısının olduğunu göstermiştir.
Son olarak yağlara bağlı ER stresi ve ölümünü azaltmak için daha önceden de gösterilen
bir biyoaktif tekli doymamış yağ asidi olan palmitoleatın, lipotoksik ER stresine-bağlı
inflamasyonu modifiye edip edemeyeceğini de inceledim. Yapmış olduğum deneylerin
sonuçlarına göre palmitoleat, yağa bağlı inflamasyonun engellenmesinde oldukça
etkilidir. Beklenmeyen bir şekilde palmitoleatın LPS’e bağlı inflamasyonu da önemli
ölçüde engellediği gözlemlenmiştir.
Özet olarak tez çalışmam boyunca PERK kinaz aktivitesini doğrudan ve özel olarak
modifiye etmek için etkin bir kimyasal-genetik mekanizması ve PERK ifadesini
azaltabilen siRNA dizileri gibi yararlı araçlar geliştirdim. Yapmış olduğum çalışmanın
sonuçları PERK’ün yağa bağlı inflamasyonda önemli bir rol oynadığını göstermiştir. Bu
da PERK aktivitesinde veya PERK’ün doğrudan pro-inflamatuvar hedeflerinde
yapılacak modifikasyonun, diyabet ve aterozkleroz patogenezine katkıda bulunan
obeziteye bağlı inflamasyonun engellenmesinde arzu edilen yaklaşımlardan biri
olabileceği anlamına gelmektedir. Bu sonuçlar aynı zamanda palmitoleatın lipotoksik
ER stresine bağlı inflamasyonu azaltabileceğini göstermiştir ve bu da hem insülin
direncini hem de aterozkleroz üzerinde yarattığı yararlı etkiyi açıklayabilir. Ayrıca,
geliştirmiş olduğum bu ATP-analoglarına duyarlı PERK mutantı, metabolik stres
sırasında PERK’ün hedeflerinin tümünü tespit etmek için proteomik çalışmaları ile
birleştirilebilir. Sonuç olarak, tez çalışmamda geliştirdiğim bulgular ve araçlar, yağa
bağlı inflamasyonda PERK’ün rolünün moleküler mekanizmasının tanımlanması,
metabolik stress sırasında PERK’e özgün hedeflerinin tespiti ve obezite, diyabet ve

ix
aterozkleroz hastalıklarında metabolik inflamasyona karşı yeni tedavi yöntemlerinin
geliştirilmesi yönünde yapılacak olan çalışmalara temel oluşturabilir.
Anahtar sözcükler: KPY, ER stresi, PERK, Palmitat, Palmitoleat

x
ACKNOWLEDGEMENT
I am deeply indebted to my supervisor Assit.Prof.Dr.Ebru Erbay whose help,
stimulating suggestions and encouragement helped me during my research and writing
of this thesis. I learned a lot from her and it felt proud for working with her.
I want to thank Assist.Prof.Dr.Uygar Tazebay and Assist.Prof.Dr.Çağdaş D.Son for
being members of my thesis committee and helpful suggestions.
I would like to give my special thanks to the former members of our group, Aylin Göke,
Gülhan Saraçaydın and Arda Mızrak for helping the first step of this master thesis.
Additionally, I can not find words to express my gratitude to the current members of our
group, Özlem Tufanlı and Büşra Yağabasan and our new member and a former senior
student, İnci Şimşek for their friendships, patience and support during my studies. I
have furthermore to thank to Elif Senem Kayalı and Hakan Köksal for assisting me
during my experiments.
I would like to express my deepest appreciation to Bilkent MBG doctoral program
student, Verda Bitirim who was always willing to help me as a valuable friend during
my experiments and writing of thesis. Many thanks to Defne Bayık, Gözde Güçlüer,
Aysegül Örs and Gülesin Eren for their friendships and moral support. It would be a
lonely lab without them.
This thesis would not have been possible without Assoc.Prof. İhsan Gürsel,
Assist.Prof.Uygar Tazebay and Prof.Dr.Mehmet Öztürk and their groups allowing me to

xi
use their instruments and materials. I would like to express my gratitude to all those
who gave me the possibility to complete this thesis.
I would like to thank all past and present MBG family for providing me an enjoyable
work place. Without them the journey in my study would be challenge to me.
I want to give my special thanks to TUBITAK for supporting me with a scholarship
during my thesis study.
I wish to thank my very close friends Esra Yalçın, Reyhan Mutlu, İlke Ilgaz, Tuğçe
Başer, Özge Kalman and Nihan Dilşat Dağtaş for their friendships and moral support.
Furthermore, I would like to thank to my very close friend Emrah Ataş for friendship as
well as helping me with grammar corrections for my thesis. All helped me to be who I
am.
I would like to express my special thanks to Seda Yağabasan and Mehmet Yağabasan
for cheering me up and standing by me through the good times and bad during my thesis
study.
Last but not the least, many thanks and gratitude to my family for giving me the
strength to plod on despite my constitution wanting to give up and throw in the towel.
xii
TABLE OF CONTENTS
ABSRACT ....................................................................................................................... iii
ÖZET ............................................................................................................................... vi
ACKNOWLEDGEMENT ................................................................................................ x
TABLE OF CONTENTS ................................................................................................ xii
LIST OF FIGURES ...................................................................................................... xvii
LIST OF TABLES ......................................................................................................... xix
1. Introduction ......................................................................................................... - 1 -
1.1 Endoplasmic Reticulum Function And Biogenesis ............................................ - 1 -
1.2 Endoplasmic Reticulum Stress ........................................................................... - 5 -
1.2.1 Endoplasmic Reticulum Stress : The Causes And Consequences ................... - 5 -
1.2.2 The Unfolded Protein Response ...................................................................... - 7 -
1.2.3 The Adaptive And Destructive Outcomes Of The Unfolded Protein Response
………………………………………………………………………………- 14 -
1.3 The Interface Between Endoplasmic Reticulum Stress And Inflammation ..... - 16 -
1.4 Endoplesmic Reticulum Stress And Inflammation In Cardiometabolic Syndrome
………………………………………………………………………...……………..- 20 -
1.5 Restoring ER Stress .......................................................................................... - 23 -
1.6 Chemical Genetics And Its Applications .......................................................... - 25 -
2. OBJECTIVES AND RATIONALES ............................................................... - 31 -
3. MATERIALS AND METHODS ...................................................................... - 34 -

xiii
3.1 MATERIALS....................................................................................................... - 34 -
3.1.1 General Laboratory Reagents ........................................................................ - 34 -
3.1.2 Tissue Culture Materials And Reagents ........................................................ - 34 -
3.1.3 Bacterial Strains ............................................................................................ - 35 -
3.1.4 Enzymes ........................................................................................................ - 35 -
3.1.5 Nucleic Acids ................................................................................................ - 35 -
3.1.6 Oligonucleotides ............................................................................................ - 36 -
3.1.7 Electrophoresis, Photography And Spectrophotometry ................................ - 37 -
3.1.8 Electroporation .............................................................................................. - 37 -
3.1.9 Antibodies ..................................................................................................... - 38 -
3.2 SOLUTIONS AND MEDIA ................................................................................ - 39 -
3.2.1 General Solutions .......................................................................................... - 39 -
3.2.2 Bacteria Solutions ......................................................................................... - 39 -
3.2.3 Tissue Culture Solutions ............................................................................... - 40 -
3.2.4 Competent Cell Solutions .............................................................................. - 42 -
3.2.5 Sodium Deodecyl Sulphate (SDS)-Polyacrylamide Gel Electrophoresis (PAGE)
And Immunoblotting Solution .................................................................................... - 43 -
3.3 METHODS ........................................................................................................... - 45 -
3.3.1 The Use Of Software Programs..................................................................... - 45 -
3.3.1.1 Pymol ......................................................................................................... - 45 -
3.3.1.2 BioLign ...................................................................................................... - 45 -
3.3.1.3 ClustalW2 .................................................................................................. - 45 -
xiv
3.3.2 Molecular Cloning Methods .......................................................................... - 46 -
3.3.2.1 Chemical Competent Cell Preparation ...................................................... - 46 -
3.3.2.2 Transformation .......................................................................................... - 47 -
3.3.2.3 Glycerol Stock Preparation ........................................................................ - 47 -
3.3.2.4 Restriction Enzyme Digestion ................................................................... - 47 -
3.3.2.5 Agarose Gel Electrophoresis ..................................................................... - 48 -
3.3.2.6 Site Directed Mutagenesis ......................................................................... - 49 -
3.3.2.7 Dpn1 Digestion .......................................................................................... - 50 -
3.3.2.8 Gel DNA Extraction .................................................................................. - 50 -
3.3.2.9 Ligation ...................................................................................................... - 50 -
3.3.2.10 Colony PCR ........................................................................................... - 51 -
3.3.2.11 Miniprep ................................................................................................. - 51 -
3.3.2.12 Midiprep ................................................................................................. - 51 -
3.3.3 Tissue Culture Methods ................................................................................ - 52 -
3.3.3.1 Cell Lines And Growth Conditions Of Cells ............................................. - 52 -
3.3.3.2 Passage Of The Cell Lines ......................................................................... - 52 -
3.3.3.3 Thawing The Cells ..................................................................................... - 53 -
3.3.3.4 Freezing Of The Cells ................................................................................ - 53 -
3.3.3.5 Transient Transfection Of Cells ................................................................ - 54 -
3.3.3.5.1 Transfection By Using Polyethylenimine .............................................. - 54 -
3.3.3.5.2 Transfection By The Electroporation Method ....................................... - 55 -
3.3.3.6 Treatment Of Cells .................................................................................... - 56 -
xv
3.3.3.7 PERK siRNA Treatment In Macrophages ................................................ - 58 -
3.3.4 Total Protein Extraction From Cultured Cells .............................................. - 58 -
3.3.5 Western Blot .................................................................................................. - 58 -
3.3.6 Total RNA Extraction From Cultured Cells ................................................. - 60 -
3.3.7 First Strand c-DNA Synthesis ....................................................................... - 60 -
3.3.8 Expression Analysis Of A Gene By Quantative RT-PCR ............................ - 61 -
3.3.8.1 Determination Of Primer Efficiency For Q-PCR Primers ......................... - 61 -
3.3.8.2 Expression Analysis Of Genes By Quantative RT-PCR (Q-PCR) ............ - 63 -
4. RESULTS ......................................................................................................... - 64 -
4.1 Generation Of The Gatekeeper Mutations Of PERK ........................................... - 64 -
4.2 Molecular Cloning And Site Directed Mutagenesis For mPERK ........................ - 73 -
4.3 Expression Of Wild Type And Allele Spesific Kinase Allele (ASKA) Mutant Of
PERK In Mammalian Cells .......................................................................................... - 76 -
4.4 The Knock Down Of PERK Expression In Macrophages By siRNA .................. - 80 -
4.5 The Loss Of Function Of PERK Activity During Lipid Induced ER Stress And
Inflammation In Macrophages ..................................................................................... - 81 -
4.6 Palmitate-LPS Induced Inflammation And Its Reduction With Palmitoleic Acid
………….. .................................................................................................................... - 85 -
6. DISCUSSION AND CONCLUSION ............................................................... - 87 -
6.1 Creating An ATP Analog Sensitive Mutant Of PERK For Chemical Genetic
Approaches .................................................................................................................. - 87 -
6.2 Characterization Of PERK’s Role In Lipid-Induced Inflammation ................. - 88 -

xvi
6.3 Reduction Of Lipid Induced ER-Stress And Inflammation By Palmitoleate .. - 90 -
7. FUTURE PERSPECTIVES .............................................................................. - 93 -
8. REFERENCES ................................................................................................. - 95 -
xvii
LIST OF FIGURES
Figure 1. 1 Endoplasmic Reticulum Stress And Unfolded Protein Response. .......... - 8 -
Figure 1. 2 IRE1 Signaling Branch Of The UPR. ..................................................... - 10 -
Figure 1. 3 ATF6 Signaling Branch Of The UPR. ................................................... - 12 -
Figure 1. 4 PERK Signaling Branch Of The UPR ..................................................... - 14 -
Figure 1. 5 The Switch From Survival To Apoptosis During Prolonged ER Stress. - 15 -
Figure 1. 6 ER Stress And Inflammation. .................................................................. - 19 -
Figure 1.7 Strategy For Labeling Individual Kinase Subsrates And Identification Of
Direct Subsrates Via ATP Analog Sensitized Kinase Mutant Approach. ................. - 28 -
Figure 1. 8 ATP Analog Sensitized Kinase Mutant Mouse Studies : Target Validation,
Therapeutic Window And Biomarkers. ..................................................................... - 29 -
Figure 4. 1 Genomic Context Of PERK Gene In Mus Musculus ............................. - 64 -
Figure 4. 2 Genomic Region And Transcripts Of PERK ......................................... - 65 -
Figure 4. 3 Domain Structure Of PERK .................................................................... - 65 -
Figure 4. 4 Multiple Sequence Alignments Of Several Kinases Whose ATP Binding
Pocket And The Gatekeeper Residue In These Pockets Have Been Identified (Human
PAK-1, Yeast Cla4p, Human JNK2, Human CDK2) With Yeast And Human Ire1 And
Mouse And Human PERK By Using Clustal W2. .................................................... - 66 -
Figure 4. 5 Predicted 3D Structure Of A PERK Fragment From 586 To 1077 By Swiss
Model. ........................................................................................................................ - 67 -
Figure 4. 6 The Hypothetical 3D Model Of PERK Aligned In Pymol15 With GCN2. ..
……………………………………………………………………………………….- 68 -
xviii
Figure 4. 7 The Hypotheticel 3D Model Of PERK In Pymol 15 With Tgcdpk1 In A
Complex With 1NM-PP1 Complex. .......................................................................... - 69 -
Figure 4. 8 PERK WT In Complex With 1NM-PP1 ................................................ - 70 -
Figure 4. 9 PERK M888G In Complex With 1NM-PP1 ........................................... - 71 -
Figure 4. 10 PERK Q889A In Complex With 1NM-PP1 .......................................... - 72 -
Figure 4. 11 PERK Q889G In Complex With 1NM-PP1 ...................................... - 72 -
Figure 4. 12 The Map Of PERK Plasmid Bought From Addgene. ........................... - 74 -
Figure 4. 13 The Sequencing Results For mPERK M888G Mutation. ..................... - 75 -
Figure 4. 14 The Sequencing Results For mPERK M888A Mutation. ..................... - 75 -
Figure 4. 15 PERK Expression In HEK293 Cells. .................................................... - 77 -
Figure 4. 16 NaPP1 Inhibits ASKA Mutant (M888A) mPERK But Not Wild Type
mPERK Expressed In PERK-/-
MEFs. ....................................................................... - 78 -
Figure 4. 17 NaPP1 Inhibits ASKA Mutant (M888G) Of mPERK But Not Wild Type
mPERK Expressed In PERK-/-
MEFs. ........................................................................ - 79 -
Figure 4. 18 siRNA Mediated Silencing Of mPERK In Macrophages. .................... - 80 -
Figure 4. 19 siRNA Mediated Silencing Of mPERK Expression Under Lipotoxic ER
Stress Conditions ....................................................................................................... - 81 -
Figure 4. 20 Phosphorylation Of IRE1 And JNK In Macrophages Treated With PERK
siRNA. ....................................................................................................................... - 82 -
Figure 4. 21 The Changes In Spliced And Unpliced XBP-1 By Semi Quantative PCR In
The Absence Of PERK .............................................................................................. - 83 -
Figure 4. 22 The Changes In Lipid-Induced Cytokine Expression In The Absence Of
PERK ....................................................................................................................... - 85 -
Figure 4.23 Reduction Of Lipotoxic ER Stress Associated Inflammation In
Macrophages By Palmitoleic Acid Treatment ............................................................- 86 -
xix
LIST OF TABLES
Table 3. 1 Primer List, Sequences And Tm Values ................................................... - 36 -
Table 3. 2 A List Of Various siRNA Used. ............................................................... - 37 -
Table 3. 3 The Site Directed Mutagenesis Primers List ............................................ - 49 -
Table 3. 4 The Transfection Methods Depending On Cell Types ............................ - 54 -
Table 3. 5 The Conditions For Electroporation Depending On Cell Types .............. - 55 -
Table 3. 6 Treatment Conditions For Cell Lines. ...................................................... - 57 -
Table 3. 7 The Q-PCR Primers List With Conditions And Efficiencies ................... - 62 -
- 1 -
1. Introduction
1.1 Endoplasmic Reticulum Function and Biogenesis
The endoplasmic reticulum (ER), an extended membrane network, is the main organelle
for protein folding and secretion, lipid synthesis and lipid droplet formation and a major
store for calcium (Ca++
). The ER controls a wide range of cellular process such as
organogenesis, transcriptional activity, stress responses and apoptosis due to its many
homeostatic functions9.
Secreted and transmembranes proteins are folded and reach maturation in the ER, which
is the major gateway for the secretory pathway. The translation of proteins occurs in the
ribosomes located on the cytosolic surface of the rough ER1. The proteins in the ER
lumen or the newly synthesized, unfolded proteins being translocated into ER by Sec61
complex118
are covered with chaperones and associate with folding enzymes in the
oxidizing and Ca++
rich environment of the ER. These nascent chains become N-
glycosylated and assume their secondary and tertiary structures with the assistance of
stabilizing protein disulfide isomerase (PDI). Endoplasmic reticulum oxidoreductin 1α
and β (Ero1α and Ero1β) are responsible for the oxidation of PDI19, 113
. In the first step,
a disulfide is introduced into the substrate protein with the concomitant reduction of a
disulfide within the active site in PDI79
. Then Ero1α or Ero1β catalyzes the reoxidation
of the PDI active site in a reaction involving the reduction of oxygen to liberate
hydrogen peroxide132, 43
. In addition to these, the amino acid cis-trans isomerases, the
chaperones such as the glucose regulated protein (GRP) 94 and immunoglobulin (Ig)
heavy chain binding protein (BiP), N-glycosylation enzymes and the lectins, calnexin
- 2 -
and calreticulin; all reside in the ER and function in protein maturation. Mature proteins
that pass quality control are transferred to Golgi, while the unqualified proteins become
targets ER-associated degradation (ERAD). ER-associated degradation (ERAD)
includes a translocation into cytosol by a translocon channel for proteosomal
degradation. Recent studies show that the mammalian translocon associated proteins,
with the help of Sec 61, can bind to improperly folded proteins and accelerate their
degradation103
. The other proteins as a translocon channel are derlins 86, 87, 168, and 155
.
Taken together, ER is an important organelle for cell homeostasis and protein
metabolism.
ER is also a major store for Ca++
; the concentration of Ca++
in rested ER can reach to
three to four times higher than that in the cytosol. This difference is generated by the
sarco (endo) plasmic reticulum Ca++
ATPase (SERCA) proteins that pump the Ca++
into
ER lumen. The latter release of Ca++
is controlled by the signaling molecule, Ins (1, 4,
5) P3, and the ryanodine receptors9.
Furthermore, it was recently suggested that lipid droplet formation from ER membrane
is mediated by ER resident proteins such as calnexin and the immunoglobulin heavy
chain binding protein BiP117
. Lipid droplets are the main intracellular storage sites for
esterified fatty acids and neutral lipids such as triglycerides (TG) and cholesterol esters
(CE). While the outer layer involves amphipathic lipids such as phospholipids (PL) and
cholesterol (CL), the core is made of only neutral lipids93
. The lipid droplets provide
building blocks for biological membranes through hormone-dependent and
independent-pathways33
. The biogenesis mechanism of lipid droplets is not clear, but
data shows it is mainly derived from the ER. The ER may assume a central role in lipid
- 3 -
droplet biogenesis through its enzymes like the diacylglycerol acyltransferase 1(DGAT)
or 1-acylglycerol-3-phosphate acyltransferase (AGAT), which synthesize neutral lipids
residing on the ER membrane. Additionally, Robenek and colleagues observed that a
large portion of lipid droplets are covered by ER membranes 127
. When fatty acids
accumulate in the cell, TG is formed as a form of storing these fatty acids for future
energy and neutralization. For this purpose, three fatty acids and one glycerol molecule
are joined by enzymes resident in the ER membrane such as acyltransferases. The newly
formed TG molecules are stored in lipid droplets that are surrounded by a single PL
membrane layer and associated proteins. One hypothesis is that the lipid droplet
originates from between two membranes of the ER and moves toward the outer
cytoplasmic layer of the ER membrane via bud formation. This hypothesis could
explain why the lipid droplet is surrounded by a PL monolayer 15
. A contrasting second
theory explains that the lipid droplet occurs outside of the ER but with the ER
facilitating synthesis of the surrounding PL monolayer127
. Regardless of the model, ER
membranes and associated proteins are found to be integral components of lipid
droplets.
Another crucial function of the ER is in lipid biosynthesis; ER is a major site for the
production of phospholipids, cholesterol and ceramides96
. For example, low
intracellular cholesterol levels activate the ER resident sterol regulatory element-
binding protein (SREBP 1 and 2), a transcriptional regulator of the fatty acid and
cholesterol synthesis pathway, respectively, which works to upregulate the expression
of enzymes responsible for cholesterol synthesis. Stearoyl coenzyme A (CoA)
desaturase (SCD), which catalyzes the delta-9 desaturation of saturated free fatty acids
(FFAs) is another enzyme located on the ER membranes. Furthermore, serine

- 4 -
palmitoyltransferase, which is rate –limiting enzyme of de novo ceramide production, is
found on the ER membrane. Fatty acid elongation beyond the 16-Carbons (length of the
palmitate) produced by the cytoplasmic Fatty acid synthase (FAS) is mainly catalyzed
by enzymes such as DGATs [DAG (diacylglycerol) acyltransferases] for triacyl-
glycerols) and/or ASATs (acyl-CoA: sterol acyltransferases) for SEs (steryl esters)
associated with the ER48
. These ER enzymes lengthen not only fatty acids produced by
FAS but also the dietary polyunsaturated fatty acids. Formation of a double bond in a
fatty acid involves the following endoplasmic reticulum membrane proteins such as
desaturases, NADH-cyt b5 Reductase and Cytochrome b5.
The expansion of ER based on the increased demands on the exocytic pathway was
documented in some specialized cells including the β cells of the pancreas and
antibody-secreting plasma cells. However, the molecular mechanisms coordinating the
protein and lipid components of the ER during this process remain unclear48
. A study
conducted by Sriburi and colleagues showed that spliced XBP-1 (X box binding
protein-1) activated by UPR was enough to stimulate synthesis of phosphatidylcholine,
the primary PL of the ER membrane138
. Overexpression of the spliced XBP-1 in cells
resulted in increased membrane PLs, surface area and volume of the rough ER, and
enhanced activity of the cytidine diphosphocholine pathway of phosphatidylcholine
biosynthesis138
. This data showed that coordinating induction of phospholipid
biosynthesis with up-regulated expression of ER resident proteins allows the
mammalian UPR to both build and equip the ER, at least via XBP-1 activity. These
findings demonstrate ER plays an important role in the maintenance of its own
biogenesis.
- 5 -
The ER plays a role on insulin biosynthesis from pre-pro-insulin to pro-insulin90
. The
newly synthesized and signal tagged pre-pro-insulin in the cytoplasm is translocated
into the lumen of the ER124, 125
. After the signal peptide is cleaved in the ER by the
endopeptidase called proprotein convertase 1, pro-insulin undergoes folding process in
the ER lumen and the newly formed disulfide bonds lead to its stabilization and
bioactivity124, 125
. Then, this processed pro-insulin passes into secretory granules
through Golgi apparatus. In final step, it gets native structure and then is secreted.
1.2 Endoplasmic Reticulum Stress
1.2.1 Endoplasmic Reticulum Stress : The Causes and Consequences
The ER participates in wide range of cellular activity from protein folding, lipid
synthesis, calcium homeostasis to its own biogenesis. That’s why many factors that
negatively impact cellular homeostasis leads to ER dysfunction and stress. Protein
overload, accumulation of unfolded proteins, protein trafficking defects, chaperones
deficiency, environmental toxins, viral infections, aging and chemicals such as
tunicamycin, thapsigargin, and DTT destroy the balanced environment of the ER
leading to a unique signaling cascade emanating from the ER and known as the
accumulation of unfolded protein response (UPR) 30, 35
. Physiological and pathological
processes including aging105
, glucose deprivation, aberrant calcium regulation, viral
infection and hypoxia may alter the protein folding and cause ER stress70, 128
. In the
stressed ER, the misfolded or unfolded proteins are targeted for destruction through the
ER-associated degradation (ERAD) pathway, which leads to their translocation to the
cytosol for proteasomal degradation where they are degraded by ubiquitin-proteasome
machinery70
. Such proteins become subject to the ER quality system (ERQC), in which
molecular chaperones are the main players aiding in proper folding and evaluation of
- 6 -
protein damage30
. If the screened substrates fail to pass this quality test, they are marked
as substrates for ERAD with the help of 76 amino acid peptide- specific E3 ubiquitin
near or in ER membrane and then targeted to the proteasome, which is a multi-catalytic
protease that resides in cytoplasm. If the ER stress can not be relieved, a specific stress
response pathway, the UPR, is activated. A major function of the UPR is to combat with
the accumulation of unfolded proteins through three complementary signaling pathways
activated depending on the duration and the degree of the cellular insult. These
functions of the UPR include reducing the protein load, increasing the capacity of the
ER to handle the unfolded proteins and the decision to commit the cell to apoptotic
death. This response is made of three signaling arms each governed by a proximal stress
sensor: Inositol requiring enzyme 1 (IRE1), PKR resemble ER kinase (PERK) and
activating transcription factor 6 (ATF6).
Recent studies showed that metabolic stress during obesity leads to ER stress and
activation of the UPR especially in metabolically active sites such as liver, adipose
tissues and pancreatic cells57
. Nutrient or energy deprivation, in addition to its excess in
obesity, can lead to ER stress. How obesity leads to ER stress remains a question of
great interest. The maintenance of ER membrane function is supported by lipid
metabolism, so one possibility is that obesity-driven perturbations in lipid metabolism
can cause stress in the ER and lead to its metabolic dysfunction37
. ER stress is a marker
of early consequences of nutrient excess and a causally linked to the development of
inflammation and insulin resistance in metabolic tissues including hepatocytes,
cardiomyoblasts, pancreatic β cells and macrophages17, 18, 75, 158
. Based on its duration,
ER stress can be categorized as acute, periodic and chronic. The acute form of ER stress
can be induced experimentally through treatments of chemicals such as tunicamycin,
- 7 -
DTT, calcium ionophores, thapsigargin and high levels of lipids such as saturated fatty
acids or free cholesterol. An example of periodic ER stress is related to the rhythmic
and transient physiological changes that occur during feeding and fasting cycles17, 116
.
After each cycle, the activation of the UPR is completely restored back to the basal
levels. On the other hand, chronic ER stress indicates that the stress cannot be resolved
and is continuous due to the presence of an ER stress inducer or as part of a vicious
cycle, such as that created during obesity38
.
1.2.2 The Unfolded Protein Response
Kozutsumi and colleagues suggested for the first time that unfolded proteins can
activate a signal transduction pathway emanating from the ER78
. This study observed
that the expression of mutant influenza hemagglutinin lead to the induction of both
unfolded proteins and the expression of ER resident proteins78
. The delineation of this
signaling pathway was first depicted in yeast, Saccharomyces cerevisiae, in which a 22-
bp cis-acting element termed the UPR element was identified in the promoter of most
genes up-regulated by UPR98, 99
. The screening of the yeast mutants that induced this
UPR element helped identify an ER trans-membrane protein, IRE1p. IRE1p turned out
to be a bifunctional enzyme with both Ser/Thr kinase and endoribonuclease activities,
which cleaves a transcriptional factor HAC1, in its C terminal domain26, 98
. Originally,
the IRE1p was identified as a gene required for inositol prototrophy in S. cerevisiae and
hinting to its mammalian counterpart’s diverse functions in lipid metabolism107
. In
eukaryotic cells, ER homeostasis is controlled and communicated through the unfolded
protein response (UPR) initiated by three ER membrane associated proteins, PERK
(PKR-like eukaryotic initiation factor 2 α kinase), IRE1 (Inositol requiring enzyme 1),
and ATF 6 (activating transcriptional factor 6) (Figure 1.1). To maintain ER
- 8 -
homeostasis, these proteins keep a dynamic control over the ER chaperones-
BiP/GRP7810, 134
. However, when ER homeostasis cannot be maintained, IRE1 and
PERK are oligomerized and become fully activated to engage the downstream adaptive
or destructive signaling pathways129
. Furthermore, the ER resident transcription factor,
ATF6, translocates to the Golgi where it is cleaved by a serine protease site -1 protease
(S1P) and the metalloprotase site-2 protease (S2P) for full activation23
(Figure 1.1).
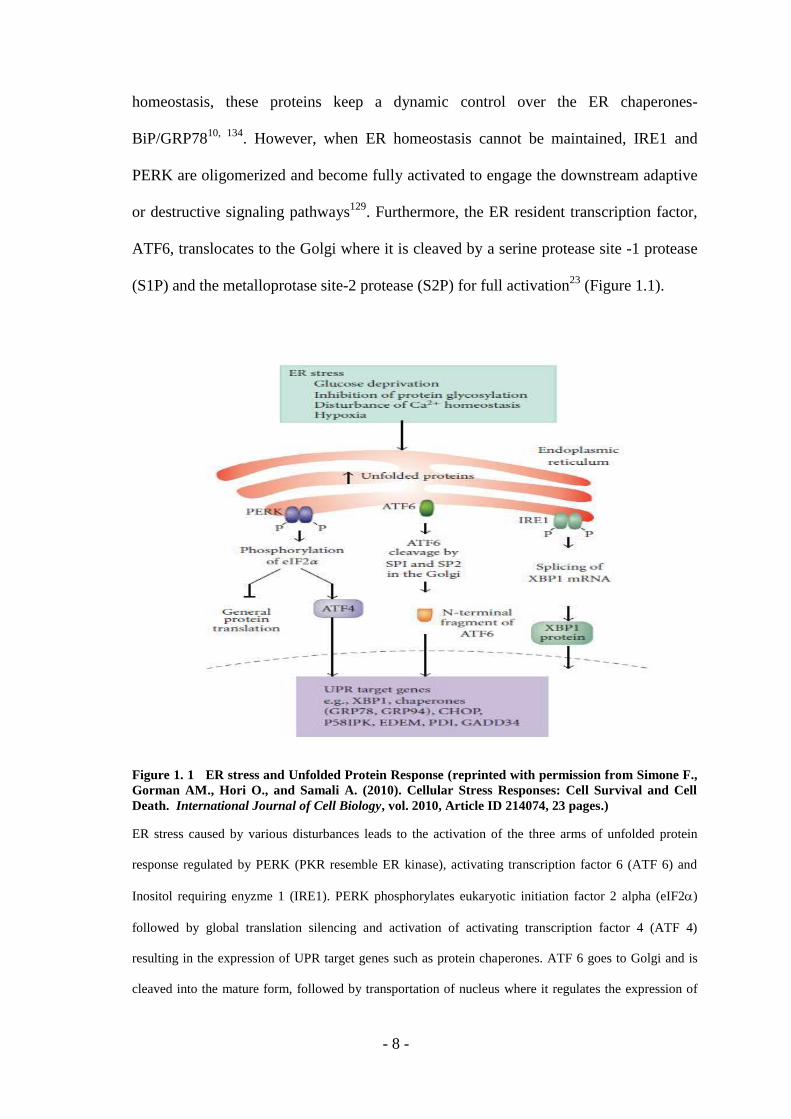
Figure 1. 1 ER stress and Unfolded Protein Response (reprinted with permission from Simone F.,
Gorman AM., Hori O., and Samali A. (2010). Cellular Stress Responses: Cell Survival and Cell
Death. International Journal of Cell Biology, vol. 2010, Article ID 214074, 23 pages.)
ER stress caused by various disturbances leads to the activation of the three arms of unfolded protein
response regulated by PERK (PKR resemble ER kinase), activating transcription factor 6 (ATF 6) and
Inositol requiring enyzme 1 (IRE1). PERK phosphorylates eukaryotic initiation factor 2 alpha (eIF2)
followed by global translation silencing and activation of activating transcription factor 4 (ATF 4)
resulting in the expression of UPR target genes such as protein chaperones. ATF 6 goes to Golgi and is
cleaved into the mature form, followed by transportation of nucleus where it regulates the expression of
- 9 -
UPR related genes. IRE1 phosphorylates itself and also catalyzes splicing of XBP-1 (X-box binding
protein 1) mRNA through its RNAase activity.
Historically, the first discovered and conserved branch of the UPR is regulated by IRE1,
which regulates the production of key ER chaperons through processing and activating
the XBP1 mRNA20, 15
. IRE1 has two homologs: IRE1α is expressed in a variety of
tissues including placenta, liver, skeletal muscle, lung and especially pancreas145
, but
IRE1β is expressed only in the intestinal epithelia145, 156
. IRE1 is activated by homo-
oligomerization followed by auto-phosphorylation of the C-terminal kinase domain at
serine 724114, 133, 159,161
. The kinase activity of IRE1 has only one known substrate, itself.
Although poorly understood, IRE1 has a unique effector function which leads to the
endonucleolytic cleavage of its main substrate: mRNA encoding a transcription factor
called HAC1 in yeast and XBP1 (X-box binding protein 1) in metazoans. IRE1’s
endonucleolytic activity cleaves 26 nucleotides from the intron of XBP1-mRNA81, 135,
171, resulting in a 41 kDA frameshift variant (sXBP1) that is an active transcription
factor. XBP-1 regulates the expression of ER chaperones and the components of ERAD
machinery92, 123
. Furthemore, XBP1 upregulates the phospholipid synthesis enzymes
leading to ER expansion, a hallmark of UPR. IRE1 also has a nonspesific RNAse
activity that degrades mRNAs localized on ER membrane, reducing the synthesis and
import of the corresponding proteins into the ER lumen53
. Additionally, XBP-1 can
upregulate the expression of P58IPK
; a member of the Hsp40 (heat shock protein 40 kD)
known as DNAJ in short name that is responsible of proper protein folding, acts as a co-
chaperones and also negatively regulates PERK activity forming one of the many
intersections between the three UPR braches167
. The IRE1 dimers also interact with
adaptor proteins such as TNF receptor-associated factor 2 (TRAF2) to induce the

- 10 -
apoptosis signal regulating kinase (ASK1) and subsequently activate the pro-apoptotic
cJUN NH2-terminal Kinase (JNK) and p38 mitogen activated kinase (p38MAPK) 149
and caspase 12 Pro-caspase 12 forms a complex with TRAF2, but with activation of ER
stress these two proteins dissociate leading to the activation of caspase 12 and resulting
in cell death169
. IRE1 can also modulate the activation of extracellular signal regulated
kinases (ERKs) and nuclear factor қB (NF-қB) pathways62, 106
via JNK-AP1 pathways
(Figure 1.2).
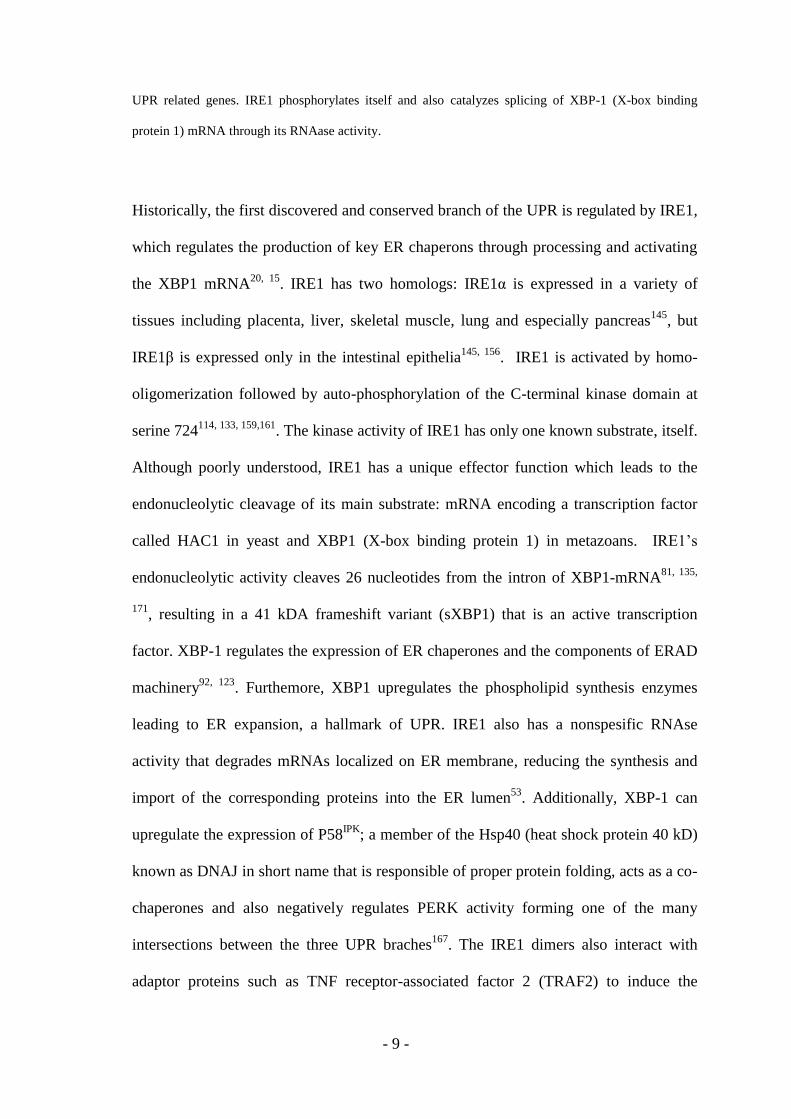
Figure 1. 2 IRE1 signaling (reprinted with permission from Ron, D., and Walter, P. (2007). Signal
integration in the endoplasmic reticulum unfolded protein response. Nat. Rev. Mol. Cell Biol. 8,
519–529. © Nature publishing Group, 2007)
While inositol requiring enzyme 1 (IRE1) is in nonoligomerization state in unstressed conditions, IRE1
oligomerizes and autophosphorylates itself in stressed conditions. Upon stress induced activation, the
RNAse activity of IRE1 cleaves X-box binding protein (XBP-1) in higher eukaryotes (HAC1
(homologous to ATF/CREB1) in yeast) into small RNA fragment encoding the active form of XBP-1
transcription factor, while unspliced XBP-1 encodes XBP1u, an inhibitor of UPR171
. This is followed by
the transcriptional upregulation of unfolded protein response (UPR) related genes. XBP-1 is also controls
ER biogenesis. Alternatively, phosphorylated IRE1 recruits TRAF2 (tumour necrosis factor receptor
(TNFR)-associated factor-2 resulting in activation of Jun N-terminal kinase (JNK) 149
and change
- 11 -
intracellular signaling such as insulin resistance109
. Additionally, the IRE1-TRAF2 complex acts on
caspase 12 activation and cell death171
. ER stress can also lead to an ER-associated degradation (ERAD)
of misfolded proteins.
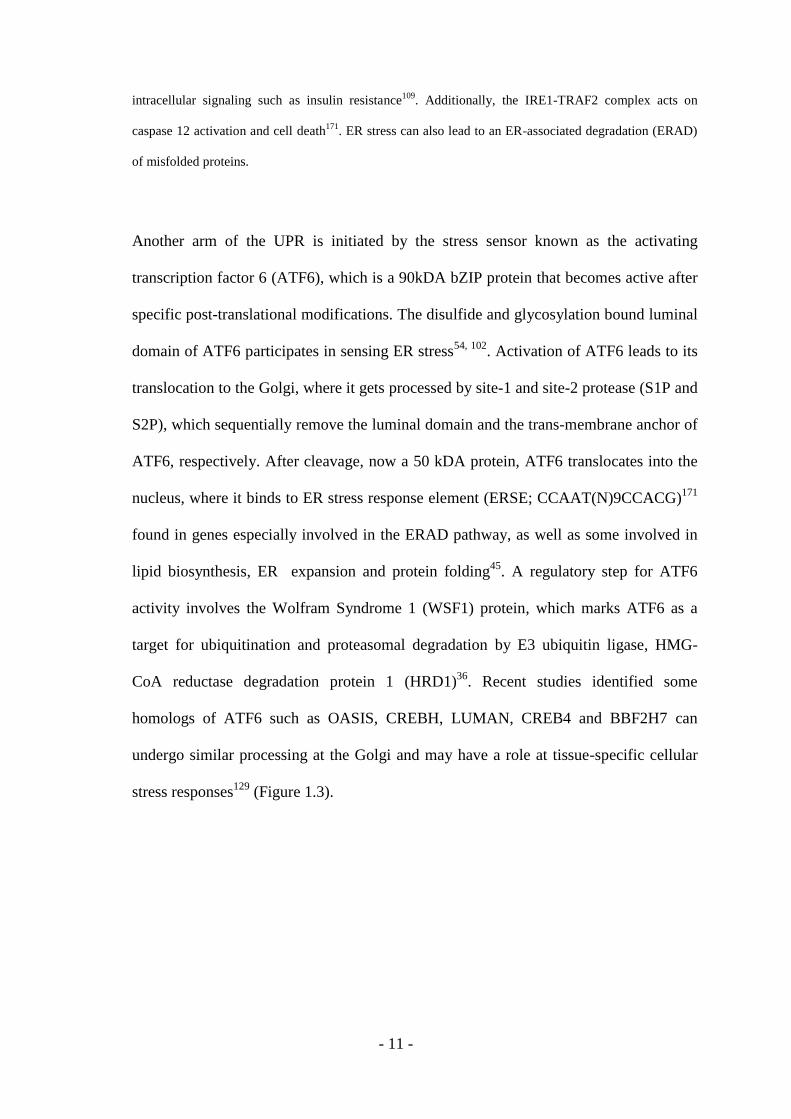
Another arm of the UPR is initiated by the stress sensor known as the activating
transcription factor 6 (ATF6), which is a 90kDA bZIP protein that becomes active after
specific post-translational modifications. The disulfide and glycosylation bound luminal
domain of ATF6 participates in sensing ER stress54, 102
. Activation of ATF6 leads to its
translocation to the Golgi, where it gets processed by site-1 and site-2 protease (S1P and
S2P), which sequentially remove the luminal domain and the trans-membrane anchor of
ATF6, respectively. After cleavage, now a 50 kDA protein, ATF6 translocates into the
nucleus, where it binds to ER stress response element (ERSE; CCAAT(N)9CCACG)171
found in genes especially involved in the ERAD pathway, as well as some involved in
lipid biosynthesis, ER expansion and protein folding45
. A regulatory step for ATF6
activity involves the Wolfram Syndrome 1 (WSF1) protein, which marks ATF6 as a
target for ubiquitination and proteasomal degradation by E3 ubiquitin ligase, HMG-
CoA reductase degradation protein 1 (HRD1)36
. Recent studies identified some
homologs of ATF6 such as OASIS, CREBH, LUMAN, CREB4 and BBF2H7 can
undergo similar processing at the Golgi and may have a role at tissue-specific cellular
stress responses129
(Figure 1.3).
- 12 -
Figure 1. 3 ATF6 signaling (reprinted with permission from Ron, D., and Walter, P. (2007). Signal
integration in the endoplasmic reticulum unfolded protein response. Nat. Rev. Mol. Cell Biol. 8,
519–529. © Nature publishing Group, 2007).
In unstressed conditions, activating transcription factor 6 (ATF6) and cylic AMP response element
binding protein hepatocyte (CREBH) are located in the ER. Also, ATF6 is tethered to the ER by an ER
chaperone immunoglobulin –binding protein (BiP) found in the lumenal domain of ER membrane. In
stressed conditions, both ATF6 and CREBH translocate to the Golgi apparatus with the help of unknown
vesicular transport system and are cleaved by first the lumenal site-1 protease and then the intra-
membrane site 2 protease. After this activating cleavage, both proteins move to the nucleus, where ATF 6
activates UPR target genes and CREBH activates acute phase genes.
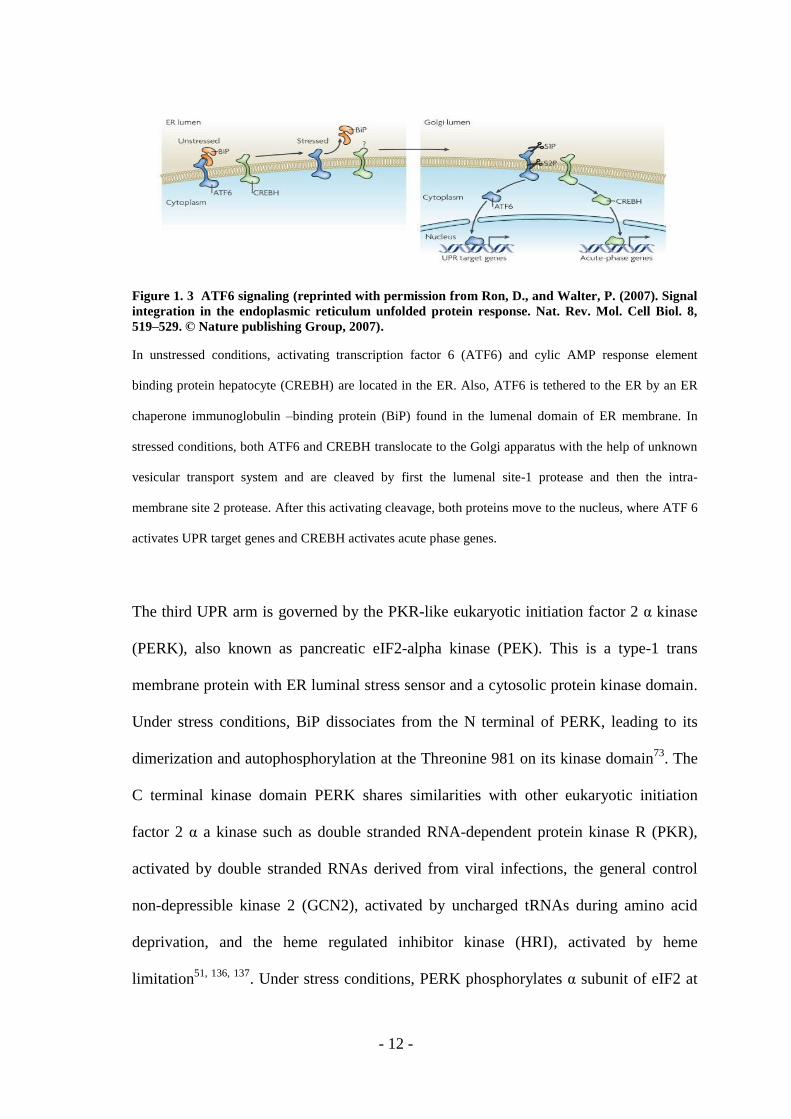
The third UPR arm is governed by the PKR-like eukaryotic initiation factor 2 α kinase
(PERK), also known as pancreatic eIF2-alpha kinase (PEK). This is a type-1 trans
membrane protein with ER luminal stress sensor and a cytosolic protein kinase domain.
Under stress conditions, BiP dissociates from the N terminal of PERK, leading to its
dimerization and autophosphorylation at the Threonine 981 on its kinase domain73
. The
C terminal kinase domain PERK shares similarities with other eukaryotic initiation
factor 2 α a kinase such as double stranded RNA-dependent protein kinase R (PKR),
activated by double stranded RNAs derived from viral infections, the general control
non-depressible kinase 2 (GCN2), activated by uncharged tRNAs during amino acid
deprivation, and the heme regulated inhibitor kinase (HRI), activated by heme
limitation51, 136, 137
. Under stress conditions, PERK phosphorylates α subunit of eIF2 at
- 13 -
serine 5152
. The eIF2α is a heterodimer protein that is required for the transport of the
initiating protein methoinyl-transfer RNA (met-tRNA) to the ribosome. Under stress
conditions, PERK phosphorylates eIF2α, which inhibits translation initiation70, 52
. PERK
activity also stimulates some stress induced genes including the activating transcription
factor-4 (ATF-4), the nuclear erythroid 2 p45-related factor 2 (Nrf-2)27
and nuclear
factor kappa β (NF-қB) 28
. ATF-4 regulates the expression of genes involved in amino
acid import, glutathione biosynthesis, resistance to oxidative stress50
as well as the pro-
apoptotic genes such as the CCAAT/enhancer binding protein (C/EBP) homologous
protein (CHOP) and activating transcription factor-3 (ATF 3) 90, 65, 119
. PERK dependent
phosphorylation of the Nuclear factor eryhthroid-2-related factor-2) Nrf2/Keap1 (Kelch-
like ECH-associated Protein 1) complexes leads to dissociation of this complex
followed by Nrf2’s import into the nucleus27
. The dephosphorylation of eIF2α is
mediated by the growth arrest and DNA damage inducible gene (GADD34) interacting
with catalytic subunit of protein phosphatase (PP) 1108
(Figure 1.4). Additionally, P58IPK
that is induced by the activation of ATF6 binds to the cytosolic kinase domain of PERK
and represses its activity151, 167
. Interestingly, P58PIK
expression occurs several hours
after PERK activation and eIF2α phosphorylation. Thus, P58IPK
induction may be
thought as a marking the end of UPR and the beginning of the alarm/apoptosis phase of
response140
since at this point, if the ER stress can be handled, ER returns to normal
function and the cell survives; but if the stress keeps going on, the blocking of the
translational suppression by P58IPK might lead to apoptosis140
- 14 -
Figure 1. 4 PERK signaling pathway (reprinted with permission from Ron, D., and Walter, P.
(2007). Signal integration in the endoplasmic reticulum unfolded protein response. Nat. Rev. Mol.
Cell Biol. 8, 519–529. © Nature publishing Group, 2007)
Under stress conditions, protein kinase RNA (PKR) - like ER kinase (PERK) is activated, resulting in the
phosphorylation of eukaryotic initiation factor 2 alpha (eIF2alpha) followed by general translation
inhibition but selective translational activation of several UPR related genes. eIF2alpha can also be
phosphorylated by other kinases including protein kine RNA (PKR), heme regulated inhibitor kinase
(HRI) and general control non-derepressible-2 (GCN2) in an independent manner from ER stress. Hence,
the larger stress response to a multitude of cellular insults and that includes the UPR is known as the
integrated stress response (ISR).
1.2.3 The Adaptive and Destructive Outcomes of the Unfolded Protein Response
UPR response involves three phases: adaptation, alarm and apoptosis (Figure 1.5). In
the adaptation phase, UPR tries to re-establish homeostasis in cells by upregulating the
expression of chaperone proteins that aid in protein folding. While the unfolded proteins
degradation increases, global translation is attenuated in order to reduce the build up of
further misfolded proteins in the ER. If this stage fails, UPR stimulates an alarm phase,
- 15 -
followed by the execution of the apoptosis program122
. The alarm phase includes several
signal transduction events, leading to the suppression of the expression and activity of
pro-survival factors such as the B-cell lymphoma (Bcl2) protein. Beyond this stage, the
stressed cell will undergo apoptosis. In addition ER stress can induce autophagy8, 39, 61,
69, 77, 111, and 170. This fate decision from survival to death can be due to unresolved stress
and incomplete recovery from the accumulation of misfolded proteins in the ER, ER
Ca++
depletion, hampered disulfide formation and perturbed in redox state. All these
stressors result in ER dysfunction and when prolonged, in apoptosis through the up
regulation of the pro-apoptototic CCAAT/enhancer binding protein (CHOP), activation
of JNK kinase and caspase 12 and via the interaction of IRE1 with other ER-localized
pro-apoptotic B-cell lymphoma 2 (Bcl-2) family proteins141
. However, the decision
from survival to death in UPR may change from cell to cell since UPR is cell
autonomous and context-dependent47
. As an example, salubrinal, an inhibitor of eIF2α
de-phosphorylation, protects pheochromocytoma cells from ER stress whereas it
induces apoptosis in pancreatic β cells and renders them sensitive to free fatty acids25, 80
.
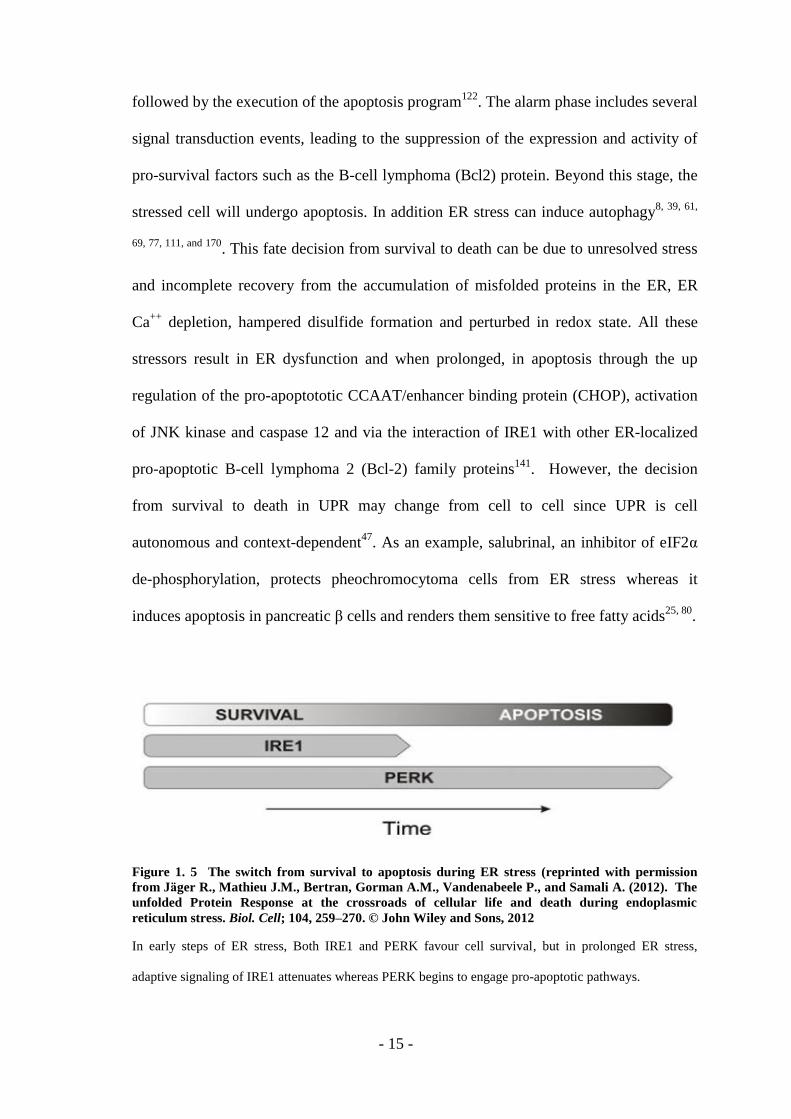
Figure 1. 5 The switch from survival to apoptosis during ER stress (reprinted with permission
from Jӓger R., Mathieu J.M., Bertran, Gorman A.M., Vandenabeele P., and Samali A. (2012). The
unfolded Protein Response at the crossroads of cellular life and death during endoplasmic
reticulum stress. Biol. Cell; 104, 259–270. © John Wiley and Sons, 2012
In early steps of ER stress, Both IRE1 and PERK favour cell survival, but in prolonged ER stress,
adaptive signaling of IRE1 attenuates whereas PERK begins to engage pro-apoptotic pathways.
- 16 -
1.3 The Interface Between ER Stress And Inflammation
Recent studies have shown that the UPR may be linked to inflammatory signaling
cascades and stress signaling pathways through multiple scenarios including activation
of JNK and NF-қB pathways28, 62
, the production of ROS and the generation of nitric
oxide resulting in both ER stress and inflammation27, 42
. These pathways also have a
central role in obesity-induced inflammation and metabolic abnormalities, especially in
abnormal insulin action56
.
IRE1 is required for the ER stress induced activation of JNK, which regulates many
inflammatory genes149
. Earlier studies showed that pro-inflammatory cytokines such as
TNF-alpha, IL6 and MCP-1 are suppressed in the absence of JNK in
cells and tissues,
and that chronic JNK activation contributes to insulin resistance and type 2 diabetes55,
146 and 150.
Other mechanism that leads to inflammation involves NF-қB-IKK activation by both
IRE1α, through the interaction of TRAF2 (TNF receptor-associated factor 2) and
apoptosis signal-regulating kinase 1 (ASK1), which, in turn, causes the phosphorylation
and activation of JNK. This active JNK phosphorylates and induces the activity of
transcription factor activator protein 1 (AP-1), which leads to the expression of
inflammatory genes. Additionally, AP-1 recruits IқB kinase (IKK) causing release of
NFқB and so promotes NFқB mediated inflammation. Moreover, PERK via PERK
eIF2α mediated translation suppression of IқB can directly stimulate NFқB (negatively
regulating nuclear factor-қB) activation. This activation results in increase in the ratio of
NFқB to IқB, thereby allowing the excess NFқB to enter the nucleus to trigger
- 17 -
expression of inflammatory cytokines28, 62, and 138
. Furthermore, recent studies also link
the ATF6-regulated branch of UPR to NF-қB-IKK signaling, suggesting specific
inflammatory signals may be induced through all three branches of the UPR166
. Some
studies in cellular systems report that experimental induction of UPR via free
cholesterol or high amounts of free fatty acids68
may cause increased expression of pro-
inflammatory molecules such as IL-8, IL-6, MCP-1 and TNFalpha82
.
Another mechanism that ER stress may be linked to inflammation involves the
transcription factor cyclic-AMP-responsive-element-binding protein H (CREBH),
which also resides on the ER membrane and stimulates the production of acute phase
response genes in the liver such as C reactive protein (CRP) and serum amyloid P-
component (SAP) 174
. CREBH and CHOP also may play an important role in the
regulation of peptide hormone hepcidin, which may present a link between iron
metabolism and inflammatory output via ER152
. However, these interactions between
ER stress and inflammation are not unidirectional, because recent studies in the brain
provided proof that both ER stress and inflammation can activate each other, while
inhibiting normal cellular metabolism174
. In this particular study, activation of IKK-β
led to ER stress and the activation of ER stress induced IKK-β.
More recently it was discovered that double stranded RNA-dependent protein kinase
(PKR), which is another eIF2α kinase that is homologous to PERK, plays a unique role
in linking over-nutrition to ER stress and inflammation in metabolic diseases104
. Here,
PKR was activated by lipids and was shown to have a central role in the activation of
JNK and inflammatory responses during obesity. Moreover, PKR directly blocked
insulin action via phosphorylating insulin receptor substrate-1 (IRS1). It is speculated
- 18 -
that PKR could assemble a putative metabolically-activated inflammatory complex
called metabolic inflammasome or “metaflammasome” that integrates insulin action,
pathogen responses and nutrient sensing. This scaffold may explain the functional
overlap and between multiple signaling pathways, metabolic, stress and inflammatory,
in modulating metabolism. Moreover, Baltzis et al. observed that PERK deficient
mouse embryonic fibroblasts (MEF), which display much higher levels of vesicular
stomatitis virus replication than that in the wild type MEFs, also exhibited partial PKR
activation, suggesting a cross talk may occur between PKR and PERK5.
The interactions between ER stress and inflammation also involves oxidative stress
caused by a toxic accumulation of ROS in the cells27
. This can be due to protein
chaperones uplegulated by UPR involving in disulfide bond formation in ER. Ero1p an
essential for respiration and vegetative growth 2 (Erv2p), two enzymes responsible for
disulfide bond formation, utilize oxidation/reduction reactions for reducing molecular
oxygen. This reduced molecular oxygen also accumulates during increased improper
protein folding in ER stress and is toxic to cells49
. This increase in ROS levels due to
UPR occurs through PERK mediated activation of antioxidant program with the help of
transcriptional factor Nrf2 to neutralize the toxic effects of ROS. Hence, PERK to Nrf2
signaling may be another potential link between inflammation and ER stress.
Moreover, nitric oxide (NO) generation may be related to ER stress such that NO-
induced S-nitrosylation of PDI, which catalyzes the thiol-disulphide exchange by
facilitating disulphide bond formation and rearrangement reactions, inhibits its
enzymatic activity and leads to the accumulation of polyubiquitinated proteins and
activation of the UPR147
. ER stress also can induce iNOS via activation of pro-
- 19 -
inflammatory responses through NKқβ activation165
. However, the ER molecules that
have direct effect on iNOS activation still remain unknown.
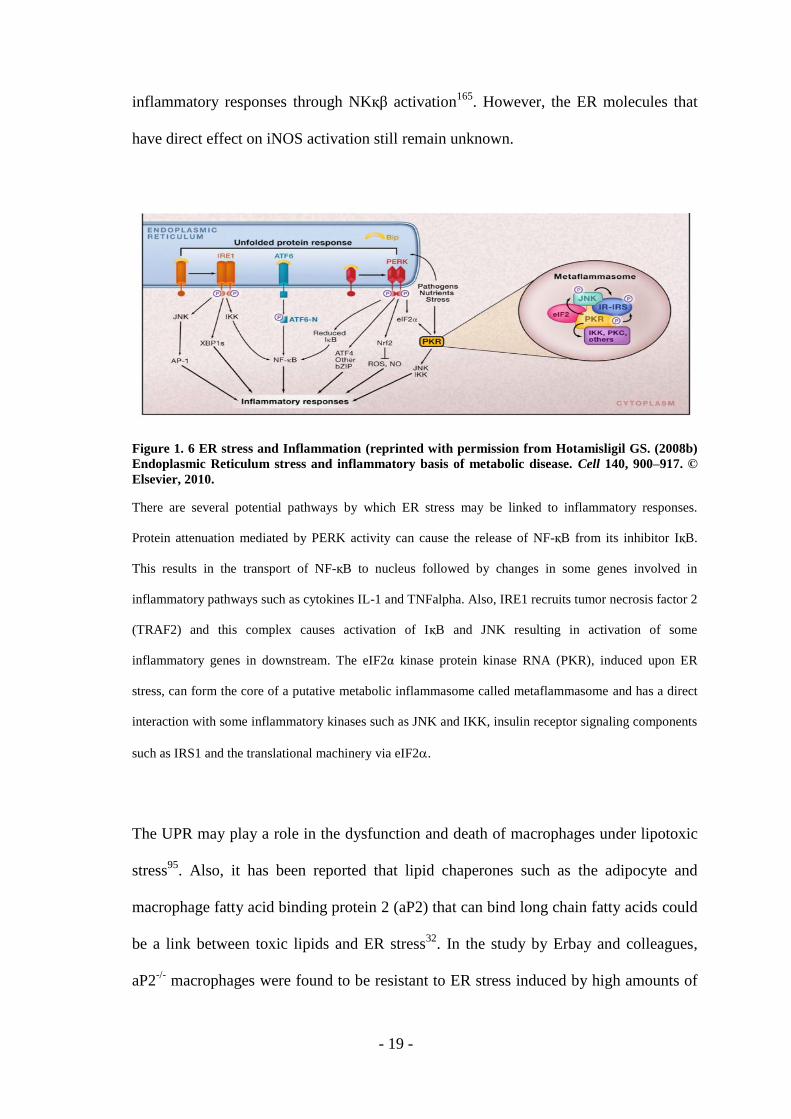
Figure 1. 6 ER stress and Inflammation (reprinted with permission from Hotamisligil GS. (2008b)
Endoplasmic Reticulum stress and inflammatory basis of metabolic disease. Cell 140, 900–917. ©
Elsevier, 2010.
There are several potential pathways by which ER stress may be linked to inflammatory responses.
Protein attenuation mediated by PERK activity can cause the release of NF-қB from its inhibitor IқB.
This results in the transport of NF-қB to nucleus followed by changes in some genes involved in
inflammatory pathways such as cytokines IL-1 and TNFalpha. Also, IRE1 recruits tumor necrosis factor 2
(TRAF2) and this complex causes activation of IқB and JNK resulting in activation of some
inflammatory genes in downstream. The eIF2α kinase protein kinase RNA (PKR), induced upon ER
stress, can form the core of a putative metabolic inflammasome called metaflammasome and has a direct
interaction with some inflammatory kinases such as JNK and IKK, insulin receptor signaling components
such as IRS1 and the translational machinery via eIF2.
The UPR may play a role in the dysfunction and death of macrophages under lipotoxic
stress95
. Also, it has been reported that lipid chaperones such as the adipocyte and
macrophage fatty acid binding protein 2 (aP2) that can bind long chain fatty acids could
be a link between toxic lipids and ER stress32
. In the study by Erbay and colleagues,
aP2-/-
macrophages were found to be resistant to ER stress induced by high amounts of
- 20 -
saturated fatty acids and the lipid-induced toxicity was mediated by the aP2 protein.
Lipotoxicity of immune cells such as macrophages is one of the critical features of
obesity and atherosclerosis suggesting that the action of the lipid chaperones in
controlling lipid-induced ER stress could be therapeutically targeted to treat these
diseases and their complications32, 91
. To this date, the precise molecular links between
ER stress and inflammation and how ER stress in immune cells alters the progress of
chronic metabolic diseases is not fully understood (Figure 1.6).
1.4 ER Stress And Inflammation In Cardiometabolic Syndrome
Myocardial infarction and stroke are two consequences of the atherosclerotic disease
and the leading cause of mortality and morbidity worldwide. Even though there have
been important advances to understanding the pathogenic mechanisms underlying these
metabolic diseases, due to very limited preventive and therapeutic strategies they still
account for one third of all deaths annually. The signaling pathways that lie at the
interface of chronic inflammation and nutrient metabolism strongly influence these
chronic diseases as well as obesity, insulin resistance and type 2 diabetes59
.
Atherogenesis is triggered with the subendothelial retention of apolipoprotein (apo) B-
containing lipoproteins in focal areas of the arterial subendothelium162, 142
. A series of
maladaptive inflammatory responses are triggered against oxidized or alternatively
modified lipoproteins162, 142, 89, 84 and 40
. Blood-borne monocytes are attracted to focal
sites of activated endothelial cells (ECs) overlying areas of lipoprotein retention,
followed by monocyte differentiation into macrophages. The recruited macrophages
ingest these modified lipoproteins, convert to foam cells, and are of pro-inflammatory
nature89, 40, 41 and 84
.
- 21 -
In most lesions, the detrimental clinical results of atherosclerosis are prevented by
several adaptive processes: The remodeling of the vessel wall maintains the patency of
the arterial lumen. The phagocytic clearance (“efferocytosis”) of dead cells, mostly
apoptotic macrophages, prevents plaque necrosis. The scar formation by collagen-
producing intimal smooth muscle cells (myofibroblasts) helps to defend against matrix
protease–mediated erosion or rupture of the intima into the lumen. Despite all these
measures, a minority of these lesions progress due to increased lesional macrophage
apoptosis, defective efferocytosis, and death of collagen producing intimal smooth
muscle cells. These plaques erode or rupture, leading to the exposure of the blood to
coagulation and thrombotic factors released from the necrotic lesions and acute lumenal
thrombosis 7, 83,
143 and 154
. Studies conducted in animal models of atherosclerosis and,
most importantly, through the analysis of human atherosclerotic lesions, support ER
stress occurs in atherosclerotic plaques, particularly in the advanced stages of the
disease leading to acute thrombosis101
. ER stress occurs in lipid-laden macrophages at
all stages of the disease34, 101 and 175
. In Miyoishi and colleagues’ study human coronary
artery lesions from autopsy samples and fresh human carotid endarterectomy specimens
were examined in terms of lesion stage, UPR markers, and apoptosis, revealing a
striking relationship among advanced lesion stage, CHOP expression, and lesional
apoptosis101
.
The possible connection between endoplasmic reticulum stress and metabolic disorders
such as obesity, diabetes and atherosclerosis may occur through several ways. First,
there is a direct relation between lipid metabolism and ER stress, including the
existence of lipogenic enzymes in ER domains. Furthermore, XBP1 plays a role in ER
phosphatidylcholine synthesis and ER membrane expansion139
. Multiple studies also
- 22 -
show that ER stress promotes lipogenesis and hepatic lipid accumulation, but how the
individual UPR branches plays a role in this remains unclear59
. Second, ER stress leads
to abnormal insulin action and hyperglycemia by causing insulin resistance, stimulation
of hepatic glucose production and suppression of glucose disposal. Studies show ER
stress is a potential link between obesity, type 2 diabetes and atherosclerosis121
.
Moreover, ER stress may lead to the production of inflammatory mediators and reactive
oxygen species, which are destructive for insulin action, lipid metabolism and glucose
homeostasis60
.
It is known that primary macrophages play an important role in the progress of
atherosclerosis97
. Hence, the studies on the role of ER stress in macrophages may
provide clues to ER stress contribution to atherosclerosis. ER stress can be induced by
excess accumulation of free cholesterol, resulting with cell death in macrophages. The
overload of fatty acid leads to their accumulation and stiffening of ER membranes,
which are known to be poor in cholesterol content. Consequently, the stiffening of ER
membranes activates the UPR and the PERK-mediated CHOP activation leads to
apoptosis34
.
Recently, it has been reported that obesity and insulin resistance may stimulate ER
stress in lesion macrophages due to elevations of saturated fatty acids (SFAs) 32, 131
.
SFAs cause the loss of fluidity of the ER membrane bilayer, which is a known inducer
of the UPR. However, the exact mechanism of SFA-induced ER stress is not fully
understood. Erbay and colleagues demonstrated that intracellular lipid chaperones (or
macrophage/adipoctye fatty acid-binding protein-4, aP2) mediates SFA- induced ER
stress and apoptosis in macrophages. In this study, ApoE-/-
( apolipoprotein E) mouse
- 23 -
model fed by Western diet, when genetically deficient for aP2 were found to be
protected against lipid induced PERK activation, XBP-1 splicing and apoptosis in
macrophage-rich regions of atherosclerotic lesions. These results implicated aP2 as a
central mediator of lipotoxic ER stress in macrophages during atherogenesis.
Furthermore, reduction of ER stress by chemical chaperons reduced atherosclerosis in
mice32
. Collectively; the described findings show the important contribution of lipid-
induced ER stress to atherosclerosis progression and offer new insights into metabolic
disease pathogenesis.
1.5 Restoring ER Stress
Restoring ER function may become a promising future therapeutic strategy against
metabolic diseases including insulin resistance, diabetes, fatty liver disease, obesity and
atherosclerosis. For example, Qi et al. (2004) 120
and Vilatabo et al. (2005) 153
observed
that 4-phenylbutyric acid (PBA), which is known as a chemical chaperon, has protective
effects against cerebral ischemia and liver ischemia reperfusion injury by inhibiting ER-
stress- related apoptosis. Another reagent tauroursodeoxycholic acid (TUDCA), a
hydrophilic endogenous bile acid, also prevented diet-induced ER stress and ER-stress
associated apoptosis in human liver cells through unknown mechanisms31
. Additional
studies in obese and diabetic mouse models showed that the administration of TUDCA
and PBA can reduce ER stress, normalize hyperglycemia, increase systemic insulin
sensitivity, resolve the fatty liver disease and enhanced insulin action in liver, muscle
and adipose tissues110
. Furthermore, administration of PBA to Apolipoprotein E null
(ApoE−/−) mice with atherosclerosis exhibit ER stress and UPR activation in the
lesions175
resulted in a dose-dependent reduction ER stress in macrophages and
atherosclerotic lesions32
. In this study, the ER stress markers phosphorylated-eIF2α,
- 24 -
phosphorylated-PERK and ATF3 expression were significantly reduced in the
atherosclerotic lesions of mice treated with PBA, suggesting restoring ER function with
chemical chaperone and reducing ER stress and death of macrophages in lesions can
protect against the deleterious effects of toxic lipids and prevent atherosclerosis32
.
Additionally, it was also observed that gastric bypass induced weight loss results in the
reduction of the ER stress markers, GRP78, sXBP1, phosphorylated-eIF2α and JNK-1
in the liver samples of these patients43
. These observations indicate reduction in nutrient
intake and in adipose tissue size may reduce the ER stress levels in metabolically active
tissues in humans. Furthermore, a study conducted by Diakogiannaki showed that the
administration of a monounsaturated fatty acid palmitoleate for 18 hrs., reduced ER
stress induced by both a saturated fatty acid palmitate and also tunicamycin (a chemical
stressor of the ER by blocking N glycosylation) in β cells29
. When the two species of
fatty acid palmitate and palmitoleate were given in combination, the extent of cell
damage was less than that when palmitate was applied alone. In fact, examination of
multiple images showed that the overall ER membrane area was reduced in palmitate
and palmitoleate administration compared with in only palmitate administration;
suggesting that mono unsaturated fatty acids entering membrane lipids is less
destructive to membrane architecture than when saturated molecules exist29
.
The possibility of applying these chemical chaperones to restore ER function and reduce
ER stress in human metabolic diseases still remains to be fully explored. However, new
studies are appearing with promising results. For instance, a study conducted by Kars et
al. in 2010 displays TUDCA-stimulated increase in the muscle and hepatic insulin
sensitivity of obese and insulin resistant patients71
.
- 25 -
1.6 Chemical Genetics And Its Applications
Advances in high throughput chemistry and genetics have created a new field dubbed
“chemical genetics”, which generates tools that can help elucidate and validate novel
drug targets. This approach can also be successfully applied to deciphering signal
transduction cascades, particularly, in discovering novel substrates of kinases74
.
The traditional genetics approach can examine the function of a single protein at the
level of the organism, a major reason why knock out mice have become popular tools
for target analyses. However, this approach has some disadvantages. For example,
genetic approach knocks out a specific gene without discriminate against the other
proteins that associated with the targeted protein or in other words, leading to the
disassembly of associating proteins in a protein complex (for instance, the targeted gene
may be an important scaffold in a complex) or abolish an enzymatic function of the
targeted protein. This unwanted effect renders it difficult to determine the direct and
indirect effects of the gene knock-out approach. Second, the genetic approach lacks
temporal control over the targeted protein. While, inducible knock outs and RNA based
approaches (such as antisense and RNAi) have been devised, these lead to a slow
change in protein activity compared to quick signaling responses that normally take
place in cells. In addition, Causton et al. in 2001 showed that a temporal shift in yeast
(from 25 oC and 37
oC) leads to significant differences in genome expression
22. This
study indicates that conditional or inducible systems such as temperature sensitive
alleles may cause secondary perturbations with unwanted side effects. Finally, some
genes, which play significant roles in embryonic development result in lethal phenotype
making these genetic models inapplicable, particularly valid for knockout mice63
.
- 26 -
Because of these and other reasons, genetic approach can fall short in analyzing
processes such as signal transduction.
In addition to these, purely chemical approaches for studying protein function have their
own shortcomings. Even though chemicals are useful tools for analyzing functions of a
protein in a temporal manner, they can lack target specificity. Therefore, with this
approach, determination of individual target’s direct actions and biological role can be
difficult. In addition, these “off targets” can be the major cause for toxicity.
In summary, the genetics approach provides target specificity while chemistry allows
for temporal control over the function of the targeted protein. The chemical genetics
approach combines the specificity of genetics with pharmacologically relevance and
control of small molecule chemistry2. Therefore, combining these two experimental
approaches into one by means of chemical genetics offers great advantages in validating
targets and in drug discovery in the post genomic area.
Protein kinases represent approximately 2% of all human genes and play important
roles in cellular process and consequently, in many diseases processes. Therefore, they
offer a rich source of drug targets. The recent application of the chemical genetics
approach to protein kinases involves the discovery of analog sensitive alleles (ASKAs)
and corresponding small molecule analog compounds that can specifically modulate
ASKA’s activity13
. The main feature of this approach is the creation of unique structural
distinction between the catalytic domains of one kinase. This distinction is achieved by
making a mutation in ATP binding pocket of the kinase that enlarges it: All proteins
contain bulky amino acid residues at conserved positions in ATP-binding pocket called
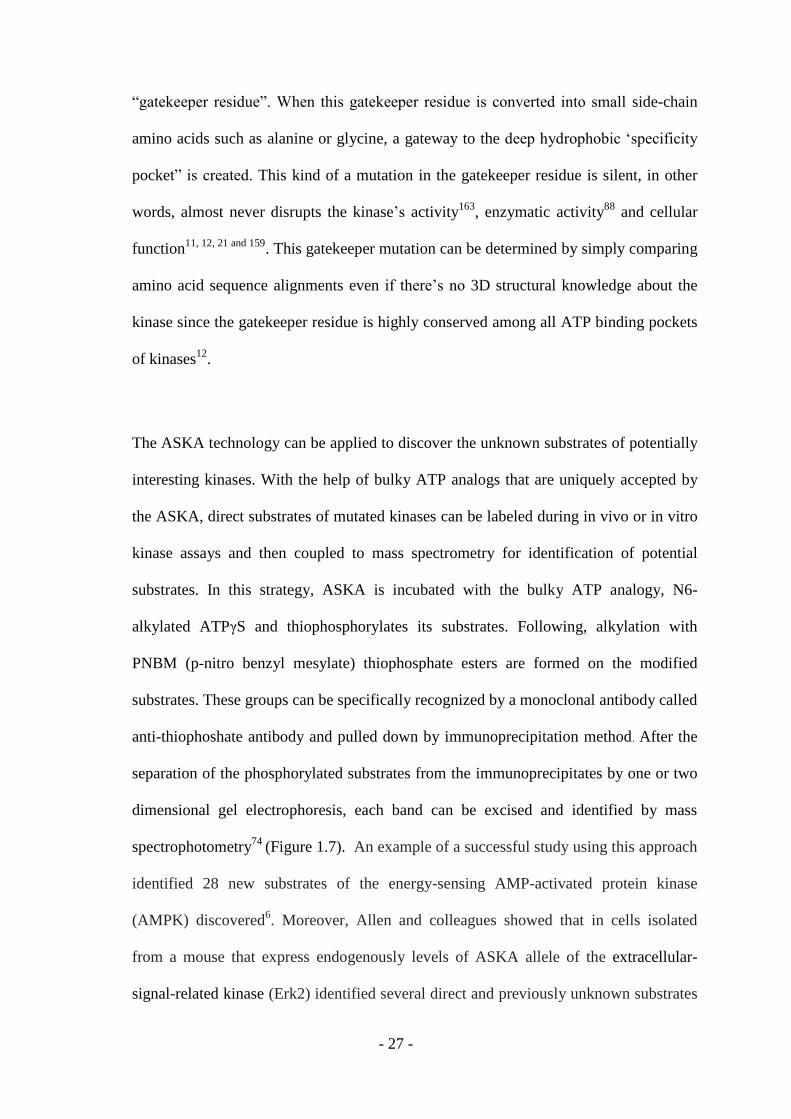
- 27 -
“gatekeeper residue”. When this gatekeeper residue is converted into small side-chain
amino acids such as alanine or glycine, a gateway to the deep hydrophobic ‘specificity
pocket” is created. This kind of a mutation in the gatekeeper residue is silent, in other
words, almost never disrupts the kinase’s activity163
, enzymatic activity88
and cellular
function11, 12, 21 and 159
. This gatekeeper mutation can be determined by simply comparing
amino acid sequence alignments even if there’s no 3D structural knowledge about the
kinase since the gatekeeper residue is highly conserved among all ATP binding pockets
of kinases12
.
The ASKA technology can be applied to discover the unknown substrates of potentially
interesting kinases. With the help of bulky ATP analogs that are uniquely accepted by
the ASKA, direct substrates of mutated kinases can be labeled during in vivo or in vitro
kinase assays and then coupled to mass spectrometry for identification of potential
substrates. In this strategy, ASKA is incubated with the bulky ATP analogy, N6-
alkylated ATPγS and thiophosphorylates its substrates. Following, alkylation with
PNBM (p-nitro benzyl mesylate) thiophosphate esters are formed on the modified
substrates. These groups can be specifically recognized by a monoclonal antibody called
anti-thiophoshate antibody and pulled down by immunoprecipitation method. After the
separation of the phosphorylated substrates from the immunoprecipitates by one or two
dimensional gel electrophoresis, each band can be excised and identified by mass
spectrophotometry74
(Figure 1.7). An example of a successful study using this approach
identified 28 new substrates of the energy-sensing AMP-activated protein kinase
(AMPK) discovered6. Moreover, Allen and colleagues showed that in cells isolated
from a mouse that express endogenously levels of ASKA allele of the extracellular-
signal-related kinase (Erk2) identified several direct and previously unknown substrates
- 28 -
of Erk22. Furthermore, Ultanir et al. in 2012 used this method and found 5 putative
substrates of the nuclear Dbf2-related kinase (NDR1) that plays an important role in
polarized growth and control of dentrite growth and morphology148
.
Figure 1. 7 Strategy for labeling individual kinase substrates and identification of direct substrates
via ASKA approach. ( reprinted with permission from Allen JJ., Li M., Brinkworth CS., Paulson
JL., Wang D., Hübner A., Chou WH., Davis RJ., Burlingame AL., Messing RO, Katayama CD.,
Hedrick SM, Shokat K.M. (2007). A semisynthetic epitope for kinase substrates. Nat
Methods.Jun;4(6):511-6.© Nature Publishing Group, 2007.
In first step analog sensitive kinase uses N6-alkylated ATPγS (A*TPγS) to form thiophosphorylates on its
substrates. Next, PNBM alkylates these substrates resulting in thiophosphate esters or thioesters that is
recognized by a specific antibody, α-hapten-IgG and pulled down by immunoprecipitation technique.
After these steps, the potential substrates from the immunoprecipitates can be analyzed by mass
spectrophotometry.
The ASKA strategy can be applied to in cells or in vivo mouse models for
pharmacologically relevant target validation. In this strategy, wild type kinase is
replaced by its ASKA counterpart with the help of gene targeting in embryonic stem
cells. The resultant transgenic mice can be used either directly in various chemically
induced disease models or by mating to suitable disease model strains. Potent, specific
kinase inhibition can be achieved by the intraperitoneal injection of orthoganal inhibitor
that inhibits only the ASKA and not the wild type kinases74
(Figure 1.8). In 2005, Chen

- 29 -
and colleagues23
used this approach to study neurotrophin signaling, where they
reported in vivo administration of an ATP analog inhibitor, 1NM-PP1, (by
intraperiotenal injection or in the drinking water) only inhibited the ASKA allele of the
kinase of interest, leading to the elimination of specific populations of neurons in the
chemical-genetic mouse model but not in their wild type littermates. Wang et al. in
2003157
also used this approach to control CaMKII-mediated synaptic plasticity in the
forebrain during distinct stages of memory processes157
.
Figure 1. 8 ASKA mouse studies: target validation, therapeutic index and biomarkers (reprinted
with permission from Kevan Shokat and Mark Velleca (2002). Novel chemical genetics approaches
to the discovery of signal gtransduction inhibitors. Drug Discov Today.Aug 15; 7(16):872-9. ©
Elsevier, 2002.
Analog sensitive kinase alleles (ASKA) mouse studies for drug screens, the discovery of biomarkers and
new targets. Wild type kinase mouse strains can be changed by ASKA counterpart by use of transgenic
approaches or gene targeting in embryonic stem cells. These mouse strains can be useful in direct use or

- 30 -
in the mate of disease model strains. The bulky ATP analog inhibitors specific to ASKA may be applied
to mouse models by intra-peritoneal injection.
The other applications of chemical-genetics include genomic profiling using
microarrays to define the impact of this kind of highly specific drug-mediated kinase
inhibition on gene expression. Importantly, two studies12, 21
demonstrated the blueprints
of their targeted kinases differed significantly from those generated by knockdown or
knockout technologies against the same kinase. For example, the study conducted by
Carroll and colleagues showed that a novel role for Pho85 cyclin dependent kinase in a
metabolic pathway, that could only be revealed by acute chemical inhibition of ASKA
and has been missed in studies using the knock out approach against the same kinase21
.
A final application of chemical genetics involves the carrying out genomic profiling in
high throughput and high content drug screens in preclinical in vivo models using the
chemical-genetic inhibition as a reference to establish a therapeutic index and generate
new biomarkers74
- 31 -
2. OBJECTIVES AND RATIONALES
Endoplasmic reticulum stress has been linked to inflammation through several ways.
One of these links involves PERK-mediated translation attenuation that causes a
reduction in IқB protein levels and the release of NF-қB, which can then translocate to
nucleus and activate the transcription of inflammatory genes such as interleukin 1 (IL1)
and tumor necrosis factor alpha (TNF). Additionally, activated PERK can
phosphorylate nuclear erythroid 2 p45-related factor 2 (Nrf2) followed by its release
from the Nrf2/Keap1 complex and subsequent transportation into the nucleus27
, where it
regulates the expression of antioxidant response element-dependent genes encoding
heme oxygenase-1 (HO-1), thioredoxin reductase 1 (TXNRD1) and the glutathione S-
transferases GSTP1, GSTM1, and GSTm227
. Furthermore, chronic ER stress can lead to
oxidative stress due to increased ROS production from the ER. The ER ROS
production is the result of UPR-stimulated up regulation of protein chaperones
mediating disulfide bond formation in the ER lumen, which is a process which involves
the activities of Ero1p and Erv2p enzymes that use oxidation/reduction reactions, with
molecular oxygen as the final electron recipient27
. ROS accumulation can result in
inflammation through engaging kinases such as JNK and NFқB and some proteins such
as COX2, an important mediator of inflammation and iNOS activity67
. Hence, ROS
produced from the ER can be another link between chronic ER stress and inflammation.
The IRE-1 branch also connects ER stress with inflammation. The activation of IRE1
causes the recruitment of tumor necrosis factor-a (TNF-a)-receptor-associated factor 2
(TRAF2) and the activating IқB/ NF-қB (IKK) complex62
or JNK, leading to the
- 32 -
activation of NF- қB or activating transcription factor 1 (AP1) pro-inflammatory
transcriptional targets such as TNFalpha, interleukin 6 and INOS, in the nucleus149
.
Elevated lipids in obesity or dyslipidemia such as saturated and oxidized lipids are
known to cause ER stress and inflammation37
. For example, saturated fatty acids such as
palmitate and stearate induce ER stress in various cell types such as liver, 3T3-L1
fibroblasts, preadipocytes, pancreatic Beta cells and macrophages4, 46 and 158
. However,
it’s not clear which branch of UPR and to what extent mediates the lipid-induced
inflammation since all three arms of the UPR are activated by metabolic stress during
obesity.
In this thesis study, I developed an experimental approach, which can address the direct
impact of one specific arm of the UPR, initiated by PERK, on inflammation during lipid
stress. I used specific siRNA-based silencing of PERK activity to study the loss of
function for PERK during lipid-induced inflammation. In addition, I developed a
molecular tools based on chemical genetics that can be used to identify the full spectrum
of PERK’s substrates. In the chemical genetics approach, the interested kinase can be
mutated as an ATP analog sensitive kinase allele, whose kinase activity can be inhibited
by cell permeable bulky ATP analogs. When coupled to proteomics, the ATP-analog
sensitized mutant of PERK can be valuable tool for future studies intending to identify
the full spectrum of PERK’s substrates. In this thesis study, I used the siRNA based
silencing of PERK activity for initial characterization of PERK’s role on lipid induced
inflammation in macrophages.
- 33 -
Finally, I analyzed the impact of ER stress reduction on lipid-induced inflammation by
simultaneously treating macrophages with palmitoleate, known to block lipid-induced
ER stress. Taken together, the findings presented in this thesis demonstrates the direct
role of PERK in lipid induced ER stress and inflammation, an important pathogenic
mechanisms underlying metabolic diseases including insulin resistance, fatty liver
diseases, diabetes, atherosclerosis and obesity. Furthermore, the outcome of my studies
suggests reduction of lipid induced inflammation by palmitoleate may explain its
protective effects in metabolic diseases.
- 34 -
3. MATERIALS AND METHODS
3.1 MATERIALS
3.1.1 General Laboratory Reagents
The reagents utilized during this research were purchased from major companies such
as Sigma-Aldrich (St Louis, MO, USA), AppliChem (Darmstadt, Germany) and Merck
(NJ, USA). DMSO was purchased from AppliChem (Darmstadt, Germany). Ethanol,
Methanol, Isopropanol was from Sigma-Aldrich (St.Louis, MO). Plasmid mini- and
midi-prep kits for plasmid extraction were bought from Qiagen (Hilden, Germany),
Promega (Wisconsin, USA) and Invitrogen (CA, USA). Gel DNA Recovery kit used in
DNA purification was from Zymo Research Corporation (CA, USA). PCR Purification
kit was bought from MO-BIO Company (CarlsbadCA, USA) Agarose was purchased
from PRONA (The European Economic Community). Yeast extract, tryptone, NaCl ,
Bacto Peptone and agar were purchased from CONDA (Madrid, Spain), Sigma
ALDRICH (St. Louis,MO,USA) ,BD (MD,USA); respectively. ECL Plus western blot
detection kit was from Amersham Pharmacia Biotech Company (Amersham, UK).
Bradford Reagent was bought from Sigma-ALDRICH (St.Lous, MO, USA). Poly-
ethylamine was from PolySciences (Warrington, PA, USA). High Grade pure water and
Phospho Saline Buffer (PBS) were purchased from HyClone (Rockford, USA)
3.1.2 Tissue Culture Materials And Reagents
All plastic materials utilized in cell culture such as petri dishes, plates, flask were
purchased from Greiner Bio One (Monroe, NC, USA). Serological Pipettes were from
Sarstedt Inc. (Newton, NC, USA). Dulbecco’s modified Eagle’s Medium was purchased
- 35 -
from Thermo Scientific HyClone (Rockford, USA) and Lonza (Basel, Switzerland).
NEON Transfection System was bought from Invitrogen (Carlsbad, CA, USA). Other
reagents such as Trypsin-EDTA, Fetal Bovine Serum and L-Glutamine were bought
from HyClone (Rockford, USA) and GIBCO (Invitrogen, Carlsbad, CA, USA),
respectively.
3.1.3 Bacterial Strains
Escherichia coli E.coli DH5α strain was used.
3.1.4 Enzymes
EcoR1 and Xho1 purchased from New England BioLabs (Ipswich, MA, UK) were used
in restriction digestion during this research. T4 Ligase for ligation is bought from
Fermentas Molecular Biology Tools (Thermo Scientific, Rockford, USA). The enzyme
“Phusion Hot Start II High Fidelity DNA polymerase used in site-directed mutagenesis
PCR and Phire Hot Start used in other PCR types such and conventional PCR, colony
PCR were bought from FINNZYMES (Thermo Scientific, Vantaa, Finland).
3.1.5 Nucleic acids
DNA molecular weight markers were bought from Fermentas (Thermo Scientific,
Rockford, USA). The plasmids used during this research such as pcDNA5F-FLAG
(Invitrogen) and pBABE-Puro were kindly provided by Batu ERMAN (Sabanci
University, Turkey).

- 36 -
3.1.6 Oligonucleotides
Primer Sequence Tm
mPERK M888A
Fwd
5'GTATCTGTACATTCAGGCGCAGCTGTGCAGGAA
GG 3'
63oC
mPERK M888A
Rev
5'CCTTCCTGCACAGCTGCGCCTGAATGTACAGATA
C 3'
63°C
mPERK M888G
Fwd
5'GTATCTGTACATTCAGGGGCAGCTGTGCAGGAA
GG 3'
63°C
mPERK M888G
Rev
5'CCTTCCTGCACAGCTGCCCCTGAATGTACAGATA
C 3'
63°C
mPERK Seq-1 Fwd TCGGAGACAGTGTTTGGCTTAG NA
mPERK Seq-2 Rev CGTCCATCTAAAGTGCTGATGATTAC NA
mPERK Seq-3 Fwd CCTCTTCCAGTGGGACCG NA
mPERK Seq-4 Fwd GGGAGTACCAGTTTTGTACTCC NA
mPERK Seq-5 Fwd CGCAGATCACAGTCAGGTTC NA
mPERK Seq-6 Fwd CCACCAGAGAAGTGGCAAG NA
mPERK Seq-7 Fwd CACTCCTTTGAACTTTGTCC NA
mPERK Seq-8 Fwd CATCTTCCTGCAGATCGCAG NA
mPERK Seq-9 Fwd GATGGTTCAAGACATGCTCTCTC NA
Table 3. 1 The list of used primer; sequences and melting temperatures (Tm)
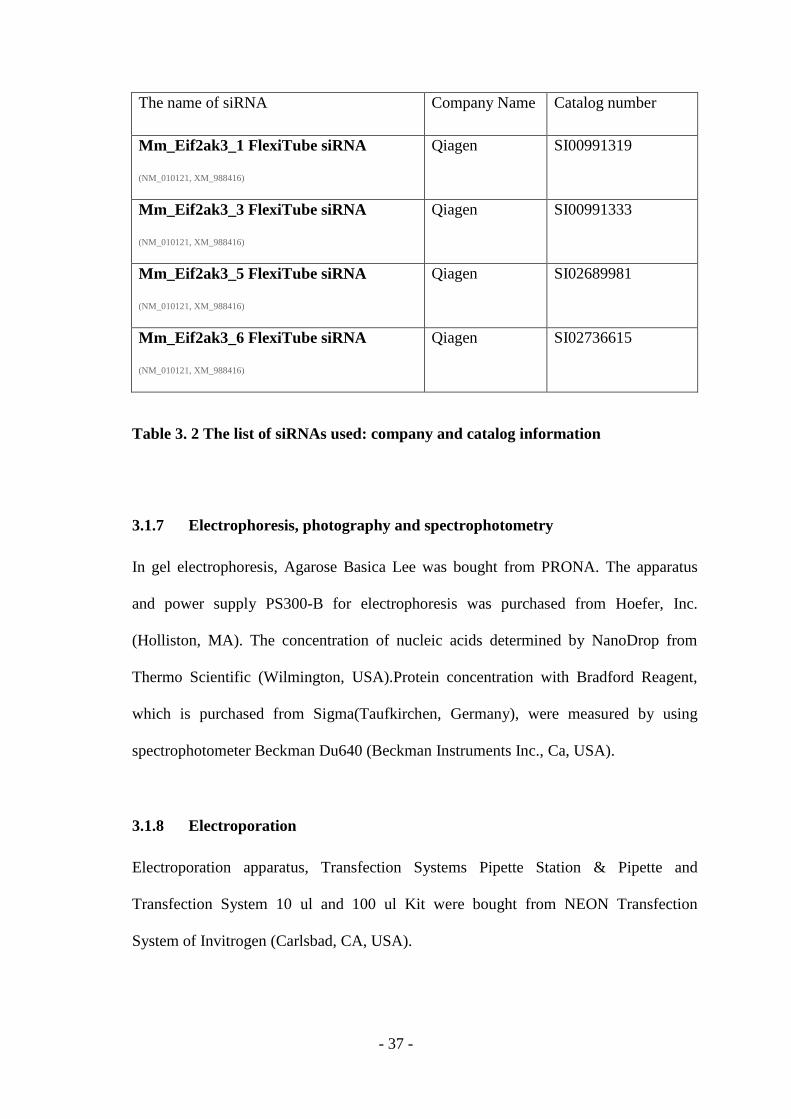
- 37 -
The name of siRNA Company Name Catalog number
Mm_Eif2ak3_1 FlexiTube siRNA
(NM_010121, XM_988416)
Qiagen SI00991319
Mm_Eif2ak3_3 FlexiTube siRNA
(NM_010121, XM_988416)
Qiagen SI00991333
Mm_Eif2ak3_5 FlexiTube siRNA
(NM_010121, XM_988416)
Qiagen SI02689981
Mm_Eif2ak3_6 FlexiTube siRNA
(NM_010121, XM_988416)
Qiagen SI02736615
Table 3. 2 The list of siRNAs used: company and catalog information
3.1.7 Electrophoresis, photography and spectrophotometry
In gel electrophoresis, Agarose Basica Lee was bought from PRONA. The apparatus
and power supply PS300-B for electrophoresis was purchased from Hoefer, Inc.
(Holliston, MA). The concentration of nucleic acids determined by NanoDrop from
Thermo Scientific (Wilmington, USA).Protein concentration with Bradford Reagent,
which is purchased from Sigma(Taufkirchen, Germany), were measured by using
spectrophotometer Beckman Du640 (Beckman Instruments Inc., Ca, USA).
3.1.8 Electroporation
Electroporation apparatus, Transfection Systems Pipette Station & Pipette and
Transfection System 10 ul and 100 ul Kit were bought from NEON Transfection
System of Invitrogen (Carlsbad, CA, USA).
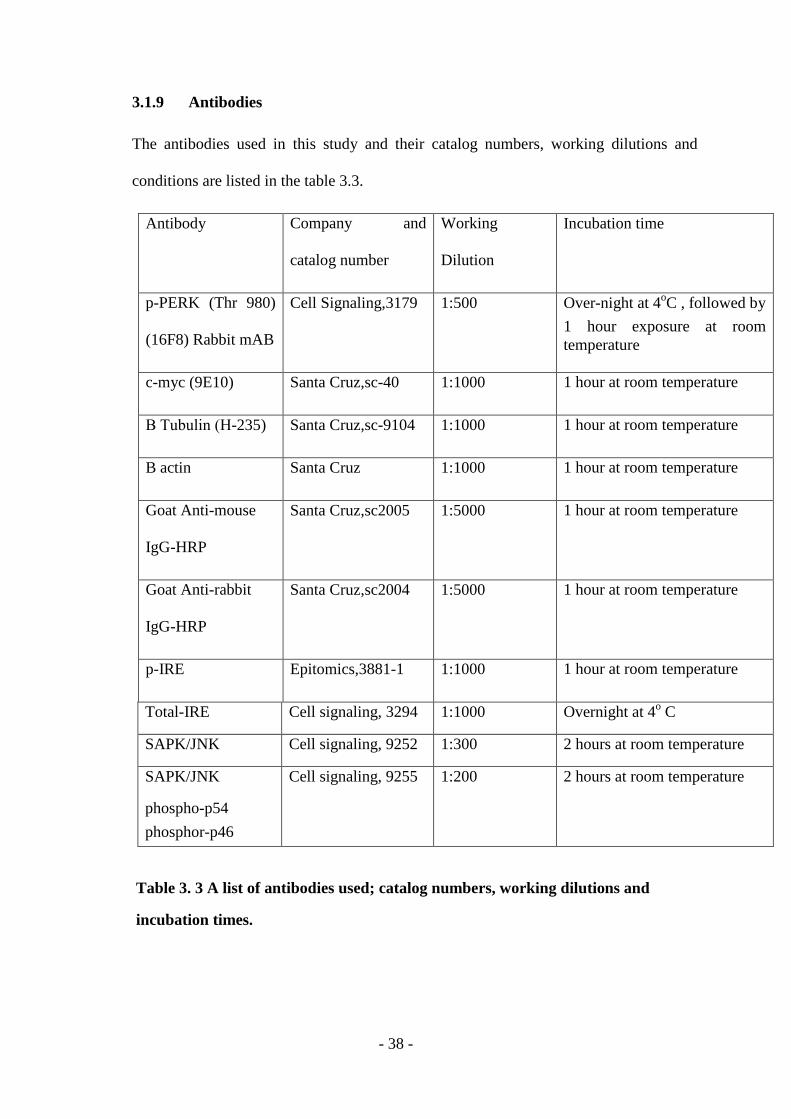
- 38 -
3.1.9 Antibodies
The antibodies used in this study and their catalog numbers, working dilutions and
conditions are listed in the table 3.3.
Antibody Company and
catalog number
Working
Dilution
Incubation time
p-PERK (Thr 980)
(16F8) Rabbit mAB
Cell Signaling,3179 1:500 Over-night at 4oC , followed by
1 hour exposure at room
temperature
c-myc (9E10) Santa Cruz,sc-40 1:1000 1 hour at room temperature
Β Tubulin (H-235) Santa Cruz,sc-9104 1:1000 1 hour at room temperature
B actin Santa Cruz 1:1000 1 hour at room temperature
Goat Anti-mouse
IgG-HRP
Santa Cruz,sc2005 1:5000 1 hour at room temperature
Goat Anti-rabbit
IgG-HRP
Santa Cruz,sc2004 1:5000 1 hour at room temperature
p-IRE Epitomics,3881-1 1:1000 1 hour at room temperature
Total-IRE Cell signaling, 3294 1:1000 Overnight at 4o C
SAPK/JNK Cell signaling, 9252 1:300 2 hours at room temperature
SAPK/JNK
phospho-p54
phosphor-p46
Cell signaling, 9255 1:200 2 hours at room temperature
Table 3. 3 A list of antibodies used; catalog numbers, working dilutions and
incubation times.
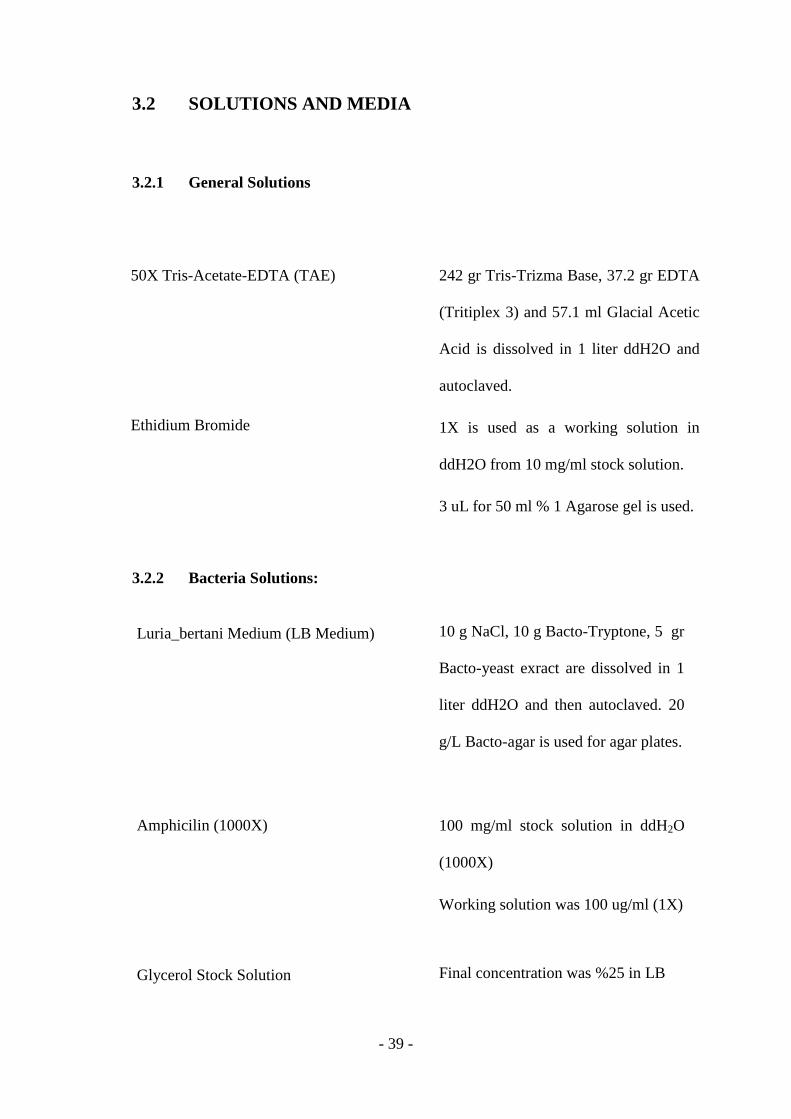
- 39 -
3.2 SOLUTIONS AND MEDIA
3.2.1 General Solutions
3.2.2 Bacteria Solutions:
50X Tris-Acetate-EDTA (TAE)
Ethidium Bromide
242 gr Tris-Trizma Base, 37.2 gr EDTA
(Tritiplex 3) and 57.1 ml Glacial Acetic
Acid is dissolved in 1 liter ddH2O and
autoclaved.
1X is used as a working solution in
ddH2O from 10 mg/ml stock solution.
3 uL for 50 ml % 1 Agarose gel is used.
Luria_bertani Medium (LB Medium)
Amphicilin (1000X)
Glycerol Stock Solution
10 g NaCl, 10 g Bacto-Tryptone, 5 gr
Bacto-yeast exract are dissolved in 1
liter ddH2O and then autoclaved. 20
g/L Bacto-agar is used for agar plates.
100 mg/ml stock solution in ddH2O
(1000X)
Working solution was 100 ug/ml (1X)
Final concentration was %25 in LB
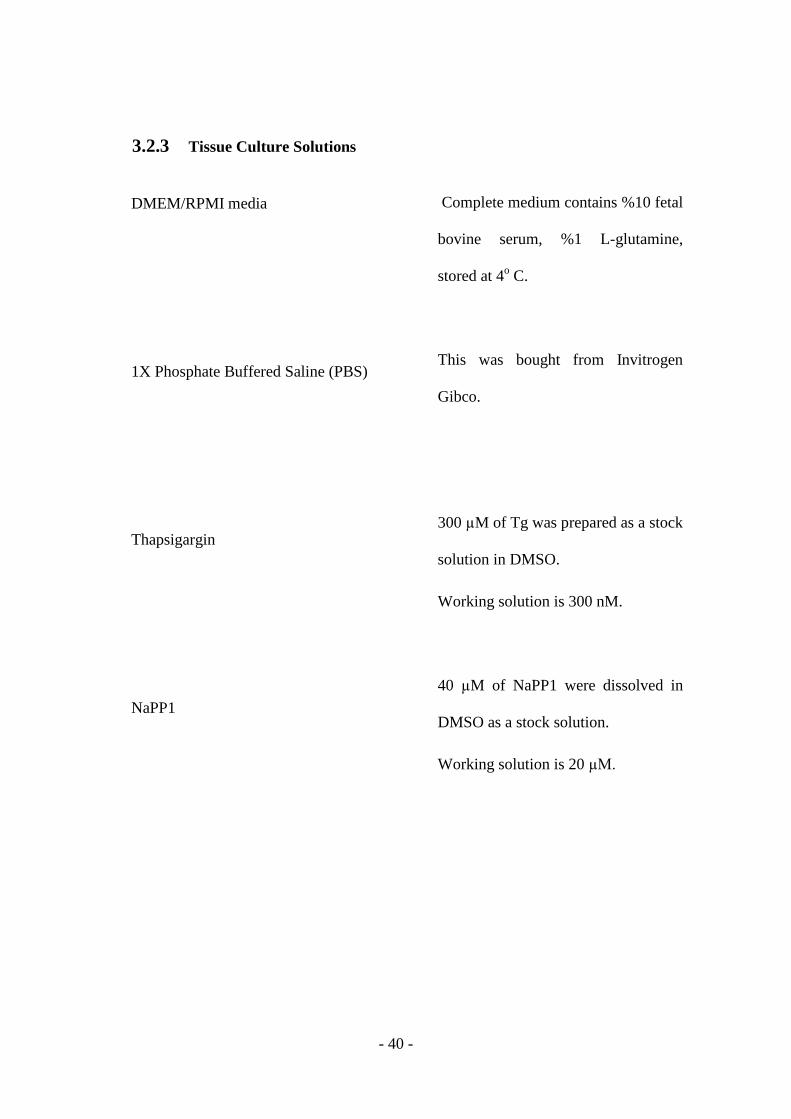
- 40 -
3.2.3 Tissue Culture Solutions
DMEM/RPMI media
1X Phosphate Buffered Saline (PBS)
Thapsigargin
NaPP1
Complete medium contains %10 fetal
bovine serum, %1 L-glutamine,
stored at 4o C.
This was bought from Invitrogen
Gibco.
300 µM of Tg was prepared as a stock
solution in DMSO.
Working solution is 300 nM.
40 µM of NaPP1 were dissolved in
DMSO as a stock solution.
Working solution is 20 µM.
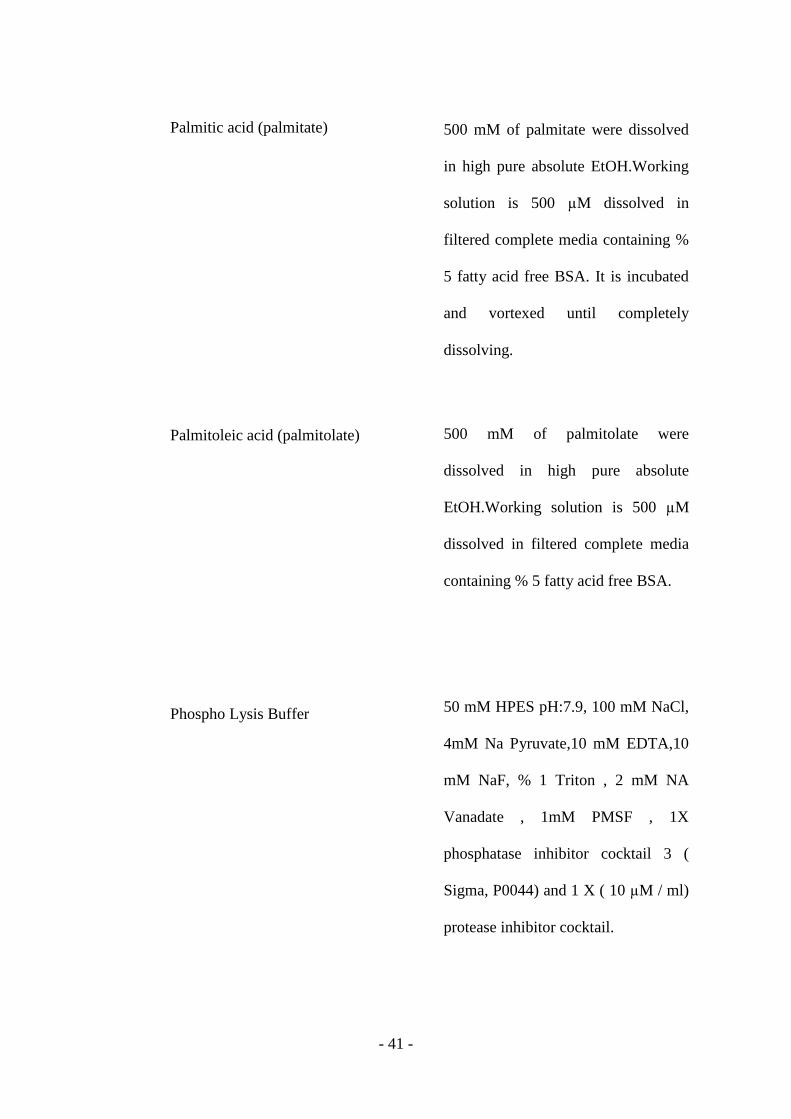
- 41 -
Palmitic acid (palmitate)
Palmitoleic acid (palmitolate)
Phospho Lysis Buffer
500 mM of palmitate were dissolved
in high pure absolute EtOH.Working
solution is 500 µM dissolved in
filtered complete media containing %
5 fatty acid free BSA. It is incubated
and vortexed until completely
dissolving.
500 mM of palmitolate were
dissolved in high pure absolute
EtOH.Working solution is 500 µM
dissolved in filtered complete media
containing % 5 fatty acid free BSA.
50 mM HPES pH:7.9, 100 mM NaCl,
4mM Na Pyruvate,10 mM EDTA,10
mM NaF, % 1 Triton , 2 mM NA
Vanadate , 1mM PMSF , 1X
phosphatase inhibitor cocktail 3 (
Sigma, P0044) and 1 X ( 10 µM / ml)
protease inhibitor cocktail.
- 42 -
3.2.4 Competent Cell Solutions
CaCL2 sln:
Solutions:
PIPEs (Mw= 307.37 g/mol) pH: 6.4 0.1 M stored at room temperature
CaCl2 (Mw= 147.g/ mol) 2 M stored at room temperature
Glycerol % 87 stored at room temperature
The preparation of Mixture for 500 ml from stock solutions:
Stock solutions Final concentration:
2 M Cacl2 60 mM
0.1 M PIPEs 10 mM
% 87 Glycerol %15
ddH2O up to final volume
**Autoclave or filter the solution before use and store at 4 degrees.

- 43 -
3.2.5 Sodium Deodecyl Sulphate (SDS)-Polyacrylamide Gel Electrophoresis
(PAGE) And Immunoblotting Solution
In this study, Mini PROTEAN Tetra Cell western blotting system (Bio Rad, CA, and
USA) was used for the westernblot experiments. The gels used were prepared as % 10
resolving gels and % 5 stacking gels.
% 10 Resolving Gel %30 Acyrlamide mix, 1.5 mM Tris HCl (pH: 8.8)
%10 SDS and amonium persulfate, %0.08
TEMED with suitable volume of ddH2O
to complete desired volume.
% 5 Stacking Gel %30 Acyrlamide mix, 1.5 mM Tris HCl (pH: 6.8)
%10 SDS and ammonium persulfate, %0.1
TEMED with suitable volume of ddH2O to
complete total desired volume.
5 X Running Buffer 124 mM Tris Base, 960 mM Glycine, 17.4 mM
SDS were dissolved in ddH2O as a stock
solution.
Working solution is 1 X.
5 X Transfer Buffer 64.4 mM Glycine, 80 mM Trisma Base and 2.14
mM SDS was dissolved in ddH2O.
Working solution is 1X while working.

- 44 -
10 X Tris Buffered Saline 100 mM Trisma Base, 1.5 M NaCl in ddH2O
(TBS) and is adjusted to pH: 8 with 1 N HCl.
1 X TBS-Tween 20 0.2 % Tween in 1 X TBS
Blocking Solution % 5 (w/ v) BSA (Bovine Serum Albumin)
was dissolved in % 0.2 TBS-Tween 20.
- 45 -
3.3 METHODS
3.3.1 The use of Software Programs
3.3.1.1 Pymol
The hypothetical 3D model of PERK was created using SwissModel Tools program and
then aligned with the other kinases ATP binding pockets (whose crystal structures were
solved previously) in a complex with ATP or 1NM-PP1 using PyMOL15 according to
manufacturer’s recommendations (PyMOL, http://pymol.org/educational/).
The proteins used for comparison was GCN2 (ID number: 1YZ5; Padyane et al., 2005;
http://www.pdb.org/pdb/explore/explore.do?structureId=1ZY5) and TgCDPKI (ID
number:3I7B, Kayode et al.,2010;
http://www.pdb.org/pdb/explore/explore.do?structureId=3I7B )
3.3.1.2 BioLign
The sequence information for PERK in the AB1 format or a DNA sequence
chromatogram from the sequencing machine was visualized in BioLign 4.0.6 Tool
according to the manufacturer’s recommendations (http://en.bio-
soft.net/dna/BioLign.html ).
3.3.1.3 ClustalW2
Homosapiens PERK sequence (NM_004836.5, December 2010) and mus musculus
PERK sequence (NM_010121.2, December,2010) was aligned with other kinases with
known crystal structures for their ATP binding domains using the ClustalW2 program
as per se the manufacturer’s recommendations ( Clustal W2, EMBL-EBI;
- 46 -
http://www.ebi.ac.uk/Tools/msa/clustalw2/ ).
3.3.2 Molecular Cloning Methods
3.3.2.1 Chemical Competent Cell Preparation
For the preparation of competent cells, firstly, a BIOLABS NeB-5-alpha High
efficiency competent E.coli cell was inoculated into 50 ml Luria-Bertani media (LB
media) without any antibiotics for 12 hours. Then, 200 µl of this culture was diluted into
100 ml LB. After one hour, the optical density (OD) of culture was checked using a
spectrometer until it reached 0.345 OD, demonstrating a logarithmic growth in culture.
The culture was divided into 2x50 ml falcon tubes on ice and incubated for 10 minutes.
After centrifugation at 1600g (4oC) for 20 minutes, the bacterial pellet was resuspended
in 10 ml of ice cold CaCl2 solution. This suspension was centrifuged in 1100 g (4oC) for
10 minutes before resuspending in 10 ml of ice-cold CACl2 solution again. Then, it was
incubated on ice for another 30 minutes, followed by centrifugation at 1100g (4oC) for
10 minutes. The obtained pellet was dissolved in 2 ml of ice cold CaCl2 solution and
dispensed into pre-chilled sterilized eppendorf tubes on ice (50µl/tubes). These aliquots
were frozen immediately in liquid nitrogen and stored away in -80oC freezer. The
competency of the cells was tested each time by transforming a previously confirmed
plasmid.
- 47 -
3.3.2.2 Transformation
First, 50 µl competent cells were thawed on ice and 2 µl (≤100 pg) of plasmid of
interest was added and gently tapped couple times. Then, this was incubated on ice for
30 minutes, followed by heat shock at 42oC for 45 seconds. After this, it was incubated
on ice for another 10 minutes until it was diluted into 200 µl of room temperature LB.
Following this, the transformation mix was incubated in a shaker at 37oC for 60 minutes
at 250 rpm. Meanwhile, the agar plates were put on the 37oC incubator for warming up.
One hour later, the transformation mixture was seeded on two agar plates at 150 µl and
50 µl volumes. These were incubated at 37oC incubator for 16 to 18 hours until single
colonies were apparent. These colonies were selected for further growth in larger
cultures of LB.
3.3.2.3 Glycerol Stock Preparation
A single colony from plate was picked with a sterile tip and cultured in ~ 5 ml LB with
the selectable antibiotics in 50 ml falcon tubes (without exceeding %10 of total volume
for proper airing) for 14 to 15 hours at 37oC and 225 rpm. Next day, 500 µl of the
culture was inoculated into 500 ml of sterile %50 glycerol solution (at the final ratio of
1:4, Glycerol to LB culture). Finally, the glycerol stocks were frozen and stored at
-80oC .
3.3.2.4 Restriction Enzyme Digestion
The plasmid exposed to any kind of experiments methods such as ligation, mutation is
digested by corresponding suitable enzyme to confirm to be accuracy of that our
interested gene was still inside the interested vector. In this case, our interested gene,

- 48 -
PERK was between EcoR1 and Xho1 restriction site. Approximately, 1000ng of PERK
plasmid was digested with EcoR1 and Xho1 restriction enzyme with the corresponding
amount of manufacturer’s recommendation and then waited for 4 hrs. After that, the
samples were run on the variable agarose gel concentration depending on the purpose of
the experiment. If it was only for confirmation, % 1 basica agarose gel was used due to
our insert and backbone size; 3577 bp and 5400 bp or 5169 bp respectively. However, if
it was needed for further process like gel DNA extraction, % 0.5 reducta agarose gel
was used to make extraction more purified.
3.3.2.5 Agarose Gel Electrophoresis
DNA samples and PCR products were detected on agarose gel using Hoefer SUB10
Mini Plus submarine electrophoresis system (Holliston, MA, USA) with the help of
Hoefer PS300B 300 Volt Power Supply. Gels dissolved and run in 1X TAE buffer were
in different agarose concentrations between %0.5-%1 depending on the size of the DNA
fragment and the aim of experiment .For DNA gel recovery; DNA products were run on
% 0.5 or 0.8 agarose gels. % 1 agarose gels were used in the detection of DNA
fragments for molecular cloning. During the preparation of the gel, corresponding
amount of agarose was dissolved in 1X TAE buffer and boiled in microwave for couple
minutes. After that, the solution put under the hood to cool it down for a while and EtBr
was added on with the final concentration of 30 ug/ml before pouring the gel. DNA
samples were mixed with 10X bromophenol blue loading dyes before loading into gel.
Agarose gels were run at room temperature under around 100-80V voltage for 40 min or
60 min., respectively. Fermentas #SM0241 Gene ruler 100 bp or #SM0311 Gene Ruler
1 kb ladders used as reference point on the gels when the gels were visualized under UV
Light.
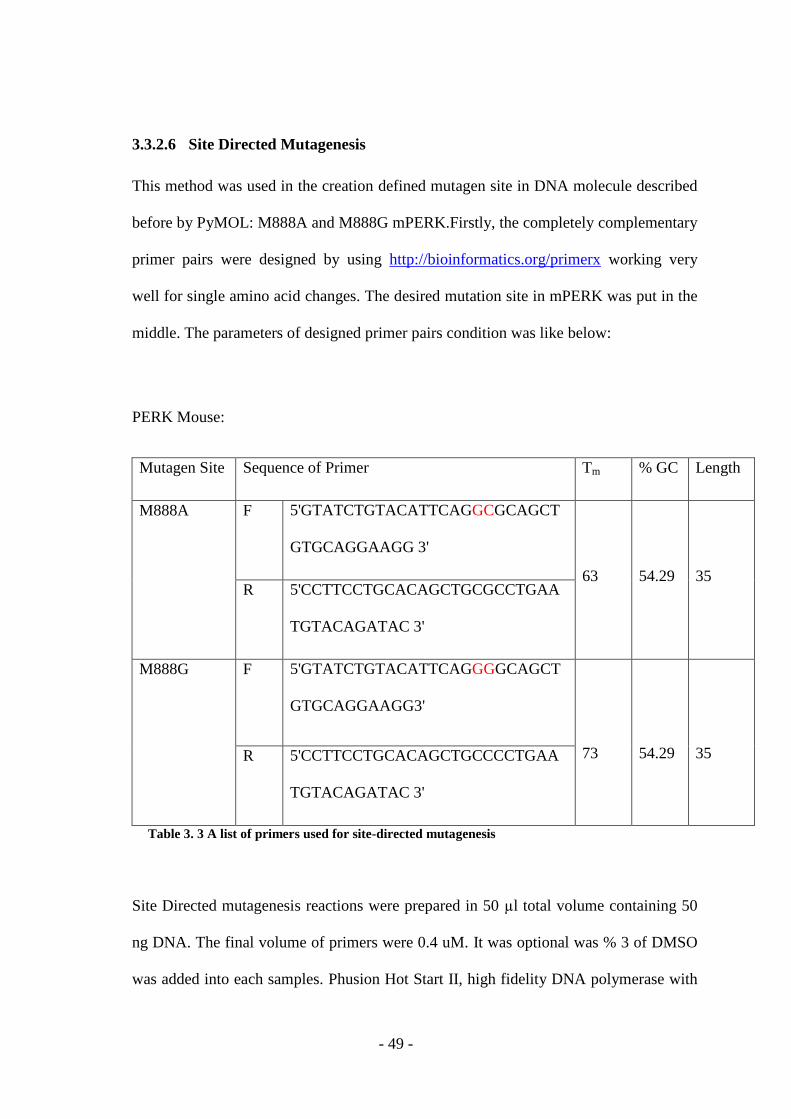
- 49 -
3.3.2.6 Site Directed Mutagenesis
This method was used in the creation defined mutagen site in DNA molecule described
before by PyMOL: M888A and M888G mPERK.Firstly, the completely complementary
primer pairs were designed by using http://bioinformatics.org/primerx working very
well for single amino acid changes. The desired mutation site in mPERK was put in the
middle. The parameters of designed primer pairs condition was like below:
PERK Mouse:
Mutagen Site Sequence of Primer Tm % GC Length
M888A F 5'GTATCTGTACATTCAGGCGCAGCT
GTGCAGGAAGG 3'
63
54.29
35 R 5'CCTTCCTGCACAGCTGCGCCTGAA
TGTACAGATAC 3'
M888G F 5'GTATCTGTACATTCAGGGGCAGCT
GTGCAGGAAGG3'
73
54.29
35 R 5'CCTTCCTGCACAGCTGCCCCTGAA
TGTACAGATAC 3'
Table 3. 3 A list of primers used for site-directed mutagenesis
Site Directed mutagenesis reactions were prepared in 50 µl total volume containing 50
ng DNA. The final volume of primers were 0.4 uM. It was optional was % 3 of DMSO
was added into each samples. Phusion Hot Start II, high fidelity DNA polymerase with
- 50 -
proofreading activity (Finnzymes, Finland) was used as reaction enzymes. Reactions
started with initial denaturation step at 980C for 5 minutes. Then, 25 cycles of
amplification reaction was performed at 980C 35 seconds, at 63
0C 30 seconds, at 72
0C 5
min (~30 s/kb).After that, ~5 µl of the reaction was run on the gel to see band
corresponding to the expected product. After seeing of the band, the rest of reactions
was proceed to next step.
3.3.2.7 Dpn1 Digestion
As soon as the confirmation of succession in Site directed mutagenesis, 1 µl of Dpn1
(20 U/ µl) bought from NEB (Ipswich, MA) was added into 50 µl of reaction to get rid
of the template DNA since it cut methylated DNA. Then it was incubated at 37oC for
overnight and the reaction was inactivated at 80oC for 20 minutes. After that, 2 µl of the
sample was transformed into competent cells.
3.3.2.8 Gel DNA Extraction
Zymoclean Gel DNA recovery kit was used for pure DNA purification from agarose
gel. 50 µl of sample loaded into %0.5 agarose gels and run at 100 volts for 40 minutes.
Then, it was cut under UV light and then followed by manufacturer’s recommendations.
In the end; DNA was dissolved at 10 µl of DNA/RNAase free ddH2O.
3.3.2.9 Ligation
The plasmids were ligated to the insert (DNA) at 1:7 ratios with the help of T4 ligase
enzyme (Fermentas). The amount of buffer and enzyme were determined depending on
manufacturer’s recommendations.
- 51 -
3.3.2.10 Colony PCR
Single colonies swiped with the tip of pipets from the plates were placed in PCR tubes.
.A PCR mixture was prepared including 1 µl of the 5X Phire enzyme buffer, 0.2 µl
forward and reverse primers, 0.3 µl DMSO, 0.8 µl MgCl2, 0.2 µl dNTP, 0.2 µl Phire
Hot Start Enzyme (Finnzymes) in ddH2O (total reaction volume was 10 µl ). The PCR
program used was the same as the molecular cloning PCR since the same primers and
enzyme were used here as well.
3.3.2.11 Mini Prep
Invitrogen PureLink Quick Plasmid Miniprep Kit (Carlsbad, CA, USA) and Promega
Pure Yield Miniprep System (Fitchburg, Wisconsin, USA) protocols were used
according to the manufacturer’s recommendations. At the end, the obtained DNA
samples were dissolved in 50 µl DNA/RNAase free sterilized water and measured with
spectroscopy.
3.3.2.12 Midi Prep
For midiprep cultures, the initial culture was prepared in 1mL of LB and grown for a
few hours at 37 oC and 225 rpm. This initial culture was transferred into 100 ml LB for
overnight incubation (the amount of LB was not exceeding %10 of total volume of
flask). The QIAGEN Plasmid Midiprep Kit (Hilden, Germany) or Invitrogen (Carlsbad,
CA, USA) protocols were followed according to the manufacturer’s recommendations.
At the end of the protocol the DNA samples were dissolved in 200 µl DNA/RNAase
free sterilized water.
- 52 -
3.3.3 Tissue Culture Methods
3.3.3.1 Cell Lines And Growth Conditions Of Cells
The cell lines used in this research were grown in either RPMI or DMEM. 293HEK,
PERK-/-
. Mouse fibroblast was cultured in DMEM. RAW 264.7 (mouse murine
macrophage cell lines) were grown in RPMI. DMEM and RPMI mediums for cell
culture were complete medium including % 10 fetal bovine serums, %1 L-Glutamine.
All cells were placed in incubators at 37o C with % 5 CO2 concentrations in air. All cells
in incubators were regularly checked and changed into a new dishes or plates before
they reached to high confluency.
3.3.3.2 Passage Of The Cell Lines
After the medium was sucked out with the help of vacuum, trypsin-EDTA was added
into plate or dishes with the variable concentrations. The concentration was determined
depending on the surface area of the dish or plate but not exceeding % 10 of total
volume. Trypsinized cells were kept in the incubators for few minutes. After that,
detached cells were collected in complete medium in 15 ml or 50 ml falcon tubes with
serological pipettes. Cells were pipetted up and down. With the determined dilution of
collected cells were re-seeded on plates or dishes.
The passage of macrophages was different from other types of cell lines. Instead of
trypsinization, they were scraped by a scrapper and then collected with a complete
medium in the 15 or 50 ml falcon tubes. Then, they were distributed by pipetting up and
down. They were reseeded into plates.
- 53 -
All mediums used in cell passage were pre-warmed by incubating in the water bath at
37oC prior to usage.
3.3.3.3 Thawing The Cells
Stock cell lines in cryovial tubes were transferred from -80oC freezer or liquid nitrogen
tank to ice immediately. The vials were incubated in the water bath at 37oC for a couple
minutes until completely thawed. 1 ml of pre-heated complete medium was mixed into
the vial by pipetting up and down for few times. Meanwhile, 6 ml of pre-heated
complete medium was added into t25 flasks. The mixture in the vial was collected by
serological pipettes and placed inside the flask. Cells were distributed in the flask by
moving the flask back and forth or right and left (but never swirling). After growing for
a day, the cells were refreshed with a new medium. The 80% confluent plates were split
again.
3.3.3.4 Freezing Of The Cells
Cell stocks were prepared from cells that have reached %70 to 80 confluency in growth
plates. First, the medium was sucked out and washed with PBS for 2 twice. The cells
were collected after detachment with trypsin-EDTA treatment for 5 minutes a room
temperature. For macrophages, detachment was possible through scraping. The
collected cells were next centrifuged for 5 minutes at 1000 rpm. In the meantime, the
freezing medium was prepared containing % 10 DMSO, % 40 FBS and % 50 medium
(DMEM or RPMI, depending on the cell type). The pellet was then resuspended with
this freezing medium. For each cell type, 1 ml of the freezing medium was transferred
into a single cyrotubes and frozen at -80oC freezer covered by tissue paper in foam
boxes. One day later, they were transferred into liquid nitrogen tanks.
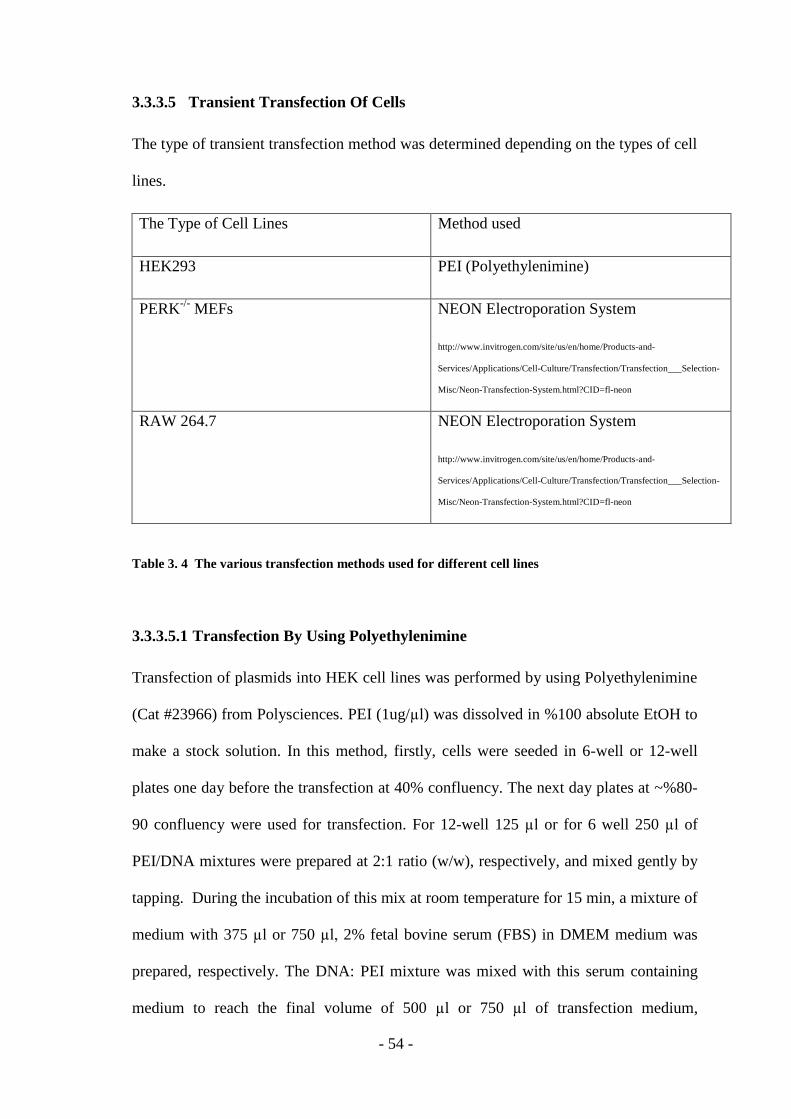
- 54 -
3.3.3.5 Transient Transfection Of Cells
The type of transient transfection method was determined depending on the types of cell
lines.
The Type of Cell Lines Method used
HEK293 PEI (Polyethylenimine)
PERK-/-
MEFs NEON Electroporation System
http://www.invitrogen.com/site/us/en/home/Products-and-
Services/Applications/Cell-Culture/Transfection/Transfection___Selection-
Misc/Neon-Transfection-System.html?CID=fl-neon
RAW 264.7 NEON Electroporation System
http://www.invitrogen.com/site/us/en/home/Products-and-
Services/Applications/Cell-Culture/Transfection/Transfection___Selection-
Misc/Neon-Transfection-System.html?CID=fl-neon
Table 3. 4 The various transfection methods used for different cell lines
3.3.3.5.1 Transfection By Using Polyethylenimine
Transfection of plasmids into HEK cell lines was performed by using Polyethylenimine
(Cat #23966) from Polysciences. PEI (1ug/µl) was dissolved in %100 absolute EtOH to
make a stock solution. In this method, firstly, cells were seeded in 6-well or 12-well
plates one day before the transfection at 40% confluency. The next day plates at ~%80-
90 confluency were used for transfection. For 12-well 125 µl or for 6 well 250 µl of
PEI/DNA mixtures were prepared at 2:1 ratio (w/w), respectively, and mixed gently by
tapping. During the incubation of this mix at room temperature for 15 min, a mixture of
medium with 375 µl or 750 µl, 2% fetal bovine serum (FBS) in DMEM medium was
prepared, respectively. The DNA: PEI mixture was mixed with this serum containing
medium to reach the final volume of 500 µl or 750 µl of transfection medium,
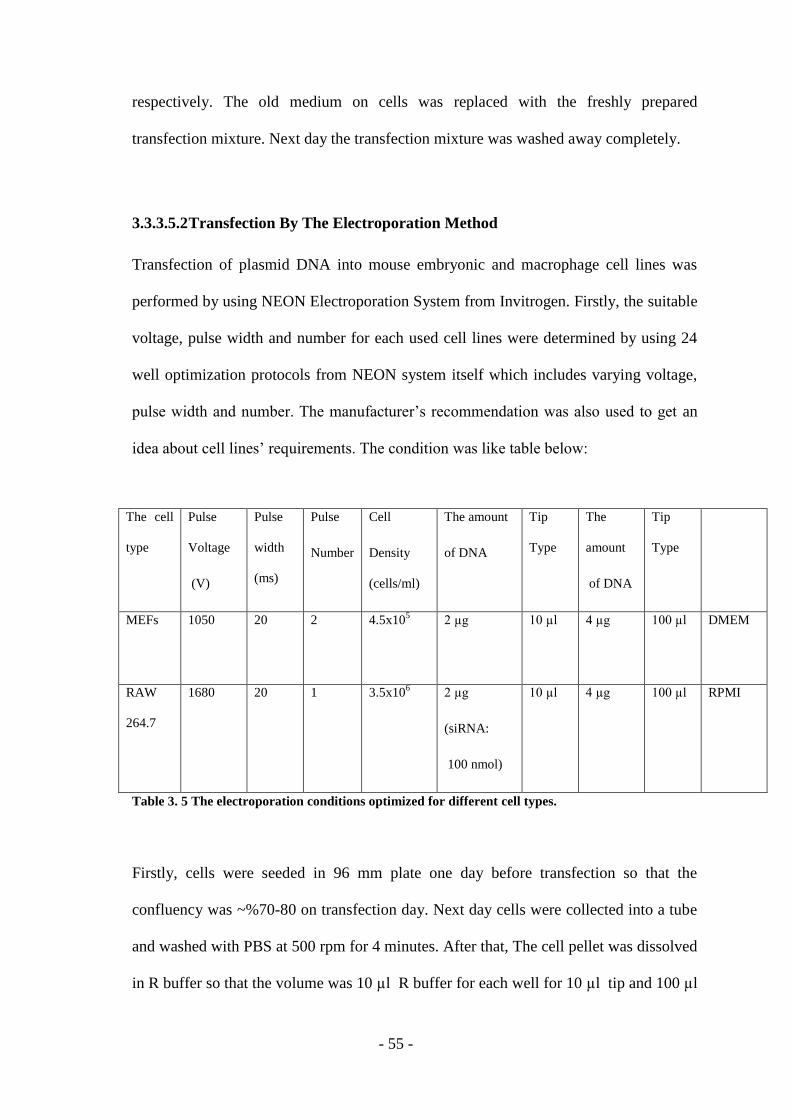
- 55 -
respectively. The old medium on cells was replaced with the freshly prepared
transfection mixture. Next day the transfection mixture was washed away completely.
3.3.3.5.2 Transfection By The Electroporation Method
Transfection of plasmid DNA into mouse embryonic and macrophage cell lines was
performed by using NEON Electroporation System from Invitrogen. Firstly, the suitable
voltage, pulse width and number for each used cell lines were determined by using 24
well optimization protocols from NEON system itself which includes varying voltage,
pulse width and number. The manufacturer’s recommendation was also used to get an
idea about cell lines’ requirements. The condition was like table below:
Table 3. 5 The electroporation conditions optimized for different cell types.
Firstly, cells were seeded in 96 mm plate one day before transfection so that the
confluency was ~%70-80 on transfection day. Next day cells were collected into a tube
and washed with PBS at 500 rpm for 4 minutes. After that, The cell pellet was dissolved
in R buffer so that the volume was 10 µl R buffer for each well for 10 µl tip and 100 µl
The cell
type
Pulse
Voltage
(V)
Pulse
width
(ms)
Pulse
Number
Cell
Density
(cells/ml)
The amount
of DNA
Tip
Type
The
amount
of DNA
Tip
Type
MEFs
1050 20 2 4.5x10⁵
2 µg 10 µl 4 µg 100 µl DMEM
RAW
264.7
1680 20 1 3.5x10⁶
2 µg
(siRNA:
100 nmol)
10 µl 4 µg 100 µl RPMI
- 56 -
R buffer for each well for 100 µl tip then followed by the manufacturer’s
recommendations. The added volume of DNA into R buffer for each well was not
exceeding %10 percent of total volume R buffer for each well.
3.3.3.6 Treatment of Cells
Cells were firstly plated to corresponding plates according to the experiment type. One
day after seeding, the mediums were removed and the treatments were done in complete
mediums. Treatment medium including chemicals such as thapsigargin, palmitate,
palmitoleic acids, LPS, ATP analogs etc. were prepared freshly from stocks aliquot
before. Complete mediums containing same amount of solvent were prepared as an
control samples such as water, EtOH or DMSO. The parameters for chemicals were
listed on table next page:
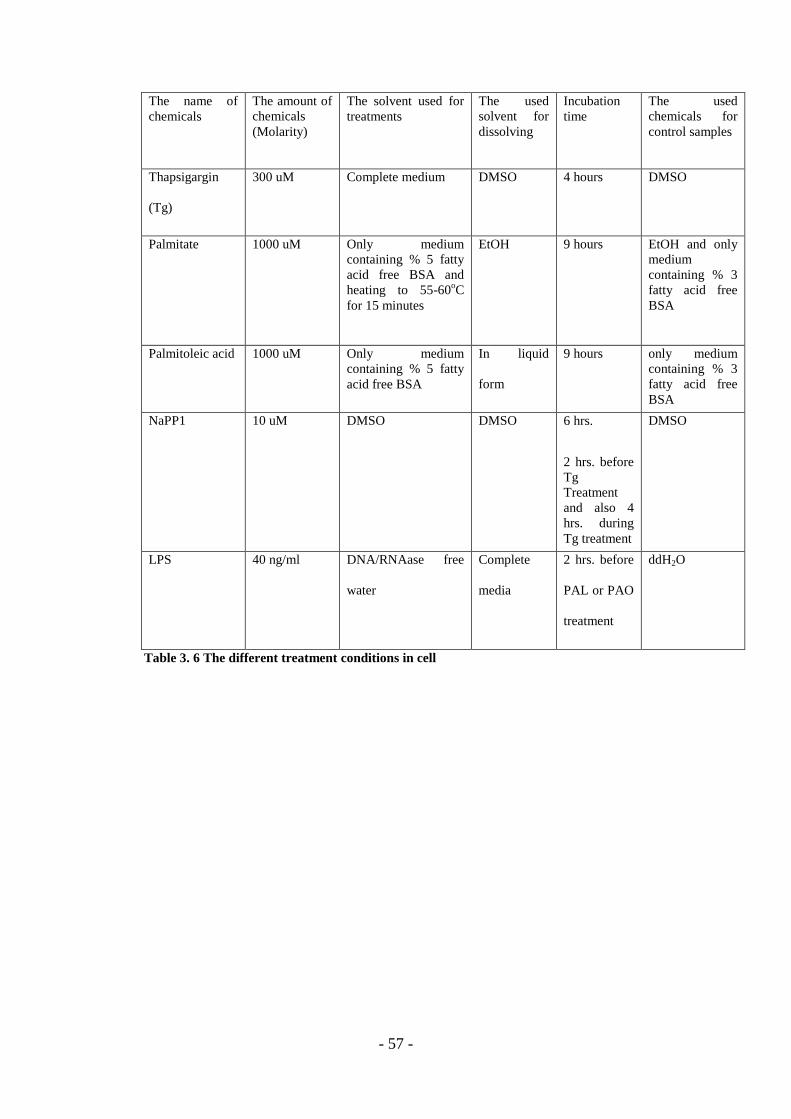
- 57 -
The name of
chemicals
The amount of
chemicals
(Molarity)
The solvent used for
treatments
The used
solvent for
dissolving
Incubation
time
The used
chemicals for
control samples
Thapsigargin
(Tg)
300 uM Complete medium DMSO 4 hours DMSO
Palmitate 1000 uM Only medium
containing % 5 fatty
acid free BSA and
heating to 55-60oC
for 15 minutes
EtOH 9 hours EtOH and only
medium
containing % 3
fatty acid free
BSA
Palmitoleic acid 1000 uM Only medium
containing % 5 fatty
acid free BSA
In liquid
form
9 hours only medium
containing % 3
fatty acid free
BSA
NaPP1 10 uM DMSO DMSO 6 hrs.
2 hrs. before
Tg
Treatment
and also 4
hrs. during
Tg treatment
DMSO
LPS 40 ng/ml DNA/RNAase free
water
Complete
media
2 hrs. before
PAL or PAO
treatment
ddH2O
Table 3. 6 The different treatment conditions in cell

- 58 -
3.3.3.7 PERK siRNA Treatment In Macrophages
Transient transfection by electroporation was performed with 100 nmol of siRNA like
explained in section 3.3.3.5.2 under the conditions in Table 3.4. After transfection, the
cells were incubated for 24 hours without change of complete media and then proceed
to further step.
3.3.4 Total Protein Extraction From Cultured Cells
Cells in wells or dishes were put on ice for 5 minutes with the addition of
corresponding and sufficient amount of lysis buffer ( RIPA or Phospho-Lysis Buffer) on
the cells and then scraped with the tip of 1000 ml pipette tip by collecting in eppendorf
tubes that are kept on ice. Thereafter, lyzed cells were centrifuged at 14.000 g for 10
minutes at + 4
oC and supernatants are collected that are kept on ice. After that, 5X SDS
added to samples by making 1X SDS concentration in total volume. After the vortex of
mixture, the samples were boiled at 90o C for 5 minutes, vortex and loaded on to SDS-
page protein gels.
3.3.5 Western Blot
In first step, concentrations of proteins were calculated by using Bradford Assay. All
samples were measured at 595 nm wavelength in spectrophotometer. Meanwhile, the
standard curve were calculated with varying concentrations of already known protein
concentration of bovine serum albumin (BSA) and used as a reference for calculation
of proteins with unknown concentrations. The calculation was done by putting the
absorbance values in equation.
- 59 -
After quantification of protein concentrations of samples, all samples were prepared for
loading into gel by addition of 5X SDS Loading Dye so that the loading buffer would
be 1X of total volume of samples.80 to 100 µg of proteins were loaded into gel relied on
the type of experiments. Afterward, the combination of sample and loading buffer were
heated at 90oC for 15 minutes before loading into gel.
In this case, BIO RAD Mini Tans Blot protein electrophoresis system was used for
running the sample on gels with the help of the method called Tris-glycine SDS-
Polyacrylamide Gel Electrophoresis and transferring the protein samples onto
membrane. Gel concentrations for Tris-glycine SDS-Polyacrylamide Gel were chosen
depending on the size of the interested protein but generally %10 for running gel and
%5 for resolving gel were used. The samples were run on gel at 80V voltage for ~30
minutes (until they enter into running gel) and then at 120 V for ~90 minutes until the
color of loading dye disappear. After running, proteins were transferred onto Thermo
Scientific PVDF Transfer membranes with wet transfer protocol but before that, PVDF
membrane was activated inside methanol for 15 seconds. Transfer Buffer was prepared
1X from 5X stocks with %20 methanol in ddH2O. After all materials were soaked into
transfer buffer, wet transfer sandwich were prepared including 1 sponge,1 whatman
filter paper, gel, membrane,1 whatman filter paper and 1 sponge ,respectively. Transfer
was done for 120 minutes at 95 V voltages. During transfer, western blot tank was
either kept in cold room and also the ice pocket supplied with system was put inside
tank.
After transfer was end, membranes were neutralized in TBS-T for 5 minutes and then
immersed into blocking solution with % 3 milk powder or % 5 BSA in 1X TBS-Tween
- 60 -
for 1 hrs. at RT or o/night at +40C on a shaker .After that, primary antibodies were
prepared in same blocking solution used previous step while membranes were washed
in TBT-T and then incubated for 1 hrs. at RT or o/night at +40C with corresponding
dilutions on a shaker. Thereby, membranes were washed in 1X TBS-T four times for 5,
15, 5, 5 minutes at RT on a shaker. Afterward, horseradish peroxidase (HRP)
conjugated antibodies; anti mouse or anti rabbit were used as secondary antibodies
depending on used primary antibodies. After incubation for 1 hrs, at RT, they were
washed in TBS-T four times for 5, 15, 5, 5 minutes on a shaker; again. Detection were
performed using chemiluminescent detection kits such as ECL + and ECL Prime +
(Amersham, UK) according to manufacturer’s recommendations and the intensity of
expected signal on membrane. In the end, X-ray films were exposed to the emitted
chemiluminescent light from the reaction of HRP and developed in X-ray developer.
Exposure time was determined relied on the detection reagent, the specific antibody
used against the protein of interest and also the expected signal intensity of interested
protein.
3.3.6 Total RNA Extraction From Cultured Cells
RNA from cell lines were extracted by using Ambion Trizol Reagent (Cat#15596,
Invitrogen, Grand Island, NY, USA) according to manufacturer’s protocol. In the end,
RNA was dissolved in 50 µl DNA/RNAase free water per 1 ml of Trizol reagent.
3.3.7 First Strand c-DNA Synthesis
First strand cDNAs were synthesized by using Fermentas RevertAid cDNA synthesis
Kit (GMBH Fermentas, Germany). The manufacturer’s instructions were followed. 0.5
- 61 -
ug RNA was used for cDNA synthesis. The oligo (dT)18 primer was added into RNA
since it primed cDNA synthesis from mRNA with poly (A) tails. Then, DNA/RNAase
free water was added up to 6 µl. After that, the sample was mixed gently, centrifuged
and incubated at 65oC for 5 minutes. Thereafter, it was chilled on ice and spinned down
( optional step on manufacturer’s instructions if The RNA template is GC rich or
contain secondary structures).Subsequent to addition of 2 µl reaction buffer, 1 µl
dNTP mix,0.5 µl RNAase inhibitor,0.5 µl Revert aid M-Mul V Reverse Transcriptase
(200u/µl ) and DNA/RNAase free water up to 10 µl , samples were mixed gently and
centrifuged. Afterwards, they were incubated 60 min at 42oC followed by heat
activation at 70oC for 5 minutes.
3.3.8 Expression Analysis Of A Gene By Quantative RT-PCR
3.3.8.1 Determination Of Primer Efficiency For Q-PCR Primers
The primers used in q-PCR were taken from published articles or the groups who had
already have annealing temperature and cycle optimizations for primers. That’s why the
optimization protocol for cycles and melting temperature were not performed but
efficiencies for the primers were calculated before the actual expression analysis by
making serial dilution of cDNA pool forming by mixing all samples. The primer
sequences and some parameters were shown on the table on next page:
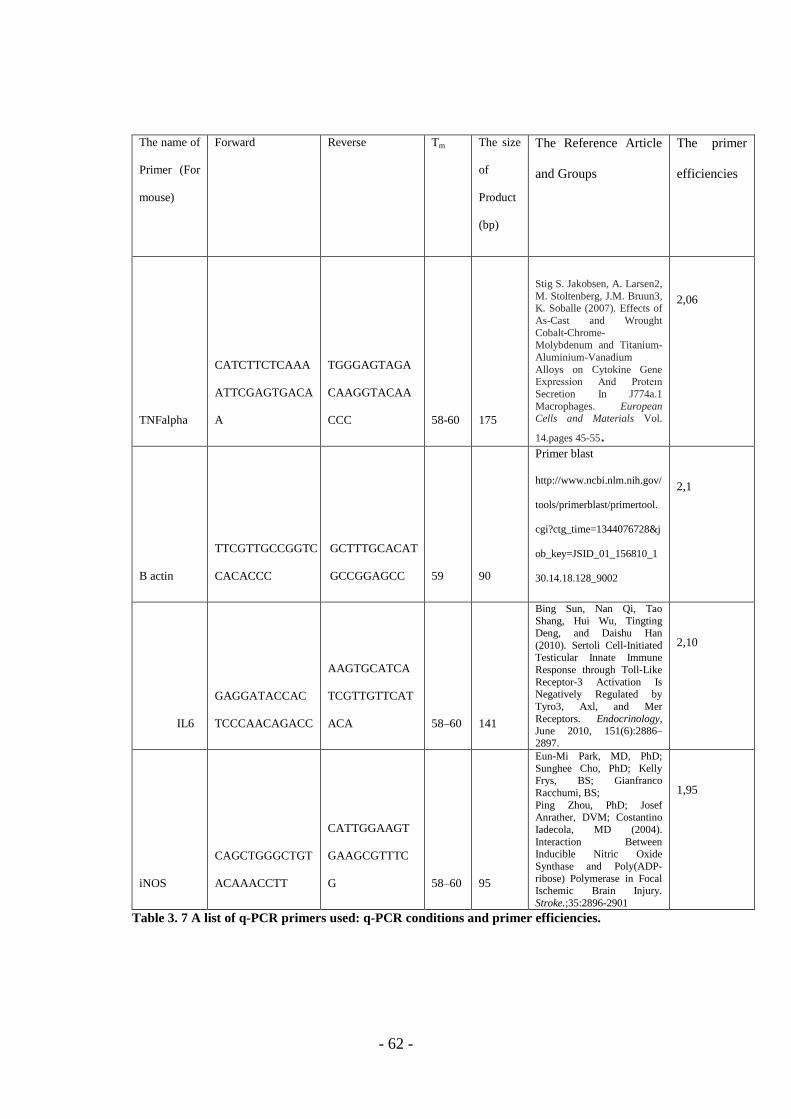
- 62 -
The name of
Primer (For
mouse)
Forward
Reverse
Tm
The size
of
Product
(bp)
The Reference Article
and Groups
The primer
efficiencies
TNFalpha
CATCTTCTCAAA
ATTCGAGTGACA
A
TGGGAGTAGA
CAAGGTACAA
CCC 58-60 175
Stig S. Jakobsen, A. Larsen2,
M. Stoltenberg, J.M. Bruun3, K. Soballe (2007). Effects of
As-Cast and Wrought
Cobalt-Chrome-
Molybdenum and Titanium-
Aluminium-Vanadium
Alloys on Cytokine Gene Expression And Proteın
Secretion In J774a.1
Macrophages. European Cells and Materials Vol.
14.pages 45-55.
2,06
B actin
TTCGTTGCCGGTC
CACACCC
GCTTTGCACAT
GCCGGAGCC 59 90
Primer blast
http://www.ncbi.nlm.nih.gov/
tools/primerblast/primertool.
cgi?ctg_time=1344076728&j
ob_key=JSID_01_156810_1
30.14.18.128_9002
2,1
IL6
GAGGATACCAC
TCCCAACAGACC
AAGTGCATCA
TCGTTGTTCAT
ACA 58–60 141
Bing Sun, Nan Qi, Tao
Shang, Hui Wu, Tingting Deng, and Daishu Han
(2010). Sertoli Cell-Initiated Testicular Innate Immune
Response through Toll-Like
Receptor-3 Activation Is Negatively Regulated by
Tyro3, Axl, and Mer
Receptors. Endocrinology, June 2010, 151(6):2886–
2897.
2,10
iNOS
CAGCTGGGCTGT
ACAAACCTT
CATTGGAAGT
GAAGCGTTTC
G 58–60 95
Eun-Mi Park, MD, PhD;
Sunghee Cho, PhD; Kelly Frys, BS; Gianfranco
Racchumi, BS;
Ping Zhou, PhD; Josef
Anrather, DVM; Costantino
Iadecola, MD (2004).
Interaction Between Inducible Nitric Oxide
Synthase and Poly(ADP-
ribose) Polymerase in Focal Ischemic Brain Injury.
Stroke.;35:2896-2901
1,95
Table 3. 7 A list of q-PCR primers used: q-PCR conditions and primer efficiencies.
- 63 -
3.3.8.2 Expression analysis of genes by quantative RT-PCR (q-PCR)
Quantitative PCR analysis was performed by using Inceptra Cycler 9660. DyNAmo HS
Syber Green q-PCR kit from Finnzymes was used for q-PCR experiments followed by
manufacturer’s protocol. The amount of 2x DyNAmo master mix was changed into 7 ul
instead of 10 ul. The reactions were prepared in 20 ul total volume containing 1 ul
cDNA sample. The reactions started with initial denaturation step at 95oC for10
minutes. Then, 40 cycles of amplification reaction was done at 95o 30 seconds, at 60
oC
30 seconds, at 72oC 30 seconds with final extension at 72
oC 5 minutes. After that,
melting temperature step was followed at 95oC 20 seconds ended with one more step for
annealing and extension time to make sure all samples were double stranded in case
they were run on agarose gel for further steps. Expression levels of the genes were
calculated depending on the Ct value of the amplification of the interested gene and
reference gene (β actin or 18S) and efficiencies of primer used. Relative quantification
was statistically performed with the help of formula (Primer efficiency)-ΔΔCt
where
ΔΔCt means ΔCt (sample)- ΔCt ( calibrator) and was the Ct of the target gene
subtracted from the CT of the housekeeping gene and Ct (threshold cycle) was the
intersection between an amplification curve and a threshold line. All experiments were
performed in duplicates of each sample.
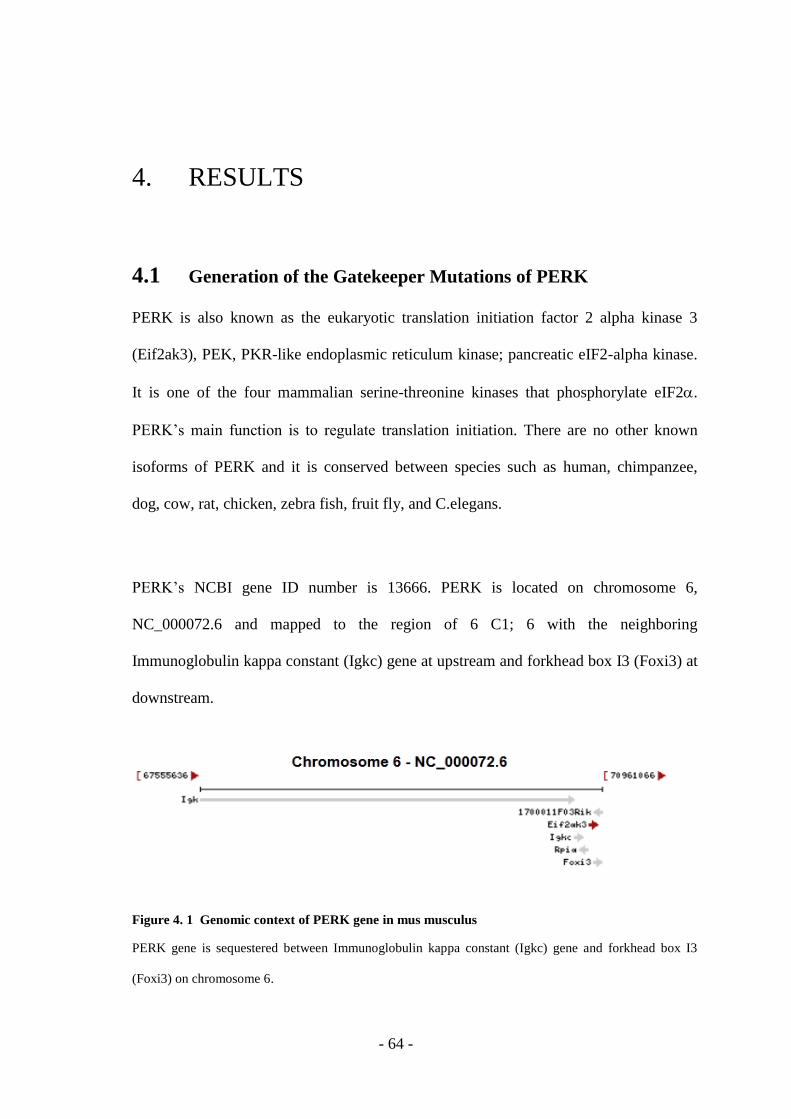
- 64 -
4. RESULTS
4.1 Generation of the Gatekeeper Mutations of PERK
PERK is also known as the eukaryotic translation initiation factor 2 alpha kinase 3
(Eif2ak3), PEK, PKR-like endoplasmic reticulum kinase; pancreatic eIF2-alpha kinase.
It is one of the four mammalian serine-threonine kinases that phosphorylate eIF2.
PERK’s main function is to regulate translation initiation. There are no other known
isoforms of PERK and it is conserved between species such as human, chimpanzee,
dog, cow, rat, chicken, zebra fish, fruit fly, and C.elegans.
PERK’s NCBI gene ID number is 13666. PERK is located on chromosome 6,
NC_000072.6 and mapped to the region of 6 C1; 6 with the neighboring
Immunoglobulin kappa constant (Igkc) gene at upstream and forkhead box I3 (Foxi3) at
downstream.
Figure 4. 1 Genomic context of PERK gene in mus musculus
PERK gene is sequestered between Immunoglobulin kappa constant (Igkc) gene and forkhead box I3
(Foxi3) on chromosome 6.
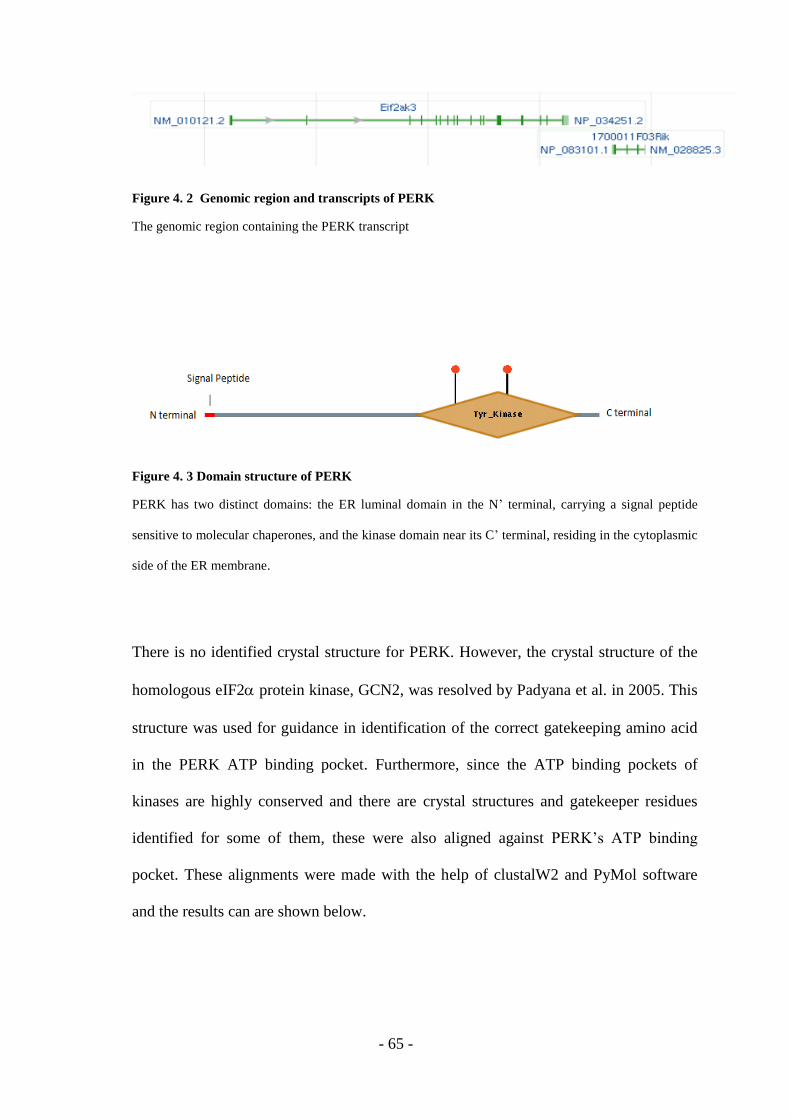
- 65 -
Figure 4. 2 Genomic region and transcripts of PERK
The genomic region containing the PERK transcript
Figure 4. 3 Domain structure of PERK
PERK has two distinct domains: the ER luminal domain in the N’ terminal, carrying a signal peptide
sensitive to molecular chaperones, and the kinase domain near its C’ terminal, residing in the cytoplasmic
side of the ER membrane.
There is no identified crystal structure for PERK. However, the crystal structure of the
homologous eIF2 protein kinase, GCN2, was resolved by Padyana et al. in 2005. This
structure was used for guidance in identification of the correct gatekeeping amino acid
in the PERK ATP binding pocket. Furthermore, since the ATP binding pockets of
kinases are highly conserved and there are crystal structures and gatekeeper residues
identified for some of them, these were also aligned against PERK’s ATP binding
pocket. These alignments were made with the help of clustalW2 and PyMol software
and the results can are shown below.
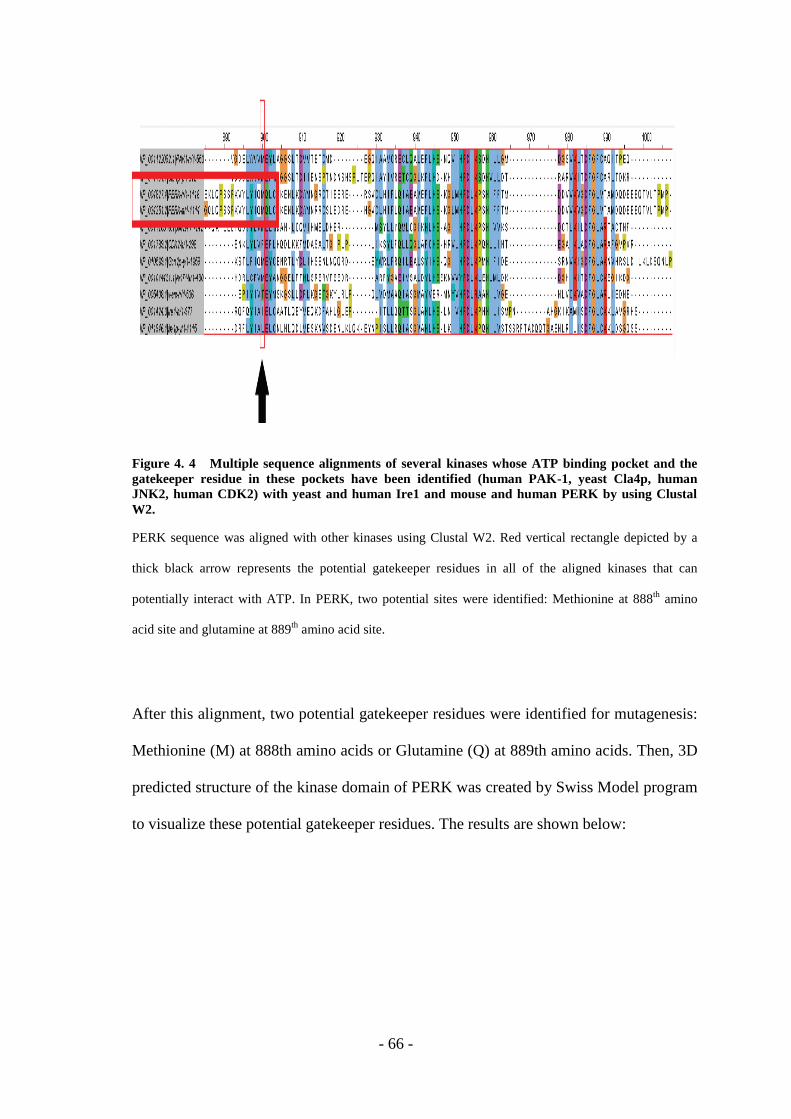
- 66 -
Figure 4. 4 Multiple sequence alignments of several kinases whose ATP binding pocket and the
gatekeeper residue in these pockets have been identified (human PAK-1, yeast Cla4p, human
JNK2, human CDK2) with yeast and human Ire1 and mouse and human PERK by using Clustal
W2.
PERK sequence was aligned with other kinases using Clustal W2. Red vertical rectangle depicted by a
thick black arrow represents the potential gatekeeper residues in all of the aligned kinases that can
potentially interact with ATP. In PERK, two potential sites were identified: Methionine at 888th
amino
acid site and glutamine at 889th
amino acid site.
After this alignment, two potential gatekeeper residues were identified for mutagenesis:
Methionine (M) at 888th amino acids or Glutamine (Q) at 889th amino acids. Then, 3D
predicted structure of the kinase domain of PERK was created by Swiss Model program
to visualize these potential gatekeeper residues. The results are shown below:
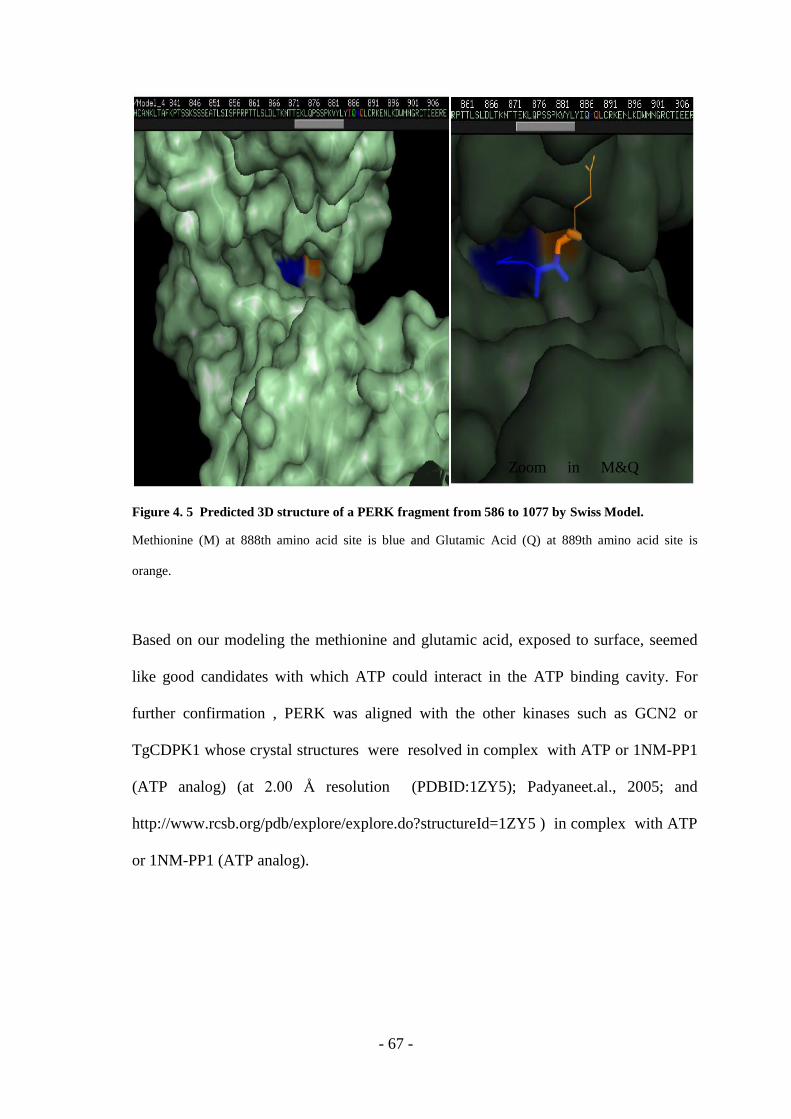
- 67 -
Figure 4. 5 Predicted 3D structure of a PERK fragment from 586 to 1077 by Swiss Model.
Methionine (M) at 888th amino acid site is blue and Glutamic Acid (Q) at 889th amino acid site is
orange.
Based on our modeling the methionine and glutamic acid, exposed to surface, seemed
like good candidates with which ATP could interact in the ATP binding cavity. For
further confirmation , PERK was aligned with the other kinases such as GCN2 or
TgCDPK1 whose crystal structures were resolved in complex with ATP or 1NM-PP1
(ATP analog) (at 2.00 Å resolution (PDBID:1ZY5); Padyaneet.al., 2005; and
http://www.rcsb.org/pdb/explore/explore.do?structureId=1ZY5 ) in complex with ATP
or 1NM-PP1 (ATP analog).
Zoom in M&Q
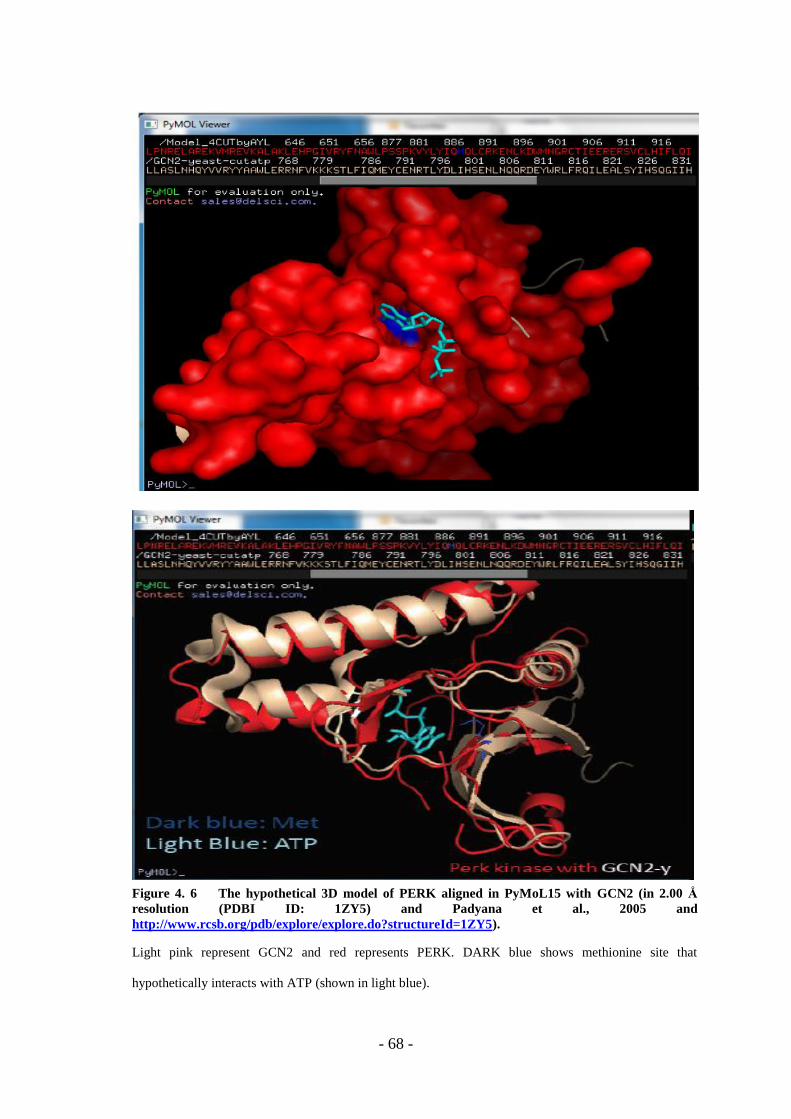
- 68 -
Figure 4. 6 The hypothetical 3D model of PERK aligned in PyMoL15 with GCN2 (in 2.00 Å
resolution (PDBI ID: 1ZY5) and Padyana et al., 2005 and
http://www.rcsb.org/pdb/explore/explore.do?structureId=1ZY5).
Light pink represent GCN2 and red represents PERK. DARK blue shows methionine site that
hypothetically interacts with ATP (shown in light blue).

- 69 -
Figure 4. 7 The hypothetical 3D model of PERK in PyMol 15 with TgCDPK1 in a complex with
1NM-PP1 complex (in 2.04 Å resolution (PDB ID: 3I79) and Kayode et al., 2010 and
http://www.rcsb.org/pdb/explore/explore.do?structureId=3I79).
Grey represents TgCDPKI and light blue represents PERK. Yellow and Green show methionine and
glutamine site, respectively, which can potentially interact with 1NM-PP1 shown red.
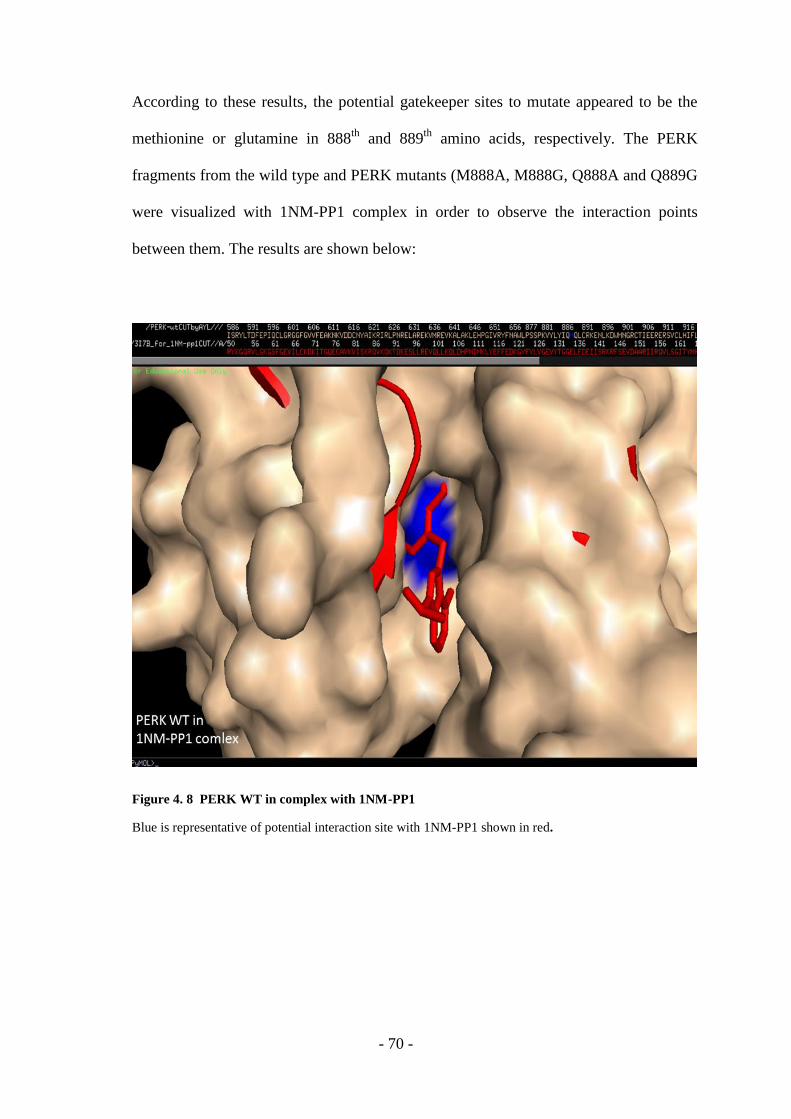
- 70 -
According to these results, the potential gatekeeper sites to mutate appeared to be the
methionine or glutamine in 888th
and 889th
amino acids, respectively. The PERK
fragments from the wild type and PERK mutants (M888A, M888G, Q888A and Q889G
were visualized with 1NM-PP1 complex in order to observe the interaction points
between them. The results are shown below:
Figure 4. 8 PERK WT in complex with 1NM-PP1
Blue is representative of potential interaction site with 1NM-PP1 shown in red.
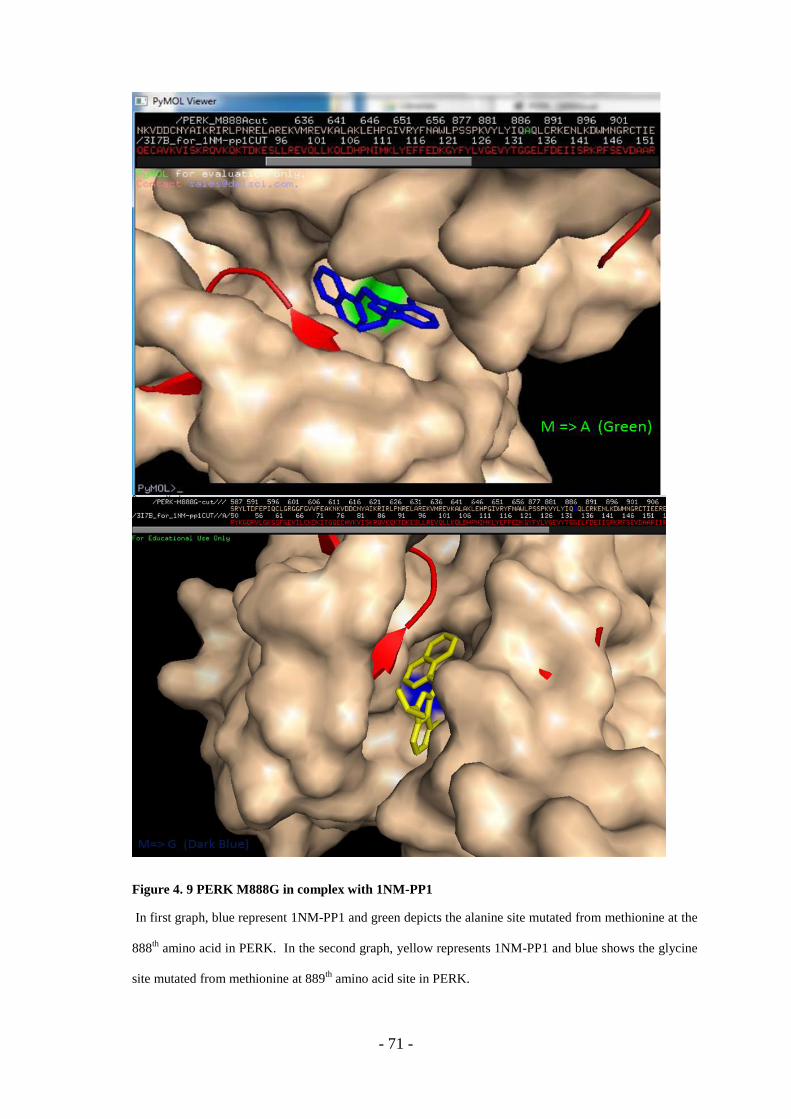
- 71 -
Figure 4. 9 PERK M888G in complex with 1NM-PP1
In first graph, blue represent 1NM-PP1 and green depicts the alanine site mutated from methionine at the
888th
amino acid in PERK. In the second graph, yellow represents 1NM-PP1 and blue shows the glycine
site mutated from methionine at 889th
amino acid site in PERK.
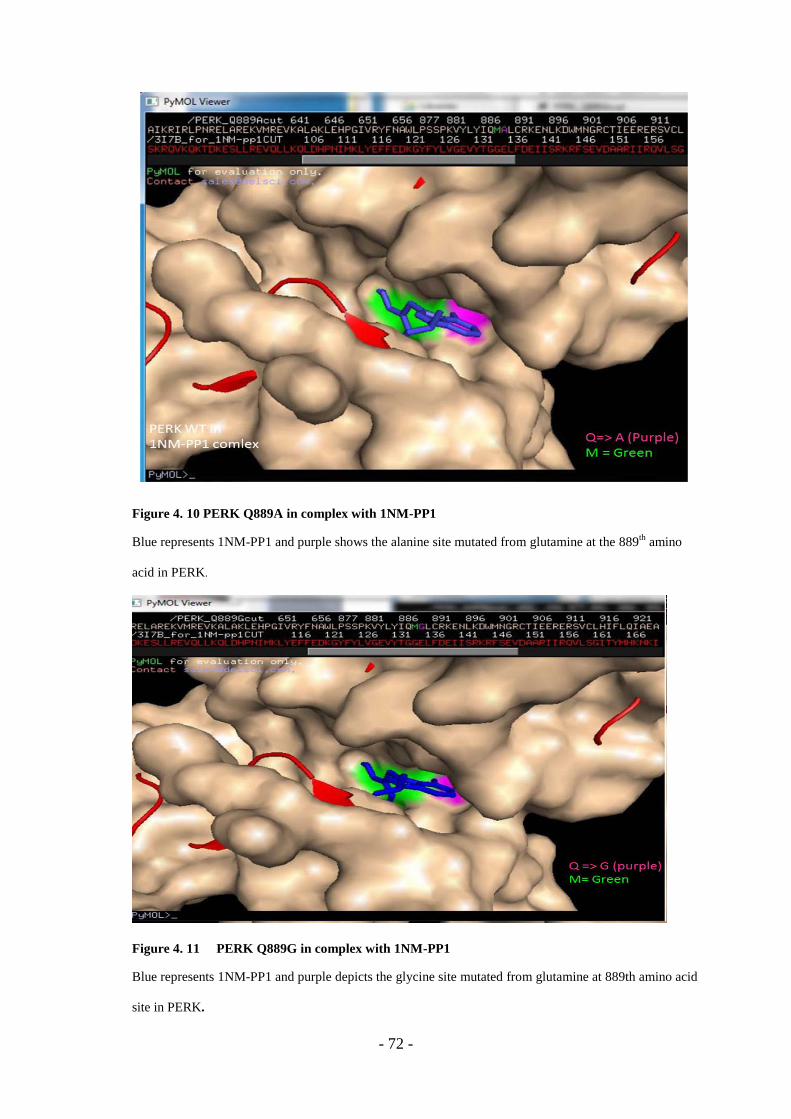
- 72 -
Figure 4. 10 PERK Q889A in complex with 1NM-PP1
Blue represents 1NM-PP1 and purple shows the alanine site mutated from glutamine at the 889th
amino
acid in PERK.
Figure 4. 11 PERK Q889G in complex with 1NM-PP1
Blue represents 1NM-PP1 and purple depicts the glycine site mutated from glutamine at 889th amino acid
site in PERK.
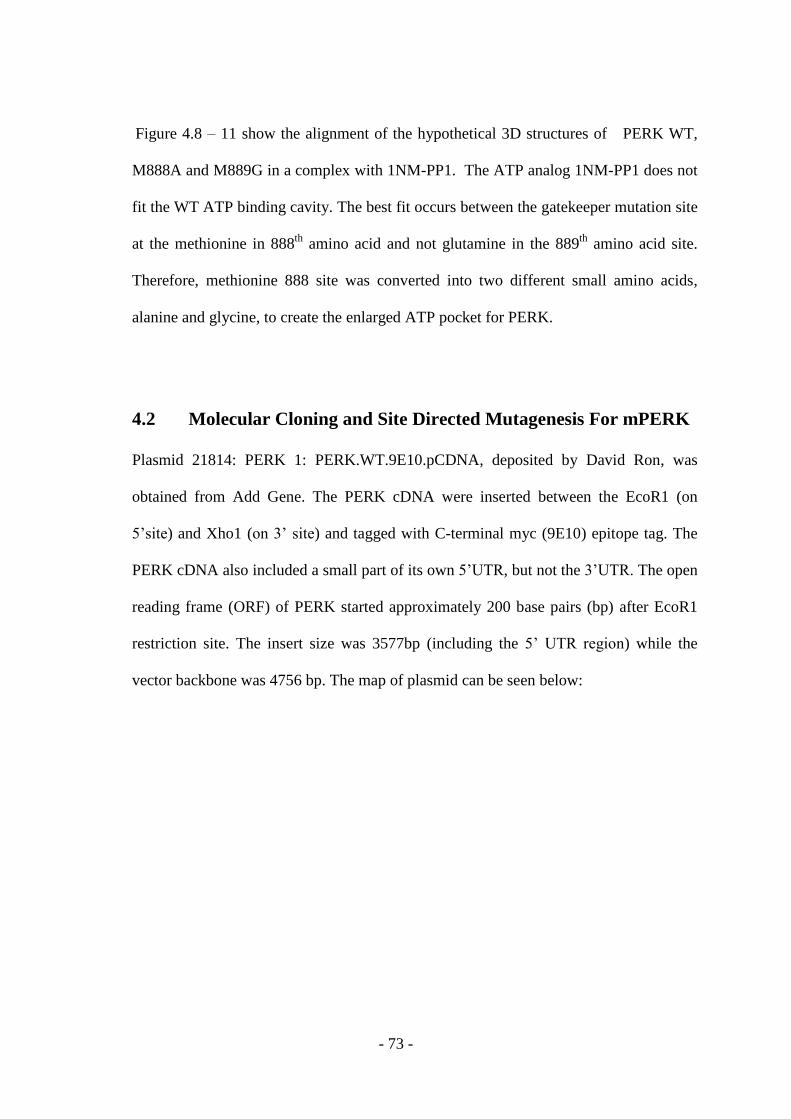
- 73 -
Figure 4.8 – 11 show the alignment of the hypothetical 3D structures of PERK WT,
M888A and M889G in a complex with 1NM-PP1. The ATP analog 1NM-PP1 does not
fit the WT ATP binding cavity. The best fit occurs between the gatekeeper mutation site
at the methionine in 888th
amino acid and not glutamine in the 889th
amino acid site.
Therefore, methionine 888 site was converted into two different small amino acids,
alanine and glycine, to create the enlarged ATP pocket for PERK.
4.2 Molecular Cloning and Site Directed Mutagenesis For mPERK
Plasmid 21814: PERK 1: PERK.WT.9E10.pCDNA, deposited by David Ron, was
obtained from Add Gene. The PERK cDNA were inserted between the EcoR1 (on
5’site) and Xho1 (on 3’ site) and tagged with C-terminal myc (9E10) epitope tag. The
PERK cDNA also included a small part of its own 5’UTR, but not the 3’UTR. The open
reading frame (ORF) of PERK started approximately 200 base pairs (bp) after EcoR1
restriction site. The insert size was 3577bp (including the 5’ UTR region) while the
vector backbone was 4756 bp. The map of plasmid can be seen below:
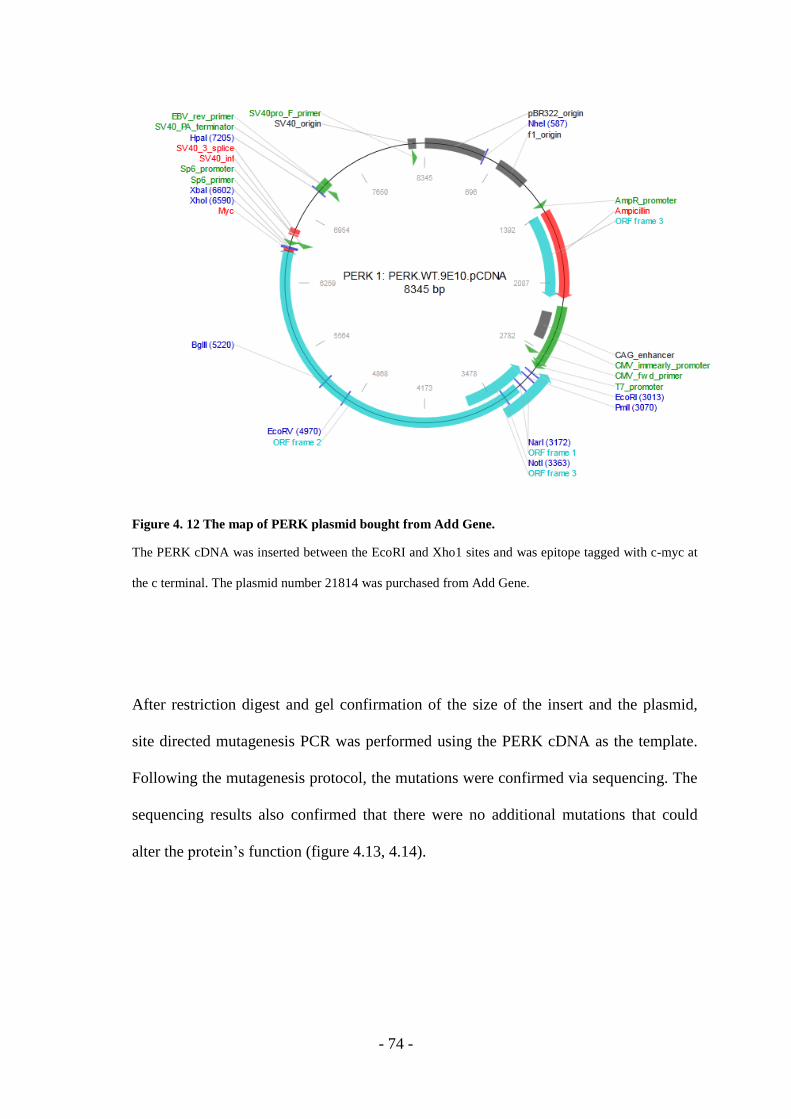
- 74 -
Figure 4. 12 The map of PERK plasmid bought from Add Gene.
The PERK cDNA was inserted between the EcoRI and Xho1 sites and was epitope tagged with c-myc at
the c terminal. The plasmid number 21814 was purchased from Add Gene.
After restriction digest and gel confirmation of the size of the insert and the plasmid,
site directed mutagenesis PCR was performed using the PERK cDNA as the template.
Following the mutagenesis protocol, the mutations were confirmed via sequencing. The
sequencing results also confirmed that there were no additional mutations that could
alter the protein’s function (figure 4.13, 4.14).
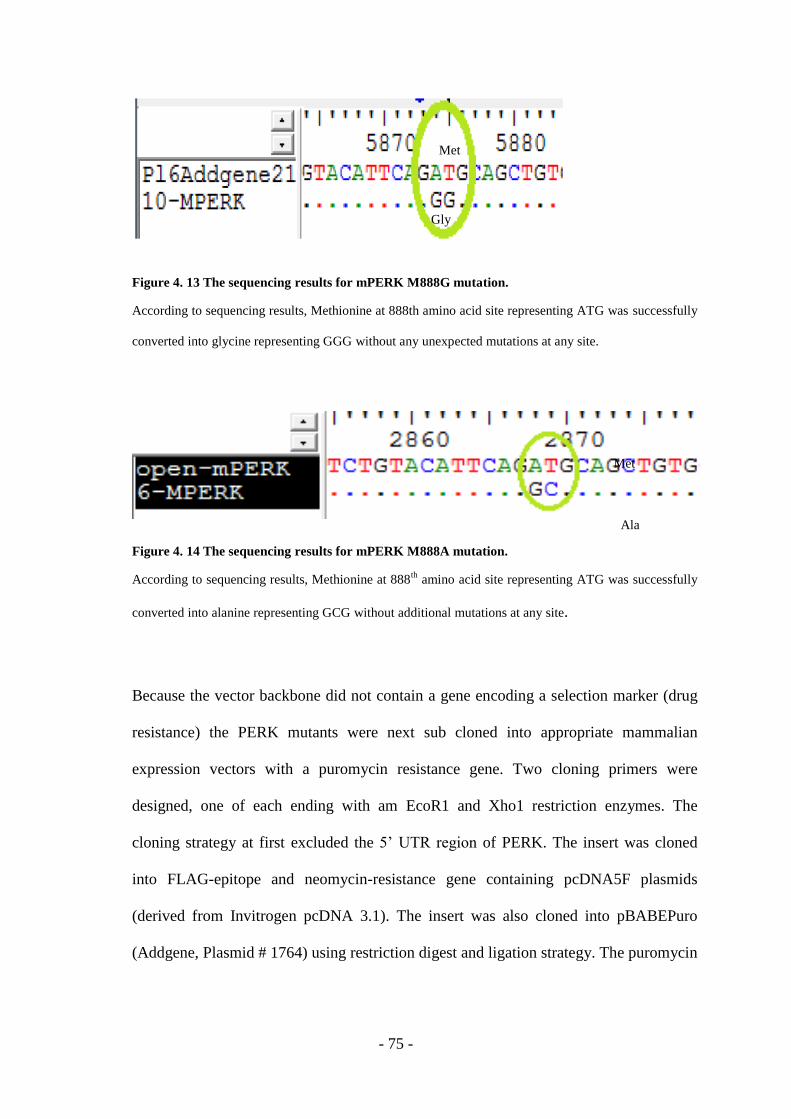
- 75 -
Figure 4. 13 The sequencing results for mPERK M888G mutation.
According to sequencing results, Methionine at 888th amino acid site representing ATG was successfully
converted into glycine representing GGG without any unexpected mutations at any site.
Figure 4. 14 The sequencing results for mPERK M888A mutation.
According to sequencing results, Methionine at 888th
amino acid site representing ATG was successfully
converted into alanine representing GCG without additional mutations at any site.
Because the vector backbone did not contain a gene encoding a selection marker (drug
resistance) the PERK mutants were next sub cloned into appropriate mammalian
expression vectors with a puromycin resistance gene. Two cloning primers were
designed, one of each ending with am EcoR1 and Xho1 restriction enzymes. The
cloning strategy at first excluded the 5’ UTR region of PERK. The insert was cloned
into FLAG-epitope and neomycin-resistance gene containing pcDNA5F plasmids
(derived from Invitrogen pcDNA 3.1). The insert was also cloned into pBABEPuro
(Addgene, Plasmid # 1764) using restriction digest and ligation strategy. The puromycin
Met
Ala
Met
Gly
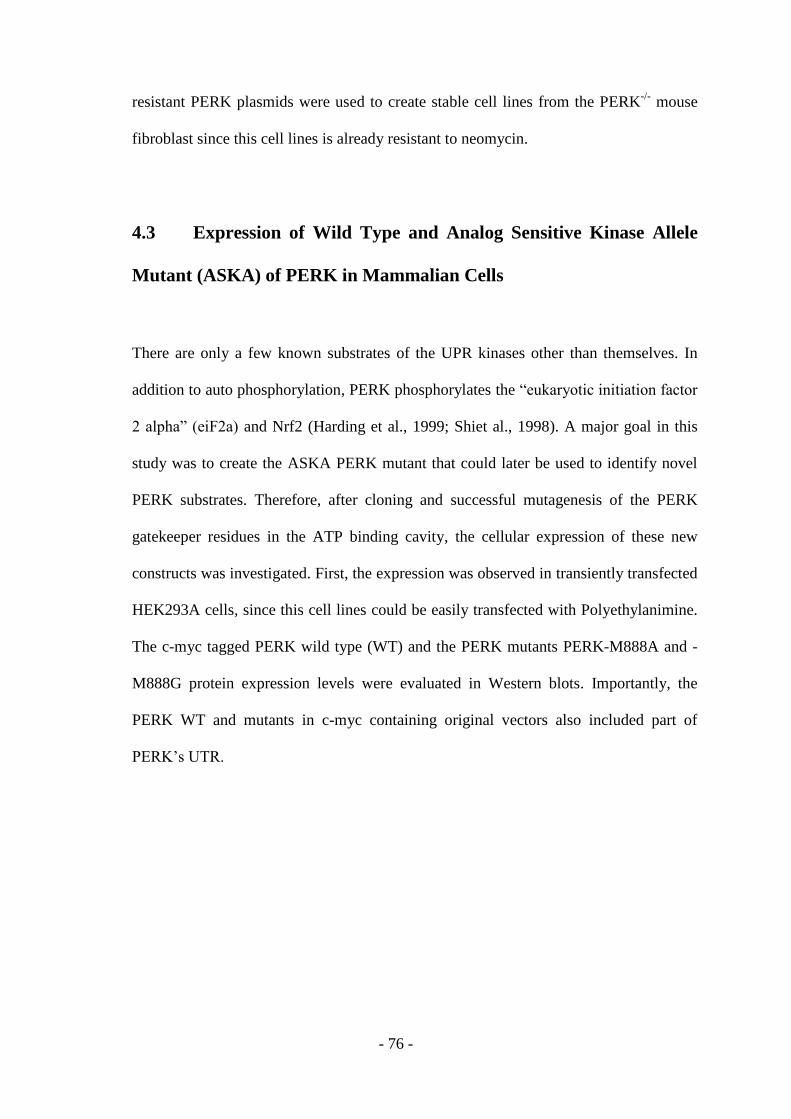
- 76 -
resistant PERK plasmids were used to create stable cell lines from the PERK-/-
mouse
fibroblast since this cell lines is already resistant to neomycin.
4.3 Expression of Wild Type and Analog Sensitive Kinase Allele
Mutant (ASKA) of PERK in Mammalian Cells
There are only a few known substrates of the UPR kinases other than themselves. In
addition to auto phosphorylation, PERK phosphorylates the “eukaryotic initiation factor
2 alpha” (eiF2a) and Nrf2 (Harding et al., 1999; Shiet al., 1998). A major goal in this
study was to create the ASKA PERK mutant that could later be used to identify novel
PERK substrates. Therefore, after cloning and successful mutagenesis of the PERK
gatekeeper residues in the ATP binding cavity, the cellular expression of these new
constructs was investigated. First, the expression was observed in transiently transfected
HEK293A cells, since this cell lines could be easily transfected with Polyethylanimine.
The c-myc tagged PERK wild type (WT) and the PERK mutants PERK-M888A and -
M888G protein expression levels were evaluated in Western blots. Importantly, the
PERK WT and mutants in c-myc containing original vectors also included part of
PERK’s UTR.
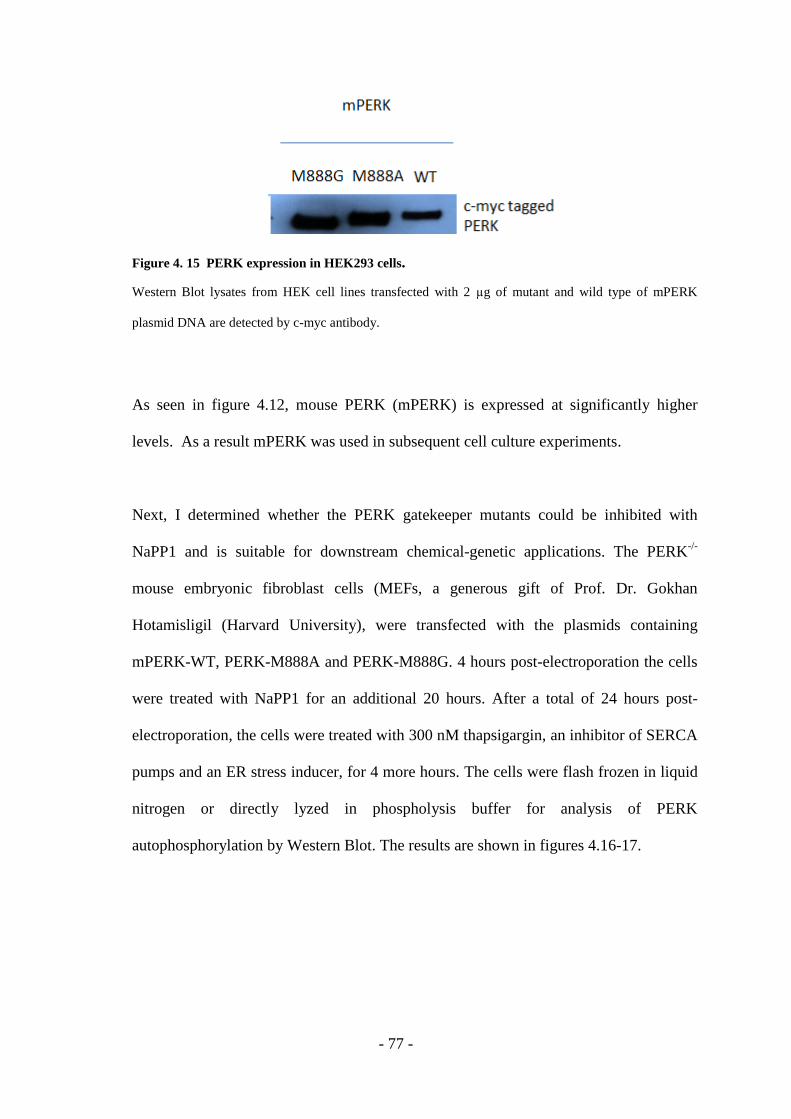
- 77 -
Figure 4. 15 PERK expression in HEK293 cells.
Western Blot lysates from HEK cell lines transfected with 2 µg of mutant and wild type of mPERK
plasmid DNA are detected by c-myc antibody.
As seen in figure 4.12, mouse PERK (mPERK) is expressed at significantly higher
levels. As a result mPERK was used in subsequent cell culture experiments.
Next, I determined whether the PERK gatekeeper mutants could be inhibited with
NaPP1 and is suitable for downstream chemical-genetic applications. The PERK-/-
mouse embryonic fibroblast cells (MEFs, a generous gift of Prof. Dr. Gokhan
Hotamisligil (Harvard University), were transfected with the plasmids containing
mPERK-WT, PERK-M888A and PERK-M888G. 4 hours post-electroporation the cells
were treated with NaPP1 for an additional 20 hours. After a total of 24 hours post-
electroporation, the cells were treated with 300 nM thapsigargin, an inhibitor of SERCA
pumps and an ER stress inducer, for 4 more hours. The cells were flash frozen in liquid
nitrogen or directly lyzed in phospholysis buffer for analysis of PERK
autophosphorylation by Western Blot. The results are shown in figures 4.16-17.
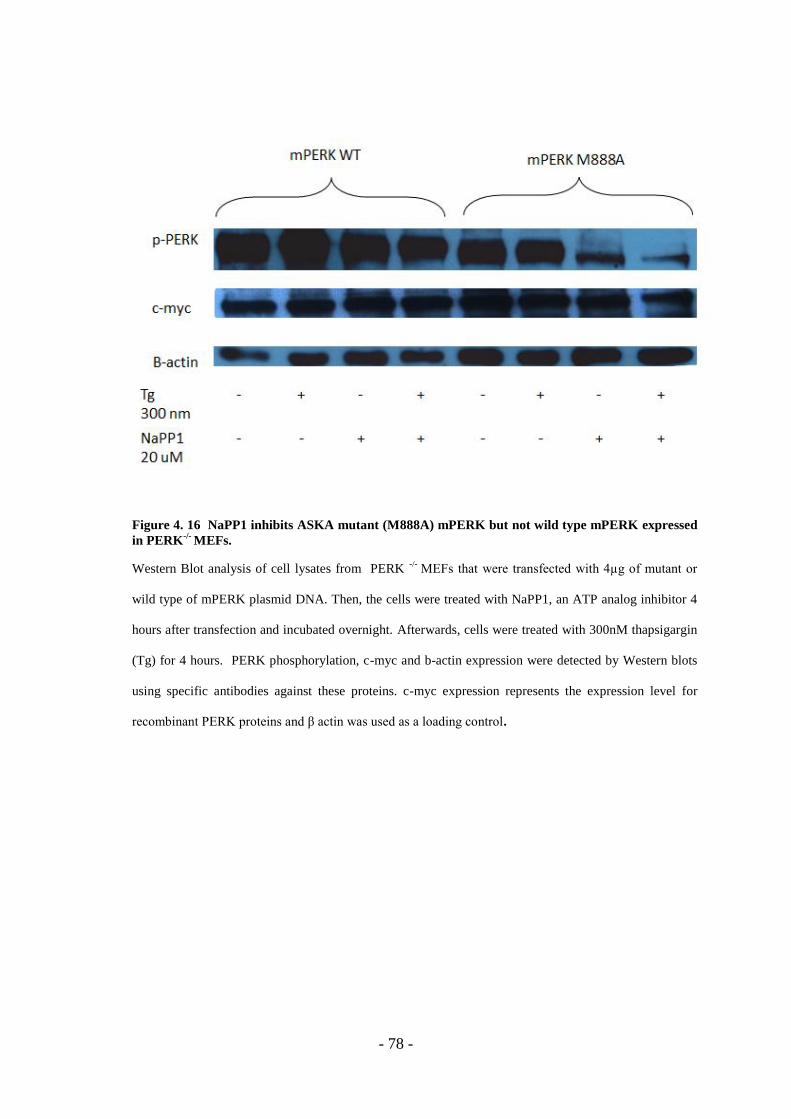
- 78 -
Figure 4. 16 NaPP1 inhibits ASKA mutant (M888A) mPERK but not wild type mPERK expressed
in PERK-/-
MEFs.
Western Blot analysis of cell lysates from PERK -/-
MEFs that were transfected with 4µg of mutant or
wild type of mPERK plasmid DNA. Then, the cells were treated with NaPP1, an ATP analog inhibitor 4
hours after transfection and incubated overnight. Afterwards, cells were treated with 300nM thapsigargin
(Tg) for 4 hours. PERK phosphorylation, c-myc and b-actin expression were detected by Western blots
using specific antibodies against these proteins. c-myc expression represents the expression level for
recombinant PERK proteins and β actin was used as a loading control.
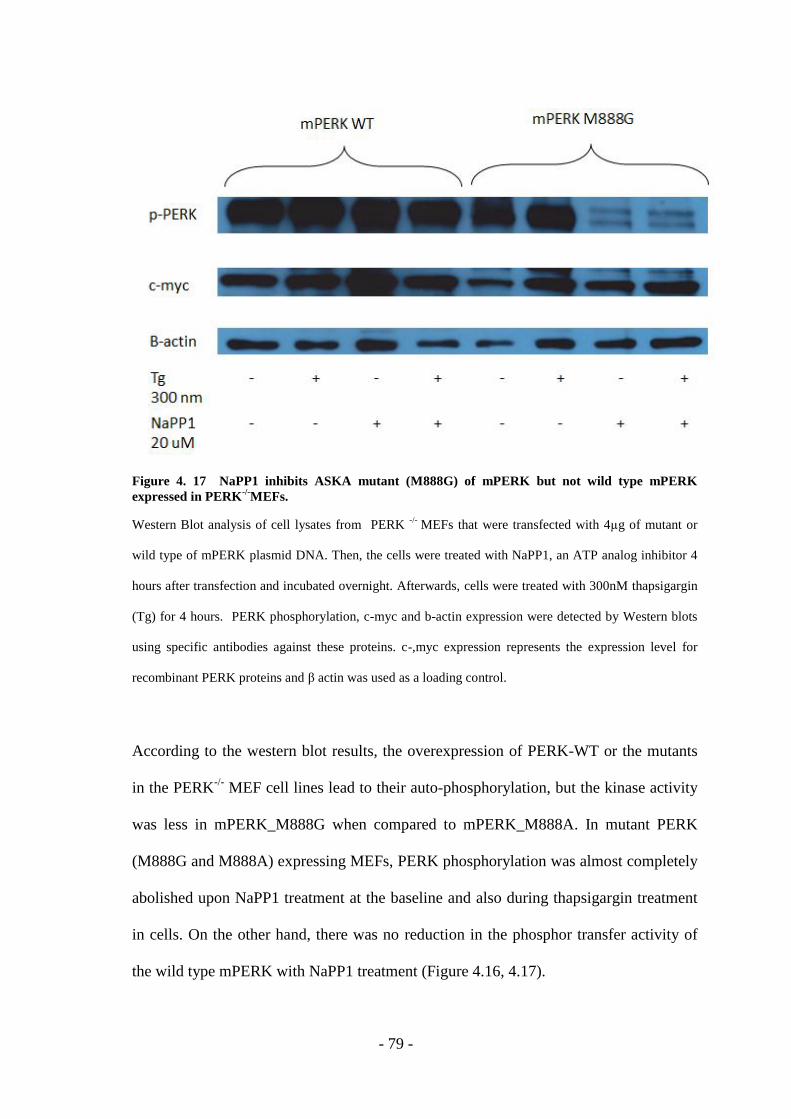
- 79 -
Figure 4. 17 NaPP1 inhibits ASKA mutant (M888G) of mPERK but not wild type mPERK
expressed in PERK-/-
MEFs.
Western Blot analysis of cell lysates from PERK -/-
MEFs that were transfected with 4µg of mutant or
wild type of mPERK plasmid DNA. Then, the cells were treated with NaPP1, an ATP analog inhibitor 4
hours after transfection and incubated overnight. Afterwards, cells were treated with 300nM thapsigargin
(Tg) for 4 hours. PERK phosphorylation, c-myc and b-actin expression were detected by Western blots
using specific antibodies against these proteins. c-,myc expression represents the expression level for
recombinant PERK proteins and β actin was used as a loading control.
According to the western blot results, the overexpression of PERK-WT or the mutants
in the PERK-/-
MEF cell lines lead to their auto-phosphorylation, but the kinase activity
was less in mPERK_M888G when compared to mPERK_M888A. In mutant PERK
(M888G and M888A) expressing MEFs, PERK phosphorylation was almost completely
abolished upon NaPP1 treatment at the baseline and also during thapsigargin treatment
in cells. On the other hand, there was no reduction in the phosphor transfer activity of
the wild type mPERK with NaPP1 treatment (Figure 4.16, 4.17).
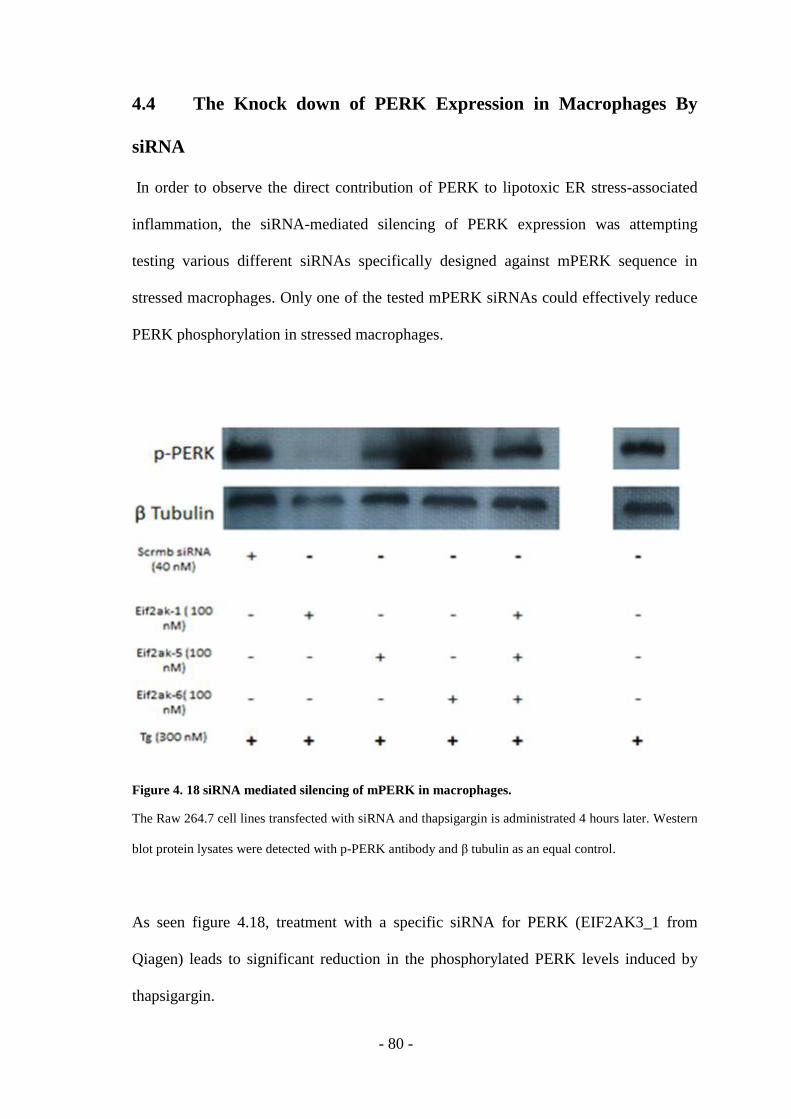
- 80 -
4.4 The Knock down of PERK Expression in Macrophages By
siRNA
In order to observe the direct contribution of PERK to lipotoxic ER stress-associated
inflammation, the siRNA-mediated silencing of PERK expression was attempting
testing various different siRNAs specifically designed against mPERK sequence in
stressed macrophages. Only one of the tested mPERK siRNAs could effectively reduce
PERK phosphorylation in stressed macrophages.
Figure 4. 18 siRNA mediated silencing of mPERK in macrophages.
The Raw 264.7 cell lines transfected with siRNA and thapsigargin is administrated 4 hours later. Western
blot protein lysates were detected with p-PERK antibody and β tubulin as an equal control.
As seen figure 4.18, treatment with a specific siRNA for PERK (EIF2AK3_1 from
Qiagen) leads to significant reduction in the phosphorylated PERK levels induced by
thapsigargin.
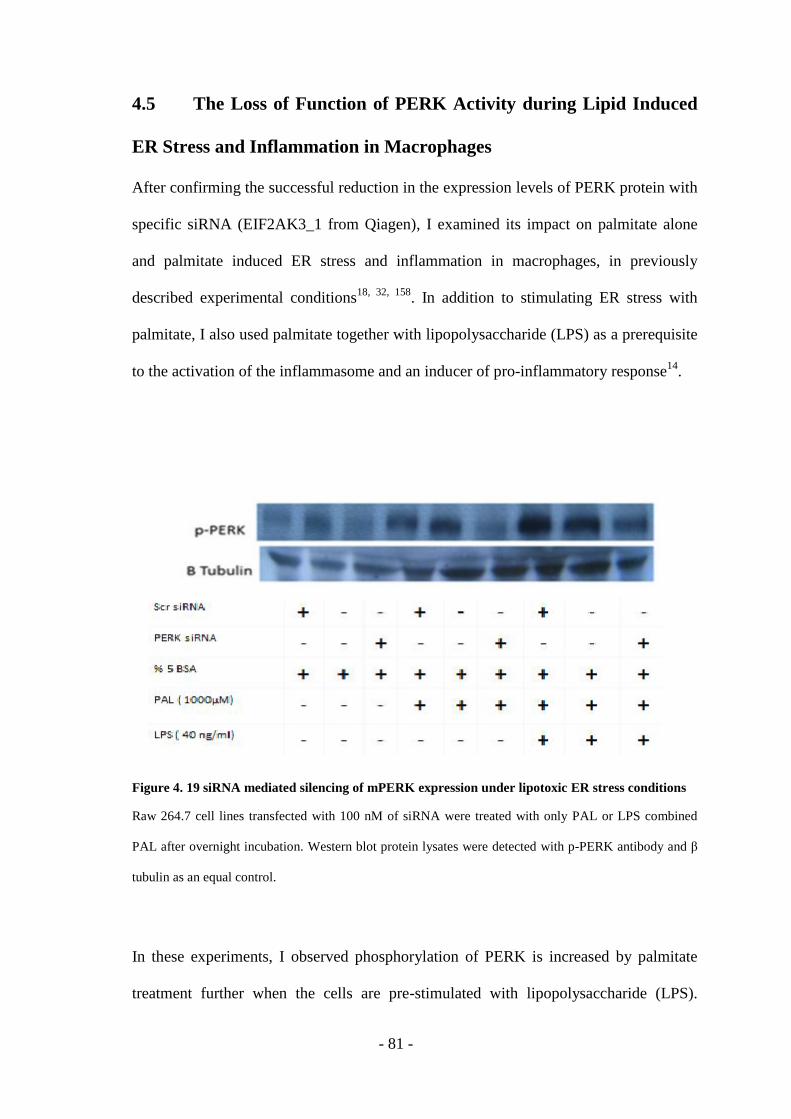
- 81 -
4.5 The Loss of Function of PERK Activity during Lipid Induced
ER Stress and Inflammation in Macrophages
After confirming the successful reduction in the expression levels of PERK protein with
specific siRNA (EIF2AK3_1 from Qiagen), I examined its impact on palmitate alone
and palmitate induced ER stress and inflammation in macrophages, in previously
described experimental conditions18, 32, 158
. In addition to stimulating ER stress with
palmitate, I also used palmitate together with lipopolysaccharide (LPS) as a prerequisite
to the activation of the inflammasome and an inducer of pro-inflammatory response14
.
Figure 4. 19 siRNA mediated silencing of mPERK expression under lipotoxic ER stress conditions
Raw 264.7 cell lines transfected with 100 nM of siRNA were treated with only PAL or LPS combined
PAL after overnight incubation. Western blot protein lysates were detected with p-PERK antibody and β
tubulin as an equal control.
In these experiments, I observed phosphorylation of PERK is increased by palmitate
treatment further when the cells are pre-stimulated with lipopolysaccharide (LPS).
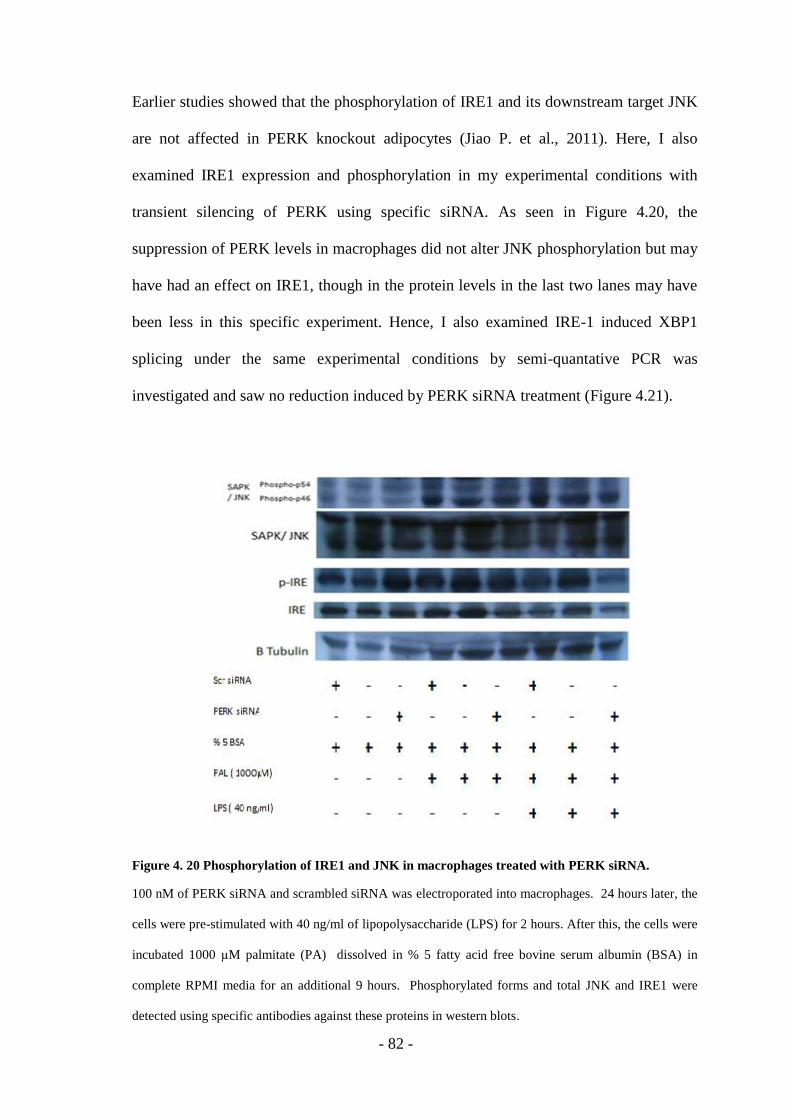
- 82 -
Earlier studies showed that the phosphorylation of IRE1 and its downstream target JNK
are not affected in PERK knockout adipocytes (Jiao P. et al., 2011). Here, I also
examined IRE1 expression and phosphorylation in my experimental conditions with
transient silencing of PERK using specific siRNA. As seen in Figure 4.20, the
suppression of PERK levels in macrophages did not alter JNK phosphorylation but may
have had an effect on IRE1, though in the protein levels in the last two lanes may have
been less in this specific experiment. Hence, I also examined IRE-1 induced XBP1
splicing under the same experimental conditions by semi-quantative PCR was
investigated and saw no reduction induced by PERK siRNA treatment (Figure 4.21).
Figure 4. 20 Phosphorylation of IRE1 and JNK in macrophages treated with PERK siRNA.
100 nM of PERK siRNA and scrambled siRNA was electroporated into macrophages. 24 hours later, the
cells were pre-stimulated with 40 ng/ml of lipopolysaccharide (LPS) for 2 hours. After this, the cells were
incubated 1000 µM palmitate (PA) dissolved in % 5 fatty acid free bovine serum albumin (BSA) in
complete RPMI media for an additional 9 hours. Phosphorylated forms and total JNK and IRE1 were
detected using specific antibodies against these proteins in western blots.
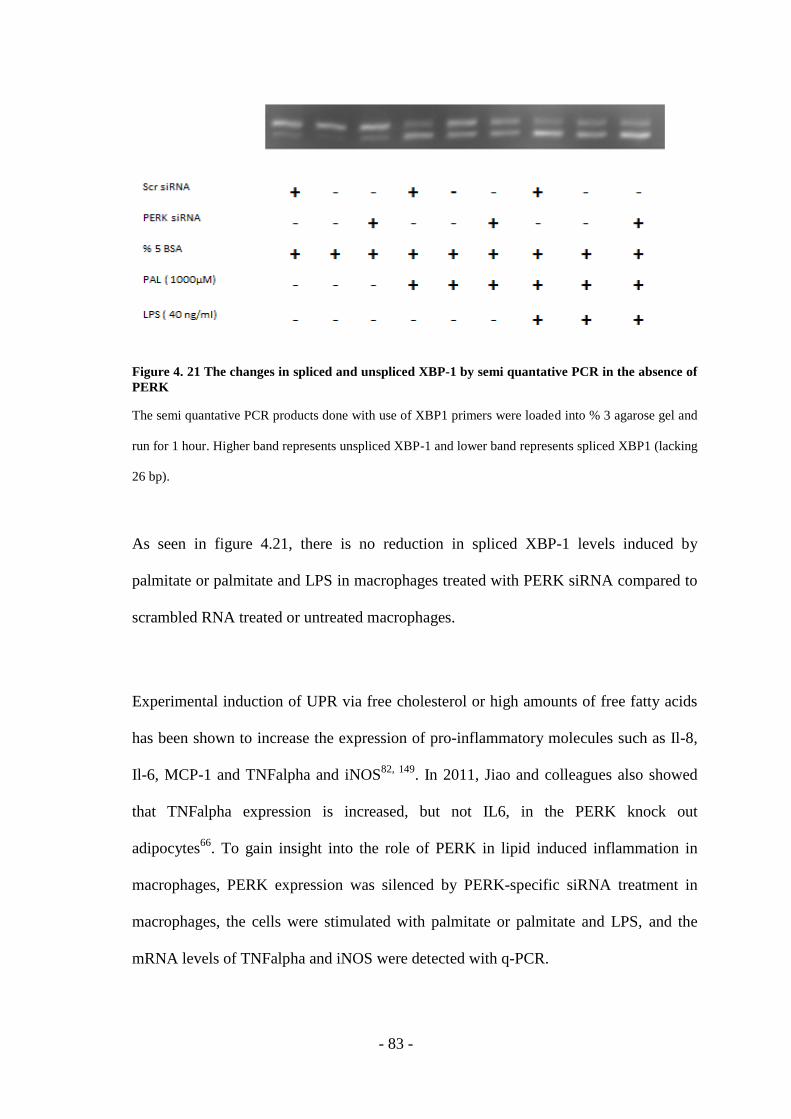
- 83 -
Figure 4. 21 The changes in spliced and unspliced XBP-1 by semi quantative PCR in the absence of
PERK
The semi quantative PCR products done with use of XBP1 primers were loaded into % 3 agarose gel and
run for 1 hour. Higher band represents unspliced XBP-1 and lower band represents spliced XBP1 (lacking
26 bp).
As seen in figure 4.21, there is no reduction in spliced XBP-1 levels induced by
palmitate or palmitate and LPS in macrophages treated with PERK siRNA compared to
scrambled RNA treated or untreated macrophages.
Experimental induction of UPR via free cholesterol or high amounts of free fatty acids
has been shown to increase the expression of pro-inflammatory molecules such as Il-8,
Il-6, MCP-1 and TNFalpha and iNOS82, 149
. In 2011, Jiao and colleagues also showed
that TNFalpha expression is increased, but not IL6, in the PERK knock out
adipocytes66
. To gain insight into the role of PERK in lipid induced inflammation in
macrophages, PERK expression was silenced by PERK-specific siRNA treatment in
macrophages, the cells were stimulated with palmitate or palmitate and LPS, and the
mRNA levels of TNFalpha and iNOS were detected with q-PCR.

- 84 -
- 85 -
Figure 4. 22 The changes in lipid-induced cytokine expression in the absence of PERK
Reduction of PERK levels was achieved by transfection of PERK-specific siRNA to macrophages. The
cells were treated with only LPS or LPS combined PAL TNFalpha and iNOS expression was determined
by qPCR. The values depicted in the graphs represent the mean of three experiments and the standard
deviations (SD) were shown on the bars. Student T-test was performed to determine significance (* P
<0.05).
These results imply that suppression of PERK activity leads to further induction of
iNOS and TNFalpha upon stressing macrophages with palmitate and LPS pre-
stimulation.
4.6 Palmitate-LPS Induced Inflammation and Its Reduction with
Palmitoleic Acid
Saturated fatty acid (such as palmitate) or cholesterol administration to cells is known to
lead to ER stress and cytotoxicity18, 32, 158
. On the other hand, unsaturated fatty acids
particularly palmitoleate, can significantly alleviate ER stress under palmitate or
cholesterol induced ER stress176, 177 and 178
. Additionally, lipopolysaccharide stimulates
the pro-inflammatory responses in macrophages14
. When used together, LPS and PA,
induce marked ER stress and inflammation in macrophages. In this part of my thesis
studies, I attempted to reduce lipid-induced ER stress and associated inflammation by
treating macrophages with palmitoleate.
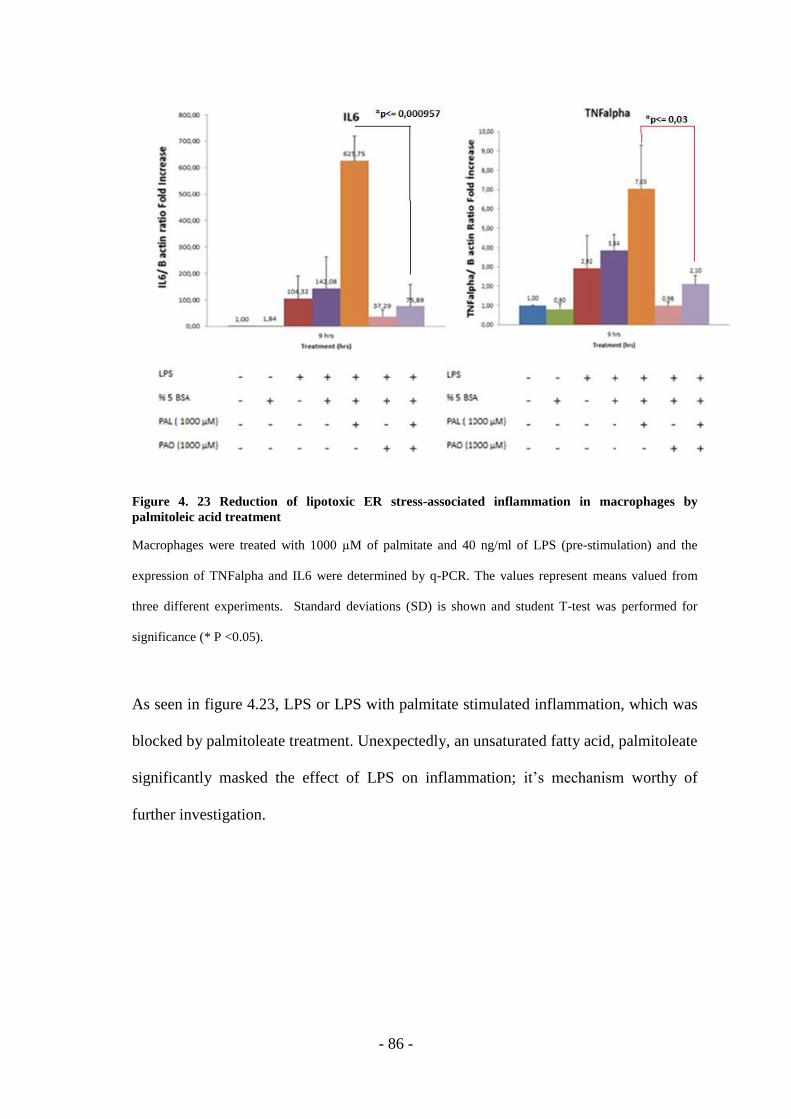
- 86 -
Figure 4. 23 Reduction of lipotoxic ER stress-associated inflammation in macrophages by
palmitoleic acid treatment
Macrophages were treated with 1000 µM of palmitate and 40 ng/ml of LPS (pre-stimulation) and the
expression of TNFalpha and IL6 were determined by q-PCR. The values represent means valued from
three different experiments. Standard deviations (SD) is shown and student T-test was performed for
significance (* P <0.05).
As seen in figure 4.23, LPS or LPS with palmitate stimulated inflammation, which was
blocked by palmitoleate treatment. Unexpectedly, an unsaturated fatty acid, palmitoleate
significantly masked the effect of LPS on inflammation; it’s mechanism worthy of
further investigation.

- 87 -
6. DISCUSSION AND CONCLUSION
The main focus of my thesis study was the characterization of PERK in the context of
lipid induced inflammation in macrophages. For this purpose, two experimental tools, a
specific siRNA against PERK and an ATP analog sensitized mutant of PERK were
created to block PERK’s activity without affecting the two other UPR pathways.
6.1 Creating An ATP Analog Sensitive Mutant Of PERK For Chemical
Genetic Approaches
Chemical genetics approach can be coupled to the discovery of novel kinase targets that
could be developed into future therapeutics. The chemical-genetic strategy can also be
used to modulate the activities protein kinases during signal transduction events13
. This
strategy, a semisynthetic reaction scheme, requires the use of labeled or detectable
bulky ATP analogs for thio-phosphorylation, followed by alkylation of this bond, which
generates a semisynthetic epitope on the modified substrates that can be recognized by a
monoclonal, anti-thiophosphate specific antibody2. In this thesis, I adopted this
chemical-genetic approach to create a PERK mutant that could be modulated by bulky
ATP analogs and inhibitors.
PERK136
is an important kinase that phosphorylates eukaryotic initiation factor 2 alpha
leading to global translation arrest during unresolved ER stress51, 52
. ER stress can be the
result of many signals such as glucose deprivation, aberrant calcium regulation, viral
infection and hypoxia70, 128
. In addition to autophosphorylating itself, PERK has two
other known substrates, Nrf227
and eIF2α52
. In this thesis, I attempted to generate PERK
- 88 -
mutant that can be monospecifically activated or inhibited via bulky ATP analogs. This
mutant can also be coupled to identify the full range of PERK substrates during lipid-
induced stress.
In the beginning of my thesis, I identified the potential mutagenic sites for the
gatekeeper residue of PERK (M888A and M88G) that would allow the fitting of a bulky
ATP analog into the ATP binding cavity of PERK (Figure 4.4-4.11). A significant
observation during this study was that these mutations conserved the kinase activity of
PERK (Figure 4.16 and 4.17). Furthermore, I observed the mutant PERK’s activity, but
not wild type PERK activity, could be controlled by a cell permeable bulky ATP analog
such as NaPP12
(Figure 4-15-17). This result demonstrated the specificity of the created
mutation for accepting the bulky ATP inhibitor. In future studies, PERK kinase assay
using the bulky ATP analog (N6benzylATPgammaS) can be coupled to proteomics for
the identification of novel PERK substrates during lipotoxic stress.
6.2 Characterization Of PERK’s Role In Lipid-Induced Inflammation
Previous studies showed that ER stress may be linked to inflammation through various
mechanisms including activation of JNK by IRE-1, NF-қB through PERK and IRE128,
62, the production of ROS, the generation of nitric oxide that activates Nrf2/Keap
complex and phosphorylation of Nrf2 by PERK27, 42
. ER stress through these and other
mechanisms can lead to induction of pro-inflammatory genes such as TNF alpha, IL6,
IL1-B and IL18. The excess of lipids or their metabolites impact both the metabolic and
immune functions through mechanisms not clearly understood81, 175
. In recent studies,
saturated fatty acids such as palmitate, but not unsaturated ones, were shown to induce
ER stress and inflammatory response in human islets179
, β cells4, mouse 3T3-L1 cells

- 89 -
and rat primary pre-adipocytes46
and liver cells158
. Since metabolic stress generated by
lipids can cause the activation of all three arms of UPR, the individual contribution of
the PERK arm to inflammation is not clear. To evaluate the specific contribution of
PERK to lipid-induced inflammation I identified specific siRNA sequences that can
block PERK’s activity upon transfection into macrophages. Using this tool, the
expression of PERK was silenced in macrophages during lipid induced ER stress and
the changes in the expression of some cytokines’ levels, including TNF alpha and
iNOS, were analyzed (Figure 4.22). The outcomes of these studies showed that the
expression of PERK has a direct effect on expression of proinflammatory cytokines
such as TNF alpha and iNOS induced by saturated fatty acids in macrophages. In 2011,
Jiao and et al. had unexpectedly observed an increase of TNF alpha levels and the
phosphorylation of JNK in PERK-deficient adipocytes66
. However, PERK-deficient
adipocytes exhibited a converse reduction in IL6 production in the same conditions. The
increase in cytokines may be due to an induction in IKKβ, since Jiao et al. also observed
the increased phosphorylation of IKKβ with FFAs in the same cells. Based on these
results, PERK dampens IKKβ activity which is associated with TNFalpha increase. It
appears that the absence of PERK worsens inflammation but the changes in other pro-
inflammatory cytokines need to be examined for a generalized view. In this thesis study,
I showed that PERK can directly suppress inflammation, particularly iNOS levels.
Furthermore, I examined whether the absence of PERK activates the other arms of
UPR, in particularly IRE1 that has been shown to be involved in inflammation57, 58
. A
published work showed that IRE1’s phosphorylation is not increased by the absence of
PERK, at least in adipocytes66
. There was no further increase in either the
phosphorylation of IRE-1 and JNK or the splicing of XBP-1 upon silencing of PERK
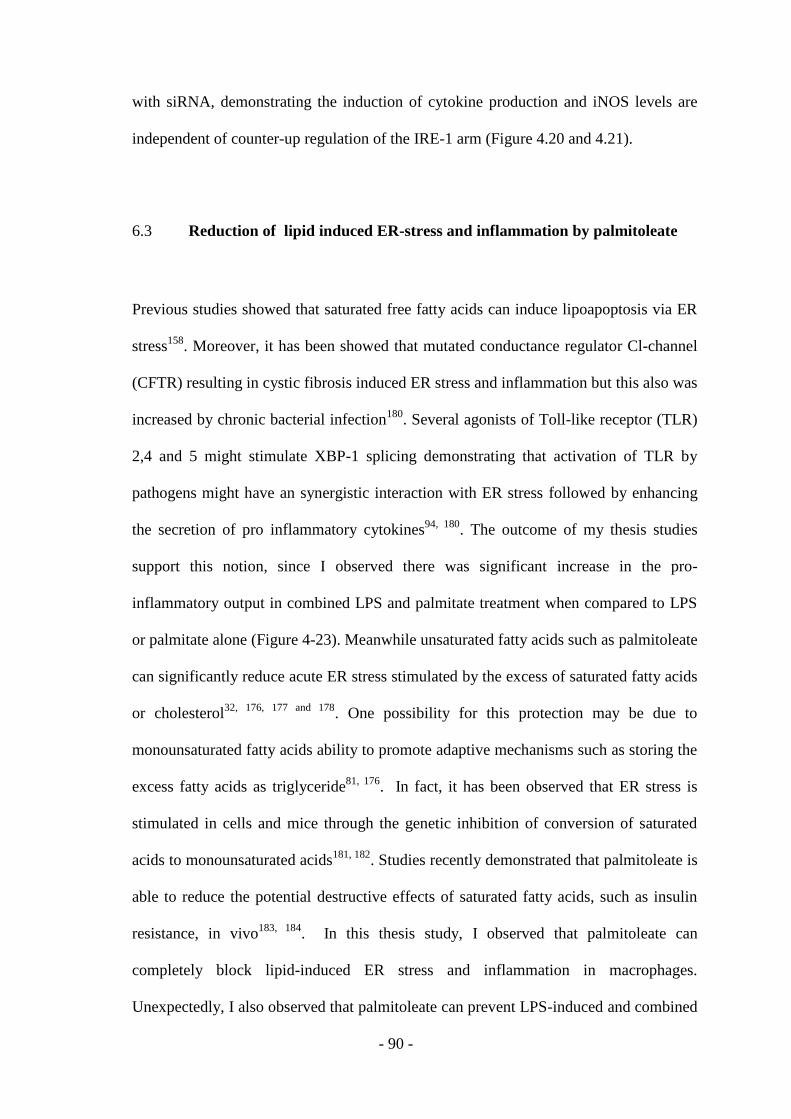
- 90 -
with siRNA, demonstrating the induction of cytokine production and iNOS levels are
independent of counter-up regulation of the IRE-1 arm (Figure 4.20 and 4.21).
6.3 Reduction of lipid induced ER-stress and inflammation by palmitoleate
Previous studies showed that saturated free fatty acids can induce lipoapoptosis via ER
stress158
. Moreover, it has been showed that mutated conductance regulator Cl-channel
(CFTR) resulting in cystic fibrosis induced ER stress and inflammation but this also was
increased by chronic bacterial infection180
. Several agonists of Toll-like receptor (TLR)
2,4 and 5 might stimulate XBP-1 splicing demonstrating that activation of TLR by
pathogens might have an synergistic interaction with ER stress followed by enhancing
the secretion of pro inflammatory cytokines94, 180
. The outcome of my thesis studies
support this notion, since I observed there was significant increase in the pro-
inflammatory output in combined LPS and palmitate treatment when compared to LPS
or palmitate alone (Figure 4-23). Meanwhile unsaturated fatty acids such as palmitoleate
can significantly reduce acute ER stress stimulated by the excess of saturated fatty acids
or cholesterol32, 176, 177 and 178
. One possibility for this protection may be due to
monounsaturated fatty acids ability to promote adaptive mechanisms such as storing the
excess fatty acids as triglyceride81, 176
. In fact, it has been observed that ER stress is
stimulated in cells and mice through the genetic inhibition of conversion of saturated
acids to monounsaturated acids181, 182
. Studies recently demonstrated that palmitoleate is
able to reduce the potential destructive effects of saturated fatty acids, such as insulin
resistance, in vivo183, 184
. In this thesis study, I observed that palmitoleate can
completely block lipid-induced ER stress and inflammation in macrophages.
Unexpectedly, I also observed that palmitoleate can prevent LPS-induced and combined

- 91 -
LPS and lipid induced inflammation. These results show that the protective mechanisms
of this promising, palmitoleate involve prevention of lipid induced inflammation.
Palmitoleate may become a potent anti-inflammatory and metabolic enhancing
therapeutic targeting obesity and related disorders such as insulin resistance, diabetes
and atherosclerosis.
Lipid induced macrophage inflammation plays an important role in the pathogenesis of
metabolic diseases. Previous studies conducted in obese mouse models detected the
cross-talk between adipocytes and macrophages in adipose tissues leads to local and
systemic insulin resistance through the activation of Jun N-terminal kinase (JNK),
inhibitor of κB kinase (IKKβ) via secretion of free fatty acids and pro-inflammatory
cytokines such as TNFalpa, IL6 and IL1β 144, 185
. Furthermore, other studies showed that
Kupffer cells, a major bone-derived macrophage cell type in liver induce insulin
resistance in the neighboring hepatocytes through the secretion of inflammatory
cytokines5, 130
. Also, in atherosclerosis, macrophages recruited to the lesions play a
central role in the maladaptive and non-resolving inflammatory response leading to
plaque progression and rupture97
. Taken together, lipid induced macrophage
inflammation is very important in the regulation of metabolism, so the studies about the
elucidation of molecular mechanism of this type of inflammation offer promise for the
discovery of new therapeutics against metabolic and inflammatory diseases.
In conclusion, the experimental tools created in this thesis study lead to important
observations that deepens our understanding of PERK’s role in inflammatory and
metabolic diseases. The results of my thesis study demonstrate for the first time a direct
role of PERK in lipid-induced inflammation in macrophages. Furthermore, the

- 92 -
chemical-genetic mutant of PERK that was created in this study can become a useful
tool to identify the full spectrum of PERK substrates in lipid-induced stress in future
studies and guide the development of novel and specific new therapeutics against
metabolic and inflammatory diseases
- 93 -
7. FUTURE PERSPECTIVES
First, this thesis study identified two mutants of PERK suitable for the chemical-
genetics approach, which allows the temporal and specific control of the mutant of
PERK activity when combined with permeable bulky ATP analogs or inhibitors. The
expression of this mutant of PERK in macrophages leads to its spontaneous activation
and a gain of function for PERK, which can be inhibited by NaPP1 addition to cells.
Second, I identified specific siRNA species that can reduce PERK expression in
macrophages. Using these siRNAs, I studied the loss of function for PERK in lipid
induced inflammation. These complementary experimental strategies can be used to
understand the direct role of PERK in lipid induced inflammation. The outcome of my
studies showed that PERK has a direct role in pro-inflammatory response. These studies
should be supported by experiments for additional pro- inflammatory cytokines such as
MCP1, anti-inflammatory cytokines such as IL10 and also inflammasome related
cytokines such as IL18 and IL1β. Additionally, I only used the mouse macrophage cell
line RAW 264.7 in this study. Similar experiments should be carried out in mouse
primary bone-marrow derived macrophages and human macrophages.
Unexpectedly and interestingly, I also observed that palmitoleate can mitigate LPS
alone-induced or combined LPS and lipid treatment-induced inflammation. All together,
the data presented in this thesis study supports the direct role of PERK and the
promising effects of palmitoleic acid on inflammation, further studies are needed to
understand their precise molecular mechanisms of action. In the future, ATP-analog
sensitized mutant of PERK, in a kinase reaction with a different ATP analog N6-
ATPgammaS to thiophosphorylate its substrates, should be coupled with proteomics to

- 94 -
identify full spectrum of PERK’s substrates. In this study, we optimized the usage of
bulky ATP analog inhibitor NaPP1 by the ASKA mutant of PERK, but PERK kinase
assay optimization using the N6-ATPgammaS need to be carried out. After
identification of potential substrates of PERK, they need to be validated in further
kinase assay and biological experiments. Moreover, transgenic expression of this
mutant of PERK in mice and chemical ablation by NaPP1 can become a useful tool in
studying the direct contribution of PERK to metabolic disease pathogenesis.

- 95 -
8. References
1. Adesnik M., Lande M., Martin T., Sabatini D.D. (1976) Retention of mRNA
on the endoplasmic reticulum membranes after in vivo disassembly of polysomes by an
inhibitor of initiation. J Cell Biol 71:307–313.
2. Allen JJ., Li M., Brinkworth CS., Paulson JL., Wang D., Hübner A., Chou
WH., Davis RJ., Burlingame AL., Messing RO, Katayama CD., Hedrick SM, Shokat
K.M. (2007). A semisynthetic epitope for kinase substrates. Nat Methods.Jun; 4(6):
511-6.
3. Arkan M.C., Hevener AL., Greten FR., Maeda S., Li Z. (2005). IKK-β links
inflammation to obesity induced insulin resistance. Nat. Med. 11:191–98.
4. Back S.H., Kaufman R.J. (2012) Endoplasmic Reticulum stress and Type 2
Diabetes. Annu. Rev. Biochem. 81:16.1–16.27
5. Baltzis D., Qu L.K., Papadopoulou S., Blais JD., Bell JC. (2004). Resistance to
vesicular stomatitis virus infection requires a functional cross talk between the
eukaryotic translation initiation factor 2α kinases PERK and PKR. J. Virol. 78:12747–
61.
- 96 -
6. Banko M.R, Allen J.J., Schaffer B.E. , Wilker E.W., Tsou P., White J.L.,
Ville´n J., Wang B., Kim S.R., Sakamoto K., Gygi S.P., Cantley L.C., Yaffe M.B.,
Shokat K.M., and Brunet A. (2011). Chemical Genetic Screen for AMPKa2 Substrates
Uncovers a Network of Proteins Involved in Mitosis. Molecular Cell 44, 878–892.
7. Bennett MR. (1999). Apoptosis of vascular smooth muscle cells in vascular
remodeling and atherosclerotic plaque rupture. Cardiovasc Res.; 41:361–368.
8. Bernales S., McDonald K.L., Walter P. (2006). Autophagy counterbalances
endoplasmic reticulum expansion during the unfolded protein response. PLoS Biol
4:e423.
9. Berridge MJ. (2002). The endoplasmic reticulum: a multifunctional signaling
organelle. Cell Calcium 32:235–249.
10. Bertolotti, A., Zhang, Y., Hendershot, L.M., Harding, H.P., and Ron, D.
(2000). Dynamic interaction of BiP and ER stress transducers in the unfolded-protein
response. Nat. Cell Biol. 2, 326–332.
11. Bishop, A.C. et al. (1998). Design of allele-specific inhibitors to probe protein
kinase signaling. Curr. Biol. 8, 257–266
- 97 -
12. Bishop, A.C. et al. (2000). A chemical switch for inhibitor-sensitive alleles of
any protein kinase. Nature 407, 395–401.
13. Bishop, A.C. et al. (2001). Magic bullets for protein kinases. Trends Cell .Biol.
11, 167–172.
14. Blais DR., Vascotto SG., Griffith M., Altosaar I. (2005). LBP and CD14
secreted in tears by the lacrimal glands modulate the LPS response of corneal epithelial
cells. Invest Ophthalmol Vis Sci.;46(11):4235-44
15. Bluher, M., M. D. Michael, O. D. Peroni, K. Ueki, N. Carter, B. B. Kahn, and
C. R. Kahn. (2002). Adipose tissue selective insulin receptor knockout protects against
obesity and obesity-related glucose intolerance. Dev. Cell. 3: 25–38.
16. Boden G. (2009). Endoplasmic Reticulum Stress: Another Link between
Obesity and Insulin Resistance/ Inflamamtion.Diabetes 58:518-19.
17. Boden, G., Song, W., Duan, X., Cheung, P., Kresge, K., Barrero, C., and
Merali, S. (2011). Infusion of glucose and lipids at physiological rates causes acute
endoplasmic reticulum stress in rat liver. Obesity (Silver Spring) 19, 1366– 1373.
- 98 -
18. Borradaile, N.M., Han, X., Harp, J.D., Gale, S.E., Ory, D.S., and Schaffer, J.E.
(2006). Disruption of endoplasmic reticulum structure and integrity in lipotoxic cell
death. J. Lipid Res. 47, 2726–2737.
19. Cabibbo A, Pagani M, Fabbri M, Rocchi M, Farmery MR, Bulleid NJ, Sitia R
(2000). ERO1-L, a human protein that favors disulfide bond formation in the
endoplasmic reticulum. J Biol Chem 275: 4827–4833.
20. Calfon, M., Zeng, H., Urano, F., Till, J.H., Hubbard, S.R., Harding, H.P.,
Clark, S.G., and Ron, D. (2002). IRE1 couples endoplasmic reticulum load to secretory
capacity by processing the XBP-1 mRNA. Nature 415, 92–96.
21. Carroll, A.S. et al. (2001). Chemical inhibition of the Pho85 cyclin dependent
kinase reveals a role in the environmental stress response. Proc. Natl. Acad. Sci. U. S. A.
98, 12578–12583.
22. Causton, H.C. et al. (2001). Remodeling of yeast genome expression in
response to environmental changes. Mol. Biol. Cell 12, 323–337.
23. Chen, X., Shen, J., and Prywes, R. (2002). The luminal domain of ATF6 senses
endoplasmic reticulum (ER) stress and causes translocation of ATF6 from the ER to the
Golgi. J. Biol. Chem. 277, 13045–13052.
- 99 -
24. Chen X., Ye H., Kuruvilla R., Ramanan N., Scangos K.W., Zhang C., Johnson
N.N., England P.M., Shokat K.M., Ginty D.D. (2005). A Chemical-Genetic Approach
to Studying Neurotrophin Signaling. Neuron, Vol. 46, 13–21.
25. Cnop, M. et al. (2007). Selective inhibition of eukaryotic translation initiation
factor 2a dephosphorylation potentiates fatty acid-induced endoplasmic reticulum stress
and causes pancreatic b-cell dysfunction and apoptosis. J. Biol. Chem. 282, 3989–3997.
26. Cox JS, Shamu CE, Walter P (1993). Transcriptional induction of genes
encoding endoplasmic reticulum resident proteins requires a trans membrane protein
kinase. Cell 73:1197–1206.
27. Cullinan, S.B., and Diehl, J.A. (2006). Coordination of ER and oxidative stress
signaling: the PERK/Nrf2 signaling pathway. Int. J. Biochem. Cell Biol. 38, 317–332.
28. Deng, J., Lu, P.D., Zhang, Y., Scheuner, D., Kaufman, R.J., Sonenberg, N.,
Harding, H.P., and Ron, D. (2004). Translational repression mediates activation of
nuclear factor kappa β by phosphorylated translation initiation factor 2. Mol. Cell. Biol.
24, 10161–10168.
- 100 -
29. Diakogiannak E., Welters H., Morgan N.G., (2008). Differential regulation of
the endoplasmic reticulum stress response in pancreatic b-cells exposed to long-chain
saturated and monounsaturated fatty acids. Journal of Endocrinology, 197, 553–563.
30. Ellgaard L., Helenius A. (2003). Quality control in the endoplasmic reticulum.
Nat Rev Mol Cell Biol 4:181–191.
31. Engin F., Hotamisligil G.S. (2010). Restoring endoplasmic reticulum function
by chemical chaperones: an emerging therapeutic approach for metabolic diseases.
Diabetes, Obesity and Metabolism 12 (Suppl. 2): 108–115.
32. Erbay, E., Babaev, V.R., Mayers, J.R., Makowski, L., Charles, K.N., Snitow,
M.E., Fazio, S., Wiest, M.M., Watkins, S.M., Linton, M.F., et al. (2009). Reducing
endoplasmic reticulum stress through a macrophage lipid chaperone alleviates
atherosclerosis. Nat. Med. 15, 1383–1391.
33. Farese Jr. R.V., Walther T.C. (2009) Lipid Droplets Finally Get a Little R-E-S-
P-E-C-T. Cell. November 25; 139(5): 855–860.
34. Feng, B., Yao, P. M., Li, Y., Devlin, C. M., Zhang, D., Harding, H. P.,
Sweeney, M., Rong, J. X., Kuriakose, G., Fisher, E. A., Marks, A. R., Ron, D., and
Tabas, I. (2003) The endoplasmic reticulum is the site of cholesterol-induced
cytotoxicity in macrophages. Nat. Cell Biol. 5, 781–792.

- 101 -
35. Fonseca SG., Burcin M., Gromada J., Urano F. (2009). Endoplasmic reticulum
stress in beta-cells and development of diabetes. Curr Opin Pharmacol 9:763–770.
36. Fonseca, S.G. et al. (2010). Wolfram syndrome 1 gene negatively regulates ER
stress signaling in rodent and human cells. J. Clin. Invest. 120, 744–755
37. Fu, S., Yang, L., Li, P., Hofmann, O., Dicker, L., Hide, W., Lin, X., Watkins,
S.M., Ivanov, A.R., and Hotamisligil, G.S. (2011). Aberrant lipid metabolism disrupts
calcium homeostasis causing liver endoplasmic reticulum stress in obesity. Nature 473,
528–531.
38. Fu, S., Watkins, S.M., and Hotamisligil, G.S. (2012). The Role of Endoplasmic
Reticulum in Hepatic Lipid Homeostasis and Stress Signaling. Cell Metabolism, 623-
634.
39. Fujita E., Kouroku Y., Isoai A., Kumagai H., Misutani A., Matsuda C.,
Hayashi YK., Momoi T. (2007). Two endoplasmic reticulum-associated degradation
(ERAD) systems for the novel variant of the mutant dysferlin: Ubiquitin/proteasome
ERAD (I) and autophagy/lysosome ERAD (II). Hum Mol Genet 16:618–629.
- 102 -
40. Glass CK., Witztum JL. (2001). Atherosclerosis. The road ahead. Cell.104:
503–516.
41. Gerrity RG. (1991). Transition of blood-borne monocytes into foam cells in
fatty lesions. Am J Pathol.; 103:181–190.
42. Gotoh, T., and Mori, M. (2006). Nitric oxide and endoplasmic reticulum stress.
Arterioscler. Thromb. Vasc. Biol. 26, 1439–1446.
43. Gregor MF., Yang L., Fabbrini E. et al. (2009). Endoplasmic reticulum stress is
reduced in tissues of obese subjects after weight loss. Diabetes; 58: 693–700.
44. Gross, E., Sevier, C. S., Heldman, N., Vitu, E., Bentzur, M., Kaiser, C. A.,
Thorpe, C., and Fass, D. (2006). Generating disulfides enzymatically: Reaction products
and electron acceptors of the endoplasmic reticulum thiol oxidase Ero1p. Proc. Natl.
Acad. Sci. U.S.A. 103, 299–304.
45. Gu, F. et al. (2004). Protein-tyrosine phosphatase 1B potentiates IRE1
signaling during endoplasmic reticulum stress. J. Biol. Chem. 279, 49689–49693.
46. Guo W., Wong S., Xie W., Lei T., and Luo Z. (2007). Palmitate modulates
intracellular signaling, induces endoplasmic reticulum stress, and causes apoptosis in
- 103 -
mouse 3T3-L1 and rat primary preadipocytes. American Journal of Physiology, vol.
293, no. 2, pp. E576–E586,
47. Gurzov, E.N. and Eizirik, D.L. (2011). Bcl-2 proteins in diabetes:
mitochondrial pathways of b-cell death and dysfunction. Trends Cell Biol. 21, 424–431.
48. Hapala I., Marza E., Ferreira T. (2011). Is fat so bad? Modulation of
endoplasmic reticulum stress by lipid droplet formation. Biol. Cell 103, 271–285.
49. Haynes, C.M., Titus, E.A., and Cooper, A.A. (2004). Degradation of misfolded
proteins prevents ER-derived oxidative stress and cell death. Mol. Cell 15, 767–776.
50. Harding H. P. and Ron D. (2002). Endoplasmic reticulum stress and the
development of diabetes: a review. Diabetes, vol. 51, no. 3, pp. S455–S461.
51. Harding H.P, Zhang Y, Ron D. (1999). Protein translation and folding are
coupled by an endoplasmic-reticulum-resident kinase. Nature 397: 271–274.
52. Harding H.P., Zhang Y., Bertolotti A., Zeng H., and Ron D. (2000). Perk Is
Essential for Translational Regulation and Cell Survival during the Unfolded Protein
Response. Molecular Cell, Vol. 5, 897–904.
- 104 -
53. Hollien, J. and Weissman, J.S. (2006). Decay of endoplasmic reticulum-
localized mRNAs during the unfolded protein response. Science 313, 104–107.
54. Hong M., Luo S., Baumeister P., Huang JM., Gogia RK., Li M., Lee AS.
(2004). Underglycosylation of ATF6 as a novel sensing mechanism for activation of the
unfolded protein response. J Biol Chem 279:11354–11363.
55. Hotamisligil, G.S., Shargill, N.S., and Spiegelman, B.M. (1993). Adipose
expression of tumor necrosis factor-alpha: direct role in obesity-linked insulin
resistance. Science 259, 87–91.
56. Hotamisligil, G.S. (2006). Inflammation and metabolic disorders. Nature 444,
860–867.
57. Hotamisligil GS. (2008a).Inflammation and endoplasmic reticulum stress in
obesity and diabetes. International journal of Obesity 32:52-54.
58. Hotamisligil GS. (2008b) Endoplasmic Reticulum stress and inflammatory
basis of metabolic disease. Cell 140, 900–917.
59. Hotamisligil G.S. (2010). Endoplasmic reticulum stress and atherosclerosis.
Nature Medicine Volume 16 Number 4
- 105 -
60. Hotamisligil, G. S. & Erbay, E. (2008). Nutrient sensing and inflammation in
metabolic diseases. Nature Rev. Immunol. 8, 923–934
61. Høyer-Hansen M., Bastholm L., Szyniarowski P., Campanella M., Szabadkai
G., Farkas T., Bianchi K., Fehrenbacher N., Elling F., Rizzuto R., Mathiasen IS.,
Jaattela M. (2007). Control of macro autophagy by calcium, calmodulin dependent
kinase kinase-beta, and bcl-2. Mol Cell 25:193–205.
62. Hu P., Han Z., Couvillon A., Kaufman R., Exton J. (2006). Autocrine tumor
necrosis factor alpha links endoplasmic reticulum stress to the membrane death receptor
pathway through IRE1a-mediated NF-kB activation and down-regulation of TRAF2
expression. Mol Cell Biol. 26:3071–3084.
63. Ihle, J.N. (2000). The challenges of translating knockout phenotypes into gene
function. Cell 102,131-134.
64. Jӓger R., Mathieu J.M., Bertran, Gorman A.M., Vandenabeele P., and Samali
A. (2012). The unfolded Protein Response at the crossroads of cellular life and death
during endoplasmic reticulum stress. Biol. Cell; 104, 259–270.
- 106 -
65. Jiang HY., Wek SA., McGrath BC., Lu D., Hai T., Harding HP., Wang X., Ron
D., Cavener DR., Wek RC. (2004). Activating transcription factor 3 is integral to the
eukaryotic initiation factor 2 kinase stress response. Mol Cell Biol 24:1365–1377.
66. Jiao P., Ma J., Feng B., Zhang H., Alan Diehl J. et al. (2011). FFA-induced
adipocyte inflammation and insulin resistance: involvement of ER stress and IKKbeta
pathways. Obesity (Silver Spring) 19: 483–491.
67. Johar D., Roth JC., Bay GH., Walker JN., Kroczak TJ., Los M., (2004).
Inflammatory response, reactive oxygen species, programmed (necrotic-like and
apoptotic) cell death and cancer. Rocz Akad Med Bialymst. 49:31-9.
68. Kahn SE., Hull RL., Utzschneider KM. (2006). Mechanisms linking obesity to
insulin resistance and type 2 diabetes. Nature 444:840–46.
69. Kamimoto T., Shoji S., Hidvegi T., Mizushima N., Umebayashi K., Perlmutter
DH., Yoshimori T. (2006). Intracellular inclusions containing mutant alpha1-antitrypsin
Z are propagated in the absence of autophagic activity. J Biol Chem 281:4467–4476.
70. Kaufman RJ., Scheuner D., Schroder M., Shen X., Lee K., Liu CY., Arnold
SM. (2002). The unfolded protein response in nutrient sensing and differentiation. Nat
Rev Mol Cell Biol 3:411–421.
- 107 -
71. Kars M., Yang L., Gregor M.F, Mohammed BS., Pietka TA., Finck BN.,
Patterson BW., Horton JD., Mittendorfer B., Hotamisligil GS., Klein S. (2010).
Tauroursodeoxycholic Acid may improve liver and muscle but not adipose tissue
insulin sensitivity in obese men and women. Diabetes; 59(8):1899-905.
72. Kayode K.O., Larson E.T., Keyloun K.R., Castaneda L.J., DeRocher A.E.,
Inampudi K.K., Kim J.E., Arakaki T.L., Murphy R.C., Zhang L., Napuli AJ., Maly
D.J., Verlinde C., Buckner F.S., Parsons M., Hol W.GJ., Merritt E.A. , Van Voorhis
W.C. (2009). Toxoplasma gondii calcium-dependent protein kinase 1 is a target for
selective kinase inhibitors, Nature Structural & Molecular Biology 17,602–607.
73. Kebache S., Cardin E., Nguyen DT., Chevet E., Larose L. (2004). Nck-1
antagonizes the endoplasmic reticulum stress-induced inhibition of translation. J Biol
Chem 279:9662–9671.
74. Kevan Shokat and Mark Velleca (2002). Novel chemical genetics approaches
to the discovery of signal transduction inhibitors. Drug Discov Today.Aug 15;
7(16):872-9.
75. Kharroubi, I., Ladriere, L., Cardozo, A.K., Dogusan, Z., Cnop, M., and Eizirik,
D.L. (2004). Free fatty acids and cytokines induce pancreatic beta-cell apoptosis by
- 108 -
different mechanisms: role of nuclear factor kappa β and endoplasmic reticulum stress.
Endocrinology 145, 5087–5096.
76. Kim M.K., Kim H.S., Lee IK., and Park K.G. (2012). Endoplasmic Reticulum
Stress and Insulin Biosynthesis: A Review. Experimental Diabetes Research, vol. 2012,
Article ID 509437, 7 pages.
77. Kouroku Y., Fujita E., Tanida I., Ueno T., Isoai A., Kumagai H., Ogawa S.,
Kaufman RJ., Kominami E., Momoi T. (2007). ER stress (PERK/eIF2alpha
phosphorylation) mediates the polyglutamine-induced LC3 conversion, an essential step
for autophagy formation. Cell Death Differ 14: 230–239.
78. Kozutsumi Y., Segal M., Normington K., Gething MJ., Sambrook J. (1988).
The presence of misfolded proteins in the endoplasmic reticulum signals the induction
of glucose regulated proteins. Nature 332:462–464.
79. Kulp, M. S., Frickel, E. M., Ellgaard, L., and Weissman, J. S. (2006). Domain
architecture of protein –disulfide isomerase facilitates its dual role as an oxidase and an
isomarase in Ero1p- mediated disulfide formation. J. Biol.Chem. 281, 876–884.
80. Ladrie `re, L. et al. (2010). Enhanced signaling downstream of ribonucleic
acid-activated protein kinase-like endoplasmic reticulum kinase potentiates lipotoxic
- 109 -
endoplasmic reticulum stress in human islets. J. Clin. Endocrinol. Metab. 95, 1442–
1449.
81. Lee K., Tirasophon W., Shen X., Michalak M., Prywes R., Okada T., Yoshida
H., Mori K., Kaufman RJ. (2002). IRE1-mediated unconventional mRNA splicing and
S2p-mediated ATF6 cleavage merge to regulate XBP1 in signaling the unfolded protein
response. Genes Dev 16:452–466.
82. Li, Y., Schwabe, R.F., DeVries-Seimon, T., Yao, P.M., Gerbod-Giannone,
M.C., Tall, A.R., Davis, R.J., Flavell, R., Brenner, D.A., and Tabas, I. (2005). Free
cholesterol-loaded macrophages are an abundant source of tumor necrosis factor-alpha
and interleukin-6: model of NF-kappaB- and map kinase-dependent inflammation in
advanced atherosclerosis. J. Biol. Chem. 280, 21763–2177.
83. Libby P. (2000). Changing concepts of atherogenesis. J Intern Med.; 247: 349–
358.
84. Libby P. (2002). Inflammation in atherosclerosis. Nature.420:868–874.
85. Libby P., Clinton SK. (1993). The role of macrophages in atherogenesis. Curr
Opin Lipidol. 4:355–363.
- 110 -
86. Lilley BN, Ploegh HL 2004 A membrane protein required for dislocation of
misfolded proteins from the ER. Nature 429:834–840
87. Lilley BN., Ploegh HL. (2005) Multiprotein complexes that link dis- location,
ubiquitination, and extraction of misfolded proteins from the endoplasmic reticulum
membrane. Proc Natl Acad Sci USA 102:14296–14301.
88. Liu, Y. et al. (1998). Engineering Src family protein kinases with unnatural
nucleotide specificity. Chem. Biol. 5, 91–101.
89. Lusis AJ. (2000). Atherosclerosis. Nature.;407:233–241.
90. Ma Y., Brewer JW., Diehl JA., Hendershot LM. (2002). Two distinct stress
signaling pathways converge upon the CHOP promoter during the mammalian unfolded
protein response. J Mol Biol 318: 1351–1365.
91. Makowski, L., Boord, J.B., Maeda, K., Babaev, V.R., Uysal, K.T., Morgan,
M.A., Parker, R.A., Suttles, J., Fazio, S., Hotamisligil, G.S., et al. (2001). Lack of
macrophage fatty-acid-binding protein aP2 protects mice deficient in apolipoprotein E
against atherosclerosis. Nat. Med. 7, 699–705.
- 111 -
92. Malhotra JD., Kaufman RJ. (2007). The endoplasmic reticulum and the
unfolded protein response. Semin Cell Dev Biol 18:716–731.
93. Martin, S., and R. G. Parton. (2005). Caveolin, cholesterol, and lipid bodies.
Semin. Cell Dev. Biol. 16: 163–174.
94. Martinon, F. et al. (2010) TLR activation of the transcription factor XBP1
regulates innate immune responses in macrophages. Nat. Immunol. 11, 411–418.
95. Maxfield, F.R., and Tabas, I. (2005). Role of cholesterol and lipid organization
in disease. Nature 438, 612–621.
96. Meer, G. et al. (2008). Membrane lipids: where they are and how they behave.
Nat. Rev. Mol. Cell Biol. 9, 112–124.
97. Moore K.J. and Tabas I. (2011). Macrophages in the pathogenesis of
atherosclerosis. Cell 145.
98. Mori K, Ma W, Gething MJ, Sambrook J (1993).A trans membrane protein
with a cdc2+/CDC28-related kinase activity is required for signaling from the ER to the
nucleus. Cell 74:743–756.
- 112 -
99. Mori K., Ogawa N., KawaharaT., Yanagi H., Yura T. (1998). Palindrome with
spacer of one nucleotide is characteristic of the cis-acting unfolded protein response
element in Saccharomyces cerevisiae. J Biol Chem 273:9912–9920.
100. Mori K., Sant A., Kohno K., Normington K., Gething MJ., Sambrook JF.
(1992). A 22 bp cis-acting element is necessary and sufficient for the induction of the
yeast KAR2 (BiP) gene by unfolded proteins. EMBO J 11:2583–2593.
101. Myoishi M., Hao H., Minamino T., Watanabe K., Nishihira K., Hatakeyama
K., Asada Y., Okada K., Ishibashi-Ueda H., Gabbiani G., Bochaton-Piallat ML.,
Mochizuki N., Kitakaze M. (2007). Increased endoplasmic reticulum stress in
atherosclerotic plaques associated with acute coronary syndrome. Circulation.
116:1226–1233.
102. Nadanaka S., Okada T., Yoshida H., Mori K. (2007) Role of disulfide bridges
formed in the luminal domain of ATF6 in sensing endoplasmic reticulum stress. Mol
Cell Biol 27:1027–1043.
103. Nagasawa K., Higashi T., Hosokawa N., Kaufman RJ., Nagata K. (2007).
Simultaneous induction of the four subunits of the TRAP complex by ER stress
accelerates ER degradation. EMBO Rep 8:483– 489
- 113 -
104. Nakamura, T., Furuhashi, M., Li, P., Cao, H., Tuncman, G., Sonenberg, N.,
Gorgun, C.Z., and Hotamisligil, G.S. (2010). Double-stranded RNA-dependent protein
kinase links pathogen sensing with stress and metabolic homeostasis. Cell 140, 338–
348.
105. Naidoo N. (2009). ER and aging-protein folding and the ER stress response.
Ageing Res Rev 8:150–159.
106. Nguyen DT., Kebache S., Fazel A., Wong HN., Jenna S., Emadali A., Lee EH.,
Bergeron JJM., Kaufman RJ., Larose L., Chevet E. (2004). Nck-dependent activation of
extracellular signal regulated kinase-1 and regulation of cell survival during
endoplasmic reticulum stress. Mol Biol Cell 15: 4248–4260.
107. Nikawa, J. and S. Yamashita. (1992). IRE1 encodes a putative protein kinase
containing a membrane-spanning domain and is required for inositol prototrophy in
Saccharomyces cerevisiae. Mol. Microbiol. 6: 1441–1446.
108. Novoa I., Zeng H., Harding HP., Ron D. (2001). Feedback inhibition of the
unfolded protein response by GADD34-mediated dephosphorylation of eIF2alpha. J
Cell Biol 153:1011–1022.
- 114 -
109. Ozcan U., Yilmaz E., Ozcan L. et al. (2006). Chemical chaperones reduce ER
stress and restore glucose homeostasis in a mouse model of type 2 diabetes. Science;
313: 1137–1140.
110. Ozcan, U. et al. (2004). Endoplasmic reticulum stress links obesity, insulin
action, and type 2 diabetes. Science 306, 457–461
111. Ogata M., Hino SI., Saito A., Morikawa K., Kondo S., Kanemoto S.,
Murakami T., Taniguchi M., Tanii I., Yoshinaga K., Shiosaka S., Hammarback JA.,
Urano F., Imaizumi K. (2006). Autophagy is activated for cell survival after
endoplasmic reticulum stress. Mol Cell Biol 26:9220–9231.
112. Padyana AK., Qiu H., Roll-Mecak A., Hinnebusch AG., Burley SK. (2005).
Structural basis for auto inhibition and mutational activation of eukaryotic initiation
factor 2alpha protein kinase GCN2. J Biol Chem. 12;280(32):29289-99.
113. Pagani M., Fabbri M., Benedetti C., Fassio A., Pilati S., Bulleid NJ., Cabibbo
A., Sitia R. (2000). Endoplasmic reticulum oxidoreductin 1-l (ERO1-L), a human gene
induced in the course of the unfolded protein response. J Biol Chem 275:23685–23692.
114. Papa FR., Zhang C., Shokat K., Walter P. (2003). Bypassing a kinase activity
with an ATP-competitive drug. Science 302:1533–1537.

- 115 -
115. Patil, C., and Walter, P. (2001). Intracellular signaling from the endoplasmic
reticulum to the nucleus: the unfolded protein response in yeast and mammals. Curr.
Opin. Cell Biol. 13, 349–355.
116. Pfaffenbach, K.T., Nivala, A.M., Reese, L., Ellis, F., Wang, D., Wei, Y., and
Pagliassotti, M.J. (2010). Rapamycin inhibits postprandial-mediated X-box- binding
protein-1 splicing in rat liver. J. Nutr. 140, 879–884.
117. Ploegh HL. (2007). A lipid-based model for the creation of an escape hatch
from the endoplasmic reticulum. Nature 448:435–438
118. Pilon M., Romisch K., Quach D., Schekman R. (1998). Sec61p serves multiple
roles in secretory precursor binding and translocation into the endoplasmic reticulum
membrane. Mol Biol Cell 9:3455–3473.
119. Pirot P., Ortis F., Cnop M., Ma Y., Hendershot LM., Eizirik DL., Cardozo AK.
(2007). Transcriptional regulation of the endoplasmic reticulum stress gene chop in
pancreatic insulin-producing cells. Diabetes 56:1069–1077.
120. Qi X., Hosoi T., Okuma Y., Kaneko M., Nomura Y. (2004). Sodium 4-
phenylbutyrate protects against cerebral ischemic injury. Mol Pharmacol; 66: 899–908.
- 116 -
121. Rader, D.J. & Daugherty, A. (2008).Translating molecular discoveries into
new therapies for atherosclerosis.Nature 451, 904–913.
122. Rao RV., Bredesen DE. (2004). Misfolded proteins, endoplasmic reticulum
stress and neurodegeneration. Curr Opin Cell Biol 16:653–662. (a).
123. Rao, R.V., Ellerby, H.M., and Bredesen, D.E. (2004). Coupling endoplasmic
reticulum stress to the cell death program. Cell Death Differ. 11, 372–380. (b).
124. Rhodes, C.J. (2004). Processing of the insulin molecule. In Diabetes Mellitus,
D. LeRoith, S.I. Taylor, and J.M. Olefsky, eds. (Philadelphia, PA: Lippincott Williams
& Wilkins), pp. 27–50.
125. Rhodes, C.J., Shoelson, S., and Halban, P.A. (2005). Insulin Biosynthesis,
Processing, and Chemistry. In Joslin’s Diabetes Mellitus, C.R. Kahn, G.C. Weir, G.L.
King, A.M. Jacobson, A.C. Moses, and R.J. Smith, eds. (Boston: Joslin Diabetes
Center), pp. 65–82.
126. Ribeiro, C.M. and Boucher, R.C. (2010) Role of endoplasmic reticulum stress
in cystic fibrosis-related airway inflammatory responses. Proc. Am. Thorac. Soc. 7,
387–394.
- 117 -
127. Robenek, H., O. Hofnagel, I. Buers, M. J. Robenek, D. Troyer, and N. J.
Severs. (2006). Adipophilin-enriched domains in the ER membrane are sites of lipid
droplet biogenesis. J. Cell Sci. 119: 4215–4224.
128. Ron D. (2002). Translational control in the endoplasmic reticulum stress
response. J Clin Invest 110:1383–1388.
129. Ron, D., and Walter, P. (2007). Signal integration in the endoplasmic reticulum
unfolded protein response. Nat. Rev. Mol. Cell Biol. 8, 519–529.
130. Schenk S., Saberi M., Olefsky JM. (2008). Insulin sensitivity: modulation by
nutrients and inflammation. J. Clin. Investig. 118:2992–3002.
131. Seimon TA., Liao X., Magallon J., Moore KJ., Witztum JL., Tsimikas S.,
Golenbock DT., Webb NR., Tabas I. (2010). Atherogenic lipids and lipoproteins trigger
CD36-TLR2-dependent apoptosis in macrophages undergoing endoplasmic reticulum
stress. Cell Metabolism 12, 467–482.
132. Sevier, C. S., and Kaiser, C. A. (2002). Formation and transfer of disulphide
bonds in living cells. Nat. Rev. Mol. Cell Biol. 3,836–847.
- 118 -
133. Shamu CE., Walter P. (1996). Oligomerization and phosphorylation of the
Ire1p kinase during intracellular signaling from the endoplasmic reticulum to the
nucleus. EMBO J 15:3028–3039.
134. Shen, J., Chen, X., Hendershot, L., and Prywes, R. (2002). ER stress regulation
of ATF6 localization by dissociation of BiP/GRP78 binding and unmasking of Golgi
localization signals. Dev. Cell 3, 99–111.
135. Shen X., Ellis RE., Lee K., Liu CY., Yang K., Solomon A., Yoshida H.,
Morimoto R., Kurnit DM., Mori K, Kaufman RJ. (2001). Complementary signaling
pathways regulate the unfolded protein response and are required for C. elegans
development. Cell 107:893–903.
136. Shi Y., Vattem KM., Sood R., An J., Liang J., Stramm L., Wek RC. (1998).
Identification and characterization of pancreatic eukaryotic initiation factor 2 alpha-
subunit kinase, PEK, involved in translational control. Mol Cell Biol 18:7499–7509.
137. Shi Y., An J., Liang J., Hayes SE., Sandusky GE., Stramm LE., Yang NN.
(1999). Characterization of a mutant pancreatic eif-2alpha kinase, PEK, and co-
localization with somatostatin in islet delta cells. J Biol Chem 274:5723–5730.
138. Shoelson, S.E., Lee, J., and Goldfine, A.B. (2006). Inflammation and insulin
resistance. J. Clin. Invest. 116, 1793–1801.
- 119 -
139. Sriburi, R., Jackowski, S., Mori, K. & Brewer, J.W. (2004). XBP1: a link
between the unfolded protein response, lipid biosynthesis, and biogenesis of the
endoplasmic reticulum J. Cell Biol. 167, 35–41.
140. Szegezdi E., Logue SE., Gorman AM., Samali A. (2006). Mediators of
endoplasmic reticulum stress-induced apoptosis. EMBO Rep 7:880–885.
141. Tabas, I. and Ron, D. (2011). Integrating the mechanisms of apoptosis induced
by endoplasmic reticulum stress. Nat. Cell Biol. 13, 184–190.
142. Tabas I., Williams KJ., Boren J. (2007).Subendothelial lipoprotein retention as
the initiating process in atherosclerosis: update and therapeutic implications.
Circulation. 116:1832–1844.
143. Tabas I. (2005). Consequences and therapeutic implications of macrophage
apoptosis in atherosclerosis: the importance of lesion stage and phagocytic efficiency.
Arterioscler Thromb Vasc Biol.; 25:2255–2264.
144. Tajiri Y., Mimura K., Umeda F. (2005). High-sensitivity C-reactive protein in
Japanese patients with type 2 diabetes. Obes. Res. 13:1810–16.
- 120 -
145. Tirasophon W., Welihinda AA., Kaufman RJ. (1998). A stress response
pathway from the endoplasmic reticulum to the nucleus requires a novel bifunctional
protein kinase/endoribonuclease (IRE1p) in mammalian cells. Genes Dev 12:1812–
1824.
146. Tuncman, G., Hirosumi, J., Solinas, G., Chang, L., Karin, M., and
Hotamisligil, G.S. (2006). Functional in vivo interactions between JNK1 and JNK2
isoforms in obesity and insulin resistance. Proc. Natl. Acad. Sci. USA 103, 10741–
10746.
147. Uehara, T., Nakamura, T., Yao, D., Shi, Z.Q., Gu, Z., Ma, Y., Masliah, E.,
Nomura, Y., and Lipton, S.A. (2006). S-nitrosylated protein-disulphide isomerase links
protein misfolding to neurodegeneration. Nature 441, 513–517.
148. Ultanir S.K., Hertz N.T., Li G., Ge W.P., Burlingame A.L., Pleasure S.J.,
Shokat K., Jan L.Y. Jan Y.N. (2012). Chemical Genetic Identification of NDR1/2
Kinase Substrates AAK1 and Rabin8 Uncovers Their Roles in Dendrite Arborization
and Spine Development. Neuron Vol. 73, Issue 6, pp. 1127-1142.
149. Urano F., Wang X., Bertolotti A., Zhang Y., Chung P., Harding HP., Ron D.
(2000). Coupling of stress in the ER to activation of JNK protein kinases by
transmembrane protein kinase IRE1. Science 287:664–666.
- 121 -
150. Vallerie, S.N., Furuhashi, M., Fucho, R., and Hotamisligil, G.S. (2008). A
predominant role for parenchymal c-Jun amino terminal kinase (JNK) in the regulation
of systemic insulin sensitivity. PLoS ONE 3, e3151.
151. van Huizen R., Martindale JL., Gorospe M., Holbrook NJ. (2003). P58IPK, a
novel endoplasmic reticulum stress-inducible protein and potential negative regulator of
eIF2alpha signaling. J Biol Chem 278:15558– 15564.
152. Vecchi, C., Montosi, G., Zhang, K., Lamberti, I., Duncan, S.A., Kaufman, R.J.,
and Pietrangelo, A. (2009). ER stress controls iron metabolism through induction of
hepcidin. Science 325, 877–880.
153. Vilatoba M., Eckstein C., Bilbao G. et al. (2005) .Sodium 4-phenylbutyrate
protects against liver ischemia reperfusion injury by inhibition of endoplasmic
reticulum-stress mediated apoptosis. Surgery; 138: 342–351
154. Virmani R., Burke AP., Kolodgie FD., Farb A. (2002).Vulnerable plaque: the
pathology of unstable coronary lesions. J Interv Cardiol.; 15:439–446.
- 122 -
155. Wahlman J., DeMartino GN., Skach WR., Bulleid NJ., Brodsky JL., Johnson
AE. (2007). Real-time fluorescence detection of ERAD substrate retro translocation in
a mammalian in vitro system. Cell 129: 943–955.
156. Wang XZ., Harding HP., Zhang Y., Jolicoeur EM., Kuroda M., Ron D. (1998).
Cloning of mammalian IRE1 reveals diversity in the ER stress responses. EMBO J
17:5708–5717.
157. Wang H., Shimizu E., Tang YP., Cho M., Kyin M., Zuo W., Robinson DA.,
Alaimo PJ., Zhang C., Morimoto H., Zhuo M., Feng R., Shokat KM., Tsien JZ. (2003).
Inducible protein knockout reveals temporal requirement of CaMKII reactivation for
memory consolidation in the brain. Proc Natl Acad Sci USA 100: 4287–4292.
158. Wei, Y., Wang, D., Topczewski, F., and Pagliassotti, M.J. (2006). Saturated
fatty acids induce endoplasmic reticulum stress and apoptosis independently of
ceramide in liver cells. Am. J. Physiol. Endocrinol. Metab. 291, E275–E281.
159. Weiss A., Schlessinger J. (1998). Switching signals on or off by receptor
dimerization. Cell 94:277–280.
160. Weiss, E.L. et al. (2000). Chemical genetic analysis of the budding-yeast p21-
activated kinase Cla4p. Nat. Cell Biol. 2, 677–685.
- 123 -
161. Welihinda AA., Kaufman RJ. (1996). The unfolded protein response pathway
in Saccharomyces cerevisiae. Oligomerization and trans- phosphorylation of Ire1p
(Ern1p) are required for kinase activation. J Biol Chem 271:18181–18187.
162. Williams KJ., Tabas I. (1995). The response-to-retention hypothesis of early
atherogenesis. Arterioscler Thromb Vasc Biol.; 15:551–561.
163. Witucki, L.A. et al. (2002). Mutant tyrosine kinases with unnatural nucleotide
specificity retain the structure and phospho-acceptor specificity of the wild-type
enzyme. Chem. Biol. 9, 25–33.
164. Wolins, N. E., D. L. Brasaemle, and P. E. Bickel. (2006). A proposedmodel of
fat packaging by exchangeable lipid droplet proteins.FEBS Lett. 580: 5484–5491.
165. Xie Q.W., Kashiwabara Y., Nathan C. (1994). Role of transcription factor NF-
κB/Rel in induction of nitric oxide synthase. J. Biol. Chem., 269 pp. 4705–4708.
166. Yamazaki, H., Hiramatsu, N., Hayakawa, K., Tagawa, Y., Okamura, M.,
Ogata, R., Huang, T., Nakajima, S., Yao, J., Paton, A.W., et al. (2009). Activation of the
Akt-NF-kappaB pathway by subtilase cytotoxin through the ATF6 branch of the
unfolded protein response. J. Immunol. 183, 1480–1487.
- 124 -
167. Yan W., Frank CL., Korth MJ., Sopher BL., Novoa I., Ron D., Katze MG.
(2002). Control of PERK eIF2alpha kinase activity by the endoplasmic reticulum stress-
induced molecular chaperone p58ipk. Proc Natl Acad Sci USA 99:15920–15925.
168. Ye Y., Shibata Y., Yun C., Ron D., Rapoport TA. (2004). A membrane protein
complex mediates retro-translocation from the ER lumen into the cytosol. Nature
429:841–847.
169. Yoneda, T. et al. (2001). Activation of caspase-12, an endoplasmic reticulum
(ER) resident caspase, through tumor necrosis factor receptor-associated factor-2-
dependent mechanism in response to the ER stress. J. Biol. Chem. 276, 13935–13940
170. Yorimitsu T., Nair U., Yang Z., Klionsky DJ. (2006). Endoplasmic reticulum
stress triggers autophagy. J Biol Chem 281:30299–30304.
171. Yoshida H., Matsui T., Yamamoto A., Okada T., Mori K. (2001).
XBP1mRNAis induced by ATF6 and spliced by IRE1 in response to ER stress to
produce a highly active transcription factor. Cell 107:881–891.
172. Yusta B., Baggio LL., Estall JL., Koehler JA., Holland DP., Li H., Pipeleers
D., Ling Z., Drucker DJ. (2006). GLP-1 receptor activation improves β cell function
and survival following induction of endoplasmic reticulum stress. Cell Metab 4:391–
406.
- 125 -
173. Zhang, K., Shen, X., Wu, J., Sakaki, K., Saunders, T., Rutkowski, D.T., Back,
S.H., and Kaufman, R.J. (2006a). Endoplasmic reticulum stress activates cleavage of
CREBH to induce a systemic inflammatory response. Cell 124, 587–599.
174. Zhang, X., Zhang, G., Zhang, H., Karin, M., Bai, H., and Cai, D. (2008). Hypo-
thalamic IKKbeta/NF-kappaB and ER stress link over nutrition to energy imbalance and
obesity. Cell 135, 61–73.
175. Zhou, J., Lhotak, S., Hilditch, B.A. & Austin, R.C. (2005). Activation of the
unfolded protein response occurs at all stages of atherosclerotic lesion development in
apolipoprotein E-deficient mice.Circulation 111, 1814–1821.
176. Listenberger, L.L., Han, X., Lewis, S.E., Cases, S., Farese, R.V., Jr., Ory, D.S.,
and Schaffer, J.E. (2003). Triglyceride accumulation protects against fatty acid-induced
lipotoxicity. Proc. Natl. Acad. Sci. USA 100, 3077–3082.
177. Pineau, L., Colas, J., Dupont, S., Beney, L., Fleurat-Lessard, P., Berjeaud, J.-
M., Berge` s, T., and Ferreira, T. (2009). Lipid-induced ER stress: synergistic effects of
sterols and saturated fatty acids. Traffic 10, 673–690.
178. Peng, G., Li, L., Liu, Y., Pu, J., Zhang, S., Yu, J., Zhao, J., and Liu, P. (2011).
Oleate blocks palmitate-induced abnormal lipid distribution, endoplasmic reticulum
- 126 -
expansion and stress, and insulin resistance in skeletal muscle. Endocrinology 152,
2206–2218.
179. Igoillo-Esteve, M. et al. (2010) Palmitate induces a pro-inflammatory response
in human pancreatic islets that mimics CCL2 expression by beta cells in type 2 diabetes.
Diabetologia 53, 1395–1405.
180. Ribeiro, C.M. and Boucher, R.C. (2010) Role of endoplasmic reticulum stress
in cystic fibrosis-related airway inflammatory responses. Proc. Am. Thorac. Soc. 7,
387–394.
181. Green, C.D., and Olson, L.K. (2011). Modulation of palmitate-induced
endoplasmic reticulum stress and apoptosis in pancreatic b-cells by stearoyl-CoA
desaturase and Elovl6. Am. J. Physiol. Endocrinol. Metab. 300, E640–E649.
182. Flowers, M.T., Keller, M.P., Choi, Y., Lan, H., Kendziorski, C., Ntambi, J.M.,
and Attie, A.D. (2008). Liver gene expression analysis reveals endoplasmic reticulum
stress and metabolic dysfunction in SCD1-deficient mice fed a very low-fat diet.
Physiol. Genomics 33, 361–372.
183. Cao, H., Gerhold, K., Mayers, J.R., Wiest, M.M., Watkins, S.M., and
Hotamisligil, G.S. (2008). Identification of a lipokine, a lipid hormone linking adipose
tissue to systemic metabolism. Cell 134, 933–944.

- 127 -
184. Riquelme, C.A., Magida, J.A., Harrison, B.C., Wall, C.E., Marr, T.G., Secor,
S.M., and Leinwand, L.A. (2011). Fatty acids identified in the Burmese python promote
beneficial cardiac growth. Science 334, 528–531.
185. Olefsky, J.M., and Glass, C.K. (2010). Macrophages, inflammation, and insulin
resistance. Annu. Rev. Physiol. 72, 219–246.