iowa state university department chair: role, progression ... resources...iowa state university...
TRANSCRIPT

Iowa State University Department Chair:
Role, Progression, and Directions
A Report
Submitted to
Office of the Executive Vice President and Provost Iowa State University
Taskforce on ISU Department Leadership
ISU ADVANCE
Report prepared by
Dr. Linda Serra Hagedorn and Agustina V. Purnamasari

i
TABLE OF CONTENTS
TABLE OF CONTENTS………………………………………………………………………. i
LIST OF TABLES……………………………………………………………………..………. iv
LIST OF FIGURES………………………………………………..…………………………... vii
Executive Summary …………………………………………………………………………… 1
Introduction …………………………………………………………………………………… 2
Limitations ……………………………………………………………………………………. 3
Significance …………………………………………………………………………………… 3
REVIEW OF THE LITERATURE …………………………………………………………… 4
Methods ……………………………………………………………………………………….. 5
Data Collection ……………………………………………………………………………….. 6
Instruments …………………………………………………………………………………… 6
Data Analysis ………………………………………………………………………………… 8
Findings ……………………………………………………………………………………… 9
Department Chairs Overall Profile ………………………………………………………….. 9
Recruiting Source ……………………………………………………………………………. 12
Department Chair Pay-Base ………………………………………………………………… 13
Gender ………………………………………………………………………………………. 19
Race/Ethnicity ………………………………………………………………………………. 20
Time Management ………………………………………………………………………….. 22
Reviews/Assessments ………………………………………………………………………. 24
Performance Expectations ………………………………………………………………….. 26
Chair Duty/Task …………………………………………………………………………….. 29
Input to the Dean Regarding the Selection of Department Chair …………………………… 31

ii
Support ………………………………………………………………………………………. 33
Stress ………………………………………………………………………………………… 34
Difficulties Due to Gender, Race, and Sexual Orientation …………………………………. 35
Department Chair Profiles and Analyses by Colleges ……………………………………… 38
College of Agriculture ……………………………………………………………………… 38
Department Chairs’ Gender Distribution at the College of Agriculture ……………………. 42
Department Chairs’ Race/Ethnicity Distribution at the College of Agriculture …………… 43
College of Business ………………………………………………………………………… 44
Department Chairs’ Gender Distribution at the College of Business ……………………… 47
Department Chairs’ Race/ Ethnicity Distribution at the College of Business ……………... 48
College of Design ………………………………………………………………………….. 49
Department Chairs’ Gender Distribution at the College of Design ……………………….. 52
Department Chairs’ Race/ Ethnicity Distribution at the College of Design ………………. 53
College of Engineering …………………………………………………………………….. 54
Department Chairs’ Gender Distribution at the College of Engineering ………………….. 56
Department Chairs’ Race/ Ethnicity Distribution at the College of Engineering …………. 58
College of Human Sciences ……………………………………………………………….. 59
Department Chairs’ Gender Distribution at the College of Human Sciences …………….. 62
Department Chairs’ Race/ Ethnicity Distribution at the College of Human Sciences ……. 63
College of Liberal Arts and Sciences ……………………………………………………... 64
Department Chairs’ Gender Distribution at the College of Liberal Arts and Sciences …... 70
Department Chairs’ Race/ Ethnicity Distribution at the College of
Liberal Arts and Sciences …………………………………………………………………. 71

iii
College of Veterinary Medicine ………………………………………………………….. 72
Department Chairs’ Gender Distribution at the College of Veterinary Medicine ……….. 76
Department Chairs’ Race/ Ethnicity Distribution at the College of
Veterinary Medicine ………………………………………………………………………. 77
Conclusions and Recommendations …………………………………………..………….. 78
References …………………………………………………………………………………. 85

iv
LIST OF TABLES
Table 1. Number of Departments V. Number of Department Chairs 2012 ………………… 9
Table 2. Department Chairs who either Serve at the Same Department within 2 Different
Colleges or two Different Departments within 2 Different Colleges ……………. 11
Table 3. Department Chairs who serve at Two Different Departments
within One College ………………………………………………………………… 11
Table 4. Department Chairs Recruiting Source 2012 ……………………………………… 12
Table 5. Department Chairs Pay-Base 2012 ……………………………………………….. 14
Table 6. Department Chairs Salary per College 2012 ……………………………………… 16
Table 7. Department Chairs’ Salary Span 1994-2005 and 2012 ………………………….. 18
Table 8. Department Chairs’ Gender Demographics 2012 ……………………………….. 19
Table 9. Department Chairs’ Race/Ethnicity ……………………………………………… 20
Table 10. Amount of Time Spend by Department Chairs for their activities
(ranked descending) ………………………………….………………………….. 23
Table 11. Frequency of Department Chairs’ Performance Review by Dean ……………… 24
Table 12. Frequency of Department Chairs’ Performance Review by Faculty …………… 25
Table 13. How the Deans Provided Performance Expectations Prior To Assuming the
Position as Department Chairs …………………………………………………. 27
Table 14. The Importance of Department Chair duties (‘Extremely Important’ to
‘Not at all Important’) ………………………………………………………….. 29
Table 15. Persons Provided Inputs to the Dean Regarding the Selection of
Department Chair ……………………………………………………………….. 31
Table 16. Department Chairs Perceived Support …………………………………………. 33

v
Table 17. Department Chairs Perceived Stress ……………………………………………. 34
Table 18. Department Chairs’ Perceptions on difficulties due to Gender,
Race, and Sexual Orientation …………………………………………………… 35
Table 19. Department Chairs’ Length of Service in the College of Agriculture ………..… 38
Table 20. Department Chairs’ Gender Distribution at the College of Agriculture ………... 42
Table 21. Race/Ethnicity Profile at the College of Agriculture …………………………… 43
Table 22. Department Chairs’ Length of Service at the College of Business …………….. 44
Table 23. Department Chairs’ Gender Distribution at the College of Business ………….. 47
Table 24. Department Chairs’ Race/Ethnicity at the College of Business ……………….. 48
Table 25. Department Chairs’ Length of Service in the College of Design ……………… 49
Table 26. Gender Distribution in the College of Design …………………………………. 52
Table 27. Race/Ethnicity Profile in the College of Design ………………………………. 53
Table 28. Length of Service at College of Engineering ………………………………….. 54
Table 29. Department Chair Gender Distribution in the College of Engineering ….…….. 56
Table 30. Department Chairs’ Race/Ethnicity Background in the
College of Engineering …………………………………………………….…... 58
Table 31. Length of Service at the College of Human Sciences ………………………..… 59
Table 32. Department Chairs’ Gender Distribution at the College of
Human Sciences ……………………………………………………….……..… 62
Table 33. Department Chairs’ Race/Ethnicity Background at the
College of Human Sciences ……………………………………………..…….... 63
Table 34. Department Chairs’ Length of Service at the College of
Liberal Arts and Sciences ………………………………………………….……. 64

vi
Table 35. Department Chairs’ Gender Distribution at the
College of Liberal Arts and Sciences …………………………………………... 70
Table 25. Department Chairs’ Race/Ethnicity Distribution at the College of
Liberal Arts and Sciences ………………………………………………………. 71
Table 37. Department Chairs’ Length of Service at the College of
Veterinary Medicine ….…………………………………..…………………….. 72
Table 38. Department Chairs’ Gender Distribution at the College of
Veterinary Medicine ………………………………….………………………… 76
Table 39. Department Chairs’ Race/Ethnicity in the College of
Veterinary Medicine ……………………………………………………………. 77

vii
LIST OF FIGURES
Figure 1. Number of Departments V. Number of Department Chairs …………………….. 10
Figure 2. Department Chair Recruiting Source in Overall 2012 ………………………..…. 13
Figure 3. Department Chairs Pay-Base 2012 ……………………………………………..... 15
Figure 4. Department Chairs’ Average Compensation 2012 ………………………………. 17
Figure 5. Department Chairs’ Average Compensation 1994-2005……………………..… . 17
Figure 6. Department Chairs’ Salary Span 1994-2005 and 2012 …………………………. 18
Figure 7. Department Chairs’ Gender Distribution 1994-2005 …………………….……… 19
Figure 8. Department Chairs’ Gender Distribution 2012 ………………………………….. 19
Figure 9. Department Chairs’ Race/Ethnicity 1994-2005 …………………………………. 20
Figure 10. Department Chairs’ Race/Ethnicity 2012...…………………………………… 21
Figure 11. Frequency of Department Chairs’ Performance Review by Dean ……………… 24
Figure 12. Frequency of Department Chairs’ Performance Review by Faculty …………… 26
Figure 13. Department chairs’ perceptions on their evaluation whether or
not it is based on clear performance expectations ……………………………... 27
Figure 14. How the Deans provided performance expectations prior to assuming
the position as department chairs …………………………………………….... 28
Figure 15. Persons Provided Inputs to the Dean Regarding the Selection of
Department Chair ……………………..…………………………………….…. 32
Figure 16. Department Chairs’ Perceptions on Difficulty Due to Gender .…….…………. 36
Figure 17. Department Chairs’ Perceptions on Difficulty Due to Race ………………….. 37
Figure 18. Department Chairs’ Perceptions on Difficulty Due to Sexual Orientation ..….. 37
Figure 19. Length of Service before Administrative Appointment at the College of

viii
Agriculture ………………………………………………………………………. 39
Figure 20. Length of Service as Department Chairs at the College of Agriculture ………... 40
Figure 21. Average Length of Service as department chairs at the College of
Agriculture 1994-2005 …………………………………………………..…….. 40
Figure 22. Total Length of Service at the College of Agriculture ………………………… 41
Figure 23. Department Chairs’ Gender Distribution at the College of Agriculture ……..… 42
Figure 24. Race/Ethnicity Profile at the College of Agriculture …………………...……… 43
Figure 25. Length of Service before Administrative Appointment at the College of
Business ………………………………………………………...………………. 45
Figure 26. Length of Service as Department Chairs at the College of Business ………….. 46
Figure 27. Total Length of Service at ISU (College of Business) ...............……………... 46
Figure 28. Department Chairs’ Gender Distribution at the College of Business …………. 47
Figure 29. Department Chairs’ Race/Ethnicity at the College of Business ………..…..… 48
Figure 30. Length of Service before Adm. Appointment in the College of Design ……… 49
Figure 31. Average Length of Service before Adm. Appointment in the
College of Design 1994-2005 ……………………………………………..…. 50
Figure 32. Length of Service as Department Chairs in the College of Design ………….. 50
Figure 33. Average Length of Service as Department Chairs in the
College of Design 1994-2005 ………………………………………………… 51
Figure 34. Total Length of Service as Department Chairs in the College of Design ……… 51
Figure 35. Gender Distribution in the College of Design …………………………………. 52
Figure 36. Race/Ethnicity Profile in the College of Design ………………………………. 53
Figure 37. Length of Service before Administrative Appointment at the
ix
College of Engineering ……………………………………………………..… 54
Figure 38. Length of Service as Department Chairs at College of Engineering ………..… 55
Figure 39. Total Length of Service at the College of Engineering ………………………. 55
Figure 40. Department Chair Gender Distribution in the College of Engineering ……….. 56
Figure 41. Department Chair Gender Distribution in the College of Engineering
1994-2005 …………………………………………………………………….. 57
Figure 42. Department Chair Race/Ethnicity Profile in the College of
Engineering ……………………………………………………………………. 58
Figure 43. Department Chairs’ Length of Service before Administrative Appointment at the
College of Human Sciences …………………………………………..………… 60
Figure 44. Length of Service as Department Chairs at the College of Human Sciences ….. 61
Figure 45. Department Chairs’ Total Length of Service as at the
College of Human Sciences …………………………………………………… 61
Figure 46. Department Chairs’ Gender Distribution at the College of Human Sciences …… 62
Figure 47. Department Chairs’ Race/Ethnicity Background at the
College of Human Sciences ………………………………………………… 63
Figure 48. Department Chairs’ Length of Service before Administrative Appointment at the
College of Liberal Arts and Sciences ………………………………………… 66
Figure 49. Department Chairs’ Length of Service before Administrative Appointment at the
College of Liberal Arts and Sciences 1994-2005 …………………………….... 67
Figure 50. Length of Service as Department Chairs at the College of Liberal
Arts and Sciences …………………………………………………………...… 68
Figure 51. Length of Service as Department Chairs at the College of Liberal

x
Arts and Sciences 1994-2005 ……………………………………..…………...... 68
Figure 52. Department Chairs’ Total Length of Service at the College of Liberal
Arts and Sciences ………………………………………………………………. 69
Figure 53. Department Chairs’ Gender Distribution at the College of Liberal
Arts and Sciences ………………………………………………………………. 70
Figure 54. Department Chairs’ Race/Ethnicity Distribution at the College of
Liberal Arts and Sciences ……………………………………………………… 71
Figure 55. Department Chairs’ Length of Service before Administrative Appointment at
the College of Veterinary Medicine ………………………………………..…. 72
Figure 56. Department Chairs’ Length of Service before Administrative Appointment at
the College of Veterinary Medicine 1994-2005 ……………….……………… 73
Figure 57. Length of Service as Department Chairs’ at the College of
Veterinary Medicine ……………………………………………….………….. 74
Figure 58. Average Length of Service as Department Chairs at the College of
Veterinary Medicine 1994-2005 …………………………….…………..….... 74
Figure 59. Department Chairs’ Total Length of Service at the College of
Veterinary Medicine ……………………………………………………...…… 75
Figure 60. Department Chairs’ Gender Distribution at the College of
Veterinary Medicine …………………………………………………………… 76
Figure 61. Department Chairs’ Race/Ethnicity in the College of
Veterinary Medicine ……………………………………………………………. 77

Iowa State University Department Chair 1
Executive Summary
This report provides an analysis on the topic of department chairs. The data were
gathered through an online survey questionnaire distributed to all Iowa State University
department chairs and from the ISU Office of Institutional Research. The ISU department chair
questionnaire can be found in appendix B. For the purpose of comparing changing trends of
department chairs, this report also contains information from a previous study; Trend Analysis of
ISU Department Chairs covering the years of 1994 to 2005 (Appendix A).
In general, across colleges there has been a slight shift in the proportion of participation
of chairs from people of color. However, similar to the findings from the longitudinal study
covering 1994 to 2005, there continues to be an absence of certain races, such as Hispanic and
Native American among department chairs.
In addition to the race/ethnicity distribution, gender remains unbalanced. Over the years,
females have been consistently underrepresented in this administrative position.
The full report provides detailed descriptions of the trend and progress of ISU department
chairs.

Iowa State University Department Chair 2
Introduction
The role of the department chair is likely the most misunderstood, non-standardized, least
studied, and most paradoxical of all academic positions. Despite the ambiguity, department
chairs perform a crucial leadership role. The job description can include a long list of tasks such
as: defining the strategic mission of the unit, curriculum planning, writing and administering
performance reviews, fiscal oversight, and advocating for and representing the department to the
university at large and to external constituents. Moreover the department chair serves as the
crucial link and bridge between the administration and faculty.
In 2005, ISU researchers provided a trend analysis of ISU department chairs covering the
years of 1994 to 2005. Using data derived from letters of intent (LOI) and the ISU
Administrative System (ADIN), the report’s stated purpose was to provide a general background
analysis. The report consisted of summary data for the colleges and within their departments.
Although comprehensive and informative, the 2005 report is now six years old and in need of
update and expansion. In addition, the October 21, 2010 meeting of the Taskforce on ISU
Department Leadership, led by Associate Provost Dawn Bratsch-Prince, defined key issues that
need to be addressed. Specifically, the task force has called for:
A definition of the role of chair
Clarification on the appointment and review process for chairs
The development of a pipeline for identifying and mentoring new chairs
In line with the research purpose, a survey distributed to department chairs designed to
answer the following research questions:
1. How are chairs appointed? What are the different patterns of appointment at ISU?

Iowa State University Department Chair 3
2. How are chairs evaluated?
3. What is the most stressful duty according to the chairs?
4. What is the gender disparity of ISU chairs? How can ISU close the gender gap?
5. What is the racial disparity of ISU chairs? What steps can be taken to increase the
diversity of ISU department chairs?
6. How do chairs perceive social identities (gender, race, and sexual orientation) with
respect to the difficulties in performing their role as chairs?
7. What are policy recommendations for the university?
Limitations
This is a study of Iowa State University. All department chairs were invited to
participate. Findings are limited to Iowa State University.
Significance
The findings of the current research provide a better understanding on the roles,
responsibility, and progress of department chairs at ISU. The results of this study provide ISU
higher administrators and department chairs insight to the issues surrounding the complexities of
the role of department chairs.

Iowa State University Department Chair 4
REVIEW OF THE LITERATURE
The literature review provides a foundation for this study and serves as the framework for
the analyses of the findings. Although not a popular topic, studies on department chairs have
served the needs of academic institutions in supporting their department chairs to perform
effectively.
Nearly 80% of all university administrative decisions are made by department chairs
(Seagren, Creswell, & Wheeler, 1993; Carroll & Wolverton, 2004). The three major roles-
academic, administrative, and leadership, describe only a small amount of the multiple roles of
department chairs. Their job description can include a long list of tasks such as: defining the
strategic mission of the unit, curriculum planning, writing and administering performance
reviews, fiscal oversight, and advocating for and representing the department to the university at
large, and to external constituents (Smith, 2004). Moreover, the department chair serves as the
crucial link and bridge between the administration and faculty.
Despite the very demanding department chairs’ roles and responsibilities, there is very
little available formal managerial training that prepares them to enter the position (Hecht,
Higgerson, Gmelch, & Tucker, 1999). In addition to insufficient preparation, department chairs
have to deal with multiple roles that are embedded within the teaching, research, service, and
administrative responsibilities. While department chairs might have experience in semi-
administrative roles (for example, serving as chair on a departmental committee), it is likely
insufficient to prepare them for the diverse and complex tasks of the department chair.
Individuals assuming the position of department chair must deal with role ambiguity as well as
the multiple expectations of others,( i.e. central administration, faculty, and students) (Pappas,
1989). The midlevel leadership position as department chair is indeed demanding and stressful;

Iowa State University Department Chair 5
consequently, the position of department chair is one of the most difficult to fill. Oftentimes,
those who are appointed would actually prefer not to take the position (Gmelch & Miskin, 1993).
Those who assume the position of chair have to deal with an extremely busy schedule that
requires them to devote their time to the department, faculty, and students, which leaves very
little time left for themselves (Smith, 2004).
This research seeks to better understand the roles and responsibilities of department
chairs at Iowa State University. More specifically, the purpose of this study is to understand how
ISU Department Chairs view their roles as well as to find ways to improve the support they
receive in regard to their responsibilities.
The research findings serve as a means to assess the academic environment for
department chairs at ISU. Feedback and opinions obtained from the survey results may assist in
the identification of appropriate and rewarding training programs and/or workshops to better
prepare the department chairs for their complex roles.
Methods
In order to respond to the stated research questions as well as to document change since
the 2005 report, the following data sources were used:
1. Survey of all ISU department chair.
2. Document analysis of ISU institutional data
3. Interview with all ISU deans

Iowa State University Department Chair 6
Data collection
In order to collect the data needed to answer the research questions, the following types
of data were collected from ISU Administrative System and Letters of Intent:
a. Number of departments per college
b. Email addresses of all chairs and deans in preparation for online surveys
c. Size of each department (number of faculty and of students)
d. Chairs demographic data (gender, race/ethnicity)
e. Date of appointment
f. Length of service at ISU
g. Appointment type
h. Reappointment data
i. Pay base
Instruments
An online questionnaire was designed and administered to the department chairs at ISU.
The survey questionnaire included the following sections:
1. Chair demographics (i.e., marital status, number of children under 18 years old)
2. Appointment/Review (how they are recruited)
3. Duties (how chairs spend their time)
4. Training (experience prior to becoming department chair)
5. Support (mentors or role models; whom they turn to for questions)
6. Evaluation (self-expectations; perceived dean’s expectations)
7. Leadership (mentors and role models; authority and lack thereof)

Iowa State University Department Chair 7
8. Department culture and norms
a. Chair evaluation procedures
b. Role of chair in the department
The department chair questionnaire was composed from a collection of existing
questionnaires of department chairs research (California State University, n.d.; Washington State
University, 1992) as well as additions to answer specific ISU concerns. After the process of
designing the questionnaire was completed, my major professor, Associate Dean Dr. Linda
Hagedorn and I arranged a meeting with the ISU Provost’s Office and the Department Chairs
Leadership Task Force. The purpose of the meeting was to review all items in the questionnaire.
Several items were edited per the committee’s recommendations. The revised questionnaire was
ultimately approved and finalized. On March 6, 2012 Dr. Linda Serra Hagedorn and Agustina
Purnamasari were called to the ISU IRB Committee meeting to discuss the submitted IRB
package. On March 14, IRB formally approved the study and sent the approval letter. The final
Department Chair questionnaire is presented in Appendix B.
In addition to the Department Chair Survey, additional data were collected from
interviews with all ISU Deans. The purpose of the interview was to understand the role of chair
from the perspective of deans as well as to compare chair responses to those of the deans.
The interview questions for the Deans (Appendix C) included the following items:
a. Expectations of chairs
b. Relationships with chairs
c. Suggestions for better implementing chair leadership

Iowa State University Department Chair 8
Data Analysis
Since there were two types of data collected, quantitative and qualitative, the data
analyses were done separately. The quantitative data were analyzed using descriptive and
inferential statistics. The qualitative data were analyzed through an inductive approach using
coding into categories to find consistencies and differences. These categories were used to
capture themes across the data and the themes were used to generate the findings. As a part of
understanding the roles and responsibilities of ISU department chairs, this study assesses
whether ISU deans’ perceptions on the roles and responsibilities of department chairs match with
the department chairs’ perceptions of their roles and responsibilities. The theoretical perspective
that guides this study is basic interpretive. The goal in basic interpretive research is to understand
the meaning the participants have constructed about their experiences and their interaction with
the social world (Merriam, 2008). The methodology used is case study. In a case study the
researcher explores a case within a bounded system through detailed, in-depth data collection
involving multiple sources of information (e.g. interview, observation, audiovisual materials,
document, and report) (Creswell, 2007, p.73). In the current study, the bounded system is the
setting of the research (i.e. Iowa State University), whereas the multiple sources of information
are interview and analysis of the university document. The method of inquiry utilized was
interview.

Iowa State University Department Chair 9
Findings
The findings covered within this document represent the results of quantitative analyses
of the chairs’ questionnaire data. The analyses are presented through the overall description of
ISU department chairs. The next part of the findings presents the data analyses by colleges.
The qualitative data will be analyzed and presented at a later date after all interviews with
college deans are completed and transcribed.
Department Chairs Overall Profile
Similar to the 2005 study, the number of department chairs is less than the number of
departments (Table 1 and Figure 1) due to the fact that there are chairs who serve two different
departments in the same colleges, and there are others who serve in one department within two
different colleges.
Colleges Number of Departments Number of Department
Chairs
College of Agriculture and Life Sciences 14 10
College of Business 5 3
College of Design 6 5
College of Engineering 8 8
College of Human Sciences 6 5
College of Liberal Arts and Sciences 20 16
College of Veterinary Medicine 5 5
Total 64 52
Table 1. Number of Departments V. Number of Department Chairs 2012

Iowa State University Department Chair 10
0
2
4
6
8
10
12
14
16
18
20
College ofAgriculture
and LifeSciences
College ofBusiness
College ofDesign
College ofEngineering
College ofHuman
Sciences
College ofLiberal Arts
andSciences
College ofVeterinaryMedicine
14
5 6
8
6
20
5
10
3
5
8
5
16
5
Number of Departments V. Number of Dept. Chairs
Number of Departments Number of Department Chairs
Note:
There are more departments than the department chairs (52 persons) because there are chairs who serve at
2 different departments and/or 2 different colleges.
There are six cases of department chairs who serve in either the same department within
two different colleges or two different departments within two different colleges (Table 2). Also,
there are four cases of department chairs who serve in two different departments within one
college (Table 3).
Figure 1. Number of Departments V. Number of Department Chairs

Iowa State University Department Chair 11
No. Name Department Colleges
1 Steven Mickelson
Agricultural & Biosystems
Engineering Agriculture and Life Sciences
Agricultural & Biosystems
Engineering Engineering
2 Ruth S. MacDonald Food Science & Human Nutrition Agriculture and Life Sciences
Food Science & Human Nutrition Human Sciences
3 R. Paul Lasley Sociology Agriculture and Life Sciences
Anthropology (interim) Liberal Arts and Sciences
4 Aragula Rao
Biochemistry, Biophysics and
Molecular Biology Agriculture and Life Sciences
Biochemistry, Biophysics and
Molecular Biology Liberal Arts and Sciences
5 Jonathan Wendel
Ecology, Evolution & Organismal
Biology Agriculture and Life Sciences
Ecology, Evolution & Organismal
Biology Liberal Arts and Sciences
6 Jo Powell-Coffman
Genetics, Development & Cell
Biology (interim) Liberal Arts and Sciences
Genetics, Development & Cell
Biology (interim) Agriculture and Life Sciences
No. Name Departments Colleges
1 Sue Blodgett Entomology Agriculture and Life Sciences
Natural Resource Ecology and Management
2 Frederick H. Dark Accounting Business
Finance
3 Thomas I. Chacko Management Business
Marketing
4 Douglas Johnston Community & Regional Planning Design
Landscape Architecture
Table 3. Department chairs who serve at two different departments within one college
Table 2. Department chairs who either serve at the same department within 2 different
colleges or two different departments within 2 different colleges

Iowa State University Department Chair 12
Recruiting Source
Chairs can be recruited internally or externally. Internal recruitment occurs when a chair
is appointed from within ISU. External recruitment occurs when the department chair is
appointed from outside ISU. Although internal recruitment is more likely than external,
departments across ISU have shown various patterns of recruitment (Table 4 and Figure 2).
Former
Assignments Agriculture Business Design Engineering
Human
Sciences
Liberal
Arts and
Sciences
Veterinary
Medicine
Internal 5 2 2 5 3 12 4
External 5 1 3 3 2 4 1
Table 4. Department Chairs Recruiting Source 2012

Iowa State University Department Chair 13
Figure 2. Department Chair Recruiting Source in Overall 2012
Department Chair Pay-Base
According to the ISU Faculty Handbook and Procedures (ISU, Office of the Executive
Vice President and Provost, n.d.), appointments of department chairs who are faculty members
are divided into two categories; A-base and B-base. A-base appointments are reserved for
administrative positions and for persons whose responsibilities require year-round service. Those
on A-base are on duty throughout the entire fiscal year, during which they accrue twenty-four
Agriculture Business Design EngineeringHuman
SciencesLiberal Arts
and SciencesVeterinaryMedicine
External 5 1 3 3 2 4 1
Internal 5 2 2 5 3 12 4
5
2 2
5
3
12
4
5
1
3
3
2
4
1
0
1
2
3
4
5
6
7
8
9
10
11
12
13
14
15
16
17N
um
be
r o
f D
ep
art
me
nt
Ch
air
s Department Chairs Recruitment Sources

Iowa State University Department Chair 14
days of paid vacation. In addition, persons on A-base part-time appointments are required to
maintain their responsibilities to the department, college, and university throughout the entire
fiscal year. Faculty members on B-base are on duty during the academic year, and they receive
no paid vacation. Those who are on B-base part-time appointments are expected to maintain their
responsibilities to the department, college, and university throughout the entire academic year.
As presented in Table 5, ISU department chairs’ pay base varied across and within
colleges. In the College of Agriculture, for instance, 60 % of the department chairs are 12
months or A-base, and 40% of the department chairs are 9 months or B-base. Although in some
cases there is only one type of pay-base, either A-base or B-base; however, within other colleges
there appears to be no consistent pattern of pay-base.
Colleges A (12 Months) B (9 Months)
Agriculture 6 (60%) 4 (40%)
Business 3 (100%) 0 (0%)
Design 1 (20%) 4 (80%)
Engineering 0 (0%) 8 (100%)
Human Sciences 4 (80%) 1 (20%)
LAS 11 (69%) 5 (31%)
Vet Med 4 (80%) 1 (20%)
Table 5. Department Chairs Pay-Base 2012

Iowa State University Department Chair 15
Figure 3. Department Chairs Pay-Base 2012
6
3
1
4
11
4
4
4
8
1
5
1
0 1 2 3 4 5 6 7 8 9 10 11 12 13 14 15 16 17
Agriculture
Business
Design
Engineering
Human Sciences
LAS
Vet Med
Agriculture Business Design EngineeringHuman
SciencesLAS Vet Med
A (12 Months) 6 3 1 0 4 11 4
B (9 Months) 4 0 4 8 1 5 1
Department Chairs' Pay Base

Iowa State University Department Chair 16
Descriptive of department chairs’ compensation (average, maximum, and minimum
salary) is summarized in Table 6 and Figure 4. To provide an overview of salary increase over
the years, Figure 5 provides a summary of the department chairs’ average salary covering the
years of 1994-2005.
As shown in Table 6, the span between the highest and the lowest salary, (i.e. between
246,225 and 69,072) is quite wide. The amount of the highest salary is more than three times the
lowest salary.
Colleges Average Salary ($) Maximum Salary ($) Minimum Salary ($)
Agriculture 161,585 217,222 99,121
Business 200,544 221,280 187,945
Design 138,691 138,691 69,072
Engineering 178,227 199,290 150,000
Human Sciences 169,689 188,700 123,392
LAS 134,124 201,409 79,769
Vet Med 166,819 246,225 130,650
Table 6. Department Chairs’ Salary per College 2012

Iowa State University Department Chair 17
Agriculture Business Design Education Engineering FCS LAS Vet Med
Avg Dept Ch Sal $90,880 $99,622 $96,236 $79,054 $104,665 $85,602 $81,262 $96,872
$0
$20,000
$40,000
$60,000
$80,000
$100,000
$120,000
Department Chair Average Compensation 1994-2005
Agriculture Business Design EngineeringHuman
SciencesLAS Vet Med
Average Salary ($) $161,585 $200,544 $138,691 $178,228 $169,690 $134,125 $166,820
Maximum Salary ($) $217,222 $221,280 $138,691 $199,290 $188,700 $201,409 $246,225
Minimum Salary ($) $99,121 $187,945 $69,072 $150,000 $123,392 $79,769 $130,650
$0.00
$50,000.00
$100,000.00
$150,000.00
$200,000.00
$250,000.00
$300,000.00
Sala
ry
Department Chairs Salary (in dollar)
Figure 4. Department Chairs’ Average Compensation 2012
Figure 5. Department Chairs’ Average Compensation 1994-2005

Iowa State University Department Chair 18
Agriculture Business Design EngineeringHuman
SciencesLAS Vet Med
Average Salary in 2012 ($) $161,585 $200,544 $138,691 $178,227 $169,689 $134,124 $166,819
Average Salary in 1994-2005 $90,880.00 $99,622.00 $96,236.00 $104,665.00 $82,328.00 $81,262.00 $96,872.00
$0
$50,000
$100,000
$150,000
$200,000
$250,000
Comparison of Department Chairs' Average Compensation between 1994-2005 and 2012
The percentage increase of department chairs’ salary across colleges from the period of 1994-
2005 as compared to 2012 is presented in Table 7. The highest percentage increase is in the
College of Agriculture and the lowest is in the College of Design.
Colleges Average Salary in
2012 ($)
Average Salary in
1994-2005
Salary
Span %
Agriculture $161,585 $90,880.00 $70,705 77.8
Business $200,544 $99,622.00 $100,922 101.3
Design $138,691 $96,236.00 $42,455 44.1
Engineering $178,227 $104,665.00 $73,562 70.28
Human Sciences* $169,689 $82,328.00 $87,361 106.11
LAS $134,124 $81,262.00 $52,862 65.05
Vet Med $166,819 $96,872.00 $69,947 72.21
Table 7. Department Chairs’ Salary Span 1994-2005 and 2012
Figure 6. Department Chairs’ Salary Span 1994-2005 and 2012
Note: *The College of Human Sciences is a merger between the College of Education and College
of Family and Consumer Sciences; therefore, the comparison of salary span for the College of
Human Sciences is derived from the average salary of College of Education and College of Family
and Consumer Sciences

Iowa State University Department Chair 19
21%
79%
Department Chairs' Gender Distribution
Female
Male
Male 83%
Female 17%
Gender
Gender
In terms of gender, males continue to dominate the role of department chair. In the
longitudinal data covering the years of 1994 to 2005, only 17 % of chairs were female (Figure 7).
Seven years later, the study found that the progress of female participation in this mid-level
administration has only slightly increased, as indicated by the 3% increase of women who are
department chairs as compared to the 2005 data (in 2012 21% of chairs are female) (Table 8 and
Figure 8).
Gender Number of dept. chairs
Female 11
Male 41
Table 8. Department Chairs’ Gender Demographics 2012
Figure 8. Department Chairs’ Gender Distribution 2012
Figure 7. Department Chairs’ Gender Distribution 1994-2005

Iowa State University Department Chair 20
Race/Ethnicity
The demographic data show that the ethnic diversity of department chairs has increased
significantly for certain races, but has decreased for others. As indicated in Figure 9, in 1994 to
2005, 6 % of department chairs were Asian, while in 2012 the number has more than doubled to
13 % (Figure 10). As for other races, namely African American, Hispanic, and Native American,
the percentages have decreased.
Ethnicity Number of Department Chair
Caucasian 44
African American 1
Asian 7
Native American 0
Hispanics 0
91%
2%
6%
0% 1%
Department Chairs' Race/Ethnicity 1994-2005
Caucasian
African American
Asian
Native American
Hispanic
Table 9. Department Chairs’ Race/Ethnicity
Figure 9. Department Chairs’ Race/Ethnicity 1994-2005

Iowa State University Department Chair 21
85%
2% 13%
0% 0%
Department Chairs' Race/Ethnicity
Caucasian
African American
Asian
Native American
Hispanics
Figure 10. Department Chairs’ Race/Ethnicity

Iowa State University Department Chair 22
Time Management
One of the items in the questionnaire (see Appendix B, page 25) discussed how much
time the department chairs spent for a list of activities (In an average year, estimate the amount
of time you spend in each department chair activity?). A Likert type response option with a
range of 1 (none) to 5 (a great deal of time) was provided. The department chair activities are
listed in Table 10. The activities are ranked based on the respondents’ level of the agreement.
Table 10 shows that most of the chairs believed that evaluating faculty performance is the
activity that took up a large proportion of their time; while representing the department at
professional meetings took the least amount of time.

Iowa State University Department Chair 23
Descriptive Statistics
Items N Rank Sum Mean
(Std. Deviation)
2. Evaluate faculty performance 45 1 179 3.98 (.892)
16. Manage department resources (finances, facilities, equipment,
and space)
44 2 174 3.95 (.776)
12. Effectively advocate for departmental interests to higher
authorities
45 3 165 3.67 (1.108)
20. Provide feedback to faculty on their major activities 45 4 159 3.53 (.869)
5. Develop and initiate long-range departmental goals 45 5 155 3.44 (.918)
8. Allocate faculty responsibilities in an effective and equitable
manner
45 6 150 3.33 (.905)
1. Facilitating successful recruitment and selection of promising
faculty
45 6 150 3.33 (.929)
18. Prepare and propose budgets 45 8 148 3.29 (.991)
7. Solicit ideas to improve the department 45 9 144 3.20 (.815)
11. Coordinate departmental activities 45 10 142 3.16 (.878)
17. Remain current within academic discipline 45 11 141 3.13 (1.198)
9. Inform faculty of department, college, and university concerns 45 12 140 3.11 (.775)
4. Assist faculty in developing their own goals and priorities 45 13 138 3.07 (.809)
6. Plan and conduct department meetings 45 14 136 3.02 (.892)
19. Look out for the personal welfare of individual faculty
members
45 15 132 2.93 (.889)
14. Participate in college and university committee work 45 16 131 2.91 (.949)
3. Reduce, resolve, and/or prevent conflict among departmental
faculty members
45 17 124 2.76 (1.048)
10. Plan and evaluate curriculum development 45 18 121 2.69 (.996)
15. Fundraising 45 19 118 2.62 (1.114)
13. Represent the department at professional meetings 45
20 110
2.44 (.967)
21. Other. Please explain* _______ 5 21 4.20 (.837)
Valid N (listwise) 5
Table 10. Amount of Time Spend by Department Chairs for Their Activities (ranked descending)

Iowa State University Department Chair 24
2%
98%
How often is your performance formally reviewed by your Dean?
Never
Once a year
Reviews/Assessments
All but one of the 45 department chairs who participated in the survey agreed that they
are annually reviewed by the dean (Table 11 and Figure 11).
How often is your performance formally reviewed by your Dean?
(question 27) Frequency Percent (%)
Never 1 2.2
Once a year 44 97.8
Total 45 100.0
Note:
*1Represent the department within the state of Iowa/ doing outreach on behalf of the department in the state;
2Schedule TA assignments and courses;
3Promote diversity, help recruit exceptional graduate students, find TA and RA support for graduate students, prepare
reports and provide information to the colleges, promote systems to improve the quality of faculty teaching, managing
department staff and IT support, inform faculty of external funding opportunities, maintain support for consulting
services the Department provides to other departments and research units on campus; deal with students.
Table 11. Frequency of Department Chairs’ Performance Review by Dean
Figure 11. Frequency of Department Chairs’ Performance Review by Dean

Iowa State University Department Chair 25
With regard to the performance review by the faculty, 15 department chairs shared that
their performance is annually reviewed by the faculty, four department chairs said they are
reviewed once every four years, two department chairs said the faculty never reviewed their
performance, and two chairs stated that the review is done at the request of the faculty (there is
no particular pattern). As presented in the note section below the Table, fifteen chairs explained
various review patterns done by faculty (Table 12 and Figure 12).
How often is your performance formally
reviewed by Faculty? (question 28) Frequency Percent
Never 2 4.4
Once a year 15 33.3
Once every 2 years 2 4.4
Once every 3 years 5 11.1
Once every 4 years 4 8.9
At your request (no particular pattern) 2 4.4
Other. Please explain*1 -15
15 33.3
Total 45 100.0
Table 12. Frequency of Department Chairs’ Performance Review by Faculty
Note:
*1year prior to end of chair term;
2I don't know if the Deans approach the faculty directly;
3at time of appointment
renewal - 5 years; 4at the request of the dean;
5during contract renewal;
65 years;
7no particular pattern:
8upon
faculty request; 9have not been chair long enough to be reviewed;
10not certain. This is my first year. I need to check
into this; 11
at time of renewal; 12
at the request of the Deans of LAS and CALS; 13
prior to end of initial appointment; 14
as part of renewal review; 15
at the end of a 5 year term and/or at the request of the Dean.

Iowa State University Department Chair 26
5%
33%
5% 11%
9% 4%
33%
How often is your performance formally reviewed by Faculty?
Never
Once a year
Once every 2 years
Once every 3 years
Once every 4 years
At your request (no particular pattern)
Other. Please explain
Performance Expectations
Using a Likert scale from ‘Strongly Agree’ (5), ‘Agree’ (4), ‘Neither Agree nor
Disagree’ (3), ‘Disagree’ (2) to ‘Strongly Disagree’ (1), the respondents were asked to give their
perceptions on the clarity of their performance expectations. The mean is 3.9 and the standard
deviation is 1.02. The department chairs’ perceptions is presented in Figure 13. The majority of
the chairs agreed that their evaluations are based on clear performance expectations, only 2
chairs strongly disagreed.
Figure 12. Frequency of Department Chairs’ Performance Review by Faculty

Iowa State University Department Chair 27
30%
42%
21%
2% 5%
My evaluation is based on clear performance expectations
(Strongly Agree to Strongly Disagree)
Strongly Disagree
Disagree
Neither Agree nor Disagree
Agree
Strongly Agree
The next item in the questionnaire asked how the performance expectations were
provided by the Deans prior to assuming the position as department chairs; whether verbally, in
writing, not provided, or using other ways. Over 80% of the respondents indicated that
performance expectations were provided either verbally or in writing (Table 13 and Figure 14).
How were performance expectations provided to you by your Dean
PRIOR to becoming department chair? Frequency Percent
Verbally 14 31.8
In writing 24 54.5
Not provided 4 9.1
Other. Please specify*1,2
2 4.5
Total 44 100.0
Figure 13. Department chairs’ perceptions on their evaluation whether or not it is based on clear
performance expectations
Table 13. How the Deans provided performance expectations prior to assuming the position as
department chairs
Note:
*1Verbally and in writing,
2 Chair provided expectations, not the Dean

Iowa State University Department Chair 28
32%
55%
9%
4%
How were performance expectations provided to you by your
Dean PRIOR to becoming department chair?
Verbally
In writing
Not provided
Other. Please specify
Figure 14. How the Deans provided performance expectations prior to assuming the position as
department chairs

Iowa State University Department Chair 29
Chair Duty/Task
Table 14 provides the ranking of items related to respondents’ perceptions of the
importance of specific chair duties. The majority of the chairs agreed that facilitating successful
recruitment and selection of promising faculty is the most important duty.
Rate the importance of each of the following department chair duties Rank
Mean
(Standard
Deviation)
1. Facilitating successful recruitment and selection of promising faculty 1 4.87 (.34)
12. Effectively advocate for departmental interests to higher authorities 2 4.67 (.48)
2. Evaluate faculty performance 3 4.64 (.48)
16. Manage department resources (finances, facilities, equipment, and space) 4 4.60 (.58)
5. Develop and initiate long-range departmental goals 5 4.51 (.589)
8. Allocate faculty responsibilities in an effective and equitable manner 6 4.38 (.49)
20. Provide feedback to faculty on their major activities 7 4.36 (.57)
4. Assist faculty in developing their own goals and priorities 8 4.31 (.56)
18. Prepare and propose budgets 8 4.31 (.67)
7. Solicit ideas to improve the department 9 4.28 (.46)
3. Reduce, resolve, and/or prevent conflict among departmental faculty members 10 4.20 (.69)
9. Inform faculty of department, college, and university concerns 11 4.13 (.58)
6. Plan and conduct department meetings 12 4.09 (.67)
17. Remain current within academic discipline 13 4.00 (.68)
19. Look out for the personal welfare of individual faculty members 13 3.91 (.82)
10. Plan and evaluate curriculum development 14 3.75 (.68)
11. Coordinate departmental activities 15 3.71 (.63)
15. Fundraising 16 3.69 (.95)
13. Represent the department at professional meetings 17 3.58 (.97)
14. Participate in college and university committee work 18 3.53 (.81)
21. Other. Please explain*1-9
Table 14. The Rank of Importance of Department Chair duties (‘Extremely Important’ to ‘Not at all
important’)

Iowa State University Department Chair 30
Related to the chair duties listed in the previous table, the chairs were also asked if they
would like more training on those specific duties. Three chairs would like to have more training
in evaluating faculty performance (statement number 2); develop and initiate long-range
departmental goals (statement number 5); fundraising (statement number 15); managing
department resources (statement number 16); and preparing and proposing budgets (statement
number 18). Two chairs stated that they need training in reducing, resolving, and/or preventing
conflict among departmental faculty members. One chair indicated the need for training for each
of the following statements, i.e. Facilitating successful recruitment and selection of promising
faculty; assist faculty in developing their own goals and priorities; plan and conduct department
meetings; plan and evaluate curriculum development; plan and evaluate curriculum
development; remain current within academic discipline; and look out for the personal welfare of
individual faculty members.
Note:*
1. Coordinate or negotiate with other departments regarding interdepartmental curricula or enterprises.
2. Ensure the department's well-being.
3. All of the above tasks are important. In a relatively large department, we have active committees working on much of
this with the chair providing oversight/critique.
4. Leading new initiatives.
5. Foster an environment of passionate faculty, staff, students.
6. Nurture positive culture.
7. Trying to manage a small college with the resources of a department. Iowa State needs to reorganize with schools that
are streamlined and maintain identity. We never should have made a college out of Human Sciences. They both should
have been schools. Now we have a School of Education, but what about the other half of Human Sciences? And Human
Sciences conflicts with Social Sciences in LAS. I also do enrollment management. We need more of that at Beardshear,
too. Scheduling classes is a nightmare at ISU.
8. Provide a place for students to express their concerns. A friendly face.
9. Promote diversity, help recruit exceptional graduate students, find TA and RA support for graduate students, prepare
reports and provide information to the colleges, promote systems to improve the quality of faculty teaching, managing
department staff and IT support, inform faculty of external funding opportunities, maintain support for consulting
services the Department provides to other departments and research units on campus.

Iowa State University Department Chair 31
Input to the Dean Regarding the Selection of Department Chair
One of the questions related to those who provide input to the Dean regarding the
selection of chairs. The answer to this question can be more than one option. As seen in Table
36, most department chairs 44 out of 47, stated that the tenured faculty provides input to the
Dean with regard to the selection of department chair (Table 15 and Figure 61).
Who provides input to the Dean regarding the selection of Department Chair? (choose all that apply)
Tenured
faculty
Tenure-
track
faculty
Non-tenure eligible
(e.g. Clinical faculty)
Adjunct
faculty
Part-time
faculty
Staff Emeritus
faculty
Other. Please
specify*1-8
44 42 36 26 22 35 6 10
84.6% 80.77% 69.23% 50% 42.30% 67.31% 11.54% 19.23%
Table 15. Persons Provided Inputs to the Dean Regarding the Selection of Department Chair
Note:*
1. Industry stakeholders 2.
I presume it is weighted, with more weight to the tenured and tenure track faculty 3.
Advisory Council 4.
members of profession 5.
graduate and undergraduate students and External advisory board members 6.
Member of dept. industry advisory council 7.
Advisory council 8.
Staff only informally 9.
Advisory Council, alumni

Iowa State University Department Chair 32
44 42
36
26 22
35
6 10
0
5
10
15
20
25
30
35
40
45
50
Figure 15. Persons Provided Inputs to the Dean Regarding the Selection of Department Chair

Iowa State University Department Chair 33
Support
With a five-point Likert scale from ‘Strongly Agree’ (5) to ‘Strongly Disagree’ (1), the
department chairs were asked to rate several statements related to their perception on support. As
indicated by the mean in Table 16, the majority of the chairs agreed that the Dean strongly
supports them.
Statements Mean (Standard Deviation)
1. My dean supports me 4.47 (.84)
2. My faculty trusts me 4.36 (.80)
3. I have the authority to make important decisions 3.91 (1.06)
4. My dean has confidence in my leadership 4.42 (.78)
5. My faculty have confidence in my leadership 4.27 (.84)
Table 16. Department Chair Perceived Support

Iowa State University Department Chair 34
Stress
Using a four-point Likert scale, the chairs’ were asked to rate statements related to the
level of stress. The scale ranged from ‘Extremely Stressful’ (4), ‘Stressful’ (3), ‘Somewhat
Stressful’ (2), and ‘Not Stressful’ (1). As indicated by the mean, chairs agreed that gaining
financial support for department programs is the most stressful task (Table 17).
Rate your level of stress in each of the following areas Mean (Standard Deviation)
1. Time to stay current in my field (with research, conferences, etc.) 2.80 (.87)
2. Gaining financial support for department programs 2.98 (.81)
3. My academic career progress 2.27 (.89)
4. Fulfilling my high self-expectation 2.91 (.95)
5. Attending meetings 2.18 (.89)
6. Dealing with faculty 2.53 (.84)
7. Maintaining a healthy family life 2.33 (1.04)
8. Maintaining healthy working relationship with faculty and staff 2.16 (.98)
9. Other. Please specify
Table 17. Department Chair Perceived Stress

Iowa State University Department Chair 35
Difficulties based on Gender, Race, and Sexual Orientation
Using a three-point Likert scale, i.e. ‘Strongly Agree’ (3), ‘Not Sure’ (2), and ‘Strongly
Disagree’ (1), the department chairs were asked to rate their agreement to several statements
related to the difficulties that chairs may face due to gender, race, and sexual orientation. Table
18 summarized the difference between female and male chairs’ perceptions of the difficulty due
to gender, race, and social orientation.
Department
chairs
‘I feel that difficulties for
women who serve as
department chair are similar to
those for men who serve as
department chair’
‘I feel that difficulties for
race/ethnic minority group
members who serve as
department chair are similar to
those of non-minority persons
who serve as department chair’
‘I feel that difficulties for gays
and lesbians who serve as
department chair are similar to
those of heterosexual persons
who serve as department chair’
Mean (Standard Deviation) Mean (Standard Deviation) Mean (Standard Deviation)
Female 2 (.87) 2 (.50) 2 (.00)
Male 2.32 (.73) 2.29 (.68) 2.24 (.61)
Table 18. Department Chairs’ Perceptions on Difficulty due to Gender, Race, and Sexual Orientation
*Note:
1We have a long way to go with diversity concerns at ISU. But we're getting there, and that's why I
respect our institution's commitment.
2I read "similar" as "no different", and in this respect there clearly are differences. But overall the
challenges of the job are comparable for all these groups.
3These three questions are not asked in a way that speaks to the added challenge of being female,
minority, or gay/lesbian. Most challenges will indeed be the same, but there will also be new
challenges because of being in a minority
4Department Chair is an extremely difficult job for anyone. Department Chair duties require an
extreme time investment which takes time away from family. Overall, this may be more difficulty for
women to manage. There may be variation in levels of difficulty across disciplines, and some
correlation between this may have a positive association with the percentage of women who are
chairs in various disciplines.

Iowa State University Department Chair 36
The department chairs’ perception on difficulty due to gender, race, and sexual orientation are
presented in Figure 16, 17, and 18 respectively.
43%
36%
21%
Similar Difficulty between Women and Men
Strongly Agree
Not Sure
Strongly Disagree
Figure 16. Department Chairs’ Perceptions on Difficulty Due to Gender
5Statements may depend on the perceptions of various stakeholders within and outside of the
university. Difficulties may increase or decrease depending on the perceptions of stakeholders.
6I believe that women end up tending to the "emotional needs" of faculty, staff and students more
than men. People come to us with problems they would not present to men, because we are
perceived as motherly.
7Personally, I am gay, and in the College of Design there are absolutely no impediments to
diversity in my view.
8Since I am still on a steep learning curve to understand the position, it's hard to give a thoughtful
answer on this.
9I think it would be more difficult for these groups but I have no knowledge or data.

Iowa State University Department Chair 37
34%
52%
14%
Similar Difficulty between Minority and Non-Minority
Strongly Agree
Not Sure
25%
66%
9%
Similar Difficulty Between Homosexual and Heterosexual
Strongly Agree
Not Sure
Strongly Disagree
Figure 17. Department Chairs’ Perceptions on Difficulty Due to Race
Figure 18. Department Chairs’ Perceptions on Difficulty Due to Sexual Orientation

Iowa State University Department Chair 38
Department Chair Profiles and Analyses by Colleges
The next sections present the description and analyses of department chairs by colleges.
College of Agriculture
Within the college of Agriculture, the length of service before assuming the position of
department chair, length of service as department chair, and the total length of service at Iowa
State University varied. Although most of the department chairs have been serving for a number
of years at ISU before they were appointed as chairs (Table 19), four began their service at ISU
as department chairs.
2Department chair of Agricultural Economics is the same as the department chair of Economics in the
College of LAS
Departments
Length of
Service before
Adm appt.
(years)
Length of Service
as Dept. Chair
(years)
Total Length
of Service
Agricultural Education and Studies 29 3 32
Agronomy 18.5 6.5 25
Animal Science 0 9 9
Biochemistry/Biophysics/Molecular Biology 2 4 6
Entomology1 0 1 1
Food Science and Human Nutrition 0 8 8
Genetics, Development, and Cell Biology 13 1 14
Plant Pathology and Microbiology 9.5 6.5 16
Sociology 21 10 31
Agricultural Economics2 27 1 28
Agricultural and Biosystem Engineering 29 1 30
Ecology, Evolution, and Organismal Biology 17 9 26
Horticulture*
Natural Resource Ecology and Management1 0 1 1
Note:
*Department of Horticulture did not participate in the survey. 1Department chair of Natural Resource Ecology & Management and Entomology is the same person.
Table 19. Length of Service in the College of Agriculture

Iowa State University Department Chair 39
Four of the department chairs at the departments of Animal Science, Entomology, Food
Science & Human Nutrition, and Natural Resource Ecology & Management were externally
recruited as chairs, therefore, their length of service at ISU before administrative appointment is
zero (Figure 19).
29
18.5
0 2
0 0
13 9.5
21
27 29
17
0 0
5
10
15
20
25
30
35
Length of Service before Adm appt. (years)
Length of Service before Adm appt. (years)
Figure 19. Length of Service before administrative appointment at the College of Agriculture

Iowa State University Department Chair 40
As mentioned earlier, the length of service as department chairs in the College of
Agriculture is varied across different departments (Figure 20). Nearly half of the department
chairs in this college have been serving as chairs for more than six years. A similar trend was
also found in the 2005 analysis on department chairs (Figure 21).
3
6.5
9
4
1
8
1
6.5
10
1 1
9
1
0
2
4
6
8
10
12
Length of Service as Dept. Chair (years)
Length of Service as Dept. Chair (years)
5 6 6 5
3
5 5 4
3
10
4
9
5 4
0
2
4
6
8
10
12
Average Length of Service as Department Chair
Avg Length of Svc
as Dept Chair
Figure 20. Length of Service as Department Chairs at the College of Agriculture
Figure 21. Average Length of Service as Department Chairs at the College of Agriculture 1994-2005
(Adapted from: Trend Analysis on Department Chairs 1994-2005)

Iowa State University Department Chair 41
Most of the department chairs have served ISU as faculty members before they were
appointed as chairs. Figure 22 summarized the total length of service of each chair in the College
of Agriculture. Total length of service includes the service before assuming the position as chairs
to the present.
32
25
9 6
1
8
14 16
31 28
30 26
1
0
5
10
15
20
25
30
35
Total Length of Service
Total Length of Service
Figure 22. Total Length of Service at the College of Agriculture

Iowa State University Department Chair 42
Gender
Out of fourteen department chairs, only four are females (Table 20 and Figure 23).
Gender Number of dept. chair
Male 10
Female 4
Male
71%
Female
29%
College of Agriculture_Gender Distribution
Male
Female
Table 20. Department Chairs’ Gender Distribution at the College of Agriculture
Figure 23. Department Chairs’ Gender Distribution at the College of Agriculture

Iowa State University Department Chair 43
Ethnicity
The race/ethnicity profile of the department chairs is dominated by Caucasian (Table 21
and Figure 24).
Ethnicity Number of dept. chair
Caucasian* 13
African American 0
Native American 0
Hispanic 0
Asian 1
93%
0% 0% 0%
7%
College of Agriculture_Ethnicity
Caucasian
African American
Native American
Hispanic
Asian
Note: *Several of the department chairs serve at two different departments within the College of Agriculture and other
colleges
Table 21. Race/Ethnicity Profile at the College of Agriculture
Figure 24. Race/Ethnicity Profile at the College of Agriculture

Iowa State University Department Chair 44
College of Business
In the College of Business, most department chairs served as faculty at ISU for more than
20 years before assuming the position of chairs. As presented in Table 22 and Figure 25, in the
Accounting, Finance, Marketing, and Management departments, all chairs have been serving for
more than twenty years prior to their service as department chairs. In contrast, the chair of the
department of Supply Chain and Information System was externally recruited.
Departments
Length of Service
before Adm appt.
(years)
Length of
Service as Dept.
Chair (years)
Total Length of
Service
Accounting/Finance1 23.5 2.5 26
Supply Chain and Information Systems 0 3 3
Marketing/Management2 23 9 32
Table 22. Department Chairs’ Length of Service at the College of Business
Notes: 1Dept chair of Accounting and Finance departments is the same person
2Dept chair of Marketing and Management departments is the same person
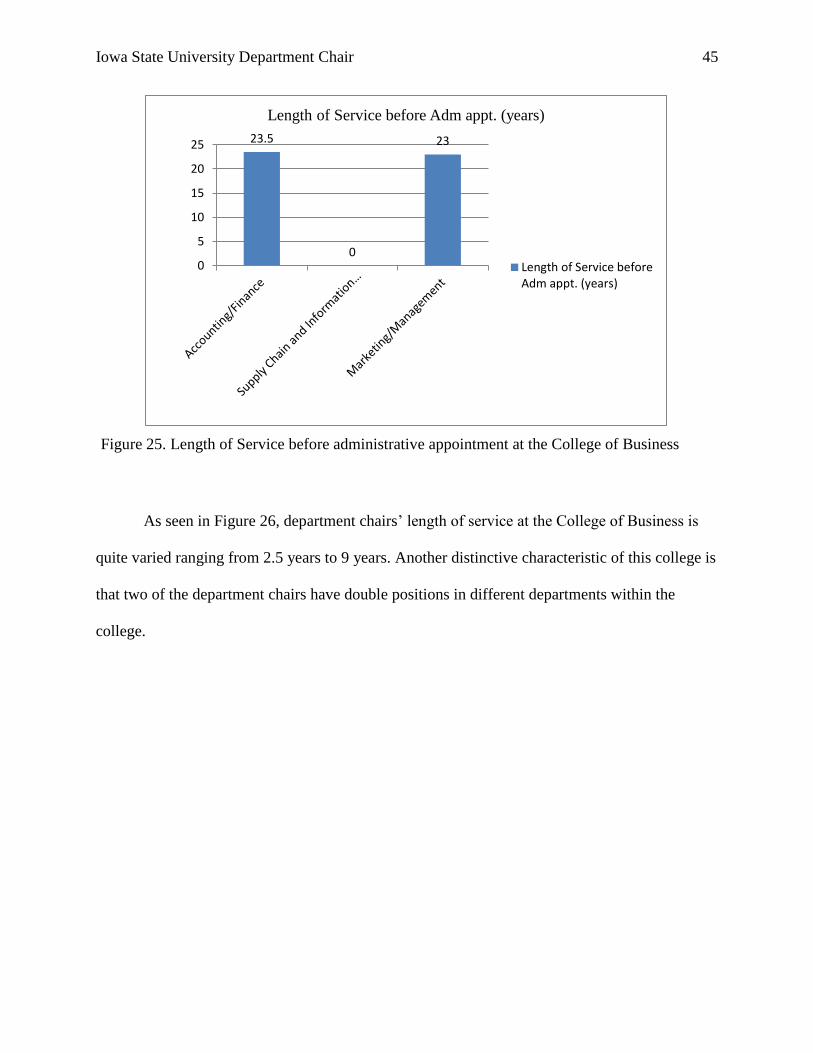
Iowa State University Department Chair 45
As seen in Figure 26, department chairs’ length of service at the College of Business is
quite varied ranging from 2.5 years to 9 years. Another distinctive characteristic of this college is
that two of the department chairs have double positions in different departments within the
college.
23.5
0
23
0
5
10
15
20
25
Length of Service before Adm appt. (years)
Length of Service beforeAdm appt. (years)
Figure 25. Length of Service before administrative appointment at the College of Business

Iowa State University Department Chair 46
26
3
32
0
5
10
15
20
25
30
35
Accounting/Finance Supply Chain and
Information Systems
Marketing/Management
Total Length of Service
Total Length of Service
2.5 3
9
0
2
4
6
8
10
Length of Service as Dept. Chair (years)
Length of Service as Dept.
Chair (years)
Figure 26. Length of Service as department chairs at the College of Business
Figure 27. Total Length of Service at ISU (College of Business)

Iowa State University Department Chair 47
Gender
As shown in Table 23 and Figure 28, none of the department chairs in the College of
Business is female. The absence of females as chairs in this college is parallel to the 1994-2005
longitudinal data. In the previous study, there were five departments that continually, from 1994
up to 2005, were chaired by males. In 2012 with the same number of departments, there is a
similar pattern of chairs that have two positions at two different departments, i.e. Accounting and
Finance departments are chaired by one person; likewise, Marketing and Management
departments are chaired by one person. Yet, none of the department chairs is female.
Gender Number of dept. chair
Male 5
Female 0
100%
0%
College of Business_Gender Disparity
Male
Female
Figure 28. Department Chairs’ Gender Distribution at the College of Business
Table 23. Department Chairs’ Gender Distribution at the College of Business

Iowa State University Department Chair 48
Ethnicity
Unlike most colleges at ISU, the majority of chairs are not Caucasian. Two of the chairs
are Asian (Table 24 and Figure 29).
Race/Ethnicity Number of dept. chair
Caucasian 1
African American 0
Native American 0
Hispanic 0
Asian 2
33%
0%
0% 0%
67%
College of Business_Ethnicity
Caucasian
African American
Native American
Hispanic
Asian
Table 24. Department Chairs’ Race/Ethnicity at the College of Business
Figure 29. Department Chairs’ Race/Ethnicity at the College of Business

Iowa State University Department Chair 49
College of Design
In the College of Design, half of the department chairs have been serving at ISU for more
than 10 years prior to their administrative appointment (Table 25 and Figure 30). This pattern is
similar to the finding in the previous 2005 study in which most of the chairs had served at ISU
for more than 10 years before assuming the department chair position (Figure 31).
Departments
Length of
Service
before
Adm appt.
(years)
Length of
Service as
Dept.
Chair
(years)
Total
Length of
Service
(years)
Architecture 17.5 2 19.5
Graphic Design 10 2 12
Interior Design 0 3 3
Landscape Architecture/Community and Regional Planning 0 5 5
Integrated Studio Art*
Note: Department chair of Landscape Architecture and Community and Regional Planning is the same person.
Department chair of Integrated Studio Art did not take the survey.
17.5
10
0 0 02468
101214161820
Length of Service before Adm appt. (years)
Length of Service before Adm appt. (years)
Figure 30. Length of Service before Adm. Appointment in the College of Design
Table 25. Department Chairs’ Length of Service in the College of Design

Iowa State University Department Chair 50
0
2
4
6
8
10
12
14
16
Architecture Art & Design Comm &RegionalPlanning
Landscape Arc
14 15
11
0
Average Length of Service before Administrative Appointment
ArchitectureGraphic
Design
Interior
Design
Landscape
Architecture/
Community
and Regional
Planning
Length of Service as Dept. Chair
(years)2 2 3 5
2 2
3
5
0
1
2
3
4
5
6
ye
ars
Length of Service as Dept. Chair (years)
Figure 31. Average Length of Service before Adm. Appointment in the College of Design 1994-2005
Figure 32. Length of Service as Department Chairs in the College of Design

Iowa State University Department Chair 51
19.5
12
3 5
0
5
10
15
20
25
Total Length of Service (years) in 2012
Total Length of Service (years)
Another interesting finding is that the length of service as department chair is almost
similar to the 2005 data. As can be seen in Figure 32, the length of service of department chairs
in 2012 varied from 2 to 5 years, whereas in 1994-2005, the average length of service of the
department chairs ranged from 2 to 11 years (Figure 33).
2
5 5
11
0
2
4
6
8
10
12
Architecture Art & Design Comm & RegionalPlanning
Landscape Arc
Average Term & Average Length of Service as Department Chair 1994-2005
Avg Term
Avg Length ofSvcas Dept Chair
Figure 33. Average Length of Service as Department Chairs in the College of Design 1994-2005
Figure 34. Total Length of Service in 2012 as Department Chairs in the College of Design

Iowa State University Department Chair 52
Gender
There is almost an equal number of male and female department chairs in the College of
Design. As presented in Table 26 and Figure 35, there are 3 males (60%) and 2 (40%) females
assuming the position of department chairs (Table 15 and Figure 35).
Gender Number of department chair
Male 3
Female 2
60%
40%
College of Design_Gender Distribution
Male
Female
Table 26. Gender Distribution in the College of Design
Figure 35. Gender Distribution in the College of Design

Iowa State University Department Chair 53
Ethnicity
All five department chairs at the College of Design are Caucasians, as presented in Table
27 and Figure 36.
Ethnicity Number of Dept. Chair
Caucasian 5
African American 0
Native American 0
Hispanic 0
Asian 0
100%
0% 0%
College of Design_Ethnicity
Caucasian
African American
Native American
Hispanic
Asian
Table 27. Race/Ethnicity Profile in the College of Design
Figure 36. Race/Ethnicity Profile in the College of Design

Iowa State University Department Chair 54
0
29
12
26
0 0
9
05
101520253035
Length of Service before Adm appt. (years)
Length of Service before Adm appt. (years)
College of Engineering
There is great variability (0- 29 years) with respect to the length of service at ISU prior to
administrative appointment in the College of Engineering (Table 28 and Figure 37).
Departments
Length of
Service before
Adm appt.
(years)
Length of
Service as
Dept. Chair
(years)
Total
length of
Service
(years)
Aerospace Engineering 0 2 2
Agricultural & Biosystems Engineering 29 1 30
Chemical & Biological Engineering 12 3 15
Civil, Construction and Environmental
Engineering 26 1 27
Industrial and Manufacturing Systems
Engineering 0 0.75 0.75
Materials Science and Engineering 0 6 6
Mechanical Engineering 9 3 12
Electrical and Computer Engineering*
Table 28. Length of Service at College of Engineering
Figure 37. Length of Service before Administrative Appointment at College of Engineering
Note:
*Department of Electrical and Computer Engineering did not participate in the survey.

Iowa State University Department Chair 55
2
30
15
27
0.75
6
12
0
5
10
15
20
25
30
35
Aerospace
Engineering
Agricultural &
Biosystems
Engineering
Chemical &
Biological
Engineering
Civil,
Construction
and
Environmental
Engineering
Industrial and
Manufacturing
Systems
Engineering
Materials
Science and
Engineering
Mechanical
Engineering
Total Length of Service (years)
Total length of Service (years)
2
1
3
1 0.75
6
3
0
1
2
3
4
5
6
7
Aerospace
Engineering
Agricultural &
Biosystems
Engineering
Chemical &
Biological
Engineering
Civil,
Construction
and
Environmental
Engineering
Industrial and
Manufacturing
Systems
Engineering
Materials
Science and
Engineering
Mechanical
Engineering
Length of Service as Dept. Chair (years)
Length of Service as Dept. Chair (years)
Figure 38. Length of Service as Department Chairs at College of Engineering
Figure 39. Total Length of Service at the College of Engineering

Iowa State University Department Chair 56
Gender
In the College of Engineering the gender distribution among female and male department
chairs remains unequal, with two females (25%) and six males (75%) (Table 29 and Figure 40)
but represents an improvement over the previous 8% of women chairs during the years of 1994-
2005 (Figure 41).
Gender Number of Department Chairs
Male 6
Female 2
75%
25%
College of Engineering_Gender Distribution
Male
Female
Table 29. Department Chair Gender Distribution in the College of Engineering
Figure 40. Department Chair Gender Distribution in the College of Engineering

Iowa State University Department Chair 57
92%
8%
College of Engineering_Gender Distribution 1994-2005
Male
Female
Figure 41. Department Chair Gender Distribution in the College of Engineering 1994-2005

Iowa State University Department Chair 58
Ethnicity
Seven departments in the College of Engineering are chaired by those of Caucasian
background and one department is chaired by an Asian (Table 30 and Figure 42). This
distribution is consistent with the 1994 to 2005 trend analysis. According to the previous report,
in 2000, however, the distribution of the different races was a bit more diverse with one person
of African-American who assumed the position as a chair.
Race/Ethnicity Number of dept. chair
Caucasian 7
African American 0
Native American 0
Hispanic 0
Asian 1
87%
0% 0%
0%
13%
College of Engineering_Ethnicity
Caucasian
African American
Native American
Hispanic
Asian
Table 30. Department Chairs’ Race/Ethnicity Background in the College of Engineering
Figure 42. Department Chair Race/Ethnicity Profile in the College of Engineering

Iowa State University Department Chair 59
College of Human Sciences
College of Human Sciences is relatively new to Iowa State University. Founded in 2005,
the college is the result of a merger of the former College of Education and the College of
Family and Consumer Sciences. The department chairs’ length of service at ISU before their
administrative appointment in the College of Human Sciences varied; from zero up to twenty
years of service (Table 31 and Figure 35).
Departments
Length of Service
before Adm appt.
(years)
Length of
Service as
Dept. Chair
(years)
Total
length of
service
(years)
Curriculum and Instruction 3 5 8
Educational Leadership and Policy Studies 20 5 25
Human Development and Family Studies 0 2 2
Kinesiology 0 4 4
Food Science and Human Nutrition1 0 8 8
Apparel, Educational Studies, and
Hospitality Management*
Note:
1Food Science and Human Nutrition belongs to 2 colleges, i.e. Agriculture and Human Sciences.
*Department chair of Apparel, Educational Studies, and Hospitality Management did not participate in the
survey.
Table 31. Length of Service at the College of Human Sciences

Iowa State University Department Chair 60
The length of service of department chairs ranged from two to 8 years (Figure 44). Three
out of six chairs at this college were externally recruited and therefore, the total length of their
service started when they assumed the department chair position (Figure 45).
Curriculum
and
Instruction
Educational
Leadership
and Policy
Studies
Human
Development
and Family
Studies
Kinesiology
Food Science
and Human
Nutrition
Length of Service before Adm appt.
(years)3 20 0 0 0
3
20
0 0 0 0
5
10
15
20
25y
ears
Length of Service before Adm appt. (years)
Figure 43. Department Chairs’ Length of Service before Administrative Appointment at the
College of Human Sciences

Iowa State University Department Chair 61
Curriculum
and
Instruction
Educational
Leadership
and Policy
Studies
Human
Developme
nt and
Family
Studies
Kinesiology
Food
Science and
Human
Nutrition
Total length of service (years) 8 25 2 4 8
8
25
2
4
8
0
5
10
15
20
25
30
yea
rs
Total length of service (years)
Curriculum
and
Instruction
Educational
Leadership
and Policy
Studies
Human
Developme
nt and
Family
Studies
Kinesiology
Food
Science and
Human
Nutrition
Length of Service as Dept. Chair
(years)5 5 2 4 8
5 5
2
4
8
0
5
10y
ears
Length of Service as Dept. Chair (years)
Figure 44. Length of Service as Department Chairs at the College of Human Sciences
Figure 45. Department Chairs’ Total Length of Service as at the College of Human Sciences

Iowa State University Department Chair 62
Gender
Out of six departments, two of the department chairs are females (Table 32 and Figure
46).
Gender Number of Department Chair
Male 4
Female 2
67%
33%
College of Human Sciences_Gender
Male
Female
Table 32. Department Chairs’ Gender Distribution at the College of Human Sciences
Figure 46. Department Chairs’ Gender Distribution at the College of Human Sciences

Iowa State University Department Chair 63
Race/Ethnicity
Four of the chairs in the College of Human Science are Caucasians, one is African-
American, and one is Asian (Table 33 and Figure 47).
Race/Ethnicity Number of Dept. Chair
Caucasian 4
African American 1
Native American 0
Hispanic 0
Asian 1
67%
16%
0%
0% 17%
College of Human Sciences_Ethnicity
Caucasian
African American
Native American
Hispanic
Asian
Table 33. Department Chairs’ Race/Ethnicity Background at the College of Human Sciences
Figure 47. Department Chairs’ Race/Ethnicity Background at the College of Human Sciences

Iowa State University Department Chair 64
College of Liberal Arts and Sciences
At the College of Liberal Arts and Sciences 14 out of 18 department chairs who filled out
the survey stated that they have served at ISU for more than 10 years. One has served for 6 years,
another Chair served for 2 years. Further, there are two of the chairs who were externally
recruited, thus, their length of service before the administrative appointment is zero (Table 34
and Figure 40).
Departments
Length of
Service before
Adm appt.
(years)
Length of
Service as
Dept. Chair
(years)
Total
length
of
service
(years)
1. Chemistry 18 1 19
2. Ecology, Evolution & Organismal Biology 17 9 26
3. Economics 27 1 28
4. English 0 2 2
5. Geological and Atmospheric Sciences 14 1 15
6. Greenlee School of Journalism and Communication 0 9 9
7. History 10 2 12
8. Mathematics 25 4 29
9. Music and Theatre 6 7 13
10. Philosophy and Religious Studies 10 3 13
11. Political Science 24 13 37
12. Psychology 16 3 19
13. Statistics 24 10 34
14. World Languages and Culture 21 4 25
15. Anthropology1 21 10 31
16. Biochemistry, Biophysics, and Molecular Biology2 2 4 6
17. Computer Science*
18. Genetics, Development, and Cell Biology3 13 1 14
19. Physics and Astronomy*
20. Sociology1, 4
21 10 31
Table 34. Department Chairs’ Length of Service at the College of Human Sciences

Iowa State University Department Chair 65
Notes:
*Two departments, i.e. Computer Science and Physics &Astronomy did not participate in the survey.
1The department chair of Anthropology is the same as Sociology, and the respondent categorized himself into
College of Agriculture.
2The department of Biochemistry, Biophysics, and Molecular biology is within two different colleges, i.e. Agriculture
and LAS.
3The department of Genetics, Development, and Cell Biology is categorized under 2 different colleges: Agriculture
and LAS.
4The department of Sociology belongs under 2 different colleges: Agriculture and LAS.
In the College of Liberal Arts and Sciences, the length of service of department chairs
prior to assuming the position as chairs varied widely. As shown in Figure 48, two of the chairs
were externally recruited, and thus, have zero years of service at ISU before becoming a
department chair. Nine have been serving ISU from 2 to 18 years before becoming a chair;
while, seven of the department chairs have been serving for more than 20 years before
undertaking the administrative role.

Iowa State University Department Chair 66
A similar variation of the length of service at ISU prior to the administrative appointment
was also found in 1994-2005 trend analysis (Figure 49).
18 17
27
0
14
0
10
25
6
10
24
16
24
21 21
2
13
21
0
5
10
15
20
25
30
Length of Service before Adm appt. (years)
Length of Service before Adm appt. (years)
Figure 48. Department Chairs’ Length of Service before Administrative Appointment
at the College of Liberal Arts and Sciences

Iowa State University Department Chair 67
The department chairs’ length of service in the College of Liberal Arts and Sciences, as
described in Figure 50, is varied from 1 to 13 years. Parallel to the 2012 data, in 1994-2005, the
average length of service of the chairs was also widespread from 3 to 14 years (Figure 51).
0
5
10
15
20
25
30
22
15 15 11
19
6
20 15
9
21
5
27
15 11
17 22
12 8
28
20
Average Length of Service before Administrative Appointment 1994-2005
Figure 49. Department Chairs’ Length of Service before Administrative Appointment at the College
of Liberal Arts and Sciences 1994-2005

Iowa State University Department Chair 68
1
9
1 2
1
9
2
4
7
3
13
3
10
4
10
4
1
10
0
2
4
6
8
10
12
14
Length of Service as Dept. Chair (years)
Length of Service as Dept. Chair (years)
7 5 4 5 5 5 4 5
10
5 4
7
4
14
5 3 5 4 4
10
02468
10121416
Average Term & Average Length of Service as Department Chair
Avg Term
Avg Length ofSvcas Dept Chair
Figure 50. Length of Service as Department Chairs at the College of Liberal Arts and Sciences
Figure 51. Length of Service as Department Chairs at the College of Liberal Arts and Sciences 1994-2005

Iowa State University Department Chair 69
Similarly, the total length of service before assuming the administrative position and
during the appointment as department chairs, ranged from 2 to 37 years. One of the chairs has
served for a total of 2 years, while nine of the chairs have been serving from 6 to 19 years. Seven
department chairs have been serving at ISU for more than 25 years (Figure 52).
19
26 28
2
15
9 12
29
13 13
37
19
34
25
31
6
14
31
0
5
10
15
20
25
30
35
40
Total length of service (years)
Total length of service (years)
Figure 52. Department Chairs’ Total Length of Service at the College of Liberal Arts and Sciences

Iowa State University Department Chair 70
Gender
In the College of Liberal Arts and Sciences 4 out of the 20 departments are chaired by
women (Table 35 and Figure 53).
Gender Number of Dept. Chair
Male 16
Female 4
80%
20%
College of Liberal Arts and Sciences
Male
Female
Table 35. Department Chairs’ Gender Distribution at the College of Liberal Arts and Sciences
Figure 53. Department Chairs’ Gender Distribution at the College of Liberal Arts and Sciences

Iowa State University Department Chair 71
Race/Ethnicity
Like most of the departments in other colleges, the department chairs are dominated by
Caucasians (Table 36 and Figure 54).
Race/Ethnicity Number of Dept. Chair
Caucasian 18
African American 0
Native American 0
Hispanic 0
Asian 2
90%
0%
0% 0%
10%
College of Liberal Arts and Sciences
Caucasian
African American
Native American
Hispanic
Asian
Table 36. Department Chairs’ Race/Ethnicity Distribution at the College of Liberal Arts and Sciences
Figure 54. Department Chairs’ Race/Ethnicity Distribution at the College of Liberal Arts and Sciences

Iowa State University Department Chair 72
College of Veterinary Medicine
In the College of Veterinary Medicine, nearly all of the department chairs have been
serving at ISU for more than eight years prior to their administrative appointment (Table 37 and
Figure 47). Among five chairs only one of them was externally recruited.
An interesting finding is that in the 1994-2005 trend analysis, the average length of
service of the department chair of Veterinary and Clinical Science was one year (Figure 56). The
situation in 2012 is presented in Figure 55.
Departments
Length of
Service before
Adm Appt.
(years)
Length of
Service as
Dept. Chair
(years)
Total
Length of
Service
Biomedical Science 9 4 13
Veterinary Microbiology & Preventive Medicine 25 3 28
Veterinary Clinical Sciences 0 3 3
Veterinary Diagnostic & Production Animal
Medicine 11 6 17
Veterinary Pathology 25 1 26
9
25
0
11
25
0
5
10
15
20
25
30
Biomedical
Science
Veterinary
Microbiology
& Preventive
Medicine
Veterinary
Clinical
Sciences
Veterinary
Diagnostic &
Production
Animal
Medicine
Veterinary
Pathology
Length of Service before Adm appt. (years)
Length of Service before Adm appt. (years)
Table 37. Department Chairs’ Length of Service at the College of Veterinary Medicine
Figure 55. Department Chairs’ Length of Service before Administrative Appointment at
the College of Veterinary Medicine
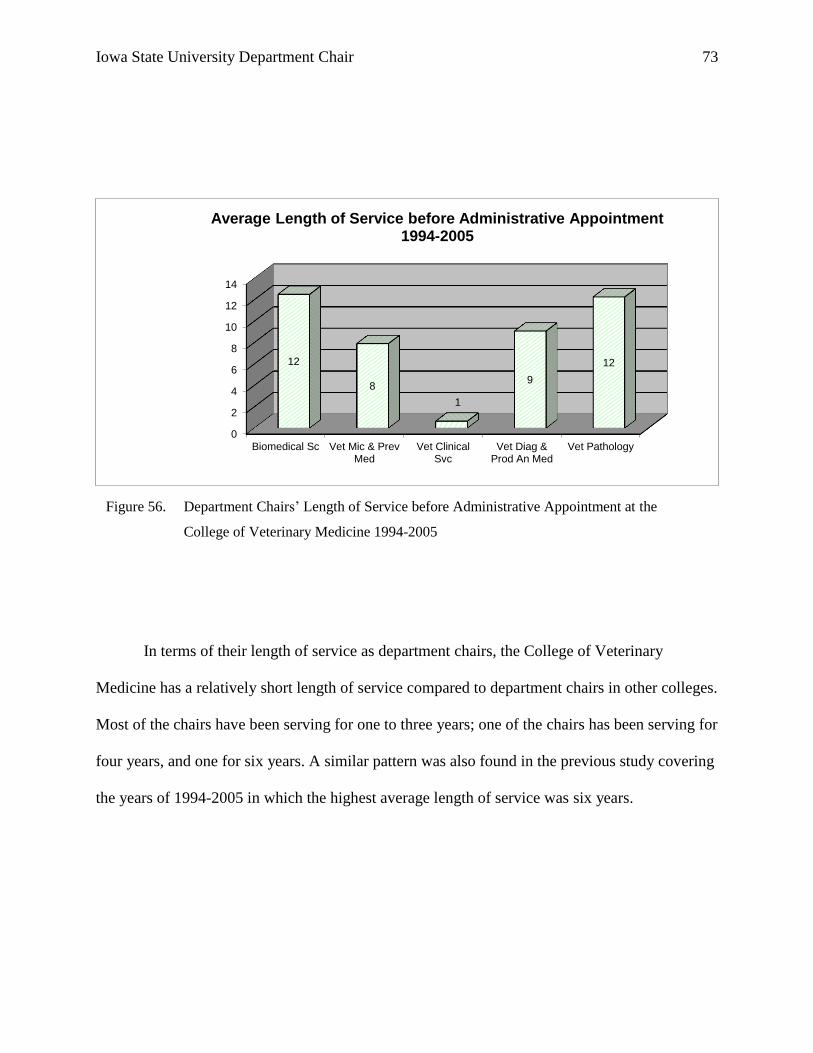
Iowa State University Department Chair 73
In terms of their length of service as department chairs, the College of Veterinary
Medicine has a relatively short length of service compared to department chairs in other colleges.
Most of the chairs have been serving for one to three years; one of the chairs has been serving for
four years, and one for six years. A similar pattern was also found in the previous study covering
the years of 1994-2005 in which the highest average length of service was six years.
0
2
4
6
8
10
12
14
Biomedical Sc Vet Mic & PrevMed
Vet ClinicalSvc
Vet Diag &Prod An Med
Vet Pathology
12
8
1
9
12
Average Length of Service before Administrative Appointment 1994-2005
Figure 56. Department Chairs’ Length of Service before Administrative Appointment at the
College of Veterinary Medicine 1994-2005

Iowa State University Department Chair 74
4
3 3
6
1
0
5
10
Biomedical
Science
Veterinary
Microbiology
& Preventive
Medicine
Veterinary
Clinical
Sciences
Veterinary
Diagnostic &
Production
Animal
Medicine
Veterinary
Pathology
Length of Service as Dept. Chair (years)
Length of Service as Dept. Chair (years)
6
3 3
2
3
0
1
2
3
4
5
6
BiomedicalSc
Vet Mic &Prev Med
Vet ClinicalSvc
Vet Diag &Prod An Med
Vet Pathology
Average Term & Average Length of Service as Department Chair
Avg Term
Avg Length ofSvcas Dept Chair
Figure 57. Length of Service as Department Chairs’ at the College of Veterinary Medicine
Figure 58. Length of Service as Department Chairs at the College of Veterinary Medicine 1994-2005

Iowa State University Department Chair 75
As for the total length of service of the department chairs, all chairs except the chair of
Veterinary Clinical Science department, have been serving for more than ten years, the range
slightly varied from 13 to 28 years (Figure 59).
13
28
3
17
26
0
5
10
15
20
25
30
Biomedical
Science
Veterinary
Microbiology
& Preventive
Medicine
Veterinary
Clinical
Sciences
Veterinary
Diagnostic &
Production
Animal
Medicine
Veterinary
Pathology
Total Length of Service
Total Length of Service
Figure 59. Department Chairs’ Total Length of Service at the College of Veterinary Medicine

Iowa State University Department Chair 76
Gender
In contrast to the majority of the student population in the College of Veterinary
Medicine who are mostly females, none of the department chairs is female (Table 38 and Figure
60).
Gender Number of dept. chair
Male 5
Female 0
100%
0%
College of Veterinary Medicine
Male
Female
Table 38. Department Chairs’ Gender Distribution at the College of Veterinary Medicine
Figure 60. Department Chairs’ Gender Distribution at the College of Veterinary Medicine

Iowa State University Department Chair 77
Ethnicity
One chair is of Asian ethnicity and four are Caucasian (Table 39 and Figure 61).
Compared to the period of 1994-2005, where there were four African American and 15
Caucasians.
Race/Ethnicity Number of dept. chair
Caucasian 4
African American 0
Native American 0
Hispanic 0
Asian 1
80%
0%
0% 0% 20%
College of Veterinary Medicine
Caucasian
African American
Native American
Hispanic
Asian
Table 39. Department Chairs’ Race/Ethnicity in the College of Veterinary Medicine
Figure 61. Department Chairs’ Race/Ethnicity in the College of Veterinary Medicine

Iowa State University Department Chair 78
Conclusions and Recommendations
This section presents findings that may lead to further discussion and policy
determinations on the topic of the ISU department chair.
Research question 1: How are chairs appointed? What are the different patterns of appointment
at ISU?
The appointment of chairs at ISU varies from college to college; sometimes the
appointment is internal and other times it is the result of a national search. There is no university
pattern.
In terms of the pay base, appointments of department chair who are faculty members are
divided into two categories; A-base and B-base (Office of the Executive President and Provost,
Iowa State University, n.d.). A-base appointments are reserved for administrative positions and
for persons whose responsibilities require year-round service. Faculty members on B-base are on
duty during the academic year, and they receive no paid vacation. Again, there is no university
policy on whether chairs should be A- or B-based. We found that ISU department chairs’ pay
base varied across and within colleges. For example, within one college 60% of the chairs are 12
months or A-base and 40% are 9 months or B-base, while in others there is only either A-base or
B-base. Sometimes a chair’s salary may be supplemented with an administrative stipend. The
amount of the stipend is also not uniform.
The selection of department chair often is influenced by input to the Dean from the
faculty. The majority of the chairs (84.6%) stated that tenured faculty provided input to the
Dean with respect to the selection of the department chair.
Another finding to note is that the term of appointment of the department chairs varied
across the colleges, ranging from 1 year up to 5 years.
Iowa State University Department Chair 79
Typically, most of the chairs have been serving at ISU for a number of years prior to
assuming their administrative positions. However, there are cases in which the chairs are
externally recruited (recruited from outside ISU), and thus, their length of service before
becoming chair was zero.
Research question 2: How are chairs evaluated?
In answering the second research question on chairs evaluation, this study found the
majority of the chairs agreed that their evaluation is based on clear performance expectations;
however, there were two chairs who strongly disagreed. It is important to note that there are no
university level expectations; all expectations are college level. Over 80% of the department
chairs stated that performance expectations were provided to them either verbally or in writing
prior to assuming the administrative position. In addition, some colleges have rubrics for
evaluating department chairs, but some did not.
The chairs responded positively regarding their perceived support from their Dean. The
majority of the respondents agreed that their Dean is supportive and also has confidence in their
leadership skill. The chairs also agreed that the faculty trust and have confidence in them.
Based on our interview with Deans across colleges, we found that there is no definitive
mentor assigned to new department chairs. They typically get guidance from the Dean. Some
new chairs will take it upon themselves find another more experienced chair to be their mentor.
While ISU does provide some training for chairs, there is no formal mentoring program.
Research question 3: What is the most stressful duty according to the chairs?
One of the key findings worth noting is the identification of duties perceived by the
chairs as the most stressful. Gaining financial support for department programs was recognized
by the chairs to be the most stressful task. The second most stressful task was fulfilling their high
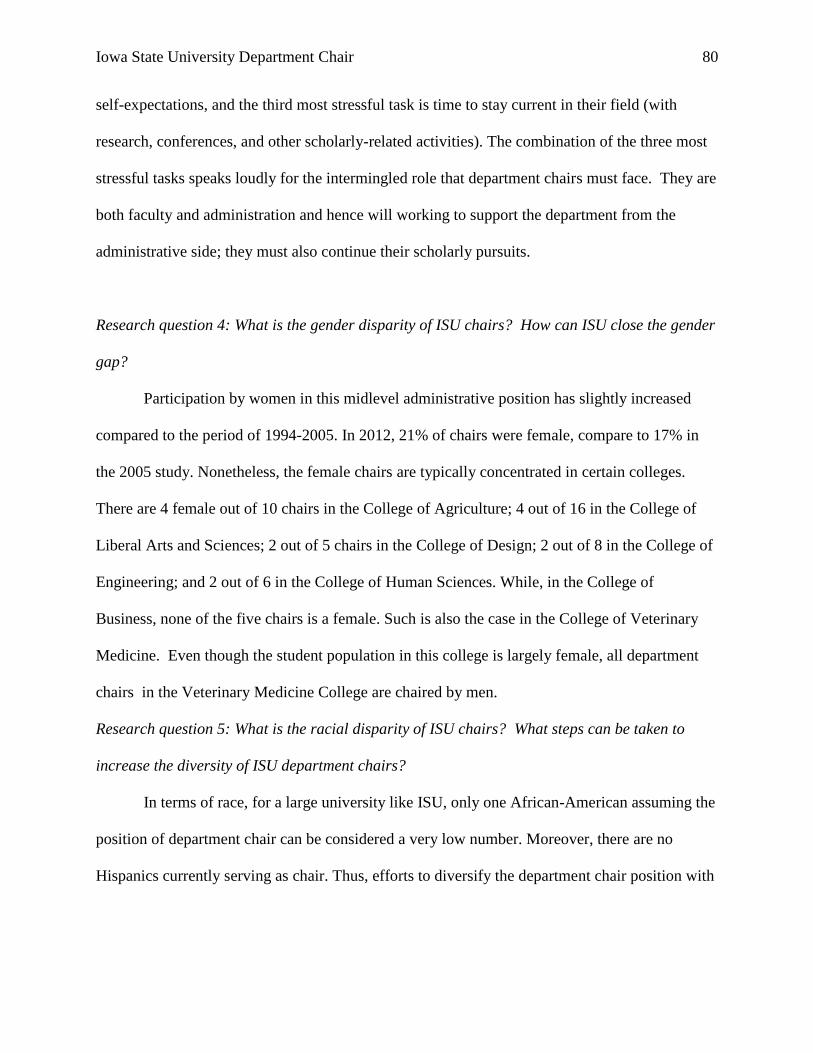
Iowa State University Department Chair 80
self-expectations, and the third most stressful task is time to stay current in their field (with
research, conferences, and other scholarly-related activities). The combination of the three most
stressful tasks speaks loudly for the intermingled role that department chairs must face. They are
both faculty and administration and hence will working to support the department from the
administrative side; they must also continue their scholarly pursuits.
Research question 4: What is the gender disparity of ISU chairs? How can ISU close the gender
gap?
Participation by women in this midlevel administrative position has slightly increased
compared to the period of 1994-2005. In 2012, 21% of chairs were female, compare to 17% in
the 2005 study. Nonetheless, the female chairs are typically concentrated in certain colleges.
There are 4 female out of 10 chairs in the College of Agriculture; 4 out of 16 in the College of
Liberal Arts and Sciences; 2 out of 5 chairs in the College of Design; 2 out of 8 in the College of
Engineering; and 2 out of 6 in the College of Human Sciences. While, in the College of
Business, none of the five chairs is a female. Such is also the case in the College of Veterinary
Medicine. Even though the student population in this college is largely female, all department
chairs in the Veterinary Medicine College are chaired by men.
Research question 5: What is the racial disparity of ISU chairs? What steps can be taken to
increase the diversity of ISU department chairs?
In terms of race, for a large university like ISU, only one African-American assuming the
position of department chair can be considered a very low number. Moreover, there are no
Hispanics currently serving as chair. Thus, efforts to diversify the department chair position with

Iowa State University Department Chair 81
respect to race are highly warranted. The university may want to consider identifying faculty of
color who may be future chairs and provide leadership or other training.
Research question 6: How do chairs perceive social identities (gender, race, and sexual
orientation) with respect to the difficulties in performing their role as chairs?
Another finding to be highlighted is the question on difficulties that the chairs face due to
gender, race, and sexual orientation. Most chairs are unsure whether or not their biological or
social identities affect the difficulties chairs may face. However, it is worth noting that the
respondents’ answers were somewhat related to their own social identities. Our findings provide
evidence that male chairs are less likely to perceive female chairs having difficulty based on
gender. Likewise, for an item that asked the respondents to rate whether they feel that difficulties
for gays and lesbians who serve as department chair are similar to those for heterosexual persons
who serve as chair, the respondents were more likely to not sure. Indeed, it was reflected by the
66% of the chairs who chose the ‘Not Sure’ option. This item provides room for the respondents
to give comments on how social identities, i.e. gender, race, and sexual orientation might cause
different difficulties in their role as chair.
As discussed in literature on department chairs, time management can be challenging due
to the many roles and responsibilities that a chair must balance. The majority of the chairs agreed
that evaluating faculty performance is their most time-consuming single activity. The second
most time-consuming activity is managing department resources (finances, facilities, equipment,
and space). The third most time-consuming activity is advocating for departmental interests to
higher authorities. Conversely, the activity that demands the least of the chairs’ time is
representing the department at professional meetings. Perhaps it may be noted that there will be
periods within the academic year that may be especially taxing with respect to time.

Iowa State University Department Chair 82
Research question 7: What are policy recommendations for the university?
Findings of the current study have prompted reflective questions as the foundation for
policy recommendations for Iowa State University. In regard to understand the role of ISU
department chair and to improve support for the chairs, we propose the following questions as
well as recommendations:
1. Pay base of ISU department chairs is not uniformed across colleges; should the pay-base
be standardized, either using A-base (12 months) or B-base (9 months)?
2. The average compensation of the chairs is varied widely; there is a wide span between
the average of the lowest and the highest compensations between different colleges. What
criteria to determine the salary and what is the appropriate level of compensation? How
can market disciplinary differences be understood within a profession that is
administrative and similar regardless of discipline. How should the size of the
department factor into chair compensation?
3. How can ISU better accommodate diversity with respect to the department chair? Issues
of length of service at ISU, length of tenure at ISU, level of seniority, age, gender, and
race/ethnicity all have an effect on securing a diverse chair pool.
4. What are the criteria to select chair, should there be standardized criteria or qualification
to recruit a department chair?
5. Some of the colleges do not have specific criteria or rubrics used to evaluate chair. Apart
from fulfilling duties according to the PRS (Position Responsibilities Statement) that
determines the percentage of teaching, research, and service; the department chair has a
number of administrative duties on which the chair should be evaluated. Should there be
a uniform rubric of expectations?

Iowa State University Department Chair 83
6. The findings of this study indicated that nearly half of the chairs stated that the evaluation
on chairs is not based on clear expectations. If the university expects chairs to improve
their departments and to effectively manage the departments, then, chairs need to know
what the expectations are. By doing so, chair would be able to measure how much he/she
has achieved and what he/she still needs to improve.
7. ISU may consider more intentional training of new chairs. This may be accomplished
through more national leadership workshops or other training.
8. As a midlevel administrator, chairs have to deal with arduous paperwork taking a great
portion of their time. ISU may consider ways to alleviate the book-keeping and similar
types of activities. In some departments, perhaps the consideration of an assistant- or
associate-chair
9. The complexities of chairs’ duties should be balanced with a higher level of authority.
Oftentimes, chairs are required to fulfill high level responsibilities, but the authority or
administrative “power” they have may not be sufficiently matched.
10. At times those who have proven their ability in leading the department may not be
interested in continuing their service as chair. The University can encourage productive
chairs by providing larger tangible and intangible rewards when inviting those chairs to
continue serving. Moreover, chairs are likely to be in the best position to identify the
next generation of department chairs.
11. Department chairs who are internally recruited have to undergo the transition from being
a part of faculty, into overseeing the faculty. In other words, transforming from their role
as colleague to supervisor. The university may consider how it can help to smooth the

Iowa State University Department Chair 84
change of the nature of interaction with faculty during their term as chair and after the
term ends?
12. “A good researcher is not always a good chair, and vice versa” (Dean, anonymous). That
statement was quoted from one of our interviews with ISU Deans. The PRS requires
chairs who are faculty members, to fulfill their teaching and research duties.
Consequently, oftentimes chairs are still evaluated on teaching and research
responsibilities; while in fact, they have little time left to do research and teaching.
Therefore, university might need to revisit the policy related to the teaching and research
expectations of department chairs.
13. In order to improve the department’s performance, chairs need to have a chance to create
innovative ideas. With the already hectic chairs’ schedule the university may consider
ways to support chairs to develop their creativity, both scholarly and managerially.
14. Undoubtedly, the job of a chair is highly complex. The university may consider clearly
stating the priority for chairs, whether it is their scholarship, teaching, or leading the
department. By doing so, department chairs may benefit from the increased direction on
how to prioritize their works.
We conclude with a quotation that sums up the job of department chair. “Where else in
institutions of higher education do we hire an individual without appropriate previous experience
and expect him or her to tackle admittedly difficult and complex responsibilities without benefit
of relevant training (Hecht, et al 1999, pg. 7). Considering the complexities and the high stakes
involved in the position, ISU is indeed fortunate to have a dedicated and productive team of

Iowa State University Department Chair 85
department chairs. It is hoped that this report provides some university guidance to continue the
fine service of its chairs as well as direction to make the university more chair-friendly.

Iowa State University Department Chair 86
References
Carroll, J. B. & Wolverton, M. (2004). Who becomes a chair? New Directions for Higher
Education, 126, 3-10.
Creswell, J. W. (2003). Research design: Qualitative, quantitative, and mixed-methods
approaches. Thousand Oaks, CA: Sage Publication.
Creswell, J. W. (2007). Qualitative inquiry and research design: Choosing among five
approaches. Thousand Oaks, CA: Sage Publication.
Denzin, N.K. (1989). The research act: A theoretical introduction to sociological methods.
Englewood Cliffs, N.J: Prentice Hall.
Gmelch, W. H. & Miskin, D. (1993). Understanding the challenges of department chairs:
Leadership Skills for Department Chairs, Bolton, MA: Anker.
Hecht, I. W. D., Higgerson, M. L., Gmelch, W. H., & Tucker, A. (1999). The department chair
as academic leader. Phoenix, AZ: Oryx Press.
Iowa State University. (2005). Trend Analysis on Department Chairs 1994-2005 Iowa State
University. Ames, IA.
Jones, S., Torres, V., & Arminio, J. (2006). Negotiating the complexities of qualitative research
in higher education: Fundamental elements and issues. New York, NY: Routledge.
Lincoln, Y. S. and Guba, E. (1985). Naturalistic Inquiry. Newbury Park, CA: Sage Publications.
Merriam, S. B. (2008). Qualitative research in practice: Examples for discussion and analysis.
San Fransisco, CA: Jossey-Bass.

Iowa State University Department Chair 87
Munger, M. C. (2010, February 8). 10 Suggestions for a new department chair. The Chronicle of
Higher Education. Retrieved from http://chronicle.com/article/10-Suggestions-for-a-
New/64963/
Office of the Executive Vice President and Provost, Iowa State University. (n.d). Faculty
Handbook and Procedures. Retrieved from
http://www.provost.iastate.edu/faculty/handbook/current/section3.html#section-3.3.1
Papas, E. (1989). The department chair in the 1990s: Confessions, concerns, and convictions.
ACA Bulletin, 68: 34-39.
Seagren, A. T., Creswell, J. W., & Wheeler, D. W. (1993). The department chair: new roles
responsibilities and challenges. ERIC Higher Education Report, 1. Washington, D.C.:
George Washington University.
Smith, E. (2004). The end of the reign: Department chair no more. New Directions for Higher
Education, 126, 85-92.

Appendix A
Trend Analysis onDepartment Chairs
1994 - 2005
Iowa State University

Draft - 5/5/2005
Executive Summary
The purpose of this study is to provide a general background analysis on Department Chairs. The
data were gathered partly from the letter of intent (LOI) and partly from the ISU Administrative System
(ADIN). Information were gathered on each Department Chair for the past ten years within each
college. It is important to remember that some Department Chairs started their position earlier than
1994. There are circumstances where the Department Chairs have left the university for more than
five years and documentation is limited or non-existent. In these cases, certain criteria like term length,
reappointment and salary were assessed base on information that was found from the ISU
Administrative System (ADIN).
In the case where two or more departments are merged into one, only the current/new department is
used for labelling but the total number/data of Department Chairs of combined departments are used.
So the total number of Department Chairs may be slightly higher than usual. If this is the case, it will
be indicated/noted on the corresponding table/chart.
Certain data may be duplicated for the purpose of this report. In the case where a person is the
Department Chair for more than one department, he/she is considered as separate individuals. In
the case where a department belongs to two colleges, the department is listed twice (once in each
college). In either case, the duplicated data were treated as separate data for the purpose of this
study.
The report is organized into two sections: summary data for the colleges (with the exception of College
of Library) and departmental data within each college (with the exception of Departments of Air Force
Aerospace Studies, Military Science & Tactics and Naval Science for College of Liberal Arts & Sciences).
College of Library has been intentionally, not inadvertently, excluded from this report. Although the
University Library functions as a college, with a Dean of Library Services and tenure-track faculty
librarians, it is excluded from this study due to the unique nature of department chair positions
in the library system. The Library's three Associate Deans (for Collections & Technical Services,
Reference & Instruction, and Research & Access) hold renewable appointments as senior
administrators, but also serve as department chairs in promotion, tenure, and post-tenure reviews
within their respective divisions.
The report was first done departmentally within each college (pages 10 - 42), then summarized for the
colleges with the same criteria (pages 5-9) with added information such as compensation and
demographic. Detail descriptions of the study are listed below:
1. Table 1
Avg Length of Svc bef Adm Appt - This is an average time a Department Chair serves as a
faculty member before he/she was appointed to an Administrative position.Avg Term - This is an average term that a Department Chair is hired for as specified in his/her
Letter of Intent (LOI).Avg Length of Service as Dept Chair - This is an average time that a person serves
as a Department Chair (this includes Interim and Regular appointment).
2. Chart 1 - Average Length of Service before Administrative Appointment
A column chart showing the average time a faculty serves as a faculty member before being
appointed to an Administrative position.
Page 1 - Summary

Draft - 5/5/2005
3. Chart 2 - Average Term & Average Length of Service as Department Chair
A column-line chart showing a relationship between the average term a Department Chair is
hired for and the average time he/she actually served as a Department Chair.
4. Table 2
Number of Department Chairs - This is the total number of Department Chairs that serve in
each category (department/college) for the past ten years. In such cases where two or
more departments are combined into one, the total number of Department Chairs are
used. If this is the case, it will be indicated/noted on the corresponding table/chart.
*Number of Departments - This is the total number of Departments that each College
currently has. For the College of Liberal Arts & Sciences, Departments of Air Force
Aerospace Studies, Military Science & Tactics and Naval Science are excluded from this
study.
*This information is furnished for the colleges only.
Recruiting Source - This the total number of Department Chairs that were hired internally vs.
externally. The conclusion was made by considering the length of time a Department Chair
serves as a faculty member before being appointed to a Department Chair. If the length of
time is zero, the Department Chair is considered as an external candidate. On the other
hand, if the length of time is not zero, the Department Chair is considered as having served
at the university as a faculty member and therefore is considered as internal candidate.
5. Chart 3
*Number of Dept Chairs Vs. Number of Depts (1994-2004)
A column-bar chart showing the total number of Department Chairs Vs. total number of
Departments.
*This information is provided for the colleges only.
Number of Department Chairs (1994-2004)
A bar chart showing the total number of Department Chairs for the past ten years.
6. Chart 4 - Recruiting Source
A stacked-column chart showing a comparison between how many Department Chairs were
hired internally vs externally by each category (department/college).
7. Table 3 - Appointment Type
Interim - This is the total number of Department Chairs served on Interim basis.
Co-Interim - This is the total number of Department Chairs served as Co-Interim.
Interim/Term - This is the total number of Department Chairs served first as Interim and later
served as regular (Term) appointment.Term - This is the total number of Department Chairs served as regular (term) appointment.
9. Table 4 - Reappointed
This is the total number of Department Chairs reappointed or not reappointed as chairs.
First Term - This is the total number of Department Chairs currently serving on their first term
(data of whether they are reappointed or not are not yet available).
10. Chart 5 - Reappointed
A column chart showing side-by-side comparison of how many Department Chairs were
reappointed or not and how many Department Chairs are serving on their first term.
Page 2 - Summary

Draft - 5/5/2005
11. Table 5 - Faculty Pay Base
This is the pay base should a Department Chair return to a faculty position. It is important to
remember that certain Department Chair is an A-base (12 months) faculty member and certain
Department Chair is hired as Department Chair on B-base (9 months) appoinment only.
12. Chart 6 - Faculty Pay Base
A bar chart showing the percentage of each faculty pay base, A (12 Months) vs B (9 Months)
should a Department Chair return to a faculty position.
13. Table 6 - Benefits/Inducement Included
These are the different types of benefits/inducement included in appointment conditions (addition
to compensation) and may vary by department/college.
14. Table 7 - Special Conditions stated in Letter of Intent
These are additional conditions that may or may not be stated in the Letter of Intent and may
vary by department/college.
*The following information are provided on a college/university level only.
15. Table 8 - Compensation
Avg Dept Chair Salary - This is an average salary (includes administrative increment) for
Department Chairs within a college. This includes initial salary when a person is hired as a
Department Chair and the salary each time the Department Chair is reappointed. It does
not include regular annual salary increase. All twelve-month salaries have been converted
to nine-month equivalents for comparison purposes.Avg Faculty Salary - This is the average nine-month salaries for full professor (1993-2004).
Avg Adm Inc - This is an average administrative increment for Department Chairs within a
college. In the case where a Department Chair is hired on different administrative
increment (in such case where a Department Chair first served as Interim and later
appointed to regular appointment or Department Chair reappointed at higher increment),
an average amount is used for the purpose of this study.
16. Chart 7 - Average Compensation
This chart attemps to explain the relationship of how much salary a Department Chair earns as
compared to a faculty member (full professor) vs. the administrative increment that he/she
receives.
17. Table 9 - Demographic
This is the general Department Chairs' demographic.
18. Chart 8 - Demographic
A pie chart showing the percentage of each demographic category.
19. Table 10 - Gender
This is the total number of male and female Department Chairs.
20. Chart 9 - Gender
A pie chart showing the percentage of male vs female Department Chairs.
21. Table 11 - Ethnicity
This is the total number of Department Chairs by ethnicity.
Page 3 - Summary

Draft - 5/5/2005
22. Chart 10 - Ethnicity
A pie chart showing the percentage of each ethnicity.
Page 4 - Summary

Draft - 5/5/2005
Table 1
Avg Length of Svc
bef Adm ApptAvg Term
Avg Length of Svc
as Dept Chair
Agriculture 13 4 5
Business 10 3 3
Design 11 4 5
Education 15 2 3
Engineering 14 4 5
FCS 9 3 5
LAS 16 4 5
Vet Med 9 3 3
Chart 1
Chart 2
0
2
4
6
8
10
12
14
16
Agriculture Business Design Education Engineering FCS LAS Vet Med
13
10 11
15 14
9
16
9
Average Length of Service before Administrative Appointment
0
1
2
3
4
5
6
Agriculture Business Design Education Engineering FCS LAS Vet Med
Average Term & Average Length of Service as Department Chair
Avg Term
Avg Length of Svcas Dept Chair
Page 5 - Colleges

Draft - 5/5/2005
Number of Number of
Table 2 Department Chairs Departments Internal External
Agriculture 42 14 27 15
Business 21 5 16 5
Design 10 4 5 5
Education 17 4 14 3
Engineering 25 8 18 7
FCS 13 3 8 5
LAS 57 20 48 9
Vet Med 22 5 16 6
Chart 3
Chart 4
Recruiting Source
0
10
20
30
40
50
60
Agriculture Business Design Education Engineering FCS LAS Vet Med
Number of Dept Chairs Vs. Number of Depts (1994-2004)
Department Chairs
Departments
0
10
20
30
40
50
60
Agriculture Business Design Education Engineering FCS LAS Vet Med
27
16
5
14 18
8
48
16
15
5
5
3
7
5
9
6
Recruiting Source
External
Internal
Page 6 - Colleges

Draft - 5/5/2005
Table 3 Interim Co-Interim Interim/Term Term
Agriculture 7 0 6 31
Business 2 0 3 16
Design 1 0 3 6
Education 5 2 3 6
Engineering 6 0 3 16
FCS 1 2 1 9
LAS 3 0 10 44
Vet Med 9 0 2 11
Table 4 Yes No First Term
Agriculture 21 11 11
Business 7 12 2
Design 7 2 1
Education 10 5 2
Engineering 14 6 5
FCS 9 3 1
LAS 34 10 13
Vet Med 13 5 4
Chart 5
Appointment Type
Reappointed
0
5
10
15
20
25
30
35
Agriculture Business Design Education Engineering FCS LAS Vet Med
21
7 7
10
14
9
34
13
11 12
2
5 6
3
10
5
11
2 1
2
5
1
13
4
Reappointed
Yes
No
First Term
Page 7 - Colleges

Draft - 5/5/2005
Table 5 A (12 Months) B (9 Months)
Agriculture 30 11
Business 0 21
Design 1 9
Education 1 15
Engineering 1 24
FCS 3 10
LAS 11 46
Vet Med 20 2
Chart 6
Table 6 Benefits/inducement Included:
a) Travel/Research
b) Administrative/Research Assistant/Associate
c) Profesional Development
d) Summer Salary/Supplement
e) UP Professorship Supplement
f) Reimbursed Moving Costs
g) Funding towards course buyout
h) Semester leave with pay
i) Start-up package
Table 7 Special Conditions stated in Letter of Intent:
a) Serves at the pleasure of the Dean
b) Unused vacation will be forfeited upon returning to B-base
Faculty Pay Base
0% 20% 40% 60% 80% 100%
Agriculture
Business
Design
Education
Engineering
FCS
LAS
Vet Med
Faculty Pay Base
A (12 Months)
B (9 Months)
Page 8 - Colleges

Draft - 5/5/2005
Table 8 Avg Dept Ch Sal Avg Faculty Sal Avg Adm Inc
Agriculture $90,880 $76,432 $6,568
Business $99,622 $97,910 $7,711
Design $96,236 $67,565 $10,032
Education $79,054 $71,034 $5,469
Engineering $104,665 $94,673 $3,531
FCS $85,602 $72,924 $3,962
LAS $81,262 $77,459 $5,221
Vet Med $96,872 $87,730 $5,061
Chart 7
Table 9 Male Female
Caucasian 147 35
African American 4 0
Asian 13 0
Native American 0 0
Hispanic 1 0
Chart 8
Compensation
0% 20% 40% 60% 80% 100%
Caucasian
African American
Asian
Native American
Hispanic
Male
Female
$0
$2,000
$4,000
$6,000
$8,000
$10,000
$12,000
$0
$20,000
$40,000
$60,000
$80,000
$100,000
$120,000
Agriculture Business Design Education Engineering FCS LAS Vet Med
Average Compensation
Avg Dept Ch Sal
Avg Faculty Sal
Avg Adm Inc
Page 9 - Colleges

Draft - 5/5/2005
Table 10
Male 171
Female 36
Chart 9
Table 11
Caucasian 189
African American 4
Asian 13
Native American 0
Hispanic 1
Chart 10
91%
2%
6%
0% 1%
Ethnicity
Caucasian
African American
Asian
Native American
Hispanic
Male 83%
Female 17%
Gender
Page 10 - Colleges

Third Draft - 3/1/2005
Table 1
Avg Length of
Svc bef Adm
Appt
Avg Term
Avg Length of
Svc
as Dept Chair
Ag Economics 6 5 5
Ag & Biosys Engr 22 5 6
Ag Educ & Stud 18 5 6
Agronomy 7 4 5
Animal Science 11 3 3
BBMB 15 4 5
EEOB 19 4 5
Entomology 17 5 4
FSHN 5 4 3
GDCB 9 3 10
Horticulture 5 3 4
NREM 13 4 9
Plant Pathology 13 4 5
Sociology 28 4 4
Chart 1
Chart 2
College of Agriculture
0
5
10
15
20
25
30
AgEconomics
Ag & BiosysEngr
Ag Educ &Stud
Agronomy AnimalScience
BBMB EEOB Entomology FSHN GDCB Horticulture NREM PlantPathology
Sociology
6
22
18
7
11
15
19 17
5
9
5
13 13
28
Average Length of Service before Administrative Appointment
0
2
4
6
8
10
12
Average Term & Average Length of Service as Department Chair
Avg Term
Avg Length of Svcas Dept Chair
Page 11 - Agriculture

Third Draft - 3/1/2005
Number of
Table 2 Department Chairs Internal External
Ag Economics 2 1 1
Ag & Biosys Engr 2 2 0
Ag Educ & Stud 2 2 0
Agronomy 3 1 2
Animal Science 4 2 2
BBMB 3 3 0
EEOB 3 2 1
Entomology 3 2 1
FSHN 4 1 3
GDCB 2 1 1
Horticulture 3 2 1
NREM 4 3 1
Plant Pathology 3 2 1
Sociology 3 3 0
Chart 3
Chart 4
Recruiting Source
0
1
2
3
4
5
Ag EconomicsAg & Biosys EngrAg Educ & StudAgronomyAnimal Science BBMB EEOB Entomology FSHN GDCB Horticulture NREM Plant PathologySociology
2 2 2
3
4
3 3 3
4
2
3
4
3 3
Number of Department Chairs (1994-2004)
0
1
2
3
4
AgEconomics
Ag & BiosysEngr
Ag Educ &Stud
Agronomy AnimalScience
BBMB EEOB Entomology FSHN GDCB Horticulture NREM PlantPathology
Sociology
1
2 2
1
2
3
2 2
1 1
2
3
2
3 1
0 0 2
2 0
1 1 3
1
1
1
1
0
Recruiting Source
External
Internal
Page 12 - Agriculture

Third Draft - 3/1/2005
Table 3 Interim Interim/Term Term
Ag Economics 0 1 1
Ag & Biosys Engr 0 1 1
Ag Educ & Stud 0 2 0
Agronomy 1 0 2
Animal Science 1 0 3
BBMB 0 1 2
EEOB 0 1 2
Entomology 0 0 3
FSHN 1 0 3
GDCB 0 0 2
Horticulture 1 0 2
NREM 1 0 3
Plant Pathology 0 0 3
Sociology 0 0 3
Table 4 Yes No First Term
Ag Economics 2 0 0
Ag & Biosys Engr 1 0 1
Ag Educ & Stud 1 1 0
Agronomy 1 1 1
Animal Science 0 3 1
BBMB 2 0 1
EEOB 2 0 1
Entomology 1 1 1
FSHN 2 1 1
GDCB 2 0 0
Horticulture 2 1 0
NREM 3 0 1
Plant Pathology 1 1 1
Sociology 1 2 0
Chart 5
Appointment Type
Reappointed
Reappointed
Page 13 - Agriculture

Third Draft - 3/1/2005
Table 5 A B
Ag Economics 0 2
Ag & Biosys Engr 1 1
Ag Educ & Stud 2 0
Agronomy 3 0
Animal Science 4 0
BBMB 3 0
EEOB 1 2
Entomology 3 0
FSHN 3 1
GDCB 0 2
Horticulture 3 0
NREM 4 0
Plant Pathology 2 1
Sociology 1 2
Faculty Pay Base
0
1
2
3
AgEconomics
Ag & BiosysEngr
Ag Educ &Stud
Agronomy AnimalScience
BBMB EEOB Entomology FSHN GDCB Horticulture NREM PlantPathology
Sociology
2
1 1 1
0
2 2
1
2 2 2
3
1 1
0 0
1 1
3
0 0
1 1
0
1
0
1
2
0
1
0
1 1 1 1 1 1
0 0
1 1
0
Reappointed
Yes
No
First Term
Page 14 - Agriculture

Third Draft - 3/1/2005
Chart 6
Table 6 Benefits/inducement Included:
a) Travel/Research
b) Research Assistant/Associate
c) Profesional Development
d) Summer Salary
e) Reimbursed Moving Costs
f) Funding towards course buyout
Table 7 Special Conditions stated in Letter of Intent:
a) Serves at the pleasure of the Dean
b) Unused vacation will be forfeited upon returning to B-base
0% 10% 20% 30% 40% 50% 60% 70% 80% 90% 100%
Faculty Pay Base
A
B
Page 15 - Agriculture

Third Draft - 3/1/2005
Table 1
Avg Length of
Svc bef Adm ApptAvg Term
Avg Length of
Svc
as Dept Chair
Accounting 9 3 4
Finance 9 3 4
LOMIS 9 3 2
Management 11 4 3
Marketing 11 4 3
Chart 1
Chart 1
College of Business
0
2
4
6
8
10
12
Accounting Finance LOMIS Management Marketing
9 9 9
11 11
Average Length of Service before Administrative Appointment
0
1
1
2
2
3
3
4
4
Accounting Finance LOMIS Management Marketing
Average Term & Average Length of Service as Department Chair
Avg Term
Avg Length of Svcas Dept Chair
Page 16 - Business

Third Draft - 3/1/2005
Number of
Table 2 Department Chairs Internal External
Accounting 4 3 1
Finance 4 3 1
LOMIS 5 4 1
Management 4 3 1
Marketing 4 3 1
Chart 3
Chart 4
Recruiting Source
0
1
2
3
4
5
Accounting Finance LOMIS Management Marketing
4 4
5
4 4
Number of Department Chairs (1994-2004)
0
1
2
3
4
5
Accounting Finance LOMIS Management Marketing
3 3
4
3 3
1 1
1
1 1
Recruiting Source
External
Internal
Page 17 - Business

Third Draft - 3/1/2005
Table 3 Interim Interim/Term Term
Accounting 1 1 2
Finance 1 1 2
LOMIS 0 1 4
Management 0 0 4
Marketing 0 0 4
Table 4 Yes No First Term
Accounting 3 1 0
Finance 3 1 0
LOMIS 1 4 0
Management 0 3 1
Marketing 0 3 1
Chart 5
Table 5 A B
Accounting 0 4
Finance 0 4
LOMIS 0 5
Management 0 4
Marketing 0 4
Chart 6
Faculty Pay Base
Reappointed
Appointment Type
0
0.5
1
1.5
2
2.5
3
3.5
4
Accounting Finance LOMIS Management Marketing
3 3
1
0 0
1 1
4
3 3
0 0 0
1 1
Reappointed
Yes
No
First Term
Faculty Pay Base
Page 18 - Business

Third Draft - 3/1/2005
Table 6 Benefits/inducement Included:
a) Research Assistant/Associate
b) Profesional Development
c) Summer Salary/Supplement
d) UP Professorship Supplement
e) Reimbursed Moving Costs
f) Semester leave with pay
Table 7 Special Conditions stated in Letter of Intent:
a) Serves at the pleasure of the Dean
b) Unused vacation will be forfeited upon returning to B-base
0% 10% 20% 30% 40% 50% 60% 70% 80% 90% 100%
Accounting
Finance
LOMIS
Management
Marketing
Faculty Pay Base
A
B
Page 19 - Business

Third Draft - 3/1/2005
Table 1
Avg Length of
Svc bef Adm
Appt
Avg Term
Avg Length of
Svc
as Dept Chair
Architecture 14 3 2
Art & Design 15 4 5
Comm & Regional Planning 11 5 5
Landscape Arc 0 5 11
Chart 1
Chart 2
College of Design
0
2
4
6
8
10
12
14
16
Architecture Art & Design Comm & RegionalPlanning
Landscape Arc
14 15
11
0
Average Length of Service before Administrative Appointment
0
2
4
6
8
10
12
Architecture Art & Design Comm & RegionalPlanning
Landscape Arc
Average Term & Average Length of Service as Department Chair
Avg Term
Avg Length of Svcas Dept Chair
Page 20 - Design

Third Draft - 3/1/2005
Number of
Table 2 Department Chairs Internal External
3 1 2
3 2 1
3 2 1
1 0 1
Chart 3
Chart 4
Architecture
Comm & Regional Planning
Landscape Arc
Recruiting Source
Art & Design
0
1
2
3
Architecture Art & Design Comm & RegionalPlanning
Landscape Arc
3 3 3
1
Number of Department Chairs (1994-2004)
0
1
2
3
Architecture Art & Design Comm & RegionalPlanning
Landscape Arc
1
2 2
0
2
1 1
1
Recruiting Source
External
Internal
Page 21 - Design

Third Draft - 3/1/2005
Table 3 Interim Interim/Term Term
Architecture 1 0 2
Art & Design 0 2 1
Comm & Regional Planning 0 1 2
Landscape Arc 0 0 1
Table 4 Yes No First Term
1 1 1
2 1 0
3 0 0
1 0 0
Chart 5
Table 5 A B
Architecture 0 3
Art & Design 0 3
Comm & Regional Planning 1 2
Landscape Arc 0 1
Chart 6
Landscape Arc
Faculty Pay Base
Appointment Type
Reappointed
Architecture
Art & Design
Comm & Regional Planning
0
1
2
3
Architecture Art & Design Comm & RegionalPlanning
Landscape Arc
1
2
3
1 1 1
0 0
1
0 0 0
Reappointed
Yes
No
First Term
Page 22 - Design

Third Draft - 3/1/2005
Table 6 Benefits/inducement Included:
a) Research Assistant/Associate
b) Profesional Development
c) Reimbursed Moving Costs
d) Semester leave with pay
Table 7 Special Conditions stated in Letter of Intent:
a) Serves at the pleasure of the Dean
b) Unused vacation will be forfeited upon returning to B-base
0% 10% 20% 30% 40% 50% 60% 70% 80% 90% 100%
Architecture
Art & Design
Comm & RegionalPlanning
Landscape Arc
Faculty Pay Base
A
B
Page 23 - Design

Third Draft - 3/1/2005
Table 1
Avg Length of
Svc bef Adm
Appt
Avg Term
Avg Length of
Svc
as Dept Chair
Curr & Instruction 21 2 3
Educ Lead & Pol St 15 2 2
Health & Human Perf 14 2 4
Industrial Educ & Tech 11 2 4
Chart 1
Chart 2
College of Education
0
5
10
15
20
25
Curr & Instruction Educ Lead & Pol St Health & HumanPerf
Industrial Educ &Tech
21
15 14
11
Average Length of Service before Administrative Appointment
0
1
2
3
4
Curr & Instruction Educ Lead & Pol St Health & Human Perf Industrial Educ & Tech
Average Term & Average Length of Service as Department Chair
Avg Term
Avg Length of Svcas Dept Chair
Page 24 - Education
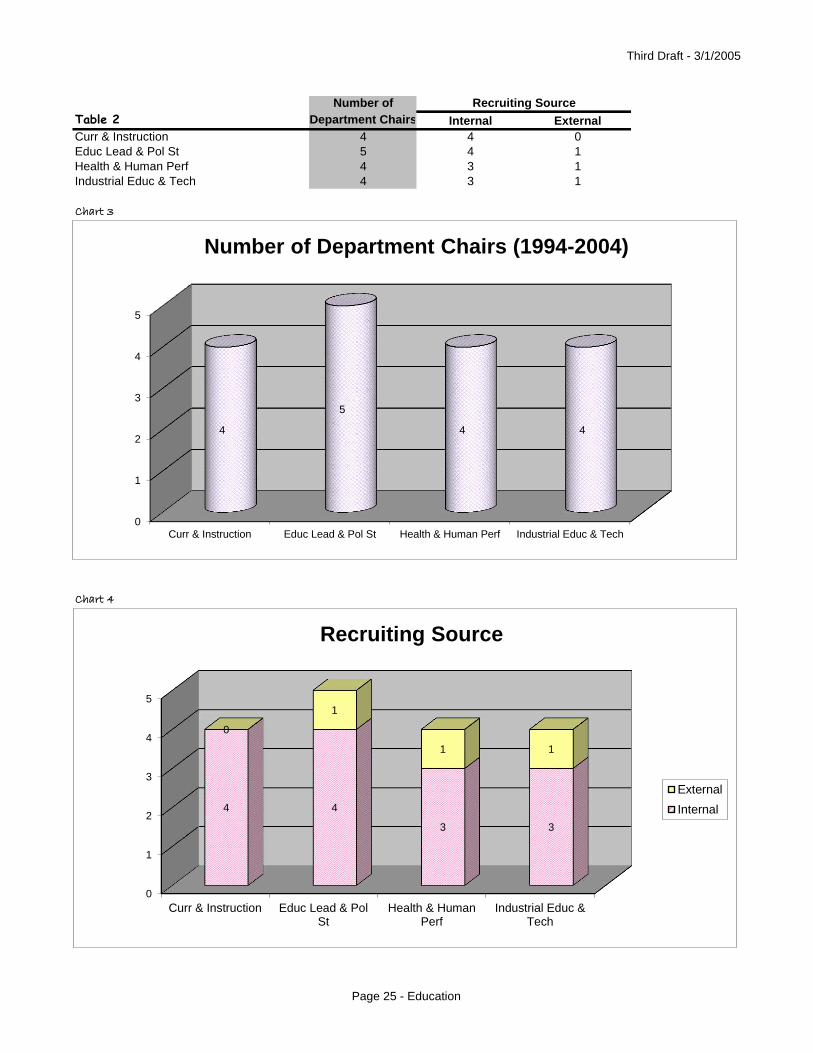
Third Draft - 3/1/2005
Number of
Table 2 Department Chairs Internal External
4 4 0
5 4 1
4 3 1
4 3 1
Chart 3
Chart 4
Health & Human Perf
Industrial Educ & Tech
Recruiting Source
Curr & Instruction
Educ Lead & Pol St
0
1
2
3
4
5
Curr & Instruction Educ Lead & Pol St Health & Human Perf Industrial Educ & Tech
4
5
4 4
Number of Department Chairs (1994-2004)
0
1
2
3
4
5
Curr & Instruction Educ Lead & PolSt
Health & HumanPerf
Industrial Educ &Tech
4 4
3 3
0
1
1 1
Recruiting Source
External
Internal
Page 25 - Education

Third Draft - 3/1/2005
Table 3 Interim Co-Interim Interim/Term Term
Curr & Instruction 2 0 0 2
Educ Lead & Pol St 1 2 0 1
Health & Human Perf 1 0 1 2
Industrial Educ & Tech 1 0 2 1
Table 4 Yes No First Term
Curr & Instruction 3 1 0
Educ Lead & Pol St 3 1 1
Health & Human Perf 2 1 1
Industrial Educ & Tech 2 2 0
Chart 5
Table 5 A B
Curr & Instruction 0 4
Educ Lead & Pol St 1 3
Health & Human Perf 0 4
Industrial Educ & Tech 0 4
Appointment Type
Reappointed
Faculty Pay Base
0
1
2
3
Curr & Instruction Educ Lead & Pol St Health & HumanPerf
Industrial Educ &Tech
3 3
2 2
1 1 1
2
0
1 1
0
Reappointed
Yes
No
First Term
Page 26 - Education

Third Draft - 3/1/2005
Chart 6
Table 7 Special Conditions stated in Letter of Intent:
1. Serves at the pleasure of the Dean
2. Unused vacation will be forfeited upon returning to B-base
0% 10% 20% 30% 40% 50% 60% 70% 80% 90% 100%
Curr & Instruction
Educ Lead & Pol St
Health & Human Perf
Industrial Educ & Tech
Faculty Pay Base
A
B
Page 27 - Education

Third Draft - 3/1/2005
Table 1
Avg Length of
Svc bef Adm
Appt
Avg Term
Avg Length of
Svc
as Dept Chair
Aerospace Engr 14 4 4
Ag & Biosys Engr 22 5 6
Chem Engr 16 3 5
Civil, Const & Env Engr 17 4 15
Elec & Comp Engr 10 3 3
Ind & Man Systems Engr 15 3 3
Mat Sc & Engr 8 5 7
Mech Engr 17 3 3
Chart 1
Arun somani
Aziz Fouad
Randall Geiger
Pat Patterson
Pius J. Egbelu
Geraldine Montag
Mufit Akinc
Krishna Vedula
Judy Vance
Jon Van Gerpen
Warren R. DeVries
Shyam Bahadur
Theodore Okiishi
Chart 2
College of Engineering
0
5
10
15
20
25
AerospaceEngr
Ag &BiosysEngr
Chem EngrCivil, Const& Env Engr
Elec &Comp Engr
Ind & ManSystems
Engr
Mat Sc &Engr
Mech Engr
14
22
16 17
10 15
8
17
Average Length of Service before Administrative Appointment
0
2
4
6
8
10
12
14
16
AerospaceEngr
Ag &BiosysEngr
Chem Engr Civil, Const& Env Engr
Elec &Comp Engr
Ind & ManSystems
Engr
Mat Sc &Engr
Mech Engr
Average Term & Average Length of Service as Department Chair
Avg Term
Avg Length of Svcas Dept Chair
Page 28 - Engineering

Third Draft - 3/1/2005
Number of
Table 2 Department Chairs Internal External
Aerospace Engr 4 3 1
Ag & Biosys Engr 2 2 0
Chem Engr 3 3 0
Civil, Const & Env Engr 1 1 0
Elec & Comp Engr 4 2 2
Ind & Man Systems Engr 3 2 1
Mat Sc & Engr 2 1 1
Mech Engr 5 4 1
Chart 3
Chart 4
Recruiting Source
0
1
2
3
4
5
AerospaceEngr
Ag & BiosysEngr
Chem Engr Civil, Const& Env Engr
Elec &Comp Engr
Ind & ManSystems
Engr
Mat Sc &Engr
Mech Engr
3
2
3
1
2 2
1
4
1
0
0
0
2
1
1
1
Recruiting Source
External
Internal
0
1
2
3
4
5
AerospaceEngr
Ag & BiosysEngr
Chem Engr Civil, Const& Env Engr
Elec & CompEngr
Ind & ManSystems
Engr
Mat Sc &Engr
Mech Engr
4
2
3
1
4
3
2
5
Number of Department Chairs (1994-2004)
Page 29 - Engineering

Third Draft - 3/1/2005
Table 3 Interim Interim/Term Term
Aerospace Engr 1 0 3
Ag & Biosys Engr 0 1 1
Chem Engr 1 0 2
Civil, Const & Env Engr 0 0 1
Elec & Comp Engr 1 0 3
Ind & Man Systems Engr 1 1 1
Mat Sc & Engr 0 1 1
Mech Engr 2 0 3
Table 4 Yes No First Term
Aerospace Engr 2 1 1
Ag & Biosys Engr 1 0 1
Chem Engr 2 1 0
Civil, Const & Env Engr 1 0 0
Elec & Comp Engr 1 2 1
Ind & Man Systems Engr 2 1 0
Mat Sc & Engr 2 0 0
Mech Engr 3 1 1
Chart 5
Table 5 A B
Aerospace Engr 0 4
Ag & Biosys Engr 1 1
Chem Engr 0 3
Civil, Const & Env Engr 0 1
Elec & Comp Engr 0 4
Ind & Man Systems Engr 0 3
Mat Sc & Engr 0 2
Mech Engr 0 5
Appointment Type
Reappointed
Faculty Pay Base
0
1
2
3
Aerospace Engr Ag & BiosysEngr
Chem Engr Civil, Const &Env Engr
Elec & CompEngr
Ind & ManSystems Engr
Mat Sc & Engr Mech Engr
2
1
2
1 1
2 2
3
1
0
1
0
2
1
0
1 1 1
0 0
1
0 0
1
Reappointed
Yes
No
First Term
Page 30 - Engineering

Third Draft - 3/1/2005
Chart 6
Table 6 Benefits/inducement Included:
a) Travel/Research
b) Profesional Development
c) Reimburse Moving Costs
d) Summer salary
Table 7 Special Conditions stated in Letter of Intent:
a) Serves at the pleasure of the Dean
b) Unused vacation will be forfeited upon returning to B-base
0% 10% 20% 30% 40% 50% 60% 70% 80% 90% 100%
Aerospace Engr
Ag & Biosys Engr
Chem Engr
Civil, Const & Env Engr
Elec & Comp Engr
Ind & Man Systems Engr
Mat Sc & Engr
Mech Engr
Faculty Pay Base
A
B
Page 31 - Engineering

Third Draft - 3/1/2005
Table 1
Avg Length of
Svc bef Adm
Appt
Avg Term
Avg Length of
Svc
as Dept Chair
*App, Educ St & Hosp Mgmt 10 4 6
Food Sc & Human Nutrition 5 4 3
Human Dev & Fam St 14 2 4
*Departments of Hotel, Rest & Inst Mgmt, Textiles & Clothing merged into the Department of App, Educ St & Hosp Mgmt
Chart 1
Mary Winter
Chart 2
College of Family & Consumer Sciences
0
2
4
6
8
10
12
14
*App, Educ St & HospMgmt
Food Sc & Human Nutrition Human Dev & Fam St
10
5
14
Average Length of Service before Administrative Appointment
0
1
2
3
4
5
6
7
*App, Educ St & Hosp Mgmt Food Sc & Human Nutrition Human Dev & Fam St
Average Term & Average Length of Service as Department Chairs
Avg Term
Avg Length of Svcas Dept Chair
Page 32 - FCS

Third Draft - 3/1/2005
Number of
Table 2 Department Chairs Internal External
App, Educ St & Hosp Mgmt 6 5 1
Food Sc & Human Nutrition 4 1 3
Human Dev & Fam St 3 2 1
Chart 3
Chart 4
Recruiting Source
0
1
2
3
4
5
6
App, Educ St & Hosp Mgmt Food Sc & Human Nutrition Human Dev & Fam St
6
4
3
Number of Department Chairs (1994-2004)
0
1
2
3
4
5
6
App, Educ St & Hosp Mgmt Food Sc & Human Nutrition Human Dev & Fam St
5
1
2
1
3 1
Recruiting Source
External
Internal
Page 33 - FCS
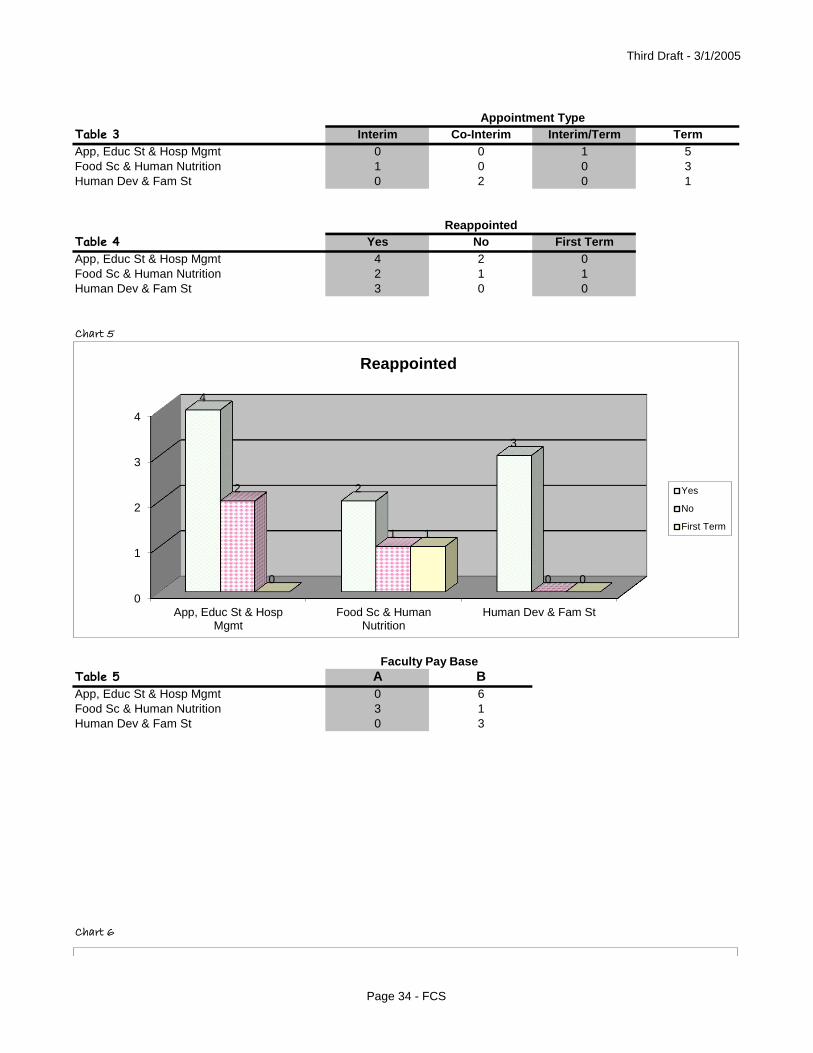
Third Draft - 3/1/2005
Table 3 Interim Co-Interim Interim/Term Term
App, Educ St & Hosp Mgmt 0 0 1 5
Food Sc & Human Nutrition 1 0 0 3
Human Dev & Fam St 0 2 0 1
Table 4 Yes No First Term
App, Educ St & Hosp Mgmt 4 2 0
Food Sc & Human Nutrition 2 1 1
Human Dev & Fam St 3 0 0
Chart 5
Table 5 A B
App, Educ St & Hosp Mgmt 0 6
Food Sc & Human Nutrition 3 1
Human Dev & Fam St 0 3
Chart 6
Faculty Pay Base
Appointment Type
Reappointed
0
1
2
3
4
App, Educ St & HospMgmt
Food Sc & HumanNutrition
Human Dev & Fam St
4
2
3
2
1
0 0
1
0
Reappointed
Yes
No
First Term
Page 34 - FCS

Third Draft - 3/1/2005
Table 6 Benefits/inducement Included:
a) Travel/Research
b) Research Assistant/Associate
c) Reimbursed Moving Costs
Table 7 Special Conditions stated in Letter of Intent:
a) Serves at the pleasure of the Dean
b) Unused vacation will be forfeited upon returning to B-base
0% 20% 40% 60% 80% 100%
App, Educ St & Hosp Mgmt
Food Sc & Human Nutrition
Human Dev & Fam St
Faculty Pay Base
A
B
Page 35 - FCS

Third Draft - 3/1/2005
Table 1
Avg Length of Svc
bef Adm ApptAvg Term
Avg Length of Svc
as Dept Chair
Anthropology 22 5 7
BBMB 15 4 5
Chemistry 15 3 4
Computer Science 11 3 5
EEOB 19 4 5
Economics 6 5 5
English 20 5 4
For Lang & Lit 15 3 5
GDCB 9 3 10
Geol & Atmos Sci 21 3 5
GSJC 5 4 4
History 27 4 7
Math 15 3 4
Music 11 4 14
Phil & Rel Studies 17 3 5
Phys & Astron 22 3 3
Political Science 12 6 5
Psychology 8 3 4
Sociology 28 4 4
Statistics 20 4 10
Chart 1
Chart 2
College of Liberal Art & Siences
0
5
10
15
20
25
30
Average Length of Service before Administrative Appointment
02468
10121416
Average Term & Average Length of Service as Department Chair
Avg Term
Avg Length of Svcas Dept Chair
Page 36 - LAS

Third Draft - 3/1/2005
Number ofTable 2 Department Chairs Internal External
Anthropology 2 2 0
BBMB 3 3 0
Chemistry 4 4 0
Computer Science 4 3 1
EEOB 3 2 1
Economics 2 1 1
English 3 3 0
For Lang & Lit 3 3 0
GDCB 2 1 1
Geol & Atmos Sci 3 3 0
GSJC 4 2 2
History 2 2 0
Math 3 2 1
Music 2 2 0
Phil & Rel Studies 3 3 0
Phys & Astron 3 3 0
Political Science 2 1 1
Psychology 3 2 1
Sociology 3 3 0
Statistics 2 2 0
Chart 3
Chart 4
Recruiting Source
0
1
2
3
4
2
3
4 4
3
2
3 3
2
3
4
2
3
2
3 3
2
3 3
2
Number of Department Chairs (1994-2004)
0
1
2
3
4
2
3
4
3
2
1
3 3
1
3
2 2 2 2
3 3
1
2
3
2
0
0
0
1
1
1
0 0
1
0 2
0
1
0
0 0
1
1
0
0
Recruiting Source
External
Internal
Page 37 - LAS

Third Draft - 3/1/2005
Table 3 Interim Interim/Term Term
Anthropology 0 0 2
BBMB 0 1 2
Chemistry 0 0 4
Computer Science 1 2 1
EEOB 0 1 2
Economics 0 1 1
English 0 0 3
For Lang & Lit 0 0 3
GDCB 0 0 2
Geol & Atmos Sci 0 0 3
GSJC 0 1 3
History 0 0 2
Math 0 1 2
Music 0 1 1
Phil & Rel Studies 0 0 3
Phys & Astron 0 0 3
Political Science 0 0 2
Psychology 1 0 2
Sociology 0 0 3
Statistics 0 2 0
Table 4 Yes No First Term
Anthropology 1 0 1
BBMB 2 0 1
Chemistry 1 1 2
Computer Science 1 2 1
EEOB 2 0 1
Economics 2 0 0
English 0 2 1
For Lang & Lit 2 0 1
GDCB 2 0 0
Geol & Atmos Sci 3 0 0
GSJC 2 1 1
History 2 0 0
Math 3 0 0
Music 1 0 1
Phil & Rel Studies 2 0 1
Phys & Astron 1 1 1
Political Science 1 1 0
Psychology 3 0 0
Sociology 1 2 0
Statistics 2 0 0
Chart 5
Appointment Type
Reappointed
3
3 3 3
Reappointed
Page 38 - LAS

Third Draft - 3/1/2005
Table 5 A B
Anthropology 0 2
BBMB 3 0
Chemistry 2 2
Computer Science 1 3
EEOB 1 2
Economics 0 2
English 1 2
For Lang & Lit 0 3
GDCB 0 2
Geol & Atmos Sci 0 3
GSJC 0 4
History 0 2
Math 0 3
Music 0 1
Phil & Rel Studies 0 3
Phys & Astron 1 2
Political Science 1 3
Psychology 1 2
Sociology 1 2
Statistics 0 2
Chart 8
Faculty Pay Base
0
1
2
1
2
1 1
2 2
0
2 2 2 2
1
2
1 1 1
2
0 0
1
2
0 0
2
0 0 0
1
0 0 0 0
1 1
0
2
0
1 1
2
1 1
0
1 1
0 0
1
0 0
1 1 1
0 0 0 0
Yes
No
First Term
Page 39 - LAS

Third Draft - 3/1/2005
Table 6 Benefits/inducement Included:
a) Travel/Research
b) Research Assistant/Associate
c) Profesional Development
d) Summer Salary
e) Reimbursed Moving Costs
f) Funding towards course buyout
Table 7 Special Conditions stated in Letter of Intent:
a) Serves at the pleasure of the Dean
b) Unused vacation will be forfeited upon returning to B-base
0% 10% 20% 30% 40% 50% 60% 70% 80% 90% 100%
Anthropology
BBMB
Chemistry
Computer Science
EEOB
Economics
English
For Lang & Lit
GDCB
Geol & Atmos Sci
GSJC
History
Math
Music
Phil & Rel Studies
Phys & Astron
Political Science
Psychology
Sociology
Statistics
Faculty Pay Base
A
B
Page 40 - LAS

Third Draft - 3/1/2005
Page 41 - LAS

Third Draft - 3/1/2005
Table 1
Avg Length of
Svc bef Adm
Appt
Avg Term
Avg Length of
Svc
as Dept Chair
Biomedical Sc 12 3 6
Vet Mic & Prev Med 8 3 3
Vet Clinical Svc 1 4 3
Vet Diag & Prod An Med 9 3 2
Vet Pathology 12 2 3
Chart 1
Patrick Halbur
Lisa Nolan
Robert Holland
Nolan Hartwig
Gary Osweiler
John Andrews
Claire Andreasen
Joseph Haynes
Norman Cheville
John Greve
Chart 2
College of Veterinary Medicine
0
2
4
6
8
10
12
14
Biomedical Sc Vet Mic & PrevMed
Vet Clinical Svc Vet Diag & ProdAn Med
Vet Pathology
12
8
1
9
12
Average Length of Service before Administrative Appointment
0
1
2
3
4
5
6
Biomedical Sc Vet Mic & Prev Med Vet Clinical Svc Vet Diag & Prod AnMed
Vet Pathology
Average Term & Average Length of Service as Department Chair
Avg Term
Avg Length of Svcas Dept Chair
Page 42 - Vet Med

Third Draft - 3/1/2005
Number of
Table 2 Department Chairs Internal External
Biomedical Sc 4 3 1
Vet Mic & Prev Med 5 3 2
Vet Clinical Svc 3 1 2
Vet Diag & Prod An Med 6 6 0
Vet Pathology 4 3 1
Chart 3
Chart 4
Recruiting Source
0
1
2
3
4
5
6
Biomedical Sc Vet Mic & PrevMed
Vet Clinical Svc Vet Diag & ProdAn Med
Vet Pathology
4
5
3
6
4
Number of Department Chairs (1994-2004)
0
1
2
3
4
5
6
Biomedical Sc Vet Mic & PrevMed
Vet Clinical Svc Vet Diag & ProdAn Med
Vet Pathology
3 3
1
6
3
1
2
2
0
1
Recruiting Source
External
Internal
Page 43 - Vet Med

Third Draft - 3/1/2005
Table 3 Interim Interim/Term Term
Biomedical Sc 1 1 2
Vet Mic & Prev Med 1 1 3
Vet Clinical Svc 1 0 2
Vet Diag & Prod An Med 3 0 3
Vet Pathology 3 0 1
Table 4 Yes No First Term
Biomedical Sc 4 0 0
Vet Mic & Prev Med 3 1 1
Vet Clinical Svc 1 1 1
Vet Diag & Prod An Med 1 3 2
Vet Pathology 4 0 0
Chart 5
Table 5 A B
Biomedical Sc 4 0
Vet Mic & Prev Med 4 1
Vet Clinical Svc 3 0
Vet Diag & Prod An Med 5 1
Vet Pathology 4 0
Chart 6
Reappointed
Faculty Pay Base
Appointment Type
0
1
2
3
4
Biomedical Sc Vet Mic & PrevMed
Vet Clinical Svc Vet Diag & ProdAn Med
Vet Pathology
4
3
1 1
4
0
1 1
3
0 0
1 1
2
0
Reappointed
Yes
No
First Term
Page 44 - Vet Med

Third Draft - 3/1/2005
Table 6 Benefits/inducement Included:
a) Research Assistant/Associate
b) Start-up package
Table 7 Special Conditions stated in Letter of Intent:
a) Serves at the pleasure of the Dean
b) Unused vacation will be forfeited upon returning to B-base
0% 10% 20% 30% 40% 50% 60% 70% 80% 90% 100%
Biomedical Sc
Vet Mic & Prev Med
Vet Clinical Svc
Vet Diag & Prod An Med
Vet Pathology
Faculty Pay Base
A
B
Page 45 - Vet Med

1
ISU Department Chair Survey
Q1 Consent Form for: Analysis of the Role, Progression, and Directions of the ISU Department Chair
This form describes a research project and contains information to help you decide whether or not you wish to participate.
Research studies include only people who choose to take part—your participation is completely voluntary. Please discuss any
questions you have about the study or about this form with the project staff before deciding to participate.
Who is conducting this study?
This study is being conducted by: Dr. Linda Serra Hagedorn, Associate Dean and Professor from the College of Human Sciences
at Iowa State University in conjunction with the ISU Provost Office, and the ISU ADVANCE Project.
Why am I invited to participate in this study?
You are being asked to take part in this study because you are a department chair or equivalent at Iowa State University.
What is the purpose of this study?
The purpose of this study is to better understand the roles and responsibility of department chairs at Iowa State University.
What will I be asked to do?
If you agree to participate, you will be asked to respond to a series of survey questions asking about your roles and
responsibilities as a department chair, as well as the support and challenges you face in your roles. Your participation will last
for the duration of your time spent on the survey, approximately 15-20 minutes to answer all of the questions. At any time
you may choose to not answer a question or to end the survey.
What are the possible risks and benefits of my participation? Risks – The researchers anticipate no risks related to your
participation in this research. The questions are non-invasive and you may choose to not respond to any question at any
time.
Appendix B

2
Benefits – You may not receive any direct benefit from taking part in this study. We hope that this research will benefit Iowa
State University department chairs by informing administrators of the challenges and support needed by department chairs
with regard to their roles and responsibilities.
How will the information I provide be used?
The information you provide will be used by Iowa State University administrators and faculty members to understand the
roles and responsibility of department chairs at Iowa State University. The data you provide will be summarized with other
department chairs’ data. Statistics may be released in aggregate form to inform administrators. No aggregated data will be
released with less than three department chairs’ data summarized in order to assure the confidentiality of all participating
chairs. There will be no identifying information attached to any analyses or presentation. However, due to the small number of
Department Chairs, complete anonymity cannot be guaranteed.
What measures will be taken to ensure the confidentiality of the data or to protect my privacy?
Records identifying participants will be kept confidential to the extent allowed by applicable laws and regulations. Records
will not be made publicly available. However auditing departments of Iowa State University, and the ISU Institutional Review
Board (a committee that reviews and approves research studies with human subjects) may inspect and/or copy your records
for quality assurance and analysis. These records may contain private information. To ensure confidentiality to the extent
allowed by law, your responses will be disassociated with identifiable information at the end of the survey period.
The confidential data will be stored on a computer behind a locked office door and password protected, and access only
granted to approved persons to analyze the data. Individual responses will not be released. Deans will not be provided with
data from their departments.
Will I incur any costs from participating or will I be compensated?
You will not have any costs from participating in this study and you will not be compensated.
What are my rights as a human research participant?

3
Participating in this study is completely voluntary. You may choose not to take part in the study or to stop participating at any
time, for any reason, without penalty or negative consequences. You may skip any questions that you do not wish to answer.
Your choice of whether or not to participate will have no impact on you as a department chair in any way.
Whom can I call if I have questions or problems?
You are encouraged to ask questions at any time during this study.
For further information about the study contact Dr. Linda Serra Hagedorn, Associate Dean and Professor, at 515-294-5746,
If you have any questions about the rights of research subjects or research-related injury, please contact the IRB
Administrator, (515) 294-4566, [email protected], or Director, (515) 294-3115, Office for Responsible Research, 1138 Pearson
Hall, Iowa State University, Ames, Iowa 50011.
Consent and Authorization Provisions
By clicking the “continue” button, you indicate that you voluntarily agree to participate in this study, that the study has been
explained to you, that you have been given the time to read the document and that your questions have been satisfactorily
answered. You may print a copy of the informed consent for your own files or contact the principal investigators to obtain a
copy.
I wish to continue
I do not wish to continue
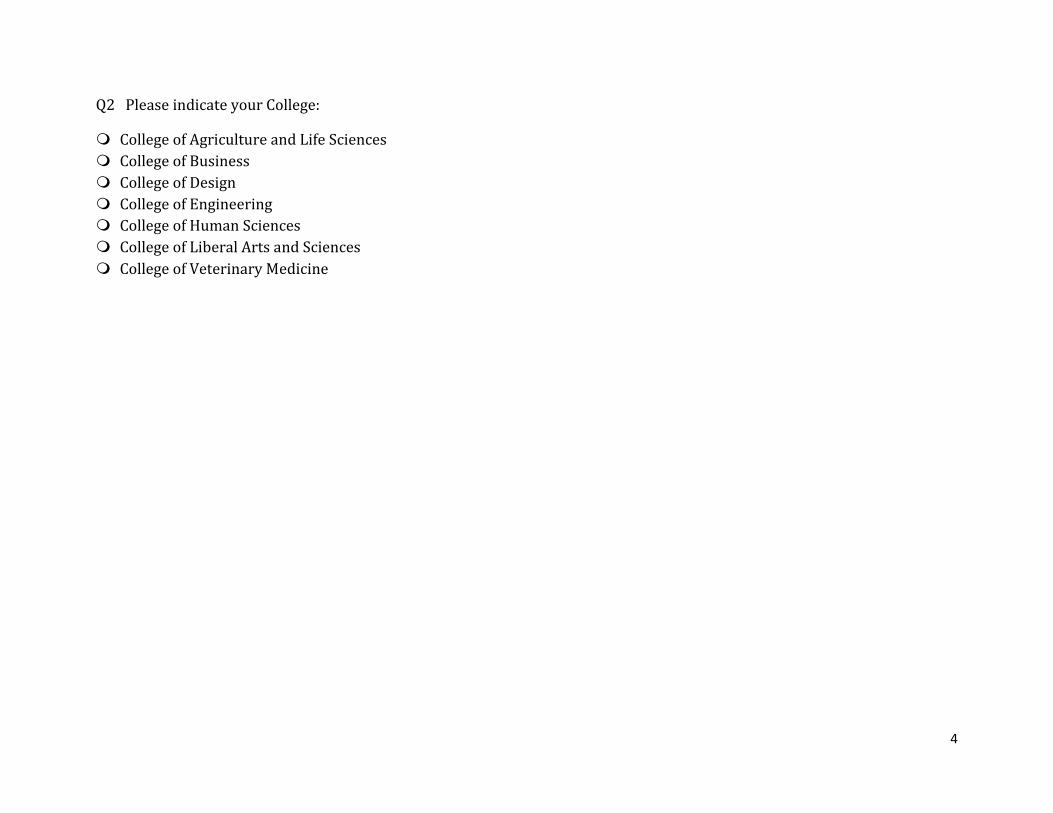
4
Q2 Please indicate your College:
College of Agriculture and Life Sciences
College of Business
College of Design
College of Engineering
College of Human Sciences
College of Liberal Arts and Sciences
College of Veterinary Medicine

5
Q3 Please indicate your department:
Agricultural Economics
Agricultural and Biosystems Engineering
Agricultural Education and Studies
Agronomy
Animal Science
Biochemistry, Biophysics and Molecular Biology
Ecology, Evolution and Organismal Biology
Entomology
Food Science and Human Nutrition
Genetics, Development and Cell Biology
Horticulture
Natural Resource Ecology and Management
Plant Pathology and Microbiology
Sociology

6
Q4 Please indicate your departments:
Accounting
Finance
Supply Chain and Information Systems
Management
Marketing

7
Q5 Please indicate your department:
Architecture
Community & Regional Planning
Graphic Design
Integrated Studio Art
Interior Design
Landscape Architecture

8
Q6 Please indicate your department:
Aerospace Engineering
Agricultural & Biosystems Engineering
Chemical & Biological Engineering
Civil, Construction and Environmental Engineering
Electrical and Computer Engineering
Industrial and Manufacturing Systems Engineering
Materials Science and Engineering
Mechanical Engineering

9
Q7 Please indicate your department:
Curriculum & Instruction
Apparel, Educational Studies & Hospitality Management
Human Development and Family Studies
Food Science & Human Nutrition
Educational Leadership and Policy Studies
Kinesiology

10
Q8 Please indicate your department:
Anthropology
Biochemistry, Biophysics and Molecular Biology
Chemistry
Computer Science
Ecology, Evolution & Organismal Biology
Economics
English
Genetics, Development & Cell Biology
Geological and Atmospheric Sciences
Greenlee School of Journalism and Communication
History
Mathematics
Music & Theatre
Philosophy and Religious Studies
Physics & Astronomy
Political Science
Psychology
Sociology
Statistics
World Languages and Cultures

11
Q9 Please indicate your department:
Biomedical Sciences
Veterinary Microbiology & Preventive Medicine
Veterinary Clinical Sciences
Veterinary Diagnostic & Production Animal Medicine
Veterinary Pathology

12
Q10 Appointment Process Please select the response that best fits the search/selection process when you were
appointed Department Chair.
Internal search within the department
Internal search within ISU but external to the department
External search to ISU
Other. Please specify ____________________

13
Q11 Who provides inputs to the Dean regarding the selection of Department Chair? (choose all that apply)
Tenured faculty
Tenure-track faculty
Non-tenure eligible (e.g. Clinical faculty)
Adjunct faculty
Part-time faculty
Staff
Emeritus faculty
Other. Please specify ____________________

14
Q12 What is the term of your appointment?
Please indicate how many years: ____________________
No specific term length
Other. Please specify ____________________
Q13 If offered another term as Department Chair, how likely would it be for you to accept?
Yes, I would enthusiastically accept
Possibly would consider another term
I would not consider another term
Q14 Why would you accept or not accept the offer?

15
Q15 If offered a higher position in administration, how likely would it be for you to accept?
Yes, I would enthusiastically accept
Possibly would consider another term
I would not consider another term
Q16 Why would you accept or not accept the offer?
________________________________________________________

16
Q17 How long is your academic year contract as the Department Chair?
9 months
10 months
11 months
12 months
Not certain
Other. Please specify ____________________
Q18 What is the typical term for Department Chairs in your department?
Please indicate how many years: ____________________
No typical term
Other. Please specify ____________________

17
Q19 At the end of the Spring 2012 term, how long will you have been Department Chair at ISU?
______ years
Q20 What was your academic rank and status when you became Department Chair? (mark all that apply)
Associate Professor
Full Professor
Tenured
Other. Please specify ____________________
Q21 According to your PRS, what percentage of your profile is dedicated to Department Chair duties?
______ %
Q22 Approximately what percentage of your work time is ACTUALLY spent on Department Chair related duties (as opposed to
teaching, research, and service)?
______ %

18
Q23 Listed below are possible reasons for becoming a Department Chair. Indicate how relevant each reason was in your
case.
Not Relevant Somewhat Relevant
Very Relevant
I wanted to help lead my department
Faculty rotate through the position and it was my turn
I wanted the extra pay
I wanted to increase my retirement pay
No one else willing to do it
I aspire to higher positions of leadership
I desired to advance a particular department program
I prefer a leadership role
For personal development (interesting challenge, new opportunities)
Other. Please specify
Additional comments

19
Q24 How many total years have you been a full-time faculty member at ANY institution?
______ years
Q25 How many years have you been a full-time faculty member at ISU?
______ years
Q26 Prior to your assignment as Department Chair, were you (check all that apply)
An ISU faculty member
A faculty member at a different institution
An ISU administrator
An administrator at a different institution
Other. Please explain ____________________

20
Q27 Reviews/Assessments How often is your performance formally reviewed by your Dean?
Never
Once a Semester
Once a year
Not certain
Other. Please explain ____________________
Q28 How often is your performance formally reviewed by Faculty?
Never
Once a Semester
Once a year
Once every 2 years
Once every 3 years
Once every 4 years
At your request (no particular pattern)
Other. Please explain ____________________

21
Q29
Strongly agree
Agree Neither Agree nor Disagree
Disagree Strongly Disagree
My evaluation is based on clear Department Chair performance expectations
Q30 How were performance expectations provided to you by your dean PRIOR to becoming Department Chair?
Verbally
In writing
Not provided
Other. Please specify ____________________

22
Q31 Chair Duty/Task
Rate the importanceof each of the following Department Chair duties
Extremely Important
Very Important
Neither Important
nor Unimportan
t
Very Unimportant
Not at all Importan
t
Check if you
would like more training
1. Facilitating successful recruitment and selection of promising faculty
2. Evaluate faculty performance
3. Reduce, resolve, and/or prevent conflict among departmental faculty members
4. Assist faculty in developing their own goals and priorities
5. Develop and initiate long-range departmental goals
6. Plan and conduct department meetings
7. Solicit ideas to improve the department
8. Allocate faculty

23
responsibilities in an effective and equitable manner
9. Inform faculty of department, college, and university concerns
10. Plan and evaluate curriculum development
11. Coordinate departmental activities
12. Effectively advocate for departmental interests to higher authorities
13. Represent the department at professional meetings
14. Participate in college and university committee work
15. Fundraising
16. Manage department resources (finances, facilities, equipment, and space)
17. Remain current within academic discipline

24
18. Prepare and propose budgets
19. Look out for the personal welfare of individual faculty members
20. Provide feedback to faculty on their major activities
21. Other. Please explain

25
Q32 Time
In an average year, estimate the amount of time you spend in each Department Chair activity
1 None
2 3 4 5 A great deal
1. Facilitating successful recruitment and selection of promising faculty
2. Evaluate faculty performance
3. Reduce, resolve, and/or prevent conflict among departmental faculty members
4. Assist faculty in developing their own goals and priorities
5. Develop and initiate long-range departmental goals
6. Plan and conduct department meetings
7. Solicit ideas to improve the department
8. Allocate faculty responsibilities in an effective and equitable manner
9. Inform faculty of department, college, and university concerns
10. Plan and evaluate curriculum development
11. Coordinate departmental activities
12. Effectively advocate for departmental interests to higher

26
authorities
13. Represent the department at professional meetings
14. Participate in college and university committee work
15. Fundraising
16. Manage department resources (finances, facilities, equipment, and space)
17. Remain current within academic discipline
18. Prepare and propose budgets
19. Look out for the personal welfare of individual faculty members
20. Provide feedback to faculty on their major activities
21. Other. Please explain

27
Q33 Indicate any Department Chair preparation workshops that you attended.
Please specify ____________________
I have not attended any Department Chair preparation workshops
Q34 Indicate any leadership workshops that you attended.
Please specify ____________________
I have not attended any leadership workshops

28
Q35 Support
Rate your agreement with each of the following items:
Strongly Agree
Agree Neither Agree nor Disagree
Disagree Strongly Disagree
1. My dean supports me
2. My faculty trusts me
3. I have the authority to make important decisions
4. My dean has confidence in my leadership
5. My faculty have confidence in my leadership
Q36 What additional supports should be provided to Department Chairs to assure success?
__________________________________________________

29
Q37 Please rate your agreement with the following statements.
Strongly Agree Not Sure Strongly Disagree
1. I feel that difficulties for women who serve as department chair are similar to those for men who serve as department chair.
2. I feel that difficulties for race/ethnic minority group members who serve as department chairs are similar to those of non-minority persons who serve as department chairs
3. I feel that difficulties for gays and lesbians who serve as department chair are similar to those of heterosexual persons who serve as department chair. I
Please provide additional comments:

30
Q38 Stress
Rate your level of stress in each of the following areas:
Extremely Stressful
Stressful Somewhat Stressful
Not Stressful
1. Time to stay current in my field (with research, conferences, etc.)
2. Gaining financial support for department programs
3. My academic career progress
4. Fulfilling my high self-expectation
5. Attending meetings
6. Dealing with faculty
7. Maintaining a healthy family life
8. Maintaining healthy working relationship with faculty and staff
9. Other. Please specify
31
Q39 Demographics
What is your gender?
Female
Male
Q40 What is your marital status?
Single/ widowed /divorced
Married or living with a partner
Q41 Number of children under age 18 living at home.
________________________________________________
Q42 Any other comments you wish to add regarding your role as Department Chair?
____________________________________________________________

Interview Protocol
Procedure
1. Greetings
2. Describe the project, telling the interviewee about (a) the purpose of the study, (b) what will
be done with the data to protect confidentiality of the interviewee, and (c) how long the
interview will commence.
3. Turn on the digital recorder and test it.
4. Explain the participant’s consent
5. Give the consent form to sign
6. Start the interview
Interview questions
1. How long have you been a Dean?
2. Have you ever been a department chair?
3. Please tell me about the process of appointing a new department chair.
4. What kinds of formal or informal orientation do you provide to new department chairs?
5. Is there a typical term of department chair in your college? In your opinion, what should that
term be?
6. How often do you evaluate department chairs in your college?
7. Describe the evaluation process of department chairs in your college:
Probing questions:
Are there specific criteria in the evaluation?
What are the most important tasks on which you evaluate department chairs?
Are you satisfied with the outcome of your evaluation?
8. Do you have a rubric for evaluating department chair? May I have a copy of the rubrics?
Appendix C

9. What are the specific qualities or personalities or talents that you seek in department chairs?
10. What are your performance expectations for department chairs?
11. What scholarly expectations do you have for department chairs?
12. How do you provide performance expectations to department chairs prior to the time they
assume the position as chairs? (Verbally, in writing, or did not provide any)
13. Under what circumstances do you send chairs to department chair or leadership workshops?
14. What do you perceive as the biggest challenges that department chair face?
15. How do you support department chairs in their research and teaching agenda?
16. How have your expectations of department chairs changed over time?
17. Can you describe the reward or salary structure for department chairs?
18. What demands do you perceive are placed on the department chairs from other internal
sources?
19. What are the limits of department chairs’ authority?
20. In what ways do you think your department chairs encourage the faculty and staff to
improve their departments? (or, do you think they have not done it?)
21. What is the gender and racial composition of the college? Are there ‘tensions’ due to gender
or racial composition? How can ISU close the gender gap?
22. What are policy recommendations for the university?
23. What are the academic paths of ISU department chairs? In other words, what academic
patterns predict service as a chair?
24. Who do new department chairs turn to when seeking mentoring, advice, or just answers to
administrative questions?
25. Is there anything more you would like to share? Is there anything that you think I should ask
you?
Thank you for your participation