idaho traffic crashes 2015apps.itd.idaho.gov/apps/ohs/crash/15/analysis2015final.pdf · idaho...
TRANSCRIPT

Idaho Traffic Crashes
2015
Idaho Transportation Department Office of Highway Safety

IDAHOTRAFFICCRASHES
2015
PreparedbytheIdahoOfficeofHighwaySafety
IDAHOTRANSPORTATIONDEPARTMENTP.O.Box7129
Boise,Idaho83707‐1129(208)334‐8100
IdahoHighwaySafetyWebAddress:http://www.itd.idaho.gov/ohs

-i-
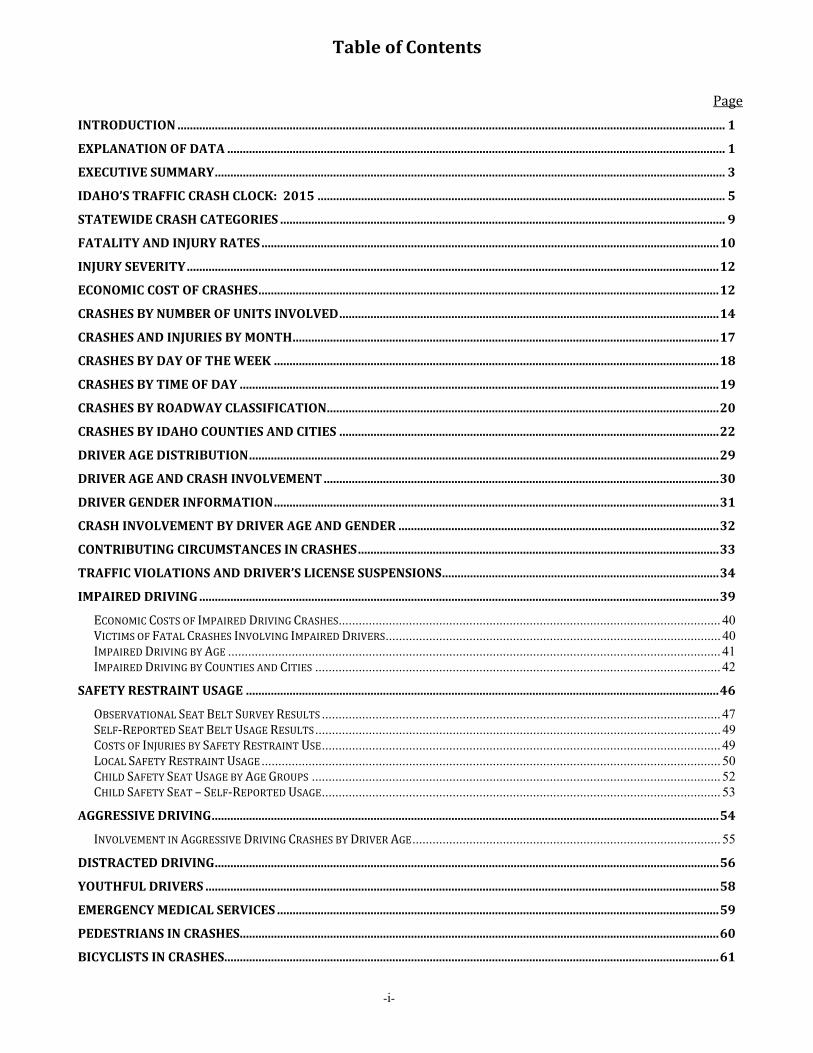
TableofContents Page
INTRODUCTION................................................................................................................................................................................1
EXPLANATIONOFDATA................................................................................................................................................................1
EXECUTIVESUMMARY....................................................................................................................................................................3
IDAHO’STRAFFICCRASHCLOCK:2015...................................................................................................................................5
STATEWIDECRASHCATEGORIES...............................................................................................................................................9
FATALITYANDINJURYRATES...................................................................................................................................................10
INJURYSEVERITY...........................................................................................................................................................................12
ECONOMICCOSTOFCRASHES....................................................................................................................................................12
CRASHESBYNUMBEROFUNITSINVOLVED..........................................................................................................................14
CRASHESANDINJURIESBYMONTH.........................................................................................................................................17
CRASHESBYDAYOFTHEWEEK...............................................................................................................................................18
CRASHESBYTIMEOFDAY..........................................................................................................................................................19
CRASHESBYROADWAYCLASSIFICATION..............................................................................................................................20
CRASHESBYIDAHOCOUNTIESANDCITIES..........................................................................................................................22
DRIVERAGEDISTRIBUTION.......................................................................................................................................................29
DRIVERAGEANDCRASHINVOLVEMENT...............................................................................................................................30
DRIVERGENDERINFORMATION...............................................................................................................................................31
CRASHINVOLVEMENTBYDRIVERAGEANDGENDER.......................................................................................................32
CONTRIBUTINGCIRCUMSTANCESINCRASHES....................................................................................................................33
TRAFFICVIOLATIONSANDDRIVER’SLICENSESUSPENSIONS.........................................................................................34
IMPAIREDDRIVING.......................................................................................................................................................................39
ECONOMICCOSTSOFIMPAIREDDRIVINGCRASHES .................................................................................................................. 40 VICTIMSOFFATALCRASHESINVOLVINGIMPAIREDDRIVERS .................................................................................................... 40 IMPAIREDDRIVINGBYAGE ................................................................................................................................................... 41 IMPAIREDDRIVINGBYCOUNTIESANDCITIES ......................................................................................................................... 42
SAFETYRESTRAINTUSAGE........................................................................................................................................................46
OBSERVATIONALSEATBELTSURVEYRESULTS ....................................................................................................................... 47 SELF‐REPORTEDSEATBELTUSAGERESULTS ......................................................................................................................... 49 COSTSOFINJURIESBYSAFETYRESTRAINTUSE ....................................................................................................................... 49 LOCALSAFETYRESTRAINTUSAGE ......................................................................................................................................... 50 CHILDSAFETYSEATUSAGEBYAGEGROUPS .......................................................................................................................... 52 CHILDSAFETYSEAT–SELF‐REPORTEDUSAGE ....................................................................................................................... 53
AGGRESSIVEDRIVING...................................................................................................................................................................54
INVOLVEMENTINAGGRESSIVEDRIVINGCRASHESBYDRIVERAGE ............................................................................................ 55
DISTRACTEDDRIVING..................................................................................................................................................................56
YOUTHFULDRIVERS.....................................................................................................................................................................58
EMERGENCYMEDICALSERVICES..............................................................................................................................................59
PEDESTRIANSINCRASHES..........................................................................................................................................................60
BICYCLISTSINCRASHES...............................................................................................................................................................61

-ii-
MOTORCYCLISTSINCRASHES....................................................................................................................................................62
COMMERCIALMOTORVEHICLESINCRASHES......................................................................................................................63
MOTORVEHICLECRASHESINWORKZONES........................................................................................................................67
GLOSSARYOFTERMS....................................................................................................................................................................69
REFERENCESANDNOTES............................................................................................................................................................71
APPENDIXA:MAPSOFFATALCRASHLOCATIONSIN2015............................................................................................73
APPENDIXB:MAPSOFCRASHESWITHWILDANIMALSIN2015..................................................................................85
APPENDIXC:STATEHIGHWAYSYSTEMCRASHDATA.....................................................................................................89
APPENDIXD:FIVE‐YEARCRASHHISTORY..........................................................................................................................109
APPENDIXE:25YEARHISTORY............................................................................................................................................115

-1-
IntroductionIdaho Traffic Crashes 2015 provides an annual description of motor vehicle crash characteristics forcrashesthathaveoccurredonpublicroadswithintheStateofIdaho.Thisdocumentisusedbystateandlocal transportation, law enforcement, health, and other agencies charged with the responsibility ofcoping with the increasing costs of traffic crashes. Agencies use the data to identify traffic safetyproblemsandtargetareasforthedevelopmentofcrashreductionandinjurypreventionprograms.Atrafficsafetyproblemisanidentifiablesubgroupofdrivers,pedestrians,vehicles,orroadwaysthatisstatistically higher in crash experience than normal expectations. Problem identification involves thestudyofrelationshipsbetweencrashesandthepopulation,licenseddrivers,registeredvehicles,vehiclemilestraveled,andcharacteristicsofspecificsubgroupsthatmaycontributetocrashes.This document is divided into two major sections: a statewide crash summary and a breakdown ofcrashes by identified problem areas. Maps displaying the approximate location of each fatal crash bytransportationdistrictarefoundinAppendixA.Preciselocationsoffatalcrashescannotbedeterminedfromthemaps.AppendixBisamapofcrasheswithwildanimals.InformationregardingcrashesontheStateHighwaySystemisavailableinAppendixC.Afive‐yearfatalandinjurycrashhistoryiscontainedinthreetablesinAppendixD.Atwenty‐fiveyearhistoryoffatalitiesandthefatalityrateper100millionannualvehiclemilestraveledisprovidedinAppendixE.IdahoTrafficCrashes2015isorganizedtoreflecttheadoptionoffocusareasbytheIdahoTrafficSafetyCommissionfortheHighwaySafetyGrantPrograms.Thefocusareasinclude: ImpairedDriving,SafetyRestraintUsage, YouthfulDrivers,AggressiveDriving,DistractedDriving, EmergencyMedical Services,Pedestrians,Bicyclists,andMotorcyclists.ThesefocusareasalignwithIdaho’sStrategicHighwaySafetyPlan.ExplanationofDataThesourceforcrashinformationistheIdahoTransportationDepartmentStatewideCrashDatabase.Thedatabase consists of crash reports completed by all law enforcement agencies in Idaho. All lawenforcement agencies use a standard crash reporting software program to enter the data andelectronically submit thedata to theDepartment, asdesignated in IdahoCode49‐1307. The resultingnumbersareconservativesince thedatabaseconsistsofonlycrashes investigatedby lawenforcementofficers.Priorto2006,onlycrashesresultingininjuryordeathofanyperson,ordamagetothepropertyofanyonepersoninexcessof$750wereincluded.Thelawwasamendedin2006tocrashesresultinginexcess of $1,500 property damage to any one person. Crashes resulting in injury or death remainedunchanged. Crashesthatareexcludedincludethosethatdonotoccuronapublicroadway,occuronaroadwayonprivateproperty,orareintentionalacts.Whenexamining anyof the statisticsherein, it is important todistinguishbetween the threedifferentlevelsofcrashdata:thecrashlevel,theunitlevel,andthepersonlevel.Forexample,location,date,time,severity, and weather conditions are specific to the entire crash; vehicle type, extent of deformity,contributing circumstances, and events are specific to each unit in the crash; and lastly, age, gender,injurytype,andprotectivedeviceusearespecifictoeachpersoninvolvedinthecrash.Eachcrashmustinvolveatleastonemotorvehicleandeachmotorvehiclecontainsanynumberofpeople,includingzero.Eachcrashisclassifiedbythemostsevereinjurythatresultedfromthecrash.Therefore,eachfatalcrashresultedinat leastonefatalitybutmayhavealsoproducedanynumberandcombinationofadditionalfatalitiesandinjuries.The Division of Motor Vehicles and the Economics and Research Section (Idaho TransportationDepartment) provide information on licensed drivers, registered motor vehicles, driver’s licensesuspensions, and driver’s license convictions. The Traffic Survey Section (Idaho Transportation

-2-
Department)provides theannualvehiclemilesof travel. TheBureauofCriminal Identification (IdahoStatePolice)providesinformationregardingDUIarrests.Othersourcesofinformationthatsupportthisdocumentarereferenced.Currentyeardataiscomparedtodatafromtheprioryeartoidentifysimplepercentagechangeseitherupwardordownward. Theaveragechangeover theprior fouryears isgiven toprovideanadditionalperspective.If you have any questions or suggestions concerning IdahoTraffic Crashes 2015, contact the Office ofHighwaySafety.Contactinformationisavailableonthetitlepageatthefrontofthisdocument.

-3-
ExecutiveSummaryAsummaryoffindingsfor2015arelistedbelow: The number ofmotor vehicle crashes increased by 8.5 percent, from 22,134 in 2014 to
24,018 in2015. Thenumberof fatalities resulting frommotorvehicle crashes increasedfrom186 in 2014 to 216 in 2015, a 16.1 percent increase. The number of fatal crashesincreasedfrom175in2014to198in2015.Thenumberofseriousinjuriesincreasedfrom1,273 in 2014 to 1,351 in 2015, a 6.1 percent increase. Although, the numbers of fatalcrashesandfatalitieswerevirtuallythesameastheywerein2013.
Idaho’sfatalityrateper100millionvehiclemilestraveledwas1.30in2015,upfrom1.15in
2014.
While64percentofallmotorvehiclecrashesoccurredonurbanroadways,78percentofthefatalmotorvehiclecrashesoccurredonruralroadwaysin2015.
Fatalitiesresultingfromimpaireddrivingcrashesincreasedin2015by20.8percentand40
percentofallfatalitiesresultedfromimpaireddriving.Ofthe87peoplekilledinimpaireddrivingcrashes,77(89percent)wereeitherthe impaireddriver,apersonridingwithanimpaireddriver,oranimpairedpedestrian.
Idaho’sobservedseatbeltuseincreasedslightlyto81percentin2015.Whiletheobserved
ratewas81percent,only38percentofthemotorvehicleoccupantskilledincrasheswerewearingseatbelts. Ifeveryonehadbeenwearingseatbelts,47ofthe93unbeltedmotorvehicleoccupantsmayhavebeensaved.
Aggressivedrivingwasacontributingfactorin52percentofthemotorvehiclecrashesand
77peoplewerekilledinaggressivedrivingcrashesin2015.
Distracteddrivingwasafactorin23percentofthemotorvehiclecrashesin2015and51peoplewerekilledindistracteddrivingcrashes.
Youthfuldrivers,ages15to19,continuetobeover‐involvedinmotorvehiclecrashes. In
2015,youthfuldriverswere2.6timesaslikelyasallotherdriverstobeinvolvedinafatalorinjurycrash.Therewere34peoplekilledincrashesinvolvingyouthfuldriversin2015.
The number of motorcyclists killed in motor vehicle crashes increased to 28 in 2015.Almost two‐thirds (64 percent) of fatal motorcycle crashes in 2015 involved just themotorcycle,whileoverhalf(54percent)of fatalmotorcyclecrashesinvolvedanimpaireddriver.
Fatalcrashesinvolvingcommercialmotorvehiclesincreasedfrom22in2014to30in2015.
Thenumberofinjurycrashesinvolvingcommercialmotorvehiclesincreasedby9percent.Therewere34peoplekilledand872peopleinjuredincommercialmotorvehiclecrashesin2015.

-4-

-5-
Idaho’sTrafficCrashClock:2015
ATrafficCrashoccurredevery21.9Minutes
APersonwasInjuredinatrafficcrashevery39.8
Minutes
APersonwasKilledinatrafficcrashevery40.6
Hours
APersonwasKilledinanImpaired
Drivingcrashevery4.2Days
AMotorcyclistwasInjuredinatrafficcrash
every16.5Hours
AnUnbeltedpassengermotorvehicleoccupantwasKilledevery
4.0Days
ABicyclistwasInjuredinatrafficcrash
every30.7Hours
APersonwasKilledinanAggressiveDrivingcrashevery4.7Days
APedestrianwasInjuredinatrafficcrash
every39.8Hours

-6-

-7-
SECTION I GENERALCRASHINFORMATION

-8-

-9-
StatewideCrashCategoriesTable1comparesmajorcrashcategoriesandmeasuresofexposure for2011 through2015. The totalnumberoftrafficcrashesin2015increasedby8.5%from2014.Fatalcrashesincreasedby13.1%,andinjurycrashesincreasedby10.1%.Totalfatalitiesincreasedby16.1%fromthepreviousyear,whilethenumberofinjuriesincreasedby12.2%.Thenumberofpropertydamagecrashesincreasedby7.5%.
Change Avg. Change
2011 2012 2013 2014 2015 2014‐2015 2011‐2014
Tota l Crashes 20,833 21,402 22,348 22,134 24,018 8.5% 2.1%
Fata l Crashes 152 169 200 175 198 13.1% 5.7%
Persons Ki l led (Fata l i ties ) 167 184 214 186 216 16.1% 4.5%
Injury Crashes 7,492 7,630 7,850 8,217 9,050 10.1% 3.1%
Persons Injured 10,866 10,988 11,344 11,768 13,207 12.2% 2.7%
Property‐Damage‐Only
Crashes ( >$1,500 after 2005) 13,189 13,603 14,298 13,742 14,770 7.5% 1.5%
Idaho Population (thousands) 1,585 1,596 1,612 1,634 1,655 1.3% 1.0%
Licensed Drivers (thousands) 1,084 1,093 1,111 1,128 1,144 1.4% 1.8%
Vehicle Miles of Travel (mi l l ions ) 15,416 15,838 15,877 16,145 16,662 3.2% 1.6%
Urban VMT (mi l l ions) 6,462 6,638 6,650 6,764 7,124 5.3% 1.5%
Rura l VMT (mi l l ions) 8,954 9,200 9,227 9,381 9,537 1.7% 1.6%
Regis tered Vehicles (thousands ) 1,417 1,555 1,445 1,480 1,489 0.6% 1.7%
Table 1
Idaho Traffic Crash Data and Measures of Exposure: 2011‐2015
Therewere23morefatalcrashes in2015thanin2014,and30morepeoplekilled. Most(182)of thefatalcrashes(91.9%)resultedinjustonefatality;therewere14fatalcrashes(7.1%)thatresultedintwofatalitiesan2fatalcrashesresultinginthreefatalitiesin2015.Changesinthenumberofcrashescanoftenbecorrelatedwithchangesinstatepopulation,thenumberofdrivers, number of registered vehicles, and the statewide Annual VehicleMiles of Travel (AVMT). In2015, the number of licensed drivers increased by 1.4% and the population grew by 1.3%, and thenumberofregisteredmotorvehiclesincreasedby0.6%.The statewide AVMT increased by 3.2% in 2015. Commercial vehicles accounted for 18% of thestatewideAVMTin2015.

-10-
FatalityandInjuryRatesTable2showsthefatalityandinjuryratesfor2011‐2015.
Change Avg. Change
2011 2012 2013 2014 2015 2014‐2015 2011‐2014
Fata l i ty Rate 1.08 1.16 1.35 1.15 1.30 12.5% 2.9%
Injury Rate 70.48 69.38 71.45 72.89 79.26 8.7% 1.1%
Table 2
Fatality and Injury Rates per 100 Million AVMT: 2011‐2015
Figures1and2illustratefatalityandinjuryratesper100millionAVMTfortheU.S.andIdaho.
Figure1FatalityRatesper100MillionAnnualVehicleMilesofTravel
ForIdahoandtheU.S.:2006‐2015
1.75
1.591.52
1.46
1.34
1.081.16
1.35
1.15
1.301.42
1.36
1.26
1.151.11 1.10
1.141.09 1.08
1.12
0.00
0.50
1.00
1.50
2.00
2006 2007 2008 2009 2010 2011 2012 2013 2014 2015
Idaho
U.S.*
*Source:EarlyEstimateofMotorVehicleTrafficFatalitiesin2015

-11-
Figure2InjuryRatesper100MillionAnnualVehicleMilesofTravel:2006‐2015
91.4
85.8
78.5
73.875.4
70.569.4
71.5
72.9
79.3
85
82
79
75 75 75
80
77 77
60.0
65.0
70.0
75.0
80.0
85.0
90.0
95.0
2006 2007 2008 2009 2010 2011 2012 2013 2014 2015
Idaho U.S. *
*Sources:2014MotorVehicle CrashDatafromFARSandGES
The2015U.S.injuryrateswerenotavailableatthetimeofpublication.Fatalityandinjuryrateshavevariedoverthepastdecade,buthavegenerallydecreased.Factorssuchasvehiclesafetyfeatures,limitedaccesshighways,engineeringimprovements,occupantrestraintusage,demographicchangesandreductionindrivingundertheinfluencetendtoreducefatalitiesandinjuries.IncreasesinAVMT,licenseddrivers,registeredvehicles,changesinreporting,andhigheraveragespeedstendtoincreasethenumberoffatalitiesandinjuries.

-12-
InjurySeverityTable 3 presents the injury distribution among persons involved in crashes from2011 through 2015.Thenumberoffatalitiesincreasedto216in2015.
Change Avg. Change
2011 2012 2013 2014 2015 2014‐2015 2011‐2014
Fata l i ties 167 184 214 186 216 16.1% 4.5%
Serious Injuries 1,293 1,287 1,262 1,273 1,351 6.1% ‐0.5%
Vis ible Injuries 3,354 3,428 3,549 3,689 4,146 12.4% 3.2%
Poss ible Injuries 6,219 6,273 6,533 6,806 7,710 13.3% 3.1%
No Injuries 40,920 42,620 44,051 42,993 46,642 8.5% 1.7%
Unknown / Miss ing 706 333 344 392 519 32.4% ‐11.9%
Total Persons in Crashes 53,899 54,125 55,952 55,339 60,584 9.5% 0.9%
Table 3
Injury Severity of Persons Involved in Traffic Crashes: 2011‐2015
In2015,therewere6seriousinjuriesforeverypersonkilledinmotorvehiclecrashes.Onaverage,fourpeoplewerekilledorseriouslyinjuredeverydayin2015.Therewas1personkilledevery41hoursand1personinjuredevery40minutes.EconomicCostofCrashesTable4givesestimatedeconomiccostsforIdahomotorvehiclecrashesin2015. Thecostestimateforpreventinga fatalitywasrevisedby theFederalHighwayAdministration(FHWA)1 in June2014. EachinjurytypecostwasdeterminedusingAIStoKABCOconversionscalesintheTIGERBenefitCostAnalysisResourceGuide. Thiswasasubstantial increaseover thepreviouscostestimateadjusted for inflation.The2015costshavebeenadjustedforinflationusingtheGrossDomesticProductImplicitPriceDeflator.TheestimatedcostofIdahocrashesin2015wasover$3.8billion.
Incident Description Total Occurrences Cost Per Occurrence Cost Per Category
Fata l i ties 216 $9,498,816 $2,051,744,290
Serious Injuries 1,351 $454,281 $613,733,858
Vis ible Injuries 4,146 $123,732 $512,992,309
Poss ible Injuries 7,710 $63,181 $487,129,139
No Injuries 46,642 $3,201 $149,288,033
Total Estimate of Economic Cost $3,814,887,629
Table 4
Economic Cost of Idaho Crashes: 2015 Estimates
Thecostoftrafficcrashesin2015amountsto$2,305foreverypersoninIdaho.

-13-
InadditiontotheFHWA’sstudy,theNationalHighwayTrafficSafetyAdministration(NHTSA)alsodidastudyonthecostsofcrashes.TheNHTSAstudynotonlyconcentratedonthecostsofcrashes,butalsowhopaysthecosts.Table5isacombinationofTable14‐3andTable14‐4fromtheNHTSAstudy,“TheEconomic and Societal Impact of Motor Vehicle Crashes, 2010”2 and shows the source of paymentdistribution of crash costs for each component of the costs. The total percentage for each source ofpaymentisalsoincludedatthebottom.
Unspecified Total Privite
Federal State Government Government Insurer Other Self Total
Medical 17.54% 5.56% 8.50% 31.60% 56.10% 1.20% 11.10% 100.00%
Emergency Service 0.00% 100.00% 0.00% 100.00% 0.00% 0.00% 0.00% 100.00%
Market Productivi ty 10.44% 6.18% 0.00% 16.62% 35.95% 7.98% 39.45% 100.00%
Household Productivi ty 0.00% 0.00% 0.00% 0.00% 33.14% 0.00% 66.86% 100.00%
Insurance Adminis tration 0.89% 0.51% 0.00% 1.40% 98.60% 0.00% 0.00% 100.00%
Workplace Costs 0.00% 0.00% 0.00% 0.00% 0.00% 100.00% 0.00% 100.00%
Legal / Court 0.00% 0.00% 0.00% 0.00% 100.00% 0.00% 0.00% 100.00%
Travel Delay 0.00% 0.00% 0.00% 0.00% 0.00% 100.00% 0.00% 100.00%
Property Damage 0.00% 0.00% 0.00% 0.00% 70.31% 0.00% 29.69% 100.00%
Percentage of Total Costs 4.94% 2.70% 1.07% 8.71% 52.19% 13.94% 25.16% 100.00%
Table 5
Estimated Source of Payment for Each Motor Vehicle Crash Cost Component2
Themostsignificantpointfromtheabovetableisthatsocietyatlargepicksupnearly75%ofallcrashcostsincurredbyindividualmotorvehiclecrashvictims.Thesecostsarepassedontothegeneralpublicthroughinsurancepremiums,taxes,directout‐of‐pocketpaymentsforgoodsandservices,andincreasedchargesformedicalcare.2

-14-
CrashesbyNumberofUnitsInvolvedWhile crashes involvinga singlevehicleoccur less frequently thancrashes involvingmultiplevehicles,theresultinginjuriesareoftenmoresevere.Single‐vehiclecrasheswere3.1timesaslikelytoresultinafatality asmultiple‐vehicle crasheswere in 2015. Table 6 shows the number of crashes and injuriesinvolving both single and multiple vehicles by the severity of the crash and injury. Multiple‐vehiclecrashesincludecrashesbetweenmorethanonemotorizedvehicleandcrashesbetweenamotorvehicleandapedestrian,bicyclist,train,orequestrian.
Type of Crash Crashes Injuries Crashes Injuries
Fata l 113 122 85 94
Serious Injury 408 489 663 862
Vis ible Injury 958 1,207 2,154 2,939
Poss ible Injury 1,164 1,633 3,703 6,077
Property Damage 4,580 10,190
Total 7,223 3,451 16,795 9,972
Table 6
Crashes and Injuries by Number of Vehicles Involved: 2015
Single Vehicle Multiple Vehicles
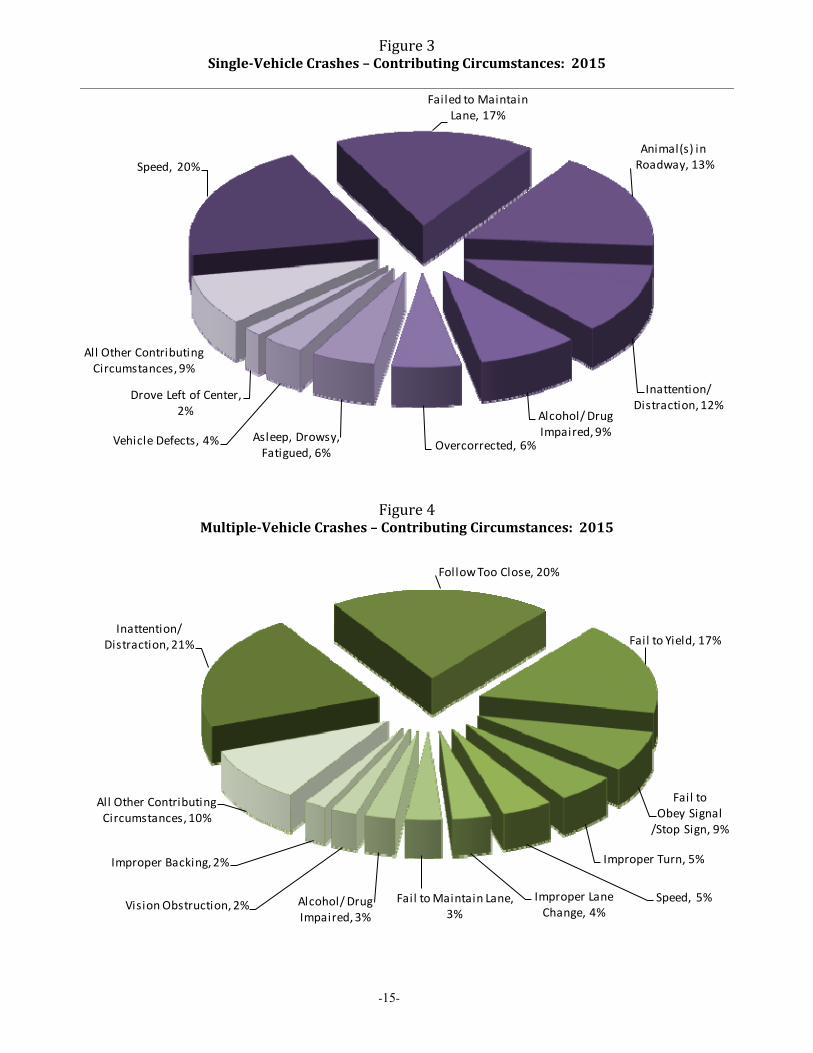
In2015, single‐vehicle crashes representedonly30%of all crashes, yet accounted for57%of all fatalcrashes.Ofthe113fatalsingle‐vehiclecrashes,95(84%)occurredonruralroadways.Ofthe85multiple‐vehiclefatalcrashes,8involvedapedestrianand3involvedatrain,andtheother74(87%) involved two or more motor vehicles. Of the 85 fatal multiple‐vehicle crashes, 60 (or 71%)occurredonruralroadways.Figures2and3,onthefollowingpage,showthemostprevalentcontributingcircumstances forsingle‐and multiple‐vehicle crashes. The “all other contributing circumstances” category combines theremaining contributing circumstances, i.e., contributing circumstanceswith percentages less than 2%.Contributing circumstances of none, not applicable and unknownwere excluded from the total in thepercentagecalculation.Speedplayedthebiggestroleinsingle‐vehiclecrashes,contributingto20%ofsingle‐vehiclecrashes.FailuretoMaintainLanecontributedto17%ofsingle‐vehiclecrashesandaswellascontributingto3%ofmultiplevehiclecrashes.Animal(s)inRoadwaywasthethirdmostprevalentcontributingcircumstanceforsingle‐vehiclecrashesat13%.Inattention/distractionwasthemostprevalentcontributingcircumstanceformultiplevehiclecrashesandthefourthmostprevalentforsingle‐vehiclecrashes.Inattention/distractioncontributedtomorethan1outofevery5multiplevehiclecrashesandalmost1outofevery8singlevehiclecrashes.Followingtooclosewasthesecondmostprevalentcontributingcircumstanceformultiplevehiclecrashes,contributingto1outofevery5multiplevehiclecrashes.Impaireddrivingcontributedto9%ofsinglevehiclecrashesand3%ofmultiplevehiclecrashes.
-15-
Figure3Single‐VehicleCrashes–ContributingCircumstances:2015
Speed, 20%
Failed to Maintain Lane, 17%
Animal(s) inRoadway, 13%
Inattention/ Distraction, 12%
Alcohol/ Drug Impaired, 9%
Overcorrected, 6%Asleep, Drowsy, Fatigued, 6%
Vehicle Defects, 4%
Drove Left of Center, 2%
All Other Contributing Circumstances, 9%
Figure4Multiple‐VehicleCrashes–ContributingCircumstances:2015
Inattention/ Distraction, 21%
Follow Too Close, 20%
Fail to Yield, 17%
Fail to Obey Signal/Stop Sign, 9%
Improper Turn, 5%
Speed, 5%Improper Lane Change, 4%
Fail to Maintain Lane, 3%
Alcohol/ Drug Impaired, 3%
Vision Obstruction, 2%
Improper Backing, 2%
All Other Contributing Circumstances, 10%

-16-
Table7showsthemostharmfuleventsforfatalsingle‐andmultiple‐vehiclecrashes.
Single‐Vehicle Crashes Multiple‐Vehicle Crashes*
Overturn (69.9%) Angle (24.0%)
Tree (8.8%) Head On (19.1%)
Immers ion (4.4%) Head On ‐ Turning (9.8%)
Embankment (2.7%) Pedestrian (7.7%)
Uti l i ty Pole / Light Support (2.7%) Angle ‐ Turning (6.0%)
Ditch (1.8%) Rear‐End (6.0%)
Overpass (1.8%) Overturn (4.4%)
Bridge/Pier Abutment (0.9%) Side Swiped ‐ Same Direction (4.4%)
Bui lding/Wal l (0.9%) Side Swiped Oppos i te (3.8%)
Concrete Traffic Barrier (0.9%) Rai l road Train (3.3%)
Fel l / Pushed / Jumped (0.9%) Other Object Not Fixed (2.2%)
Fence (0.9%) Parked Car (2.2%)
Fire / Explos ion (0.9%) Animal ‐ Wild (1.1%)
Guardra i l Face (0.9%) Fire / Explos ion (1.1%)
Other Fixed Object (0.9%) Jackni fed (1.1%)
Other Post, Pole or Support (0.9%) Same Direction ‐ Turning (1.1%)
Cargo Loss / Shi ft (0.5%)
Concrete Traffic Barrier (0.5%)
Non‐Contact Unit (0.5%)
Other (0.5%)
Struck by Fal l ing/Shi fting Cargo (0.5%)
*The percentages represent the number of vehicles the most harmful event was attributed to. Multiple units
involved in a s ingle crash may not have the same most harmful event. In 2013, there were 213 uni ts involved in
the 92 fata l multiple vehicle crashes .
Table 7
Most Harmful Events for Fatal Crashes Involving Single and Multiple Vehicles: 2015
Overturn was the leadingmost harmful event for fatal single‐vehicle crashes. Single‐vehicle rolloversaccountedfor70%ofthesinglevehiclefatalitiesand39%ofallfatalitiesin2015.Ofthe62passengermotorvehicleoccupantskilledinsingle‐vehiclerollovers,18(or29%)werewearingseatbeltsorwereinachildsafetyseat.Ofthe43passengermotorvehicleoccupantswhowerekilledinsingle‐vehiclerolloversandnotwearingaseatbelt,38(or88%)were totallyorpartiallyejected fromtheirvehicle.Seatbelts are estimated tobemore effective inpreventing fatalities in rollover crashes. Seatbeltusereduces fatalitiesby74% in rollover crashes involvingpassenger cars andby80% in rollover crashesinvolving light trucks3. By these estimates, 32 of the 43 unbelted passengermotor vehicle occupantskilledinrollovercrashesmayhavesurvivediftheyhadbeenwearingtheirseatbelt.

-17-
CrashesandInjuriesbyMonthTable8showsthenumberofcrashesandinjuriesbyseverityforeachmonth.
Fatal Injury Total Fatal Serious Visible Possible
Crashes Crashes Crashes Injuries Injuries Injuries Injuries
January 6 634 1,899 6 83 270 551
February 9 540 1,405 10 66 235 491
March 15 649 1,640 18 106 280 592
Apri l 9 708 1,736 10 80 312 639
May 16 700 1,773 17 126 344 566
June 27 810 1,963 28 153 404 632
July 29 829 2,045 31 145 401 677
August 21 802 2,027 22 137 443 638
September 20 925 2,272 24 150 398 791
October 18 783 2,187 20 105 351 622
November 15 760 2,216 16 108 304 687
December 13 910 2,855 14 92 404 824
Totals 198 9,050 24,018 216 1,351 4,146 7,710
Table 8
Severity of Crashes and Type of Injury by Month: 2015
In2015,JuneandJulyhadthehighestnumberoffatalcrashes.SeptemberandDecemberhadthehighestnumber of total crashes. Crashes occurring in thewintermonths aremore likely to be attributed tosevereweathersuchasiceandsnow;however,thesecrashestendtobelesssevereaspeoplegenerallyslowdownandaremorecautiouswhendrivinginadverseweatherconditions.

-18-
CrashesbyDayoftheWeekFigures5and6showthenumberoffatalandtotalcrashesbydayoftheweek.
Figure5FatalCrashesbyDayoftheWeek:2015
0
5
10
15
20
25
30
35
40
45
Monday Tuesday Wednesday Thursday Friday Saturday Sunday
18
28
21 21
32
39 39
Figure6
TotalCrashesbyDayoftheWeek:2015
0
500
1000
1500
2000
2500
3000
3500
4000
4500
5000
Monday Tuesday Wednesday Thursday Friday Saturday Sunday
3,611 3,6143,888
3,736
4,073
2,999
2,097

-19-
CrashesbyTimeofDayFigures7and8showthenumberoffatalandtotalcrashesbythetimeofday.
Figure7FatalCrashesbyTimeofDay:2015
0
2
4
6
8
10
12
14
16
18
Figure8TotalCrashesbyTimeofDay:2015
0
500
1000
1500
2000
2500
-20-
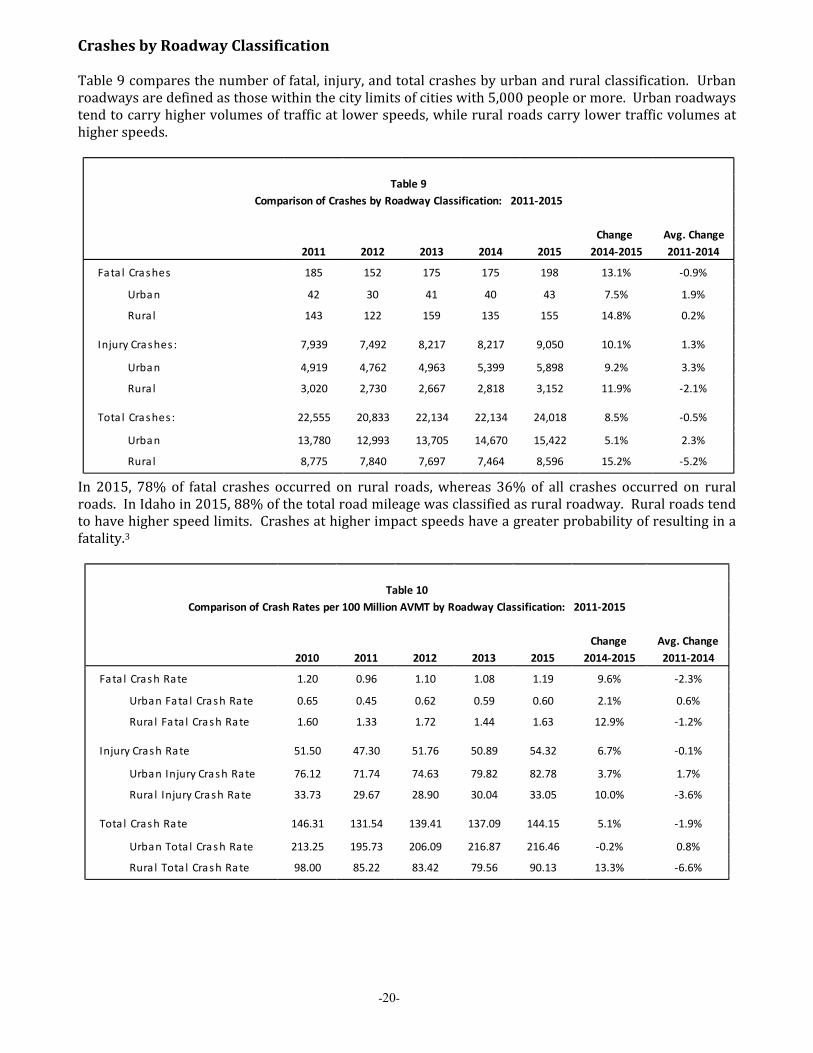
CrashesbyRoadwayClassificationTable9comparesthenumberoffatal,injury,andtotalcrashesbyurbanandruralclassification.Urbanroadwaysaredefinedasthosewithinthecitylimitsofcitieswith5,000peopleormore.Urbanroadwaystendtocarryhighervolumesoftrafficatlowerspeeds,whileruralroadscarrylowertrafficvolumesathigherspeeds.
Change Avg. Change
2011 2012 2013 2014 2015 2014‐2015 2011‐2014
Fata l Crashes 185 152 175 175 198 13.1% ‐0.9%
Urban 42 30 41 40 43 7.5% 1.9%
Rural 143 122 159 135 155 14.8% 0.2%
Injury Crashes : 7,939 7,492 8,217 8,217 9,050 10.1% 1.3%
Urban 4,919 4,762 4,963 5,399 5,898 9.2% 3.3%
Rural 3,020 2,730 2,667 2,818 3,152 11.9% ‐2.1%
Tota l Crashes : 22,555 20,833 22,134 22,134 24,018 8.5% ‐0.5%
Urban 13,780 12,993 13,705 14,670 15,422 5.1% 2.3%
Rural 8,775 7,840 7,697 7,464 8,596 15.2% ‐5.2%
Table 9
Comparison of Crashes by Roadway Classification: 2011‐2015
In 2015, 78%of fatal crashes occurred on rural roads,whereas 36%of all crashes occurred on ruralroads.InIdahoin2015,88%ofthetotalroadmileagewasclassifiedasruralroadway.Ruralroadstendtohavehigherspeedlimits.Crashesathigherimpactspeedshaveagreaterprobabilityofresultinginafatality.3
Change Avg. Change
2010 2011 2012 2013 2015 2014‐2015 2011‐2014
Fata l Crash Rate 1.20 0.96 1.10 1.08 1.19 9.6% ‐2.3%
Urban Fata l Crash Rate 0.65 0.45 0.62 0.59 0.60 2.1% 0.6%
Rura l Fata l Crash Rate 1.60 1.33 1.72 1.44 1.63 12.9% ‐1.2%
Injury Crash Rate 51.50 47.30 51.76 50.89 54.32 6.7% ‐0.1%
Urban Injury Crash Rate 76.12 71.74 74.63 79.82 82.78 3.7% 1.7%
Rura l Injury Crash Rate 33.73 29.67 28.90 30.04 33.05 10.0% ‐3.6%
Tota l Crash Rate 146.31 131.54 139.41 137.09 144.15 5.1% ‐1.9%
Urban Tota l Crash Rate 213.25 195.73 206.09 216.87 216.46 ‐0.2% 0.8%
Rura l Tota l Crash Rate 98.00 85.22 83.42 79.56 90.13 13.3% ‐6.6%
Table 10
Comparison of Crash Rates per 100 Million AVMT by Roadway Classification: 2011‐2015

-21-
Table 11 shows the number of crashes and crash rates on local and state system roadways (bothinterstate and non‐interstate) for 2011‐2015, and the number of crashes and crash rates statewide.Crash rates are lower than the statewide fatality and injury rates shown in Table 2 becausemultiplefatalitiesorinjuriesmayresultfromasinglecrash.
Change Avg. Change
Roadway Information 2011 2012 2013 2014 2015 2014‐2015 2011‐2014
Local Roads:
VMT (100 mil l ions) 71.1 74.0 73.5 74.5 75.8 1.8% 1.6%
Fata l Crashes 72 74 85 75 81 8.0% 2.0%
Injury Crashes 4,272 4,491 4,603 4,819 5,208 8.1% 4.1%
Tota l Crashes 12,011 12,606 13,499 13,852 14,498 4.7% 4.9%
Fata l Crash Rate 1.0 1.0 1.2 1.0 1.1 6.1% 0.5%
Injury Crash Rate 60.1 60.7 62.6 64.7 68.7 6.2% 2.5%
Tota l Crash Rate 169.0 170.3 183.6 185.9 191.2 2.9% 3.3%
U.S. and State Highways:
VMT (100 mil l ions) 48.2 48.4 48.8 49.5 51.1 3.2% 0.9%
Fata l Crashes 63 71 87 75 83 10.7% 7.1%
Injury Crashes 2,593 2,519 2,532 2,493 2,884 15.7% ‐1.3%
Tota l Crashes 6,897 6,882 6,807 6,603 7,619 15.4% ‐1.4%
Fata l Crash Rate 1.3 1.5 1.8 1.5 1.6 7.3% 6.3%
Injury Crash Rate 53.7 52.1 51.9 50.4 56.5 12.1% ‐2.1%
Tota l Crash Rate 143.0 142.2 139.5 133.4 149.2 11.8% ‐2.3%
Interstate Highways:
VMT (100 mil l ions) 34.8 36.0 36.5 37.4 39.7 6.1% 2.4%
Fata l Crashes 17 24 28 25 34 36.0% 15.7%
Injury Crashes 627 620 715 905 958 5.9% 13.6%
Tota l Crashes 1,925 1,914 2,041 1,679 1,901 13.2% ‐3.9%
Fata l Crash Rate 0.5 0.7 0.8 0.7 0.9 28.2% 12.9%
Injury Crash Rate 18.0 17.2 19.6 24.2 24.1 ‐0.2% 10.9%
Tota l Crash Rate 55.3 53.2 56.0 44.8 47.9 6.7% ‐6.1%
Statewide Totals:
VMT (100 mil l ions) 154.2 158.4 158.8 161.5 166.6 3.2% 1.6%
Fata l Crashes 152 169 200 175 198 13.1% 5.7%
Injury Crashes 7,492 7,630 7,850 8,217 9,050 10.1% 3.1%
Tota l Crashes 20,833 21,402 22,347 22,134 24,018 8.5% 2.1%
Fata l Crash Rate 1.0 1.1 1.3 1.1 1.2 9.6% 4.1%
Injury Crash Rate 48.6 48.2 49.4 50.9 54.3 6.7% 1.6%
Tota l Crash Rate 135.1 135.1 140.8 137.1 144.1 5.1% 0.5%
Table 11
Crash Rates for Local and State System Roadways: 2011‐2015

-22-
CrashesbyIdahoCountiesandCities
County 2013 2014 2015 2013 2014 2015 2013 2014 2015
Ada 16 15 22 2,363 2,463 2,730 6,111 6,286 6,650
Adams 3 0 4 11 15 12 28 19 19
Bannock 6 8 8 435 415 458 1,458 1,231 1,379
Bear Lake 2 1 0 28 27 30 110 92 107
Benewah 4 3 2 55 41 51 176 167 164
Bingham 9 9 16 192 180 205 632 527 625
Bla ine 3 1 0 63 52 73 223 249 259
Boise 4 4 8 43 45 51 108 106 123
Bonner 6 8 13 151 154 167 471 501 523
Bonnevi l le 5 10 3 430 485 516 1,390 1,351 1,426
Boundary 2 3 0 33 48 43 106 138 138
Butte 0 1 1 9 11 11 53 47 50
Camas 0 0 1 2 4 9 8 15 31
Canyon 20 19 22 1,001 1,116 1,353 2,676 2,830 3,147
Caribou 4 0 3 36 27 50 107 105 133
Cass ia 3 5 6 135 141 165 421 415 490
Clark 1 0 1 12 6 13 46 26 41
Clearwater 2 1 3 10 36 23 37 100 98
Custer 1 1 4 34 21 33 76 66 77
Elmore 10 2 9 164 132 137 346 283 332
Frankl in 3 6 2 54 56 50 113 122 134
Fremont 3 2 2 56 43 53 170 158 172
Gem 2 0 2 46 49 49 140 148 147
Gooding 10 4 3 84 84 72 210 196 183
Idaho 6 13 4 112 124 91 310 285 247
Jefferson 2 2 4 65 84 74 233 191 262
Jerome 7 5 7 143 157 169 399 390 442
Kootenai 11 6 8 745 815 814 2,132 2,151 2,258
Latah 9 5 1 153 165 159 496 525 493
Lemhi 4 4 2 35 50 54 127 111 121
Lewis 0 2 1 20 23 21 55 63 73
Lincoln 2 2 4 18 21 18 61 56 51
Madison 0 0 3 113 115 151 490 470 513
Minidoka 3 2 3 70 92 94 212 240 280
Nez Perce 9 5 4 223 213 196 781 692 695
Oneida 2 1 0 22 36 35 83 97 104
Owyhee 4 1 2 45 41 44 129 124 121
Payette 2 1 3 89 76 104 193 172 212
Power 3 3 3 61 63 61 165 158 160
Shoshone 3 3 3 68 61 68 206 159 187
Teton 0 0 0 24 19 18 63 53 93
Twin Fa l l s 7 11 11 318 323 412 742 729 923
Val ley 3 5 0 61 72 78 198 246 233
Washington 4 1 0 18 16 35 56 44 102
TOTALS 200 175 198 7,850 8,217 9,050 22,347 22,134 24,018
Table 12
Crash History of Idaho Counties: 2013‐2015
Fatal Crashes Injury Crashes Total Crashes

-23-
Table13showsfatal,injuryandtotalcrashesforIdahocitieswithpopulationsover2,000for2012‐2015by population groupings. Cities are grouped by population size. Population figures are from theU. S.CensusBureauestimatesforcitiesfor2015.
City by Population Size 2013 2014 2015 2013 2014 2015 2013 2014 2015
40,000 and over
Boise 9 6 10 1,417 1,481 1,588 3,608 3,683 3,817
Caldwel l 4 1 3 210 242 319 595 626 749
Coeur d'Alene 2 1 0 331 343 335 896 908 859
Idaho Fa l l s 2 4 0 254 276 304 820 790 787
Meridian 3 2 2 506 523 634 1,307 1,334 1,468
Nampa 3 4 6 538 595 667 1,399 1,462 1,569
Pocatel lo 0 1 3 307 304 292 1,025 939 985
Twin Fa l l s 1 3 0 184 195 240 350 368 452
15,000 ‐ 39,999
Eagle 0 0 1 68 82 100 248 270 303
Kuna 0 2 0 26 26 27 86 96 89
Lewiston 2 1 1 148 147 126 523 493 497
Moscow 1 1 0 62 78 77 238 271 250
Post Fa l l s 0 3 3 101 107 106 268 288 314
Rexburg 0 0 0 69 67 109 299 301 342
5,000 ‐ 14,999
Ammon 0 0 0 35 30 32 111 118 122
Blackfoot 0 0 3 57 48 69 226 169 216
Burley 1 1 0 56 48 63 210 207 247
Chubbuck 1 1 1 52 56 74 206 171 210
Emmett 0 0 0 16 23 14 38 49 45
Fruitland 0 0 0 16 10 17 38 23 25
Garden City 1 0 1 102 81 90 254 264 298
Hai ley 0 0 0 13 15 13 50 60 52
Hayden 1 0 1 46 51 68 172 164 197
Jerome 0 2 0 23 23 28 95 104 131
Middleton 0 1 1 6 12 8 28 28 16
Mounta in Home 0 0 0 20 17 9 63 39 28
Payette 0 0 0 19 10 13 43 30 31
Preston 1 0 0 13 1 2 31 3 8
Rathdrum 0 0 0 14 22 23 52 44 55
Rupert 0 0 0 6 9 2 22 35 27
Sandpoint 0 0 0 14 17 29 86 105 127
Star 0 0 0 17 13 10 34 29 30
Weiser 0 0 0 9 7 3 22 10 20
Crash History of Idaho Cities: 2013‐2015
Fatal Crashes Injury Crashes Total Crashes
Table 13

-24-
City by Population Size 2013 2014 2015 2013 2014 2015 2013 2014 2015
2,000 ‐ 4,999
American Fal l s 0 0 0 10 13 7 39 39 29
Bel levue 0 0 0 4 2 6 14 15 18
Bonners Ferry 0 0 0 9 16 8 27 27 18
Buhl 0 0 0 5 4 6 24 19 23
Dal ton Gardens 0 0 0 5 2 6 21 12 22
Fi ler 0 0 0 2 4 0 3 9 5
Gooding 0 0 0 7 7 4 20 19 32
Grangevi l le 0 0 0 5 5 4 22 10 6
Heyburn 0 0 0 17 15 13 40 34 52
Homedale 0 0 0 0 3 3 11 10 9
Iona 0 0 0 1 1 1 2 1 3
Kel logg 0 1 0 5 9 9 24 24 28
Ketchum 1 0 0 8 4 9 38 37 40
Kimberly 0 0 2 2 4 1 4 15 23
Malad 0 0 0 2 2 5 16 21 18
McCal l 0 0 0 7 14 11 30 37 39
Montpel ier 0 0 0 2 5 3 29 26 18
Orofino 0 1 1 9 7 8 28 31 31
Parma 1 0 0 2 1 1 16 10 9
Rigby 0 0 0 12 20 18 52 51 73
St. Anthony 0 0 0 5 1 6 19 17 24
St. Maries 0 0 0 4 2 3 22 36 22
Salmon 0 0 0 10 5 13 30 23 33
Shel ley 0 0 1 2 8 6 11 14 27
Soda Springs 0 0 0 5 1 5 18 7 10
Spiri t Lake 0 0 0 5 1 0 9 6 2
Wendel l 0 0 0 4 3 5 17 20 13
Fatal Crashes Injury Crashes Total Crashes
Table 13 (Continued)
Crash History of Idaho Cities: 2013‐2015
Table 14 lists fatal and injury crash data and crash rates for the 44 counties in Idaho by populationgroupings.Populationfiguresarebasedon2015U.S.CensusBureauestimatesforcounties.
2015 Fatal and Injury
Population Crash Rate Per
(in 1,000s) Total Fatal Injury Killed Injured 1,000 Population
50,000 and over
Ada 434.2 6,650 22 2,730 23 3,902 6.3
Bannock 83.7 1,379 8 458 9 677 5.6
Bonnevi l le 110.1 1,426 3 516 3 713 4.7
Canyon 207.5 3,147 22 1,353 25 2,092 6.6
Kootenai 150.3 2,258 8 814 11 1,152 5.5
Twin Fa l l s 82.4 923 11 412 12 630 5.1
Mean Crash Rate 6.0
Table 14
Fatal and Injury Crash Rates by County ‐ 2015
Number of Crashes Number of Persons

-25-
2015 Fatal and Injury
Population Crash Rate Per
(in 1,000s) Total Fatal Injury Killed Injured 1,000 Population
20,000 ‐ 49,999
Bingham 45.0 625 16 205 16 301 4.9
Bla ine 21.6 259 0 73 0 92 3.4
Bonner 41.9 523 13 167 15 239 4.3
Cass ia 23.5 490 6 165 7 253 7.3
Elmore 25.9 332 9 137 10 209 5.6
Jefferson 27.2 262 4 74 4 117 2.9
Jerome 22.8 442 7 169 7 251 7.7
Latah 38.8 493 1 159 1 216 4.1
Madison 38.3 513 3 151 3 242 4.0
Minidoka 20.5 280 3 94 4 141 4.7
Nez Perce 40.0 695 4 196 4 264 5.0
Payette 22.9 212 3 104 4 162 4.7
Mean Crash Rate 4.8
10,000 ‐ 19,999
Boundary 11.3 138 0 43 0 72 3.8
Frankl in 13.1 134 2 50 2 68 4.0
Fremont 12.8 172 2 53 2 85 4.3
Gem 16.9 147 2 49 2 80 3.0
Gooding 15.3 183 3 72 4 99 4.9
Idaho 16.3 247 4 91 4 114 5.8
Owyhee 11.3 121 2 44 2 66 4.1
Shoshone 12.4 187 3 68 3 94 5.7
Teton 10.6 93 0 18 0 29 1.7
Val ley 10.1 233 0 78 0 105 7.7
Mean Crash Rate 4.5
5,000 ‐ 9,999
Bear Lake 5.9 107 0 30 0 40 5.1
Benewah 9.1 164 2 51 2 72 5.9
Boise 7.1 123 8 51 9 66 8.4
Caribou 6.8 133 3 50 3 91 7.8
Clearwater 8.5 98 3 23 3 25 3.1
Lemhi 7.7 121 2 54 2 72 7.2
Lincoln 5.3 51 4 18 4 32 4.2
Power 7.6 160 3 61 3 95 8.4
Washington 9.9 102 0 35 0 49 0.0
Mean Crash Rate 5.9
Table 14 (Continued)
Fatal and Injury Crash Rates by County ‐ 2015
Number of Crashes Number of Persons

-26-
2015 Fatal and Injury
Population Crash Rate Per
(in 1,000s) Total Fatal Injury Killed Injured 1,000 Population
0 ‐ 4,999
Adams 3.8 19 4 12 4 23 4.2
Butte 2.5 50 1 11 1 16 4.8
Camas 1.1 31 1 9 1 15 9.4
Clark 0.9 41 1 13 1 19 15.9
Custer 4.1 77 4 33 5 39 9.1
Lewis 3.8 73 1 21 1 36 5.8
Oneida 4.3 104 0 35 0 52 8.2
Mean Crash Rate 7.1
Statewide Totals 1,654.9 22,959 173 8,677 190 12,665 5.3
Number of PersonsNumber of Crashes
Table 14 (Continued)
Fatal and Injury Crash Rates by County ‐ 2015
Table 15 lists fatal and injury crash data and rates for Idaho cities with populations over 2,000 bypopulationgroupings.PopulationfiguresarefromtheU.S.CensusBureauestimatesforcitiesfor2015.
2015 Fatal and Injury
Population Crash Rate Per
(in 1,000s) Total Fatal Injury Killed Injured 1,000 Population
40,000 and over
Boise 218.3 3,817 10 1,588 11 2,256 7.3
Caldwel l 51.7 749 3 319 3 493 6.2
Coeur d'Alene 49.1 859 0 335 0 457 6.8
Idaho Fa l l s 59.2 787 0 304 0 404 5.1
Meridian 90.7 1,468 2 634 2 918 7.0
Nampa 89.8 1,569 6 667 6 992 7.5
Pocatel lo 54.4 985 3 292 4 428 5.4
Twin Fa l l s 47.5 452 0 240 0 348 5.1
Mean Crash Rate 6.7
Number of Persons
Table 15
Fatal and Injury Crash Rates by City – 2015
Number of Crashes

-27-
2015 Fatal and Injury
Population Crash Rate Per
(in 1,000s) Total Fatal Injury Killed Injured 1,000 Population
15,000 ‐ 39,999
Eagle 23.6 303 1 100 1 150 4.3
Kuna 17.2 89 0 27 0 38 1.6
Lewiston 32.5 497 1 126 1 170 3.9
Moscow 25.1 250 0 77 0 115 3.1
Post Fa l l s 30.5 314 3 106 4 148 3.6
Rexburg 27.7 342 0 109 0 176 3.9
Mean Crash Rate 3.5
5,000 ‐ 14,999
Ammon 15.0 122 0 32 0 48 2.1
Blackfoot 11.7 216 3 69 3 100 6.1
Burley 10.4 247 0 63 0 90 6.0
Chubbuck 14.4 210 1 74 1 99 5.2
Emmett 6.6 45 0 14 0 24 2.1
Frui tland 5.1 25 0 17 0 29 3.3
Garden City 11.6 298 1 90 1 124 7.9
Hai ley 8.1 52 0 13 0 18 1.6
Hayden 14.1 197 1 68 1 112 4.9
Jerome 11.2 131 0 28 0 41 2.5
Middleton 6.8 16 1 8 1 13 1.3
Mounta in Home 13.7 28 0 9 0 10 0.7
Payette 7.4 31 0 13 0 16 1.8
Preston 5.2 8 0 2 0 6 0.4
Rathdrum 7.5 55 0 23 0 32 3.1
Rupert 5.7 27 0 2 0 2 0.4
Sandpoint 7.8 127 0 29 0 37 3.7
Star 7.8 30 0 10 0 10 1.3
Weiser 5.3 20 0 3 0 4 0.6
Mean Crash Rate 3.3
Number of Crashes Number of Persons
Table 15 (Continued)
Fatal and Injury Crash Rates by City – 2015

-28-
2015 Fatal and Injury
Population Crash Rate Per
(in 1,000s) Total Fatal Injury Killed Injured 1,000 Population
2,000 ‐ 4,999
American Fa l l s 4.3 29 0 7 0 8 1.6
Bel levue 2.3 18 0 6 0 6 2.6
Bonners Ferry 2.5 18 0 8 0 13 3.1
Buhl 4.3 23 0 6 0 8 1.4
Dal ton Gardens 2.4 22 0 6 0 9 2.5
Fi ler 2.7 5 0 0 0 0 0.0
Gooding 3.5 32 0 4 0 4 1.1
Grangevi l le 3.2 6 0 4 0 4 1.3
Heyburn 3.2 52 0 13 0 20 4.0
Homedale 2.6 9 0 3 0 4 1.2
Iona 2.1 0 1
Kel logg 2.1 28 0 9 0 9 4.3
Ketchum 2.7 40 0 9 0 9 3.3
Kimberly 3.6 23 2 1 2 1 0.8
Malad 2.1 18 0 5 0 5 2.4
McCal l 3.1 39 0 11 0 14 3.5
Montpel ier 2.5 18 0 3 0 4 1.2
Orofino 3.1 31 1 8 1 8 2.9
Parma 2.1 9 0 1 0 1 0.5
Rigby 4.0 73 0 18 0 27 4.5
St. Anthony 3.4 24 0 6 0 9 1.7
St. Maries 2.3 22 0 3 0 6 1.3
Salmon 3.0 33 0 13 0 21 4.3
Shel ley 4.3 27 1 6 1 8 1.6
Soda Springs 2.9 10 0 5 0 5 1.7
Spi ri t Lake 2.1 2 0 0 0 0 0.0
Wendel l 2.7 13 0 5 0 5 1.8
Mean Crash Rate 2.1
Number of Crashes Number of Persons
Table 15 (Continued)
Fatal and Injury Crash Rates by City – 2015

-29-
DriverAgeDistributionTable16showsthechangesinthenumberoflicenseddriversinIdahosince2000.Thesenumbersreflectgrowth in thepopulationof thestateand theagingof thebabyboomers. Since2000, therehasbeenaconsiderableincreaseinthenumberandproportionofdriversovertheageof54.
Change Change
Age 2000 2010 2015 2000‐2015 2010‐2015
15* 9,406 2,592 3,443 ‐63.4% 32.8%
(%) 1.1% 0.2% 0.3%
16‐24 156,485 153,891 160,140 2.3% 4.1%
(%) 17.5% 14.4% 14.0%
25‐34 154,133 191,583 196,056 27.2% 2.3%
(%) 17.3% 17.9% 17.1%
35‐44 178,401 177,226 186,231 4.4% 5.1%
(%) 20.0% 16.6% 16.3%
45‐54 167,821 195,441 186,222 11.0% ‐4.7%
(%) 18.8% 18.3% 16.3%
55‐64 106,190 177,521 195,777 84.4% 10.3%
(%) 11.9% 16.6% 17.1%
65+ 120,516 171,288 216,423 79.6% 26.4%
(%) 13.5% 16.0% 18.9%
TOTALS 892,952 1,069,542 1,144,292 28.1% 7.0%
*On September 1, 1989, legislation took effect increasing the driving age from 14 to 16 years old.
On September 1, 1991, legislation lowered the driving age from 16 to 15 years old.
Table 16
Age Distribution of Licensed Drivers: 2000, 2010, 2015
The graduateddriver’s license law took effect January1, 2001. The law changed the requirements foroperatinga vehiclewitha supervised instructionpermit. These requirementsmustbemet toobtainaclassDdriver’slicense:thepermitteemaynotapplyforadriver’slicensesoonerthan15yearsofageandno sooner than 6 months after completing a driver’s training course; during the 6 month period, thepermitteemustaccumulate50hoursofsuperviseddrivingtimewithalicenseddriver21yearsofageorolderand10ofthehoursmustbeatnight.Alloccupantsofthevehiclemustbeproperlyrestrained.Ifthepermittee is convicted of any traffic violation or is found in violation of any of the restrictions of thesupervisedinstructionpermit,thepermitiscanceledandthe6monthperiodstartsoverfromthedateasuperviseddrivingpermitisreissued.Theconditionsofthesuperviseddrivingpermitapplytoeveryoneunder17yearsofage that isattemptingtoobtainadriver’s license. OnceaclassD license isobtained,drivingisrestrictedtodaylighthoursforpersonsunder16yearsofage.Anamendment,takingeffectJuly1,2003,allows15yearolddriverstodriveatnight,aslongasanotherlicenseddriverovertheageof21ispresent. Another amendment, taking effect July 1, 2007, increased the number of months for thesuperviseddrivingperiodto6monthsandrestrictedthenumberofpassengersnotrelatedtothedrivertonomorethanonefordriversundertheageof17.

-30-
DriverAgeandCrashInvolvement
Age Number % Number % Involvement* Number % Involvement*
15 3,443 0.3% 381 0.9% 3.1 130 0.8% 2.6
16 10,545 0.9% 1,128 2.7% 3.0 405 2.5% 2.7
17 14,989 1.3% 1,422 3.5% 2.6 522 3.2% 2.4
18 17,106 1.5% 1,596 3.9% 2.6 628 3.8% 2.6
19 19,181 1.7% 1,399 3.4% 2.0 528 3.2% 1.9
20 19,352 1.7% 1,216 3.0% 1.7 475 2.9% 1.7
21 18,343 1.6% 1,219 3.0% 1.8 499 3.0% 1.9
22 19,598 1.7% 1,137 2.8% 1.6 449 2.7% 1.6
23 20,400 1.8% 1,100 2.7% 1.5 428 2.6% 1.5
24 20,626 1.8% 1,064 2.6% 1.4 433 2.6% 1.5
25‐34 196,056 17.1% 7,976 19.4% 1.1 3,252 19.9% 1.2
35‐44 186,231 16.3% 6,320 15.4% 0.9 2,620 16.0% 1.0
45‐54 186,222 16.3% 5,424 13.2% 0.8 2,216 13.5% 0.8
55‐64 195,777 17.1% 4,652 11.3% 0.7 1,859 11.3% 0.7
65‐74 139,818 12.2% 2,732 6.6% 0.5 1,104 6.7% 0.6
75+ 76,605 6.7% 1,513 3.7% 0.5 607 3.7% 0.6
Not Stated
or Other 852 2.1% 224 1.4%
TOTALS 1,144,292 41,131 16,379
* Involvement is calculated by dividing the percent of drivers in Crashes by the percent of licensed drivers.
Over‐representation occurs when the value is greater than 1.0.
Drivers Drivers in All Crashes Injury Crashes
Table 17
Driver Age as a Factor in Crashes: 2015
Licensed Drivers in Fatal and
Drivers,ages19andunder,wereinvolvedin2.4timesasmanyfatalorinjurytrafficcrashesasexpected.Thisagegroupcomprised5.7%ofalllicenseddriversandaccountedfor13.5%ofdriversinfatal&injurycrashes. Drivers,ages20to24,wereinvolvedin1.6timesasmanycrashesasexpected. Youngdriverscontinuetobeover‐involvedincrashes.Driversthatwere29yearsoldin2015werethefirstgroupofdriverssubjectedtotheGraduatedDriver’sLicense(GDL)requirements.

-31-
DriverGenderInformationFigure9showsthedistributionofmaleandfemalelicenseddrivers,thepercentageofdriversinvolvedinallcrashes,andthepercentageofdriversinvolvedinfatalcrashes.Malescomprisejustover50%ofthelicensed drivers, but accounted for 56% of the drivers in all crashes and 73% of the drivers in fatalcrashes.
Figure9ComparisonbyGenderforDriverLicensure,andCrashInvolvement:2015
0.0%
10.0%
20.0%
30.0%
40.0%
50.0%
60.0%
70.0%
80.0%
Licensed Drivers Fatal Crashes All Crashes
50%
73%
56%
50%
27%
44%
Male Female
In2015,maleswere1.3timesmorelikelythanfemalestobeinvolvedinanycrashandwere2.7timesaslikelyasfemalestobeinvolvedinafatalcrash.

-32-
CrashInvolvementbyDriverAgeandGenderFigure 10 shows driver involvement by age and gender for all crashes and Figure 11 shows driverinvolvementbyageandgenderforfatalandinjurycrashes.Figure11correspondswiththeinvolvementnumbersinTable17andshowshowtheinvolvementnumbersbreakdownbygender. Forexample(inFigure 11), 15 year‐old male drivers were involved in 2.7 times as many fatal and injury crashes asexpected,whilefemale15year‐olddriverswereinvolvedin2.6timesasmanyfatalandinjurycrashesasexpected.
Figure10InvolvementbyDriverAgeandGenderinAllCrashes:2015
0.0
0.5
1.0
1.5
2.0
2.5
3.0
3.5
15 16 17 18 19 20 21 22 23 24 25 ‐34
35 ‐44
45 ‐54
55 ‐64
65 ‐74
75 +
Male Female
Figure11InvolvementbyDriverAgeandGenderinFatal&InjuryCrashes:2015
0.0
0.5
1.0
1.5
2.0
2.5
3.0
3.5
15 16 17 18 19 20 21 22 23 24 25 ‐34
35 ‐44
45 ‐54
55 ‐64
65 ‐74
75 +
Male Female

-33-
ContributingCircumstancesinCrashesFigure12portraysthesevenmostprevalentcontributingcircumstancesrecordedforfatalcrashes,injurycrashes,andallcrashes.Foreveryvehicleinvolvedinacrash,theinvestigatingofficermayindicateuptothreecircumstancesthatmayhavecontributedtotheoccurrenceofthecrash.
Figure12TopSevenMostPrevalentContributingCircumstancesCitedforTrafficCrashesin2015
0%
5%
10%
15%
20%
25%
Inattention /Distraction
Alcohol / DrugInvolvement
Failed toMaintain Lane
Follow TooClose
Fail to Yield Speed Fail to ObeySignal/Stop
Sign
12%
24%
17%
1%
5%
10%
4%
21%
6%
8%
15%
12%
8%
6%
19%
5%
7%
15%
12%
9%
5%
Fatal Crashes
Injury Crashes
All Crashes

-34-
TrafficViolationsandDriver’sLicenseSuspensionsThe top ten trafficviolations forwhichdriverswereconvicted in2015arepresented inTable18.ThebasicruleviolationsrefertoIdahoCodethatrequiresdriverstooperatevehiclesatareasonable,prudentspeedfortheconditionsandwithconsiderationforactualandpotentialhazards.
Violation Type Number % of Total
1. Bas ic Rule / Speeding Violations 61,040 44.9%
2. Safety Restra int Violations 19,380 14.3%
3. Insurance Violations 12,286 9.0%
4. Fa i lure to Obey Traffic Control Devices 8,736 6.4%
5. Driving Under the Influence 6,809 5.0%
6. Driving Without Privi leges ‐ Suspended License 5,722 4.2%
7. Fol lowing Too Close 5,356 3.9%
8. Reckless or Inattentive Driving 3,053 2.2%
9. Fa i lure to Yield Right of Way 2,827 2.1%
10. Chi ld Safety Seat Violations 938 0.7%
Al l Other 9,823 7.2%
TOTAL 135,970
Table 18
Top Ten Traffic Violations for Idaho Drivers: 2015
Safetyrestraintviolationsareconsideredsecondaryviolations.Bothchildsafetyseatandsafetyrestraintviolationsarenon‐movingtraffic infractionsandarenotpartof thedrivingrecord. Dataforthesetwoviolations is obtained directly from the judicial system. The remaining violations are moving trafficinfractionsanddataisobtainedfromdrivingrecords.Information from the judicial system is obtained from the Idaho Supreme Court Data Repository.InformationfromthedrivingrecordisprovidedbytheEconomicsandResearchSectionoftheDivisionofAdministrationwithintheIdahoTransportationDepartment.

-35-
Table19isabreakdownbyagegroupsforselectedtrafficviolations.Thefiveviolationsshowncomprise63%ofallviolationsfor2015.ThebasicruleviolationsrefertoIdahoCoderequiringdriverstooperatevehiclesatareasonable,prudentspeedfortheconditionsandwithconsiderationforactualandpotentialhazards.
Licensed Fail to Stop at Stop DUI Reckless or Following
Age Drivers Basic Rule/Speed Sign and Signals Idaho Residents Inattentive Too Close
15 3,443 5.9 1.9 0.1 0.6 1.2
16‐19 61,821 13.0 2.0 0.4 0.7 1.8
20‐24 98,319 11.2 1.5 1.2 0.7 1.1
25‐34 196,056 7.1 0.9 1.1 0.4 0.6
35‐44 186,231 5.7 0.7 0.8 0.2 0.4
45‐54 186,222 4.4 0.6 0.6 0.2 0.3
55‐64 195,777 2.8 0.4 0.3 0.1 0.2
65‐74 139,818 1.9 0.3 0.1 0.1 0.2
75+ 76,605 1.0 0.4 0.0 0.1 0.2
Mean 5.3 0.8 0.6 0.3 0.5
Table 19
Selected Traffic Violation Rates for Idaho Licensed Drivers: 2015
(Per 100 Licensed Drivers)
Youngerdrivers,especiallythose19yearsofageandyounger,hadviolationrateswellabovethemeaninareasshown tobemajorcontributing factors in crashes, i.e., speeding, inattention, following tooclose,andfailingtostopatstopsignsandsignals.Driversage20‐24hadthehighestrateforDUIviolations.This information is provided by the Economic andResearch Section of theDivision of AdministrationwithintheIdahoTransportationDepartmentandcomesdirectlyfromdriver’slicenserecords.

-36-
% of All
Violation Number Suspensions
Fa i lure to Mainta in Insurance 22,480 37.5%
Fai lure to Pay Fine 14,338 23.9%
Adminis trative License Suspens ion (ALS)* 7,199 12.0%
Driving Under the Influence 5,963 9.9%
Fami ly Respons ibi l i ty Law 2,712 4.5%
Driving Without Privi leges 880 1.5%
Underage Consumption or Possess ion
of Alcohol 824 1.4%
Reckless/Inattentive Driving 716 1.2%
Refused Evidentiary BAC Test 559 0.9%
Recurrence of Violation (Under 17 Years Old) 372 0.6%
Points 350 0.6%
Al l Others 3,609 6.0%
TOTALS 60,002 100.0%
*On July 1, 1994, legislation took effect creating the Administrative License Suspension (ALS) Program to suspend licenses
of drivers who fail or refuse to submit to evidentiary testing for DUI. The ALS Program was placed in moratorium on
March 17, 1995. The law was reinstated January 1, 1998.
Driver's License Suspensions by Violation Type: 2015
Table 20
Thetwolargestcategoriesofdriver’slicensesuspensionsarefailuretomaintaininsuranceandfailuretopayatrafficfine.Thesetwosuspensionsaccountedfor61%ofalllicensesuspensions.Drivingundertheinfluenceaccountedfor10%ofalllicensesuspensions.A suspension forRecurrenceofViolation is a result of theGraduatedDriver’sLicense law. If a driverunder17yearsofagereceives2trafficcitationsforanymovingviolation,theirlicenseissuspendedfor30days.Anysubsequentviolationresultsina60daysuspension.TheEconomicsandResearchSectionoftheIdahoTransportationDepartmentprovidestheinformationconcerningdriver’slicensesuspensions.

-37-

-38-

-39-
ImpairedDrivingAnimpaireddrivingcrashisidentifiedbyinformationprovidedonthecrashreport.Alawenforcementofficer determines whether the driver was alcohol or drug impaired or whether alcohol or drugscontributed to the crash, regardless ofwhether a Blood Alcohol Content (BAC) testwas given or not.Crasheswhereasoberdrivercollidedwithanimpairedpedestrianorbicyclistarealsoincluded.
Change Avg. Change
2011 2012 2013 2014 2015 2014‐2015 2011‐2014
Impaired Driving Crashes 1,456 1,454 1,425 1,378 1,367 ‐0.8% ‐1.8%
Fata l i ties 66 73 96 72 87 20.8% 5.7%
Serious Injuries 277 241 228 227 219 ‐3.5% ‐6.3%
Vis ible Injuries 400 399 362 383 350 ‐8.6% ‐1.2%
Poss ible Injuries 474 535 445 443 477 7.7% ‐1.5%
Impaired Driving Crashes as a
% of Al l Crashes 7.0% 6.8% 6.4% 6.2% 5.7% ‐8.6% ‐3.8%
Impaired Driving Fatal i ties as a
% of Al l Fata l i ties 39.5% 39.7% 44.9% 38.7% 40.3% 4.1% ‐0.1%
Impaired Driving Injuries as a
% of Al l Injuries 10.6% 10.7% 9.1% 8.9% 7.9% ‐11.5% ‐5.2%
Al l Fatal and Injury Crashes 8,049 8,049 8,049 8,392 9,248 10.2% 1.4%
Impaired Fata l/Injury Crashes 822 843 797 784 781 ‐0.4% ‐1.5%
% Impaired Driving 10.2% 10.5% 9.9% 9.3% 8.4% ‐9.6% ‐2.9%
Impaired Driving Fatal i ty and Serious
Injury Rate per 100 Mil l ion Vehicle
Mi les Of Travel 2.22 1.98 2.04 1.85 1.84 ‐0.8% ‐5.7%
Annual DUI Arrests by Agency*
Idaho State Pol i ce 1,846 1,659 1,304 1,197 1,089 ‐9.0% ‐13.2%
Loca l Agencies 7,840 7,482 6,825 6,248 6,298 0.8% ‐7.3%
Tota l Arrests 9,686 9,141 8,129 7,445 7,387 ‐0.8% ‐8.4%
DUI Enforcement Rate** 0.89 0.84 0.73 0.66 0.65 ‐2.1% ‐9.6%
*Source: Idaho State Police, Bureau of Criminal Identification
**DUI Arrests per 100 Licensed Drivers per Year.
Impaired Driving Crashes: 2011‐2015
Table 21
In 2015, impaired driving crashes decreased by 1%, while fatalities resulting from impaired drivingcrashesincreasedby21%.Justmorethan8%ofallfatalandinjurycrashesinvolvedanimpaireddriver,animpairedpedestrian,oranimpairedbicyclist.Over40%ofallfatalitiesweretheresultofanimpaireddriving crash in2015. Only25%of thepassengermotor vehicle occupants killed in impaireddrivingcrasheswerewearingaseatbelt.

-40-
Table21alsopresentsafive‐yearsummaryofannualDUIarrestsbytheIdahoStatePolice(ISP)andlocalagencies. Local agency DUI arrests were up 1% in 2015 from the prior year, but ISP DUI arrestsdecreasedby9%.Overall,DUIarrestsdecreasedby1%from2014levels.EconomicCostsofImpairedDrivingCrashes
Table 22 contains the estimated economic costs for impaired driving‐relatedmotor vehicle crashes in2015. Theestimatedcostof Idaho impaireddrivingcrashes in2015wasmore than$1billiondollars.Thisestimaterepresentsjustmorethan26%ofthetotalcostofIdahocrashes(asshowninTable4).
Incident Description Total Occurrences Cost Per Occurrence Cost Per Category
Fata l i ties 87 $9,498,816 $826,397,006
Serious Injuries 219 $454,281 $99,487,576
Vis ible Injuries 350 $123,732 $43,306,152
Poss ible Injuries 477 $63,181 $30,137,562
No Injuries 1,448 $3,201 $4,634,644
Total Estimate of Economic Cost $1,003,962,940
Table 22
Economic Costs of Impaired Driving Crashes: 2015 Estimates
VictimsofFatalCrashesInvolvingImpairedDrivers
Of the 87 people killed in impaired driving crashes, 77 (or 89%) were impaired drivers, impairedpedestrians,orpassengersofamotorvehicleridingwithanimpaireddriver.
ATV
Impaired Status* Driver Passenger Driver Passenger Pedestrian Driver
Impaired 40 18 13 2 2 2
Not Impaired 4 5 1 0 0 0
* For drivers, bicyclists, and pedestrians, impaired status implies whether the person killed was impaired or not.
For passengers, it implies whether the passenger killed was riding with an impaired driver.
Passenger Vehicles Motorcycle
Table 23
Persons Killed in Impaired Driving Crashes: 2015
by Vehicle Type, Seating Position, and Impaired Status

-41-
ImpairedDrivingbyAge
Table24showsthenumberandpercentoflicenseddrivers,DUIarrests,andimpaireddriversincrashesbyage.Drivers,ages18to39,areover‐representedinimpaireddrivingcrashes.Drivers,ages21to23years‐old, are the most over‐represented ages. They are involved in close to three times as manyimpaireddrivingcrashesasyouwouldexpectthemtobe.Tenpercentoftheimpaireddriversinvolvedincrasheswereunder21yearsofage.
Age Number Percent Number Percent Number Percent
0 to 14 0 0.0% 0 0.0% 0 0.0%
15 3,443 0.3% 5 0.1% 2 0.1%
16 10,545 0.9% 23 0.3% 5 0.4%
17 14,989 1.3% 41 0.6% 15 1.1%
18 17,106 1.5% 34 2.5%
19 19,181 1.7% 252 3.4% 43 3.2%
20 19,352 1.7% 36 2.7%
21 18,343 1.6% 61 4.5%
22 19,598 1.7% 68 5.1%
23 20,400 1.8% 63 4.7%
24 20,626 1.8% 1,261 17.1% 42 3.1%
25‐29 97,264 8.5% 1,195 16.2% 210 15.6%
30‐34 98,792 8.6% 987 13.4% 160 11.9%
35‐39 97,172 8.5% 825 11.2% 139 10.3%
40‐44 89,059 7.8% 718 9.7% 110 8.2%
45‐49 90,225 7.9% 642 8.7% 109 8.1%
50‐54 95,997 8.4% 546 7.4% 79 5.9%
55‐59 100,852 8.8% 460 6.2% 85 6.3%
60+ 311,348 27.2% 375 5.1% 81 6.0%
Miss ing or 57 0.8% 3 0.2%
Unknown
TOTALS 1,144,292 7,387 1,345
* 18‐19 year old drivers combined
** 20‐24 year old drivers combined
Table 24
Licensed Drivers DUI Arrests Impaired Drivers in Crashes
DUI Arrests and Impaired Driving Crashes by Driver Age: 2015

-42-
ImpairedDrivingbyCountiesandCities
Table25presentsinformationonimpaireddrivingcrashesforIdahocountiesbypopulationgroupings.Populationnumbersarebasedon2015U.S.Censusestimatesforcounties.
Impaired Driving
2015 Fatal and Injury
Population Crash Rate Per
(in 1,000s) Total Fatal Injury Killed Injured 1,000 Population
50,000 and over
Ada 434.2 316 11 155 11 225 0.4
Bannock 83.7 104 3 58 4 90 0.7
Bonnevi l le 110.1 84 1 48 1 64 0.4
Canyon 207.5 152 10 84 11 139 0.5
Kootenai 150.3 171 4 80 7 114 0.6
Twin Fa l l s 82.4 56 4 32 5 54 0.4
Mean Crash Rate 0.5
20,000 ‐ 49,999
Bingham 45.0 47 7 23 7 37 0.7
Bla ine 21.6 16 0 8 0 9 0.4
Bonner 41.9 41 6 26 7 40 0.8
Cass ia 23.5 21 1 10 1 12 0.5
Elmore 25.9 15 5 6 6 12 0.4
Jefferson 27.2 10 2 5 2 8 0.3
Jerome 22.8 22 4 8 4 15 0.5
Latah 38.8 27 0 14 0 16 0.4
Madison 38.3 15 1 3 1 6 0.1
Minidoka 20.5 13 1 8 1 10 0.4
Nez Perce 40.0 43 2 11 2 23 0.3
Payette 22.9 10 0 6 0 11 0.3
Mean Crash Rate 0.4
10,000 ‐ 19,999
Boundary 11.3 11 0 8 0 10 0.7
Frankl in 13.1 6 0 4 0 4 0.3
Fremont 12.8 7 0 5 0 8 0.4
Gem 16.9 7 0 4 0 10 0.2
Gooding 15.3 15 2 8 2 13 0.7
Idaho 16.3 20 0 15 0 15 0.9
Owyhee 11.3 6 1 2 1 2 0.3
Shoshone 12.4 21 1 10 1 13 0.9
Teton 10.6 3 0 2 0 3 0.2
Val ley 10.1 17 0 8 0 9 0.8
Mean Crash Rate 0.1
Table 25
Impaired Driving Crashes by County: 2015
Number of Crashes Number of Persons

-43-
Impaired Driving
2015 Fatal and Injury
Population Crash Rate Per
(in 1,000s) Total Fatal Injury Killed Injured 1,000 Population
5,000 ‐ 9,999
Bear Lake 5.9 5 0 4 0 5 0.7
Benewah 9.1 11 0 4 0 7 0.4
Boise 7.1 12 4 5 5 6 1.3
Caribou 6.8 6 0 5 0 8 0.7
Clearwater 8.5 7 1 4 1 5 0.6
Lemhi 7.7 12 1 8 1 12 1.2
Lincoln 5.3 3 1 2 1 3 0.6
Power 7.6 11 2 7 2 12 1.2
Washington 9.9 1 0 0 0 0 0.0
Mean Crash Rate 0.7
0 ‐ 4,999
Adams 3.8 2 1 1 1 2 0.5
Butte 2.5 1 0 0 0 0 0.0
Camas 1.1 3 0 2 0 2 1.9
Clark 0.9 2 0 2 0 2 2.3
Custer 4.1 10 1 7 1 9 2.0
Lewis 3.8 1 1 0 1 0 0.3
Oneida 4.3 4 0 1 0 1 0.2
Mean Crash Rate 0.8
Statewide Totals 1,654.9 1,367 78 703 87 1,046 0.5
Table 25 (Continued)
Impaired Driving Crashes by County: 2015
Number of PersonsNumber of Crashes
Table26presents informationon impaireddrivingcrashes forcitieswithpopulationsexceeding2,000people by population groupings. Population figures are from the U. S. Census Bureau’s estimates forcitiesfor2015.
Impaired Driving
2015 Fatal and Injury
Population Crash Rate Per
(in 1,000s) Total Fatal Injury Killed Injured 1,000 Population
40,000 and over
Boise 218.3 165 6 80 6 105 0.4
Caldwel l 51.7 38 2 19 2 39 0.4
Coeur d'Alene 49.1 53 0 22 0 30 0.4
Idaho Fa l l s 59.2 48 0 25 0 27 0.4
Meridian 90.7 69 1 28 1 44 0.3
Nampa 89.8 62 1 30 1 44 0.3
Pocatel lo 54.4 74 2 35 3 56 0.7
Twin Fa l l s 47.5 21 0 10 0 13 0.2
Mean Crash Rate 0.4
Number of Crashes Number of Persons
Impaired Driving Crashes by City: 2015
Table 26

-44-
Impaired Driving
2015 Fatal and Injury
Population Crash Rate Per
(in 1,000s) Total Fatal Injury Killed Injured 1,000 Population
15,000 ‐ 39,999
Eagle 23.6 12 0 9 0 12 0.4
Kuna 17.2 5 0 4 0 7 0.2
Lewis ton 32.5 30 1 6 1 14 0.2
Moscow 25.1 10 0 4 0 5 0.2
Post Fa l l s 30.5 28 2 14 3 22 0.5
Rexburg 27.7 5 0 1 0 1 0.0
Mean Crash Rate 0.1
5,000 ‐ 14,999
Ammon 15.0 4 0 1 0 1 0.1
Blackfoot 11.7 15 3 5 3 12 0.7
Burley 10.4 9 0 4 0 4 0.4
Chubbuck 14.4 6 0 5 0 6 0.3
Emmett 6.6 2 0 2 0 3 0.3
Frui tland 5.1 3 0 2 0 5 0.4
Garden City 11.6 10 0 3 0 4 0.3
Hai ley 8.1 2 0 2 0 2 0.2
Hayden 14.1 13 0 4 0 4 0.3
Jerome 11.2 5 0 2 0 2 0.2
Middleton 6.8 2 1 1 1 5 0.3
Mounta in Home 13.7 1 0 0 0 0 0.0
Payette 7.4 1 0 0 0 0 0.0
Preston 5.2 0 0 0 0 0 0.0
Rathdrum 7.5 3 0 2 0 3
Rupert 5.7 0 0 0 0 0 0.0
Sandpoint 7.8 3 0 2 0 2 0.3
Star 7.8 1 0 1 0 1 0.1
Weiser 5.3 1 0 0 0 0 0.0
Mean Crash Rate 0.2
Table 26 (Continued)
Impaired Driving Crashes by City: 2015
Number of Crashes Number of Persons

-45-
Impaired Driving
2015 Fatal and Injury
Population Crash Rate Per
(in 1,000s) Total Fatal Injury Killed Injured 1,000 Population
2,000 ‐ 4,999
American Fa l l s 4.3 3 0 2 0 2 0.5
Bel levue 2.3 1 0 0 0 0 0.0
Bonners Ferry 2.5 1 0 1 0 2 0.4
Buhl 4.3 1 0 0 0 0 0.0
Dalton Gardens 2.4 1 0 1 0 1 0.4
Fi ler 2.7 1 0 0 0 0 0.0
Gooding 3.5 1 0 1 0 1 0.3
Grangevi l le 3.2 2 0 2 0 2 0.6
Heyburn 3.2 1 0 0 0 0 0.0
Homedale 2.6 0 0 0 0 0 0.0
Iona 2.1 0 0 0 0 0 0.0
Kel logg 2.1 5 0 3 0 3 1.4
Ketchum 2.7 2 0 1 0 1 0.4
Kimberly 3.6 1 1 0 1 0 0.3
Malad 2.1 0 0 0 0 0 0.0
McCal l 3.1 3 0 2 0 2 0.6
Montpel ier 2.5 0 0 0 0 0 0.0
Orofino 3.1 5 0 4 0 4 1.3
Parma 2.1 0 0 0 0 0 0.0
Rigby 4.0 2 0 0 0 0 0.0
St. Anthony 3.4 1 0 1 0 1 0.3
St. Maries 2.3 1 0 0 0 0 0.0
Sa lmon 3.0 4 0 2 0 5 0.7
Shel ley 4.3 3 1 1 1 2 0.5
Soda Springs 2.9 0 0 0 0 0 0.0
Spiri t Lake 2.1 0 0 0 0 0 0.0
Wendel l 2.7 1 0 1 0 1 0.4
Mean Crash Rate 0.3
Number of Crashes Number of Persons
Table 26 (Continued)
Impaired Driving Crashes by City: 2015

-46-
SafetyRestraintUsageIdaho's seat belt use law, effective July 1, 1986, requires seat belt use for front seat passengers anddrivers,regardlessofresidency,invehicleswithagrossvehicleweightof8,000poundsorlessthatweremanufacturedwithsafetybelts.Thelawisa"secondary"lawandcanonlybeenforcedwhensomeoneisstopped for another traffic violation. The law was updated July 1, 2003. It now covers all seatingpositionsandhasenhancedpenalties fordrivers less than18yearsof age. Driversandoccupants,18yearsofageandolder,receiveseparatetickets.Figure13depictsobservedseatbeltusebyyearforbothIdahoandtheU.S.Thefiguresaretheobservedratesforpersonsinpassengercars,pickups,sportutilityvehicles,andvans,whichmakeup93%ofthevehicles involved in motor vehicle crashes. The U.S. usage rate comes from the National OccupantProtectionUseSurvey(NOPUS)andtheminiNOPUS,whicharedonealternatelyeveryyear.
Figure13ObservedSeatBeltUsage–Idahovs.U.S.:2006‐2015
0%
10%
20%
30%
40%
50%
60%
70%
80%
90%
100%
2006 2007 2008 2009 2010 2011 2012 2013 2014 2015
80% 78%77% 79% 78% 79% 79%
82% 80% 81%
81% 82% 83% 84% 85% 84% 86% 87% 87% 89%
Idaho U.S.
The methodology for national seat belt surveys differs from that of Idaho and does not include anyobservationsitesinIdaho.

-47-
ObservationalSeatBeltSurveyResults
Table 27 shows the observed shoulder harness seat belt use by county. The methodology for theobservationalseatbeltsurveywasrevisedin2013andanewsetofcountiesandobservationsiteswereselectedforthesample.
Change Avg. Change
2011 2012 2013 2014 2015 2014‐2015 2011‐2014
Ada 95.5% 94.7% 92.2% 92.2% 93.9% 1.8% ‐1.2%
Bannock 62.2% 67.2% 81.2% 80.5% 87.2% 8.3% 9.3%
Bingham 55.0% 57.0% 81.0% 71.2% 79.7% 11.9% 11.2%
Bla ine 71.4% 71.2% ‐‐‐‐‐ ‐‐‐‐‐ ‐‐‐‐‐ ‐‐‐‐‐ ‐‐‐‐‐
Bonner 66.9% 71.0% 78.3% 81.0% 78.8% ‐2.7% 6.6%
Bonnevi l le 67.3% 67.3% 76.9% 70.5% 65.9% ‐6.5% 2.0%
Canyon 92.7% 94.2% 81.4% 91.9% 88.1% ‐4.1% 0.3%
Cass ia 56.5% 57.8% ‐‐‐‐‐ ‐‐‐‐‐ ‐‐‐‐‐ ‐‐‐‐‐ ‐‐‐‐‐
Elmore 72.8% 76.4% 88.2% 90.5% 89.4% ‐1.2% 7.7%
Gem ‐‐‐‐‐ ‐‐‐‐‐ 68.8% 80.2% 72.7% ‐‐‐‐‐ ‐‐‐‐‐
Gooding ‐‐‐‐‐ ‐‐‐‐‐ 71.2% 68.6% 56.2% ‐‐‐‐‐ ‐‐‐‐‐
Kootenai 75.8% 72.3% 71.8% 75.9% 74.1% ‐2.3% 0.1%
Latah 81.0% 85.4% 78.1% 83.5% 82.9% ‐0.7% 1.3%
Madison 68.6% 74.4% 71.6% 72.2% 67.7% ‐6.2% 1.8%
Minidoka 66.1% 60.5% 71.6% 62.9% 57.0% ‐9.4% ‐0.8%
Nez Perce 88.6% 86.5% 85.5% 80.6% 78.2% ‐3.0% ‐3.1%
Payette 92.6% 92.4% 88.3% 90.5% 92.1% 1.8% ‐0.7%
Twin Fa l l s 69.1% 73.6% 76.9% 68.8% 59.7% ‐13.3% 0.1%
Statewide 79.1% 79.0% 81.6% 80.2% 81.1% 1.1% 0.5%
Observed Seat Belt Use by County: 2011‐2015
Table 27
TheOffice ofHighwaySafety evaluates compliance rates through analysis of crashdata and statewideobservational surveys of seat belt use. Observational surveys are conducted by observing shoulderharnessuseornon‐use. Theobservationalsurveyisarepresentativesampleofthestateanddoesnotincludeallcounties.

-48-
Table28showstheobservedseatbeltusefortheIdahoTransportationDepartment(ITD)districts4byvehicletype.AmapofthetransportationdistrictscanbefoundinAppendixA.District3(south‐westernIdaho) had the highest overall usage at 89.5%, while district 4 (south‐central Idaho) had the overalllowestusageat57.8%.
Passenger Cars, Vans, and
ITD District Sport Utility Vehicles Pickup Trucks All Vehicles
1 76.4% 70.4% 74.4%
2 81.2% 73.5% 78.6%
3 90.9% 86.2% 89.5%
4 61.8% 51.8% 57.8%
5 88.2% 82.6% 86.6%
6 71.6% 48.7% 66.0%
Statewide 83.4% 75.8% 81.1%
Table 28
Idaho Safety Belt Observation Survey: 2015 – Usage by Vehicle Type
Usageratesfortheoccupantsofpickuptruckscontinuetobelowerthanusageratesforothertypesofpassengervehicles. Theusagerateforpickuptruckoccupantsin2015rangedfromahighof86.2%inDistrict3(south‐westernIdaho)toalowof48.7%inDistrict6(north‐easternIdaho).

-49-
Self‐ReportedSeatBeltUsageResults
Table29showstheself‐reportedseatbeltuse forpeople,ages7andolder, inpassengercars,pickups,sportutilityvehicles,andvansthatwerekilledorseriouslyinjured.Thechildpassengersafetyseatlawwasupgradedin2005toincludechildrenage6andyounger.Researchhasindicatedthereisatendencyforpersonsinvolvedincrashestofalselyreportcompliancewiththeseatbeltlawandthus,self‐reporteduse tends to overstate actual use5. Seat belt useby severely or fatally injuredoccupants canbemoredirectly assessedby lawenforcementofficersor emergencymedicalpersonnel, and is therefore,morereliable.
Change Avg. Change
Injury Type 2011 2012 2013 2014 2015 2014‐2015 2011‐2014
Fata l i ties ‐Restra ints Used 31.7% 43.0% 33.1% 44.3% 37.6% ‐15.1% 15.4%
Serious Injuries ‐Restra int Used 66.2% 65.8% 63.2% 64.2% 66.8% 4.0% ‐1.0%
Table 29
Self‐Reported Seat Belt Use: 2011‐2015Age 7 and Older in Passenger Cars, Pickups, Sport Utility Vehicles, and Vans
Ofthe157passengermotorvehicleoccupantsovertheageof7killedin2015,only59wereusingseatbelts. The National Highway Traffic Safety Administration estimates seat belts are 50% effective inpreventingfatalitiesandseriousinjuries.Bythisestimate,therewere59livessavedin2015byseatbeltusageandanadditional46lives(halfofthosekilledandunbelted)couldhavebeensavedifeveryonehadbuckledup.
CostsofInjuriesbySafetyRestraintUse
Injury Type Used Not Used Unknown Used Not Used Unknown
Fata l i ty 59 92 6 $560,430,153 $873,891,086 $56,992,897
Serious Injury 679 262 76 $308,456,913 $119,021,666 $34,525,369
Vis ible Injury 2,820 439 231 $348,923,857 $54,318,288 $28,582,061
Poss ible Injury 5,965 549 449 $376,877,472 $34,686,627 $28,368,480
No Injury 36,784 1,650 3,195 $117,735,325 $5,281,190 $10,226,304
Total $1,712,423,720 $1,087,198,858 $158,695,111
Costs of Injuries
Table 30
2015 Costs of Injuries
Persons Using Safety Restraints versus Persons Not Using Safety Restraints
Safety Restraints
Age 7 & Older in Passenger Cars, Pickups, Sport Utility Vehicles, and Vans
Self‐reported seat belt use canbebiasedbecauseof thepenalties involved fornotwearing a seatbelt(meaningpeoplemisrepresenttheirbeltusetoavoidaticket).Thenumberofpeopleusingseatbeltsishigher for the less severe injury categories becauseof this bias, but alsobecause seat belts lessen theseverityofinjuriessustainedincrashes.

-50-
LocalSafetyRestraintUsage
Table31presentsself‐reportedrestraintuseratesforallmotorvehicleoccupants,7yearsoldandolder,involvedinfatalandseriousinjurycrashesforeachcounty,for2011through2015.Crashdataprovidesan analysis of the restraint use at the local level. This information is self‐reported to the investigatingofficerafteracrash.Theself‐reporteduseisforalloccupants,regardlessofinjurytype,involvedinfatalandseriousinjurycrashes.Valuesof“‐‐‐“indicatetherewerenofatalorseriousinjurycrashes.
Change Avg. Change
County by Population 2011 2012 2013 2014 2015 2014‐2015 2011‐2014
50,000 and over
Ada 87.9% 87.8% 83.3% 85.7% 84.1% ‐1.8% ‐0.8%
Bannock 72.9% 62.4% 61.5% 70.9% 74.8% 5.5% ‐0.2%
Bonnevi l le 63.5% 75.3% 65.5% 74.1% 77.9% 5.2% 6.2%
Canyon 81.2% 82.7% 79.6% 80.3% 79.6% ‐0.8% ‐0.4%
Kootenai 81.1% 77.8% 76.6% 72.9% 78.3% 7.3% ‐3.4%
Twin Fa l l s 76.3% 79.2% 69.2% 87.4% 78.5% ‐10.2% 5.9%
20,000 ‐ 49,999
Bingham 62.7% 41.4% 60.4% 55.6% 61.5% 10.6% 1.3%
Bla ine 70.6% 42.9% 82.4% 50.0% 63.0% 25.9% 4.5%
Bonner 64.9% 62.9% 73.2% 71.2% 68.2% ‐4.2% 3.5%
Cass ia 76.5% 53.3% 70.0% 57.6% 63.9% 11.0% ‐5.6%
Elmore 62.7% 57.8% 69.2% 80.0% 67.3% ‐15.8% 9.2%
Jefferson 53.3% 48.1% 35.3% 71.1% 63.9% ‐10.1% 21.6%
Jerome 69.8% 71.9% 62.9% 59.1% 52.6% ‐10.9% ‐5.2%
Latah 60.7% 77.6% 58.3% 46.4% 87.5% 88.5% ‐5.8%
Madison 43.3% 63.2% 69.7% 42.9% 57.1% 33.3% 5.9%
Minidoka 73.7% 72.7% 53.3% 53.8% 31.8% ‐40.9% ‐9.0%
Nez Perce 82.9% 74.1% 63.8% 62.1% 81.0% 30.4% ‐9.0%
Payette 71.4% 74.1% 70.7% 70.6% 62.8% ‐11.0% ‐0.3%
10,000 ‐ 19,999
Boundary 61.1% 72.7% 80.0% 47.4% 40.0% ‐15.6% ‐3.9%
Frankl in 88.9% 69.2% 14.3% 52.4% 72.7% 38.8% 55.1%
Fremont 69.2% 79.3% 36.0% 78.8% 59.3% ‐24.8% 26.3%
Gem 64.3% 95.0% 66.7% 36.8% 68.2% 85.1% ‐8.9%
Gooding 39.6% 62.5% 41.7% 23.1% 72.4% 213.8% ‐6.7%
Idaho 60.5% 50.0% 53.7% 51.1% 51.7% 1.3% ‐5.0%
Owyhee 18.2% 55.6% 36.0% 58.3% 22.2% ‐61.9% 77.5%
Shoshone 50.0% 60.0% 36.7% 58.8% 35.7% ‐39.3% 13.8%
Teton ‐‐‐‐ 50.0% 77.8% 50.0% 0.0% ‐100.0% ‐‐‐
Washington 64.7% 84.6% 33.3% 50.0% 73.7% 47.4% 6.7%
Table 31
Self‐Reported Restraint Use of All Occupants in Fatal and Serious Injury Crashes by County: 2011‐2015
in Passenger Cars, Pickups, Sport Utility Vehicles, and Vans

-51-
Change Avg. Change
County by Population 2011 2012 2013 2014 2015 2014‐2015 2011‐2014
5,000 ‐ 9,999
Bear Lake 66.7% 55.0% 80.0% 66.7% 40.0% ‐40.0% 3.8%
Benewah 85.7% 52.6% 35.3% 55.6% 63.6% 14.5% ‐4.7%
Boise 76.3% 45.5% 73.5% 60.0% 61.5% 2.6% 1.0%
Caribou 100.0% 50.0% 54.5% 33.3% 45.5% 36.4% ‐26.6%
Clearwater 10.0% 100.0% 55.6% 76.9% 25.0% ‐67.5% 298.0%
Lemhi 40.0% 30.0% 46.7% 0.0% 53.8% ‐‐‐‐ ‐23.1%
Lincoln 44.4% 16.7% 37.5% 76.9% 75.0% ‐2.5% 55.9%
Power 34.3% 50.0% 80.0% 53.8% 46.2% ‐14.3% 24.4%
Val ley 64.7% 77.3% 94.4% 81.8% 71.4% ‐12.7% 9.4%
0 ‐ 4,999
Adams 100.0% 28.6% 68.8% 0.0% 92.3% ‐‐‐ ‐10.3%
Butte 0.0% ‐‐‐ 0.0% 66.7% 16.7% ‐75.0% ‐‐‐
Camas ‐‐‐ ‐‐‐ ‐‐‐ ‐‐‐ 100.0% ‐‐‐ ‐‐‐
Clark 50.0% 66.7% 33.3% ‐‐‐ 100.0% ‐‐‐ ‐‐‐
Custer 44.4% 18.2% 91.7% 50.0% 71.4% 42.9% 99.9%
Lewis 70.0% 66.7% 33.3% 40.0% 100.0% 150.0% ‐11.6%
Oneida 66.7% 50.0% 37.5% 66.7% 33.3% ‐50.0% 9.3%
Statewide Average 73.1% 74.4% 74.6% 71.4% 75.0% 5.0% ‐0.8%
in Passenger Cars, Pickups, Sport Utility Vehicles, and Vans
Self‐Reported Restraint Use of All Occupants in Fatal and Serious Injury Crashes by County: 2011‐2015
Table 31 (Continued)

-52-
ChildSafetySeatUsagebyAgeGroups
Thechildsafetyseatlawwasupgradedin2005toincludeallchildrenundertheageof7yearsold.Thelawtookeffect July1,2005. Prior to that, IdahoCoderequiredeverychild,under theageof four,andweighing less than40poundsberestrained inacarsafetyseat thatmeets the federalstandardswhentravelinginanon‐commercialmotorvehiclemanufacturedwithseatbeltsafterJanuary1,1966.
Figure14ChildSafetySeatUsagebyAgeGroupinCrashes:2006‐2015
0.0%
10.0%
20.0%
30.0%
40.0%
50.0%
60.0%
70.0%
80.0%
90.0%
100.0%
2006 2007 2008 2009 2010 2011 2012 2013 2014 2015
91% 91% 93%90% 90% 90%
88%92%
94% 93%
54%58%
64%60% 61%
63%
59%63% 62% 62%
Ages 0 to 3 Ages 4 to 6
Parentsarecontinuingtoplacetheirveryyoungchildren(ages0‐3)inachildsafetyseatatahighrate(93%),whileonly62%placetheirtoddlers(ages4‐6)inchildsafetyseatsorboosterseats,eventhoughtheyaretoosmallforseatbeltstofitthemcorrectly.

-53-
ChildSafetySeat–Self‐ReportedUsage
Change Avg. Change
Injury Type 2011 2012 2013 2014 2015 2014‐2015 2011‐2014
Fata l i ties
Restra ined 2 1 1 3 3 0.0% 50.0%
Unrestra ined 2 1 2 5 2 ‐60.0% 66.7%
Serious Injuries
Restra ined 10 7 9 9 7 ‐22.2% ‐0.5%
Unrestra ined 7 6 4 11 5 ‐54.5% 42.5%
Vis ible Injuries
Restra ined 47 44 55 64 66 3.1% 11.7%
Unrestra ined 22 36 35 15 30 100.0% 1.2%
Poss ible Injuries
Restra ined 173 179 209 160 267 66.9% ‐1.1%
Unrestra ined 51 59 68 49 76 55.1% 1.0%
No Injuries
Restra ined 2,019 1,913 2,053 2,051 2,150 4.8% 0.7%
Unrestra ined 454 592 501 476 498 4.6% 3.3%
Tota l Restra ined 2,251 2,144 2,324 2,287 2,493 9.0% 0.7%
Tota l Unrestra ined 536 694 608 556 611 9.9% 2.8%
% of Chi ldren Restra ined 80.8% 75.5% 79.3% 80.4% 80.3% ‐0.2% 0.0%
Self‐Reported Child Safety Seat Use by Injury Type: 2011‐2015
Under Age 7
in Passenger Cars, Pickups, Sport Utility Vehicles, and Vans
Table 32
The National Highway Traffic Safety Administration (NHTSA) estimates child safety seats are 69%effectiveinpreventingfatalitiesandseriousinjuries.Bythisestimatewecandeducethatachildsafetyseatssaved7livesin2015.Anotherlivemayhavebeensavedifallchildrenhadbeenrestrainedinchildsafetyseats.Additionally,16seriousinjurieswerepreventedand3ofthe5unrestrainedseriousinjuriesmayhavebeenpreventediftheyhadallbeenproperlyrestrained.

-54-
AggressiveDrivingAggressivedrivingbehaviorsinclude:failuretoyieldrightofway,failtoobeystopsign,exceededpostedspeed,drivingtoofastforconditions,followingtooclose,andfailtoobeysignal.Aggressivedrivingisnottobeconfusedwithroadrage,whichisadeliberateandviolentactagainstanotherdriverorindividualandisacriminaloffense.Anofficermayindicateuptothreecontributingcircumstancesforeachvehicleinacrash.Thusthetotalnumberoffatalitiesandinjuriesattributedtothesebehaviorsinthetopportionofthetabledonotequalthesumofthefatalitiesandinjuriesattributedtoindividualbehaviorsinthebottomofthetable.
Change Avg. Change
2011 2012 2013 2014 2015 2014‐2015 2011‐2014
Tota l Aggress ive Driving Crashes 10,266 11,442 12,522 12,366 12,383 0.1% 6.5%
Fata l i ties 64 66 84 72 77 6.9% 5.4%
Serious Injuries 573 629 635 649 637 ‐1.8% 4.3%
Vis ible Injuries 1,726 1,944 2,109 2,077 2,282 9.9% 6.5%
Poss ible Injuries 3,546 3,964 4,255 4,356 4,652 6.8% 7.2%
Number of Traffic Fata l i ties and Serious Injuries Involving:*
Fa i l to Yield Right of Way 238 233 244 229 276 20.5% ‐1.2%
Driving Too Fast for Condi tions 174 215 219 205 171 ‐16.6% 6.3%
Fol lowing Too Close 79 93 95 124 115 ‐7.3% 16.8%
Fai l to Obey Stop Sign 65 100 97 102 92 ‐9.8% 18.7%
Exceeded Posted Speed 65 63 68 58 49 ‐15.5% ‐3.3%
Fai l to Obey Signa l 59 63 50 60 50 ‐16.7% 2.0%
Aggress ive Driving Fata l and Serious
Injury Rate per 100 Mil l ion AVMT 4.13 4.39 4.53 4.47 4.29 ‐4.0% 2.7%
* Three contributing circumstances possible per unit involved in each crash
Table 33
Aggressive Driving Crashes: 2011‐2015
In2015,aggressivedrivingwasacontributing factor in52%ofall crashes in Idaho. While74%ofallaggressivedrivingcrashesoccurinurbanareas,70%ofthefatalaggressivedrivingcrashesoccurinruralareas.Only15%ofallaggressivedrivingcrashesinvolvedasinglevehicle,while39%offatalaggressivedrivingcrashes involved only one vehicle. Of the 28 fatal aggressive driving crashes that involved a singlevehicle,22(or79%)occurredinruralareas.Theeconomiccostofcrashesinvolvingaggressivedrivingwasnearly$1.7billiondollarsin2015. Thisrepresents44%ofthetotalcostsofIdahocrashes(asshowninTable4).

-55-
InvolvementinAggressiveDrivingCrashesbyDriverAgeDriversages19andyoungerwere4.4timesaslikelytobeinvolvedinaggressivedrivingcrashesasallotherdrivers,whiledrivers ages20 to24 are2.2 timesas likely as all otherdrivers tobe involved inaggressivedrivingcrashes.(Note:theoddsratiosabovecomparetheinvolvementofagroupofdriverstotheinvolvementofallotherdriverscombined.)Driversundertheageof25representmorethanone‐third(38%)ofthedriversinvolvedinaggressivedrivingcrashes.
Age Number % Number % Involvement* Number % Involvement*
0‐14 0 0.0% 17 0.1% 12 0.2%
15 3,443 0.3% 174 1.4% 4.6 59 1.1% 3.8
16 10,545 0.9% 525 4.2% 4.5 197 3.8% 4.1
17 14,989 1.3% 661 5.2% 4.0 266 5.1% 3.9
18 17,106 1.5% 692 5.5% 3.7 284 5.4% 3.6
19 19,181 1.7% 605 4.8% 2.9 246 4.7% 2.8
20 19,352 1.7% 463 3.7% 2.2 185 3.5% 2.1
21 18,343 1.6% 468 3.7% 2.3 186 3.6% 2.2
22 19,598 1.7% 408 3.2% 1.9 173 3.3% 1.9
23 20,400 1.8% 406 3.2% 1.8 150 2.9% 1.6
24 20,626 1.8% 379 3.0% 1.7 159 3.1% 1.7
25‐34 196,056 17.1% 2,442 19.4% 1.1 1,021 19.6% 1.1
35‐44 186,231 16.3% 1,624 12.9% 0.8 696 13.4% 0.8
45‐54 186,222 16.3% 1,316 10.4% 0.6 558 10.7% 0.7
55‐64 195,777 17.1% 1,067 8.5% 0.5 446 8.6% 0.5
65‐74 139,818 12.2% 690 5.5% 0.4 295 5.7% 0.5
75+ 76,605 6.7% 518 4.1% 0.6 229 4.4% 0.7
Not Stated
or Other 157 1.2% 50 1.0%
TOTALS 1,144,292 12,612 5,212
* Involvement is calculated by dividing the percent of Crashes by the percent of licensed drivers.
Over‐representation occurs when the value is greater than 1.0.
Drivers in All
Table 34
Involvement in Aggressive Driving Crashes by Drivers Age: 2015
Licensed
Drivers Aggressive Driving Crashes
Drivers in Fatal and Injury
Aggressive Driving Crashes

-56-
DistractedDrivingDistracted driving crashes are thosewhere investigating law enforcement officer indicates that eitherinattention or a distraction in or on the vehicle was a contributing factor in the crash. Distraction is defined by theNationalHighwayTrafficSafetyAdministrationasaspecifictypeofinattentionthatoccurswhendriversdiverttheirattentionawayfromthetaskofdrivingtofocusonanotheractivity.Distractioniscategorizedintothethreefollowingtypes:visual(takingyoureyesofftheroad),manual(takingyourhandsoffthewheel),andcognitive(takingyourmindofftheroad).
Change Avg. Change
2011 2012 2013 2014 2015 2014‐2015 2011‐2014
Tota l Dis tracted Driving Crashes 4,925 4,890 4,757 4,781 5,470 14.4% ‐1.0%
Fata l i ties 41 41 43 39 51 30.8% ‐1.5%
Serious Injuries 372 422 339 364 425 16.8% 0.4%
Vis ible Injuries 1,064 1,005 996 1,033 1,285 24.4% ‐0.9%
Poss ible Injuries 1,906 1,792 1,831 1,846 2,211 19.8% ‐1.0%
Distracted Driving Crashes as a
% of Al l Crashes 23.6% 22.8% 21.3% 21.6% 22.8% 5.4% ‐2.9%
Distracted Driving Fata l i ties as a
% of Al l Fata l i ties 24.6% 22.3% 20.1% 21.0% 23.6% 12.6% ‐4.9%
Distracted Driving Injuries as a
% of Al l Injuries 30.8% 29.3% 27.9% 27.6% 29.7% 7.7% ‐3.6%
Al l Fata l and Injury Crashes 7,644 8,049 8,049 8,392 9,248 10.2% 3.2%
Distracted Fata l/Injury Crashes 2,248 2,153 2,096 2,182 2,568 17.7% ‐0.9%
% DistractedDriving 29.4% 26.7% 26.0% 26.0% 27.8% 6.8% ‐3.9%
Distracted Driving Fata l i ty and Serious
Injury Rate per 100 Mil l ion Vehicle
Mi les Of Travel 2.68 2.92 2.41 2.50 2.86 14.5% ‐1.6%
Table 35
Distracted Driving Crashes: 2011‐2015
Distracted driving crashes made up 23% of all crashes in 2015 and were responsible for 24% of allfatalities. While 73% of all distracted driving crashes occurred on urban roadways, 74% of the fataldistracteddrivingcrashesoccurredonruralroadways.Whileonly19%ofalldistracteddrivingcrashesinvolvedasinglevehicle,48%offataldistracteddrivingcrashesinvolvedasinglevehicle.Theeconomiccostofcrashes involvingdistracteddrivingwasover$985milliondollars in2015. Thisrepresents27%ofthetotalcostsofIdahocrashes(asshowninTable4).Figures15and16on the followingpageshowwhat thedistractionswere forcrasheswere theofficerindicatedDistractedinoronVehicleasacontributingcircumstance.Therewere11fataland1,009totalcrashesthatinvolvedDistractedinoronVehicle.Inattentionmakesupalargerportionofthedistracteddriving crashes. Of course, both Inattention and Distracted in or on Vehicle could be contributingcircumstancesinasinglecrash.
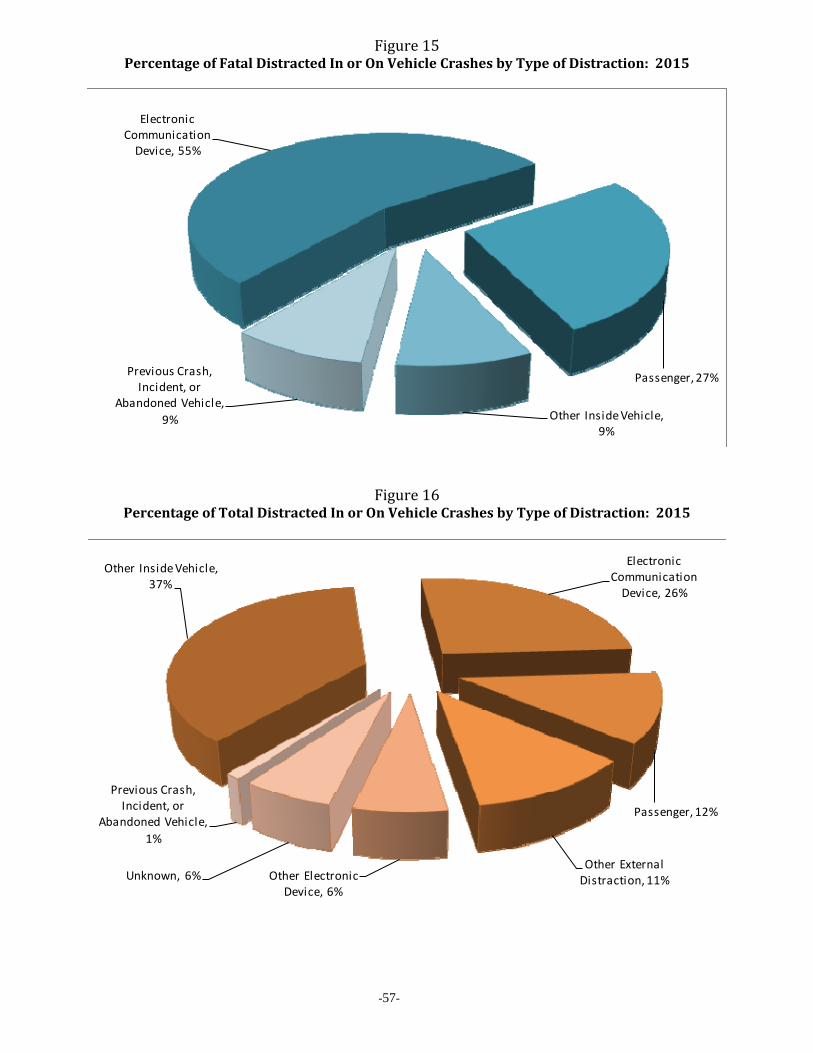
-57-
Figure15PercentageofFatalDistractedInorOnVehicleCrashesbyTypeofDistraction:2015
Electronic Communication Device, 55%
Passenger, 27%
Other Inside Vehicle, 9%
Previous Crash, Incident, or
Abandoned Vehicle,
9%
Figure16PercentageofTotalDistractedInorOnVehicleCrashesbyTypeofDistraction:2015
Other Inside Vehicle, 37%
Electronic Communication Device, 26%
Passenger, 12%
Other External Distraction, 11%Other Electronic
Device, 6%Unknown, 6%
Previous Crash, Incident, or
Abandoned Vehicle,
1%

-58-
YouthfulDriversYouthfuldriversaredriversages15to19.In2015,morethanoneoutofeveryfivecrashesinvolvedayouthful driver. In 2015, youthful driverswere involved in 2.5 times asmany crashes as youwouldexpectthemtobeandwere2.8timesaslikelyasallotherdriverstobeinvolvedinacrash.
Change Avg. Change
2011 2012 2013 2014 2015 2014‐2015 2011‐2014
Tota l Crashes 4,648 4,796 4,825 4,668 5,374 15.1% 0.2%
Fata l i ties 34 14 26 20 34 70.0% 1.3%
Serious Injuries 211 230 214 198 270 36.4% ‐1.8%
Vis ible Injuries 784 782 785 812 997 22.8% 1.2%
Poss ible Injuries 1,541 1,541 1,524 1,547 1,903 23.0% 0.1%
Drivers 15‐19 in Fata l &
Serious Injury Crashes 201 211 197 182 232 27.5% ‐3.1%
% of al l Drivers in Fata l &
Serious Injury Crashes 10.7% 11.2% 10.5% 9.4% 12.0% 27.5% ‐3.9%
Licensed Drivers 15‐19 62,674 62,094 62,398 62,895 65,264 3.8% 0.1%
% of Tota l Licensed Drivers 5.7% 5.7% 5.6% 5.6% 5.7% 2.3% ‐0.9%
Driver Involvement Rate* 1.85 1.98 1.87 1.69 2.11 24.6% ‐2.7%
Teen Drivers in Fata l Crashes 28 12 22 19 32 68.4% 4.2%
Impaired Teen Drivers
in Fata l Crashes 8 3 5 4 7 75.0% ‐5.3%
% of Youthful Drivers
Involved in Fata l Crashes
that were Impaired 28.6% 25.0% 22.7% 21.1% 21.9% 3.9% ‐9.7%
*The Driver Involvement Rate is the percent of drivers invovled in fatal and serious injury Crashes divided by percent
of licensed drivers. Over‐representation occurs when the value is greater than 1.0.
Table 36
Crashes Involving Youthful Drivers (15 to 19 Years Old): 2011‐2015
The 34 people killed in youthful driver crasheswere of all ages, not just youthful drivers. Of the 34peoplekilledinyouthfuldrivercrashes,14weretheyouthfuldrivers.Ofthe8youthfuldriverskilled,1wasonanATV,2wereonMotorcyclesand11weredrivingpassengermotorvehicles.Only4(36%)oftheyouthfuldriversofpassengermotorvehicleswerewearingseatbelts.Additionally,therewere6teenpassengerskilledinmotorvehiclecrashes(1ofthemwaskilledinacrashinvolvingayouthfuldriver).Ofthe6teenpassengermotorvehiclepassengerskilledincrashes,onlyoneofthemwaswearingaseatbelt.While 71%of all crashes involving youthful drivers occurred in urban areas, 67%of the fatal crashesinvolvingyouthfuldriversoccurredinruralareas.In2015, theeconomiccostofcrashes involvingyouthfuldriverswasnearly$728milliondollars. Thisrepresents19%ofthetotalcostofcrashes(asshowninTable4).

-59-
EmergencyMedicalServicesTable 37 shows Emergency Medical Services (EMS) response to crashes in Idaho. EMS response tocrashes indicates the number of crashes where an EMS unit responded and transported persons tomedicalfacilities.
Change Avg. Change
2011 2012 2013 2014 2015 2014‐2015 2011‐2014
Tota l Crashes 20,833 22,347 22,347 22,134 24,018 8.5% 2.1%
Fata l & Injury Crashes
With EMS Response 5,140 5,150 5,342 5,602 6,142 9.6% 2.9%
% with EMS Response 65.9% 64.0% 66.4% 66.8% 66.4% ‐0.5% 0.5%
Persons Ki l led or Injured in Crashes 11,033 11,557 11,557 11,954 13,423 12.3% 2.7%
Transported from Urban Areas 2,258 2,288 2,272 2,278 2,589 13.7% 0.3%
Transported from Rural Areas 2,236 2,214 2,189 2,288 2,321 1.4% 0.8%
Tota l Transported by EMS 4,494 4,502 4,461 4,566 4,910 7.5% 0.5%
% of Ki l led/Injured Transported 40.7% 39.0% 38.6% 38.2% 36.6% ‐4.2% ‐2.1%
Trapped and Extricated 457 439 424 459 504 9.8% 0.3%
Fata l/Serious Injuries Transported
by Hel icopter 149 147 142 110 173 57.3% ‐9.1%
Table 37
Emergency Medical Services Response to Crashes: 2011‐2015
TheavailabilityandqualityofservicesprovidedbylocalEMSmaymeanthedifferencebetweenlifeanddeath for someone injured in a traffic crash. Improved post‐crash victim care works to reduce theseverityoftraumaincurredbycrashvictims.Thesoonersomeonereceivesappropriatemedicalcare,thebettertheirchancesofrecovery.Thiscareisespeciallycriticalinruralareasbecauseofthetimeneededtotransportavictimtoatraumahospital.

-60-
PedestriansinCrashesCrashesinvolvingpedestriansdecreasedby11%in2015,andthenumberofpedestrianskilledinmotorvehiclecrashesdecreasedby43%. Ofallpedestrians involved incrashes in2015,96%receivedsomedegreeofinjury.Ofthepedestrianskilledinmotorvehiclecrashesin2015,onewas13yearsoldandtheother 7 were 23 years of age or older. Impaired pedestrians were involved in 6% of all pedestriancrashesand25%offatalpedestriancrashes.
Change Avg. Change
2011 2012 2013 2014 2015 2014‐2015 2011‐2014
Pedestrian Crashes 216 229 206 232 207 ‐10.8% 2.9%
Fata l i ties 10 13 14 14 8 ‐42.9% 12.6%
Serious Injuries 55 53 53 55 51 ‐7.3% 0.0%
Vis ible Injuries 80 102 88 87 103 18.4% 4.2%
Poss ible Injuries 66 69 53 78 66 ‐15.4% 9.5%
Pedestrians in Crashes 226 242 218 245 224 ‐8.6% 3.2%
Pedestrian Fata l and Serious Injuries 65 66 67 69 59 ‐14.5% 2.0%
% of Al l Fata l and Serious Injuries 4.5% 4.5% 4.5% 4.7% 3.8% ‐20.4% 2.0%
Impaired Fata l and Serious Injuries* 9 9 10 7 6 ‐14.3% ‐6.3%
% of Ped Fata l & Serious Injuries 13.8% 13.6% 14.9% 10.1% 10.2% 0.2% ‐8.0%
Pedestrians Ki l led or Injured in Crashes by Age
0 to 3 3 7 6 5 1 ‐80.0% 34.1%
4 to 14 34 41 34 35 46 31.4% 2.2%
15 to 19 34 43 31 47 29 ‐38.3% 16.7%
20 to 24 21 31 31 25 26 4.0% 9.4%
25 to 34 26 23 20 29 30 3.4% 6.8%
35 to 44 18 14 27 25 20 ‐20.0% 21.1%
45 to 54 29 30 22 19 21 10.5% ‐12.3%
55 to 64 22 13 21 21 19 ‐9.5% 6.9%
65 and Older 22 18 14 24 22 ‐8.3% 10.3%
Miss ing/Unknown Age 2 1 2 4 2 ‐50.0% 50.0%
* Implies the pedestrian was impaired, the sobriety of the driver that struck the pedestrian is not taken into account.
Table 38
Pedestrians in Crashes: 2011‐2015
In 2015, the economic cost of crashes involving pedestrianswas justmore than $116million dollars.Thisrepresents3%ofthetotalcostofIdahocrashes(asshowninTable4).

-61-
BicyclistsinCrashesThe number of bicycle crashes decreased by 3% in 2015 and there were no bicyclists killed. Of thebicyclistsinvolvedincrashesin2015,96%receivedsomedegreeofinjury. Ofallbicyclistsinvolvedincrashesin2015,18%werebetweentheagesof4and14.
Change Avg. Change
2011 2012 2013 2014 2015 2014‐2015 2011‐2014
Bicycle Crashes 346 389 334 296 286 ‐3.4% ‐4.4%
Fata l i ties 0 2 3 2 0 ‐100.0% 38.9%
Serious Injuries 45 51 51 41 36 ‐12.2% ‐2.1%
Vis ible Injuries 174 206 167 152 149 ‐2.0% ‐3.2%
Poss ible Injuries 117 117 104 100 101 1.0% ‐5.0%
Bicycl i s ts in Crashes 349 399 341 305 353 15.7% ‐3.6%
Bicycle Fata l and Serious Injuries 45 53 54 43 36 ‐16.3% ‐0.2%
% of Al l Fata l and Serious Injuries 3.1% 3.6% 3.7% 2.9% 2.3% ‐22.0% ‐0.1%
Bicycl i s ts in Crashes Wearing Helmets 83 97 69 82 63 ‐23.2% 2.3%
% of Bicycl i s ts Wearing Helmets 23.8% 24.3% 20.2% 26.9% 17.8% ‐33.6% 6.1%
Impaired Fata l and Serious Injuries* 2 2 1 2 0 ‐100.0% 16.7%
% of Bicycle Fata l & Serious Injuries 4.4% 3.8% 1.9% 4.7% 0.0% ‐100.0% 28.4%
Bicycl i s ts Ki l led or Injured in Crashes by Age
0 to 3 1 0 1 1 1 0.0% 33.3%
4 to 14 74 70 54 54 50 ‐7.4% ‐9.4%
15 to 19 66 66 57 45 48 6.7% ‐11.6%
20 to 24 51 59 56 55 44 ‐20.0% 2.9%
25 to 34 59 66 49 45 39 ‐13.3% ‐7.4%
35 to 44 31 38 38 36 35 ‐2.8% 5.8%
45 to 54 30 35 25 32 23 ‐28.1% 5.4%
55 to 64 16 27 19 19 28 47.4% 13.0%
65 and Older 7 13 18 6 5 ‐16.7% 19.2%
Miss ing/Unknown Age 1 0 8 2 4 100.0% #DIV/0!
* Implies the bicyclist was impaired, the sobriety of the driver that struck the bicyclist is not taken into account.
Table 39
Bicyclists in Crashes: 2011‐2015
Thepercentageofbicyclistsinvolvedincrashesthatwerewearinghelmetscontinuestoremainverylowat22%.However,32%ofbicyclists35yearsofageandolderinvolvedincrasheswerewearinghelmetswhileonly17%ofbicyclistsunderage35werewearinghelmets.In2015,theeconomiccostofcrashesinvolvingbicyclistswas$41milliondollars.Thisrepresents1%ofthetotalcostofIdahocrashes(asshowninTable4).

-62-
MotorcyclistsinCrashesThenumberofmotorcyclecrashes increased in2015by7%,whilethenumberofmotorcycle fatalitiesincreased12%.Ofallmotorcyclistsinvolvedincrashesin2015,88%receivedsomedegreeofinjury.Ofall motorcycle crashes, 9% involved impaired motorcyclists, while 54% of fatal motorcycle crashesinvolvedimpairedmotorcyclists.Roughlyfouroutofeveryninemotorcyclecrashes(45%)weresingle‐vehicle crashes and 64% of fatal motorcycle crashes involved only a single motorcycle. Of themotorcyclistskilledin2015,64%were40yearsofageorolder.Idaholawrequiresallmotorcycleoperatorsandpassengersundertheageof18towearahelmet;83%ofthose riders involved in crashes in 2015 were wearing a helmet. Only 56% of riders 18 and olderinvolvedincrasheswerewearinghelmets.
Change Avg. Change
2011 2012 2013 2014 2015 2014‐2015 2011‐2014
Motorcycle Crashes 489 545 517 510 546 7.1% 1.7%
Fata l i ties 17 22 26 25 28 12.0% 14.6%
Serious Injuries 153 158 150 146 174 19.2% ‐1.5%
Vis ible Injuries 192 253 221 207 225 8.7% 4.3%
Poss ible Injuries 104 105 95 87 131 50.6% ‐5.7%
Motorcycl i s ts in Crashes 549 621 584 562 611 8.7% 1.1%
Regis tered Motorcycles* 56,643 62,964 54,813 60,160 51,219 ‐14.9% 2.7%
Motorcycl i s ts Wearing Helmets 299 351 306 328 347 5.8% 3.9%
% Motorcycl i s ts Wearing Helmets 54.5% 56.5% 52.4% 58.4% 56.8% ‐2.7% 2.6%
Motorcycle Drivers in Crashes by Age
0 to 14 2 5 5 4 3 ‐25.0% 43.3%
15 to 20 27 40 34 39 48 23.1% 16.0%
21 to 24 50 52 52 51 52 2.0% 0.7%
25 to 34 92 109 102 103 94 ‐8.7% 4.3%
35 to 44 95 94 93 73 78 6.8% ‐7.9%
45 to 54 106 110 109 95 107 12.6% ‐3.3%
55 to 64 93 94 101 95 115 21.1% 0.9%
65 and up 24 47 32 52 49 ‐5.8% 42.1%
Miss ing/Unknown 3 0 1 3 6 100.0% #DIV/0!
* Obtained from Economics and Research Section, Idaho Transportation Department ‐ Units Registered by Registration Type
Table 40
Motorcyclists in Crashes: 2011‐2015
In2015,theeconomiccostofcrashesinvolvingmotorcyclistswas$381milliondollars.Thisrepresents10%ofthetotalcostofIdahocrashes(asshowninTable4).

-63-
CommercialMotorVehiclesinCrashesForthepurposesofcrashreporting,CMV’sarebuses,trucktractors,tractor‐trailercombinations,truckswithmorethantwoaxles,truckswithmorethantwotiresperaxle,ortrucksexceeding10,000poundsgrossvehicleweight.Thiscategoryalsoincludespickupswithdualrearwheelsandsmallervehiclesthatarecarryinghazardousmaterials.
Change Avg. Change
2011 2012 2013 2014 2015 2014‐2015 2011‐2014
Fata l Crashes 22 14 33 22 30 36.4% 22.0%
Injury Crashes 421 447 495 539 586 8.7% 8.6%
Tota l Crashes 1,535 1,521 1,681 1,613 1,768 9.6% 1.9%
Commercia l VMT (100 mil l ions) 26.9 27.4 28.2 28.6 29.3 2.6% 2.0%
Fata l Crash Rate 0.8 0.5 1.2 0.8 1.0 32.9% 19.1%
Injury Crash Rate 15.6 16.3 17.6 18.9 20.0 6.0% 6.4%
Tota l Crash Rate 57.0 55.5 59.6 56.4 60.3 6.8% ‐0.2%
Table 41
Commercial Motor Vehicle Crash Rates : 2011‐2015
Table 42 presents the location of CMV crashes by severity and roadway type. While 50% of all CMVcrashesoccurredonruralroadways,80%offatalCMVcrashestookplaceonruralroadways.
Interstate
Urban 0 0.0% 73 12.5% 66 5.7% 139 7.9%
Rura l 4 13.3% 80 13.7% 117 10.2% 201 11.4%
U.S. or State Highway
Urban 3 10.0% 69 11.8% 151 13.1% 223 12.6%
Rura l 15 50.0% 146 24.9% 235 20.4% 396 22.4%
Loca l
Urban 3 10.0% 144 24.6% 383 33.2% 530 30.0%
Rura l 5 16.7% 74 12.6% 200 17.4% 279 15.8%
Total 30
1.7%
Table 42
Location of Commercial Motor Vehicle Crashes by Roadway Type: 2015
Injury Damage
Property All
CrashesFatal
1,7681,152
65.2%
586
33.1%
ThelargestpercentageofallCMVcrashes(46%)occurredonlocalroads,whilethelargestpercentageoffatalCMVcrashes(60%)tookplaceonUSandStatehighways.

-64-
Table 43 shows the number of crashes by severity that each type of commercial motor vehicle wasinvolvedinfor2011to2015.
Change Avg. Change
2011 2012 2013 2014 2015 2014‐2015 2011‐2014
Bus
Fata l Crashes 1 0 1 0 1 0.0% 33.3%
Injury Crashes 32 23 28 26 30 15.4% ‐4.5%
Property Damage Crashes 75 66 86 82 76 ‐7.3% 4.6%
Single Unit Truck
Fata l Crashes 8 3 7 5 2 ‐60.0% 14.1%
Injury Crashes 116 120 119 148 153 3.4% 9.0%
Property Damage Crashes 291 237 266 293 289 ‐1.4% 1.3%
Single Unit Truck with Trai ler
Fata l Crashes 0 0 2 3 1 ‐66.7% 83.3%
Injury Crashes 14 12 6 9 6 ‐33.3% ‐4.8%
Property Damage Crashes 44 36 32 29 38 31.0% ‐12.9%
Truck Tractor Only (Bobta i l )
Fata l Crashes 0 0 1 0 0 0.0% 0.0%
Injury Crashes 10 10 9 11 10 ‐9.1% 4.1%
Property Damage Crashes 16 28 21 22 20 ‐9.1% 18.3%
Semi with Single‐Trai ler Configurations
Fata l Crashes 8 7 19 12 18 50.0% 40.7%
Injury Crashes 161 192 213 222 225 1.4% 11.5%
Property Damage Crashes 503 471 512 391 442 13.0% ‐7.1%
Semi with Double‐Tra i ler Configurations
Fata l Crashes 3 3 2 1 4 300.0% ‐27.8%
Injury Crashes 31 34 28 32 30 ‐6.3% 2.1%
Property Damage Crashes 91 78 60 56 68 21.4% ‐14.7%
Semi with Triple‐Trai ler Configurations
Fata l Crashes 0 0 1 0 0 0.0% 0.0%
Injury Crashes 4 2 1 3 4 33.3% 33.3%
Property Damage Crashes 9 3 7 8 6 ‐25.0% 27.0%
** Crashes between vehicle types are not mutually exclusive. In other words, a crash involving a bus and a single unit
truck would be represented in both catagories
Table 43
Crashes Involving Commercial Motor Vehicles by Vehicle Type : 2011‐2015
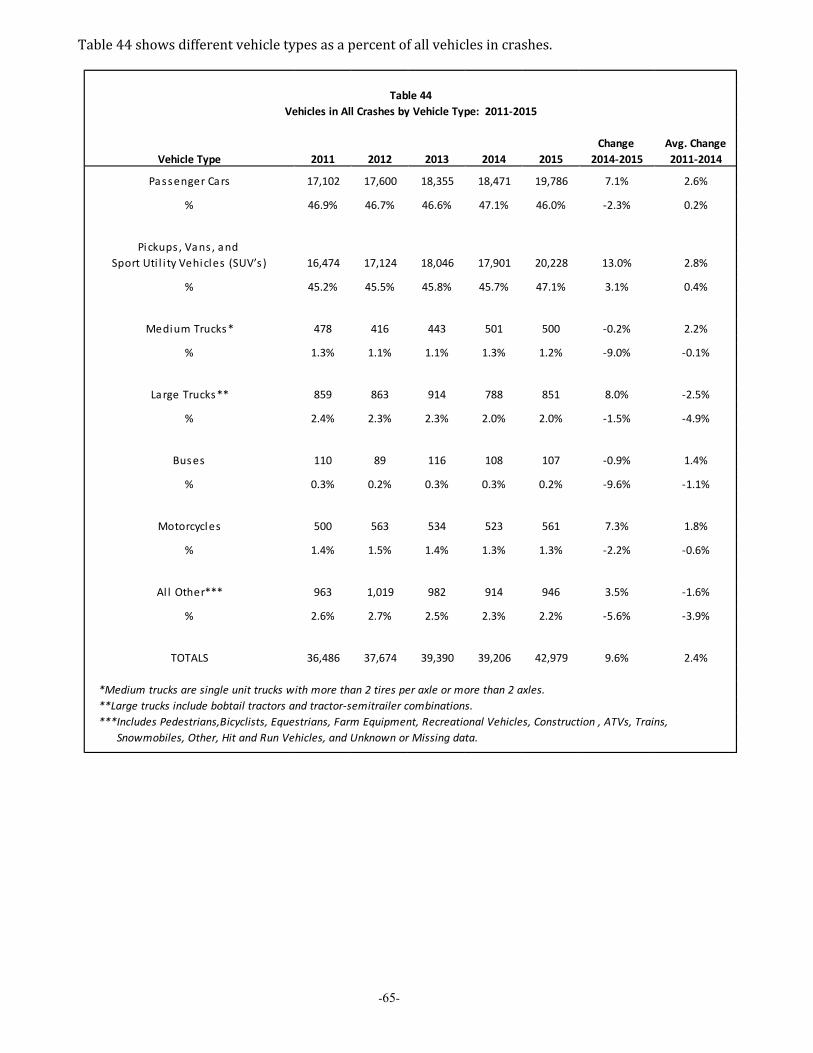
-65-
Table44showsdifferentvehicletypesasapercentofallvehiclesincrashes.
Change Avg. Change
Vehicle Type 2011 2012 2013 2014 2015 2014‐2015 2011‐2014
Passenger Cars 17,102 17,600 18,355 18,471 19,786 7.1% 2.6%
% 46.9% 46.7% 46.6% 47.1% 46.0% ‐2.3% 0.2%
Pickups , Vans , and
Sport Uti l i ty Vehicles (SUV’s ) 16,474 17,124 18,046 17,901 20,228 13.0% 2.8%
% 45.2% 45.5% 45.8% 45.7% 47.1% 3.1% 0.4%
Medium Trucks* 478 416 443 501 500 ‐0.2% 2.2%
% 1.3% 1.1% 1.1% 1.3% 1.2% ‐9.0% ‐0.1%
Large Trucks** 859 863 914 788 851 8.0% ‐2.5%
% 2.4% 2.3% 2.3% 2.0% 2.0% ‐1.5% ‐4.9%
Buses 110 89 116 108 107 ‐0.9% 1.4%
% 0.3% 0.2% 0.3% 0.3% 0.2% ‐9.6% ‐1.1%
Motorcycles 500 563 534 523 561 7.3% 1.8%
% 1.4% 1.5% 1.4% 1.3% 1.3% ‐2.2% ‐0.6%
Al l Other*** 963 1,019 982 914 946 3.5% ‐1.6%
% 2.6% 2.7% 2.5% 2.3% 2.2% ‐5.6% ‐3.9%
TOTALS 36,486 37,674 39,390 39,206 42,979 9.6% 2.4%
*Medium trucks are single unit trucks with more than 2 tires per axle or more than 2 axles.
**Large trucks include bobtail tractors and tractor‐semitrailer combinations.
***Includes Pedestrians,Bicyclists, Equestrians, Farm Equipment, Recreational Vehicles, Construction , ATVs, Trains,
Snowmobiles, Other, Hit and Run Vehicles, and Unknown or Missing data.
Table 44
Vehicles in All Crashes by Vehicle Type: 2011‐2015

-66-
Table45presentsinjuryseveritycomparisonsbyvehicletypeforallpersonsinCMVcrashes. In2015,therewere4,838people involved inCMVcrashes. Occupantsofpassengervehiclescomprised53%ofthe people involved in CMV crashes. Of the 34 fatalities that occurred in CMV crashes, 79% wereoccupantsofpassengercars,pickups,vans,orothervehicleswhile15%wereoccupantsofCMV’s.
Commercial Pickup, Van
Injury Severity Motor Vehicle Car and SUVs* All Other** Totals
Fatal i ties 5 11 16 2 34
% of Fata l i ties 14.7% 32.4% 47.1% 5.9% 0.7%
Serious Injuries 27 40 47 11 125
% of Serious Injuries 21.6% 32.0% 37.6% 8.8% 2.6%
Vis ible Injuries 69 77 96 7 249
% of Vis ible Injuries 27.7% 30.9% 38.6% 2.8% 5.1%
Poss ible Injuries 97 169 223 9 498
% of Poss ible Injuries 19.5% 33.9% 44.8% 1.8% 10.3%
Non‐Injury 2,001 630 1,278 23 3,932
% of Non‐ Injury 50.9% 16.0% 32.5% 0.6% 81.3%
Column Total s 2,199 927 1,660 52 4,838
(% OF TOTAL) 45.5% 19.2% 34.3% 1.1%
*SUV is an acronym for Sport Utility Vehicles.
**Includes pedestrians, bicyclists, motorcyclists, farm vehicles, construction equipment, RVs, and trains.
Comparison of Injury Severity for Persons in Commercial Motor Vehicle Crashes: 2015
Table 45
In 2015, the economic cost of crashes involving commercial motor vehicles was nearly $455 milliondollars.Thisrepresents12%ofthetotalcostofIdahocrashes(asshowninTable4).

-67-
MotorVehicleCrashesinWorkZones
Change Avg. Change
2011 2012 2013 2014 2015 2014‐2015 2011‐2014
Work Zone Crashes 441 342 332 407 444 9.1% ‐0.9%
Fata l i ties 3 1 3 1 2 100.0% 22.2%
Serious Injuries 35 23 12 34 27 ‐20.6% 33.7%
Vis ible Injuries 79 34 50 108 95 ‐12.0% 35.4%
Poss ible Injuries 128 104 109 204 222 8.8% 24.4%
% Al l Crashes 2.1% 1.5% 1.5% 1.8% 1.8% 0.5% ‐1.6%
Workers Injured 2 1 1 0 1 #DIV/0! 0.0%
Table 46
Crashes in Work Zones: 2011‐2015
Workerson the roadwayare especially vulnerable since their attention is focusedon the taskathandrather than on the traffic passing by. While most crashes occurring in work zones do not involve aworker,therehavebeenafewcrashesthathaveinvolvedworkers.In2011,aworkerwasstruckbythepassengermirrorbyahitandrunvehiclewhilemovingtrafficconesin Kootenai County and a worker was backed over by a cement truck in Canyon County. In 2012, aconstructionworkerwas injuredwhenbackedoverby a construction vehicle in a closed constructionzone in IdahoCounty. In2013a flaggerwas injured inacrash inAdaCounty. In2015,aworkerwasstruckandinjuredwhilesettinguporangebarrelsinaworkzoneinAdaCounty.Single‐vehiclecrashescomprised17%of thecrashes inworkzones in2015. Overturn (29%)was thepredominantmostharmfuleventinsingle‐vehiclecrashesinworkzonesfollowedbyImpactAttenuator(11%), Concrete Traffic Barrier (9%), Other Object ‐ Not Fixed (9%), Other Fixed Object (7%), andEmbankment (5%). Rear End (57%) was the predominant most harmful event for multiple‐vehiclecrashes inworkzones followedbySide‐Swipe‐SameDirection(14%),Angle(6%),andAngleTurning(6%).

-68-
Table47showsworkzonecrashesbyroadtype.
Interstate
Urban 1 50.0% 128 56.1% 47 22.0% 176 39.6%
Rura l 0 0.0% 13 5.7% 17 7.9% 30 6.8%
U.S. or State Highway
Urban 0 0.0% 35 15.4% 52 24.3% 87 19.6%
Rura l 0 0.0% 10 4.4% 15 7.0% 25 5.6%
Loca l
Urban 1 50.0% 33 14.5% 70 32.7% 104 23.4%
Rura l 0 0.0% 9 3.9% 13 6.1% 22 5.0%
Total 444
51.4% 48.2%
2
0.5%
Table 47
Work Zone Crashes by Roadway Type: 2015
228 214
Injury
Crashes
Property Damage All
Crashes
Fatal
Crashes Crashes
Table48showstheseverityofcrashesbytransportationdistrict.TransportationdistrictboundariescanbefoundinAppendixA.
Fatal Injury Property Damage Total
Crashes Crashes Crashes Crashes
Distri ct 1 1 14 23 38
Distri ct 2 0 7 9 16
Distri ct 3 1 178 144 323
Distri ct 4 0 13 13 26
Distri ct 5 0 10 14 24
Distri ct 6 0 6 11 17
Statewide 2 228 214 444
Table 48
Crashes in Work Zones by Transportation District: 2015
In2015,theeconomiccostofcrashesinworkzoneswasnearly$60milliondollars.Thisrepresents2%ofthetotalcostofIdahocrashes(asshowninTable4).
-69-
GlossaryofTermsThefollowingtermsareusedthroughoutthisreportandareprovidedtoclarifythemeaningofthedata.BICYCLE (PEDACYCLE): Every vehiclepropelled exclusively by human power uponwhichanypersonmayride,havingtwotandemwheels,exceptscootersandsimilardevices.CHILD SAFETY SEAT: A car safety seat thatmeets the requirements of Federal MotorVehicle Standard 213. As of July 1, 2005, everychildundertheageofseventhat is transportedin amotor vehiclemust be properly restrainedinsuchaseat.CRASH (TRAFFIC): An unintended event thatcausesadeath,injury,ordamageandinvolvesamotorvehicleonapublicroadway.DRIVER(OPERATOR): Everypersonwhoisinactualphysicalcontrolofamotorvehicleuponahighway.FATAL CRASH: Any motor vehicle crash thatresultedinthedeathofoneormorepersonsdueto injuries received from the crash within 30daysofthecrash.FATALITY: An individual involved in a motorvehicle crash who died within 30 days of thecrash as a result of injuries sustained in thecrash.HEAVY TRUCK: A motor vehicle exceeding8,000 pounds gross weight; has two or morewheelsperaxleorhasmorethantwoaxles;andis designed, used, or maintained primarily forthetransportationofproperty.IMPAIRED DRIVING CRASH: Any crash inwhich an officer indicated on the crash reportthat alcohol or drugs were used, or were acontributingfactorinthecrash.
INJURY:Bodilyharmtoapersonasaresultofamotorvehiclecrash.INJURYSEVERITY:Fatal Injury (Death) ‐Any injury that results inthedeathofapersonwithin30daysofthecrashinwhichtheinjurywassustained.Serious Injury (Incapacitating Injury) ‐ Anyinjury,other thana fatal injury,whichpreventsthe injured person from walking, driving, ornormally continuing the activities the personwas capable of performing before the injuryoccurred.Visible Injury (Non‐incapacitating, EvidentInjury) ‐Any injury,other thana fatal injuryorincapacitating injury, which is evident toobserversatthesceneofthecrashinwhichtheinjuryoccurred.PossibleInjury‐Anyinjuryreportedorclaimedwhichisnotafatal injury, incapacitatinginjury,ornon‐incapacitating,evidentinjury.LICENSEDDRIVER: A person who is licensedby a State tooperate amotor vehicleonpublichighways. In Idaho, a person who has reachedthe age of 15 years, and who has successfullycompletedanapproveddriver'strainingcourse,may apply for a class "D" license. Drivingprivileges are restricted to daylight hours onlyuntiltheageof16.LOCAL ROAD: Any road other than anInterstate,U.S.,orStateHighway.MOTOR VEHICLE: Every motorized vehiclewhich is self‐propelled or propelled by electricpowerobtainedfromoverheadtrolleywiresbutnot operated upon rails except motorizedwheelchairs.

-70-
GlossaryofTerms(Continued)OCCUPANT: Apersonwho is inoronamotorvehicle.PASSENGER: Any occupant of a vehicle otherthanitsdriver.PEDESTRIAN:Anypersonafootandanypersonoperatingawheelchairormotorizedwheelchair.PROPERTY DAMAGE ONLY: Any crash inwhich there was property damage of $751 ormore to any one person but no injuries orfatalities prior to 2006. The threshold wasincreasedto$1,501ormorein2006andlater.RURAL: All areas, incorporated andunincorporated, with a population of less than5,000people.SEAT BELT: A device designed to hold theoccupant of a motor vehicle in the seat of avehiclethatwasmanufacturedwithsafetybeltsincompliancewithFederalMotorVehiclesafetystandardnumber208.Eachoccupantofamotorvehiclewhichhas a gross vehicleweight of notmore than8,000pounds, and somanufactured,shallhaveaseatbeltproperlyfastenedabouthisbodyatalltimeswhenthevehicleisinmotion.
STATE HIGHWAY SYSTEM: Includes allInterstate,U.S. andStatehighways (i.e. I‐84,US95,SH75)TRACTOR/BOBTAIL:Amotorvehicledesignedand used primarily for drawing other vehiclesbut not so constructed as to carry a load otherthanpartoftheweightofthevehicleandloadsodrawn.URBAN: Any incorporated area with apopulationof5,000ormore.VEHICLE: Every device in, upon, or by whichanypersonorpropertyisormaybetransportedor drawn upon a highway, excepting devicesusedexclusivelyuponstationaryrailsortracks.VIOLATION: A conviction of a misdemeanorchargeinvolvingamovingtrafficviolation,oranadmission or judicial determination of thecommissionofan infraction involvingamovingtrafficinfraction,exceptbicycleinfractions.

-71-
ReferencesandNotes1. U.S. Department of Transportation, Federal Highway Administration, Memorandum: Guidance on
Treatment of the Economic Value of a Statistical Life (VSL) in U.S. Department of TransportationAnalyses–2014Adjustment,June13,2014.
2. Blincoe,L.J.,Miller,T.R.,Zaloshnja,E.,&Lawrence,B.A.(2015,May(Revised)). Theeconomicand
societal impact of motor vehicle crashes, 2010. (Report No. DOT HS 812 013). Washington, DC:NationalHighwayTrafficSafetyAdministration.
3. Kahane, Charels J., Fatality Reduction by Safety Belts for Front‐Seat Occupants of Cars and Light
Trucks, December 2000, Washington D.C.: U.S Department of Transportation, National HighwayTrafficSafetyAdministration,DOTHS809199.
4. HaddonandS.Baker,"InjuryControl",Chapter8,PreventiveandCommunityMedicine,EditedbyC.
ClarkandB.MacMahon,TitleBrownandCo.,NewYork,1987.5. HighwayDistrict boundaries: District I ‐North Idaho (Boundary,Bonner,Kootenai,Benewah, and
ShoshoneCounties),DistrictII‐NorthCentralIdaho(Latah,NezPerce,Lewis,Clearwater,andIdahoCounties), District III ‐ Southwest Idaho (Adams, Valley,Washington, Payette, Gem, Boise, Canyon,Ada, Owyhee, and Elmore Counties), District IV ‐ South Central Idaho (Camas, Blaine, Gooding,Lincoln,Minidoka, Jerome,TwinFalls, andCassiaCounties),DistrictV ‐Southeast Idaho (Bingham,Power,Bannock,Caribou,Oneida,Franklin,andBearLakeCounties)andDistrictVI‐EasternIdaho(Lemhi,Custer,Butte,Clark,Fremont,Jefferson,Madison,Teton,andBonnevilleCounties).
6. Dean, J. Michael, Reading, James C., and Nechodom, Patricia J., Overreporting and Measured
EffectivenessofSeatBelts inMotorVehicleCrashesinUtah,TransportationResearchRecord1485,TransportationResearchBoard,NationalResearchCouncil,NationalAcademyPress,1995.

-72-

-73-
APPENDIXA:MapsofFatalCrashLocationsin2015
Eachspotindicatesthelocationofafatalcrash.Thenumberoffatalitiesforeachtransportationdistrictisalsogiven.Themapsareintendedtogivegenerallocationsoffatalcrashes;thepreciselocationcannotbedeterminedfrommaps.Forpreciselocationsorforthenumberofcrashesonagivenroadway,pleasecontacttheOfficeofHighwaySafety.

-74-
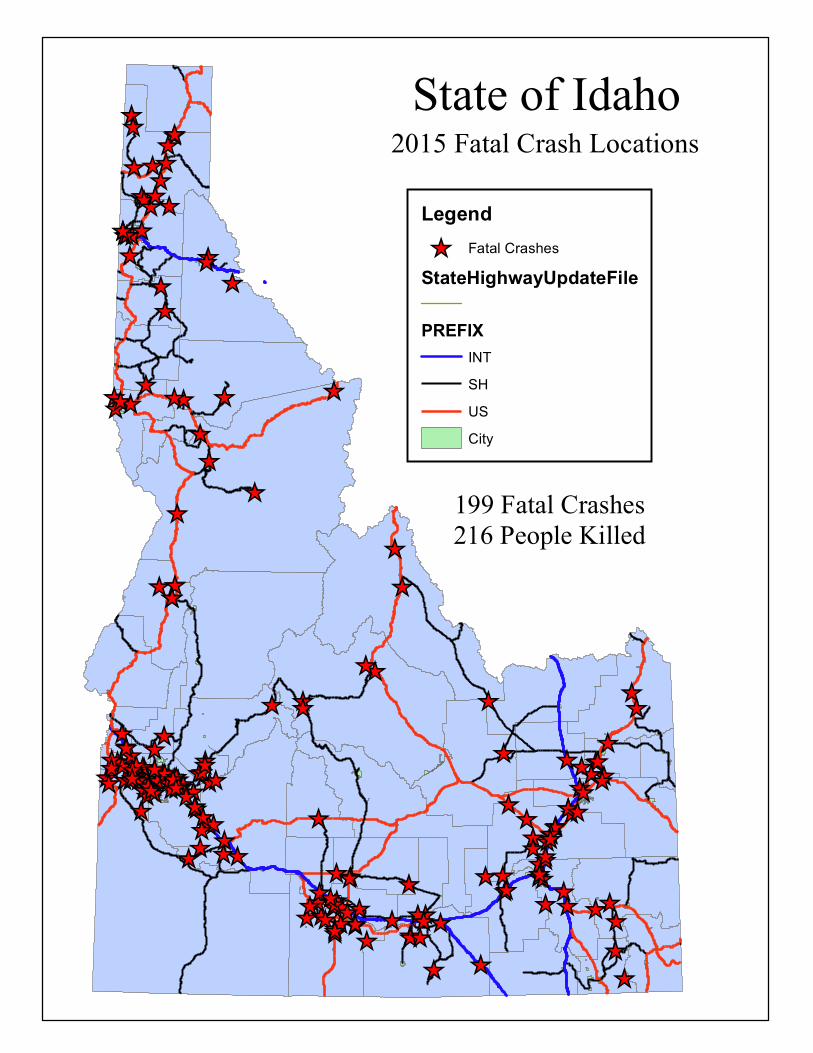
_̂
_̂_̂
_̂
_̂
_̂
_̂̂_
_̂
_̂_̂
_̂
_̂
_̂
_̂_̂
_̂̂_
_̂
_̂
_̂_̂
_̂_̂
_̂
_̂
_̂̂__̂̂_
_̂
_̂
_̂
_̂_̂̂_
_̂
_̂
_̂ _̂
_̂
_̂
_̂
_̂_̂
_̂
_̂
_̂
_̂
_̂
_̂
_̂
_̂
_̂
_̂
_̂
_̂
_̂_̂
_̂
_̂
_̂
_̂
_̂
_̂
_̂
_̂
_̂
_̂
_̂
_̂_̂
_̂_̂_̂
_̂
_̂
_̂
_̂_̂ _̂
_̂
_̂
_̂
_̂
_̂
_̂_̂
_̂ _̂
_̂
_̂_̂
_̂
_̂
_̂
_̂
_̂
_̂
_̂ _̂
_̂
_̂
_̂ _̂
_̂
_̂
_̂
_̂
_̂ _̂
_̂
_̂
_̂
_̂
_̂
_̂
_̂
_̂
_̂
_̂_̂
_̂̂_
_̂
_̂
_̂
_̂
_̂
_̂ _̂
_̂
_̂
_̂_̂
_̂
_̂
_̂_̂
_̂_̂
_̂
_̂
_̂_̂
_̂
_̂
_̂
_̂_̂̂_
_̂
_̂_̂
_̂
_̂
_̂_̂_̂
_̂
_̂
_̂
_̂
_̂
_̂
_̂
_̂_̂
_̂
_̂_̂
_̂
_̂̂__̂
_̂̂_
_̂
_̂̂_
_̂̂_
_̂
_̂
_̂
_̂
_̂
_̂
_̂
_̂
_̂
_̂
_̂_̂
_̂
_̂_̂_̂
State of Idaho2015 Fatal Crash Locations
199 Fatal Crashes216 People Killed
Legend_̂ Fatal Crashes
StateHighwayUpdateFile
PREFIXINTSHUSCity


BOUNDARY
BONNER
KOOTENAI
SHOSHONEBENEWAH
CLEARWATER
LATAH
LEWIS
IDAHO
VALLEY
LEMHIADAMS
WASHINGTON
PAYETTE
GEM
BOISE
ELMORE
CANYON
ADA
OWYHEE
TWINFALLS CASSIA
JEROME
GOODING LINCOLN
MINIDOKA
CAMAS
BLAINE
CUSTER
BUTTE
CLARK
JEFFERSON
FREMONT
TETON
BONNEVILLE
BINGHAM
MADISON
POWER
CARIBOU
BEARLAKE
BANNOCK
ONEIDAFRANKLIN
NEZPERCE
1
2
3
4 5
6
Administrative District Boundaries


_̂
_̂
_̂
_̂
_̂_̂
_̂
_̂
_̂
_̂
_̂
_̂
_̂
_̂
_̂
_̂
_̂
_̂̂_
_̂
_̂
_̂
_̂
_̂
_̂
_̂
SHOSHONE
BONNER
KOOTENAI
BOUNDARY
BENEWAH
POST FALLS
COEUR D'ALENE
DOVER
RATHDRUM
KELLOGG
SANDPOINTPONDERAY
SPIRIT LAKE
OSBURN
BONNERS FERRY
PRIEST RIVER
PLUMMER
ATHOL
MULLAN
ST MARIES
WALLACE
MOYIE SPRINGS
PINEHURST WARDNER
HARRISON
CLARK FORK
HAUSER
HOPE
HAYDEN LAKE
EAST HOPEOLDTOWN
TENSED
WORLEY
FERNAN LAKE
§̈¦90
£¤2
£¤2
£¤95
£¤95
£¤95
£¤95
£¤95
³±6
³±3
³±3
³±3
³±5
³±4
³±1³±60
³±58
³±97
³±41³±53
³±54
³±54
³±41
³±57³±200
District One
State of Idaho
Legend_̂ Fatal Crashes
State Highways
City
County
µ
0 8 16 24 324Miles
May 2016
26 Fatal Crashes31 People Killed
2015 Fatal Crashes
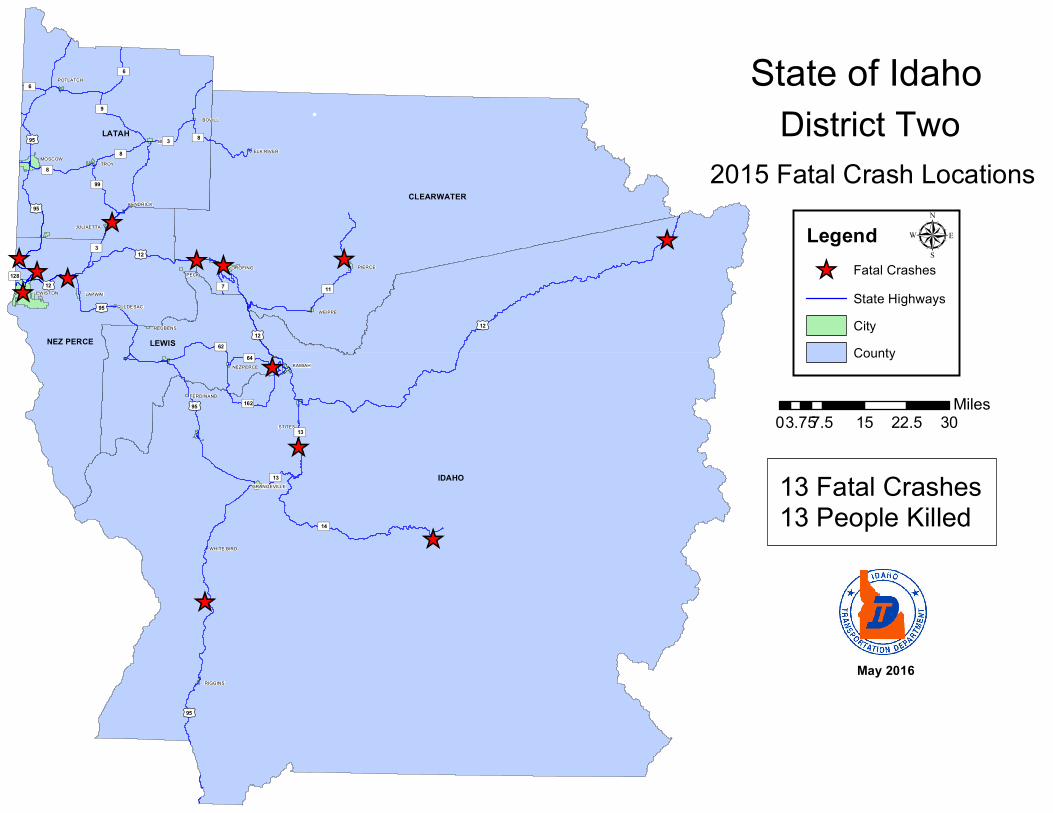
_̂_̂
_̂
_̂ _̂
_̂
_̂_̂
_̂
_̂
_̂
_̂
_̂
IDAHO
CLEARWATER
LATAH
LEWISNEZ PERCE
LEWISTON
MOSCOW
OROFINO
NEZPERCE KAMIAH
TROY
PIERCE
LAPWAI
GRANGEVILLE
DEARY
JULIAETTA
KENDRICK
WEIPPE
PECK
POTLATCH
RIGGINS
BOVILL
CULDESAC
ELK RIVER
REUBENS
FERDINAND
STITES
WHITE BIRD
£¤12
£¤95
£¤12£¤12
£¤12
£¤95
£¤95
£¤95
£¤95
³±7
³±8
³±8
³±8
³±9
³±6
³±6
³±3
³±14
³±13
³±13
³±64
³±62
³±11
³±99
³±128
³±162
³±3District Two
State of Idaho
Legend_̂ Fatal Crashes
State HighwaysCityCounty
2015 Fatal Crash Locations
µ
0 7.5 15 22.5 303.75Miles
13 Fatal Crashes13 People Killed
May 2016

_̂_̂
_̂̂_
_̂_̂
_̂
_̂
_̂
_̂
_̂
_̂
_̂
_̂
_̂_̂_̂
_̂
_̂
_̂
_̂_̂ _̂
_̂
_̂
_̂_̂ _̂_̂
_̂
_̂
_̂_̂
_̂̂_
_̂
_̂
_̂̂_̂_
_̂
_̂_̂_̂
_̂_̂
_̂_̂
_̂_̂
_̂_̂ _̂
_̂_̂
_̂
_̂
_̂_̂
_̂
_̂̂_
_̂
_̂ _̂
_̂
_̂_̂
_̂ _̂
_̂ _̂
OWYHEE
VALLEY
ELMORE
BOISE
ADA
ADAMS
GEM
WASHINGTON
CANYON
PAYETTE
BOISENAMPA
MERIDIAN
EAGLE
CALDWELL
MCCALL
KUNA
STAR
CASCADE
WEISER
PAYETTE
GARDEN CITY
MOUNTAIN HOME
EMMETT
MIDDLETON
FRUITLAND
PARMA
GLENNS FERRY
HOMEDALE
COUNCIL
PLACERVILLE
MARSING
MIDVALE
WILDER
GREENLEAFNOTUS
IDAHO CITY
NEW PLYMOUTH
GRAND VIEW
CROUCH
MELBA
HORSESHOE BEND
DONNELLY
NEW MEADOWS
CAMBRIDGE
§̈¦84
§̈¦84
§̈¦84
£¤20
£¤30
£¤26
£¤26
£¤26
£¤26
£¤20
£¤20
£¤20
£¤30
£¤30
£¤30
£¤95
£¤95
£¤95
£¤95
£¤95
£¤95
³±52
³±78
³±78 ³±45
³±21
³±19
³±69
³±19
³±16
³±52
³±52
³±71
³±55
³±55
³±55
³±55
³±78
³±78
³±51
³±51
³±51
³±51
³±67
³±44
District ThreeState of Idaho
Legend_̂ Fatal Crashes
State HighwaysCitiesCounties
µ
0 10 20 30 405Miles
72 Fatal Crashes79 People Killed
May 2016
2015 Fatal Crash Locations

_̂
_̂̂_
_̂
_̂
_̂
_̂
_̂
_̂
_̂
_̂
_̂
_̂
_̂_̂
_̂_̂
_̂
_̂
_̂
_̂_̂
_̂_̂_̂
_̂_̂
_̂
_̂_̂
_̂
_̂_̂
_̂
_̂
BLAINE
CASSIA
TWIN FALLS
CAMAS
LINCOLNGOODING
MINIDOKA
JEROME
§̈¦86
§̈¦84
§̈¦84
§̈¦84
£¤26
£¤26
£¤20
£¤30
£¤30
£¤30
£¤93
£¤93
£¤93
³±75
³±75
³±81
³±77
³±24³±24
³±27
³±25³±25
³±74
³±79
³±46
³±46
TWIN FALLS
SUN VALLEY
OAKLEY
JEROME
BURLEY
CAREY
HAILEY
BUHL
KETCHUM
HEYBURN
RUPERT
MALTA
FILER
WENDELL
GOODING
BELLEVUE
PAUL
KIMBERLY
BLISS
HOLLISTER
SHOSHONE
RICHFIELD
ACEQUIA
EDEN
ALBION
HAGERMAN
FAIRFIELD
HANSEN
HAZELTON
DIETRICH
DECLO
MINIDOKA
MURTAUGH
CASTLEFORD
District FourState of Idaho
Legend_̂ Fatal Crashes
State HighwaysCityCounty
µ
0 7.5 15 22.5 303.75Miles
May 2016
35 Fatal Crashes39 People Killed
2015 Fatal Crash Locations

_̂
_̂
_̂
_̂
_̂
_̂
_̂
_̂
_̂
_̂
_̂ _̂_̂
_̂
_̂_̂
_̂̂_
_̂
_̂
_̂_̂
_̂
_̂
_̂
_̂
_̂
_̂
_̂
_̂_̂
_̂
BINGHAM
CARIBOU
POWER
ONEIDA
BANNOCK
BEAR LAKEFRANKLIN
POCATELLO
DAYTONPRESTON
PARIS
BLACKFOOT
CHUBBUCK
SODA SPRINGS
CLIFTONMALAD
WESTON
SHELLEY
GRACE
MONTPELIER
MCCAMMON
INKOM
DOWNEY
AMERICAN FALLS
ABERDEEN
FRANKLIN
BASALT
ARIMO
FIRTH
BLOOMINGTON
ST CHARLES
BANCROFT
GEORGETOWN
LAVA HOT SPRINGS
OXFORD
ROCKLAND
ATOMIC CITY
§̈¦86
§̈¦15
§̈¦15
§̈¦15
§̈¦84
£¤89
£¤89
£¤89
£¤91
£¤91
£¤26
£¤20
£¤30
£¤30
£¤30
£¤30
³±39
³±39
³±61³±34
³±34
³±40
³±36
³±36
³±38
³±37
District FiveState of Idaho
2015 Fatal Crash LocationsLegend_̂ Fatal Crashes
State HighwaysCityCounty
32 Fatal Crashes33 People Killed
May 2016
µ
0 6.5 13 19.5 263.25Miles
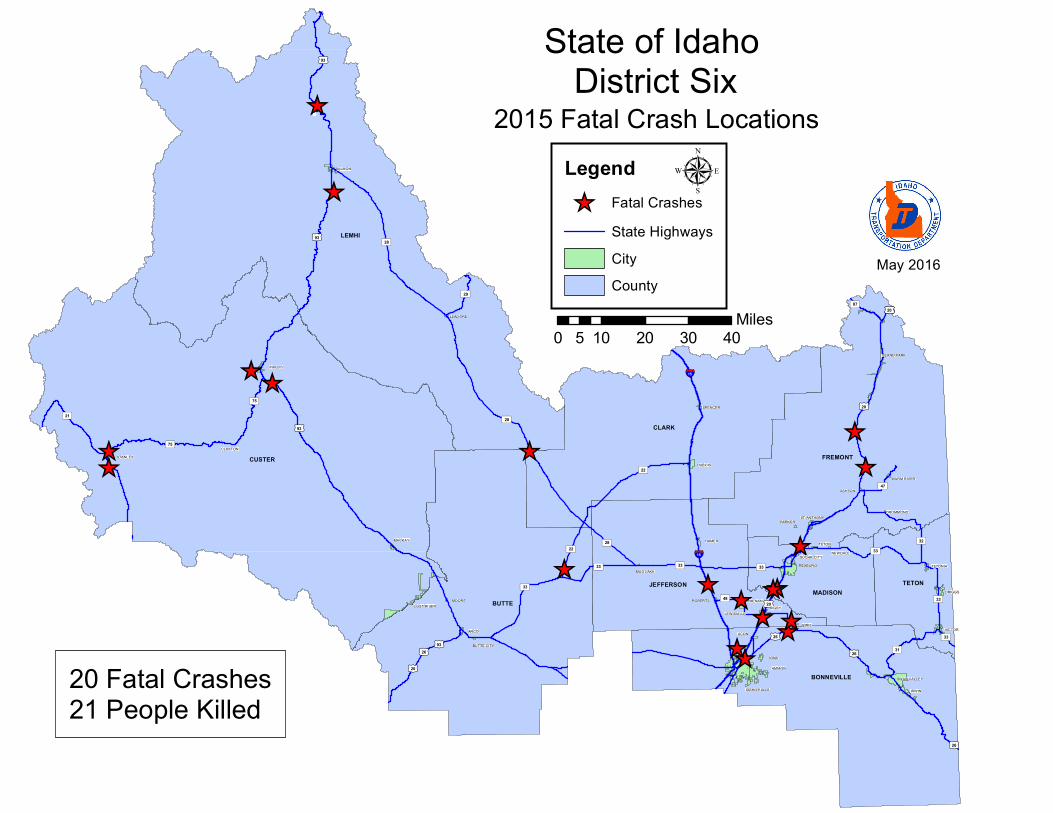
_̂
_̂
_̂
_̂
_̂
_̂
_̂
_̂
_̂
_̂
_̂_̂_̂_̂
_̂
_̂
_̂
_̂ _̂
_̂
LEMHI
CUSTER
BUTTE
CLARK
FREMONT
BONNEVILLE
JEFFERSON TETONMADISON
§̈¦15
§̈¦15
£¤20
£¤26
£¤26
£¤26
£¤26
£¤20
£¤20
£¤20
£¤93
£¤93
£¤93
£¤93
£¤20³±87
³±75
³±32
³±47
³±29
³±28
³±28
³±28
³±22
³±22
³±33
³±33 ³±33 ³±33
³±33
³±33
³±33
³±31
³±48
³±21
³±75
IDAHO FALLS
REXBURG
LOST RIVER
SWAN VALLEY
AMMON
ISLAND PARK
IRWIN
DUBOIS
SALMON
VICTOR
DRIGGS
RIGBY
CHALLIS
ARCO
IONA
MENAN
SUGAR CITY
UCON
SPENCER
ST ANTHONY
MACKAY
LEWISVILLE
TETON
ASHTON
STANLEY
RIRIE
TETONIA
WARM RIVER
PARKER
MOORE
LEADORE
ROBERTS
BUTTE CITY
HAMER
NEWDALE
MUD LAKE
DRUMMOND
CLAYTON
District SixState of Idaho
2015 Fatal Crash LocationsLegend_̂ Fatal Crashes
State HighwaysCityCounty
20 Fatal Crashes21 People Killed
0 10 20 30 405Miles
µMay 2016

-85-
APPENDIXB:MapsofCrasheswithWildAnimalsin2015
Eachspotindicatesthelocationofacrashwithananimalbyseverityofthecrash.Themapsareintendedtogivegeneral locationsofcrashes;theprecise locationcannotbedeterminedfrommaps. Forpreciselocationsorforthenumberofcrashesonagivenroadway,pleasecontacttheOfficeofHighwaySafety.

-86-

LegendFatal Crashes (1)Serious Injury Crashes (10)Visible Injury Crashes (76)Possible Injury Crashes (79)Property Damage Crashes (1,234)
State of Idaho2015 Wild Animal Crash Locations


-89-
APPENDIXC:StateHighwaySystem
CrashDataThe Idaho Transportation Department is responsible for building andmaintaining the State HighwaySystem.TheStateHighwaySystemincludestheInterstatehighways,UShighways,andStatehighways.Allotherroadsfallunderthejurisdictionofcounties,cities,orlocalhighwaydistricts.

-90-

-91-
CrashInformationforSelectedRoutesontheStateHighwaySystem:2006‐2015Ratesareper100MillionVehicleMilesTraveled
2006 2007 2008 2009 2010 2011 2012 2013 2014 2015
Fatal Crashes 10 7 6 5 8 3 4 7 8 10
Fatalities 11 8 6 5 8 4 4 9 10 10
Total Crashes 501 522 579 483 638 386 357 365 263 359
Average Daily Traffic 10,130 10,550 10,700 10,020 10,020 10,590 10,710 10,710 11,110 11,870
Fatal Crash Rate 1.26 0.93 0.78 0.70 1.12 0.40 0.52 0.91 1.01 1.18
Total Crash Rate 69.13 69.16 75.64 67.38 89.00 50.95 46.59 47.64 33.09 42.28
2006 2007 2008 2009 2010 2011 2012 2013 2014 2015
Fatal Crashes 21 29 23 16 15 4 17 15 11 16
Fatalities 23 35 28 18 22 5 20 15 11 19
Total Crashes 1,103 1,319 1,198 1,112 1,051 873 884 927 799 883
Average Daily Traffic 20,080 20,580 19,740 18,990 18,990 19,810 20,780 20,780 21,740 23,010
Fatal Crash Rate 1.18 1.40 1.16 0.84 0.79 0.20 0.81 0.72 0.50 0.69
Total Crash Rate 54.60 63.70 60.32 58.20 55.01 43.80 42.28 44.34 36.53 38.14
2006 2007 2008 2009 2010 2011 2012 2013 2014 2015
Fatal Crashes 4 2 2 1 2 3 2 2 2 2
Fatalities 4 2 2 1 3 6 2 2 2 2
Total Crashes 127 97 144 125 118 72 78 110 76 84
Average Daily Traffic 8,050 8,140 8,170 7,860 7,860 8,190 8,240 8,240 8,430 9,030
Fatal Crash Rate 1.10 1.07 1.07 0.55 1.11 1.60 1.06 1.06 1.03 0.97
Total Crash Rate 68.77 51.95 76.83 69.32 65.44 38.32 41.26 58.19 39.30 40.55
2006 2007 2008 2009 2010 2011 2012 2013 2014 2015
Fatal Crashes 1 4 6 2 2 7 1 1 3 3
Fatalities 1 6 7 3 2 7 1 2 4 3
Total Crashes 401 435 412 305 295 312 297 318 281 326
Average Daily Traffic 18,080 18,208 17,532 17,476 17,476 17,476 17,643 17,640 18,320 19,270
Fatal Crash Rate 0.42 0.82 1.27 0.42 0.42 1.49 0.21 0.21 0.61 0.57
Total Crash Rate 82.29 88.64 87.13 64.71 62.59 66.20 62.42 66.84 56.87 62.45
I‐84
I‐15
I‐86
I‐90

-92-
CrashInformationforSelectedRoutesontheStateHighwaySystem:2006‐2015Ratesareper100MillionVehicleMilesTraveled
2006 2007 2008 2009 2010 2011 2012 2013 2014 2015
Fatal Crashes 0 0 1 1 0 0 0 0 0 0
Fatalities 0 0 1 1 0 0 0 0 0 0
Total Crashes 47 39 53 38 26 34 46 44 49 35
Average Daily Traffic 54,620 57,450 55,480 55,820 55,820 56,600 57,880 57,880 58,300 60,790
Fatal Crash Rate 0.00 0.00 1.36 1.36 0.00 0.00 0.00 0.00 0.00 0.00
Total Crash Rate 65.12 51.38 72.30 51.52 35.25 45.46 60.15 57.53 63.61 43.57
2006 2007 2008 2009 2010 2011 2012 2013 2014 20152011
Fatal Crashes 1 1 2 1 0 4 2 2 3 1
Fatalities 1 1 2 1 0 4 2 2 3 1
Total Crashes 94 69 88 86 65 73 66 65 76 105
Average Daily Traffic 4,315 4,629 4,512 4,503 4,503 4,452 4,382 4,860 4,630 4,640
Fatal Crash Rate 1.37 1.28 2.63 1.32 0.00 5.32 2.70 2.44 3.84 1.28
Total Crash Rate 129.05 88.30 115.52 113.12 85.50 97.14 89.22 79.23 97.19 134.05
2006 2007 2008 2009 2010 2011 2012 2013 2014 2015
Fatal Crashes 3 2 5 3 3 3 4 0 10 3
Fatalities 4 2 7 4 3 4 4 0 11 3
Total Crashes 186 184 128 150 160 168 146 166 162 192
Average Daily Traffic 2,007 1,998 1,929 1,901 1,901 1,990 1,959 1,960 2,000 2,040
Fatal Crash Rate 7.20 1.63 4.21 2.56 2.56 2.45 3.32 0.00 8.15 2.39
Total Crash Rate 150.46 149.51 107.73 128.11 136.65 137.05 121.00 137.51 132.02 152.81
2006 2007 2008 2009 2010 2011 2012 2013 2014 2015
Fatal Crashes 10 7 7 6 8 4 4 9 7 9
Fatalities 10 8 7 6 10 4 4 9 8 9
Total Crashes 931 948 883 761 835 786 733 748 777 928
Average Daily Traffic 5,836 5,748 5,971 5,960 5,960 5,767 5,830 5,880 6,090 6,640
Fatal Crash Rate 0.76 1.04 1.04 0.89 1.18 0.62 0.61 1.35 1.02 1.23
Total Crash Rate 140.83 140.43 130.56 112.72 123.68 121.89 112.44 112.36 113.53 126.93
I‐184
US 20
US 2
US 12

-93-
CrashInformationforSelectedRoutesontheStateHighwaySystem:2006‐2015Ratesareper100MillionVehicleMilesTraveled
2006 2007 2008 2009 2010 2011 2012 2013 2014 2015
Fatal Crashes 2 3 3 4 0 1 3 2 3 2
Fatalities 3 3 3 4 0 1 3 2 3 2
Total Crashes 171 208 226 191 173 126 116 132 105 149
Average Daily Traffic 3,154 3,295 3,209 3,161 3,161 2,906 2,917 2,920 2,950 2,940
Fatal Crash Rate 1.39 1.94 1.99 2.69 0.00 0.73 2.18 1.46 2.17 1.45
Total Crash Rate 115.45 134.42 149.97 128.66 116.53 91.96 84.34 96.26 75.79 107.92
2006 2007 2008 2009 2010 2011 2012 2013 2014 2015
Fatal Crashes 5 1 7 3 2 2 4 4 5 4
Fatalities 5 1 7 3 3 2 4 4 7 5
Total Crashes 255 285 278 278 250 249 285 244 238 276
Average Daily Traffic 3,626 3,722 3,615 3,651 3,651 3,569 3,587 3,580 3,510 3,570
Fatal Crash Rate 1.49 0.38 2.75 1.17 0.78 0.80 1.59 1.59 2.04 1.59
Total Crash Rate 99.99 108.89 109.35 108.27 97.36 99.20 112.98 96.94 97.13 109.96
2006 2007 2008 2009 2010 2011 2012 2013 2014 2015
Fatal Crashes 0 0 2 1 0 0 0 1 0 0
Fatalities 0 0 2 4 0 0 0 1 0 0
Total Crashes 35 29 43 37 38 34 39 24 31 32
Average Daily Traffic 1,659 1,815 1,598 1,591 1,591 1,509 1,506 1,510 1,480 1,660
Fatal Crash Rate 3.82 0.00 7.83 3.94 0.00 0.00 0.00 4.18 0.00 0.00
Total Crash Rate 132.09 100.05 168.42 145.63 149.57 141.09 162.07 100.21 131.13 121.54
2006 2007 2008 2009 2010 2011 2012 2013 2014 2015
Fatal Crashes 2 2 0 2 2 1 4 4 0 0
Fatalities 2 3 0 2 4 1 4 5 0 0
Total Crashes 204 300 291 300 331 273 270 275 234 280
Average Daily Traffic 4,178 4,454 4,527 4,516 4,516 4,466 4,466 4,410 4,410 4,570
Fatal Crash Rate 3.91 1.43 0.00 1.41 1.41 0.71 2.85 2.90 0.00 0.00
Total Crash Rate 159.47 214.35 204.65 211.51 233.37 194.80 192.68 199.29 168.68 194.77
US 26
US 30
US 89
US 91
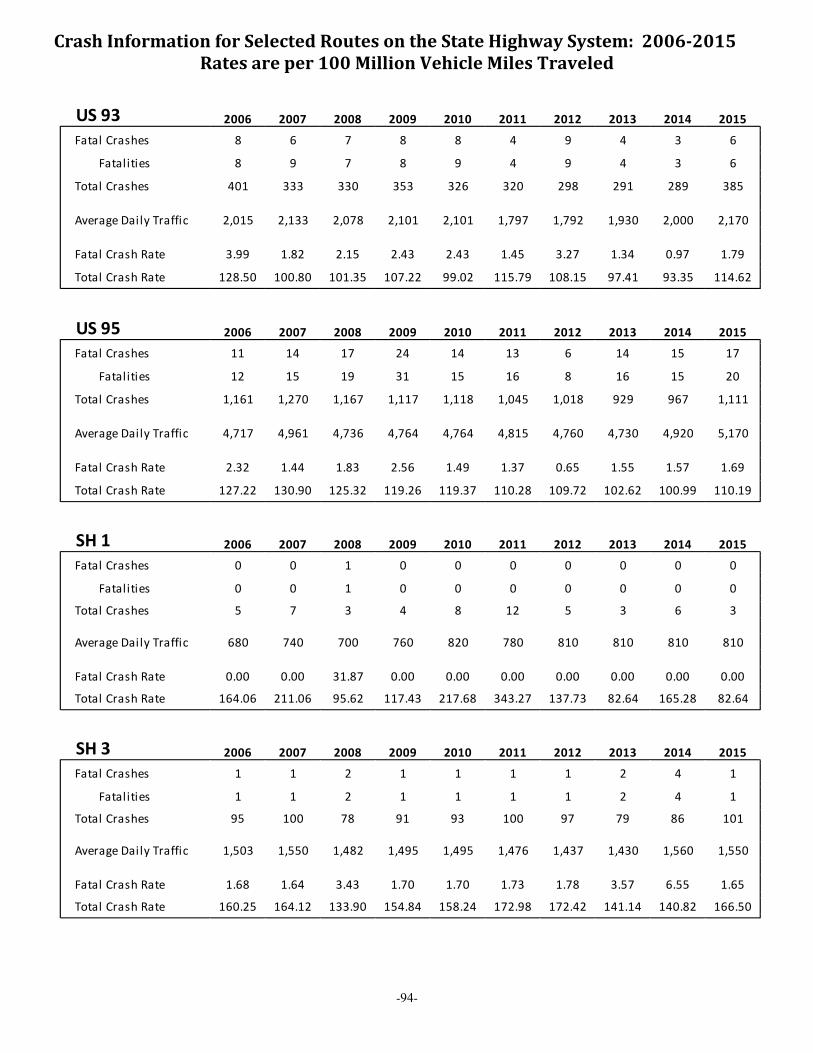
-94-
CrashInformationforSelectedRoutesontheStateHighwaySystem:2006‐2015Ratesareper100MillionVehicleMilesTraveled
2006 2007 2008 2009 2010 2011 2012 2013 2014 2015
Fatal Crashes 8 6 7 8 8 4 9 4 3 6
Fatalities 8 9 7 8 9 4 9 4 3 6
Total Crashes 401 333 330 353 326 320 298 291 289 385
Average Daily Traffic 2,015 2,133 2,078 2,101 2,101 1,797 1,792 1,930 2,000 2,170
Fatal Crash Rate 3.99 1.82 2.15 2.43 2.43 1.45 3.27 1.34 0.97 1.79
Total Crash Rate 128.50 100.80 101.35 107.22 99.02 115.79 108.15 97.41 93.35 114.62
2006 2007 2008 2009 2010 2011 2012 2013 2014 2015
Fatal Crashes 11 14 17 24 14 13 6 14 15 17
Fatalities 12 15 19 31 15 16 8 16 15 20
Total Crashes 1,161 1,270 1,167 1,117 1,118 1,045 1,018 929 967 1,111
Average Daily Traffic 4,717 4,961 4,736 4,764 4,764 4,815 4,760 4,730 4,920 5,170
Fatal Crash Rate 2.32 1.44 1.83 2.56 1.49 1.37 0.65 1.55 1.57 1.69
Total Crash Rate 127.22 130.90 125.32 119.26 119.37 110.28 109.72 102.62 100.99 110.19
2006 2007 2008 2009 2010 2011 2012 2013 2014 2015
Fatal Crashes 0 0 1 0 0 0 0 0 0 0
Fatalities 0 0 1 0 0 0 0 0 0 0
Total Crashes 5 7 3 4 8 12 5 3 6 3
Average Daily Traffic 680 740 700 760 820 780 810 810 810 810
Fatal Crash Rate 0.00 0.00 31.87 0.00 0.00 0.00 0.00 0.00 0.00 0.00
Total Crash Rate 164.06 211.06 95.62 117.43 217.68 343.27 137.73 82.64 165.28 82.64
2006 2007 2008 2009 2010 2011 2012 2013 2014 2015
Fatal Crashes 1 1 2 1 1 1 1 2 4 1
Fatalities 1 1 2 1 1 1 1 2 4 1
Total Crashes 95 100 78 91 93 100 97 79 86 101
Average Daily Traffic 1,503 1,550 1,482 1,495 1,495 1,476 1,437 1,430 1,560 1,550
Fatal Crash Rate 1.68 1.64 3.43 1.70 1.70 1.73 1.78 3.57 6.55 1.65
Total Crash Rate 160.25 164.12 133.90 154.84 158.24 172.98 172.42 141.14 140.82 166.50
US 95
SH 3
US 93
SH 1

-95-
CrashInformationforSelectedRoutesontheStateHighwaySystem:2006‐2015Ratesareper100MillionVehicleMilesTraveled
2006 2007 2008 2009 2010 2011 2012 2013 2014 2015
Fatal Crashes 0 0 0 0 0 0 0 2 0 0
Fatalities 0 0 0 0 0 0 0 2 0 0
Total Crashes 31 26 32 27 23 23 33 24 22 17
Average Daily Traffic 2,350 2,350 2,350 2,350 2,350 2,340 2,530 2,680 2,610 2,610
Fatal Crash Rate 0.00 0.00 0.00 0.00 0.00 0.00 0.00 10.70 0.00 0.00
Total Crash Rate 52.32 43.88 54.01 45.57 38.82 38.82 187.14 128.40 120.73 93.23
2006 2007 2008 2009 2010 2011 2012 2013 2014 2015
Fatal Crashes 1 2 0 0 1 0 1 0 1 1
Fatalities 1 2 0 0 1 0 2 0 2 1
Total Crashes 28 27 19 33 23 24 23 18 24 21
Average Daily Traffic 1,125 1,125 1,125 1,126 1,126 1,141 1,105 1,100 1,160 1,180
Fatal Crash Rate 6.17 12.34 0.00 0.00 6.16 0.00 6.28 0.00 5.98 5.88
Total Crash Rate 172.71 166.54 117.19 203.34 141.72 146.01 144.42 113.57 143.59 123.52
2006 2007 2008 2009 2010 2011 2012 2013 2014 2015
Fatal Crashes 0 0 0 0 0 0 0 0 0 0
Fatalities 0 0 0 0 0 0 0 0 0 0
Total Crashes 8 6 7 13 10 3 7 5 8 8
Average Daily Traffic 1,470 1,480 1,480 1,480 940 940 780 780 750 750
Fatal Crash Rate 0.00 0.00 0.00 0.00 0.00 0.00 0.00 0.00 0.00 0.00
Total Crash Rate 92.38 68.82 80.29 149.10 180.58 54.17 152.34 108.81 181.06 181.06
2006 2007 2008 2009 2010 2011 2012 2013 2014 2015
Fatal Crashes 0 1 1 0 1 1 0 4 0 0
Fatalities 0 1 1 0 1 1 0 4 0 0
Total Crashes 93 136 123 97 114 109 91 108 126 105
Average Daily Traffic 2,856 2,619 2,631 2,631 2,631 2,522 2,601 2,600 2,520 2,520
Fatal Crash Rate 0.00 1.97 1.96 0.00 1.96 2.04 0.00 7.93 0.00 0.00
Total Crash Rate 468.64 267.51 240.85 189.94 223.23 222.64 180.29 214.02 257.61 214.68
SH 6
SH 5
SH 7
SH 8

-96-
CrashInformationforSelectedRoutesontheStateHighwaySystem:2006‐2015Ratesareper100MillionVehicleMilesTraveled
2006 2007 2008 2009 2010 2011 2012 2013 2014 2015
Fatal Crashes 1 0 0 0 0 0 0 1 0 0
Fatalities 1 0 0 0 0 0 0 1 0 0
Total Crashes 3 3 7 5 4 4 3 5 6 3
Average Daily Traffic 825 850 850 850 850 850 830 830 1,030 1,030
Fatal Crash Rate 0.00 0.00 0.00 0.00 0.00 0.00 0.00 24.41 0.00 0.00
Total Crash Rate 73.68 71.51 166.86 119.18 95.35 95.35 73.23 122.06 118.03 59.01
2006 2007 2008 2009 2010 2011 2012 2013 2014 2015
Fatal Crashes 1 0 0 1 0 0 0 0 0 1
Fatalities 1 0 0 1 0 0 0 0 0 1
Total Crashes 14 31 20 14 14 10 14 7 13 11
Average Daily Traffic 990 990 790 790 790 790 870 870 670 680
Fatal Crash Rate 0.00 0.00 0.00 8.15 0.00 0.00 0.00 0.00 0.00 9.47
Total Crash Rate 91.08 201.67 163.05 114.13 114.13 32.61 14.81 7.40 124.96 104.18
2006 2007 2008 2009 2010 2011 2012 2013 2014 2015
Fatal Crashes 0 1 2 0 1 0 1 1 0 1
Fatalities 0 1 2 0 1 0 1 1 0 1
Total Crashes 20 28 16 11 28 16 18 23 10 17
Average Daily Traffic 1,510 1,540 1,270 1,350 1,350 1,330 1,690 1,690 1,720 1,650
Fatal Crash Rate 0.00 6.74 16.35 0.00 7.69 0.00 6.14 6.14 0.00 6.29
Total Crash Rate 137.51 188.76 130.79 84.59 215.32 124.89 110.57 141.29 60.36 106.96
2006 2007 2008 2009 2010 2011 2012 2013 2014 2015
Fatal Crashes 1 1 0 0 0 0 0 0 0 0
Fatalities 1 1 0 0 0 0 0 0 0 0
Total Crashes 6 8 3 4 5 7 3 3 9 0
Average Daily Traffic 460 460 470 340 340 340 340 340 280 280
Fatal Crash Rate 10.85 12.03 0.00 0.00 0.00 0.00 0.00 0.00 0.00 0.00
Total Crash Rate 72.17 96.23 35.32 65.10 81.37 113.92 48.82 48.82 177.85 0.00
SH 14
SH 13
SH 11
SH 9

-97-
CrashInformationforSelectedRoutesontheStateHighwaySystem:2006‐2015Ratesareper100MillionVehicleMilesTraveled
2006 2007 2008 2009 2010 2011 2012 2013 2014 2015
Fatal Crashes 0 1 0 2 0 1 2 0 1 1
Fatalities 0 1 0 2 0 1 2 0 1 1
Total Crashes 39 42 32 40 34 32 38 34 47 58
Average Daily Traffic 8,590 8,530 7,860 7,900 7,900 7,840 7,660 8,060 7,730 8,110
Fatal Crash Rate 2.37 2.31 0.00 4.98 0.00 2.51 5.14 0.00 2.21 2.11
Total Crash Rate 89.31 96.86 80.09 99.61 84.66 80.29 97.73 83.10 104.08 122.42
2006 2007 2008 2009 2010 2011 2012 2013 2014 2015
Fatal Crashes 0 2 1 0 2 0 0 2 1 1
Fatalities 0 2 1 0 2 0 0 3 1 1
Total Crashes 40 43 39 34 43 32 31 35 56 66
Average Daily Traffic 5,363 5,571 5,378 5,293 5,293 5,205 5,192 5,190 5,780 5,840
Fatal Crash Rate 0.00 6.10 3.16 0.00 6.42 0.00 0.00 6.55 2.94 2.91
Total Crash Rate 126.80 131.22 123.28 109.21 138.12 104.52 101.52 114.65 164.72 192.14
2006 2007 2008 2009 2010 2011 2012 2013 2014 2015
Fatal Crashes 1 5 1 3 2 3 2 1 2 4
Fatalities 1 5 1 3 2 3 2 1 2 4
Total Crashes 72 77 77 71 69 54 37 55 46 60
Average Daily Traffic 1,156 1,138 1,118 1,113 1,113 1,006 1,043 1,050 1,090 1,110
Fatal Crash Rate 1.88 9.54 1.94 5.85 3.90 6.47 4.16 2.07 3.98 7.82
Total Crash Rate 135.23 146.94 149.57 138.49 134.59 116.51 77.05 113.72 91.62 117.35
2006 2007 2008 2009 2010 2011 2012 2013 2014 2015
Fatal Crashes 1 0 0 0 0 0 0 1 0 1
Fatalities 1 0 0 0 0 0 0 1 0 1
Total Crashes 2 4 6 5 6 1 4 7 3 2
Average Daily Traffic 250 340 310 300 300 300 300 300 450 440
Fatal Crash Rate 0.00 0.00 0.00 0.00 0.00 0.00 0.00 20.79 0.00 14.17
Total Crash Rate 49.89 73.36 120.69 103.93 124.71 20.79 83.14 145.50 41.57 28.34
SH 22
SH 16
SH 19
SH 21

-98-
CrashInformationforSelectedRoutesontheStateHighwaySystem:2006‐2015Ratesareper100MillionVehicleMilesTraveled
2006 2007 2008 2009 2010 2011 2012 2013 2014 2015
Fatal Crashes 1 0 2 1 3 1 1 0 0 1
Fatalities 1 0 2 1 4 1 2 0 0 1
Total Crashes 37 43 40 28 34 32 30 35 36 31
Average Daily Traffic 1,423 1,448 1,392 1,392 1,392 1,388 1,414 1,410 1,530 1,530
Fatal Crash Rate 5.52 0.00 5.86 2.93 8.78 2.94 2.88 0.00 0.00 2.66
Total Crash Rate 106.04 121.03 117.12 81.98 99.55 93.99 86.46 101.19 95.92 82.60
2006 2007 2008 2009 2010 2011 2012 2013 2014 2015
Fatal Crashes 0 2 0 0 0 1 1 3 0 2
Fatalities 0 2 0 0 0 1 1 3 0 2
Total Crashes 48 48 59 39 35 52 56 58 37 46
Average Daily Traffic 2,139 2,139 2,035 2,059 2,059 2,004 2,067 2,070 2,150 2,150
Fatal Crash Rate 2.62 5.17 0.00 0.00 0.00 2.76 2.67 8.01 0.00 5.14
Total Crash Rate 124.05 124.02 160.26 104.68 93.94 143.41 149.73 154.94 95.16 118.31
2006 2007 2008 2009 2010 2011 2012 2013 2014 2015
Fatal Crashes 2 0 0 2 1 1 1 0 0 1
Fatalities 2 0 0 2 1 1 1 0 0 1
Total Crashes 49 76 55 51 54 42 50 43 32 58
Average Daily Traffic 2,547 2,952 2,842 2,842 2,842 2,797 2,788 2,790 2,750 3,160
Fatal Crash Rate 4.43 0.00 0.00 7.95 3.97 4.04 4.05 0.00 0.00 3.57
Total Crash Rate 217.21 290.73 218.52 202.63 214.55 169.55 202.50 174.04 131.34 207.16
2006 2007 2008 2009 2010 2011 2012 2013 2014 2015
Fatal Crashes 2 0 1 0 0 0 1 1 1 1
Fatalities 2 0 2 0 0 0 1 1 2 1
Total Crashes 32 34 48 42 40 38 35 41 23 25
Average Daily Traffic 780 780 700 660 660 660 660 660 600 590
Fatal Crash Rate 0.00 0.00 3.25 0.00 0.00 0.00 3.45 3.45 3.79 3.85
Total Crash Rate 93.28 99.11 155.91 144.69 137.80 130.91 120.58 141.25 87.16 96.34
SH 27
SH 25
SH 24
SH 28
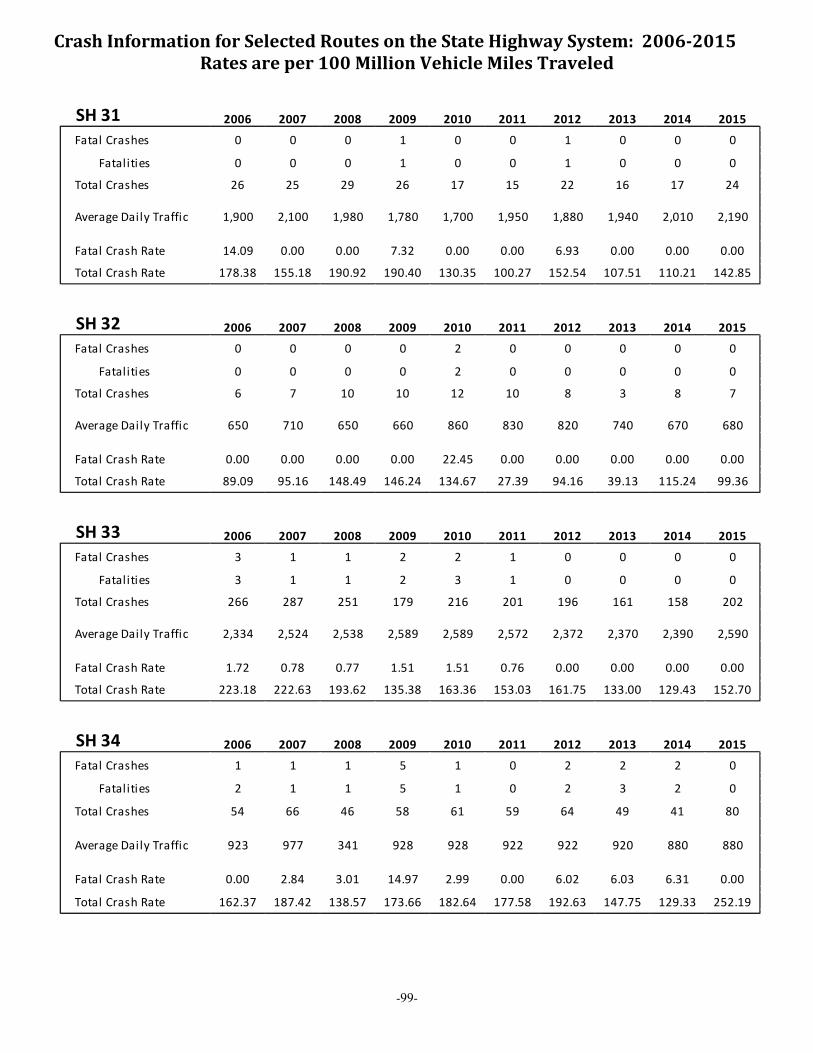
-99-
CrashInformationforSelectedRoutesontheStateHighwaySystem:2006‐2015Ratesareper100MillionVehicleMilesTraveled
2006 2007 2008 2009 2010 2011 2012 2013 2014 2015
Fatal Crashes 0 0 0 1 0 0 1 0 0 0
Fatalities 0 0 0 1 0 0 1 0 0 0
Total Crashes 26 25 29 26 17 15 22 16 17 24
Average Daily Traffic 1,900 2,100 1,980 1,780 1,700 1,950 1,880 1,940 2,010 2,190
Fatal Crash Rate 14.09 0.00 0.00 7.32 0.00 0.00 6.93 0.00 0.00 0.00
Total Crash Rate 178.38 155.18 190.92 190.40 130.35 100.27 152.54 107.51 110.21 142.85
2006 2007 2008 2009 2010 2011 2012 2013 2014 2015
Fatal Crashes 0 0 0 0 2 0 0 0 0 0
Fatalities 0 0 0 0 2 0 0 0 0 0
Total Crashes 6 7 10 10 12 10 8 3 8 7
Average Daily Traffic 650 710 650 660 860 830 820 740 670 680
Fatal Crash Rate 0.00 0.00 0.00 0.00 22.45 0.00 0.00 0.00 0.00 0.00
Total Crash Rate 89.09 95.16 148.49 146.24 134.67 27.39 94.16 39.13 115.24 99.36
2006 2007 2008 2009 2010 2011 2012 2013 2014 2015
Fatal Crashes 3 1 1 2 2 1 0 0 0 0
Fatalities 3 1 1 2 3 1 0 0 0 0
Total Crashes 266 287 251 179 216 201 196 161 158 202
Average Daily Traffic 2,334 2,524 2,538 2,589 2,589 2,572 2,372 2,370 2,390 2,590
Fatal Crash Rate 1.72 0.78 0.77 1.51 1.51 0.76 0.00 0.00 0.00 0.00
Total Crash Rate 223.18 222.63 193.62 135.38 163.36 153.03 161.75 133.00 129.43 152.70
2006 2007 2008 2009 2010 2011 2012 2013 2014 2015
Fatal Crashes 1 1 1 5 1 0 2 2 2 0
Fatalities 2 1 1 5 1 0 2 3 2 0
Total Crashes 54 66 46 58 61 59 64 49 41 80
Average Daily Traffic 923 977 341 928 928 922 922 920 880 880
Fatal Crash Rate 0.00 2.84 3.01 14.97 2.99 0.00 6.02 6.03 6.31 0.00
Total Crash Rate 162.37 187.42 138.57 173.66 182.64 177.58 192.63 147.75 129.33 252.19
SH 33
SH 32
SH 31
SH 34

-100-
CrashInformationforSelectedRoutesontheStateHighwaySystem:2006‐2015Ratesareper100MillionVehicleMilesTraveled
2006 2007 2008 2009 2010 2011 2012 2013 2014 2015
Fatal Crashes 0 2 1 1 1 0 1 2 2 0
Fatalities 0 2 1 1 1 0 2 2 2 0
Total Crashes 38 50 38 39 45 34 35 36 33 44
Average Daily Traffic 639 670 614 619 619 619 624 620 590 660
Fatal Crash Rate 0.00 12.20 6.66 6.60 6.60 0.00 6.55 13.19 13.86 0.00
Total Crash Rate 243.02 305.00 252.95 257.53 297.15 224.52 229.29 237.43 228.71 272.61
2006 2007 2008 2009 2010 2011 2012 2013 2014 2015
Fatal Crashes 3 0 1 0 0 0 1 1 0 0
Fatalities 3 0 1 0 0 0 2 1 0 0
Total Crashes 9 3 4 5 7 7 5 6 2 3
Average Daily Traffic 360 400 400 400 400 400 400 400 400 400
Fatal Crash Rate 0.00 0.00 21.93 0.00 0.00 0.00 21.93 21.93 0.00 0.00
Total Crash Rate 219.31 65.79 87.72 109.66 153.52 153.52 109.66 131.59 43.86 65.79
2006 2007 2008 2009 2010 2011 2012 2013 2014 2015
Fatal Crashes 1 0 0 0 0 0 0 0 0 0
Fatalities 1 0 0 0 0 0 0 0 0 0
Total Crashes 13 8 15 7 13 5 3 8 8 13
Average Daily Traffic 460 450 450 450 470 470 470 470 450 450
Fatal Crash Rate 0.00 0.00 0.00 0.00 0.00 0.00 0.00 0.00 0.00 0.00
Total Crash Rate 330.74 208.06 390.11 182.05 323.71 124.35 74.70 199.20 207.81 338.09
2006 2007 2008 2009 2010 2011 2012 2013 2014 2015
Fatal Crashes 2 2 1 0 1 0 4 3 0 2
Fatalities 2 2 1 0 1 0 5 3 0 2
Total Crashes 54 67 52 74 52 58 47 63 43 65
Average Daily Traffic 2,523 2,461 2,310 2,339 2,339 2,339 2,329 2,330 2,400 2,330
Fatal Crash Rate 2.08 4.28 2.27 0.00 2.24 0.00 8.99 6.74 0.00 4.49
Total Crash Rate 112.77 143.35 117.82 165.62 116.38 129.81 105.62 141.53 95.87 146.02
SH 37
SH 36
SH 38
SH 39

-101-
CrashInformationforSelectedRoutesontheStateHighwaySystem:2006‐2015Ratesareper100MillionVehicleMilesTraveled
2006 2007 2008 2009 2010 2011 2012 2013 2014 2015
Fatal Crashes 0 3 1 0 2 2 1 2 0 0
Fatalities 0 4 1 0 2 2 1 2 0 0
Total Crashes 179 146 135 153 128 125 115 145 111 133
Average Daily Traffic 5,928 6,415 6,617 6,618 6,618 6,377 6,377 6,370 6,350 6,550
Fatal Crash Rate 0.00 3.27 1.06 0.00 2.12 2.20 1.10 2.20 0.00 0.00
Total Crash Rate 211.33 159.27 142.77 161.80 135.37 137.19 126.21 159.30 122.32 142.40
2006 2007 2008 2009 2010 2011 2012 2013 2014 2015
Fatal Crashes 3 0 1 0 2 0 2 1 2 3
Fatalities 5 0 1 0 2 0 2 1 2 3
Total Crashes 253 285 217 216 222 211 174 181 249 240
Average Daily Traffic 15,027 15,158 15,318 15,337 15,337 15,281 15,979 15,960 14,850 16,700
Fatal Crash Rate 1.65 0.00 0.77 0.00 1.55 0.00 1.48 0.74 1.69 2.13
Total Crash Rate 199.40 222.80 167.87 166.88 171.52 163.41 128.87 134.42 210.93 170.34
2006 2007 2008 2009 2010 2011 2012 2013 2014 2015
Fatal Crashes 1 2 0 1 2 0 1 0 0 2
Fatalities 1 2 0 1 2 0 1 0 0 4
Total Crashes 148 147 133 131 137 101 127 127 125 200
Average Daily Traffic 6,643 7,519 7,519 7,360 7,360 7,360 7,360 7,360 7,060 7,110
Fatal Crash Rate 0.00 4.04 0.00 2.06 4.12 0.00 2.06 0.00 0.00 4.27
Total Crash Rate 338.09 296.66 268.41 270.10 282.47 208.24 261.85 261.84 269.71 426.84
2006 2007 2008 2009 2010 2011 2012 2013 2014 2015
Fatal Crashes 0 1 0 0 1 0 0 3 0 0
Fatalities 0 1 0 0 1 0 0 3 0 0
Total Crashes 31 32 34 29 34 21 37 40 37 40
Average Daily Traffic 2,112 2,112 2,347 2,321 2,321 2,086 1,864 2,240 2,470 2,460
Fatal Crash Rate 0.00 3.01 0.00 0.00 2.74 0.00 0.00 6.41 0.00 0.00
Total Crash Rate 93.39 96.40 92.19 79.50 93.21 47.72 96.23 85.50 71.72 77.94
SH 46
SH 45
SH 44
SH 41

-102-
CrashInformationforSelectedRoutesontheStateHighwaySystem:2006‐2015Ratesareper100MillionVehicleMilesTraveled
2006 2007 2008 2009 2010 2011 2012 2013 2014 2015
Fatal Crashes 0 0 0 0 0 0 0 0 0 0
Fatalities 0 0 0 0 0 0 0 0 0 0
Total Crashes 8 4 8 7 3 3 1 7 5 2
Average Daily Traffic 790 780 760 770 780 830 830 830 880 830
Fatal Crash Rate 27.57 0.00 0.00 0.00 0.00 0.00 0.00 0.00 0.00 0.00
Total Crash Rate 223.38 113.12 232.20 200.54 84.84 79.73 26.58 186.04 125.34 53.15
2006 2007 2008 2009 2010 2011 2012 2013 2014 2015
Fatal Crashes 0 2 1 0 0 0 0 1 2 2
Fatalities 0 3 1 0 0 0 0 1 2 2
Total Crashes 27 36 32 27 39 38 35 42 34 11
Average Daily Traffic 2,090 2,090 2,270 2,290 2,290 2,290 2,290 2,290 2,440 2,360
Fatal Crash Rate 5.73 10.74 4.94 0.00 0.00 0.00 0.00 4.90 9.20 9.51
Total Crash Rate 145.00 193.34 158.23 132.34 191.16 186.25 171.55 205.86 156.40 52.32
2006 2007 2008 2009 2010 2011 2012 2013 2014 2015
Fatal Crashes 0 3 0 0 1 0 1 0 0 0
Fatalities 0 3 0 0 1 0 1 0 0 0
Total Crashes 16 22 14 14 10 14 20 27 20 17
Average Daily Traffic 2,980 3,070 3,240 3,070 3,070 3,270 3,410 3,410 4,040 4,040
Fatal Crash Rate 0.00 33.09 0.00 0.00 11.03 0.00 9.93 0.00 0.00 0.00
Total Crash Rate 181.78 242.63 146.30 154.40 110.28 144.95 198.58 268.08 167.61 142.47
2006 2007 2008 2009 2010 2011 2012 2013 2014 2015
Fatal Crashes 3 1 1 2 0 1 0 1 0 1
Fatalities 4 1 1 3 0 1 0 1 0 1
Total Crashes 63 45 43 71 44 50 51 45 43 28
Average Daily Traffic 822 814 821 799 799 799 789 790 750 780
Fatal Crash Rate 10.95 3.64 3.60 7.40 0.00 3.70 0.00 3.75 0.00 3.79
Total Crash Rate 229.78 163.58 154.93 262.82 162.88 185.09 191.17 168.57 170.29 106.23
SH 51
SH 48
SH 47
SH 50

-103-
CrashInformationforSelectedRoutesontheStateHighwaySystem:2006‐2015Ratesareper100MillionVehicleMilesTraveled
2006 2007 2008 2009 2010 2011 2012 2013 2014 2015
Fatal Crashes 2 2 1 3 0 0 0 1 0 1
Fatalities 2 6 1 4 0 0 0 1 0 1
Total Crashes 61 55 77 53 55 62 65 60 66 26
Average Daily Traffic 2,180 2,300 2,150 2,150 2,150 2,150 2,150 2,150 2,180 2,200
Fatal Crash Rate 4.75 4.40 2.35 7.06 0.00 0.00 0.00 2.35 0.00 2.30
Total Crash Rate 141.64 121.04 181.28 124.78 129.49 145.97 153.03 141.26 153.25 59.82
2006 2007 2008 2009 2010 2011 2012 2013 2014 2015
Fatal Crashes 1 0 0 0 1 0 2 0 0 0
Fatalities 2 0 0 0 1 0 2 0 0 0
Total Crashes 57 45 54 50 40 48 59 51 50 73
Average Daily Traffic 6,925 7,970 7,860 8,149 8,149 7,823 7,870 7,870 8,220 8,320
Fatal Crash Rate 0.00 0.00 0.00 0.00 2.39 0.00 4.95 0.00 0.00 0.00
Total Crash Rate 160.61 110.18 133.91 119.60 95.68 119.60 146.13 126.32 118.57 171.03
2006 2007 2008 2009 2010 2011 2012 2013 2014 2015
Fatal Crashes 0 0 0 1 0 1 0 0 0 0
Fatalities 0 0 0 1 0 1 0 0 0 0
Total Crashes 22 20 23 16 10 20 16 14 18 20
Average Daily Traffic 2,600 2,830 2,740 2,640 2,640 2,220 2,260 2,260 2,260 2,350
Fatal Crash Rate 7.01 0.00 0.00 6.72 0.00 7.99 0.00 0.00 0.00 0.00
Total Crash Rate 149.47 124.84 148.95 107.54 67.21 159.86 125.62 109.92 141.33 151.02
2006 2007 2008 2009 2010 2011 2012 2013 2014 2015
Fatal Crashes 7 3 9 9 7 5 4 4 3 4
Fatalities 9 4 10 9 7 6 5 4 5 4
Total Crashes 728 765 662 641 659 693 744 640 743 803
Average Daily Traffic 7,016 7,114 6,316 6,322 6,322 6,248 6,444 6,630 6,850 7,160
Fatal Crash Rate 3.16 0.86 2.89 2.89 2.25 1.62 1.26 1.23 0.89 1.14
Total Crash Rate 211.71 218.36 212.81 205.85 211.63 225.20 234.41 196.71 221.03 228.59
SH 55
SH 52
SH 54
SH 53

-104-
CrashInformationforSelectedRoutesontheStateHighwaySystem:2006‐2015Ratesareper100MillionVehicleMilesTraveled
2006 2007 2008 2009 2010 2011 2012 2013 2014 2015
Fatal Crashes 2 0 0 0 2 0 0 0 1 2
Fatalities 2 0 0 0 2 0 0 0 1 2
Total Crashes 33 14 17 17 31 13 13 24 25 22
Average Daily Traffic 1,380 1,380 1,400 1,560 1,560 1,540 1,470 1,810 1,810 1,850
Fatal Crash Rate 0.00 0.00 0.00 0.00 9.43 0.00 0.00 0.00 4.07 7.96
Total Crash Rate 175.97 89.59 89.36 80.19 146.23 62.12 65.08 120.97 101.64 87.51
2006 2007 2008 2009 2010 2011 2012 2013 2014 2015
Fatal Crashes 0 0 0 0 0 0 0 0 0 0
Fatalities 0 0 0 0 0 0 0 0 0 0
Total Crashes 1 3 2 5 4 4 1 3 6 4
Average Daily Traffic 450 440 390 390 430 430 430 420 420 420
Fatal Crash Rate 0.00 0.00 0.00 0.00 0.00 0.00 0.00 0.00 0.00 0.00
Total Crash Rate 39.56 121.38 91.29 228.23 165.60 165.60 41.40 127.16 254.31 169.54
2006 2007 2008 2009 2010 2011 2012 2013 2014 2015
Fatal Crashes 0 0 1 0 1 0 0 0 0 1
Fatalities 0 0 1 0 1 0 0 0 0 1
Total Crashes 2 3 3 5 5 3 3 3 3 7
Average Daily Traffic 400 340 300 440 440 440 440 440 130 120
Fatal Crash Rate 38.65 0.00 59.27 0.00 40.41 0.00 0.00 0.00 0.00 148.17
Total Crash Rate 88.90 156.88 177.80 202.05 202.05 121.23 121.23 121.23 410.31 1037.17
2006 2007 2008 2009 2010 2011 2012 2013 2014 2015
Fatal Crashes 0 0 0 0 0 0 0 0 0 0
Fatalities 0 0 0 0 0 0 0 0 0 0
Total Crashes 6 6 8 11 7 6 9 3 13 1
Average Daily Traffic 11,000 7,200 7,200 8,000 8,000 8,000 6,910 6,910 6,910 6,910
Fatal Crash Rate 0.00 0.00 0.00 0.00 0.00 0.00 0.00 0.00 0.00 0.00
Total Crash Rate 16.70 25.52 34.02 42.10 26.79 22.96 39.88 13.29 57.60 4.43
SH 57
SH 62
SH 67
SH 64

-105-
CrashInformationforSelectedRoutesontheStateHighwaySystem:2006‐2015Ratesareper100MillionVehicleMilesTraveled
2006 2007 2008 2009 2010 2011 2012 2013 2014 2015
Fatal Crashes 2 3 1 0 0 1 0 0 2 0
Fatalities 2 3 1 0 0 1 0 0 2 0
Total Crashes 117 89 67 65 48 52 68 60 73 91
Average Daily Traffic 16,463 16,581 17,133 16,290 16,290 15,448 15,047 15,040 16,630 17,210
Fatal Crash Rate 2.37 6.14 2.00 0.00 0.00 2.21 0.00 0.00 4.11 0.00
Total Crash Rate 241.33 182.27 133.73 136.44 100.76 115.10 154.54 136.42 150.11 180.63
2006 2007 2008 2009 2010 2011 2012 2013 2014 2015
Fatal Crashes 0 0 1 0 0 0 0 1 0 0
Fatalities 0 0 1 0 0 0 0 1 0 0
Total Crashes 6 5 6 6 1 3 1 1 0 4
Average Daily Traffic 350 350 360 350 350 380 330 330 280 290
Fatal Crash Rate 0.00 0.00 26.49 0.00 0.00 0.00 0.00 28.90 0.00 0.00
Total Crash Rate 163.48 136.23 158.94 163.48 27.25 75.29 28.90 28.90 0.00 131.53
2006 2007 2008 2009 2010 2011 2012 2013 2014 2015
Fatal Crashes 4 5 4 3 1 1 0 1 0 2
Fatalities 4 5 5 5 1 1 0 1 0 3
Total Crashes 175 198 197 127 151 138 115 131 150 172
Average Daily Traffic 3,110 3,120 2,690 2,770 2,770 2,770 2,710 2,710 2,630 2,740
Fatal Crash Rate 2.65 2.57 2.39 1.74 0.58 0.58 0.00 0.59 0.00 1.17
Total Crash Rate 90.33 101.88 117.56 73.60 87.51 79.98 68.12 77.60 91.56 100.77
2006 2007 2008 2009 2010 2011 2012 2013 2014 2015
Fatal Crashes 0 0 0 1 1 0 0 0 0 0
Fatalities 0 0 0 1 1 0 0 0 0 0
Total Crashes 23 18 12 21 18 14 15 12 13 21
Average Daily Traffic 740 830 850 850 850 930 910 910 1,020 1,010
Fatal Crash Rate 0.00 0.00 0.00 10.51 10.51 0.00 0.00 0.00 0.00 0.00
Total Crash Rate 277.59 193.69 126.09 220.65 189.13 134.45 148.49 118.79 113.83 187.30
SH 77
SH 75
SH 71
SH 69

-106-
CrashInformationforSelectedRoutesontheStateHighwaySystem:2006‐2015Ratesareper100MillionVehicleMilesTraveled
2006 2007 2008 2009 2010 2011 2012 2013 2014 2015
Fatal Crashes 1 2 1 0 0 3 0 1 1 0
Fatalities 1 2 1 0 0 3 0 1 1 0
Total Crashes 34 42 34 29 29 29 42 37 41 35
Average Daily Traffic 725 776 850 854 854 854 790 790 720 740
Fatal Crash Rate 0.00 7.68 3.51 0.00 0.00 10.46 0.00 3.77 4.14 0.00
Total Crash Rate 139.73 161.22 119.22 101.12 101.12 101.12 158.35 139.53 169.64 140.90
2006 2007 2008 2009 2010 2011 2012 2013 2014 2015
Fatal Crashes 0 0 0 0 0 2 0 0 1 0
Fatalities 0 0 0 0 0 3 0 0 1 0
Total Crashes 21 25 28 27 22 24 35 23 21 20
Average Daily Traffic 1,230 1,420 1,310 1,360 1,360 1,400 1,390 1,390 1,470 1,470
Fatal Crash Rate 0.00 0.00 0.00 0.00 0.00 11.52 0.00 0.00 5.49 0.00
Total Crash Rate 137.66 141.96 172.34 160.08 130.43 138.23 203.03 133.42 115.19 109.70
2006 2007 2008 2009 2010 2011 2012 2013 2014 2015
Fatal Crashes 0 0 0 0 0 0 0 0 0 0
Fatalities 0 0 0 0 0 0 0 0 0 0
Total Crashes 6 4 2 7 6 11 13 2 9 10
Average Daily Traffic 990 1,200 930 1,060 1,060 1,060 1,000 1,000 1,040 1,040
Fatal Crash Rate 9.57 0.00 0.00 0.00 0.00 0.00 0.00 0.00 0.00 0.00
Total Crash Rate 181.81 99.99 64.51 198.10 169.80 311.30 389.98 60.00 259.60 288.44
2006 2007 2008 2009 2010 2011 2012 2013 2014 2015
Fatal Crashes 0 0 0 1 0 0 0 0 0 0
Fatalities 0 0 0 1 0 0 0 0 0 0
Total Crashes 22 31 25 28 20 23 26 24 23 31
Average Daily Traffic 930 1,100 1,030 1,030 1,030 1,030 920 920 920 960
Fatal Crash Rate 9.57 0.00 0.00 7.44 0.00 0.00 0.00 0.00 0.00 0.00
Total Crash Rate 181.19 215.86 186.03 208.36 148.83 171.15 216.61 199.95 191.62 247.50
SH 97
SH 81
SH 78
SH 87

-107-
CrashInformationforSelectedRoutesontheStateHighwaySystem:2006‐2015Ratesareper100MillionVehicleMilesTraveled
2006 2007 2008 2009 2010 2011 2012 2013 2014 2015
Fatal Crashes 0 0 0 0 0 0 0 0 0 0
Fatalities 0 0 0 0 0 0 0 0 0 0
Total Crashes 4 12 6 3 7 7 5 2 5 12
Average Daily Traffic 745 760 760 760 760 770 770 770 610 610
Fatal Crash Rate 0.00 0.00 0.00 0.00 0.00 0.00 0.00 0.00 0.00 0.00
Total Crash Rate 125.88 370.18 185.09 92.54 215.94 213.13 152.24 60.89 192.17 461.20
2006 2007 2008 2009 2010 2011 2012 2013 2014 2015
Fatal Crashes 0 1 0 0 1 0 0 0 0 0
Fatalities 0 1 0 0 1 0 0 0 0 0
Total Crashes 10 8 9 9 12 12 9 11 7 15
Average Daily Traffic 779 740 1,015 1,015 1,015 750 770 770 780 780
Fatal Crash Rate 0.00 15.88 0.00 0.00 11.57 0.00 0.00 0.00 0.00 0.00
Total Crash Rate 150.77 127.07 104.12 104.12 138.83 187.92 137.32 167.81 105.42 225.90
2006 2007 2008 2009 2010 2011 2012 2013 2014 2015
Fatal Crashes 1 0 0 1 0 0 0 0 0 1
Fatalities 1 0 0 1 0 0 0 0 0 1
Total Crashes 10 15 21 13 7 1 6 6 5 11
Average Daily Traffic 1,379 1,379 1,407 1,125 1,125 1,158 1,085 1,080 1,300 1,280
Fatal Crash Rate 10.95 0.00 0.00 15.02 0.00 0.00 0.00 0.00 0.00 13.93
Total Crash Rate 122.47 180.18 252.25 195.23 105.12 14.60 93.46 93.89 65.00 153.28
2006 2007 2008 2009 2010 2011 2012 2013 2014 2015
Fatal Crashes 2 1 2 1 1 0 2 1 1 0
Fatalities 2 2 2 1 1 0 2 1 1 0
Total Crashes 56 46 62 62 49 61 47 58 37 42
Average Daily Traffic 3,350 3,470 3,220 3,110 3,110 3,090 2,980 2,960 2,980 3,030
Fatal Crash Rate 0.00 2.37 5.10 2.64 2.64 0.00 5.53 2.79 2.77 0.00
Total Crash Rate 137.21 108.81 158.05 163.64 129.33 162.74 130.01 161.85 102.56 114.49
SH 200
SH 99
SH 167
SH 162

-108-

-109-
APPENDIXD:Five‐YearCrashHistory

-110-

-111-
AppendixD:IdahoFatalandInjuryCrashData,Five‐YearHistory
Change Avg. Change
2011 2012 2013 2014 2015 2014‐2015 2011‐2014
Fatal Crashes 152 169 200 175 198 13.1% 5.7%
Injury Crashes 7,492 7,630 7,850 8,217 9,050 10.1% 3.1%
Total Crashes 20,833 21,402 22,347 22,134 24,018 8.5% 2.1%
Total Persons ‐ Fatal & Injury Crashes 20,892 21,610 21,960 22,637 25,388 12.2% 2.7%
Drivers 12,922 13,350 13,858 14,472 16,297 12.6% 3.8%
Passengers 7,240 7,505 7,355 7,607 8,582 12.8% 1.7%
Total Fatalities 167 184 214 186 216 16.1% 4.5%
Fatality Rate per 100 Million AVMT 1.08 1.16 1.35 1.15 1.30 12.5% 2.9%
Total Injuries 10,866 10,988 11,344 11,768 13,207 12.2% 2.7%
Injury Rate per 100 Million AVMT 70.5 69.4 71.5 72.9 79.3 8.7% 1.1%
Impaired Drivers ‐ Fatal/Injury Crashes 796 822 782 770 769 ‐0.1% ‐1.0%
% of All Drivers‐Fatal/Injury Crashes 6.2% 6.2% 5.6% 5.3% 4.7% ‐11.3% ‐4.7%
Alcohol/Drug Test Given ‐ Fatal/Injury Crashes 681 675 635 606 615 1.5% ‐3.8%
% of Impaired Drivers Given Test ‐ F&I Crashes 85.6% 82.1% 81.2% 78.7% 80.0% 1.6% ‐2.7%
Table D‐1

-112-
AppendixD:IdahoFatalandInjuryCrashData,Five‐YearHistory
Change Avg. Change
2011 2012 2013 2014 2015 2014‐2015 2011‐2014
Total Units ‐ Fatal/Injury Crashes 13,801 14,244 14,696 15,295 17,113 11.9% 3.5%
Passenger Cars ‐ Fatal/Injury Crashes 6,412 6,470 6,640 7,033 7,816 11.1% 3.2%
% of Vehicles 46.5% 45.4% 45.2% 46.0% 45.7% ‐0.7% ‐0.3%
Pickups, Sport Utility Vehicles, & Vans
‐ Fatal/Injury Crashes 5,866 6,097 6,474 6,666 7,644 14.7% 4.4%
% of Vehicles 42.5% 42.8% 44.1% 43.6% 44.7% 2.5% 0.9%
Commercial Motor Vehicles ‐ Fatal/Injury Crashes 396 428 459 494 499 1.0% 7.6%
% of Vehicles 2.9% 3.0% 3.1% 3.2% 2.9% ‐9.7% 4.0%
Motorcycles ‐ Fatal/Injury Crashes 440 501 460 447 500 11.9% 1.0%
% of Vehicles 3.2% 3.5% 3.1% 2.9% 2.9% 0.0% ‐2.4%
Bicycles ‐ Fatal/Injury Crashes 339 381 330 296 277 ‐6.4% ‐3.8%
% of Vehicles 2.5% 2.7% 2.2% 1.9% 1.6% ‐16.4% ‐7.0%
Pedestrians ‐ Fatal/Injury Crashes 221 236 216 242 223 ‐7.9% 3.4%
% of Vehicles 1.6% 1.7% 1.5% 1.6% 1.3% ‐17.6% ‐0.1%
All Terrain Vehicles ‐ Fatal/Injury Crashes 57 64 50 46 73 58.7% ‐5.9%
% of Vehicles 0.4% 0.4% 0.3% 0.3% 0.4% 41.8% ‐9.0%
Motor Homes ‐ Fatal/Injury Crashes 7 8 13 12 13 8.3% 23.0%
% of Vehicles 0.1% 0.1% 0.1% 0.1% 0.1% ‐3.2% 19.0%
Farm Equipment ‐ Fatal/Injury Crashes 23 12 12 10 17 70.0% ‐21.5%
% of Vehicles 0.2% 0.1% 0.1% 0.1% 0.1% 51.9% ‐24.2%
Trains ‐ Fatal/Injury Crashes 2 7 10 7 6 ‐14.3% 87.6%
% of Vehicles 0.0% 0.0% 0.1% 0.0% 0.0% ‐23.4% 81.6%
Table D‐2

-113-
AppendixD:IdahoFatalandInjuryCrashData,Five‐YearHistory
Change Avg. Change
2011 2012 2013 2014 2015 2014‐2015 2011‐2014
Roadside Obstacles‐ Fatal/Injury Crashes 1,820 1,850 1,948 2,059 2,107 2.3% 4.2%
% of Crashes 22.6% 23.7% 24.2% 24.5% 22.8% ‐7.1% 2.8%
Roadway Defects‐ Fatal/Injury Crashes 186 197 176 232 225 ‐3.0% 9.0%
% of Crashes 2.3% 2.5% 2.2% 2.8% 2.4% ‐12.0% 7.4%
Vehicle Defects‐ Fatal/Injury Crashes 205 164 187 208 216 3.8% 1.8%
% of Vehicles 1.4% 1.2% 1.3% 1.4% 1.3% ‐7.2% ‐0.9%
Self‐Reported Restraint Use*‐ Fatal/Injury Crashes 14,692 15,182 15,800 16,525 18,685 13.1% 4.0%
% Usage 84.7% 85.5% 84.3% 84.9% 85.2% 0.3% 0.1%
Self‐Reported Child Restraint Use**
Fatal/Injury Crashes 965 865 1,005 942 1,147 21.8% ‐0.1%
% Usage 79.0% 72.7% 77.1% 78.4% 80.2% 2.3% ‐0.1%
Helmet Use‐ Fatal/Injury Crashes 265 319 263 284 310 9.2% 3.6%
% of Motorcycle Operators 54.6% 56.6% 51.5% 58.1% 55.9% ‐3.8% 2.5%
Emergency Medical Service Response
to Fatal/Injury Crashes 5,140 5,150 5,342 5,602 6,142 9.6% 2.9%
% of Fatal & Injury Crashes 63.9% 66.0% 66.4% 66.8% 66.4% ‐0.5% 1.5%
* All Persons 7 years or older (4 or older before 2005) in passenger cars, pickups, sport utility vehicles, and vans.
** All persons 0‐6 years old (0‐3 before 2005) in passenger cars, pickups, sport utility vehicles, and vans using a child safety seat.
Table D‐3

-114-

-115-
APPENDIXE:25YearHistory
Fatalities&FatalityRate

-116-

-117-
263
243
230
250
262258 259
265
278 276
259264
293
260
275267
252
232226
209
167
184
213
186
216
2.61
2.26
2.042.15 2.13
2.00 1.98 1.94 1.942.01
1.81 1.85
2.03
1.751.84
1.75
1.59 1.52 1.46
1.34
1.081.16
1.34
1.15
1.30
0.00
0.50
1.00
1.50
2.00
2.50
3.00
3.50
4.00
4.50
0
50
100
150
200
250
300
Fatalities Fatality Rate (per 100 million AVMT)