iab russia digital advertisers barometer
TRANSCRIPT

IAB Russia Digital Advertisers Barometer – 2016
Interactive Advertising Prospects in Russia: Advertisers’ Point of View
OCTOBER 2016
Conducted by on order and with funding by

Contents1. Acknowledgements 31.1. Ordering Parties of the Research 31.2. Research Partners 41.3. Advertisers 5
2. Executive Summary 62.1. 12 Main Survey Findings 62.2. Market Changes Through the Eyes of Advertisers 9
3. About This Research 123.1. Research Methodology 123.2. The Scope of the Research 123.3. Respondents Profile 12
4. Ad Budgets Dynamics 154.1. 2015 Growth Dynamics 154.2. 2016 Growth Dynamics 174.3. Share of Digital 204.4. Growth of Digital Share 224.5. Growth Drivers 244.6. Limiting Factors 254.7. What Do Advertisers Need 28
5. Marketing Mix 305.1. Marketing and Advertising Spend 305.2. The Number of Advertising Channels Used 305.3. Beyond Digital: TV, Radio, Print, Outdoor 32
6. Digital Mix 336.1. Utilized Tools of Interactive Advertising 336.2. The Number of Digital Tools Used 346.3. Digital Budget Structure 356.4. Dynamics of Advertising Tools: Fact and Expectations 386.5. Online Marketing Beyond Advertising 41
7. Market Mobilization 427.1. Mobile Position in Digital Strategy 427.2. Utilized Mobile Solutions 44
8. Metrics and Analytics 478.1. Parameters of Evaluating Advertising Effectiveness 478.2. Performance Marketing Metrics 488.3. Utilized Analytical Systems 49
9. Advertiser Category 519.1. Manufacturers 519.2. Retailers vs. Service providers 529.3. Opinions of Individual Advertiser Segments 53
About IAB Russia 55
Data Insight Research Agency 56

3 IAB Russia Digital Advertisers Barometer – 2016
1. Acknowledgements
The following study, “IAB Russia Digital Advertisers Barometer – 2016”, presents the views of advertisers regarding interactive advertising market, its development, dynamics and tools usage. The 2016 research is the third annual study; comparison with the similar studies for the years 2014 and 2015 allow us to see how advertisers’ views and perceptions have been changing over the time.
1.1. Ordering Parties of the Research
This study was prepared by the decision of the General Meeting of the IAB Russia members on November 19, 2015. The companies that pool their resources for the sake of development of interactive advertising market in Russia, have unanimously supported the launch of a regular study on advertisers’ mood and expectations in order to give the floor to entrepreneurs and marketers from the real business and thus to increase market transparency.
We would like to express gratitude to all the member companies of IAB Russia that have funded the preparation of this research.

4IAB Russia Digital Advertisers Barometer – 2016
In order to develop interactive advertising tools, professional community needs to listen to the voice of advertisers and understand how the businesses that feed the advertising industry feel. IAB Russia Digital Advertisers Barometer is such voice, that explains advertisers’ plans and expectations for the third consecutive year.
Boris Omelnitskiy, Business Development Director ADFOX of Yandex, President of IAB Russia
1.2. Research Partners
This study was made possible thanks to the support of our partners – communication agencies that have done a great job in attracting advertisers to become research partici-pants. We would also like to emphasize that the participation in this study for the agencies was absolutely gratis. All their work was done solely out of interest for Russian digital advertising market to become more open, transparent and understandable for all its participants.
We would like to express our sincere gratitude to each of our companies personally for their help in preparation of this study:
This research is important and necessary. Every year we support IAB Russia Digital Advertisers Barometer study. It is always interesting to ask advertisers, being active participants of the market, what has changed, where the market is going, what advertising channels are growing, which of them advertisers rely on today and which they will choose in the future. This allows all market partici-pants to look at the whole picture to move forward even more confidently.The year of 2016 has showed that online advertising keeps gaining momentum. That is proven by the market dynamics, that we estimate together with RACA. Mobile, social media ads and non-search channels in general are growing rapidly. And strategy is required more and more.
Maria Chernitskaya, President of iConGroup, Co-founder of iConText, Vice President of IAB Russia

5 IAB Russia Digital Advertisers Barometer – 2016
1.3. Advertisers
We would also like to express our gratitude to all the companies that participated in the survey whether they have given consent to their brand name being specified in this list or not. The opinion of each of you is valuable to us, as collectively these views define the further development of online advertising market in Russia.
The most important thing in any decision is to have accurate information. There-fore, we, INCHCAPE Jaguar Land Rover, support any research, especially in such direction as digital, which is the most dynamic and progressive. This is your great work and invaluable contribution to the future of the industry in general and in making daily decisions at work places.
Olga Proskurina, Head of Marketing and Advertising, INCHCAPE Jaguar Land Rover

6IAB Russia Digital Advertisers Barometer – 2016
2. Executive Summary
2.1. 12 Main Survey Findings
1. Digital is growing. The study has confirmed the positive dynamics of online advertising market: nearly 60 percent of respondents said that digital budgets of their brands have grown in 2015 and are growing in 2016; 65 percent indicated that share of digital in marketing budgets is increasing; on average, the growth of interactive ad spend of the companies surveyed is nearly 20 percentage points better than the dynamics of their offline advertising spend.
The study has showed that the potential of online advertising growth is still far from being exhausted. Estimates of online ad spend growth of “offline born and raised” (i.e. brick-and-mortar) companies, like Banking, Automotive, Real Estate, are quite encouraging. There is also definitely a great potential to grow in the segment of the largest ad categories - pharmaceutical companies, FMCG. In order to achieve this growth, online ad market should further improve the product by making it more competitive in comparison with other media, especially TV advertising… Taking into account the shift of offline companies into online and vice versa, in 2018 we can expect online ad share to make up 40 percent of the whole advertising market, whereas “online born and raised” companies will become one of the largest categories in TV ad segment, taking 5-7 percent of total TV ad market.
Andrey Chernyshov, VP, Strategy at Dentsu Aegis Network Russia Managing Partner at People & Screens
2. Advertisers’ plans have become more aggressive. Compared with the previ-ous survey a year ago, the share of advertisers with aggressive plans in the field of interactive advertising has sharply increased: in 2015 only 33 percent of respondents expected digital budgets to grow more than one-tenth, whereas this year 52 percent expected so. The share of advertisers who expect interactive ad spend to increase by more than 50 percent, has jumped 8 times – from 2 to 16 percent.
A positive signal is that nearly 70 percent of respondents plan to maintain and increase the amount of online advertising spend. High growth is expected in such innovative segments of advertising as social networks, mobile and video ads, as well as in the most popular search / contextual advertising.
Boris Omelnitskiy, Business Development Director ADFOX of Yandex, President of IAB Russia
3. Has the shift of ad spending from offline to online slowed down? Accord-ing to the estimates of the participating advertisers, digital ad spend growth this year will be nearly the same as the last year – about 20 percent on average. Moreover, whereas in 2015 interactive ad growth was accompanied by decrease of offline ad spend (and that has provided digital ad budgets to gain 7 percentage points of all ad market – from 34 percent to 41 percent), this year the dynamic has drastically slowed down. The share of digital in 2016 is estimated to gain only 2 percentage points.

7 IAB Russia Digital Advertisers Barometer – 2016
4. The growth is provided by advertisers that have come from offline. In the first place interactive ad share is increased by advertisers, who have come to digital from offline and they already allocate to digital more than 15 percent (but less than 70 percent) of their total ad spend. Advertisers from such categories as Banking, Automotive and Real Estate, show the greatest interest in increasing their digital share
5. The main growth drivers are effectiveness, targeting and mobile. Adver-tisers recognize that the main drivers of digital ad spend growth and digital ad share are online advertising effectiveness, dynamic targeting and remarketing capabilities, as well as growth of mobile media consumption. “Offline born” companies also name measurability of online advertising and big variety of target audiences to choose from.
6. Limiting factors. The most frequent answer by advertisers to the question on barriers to rapid increase in the share of digital is the admission that interactive advertising is able to solve some marketing problems, but not all of them (especially respondents noted the limited availability of interactive ad solutions for audience extension). For “offline born” companies another important constraint is inability to reduce advertising spending in offline channels. For internet companies the main obstacle is definitely high cost of online advertising.
7. Broad mix of digital tools. There was the time when online advertising would consist of banner and contextual segments only, but this era is in the past now. On average, each advertiser uses seven digital ad tools; in addition to contextual ads and banners, the whole variety of instruments (targeted advertising in social networks, mobile, performance-based, video, email advertising, retargeting) has become a standard. Each of these tools is used by more than 60 percent of respond-ents; contextual and banner ads together make up only 51 percent of total online advertising budget (on average, among the advertisers surveyed).
8. Most digital tools are growing and will continue to grow. The growth leaders, according to the dynamics of answers in 2014-2016 yrs. surveys, are mobile advertising, performance-based (CPA/lead generation) and native advertising – the proportion of advertisers using these tools is growing the fastest. However, the answers to the questions about the future (what tools will be used, which ones will increase their share in digital ad spend) also show the high potential of contextual, video and target-ed advertising. It seems easier to list the tools that do not appear to be among the most dynamic and promising in any of the questions. These are banner ads and rich media, as well as sponsorship..
9. Digital video segment is driven by manufacturers brands. According to the survey, video advertising share already accounts for 9 percent of digital budgets on average (contextual ads, banners and CPA are the only ones that have a bigger share) or about 30 percent of online branding formats. And this segment shows a high

8IAB Russia Digital Advertisers Barometer – 2016
potential for further growth: video advertising (including mobile video) was the most popular answer to the question about the new tools that advertisers can start using in the near future. More than 40 percent of “offline born” companies forecast the rise of video ad share in their digital spending. This segment’s peculiarity is in the high degree of concentration of interest in it within a single category of advertisers: video advertis-ing accounts for nearly a quarter (23 percent) of manufacturers’ digital spending, but only 1-2 percent when it comes to retail and service providers.
In this study, advertisers (offline, especially) pointed digital video among those segments where they expect a significant increase in the near future, and this is absolutely in line with our expectations as well. In the first half of the year 2016 advertisers spent RUB 2.6 billion on online video advertising, which is only 3.6 percent of TV ad spend. However global studies on the effectiveness of advertising investments argue that this proportion can be much higher. Modern development of advertising technologies and machine learning allow us to build a large-scale communication with the help of video formats, by not only incrementing TV reach, but also using such tools as targeting various segments (interests, look-alike, first-party data) and retargeting, increasing performance of their ad campaigns. Additionally, video formats have the unique ability to generate demand for products/services online, and this starts attracting those categories that did not use to advertise on TV, such as e-commerce, gaming and mobile content producers. Probably this very development of online video’s “performance compo-nent” will become the main growth driver in the near future.
Natalia Grishkina, Director of Video Projects at Yandex
10. CPA-advertising can become the second-largest segment of digital market. Performance-marketing (which in this study was interpreted as a model where advertiser pays for each specific action or lead) is not only a massively used tool (with a penetration of 65 percent), but is already a significant part of digital budgets – on average it accounts for 11 percent of online ad spend (and this share is 2 times higher for online companies). The research also shows a big potential of CPA-advertising: out of all digital tools only this segment and mobile advertising can “boast” such a strong combination of achievements: already earned noticeable share in digital budgets, significant increase in the share of those who use this tool (in comparison with surveys of the two previous years), and a large proportion of respondents who plan to increase the share of this tool in their ad spend structure.
11. Mobile advertising has matured. Mobile advertising has evolved from an ex-perimental trend (as it still was for many advertisers a year ago) to a full-fledged part of digital strategy. In a year the share of those who estimate mobile advertising role to be in the range from “one of the elements of digital strategy” to “the absolute priority of digital-strategy”, increased from 42 percent to 69 percent. Moreover, earlier the main format of advertiser presence in mobile was adaptation of websites and landing pages for mobile devices, whereas now the leading tools are separate ad campaign settings and adaptation of ad creatives for mobile devices.

9 IAB Russia Digital Advertisers Barometer – 2016
12. Native advertising has the biggest potential out of all new tools. ОThe survey results show that it is native advertising that should expect the greatest increase in the number of companies who use this tool. While currently it is used by only 43 percent of respondents (compared to almost 80 percent for retargeting and about 60 percent for programmatic/RTB buying and automatic optimization of advertising campaigns), a record 36 percent of advertisers said that they can start using native advertising this or next year.
2.2. Market Changes Through the Eyes of Advertisers
Advertisers’ opinions on the key changes of online advertising market can be found in the responses to the question “What do you think are the main changes in the online advertising market that have occurred over the past 6-12 months?” (an open-ended question). If we group these answers into thematic blocks, main changes in the digital market turn out to be advanced targeting possibilities and growth of programmatic (that are largely interconnected trends), as well as mobile advertising growth. Other popular responses were related to macro changes of advertising market, big data and video advertising.
Fig. 2.1. What do you think are the main changes in the online advertising market that have occurred over the past 6-12 months? (categories of answers)
In the case of targeting possibilities respondents noted both common things, like ad-vanced targeting options, increasing proportion of targeted placements, accumulating experience in the field of targeted advertising, and also – appearance of specific tools related to audience targeting. The examples of answers are given below.
• “increasing share of targeted placements”
• “improving expertise in the field of targeted purchases”
• “look-alike modelling on all platforms”
• “targeting by age-gender structure”

10IAB Russia Digital Advertisers Barometer – 2016
• “launch of audience segmentation tools (constructing, targeting these segments)”
• “implementation of audience settings in Yandex.Direct, launch of Yandex.Audience”
• “development of targeted advertising in social networks”
Automated (programmatic) buying in response to this question on the major market changes was mentioned mainly as a general statement of this segment’s growth and everyone’s interest in it. Perhaps the only example of a more specific response is pene-tration of programmatic into video advertising.
• “audience buying (programmatic) development”
• “programmatic/RTB growth”
• “proliferation of programmatic solutions”
• “improving expertise in the field of programmatic buying”
• “everybody bets on programmatic; this is the only thing all platforms are pushing now”
• “widespread use of programmatic”
• “video advertising transformation, its new features, programmatic, in particular”
Respondents’ answers relating to the topic of mobile segment growth show the versatility of this trend (among mentioned are also traffic growth and increase in ad spend share), still, the development of mobile advertising formats is mentioned in the first place.
• “mobile traffic growth”
• “increasing use of mobile internet”
• “increasing share of mobile advertising”
• “mobile formats boom”
• “increasing number of mobile formats and placement options”
• “increasing number of formats and interactive advertising technologies on mobile devices”
Among the market’s macro trends as key market changes respondents name such things as overall growth of advertiser activity, increasing number of brands that use digital in their promotions and active (more active than before) shift of budgets from offline to online.
• “increasing activity [of advertisers]”
• “more and more companies now use [digital] in their marketing mix”
• “reallocating budgets to online channels”
• “increasing [digital] share among all types of advertising”
Video advertising has got into the key trends of the year not only due to the overall growth of this segment, but also because of the changes noticed by advertisers in terms of tools and features available.

11 IAB Russia Digital Advertisers Barometer – 2016
• “ongoing video growth”
• “video inventory increase”
• “video advertising transformation, its new features, programmatic, in particular”
• “an increase of tools for purchasing mobile and video advertising”
When it comes to big data, in addition to the general statement of importance and positive dynamics of this sector, a number of advertisers noted an increase of publisher professionalism, as well.
• “breakthrough in big data usage”
• “careful work with data and audiences by all publishers, including premium ones”
• “client database usage and matching with his data”
The emergence of new advertising formats or modification of existing ones was men-tioned by respondents quite often, however (as can be seen from the examples below) it is difficult to draw a single significant trend out of these answers.
• “emergence of new formats”
• “an increasing shift from large and intrusive formats towards those more loyal and smart (the new trend is not for “wow-effects” but for filling banner space with information)”
• “emergence of promotional posts in social media”
• “emergence of related services and new internet formats (e.g. audio advertising plus banner ads)”
In addition to those outlined above, respondents named as the key market changes such things as changes in ad systems interfaces, development of analytical solutions, growth of bids in ad systems, unification of ad technologies, emergence of advertising on new publishers.
• “analytics by Yandex”
• “changes in Google AdWords and Yandex.Direct interfaces”
• “changes in advertising serving technologies: HTML5”
• “quality of reports”
• “improving expertise (yet not sufficient so far) in multi-channel/ cross-device field”
• “emergence of Instagram advertising”
• “competition increases and so do bids – on average, two times over the past year”
• “increasing number of special projects”
• “unification of technologies for all publishers”

12IAB Russia Digital Advertisers Barometer – 2016
3. About This Research
3.1. Research Methodology
As in the two previous years, the study IAB Russia Digital Advertisers Barometer — 2016 is based on the survey of advertisers.
The questionnaire was filled online through SurveyGizmo. It comprised 32 questions (average completion time was 25 minutes).
Major advertisers were invited to participate in the survey, namely the representatives responsible for allocation of company’s advertising budgets. Selection and engagement with respondents was held by Data Insight, IAB Russia and major advertising agencies participating as the research partners.
The questionnaires were collected in the period from April to September 2016. After eliminating duplicates (repetitive responses from previously surveyed advertisers) and low credibility profiles (conflicting answers, inability to verify respondent’s identity) an array of 91 profiles was formed; the report was prepared on its basis.
3.2. The Scope of the Research
There are 12 out of 30 largest Russian advertisers (according to AdIndex 2015 rating) among the survey participants, including 5 companies out of top-10. The aggregated advertising expenditures of these 12 companies were estimated by AdIndex to reach RUB 41 billion in 2015, of which RUB 2.4 billion accounted for online advertising.
Five companies out of ten largest advertisers in online banner segment (estimates are based on TNS data for July 2015 - June 2016) participated in this survey.
Ten companies out of the world’s largest brands (featured in Interbrand Best 100 rating) participated in this research.
3.3. Respondents Profile
The majority of respondents (59 percent) are those who directly make decisions on alloca-tion of company’s total advertising budget, or at least its digital part. Another 31 percent of respondents are those involved in decision making on allocation of advertising budgets (usually, the entire budget, not just digital); these are advertising managers and brand managers, in particular. The majority of respondents have more than 5 years of work experience in the field of marketing and advertising.

13 IAB Russia Digital Advertisers Barometer – 2016
Fig. 3.1. Do you make decisions on the allocation of advertising budget in your company?
Fig. 3.2. How many years have you been working in the field of marketing and advertising?
Every fourth respondent (24 percent) represents internet companies, i.e. those that were “born” online and originally would organize sales only via online (or including online). The majority of respondents (76 percent) represent “brick-and-mortar” advertisers who have come from offline.
In regards to the more detailed consideration of the sample structure, 38 percent of com- panies can be classified as manufacturers (and these are solely “offline born” compa- nies – FMCG, Automotive, Pharmaceuticals, Consumer Electronics, etc.); 27 percent of respondents are retailers (including both online stores and brick-and-mortar, as well as omnichannel retail chains; the most widely represented are Kids, Home Improvement & DIY, Clothing and Footwear); 28 percent of respondents are service providers, usually these are the companies that have come from offline (Telecommunication, Banking, etc.), though there are some online companies in this segment as well (such as content provid-ers that utilize subscription model). Seven percent of companies surveyed were attributed to the category “Other” – these are real estate sellers and car dealers.
Make decisions on the allocation of the entire advertising budget
Make decisions on the allocation of the budget for online advertising
Participate in decision-making on the allocation of the advertising budget
Other
more than 10 years
6-10 years
3-6 years
from 1 to 3 years

14IAB Russia Digital Advertisers Barometer – 2016
Fig. 3.3. Distribution of companies surveyed by advertiser category

15 IAB Russia Digital Advertisers Barometer – 2016
4. Ad Budgets Dynamics
4.1. 2015 Growth Dynamics
The majority of respondents (59 percent) said that their brands’ interactive advertising spending has grown in 2015 vs. 2014 (in Russian Rubles), 27 percent indicated the growth to be more than one-fifth and other 20 percent – to be 11-20 percent. Only 22 percent of brands surveyed said their interactive ad spend in 2015 has decreased or not changed (other 19% undecided).
Based on the respondents’ answers, the average (not weighed by the size of each of the advertisers’ share) growth of online advertising budgets in 2015 is estimated to be at +17 percent, whereas offline ad spend was 5 percent down.
Fig. 4.1. How has your brand’s advertising budget changed (in Russian Rubles) in 2015 vs. 2014?
Both decrease or stagnation of interactive advertising budgets and, vice versa, their increase for more than 20 percent are more likely for online companies, whereas “offline born” companies usually show moderate growth in digital budgets. Twenty-four percent of online companies and 48 percent of offline brands has either kept their interactive ad spending unchanged or increased it by only 20 percent or even less.

16IAB Russia Digital Advertisers Barometer – 2016
Fig. 4.2. How has your brand’s interactive advertising budget changed (in Russian Rubles) in 2015 vs. 2014?
Comparing to the 2015-year survey (on ad spend change in 2014), the share of compa-nies with high (over 20 percent) increase in their budgets for online advertising has not changed. However, the number of companies with zero dynamics or moderate (up to 10 percent) growth in digital ad spend has actually reduced. The proportions were redis-tributed in favor of both the answer “budget has been reduced”, and “growth by 11-20 percent”. In comparison to 2013-year estimates (the survey from 2014), the share of answers “the budget has not changed,” has fallen particularly hard – more than 2 times.
Fig. 4.3. How has your brand’s interactive advertising budget changed (in Russian Rubles) comparing to the previous year? (data from 2014-2016-years surveys, excluding undecided)
decreased
not changed
increased by 3-10%
increased by 11-20%
increased by 21-50%
increased by 50%+
undecided
online companies
“offline born” companies

17 IAB Russia Digital Advertisers Barometer – 2016
4.2. 2016 Growth Dynamics
Fifty-six percent of respondents have said that their interactive advertising budgets will grow in 2016 vs. 2015 (in Russian Rubles). Thirty percent have indicated the growth to be more than one-fifth, other 13 percent – the growth to be 11-20 percent. Twenty-nine percent of respondents expect their interactive ad budgets to decrease or stagnate (other 15 percent undecided).
Fig. 4.4. How will your brand’s advertising budget change (in Russian Rubles) in 2016 vs. 2015?
Based on the answers of respondents, the average (not weighed by the size of each advertiser share) growth of online advertising budgets in 2016 can be expected to be at +20 percent, whereas offline ad spend is estimated to be only 3 percent up.
Fig. 4.5. Change of ad budgets: average estimate

18IAB Russia Digital Advertisers Barometer – 2016
Compared to the responses to the question about the actual change of budgets for online advertising in 2015, this year somewhat bigger share of respondents (29 percent vs. 23 percent) expects budgets reduction or stagnation, at the same time the share of those who expect the growth rate to be at 20 percent and more, is bigger too (30 percent vs. 27 percent).
Fig. 4.6. How has/will your brand’s advertising budget change (in Russian Rubles)? – comparison of responses on 2015 (actual) and 2016 (forecast)
If we compare the answers to the questions about the actual change of online ad budgets in 2015 and the expected change in 2016, it appears that 41 percent of companies surveyed keep last year’s positive dynamics this year as well, 34 percent slow down the growth rate, and 25 percent ramp it up (or increase instead of reducing / keeping unchanged).
The polarization of online companies on digital ad budgets dynamics, noted above in relation to 2015 (while the majority of “offline born” companies gravitates towards moder-ate increase in digital budgets) is preserved in 2016 as well. Online companies more often choose such answers as “the budget will decrease” or, vice versa, “it will grow by 21-50 percent” and “will grow by more than 50 percent”, whereas representatives of brick-and- mortar companies more often choose the growth to be 3-10 percent only or 11-20 per-cent (32 percent of answers in total vs.10 percent for online companies).
decrease
no change
growth 3-10%
growth 11-20%
growth 21-50%
growth 50%+
undecided

19 IAB Russia Digital Advertisers Barometer – 2016
Fig. 4.7. How will your brand’s interactive advertising budget change (in Russian Rubles) in 2016 vs. 2015?
Comparing to the previous year’s survey (on the expected change in budgeting for 2015), the proportion of respondents who expect the current year’s online ad spend to decrease or stay the same, has significantly reduced. A year ago the share of such responses accounted for 52 percent, while now it is only 35%. At the same time, the proportion of respondents expecting increase in digital budgets by more than 50% has increased by eight times – from 2 percent to 16 percent.
Fig. 4.8. How will your brand’s interactive advertising budget change (in Russian Ru-bles) this year? – (data from 2014-2016-years surveys, excluding undecided)
онлайн- компании
пришедшие из оффлайна
will decrease
will not change
will increase by 3-10%
will increase by 11-20%
will increase by 21-50%
will increase by 50%+
undecided

20IAB Russia Digital Advertisers Barometer – 2016
4.3. Share of Digital
Among the respondents surveyed in 2016, one in five companies advertises entirely or almost entirely in digital – their share of online advertising accounts for 85-100 per-cent of their total budget (the average for this group is 95 percent). Another compara-ble segment of the sample (22 percent) are the companies for whom digital is the main advertising channel (its share is 40 to 80 percent, 59 percent on average). The rest of respondents (58 percent) represent companies that allocate to digital no more than 30 percent of their advertising budgets – most of the time it is from 15 to 30 percent (41 percent of all surveyed, the average share of digital for the group is 22 percent), but sometimes – even less than 15 percent (17 percent of respondents, the average share of digital is 8 percent).
The average digital share across all companies surveyed in 2016 is 43 percent of total advertising budgets (the median being 30 percent).
Fig. 4.9. Approximately what share of your brand’s advertising budget accounts now (2016 year-end forecast) for interactive advertising?
The share of digital in advertising budget differs significantly for different types of respond-ents. The majority of “online only” companies allocate to digital channels at least 85 per-cent of their total budget, while for “offline born” advertisers the average share of digital in ad budgets is 33 percent (the median being 20 percent). Among the advertisers who spent 85 to 100 percent of their budgets on digital, just one-fourth is brick-and-mortar, whereas among the companies with the lower share 85 percent is so.
For “offline born” advertisers the low share of digital ad budgets is primarily determined by conservative strategies of manufacturers – on average they allocate only 17% of their budgets to interactive advertising, – whereas retailers and services (even if to take into account only “offline born” ones) allocate half of their budgets there.
Less than 15%
15-30%
40-75%
90% and more

21 IAB Russia Digital Advertisers Barometer – 2016
Fig. 4.10. Share of digital in advertising budgets for 2016 – comparison by advertis-er category
Among specific advertiser segments we can distinguish Real Estate, Automotive and Banking – respondents from these segments on average spend on digital from 43 per- cent (Banking) to 60 percent (Real Estate) of their advertising budgets. The research also showed a greater share of online advertising in the budgets of certain categories of retailers (Kids, Home Improvement & DIY), but this is largely due to the fact that in these categories the survey covered mainly online stores (as opposed to e.g. Consumer Electronics and Appliances).
Fig. 4.11. Share of digital in advertising budgets for 2016 — comparison by advertiser segments

22IAB Russia Digital Advertisers Barometer – 2016
4.4. Growth of Digital Share
Almost two-thirds of respondents (65 percent) when asked a question “If to talk about overall trends for the previous and current year, how is your brand’s share of digital (in-cluding both online and mobile advertising) changing in your total advertising budget?”, indicated that the share of digital is growing.
Fig. 4.12. If to talk about overall trends for the previous and current year, how is your brand’s share of digital (including both online and mobile advertising) changing in your total advertising budget?
Out of the companies that are increasing the digital share, there are particularly many of those who have come from offline, primarily from such segments as Banking, Automotive and Real Estate. Also, the increase of digital share (both the previous and the current year) positively correlates with the following factors: print advertising usage (i.e. there is a budget that can be shifted to digital), targeted advertising usage (there is an under-standing, which digital segments should receive additional funds), the absence of 2015 ad budget reduction – total, not online one (there is a possibility to increase online pres-ence vs. cutting costs in proportion to the sequester of total advertising budget).
The probability of a positive answer to the question on the dynamics of digital share is significantly below average for the two opposite types of advertisers. On the one hand, these are FMCG manufacturers and any brands with low (less than 15 percent) share of digital in advertising budget. On the other hand, these are “online born” companies and/or those who spend almost all (and at times the entire) of their ad budget on digital, and, especially, online retailers (whose unpreparedness to increase their share of digital affects the survey results across the whole retailing category).
Growing
Not growing
Undecided

23 IAB Russia Digital Advertisers Barometer – 2016
Fig. 4.13. Categories with the lowest and the highest proportion of advertisers, who are increasing the share of digital in their advertising budgets
Minimum indicators: digital share is increased by
approx. 50-60% of companies
Maximum indicators: digital share is increased by
more than 70% of companies
Retailers (57%) Those who advertise in print (74%)
FMCG brands (50%) Those who have increased (or kept the same) their ad budget for 2015 (75%)
Those who spend on digital less than 15% of their total ad budget (50%) Those who use targeted advertising (72%)
Those who spend on digital more than 80% of their total ad budget (58%) “Offline born” companies (72%)
“Online born” companies (48%) Banking, Automotive, Real Estate (93%)
In addition to the data on the growth of digital, shown above, the answers to questions on the approximate digital share for each year (in the last survey the question was asked about 2014, 2015 and 2016, forecast) allow us to calculate the share of digital (average for all brands surveyed in 2016) in advertising budgets for each year. According to the respondents, in 2015 the share of digital on average has grown by 7 percentage points at once, while in the current year it is expected to increase just slightly more than by 2 percentage points. However, advertisers’ representatives tend to estimate the advertising budget dynamics for the current year cautiously and too conservatively. This is indicated, in particular, by the comparison of their answers a year ago (on the question of digital ad growth forecast in 2015) and their answers now (on the question of the budgets growth last year). In 2016 the survey post facto showed a considerably higher estimate of the market’s dynamics in 2015.
Fig. 4.14. Average share of digital in overall advertising budgets
If we compare the current respondents’ answers regarding the share of digital advertis-ing budgets for 2014, 2015 and (preliminary) 2016, it appears that the digital share is growing only among nearly 60 percent of brands (last year 64 percent said that it has increased, this year 59 percent indicated so). But if the share of digital increases, usually it does at a rate of at least 5 percentage points a year, and 10 percentage points a year and more – for each fourth advertiser.

24IAB Russia Digital Advertisers Barometer – 2016
Fig. 4.15. Advertiser distribution by the dynamics of digital share in their advertising budgets
According to the respondents themselves, for 28 percent of advertisers the share of digital is changing at the same rate as a year ago (for example, it did not change in 2015, neither it does now; or it grew by 5 percentage points in 2015 and is growing by the same 5 percentage points. in 2015). 34 percent of companies indicated that the growth pace of digital has slowed down, 21 percent – that it, on the contrary, has sped up. Another group (17% of advertisers) keeps their share of online in the advertising budget unchanged for three consecutive years (2014-2016).
4.5. Growth Drivers
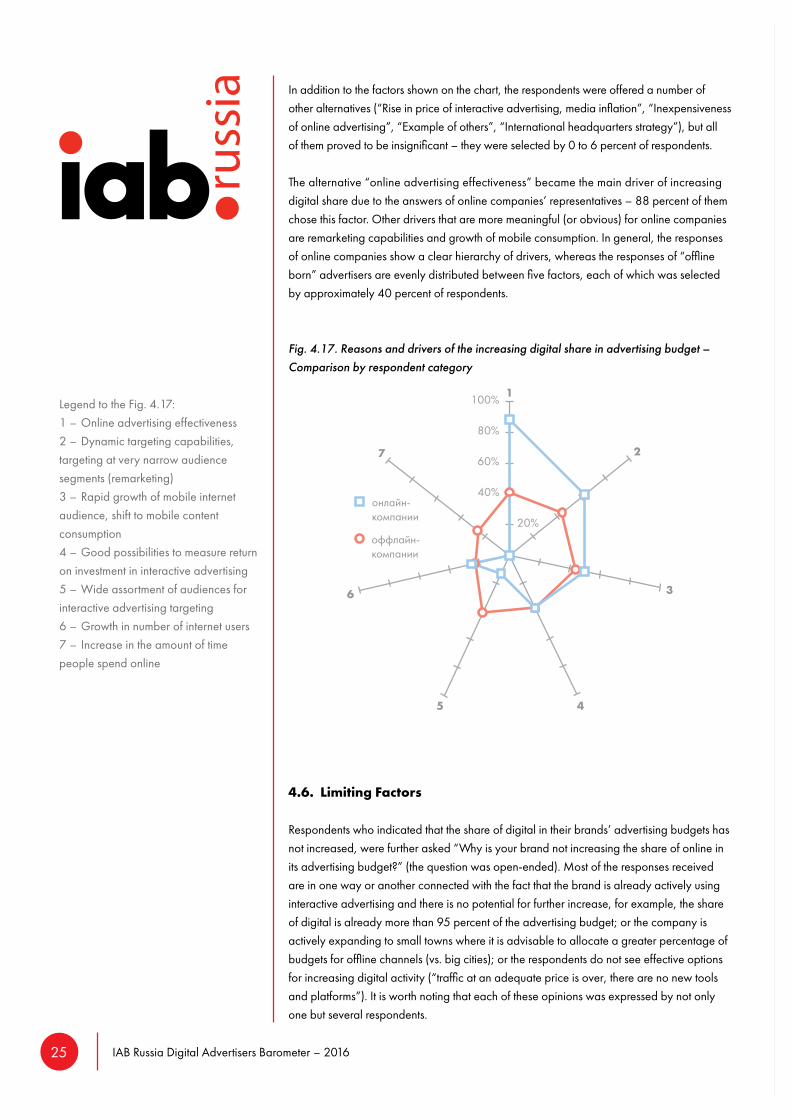
“Online advertising effectiveness” was the most popular answer to the question on the main reasons and drivers of the increasing digital share in ad budgets (respondents could choose from one to three alternatives). Among the top-5 drivers are also remarketing ca-pabilities, growth of mobile audience and mobile media consumption, high measurability of online advertising and rich selection of audiences for targeting.
Fig. 4.16. What are the main reasons and drivers of the increasing digital share in your brand’s advertising budget?
decrease
unchanged
growth by 1-4 p.p.
growth by 5-9 p.p.
growth by 10 p.p. and more
Online advertising effectiveness
Dynamic targeting capabilities, targeting at very narrow audience segments (remarketing)
Rapid growth of mobile internet audience, shift to mobile content consumption
Good possibilities to measure return on investment in interactive advertising
Wide assortment of audiences for interactive advertising targeting
Growth in number of internet users
Increase in the amount of time people spend online
25 IAB Russia Digital Advertisers Barometer – 2016
In addition to the factors shown on the chart, the respondents were offered a number of other alternatives (“Rise in price of interactive advertising, media inflation”, “Inexpensiveness of online advertising”, “Example of others”, “International headquarters strategy”), but all of them proved to be insignificant – they were selected by 0 to 6 percent of respondents.
The alternative “online advertising effectiveness” became the main driver of increasing digital share due to the answers of online companies’ representatives – 88 percent of them chose this factor. Other drivers that are more meaningful (or obvious) for online companies are remarketing capabilities and growth of mobile consumption. In general, the responses of online companies show a clear hierarchy of drivers, whereas the responses of “offline born” advertisers are evenly distributed between five factors, each of which was selected by approximately 40 percent of respondents.
Fig. 4.17. Reasons and drivers of the increasing digital share in advertising budget – Comparison by respondent category
4.6. Limiting Factors
Respondents who indicated that the share of digital in their brands’ advertising budgets has not increased, were further asked “Why is your brand not increasing the share of online in its advertising budget?” (the question was open-ended). Most of the responses received are in one way or another connected with the fact that the brand is already actively using interactive advertising and there is no potential for further increase, for example, the share of digital is already more than 95 percent of the advertising budget; or the company is actively expanding to small towns where it is advisable to allocate a greater percentage of budgets for offline channels (vs. big cities); or the respondents do not see effective options for increasing digital activity (“traffic at an adequate price is over, there are no new tools and platforms”). It is worth noting that each of these opinions was expressed by not only one but several respondents.
Legend to the Fig. 4.17: 1 – Online advertising effectiveness2 – Dynamic targeting capabilities, targeting at very narrow audience segments (remarketing)3 – Rapid growth of mobile internet audience, shift to mobile content consumption4 – Good possibilities to measure return on investment in interactive advertising5 – Wide assortment of audiences for interactive advertising targeting 6 – Growth in number of internet users7 – Increase in the amount of time people spend online

26IAB Russia Digital Advertisers Barometer – 2016
Only 5 percent of respondents answered in a way that directly questions the effectiveness of interactive advertising, or specifies other advertiser priorities. Examples include the following wording:
“The brand generally adheres to the strategy of reducing and optimizing costs; on this evidence the budgets are reallocated towards the channels that are effec-tive enough and cost lower”
“It [the share of digital] is now about 10% and there are no reasons to increase it, taking into account the campaign objective – to maximize target reach at the lowest cost”
“The priority is given to TV”
“The budget is redistributed in favor of SEO, CRM and product development – it is better to pay a salary to a programmer than to a manager or paid channels, that parasitize on your own clients”
A more complete understanding of the factors hindering the growth of digital budgets is provided by the answers to the question “What prevents you from a faster increase of the digital share in the advertising budget?” (respondents could choose all that applies out of nine alternatives). As could be expected, the respondents’ answers did not show absolute dominance of any single or two constraints. Four factors were similar in signifi-cance, though none of them was chosen by more than a third of respondents. These factors are inability of interactive advertising to solve specific marketing problems (answers to the question about what exactly these problems are, given below); inability to reduce spending on offline advertising; insufficient online audience reach and high cost of online advertising. A significant proportion of respondents (26 percent) said that none of the factors listed in question is a barrier to increasing the share of digital in the advertising budget.
The answers to the question “Which factor is the most important?” showed the particular importance of the cost-related factors and primarily – inability to reduce offline advertising spending – the vast majority of respondents who have chosen these factors as significant, chose them as the most important ones.
Fig. 4.18. What prevents you from a faster increase of the digital share in the advertis-ing budget?
Legend to Fig. 4.18: 1 – Inability of interactive advertising to solve specific marketing problems2 – Inability to reduce advertising spending in other media channels3 – Insufficient online audience reach4 – Too high cost of online advertising5 – Insufficient effectiveness of interactive advertising6 – Lack of qualified professionals in digital7 – Llack of ad inventory that is in demand8 – Conservative management of the company9 – Other10 – None of the above

27 IAB Russia Digital Advertisers Barometer – 2016
Answers in “Other” included such wordings as: “increase in cost of traffic with low [conver-sion] funnel leads to exceeding effective cost of acquisition,” “long process of campaign optimization for brand’s goals and objectives due to high competition,” “there is nowhere else to increase.” Also the respondents pointed to the limitations connected with internal processes of the company.
Respondents who among the significant barriers to the growth of digital share reported its inability to solve certain marketing problems, were asked an additional question: “Which exactly marketing objectives (relevant for you) cannot be achieved with the help of inter-active advertising?”. In their responses, the respondents pointed to such objectives as pro-viding wide and affordable reach, audience extension (including at the expense of people “from offline”); communication and sales to large customers, professional and premium audiences. Examples of their responses are shown below.
“Attracting customers from offline to online:)”
“Evaluating communication effectiveness, ROI (since we have branding communications)— haven’t seen a working [evaluation] model yet”
“Wide and affordable reach together with luxurious positioning”
“BTL (sales in offline stores)”
“Market formation — … new audience can be attracted with the help of other channels, for instance, offline advertising”
“Reach of population in remote areas with limited internet penetration”
“Building awareness for wide target audience”
“BTL, communications and sales to the public sector and large businesses”
“Customer journey implies customer’s interaction with other communication channels”
“Branding advertising format is impossible to be fully implemented online”
“Building brand awareness”
“Reaching only professionals [with status verification]”
“Face-to-face communication is often better”
“Final conversion [for premium brands]”
Inability of digital to solve specific marketing objectives is clearly the main constraining growth factor for those advertisers, whose share of online advertising in the overall budget (for the full year of 2015) is 15-30 percent or about 50 percent. The second most important barrier to such advertisers is high cost of online advertising.
At the same time for advertisers with digital share of less than 15 percent, the main con-straints are inability to reduce other (offline) advertising channels and the belief that Internet has insufficient audience reach.
Answers to the question about the factors hindering the growth of digital share, also vary greatly depending on the type of advertiser. The main factor for online companies is cost of advertising, and they also often report such problem as lack of effectiveness of digital. “Offline born” advertisers most often name inability to reduce costs on other media.

28IAB Russia Digital Advertisers Barometer – 2016
Fig. 4.19. What prevents you from a faster increase of the digital share in the advertising budget? – Comparison by advertiser category
Legend to Fig. 4.19: 1 – Inability of interactive advertising to solve specific marketing problems2 – Inability to reduce advertising spending in other media channels3 – Insufficient online audience reach
4 – Too high cost of online advertising5 – Insufficient effectiveness of interactive advertising
4.7. What Do Advertisers Need
At the end of the questionnaire the respondents were asked “What does your company lack on the online advertising market, what options and services does it need?” (open-end-ed question). The responses to this question show that the major unmet needs for advertisers are data, analytics and consolidation of this analytics. Other popular topics of claims and wishes are lack of targeting capabilities and shortcomings in the work of agencies.
What do they need Examples of answers
Data • “cross-platform tracking and analytics” • “planning and buying of people instead of browsers” • “decent analytical system for mobile apps” • “consolidated analytics” • “Big Data” • “single panel with offline” • “cross-device analytics, … capability of using a single tool to consider the overall reach when placing ads across different channels, capability of understanding reach duplication with TV and OOH” • “taking into account offline conversions” • “reliable tools to eliminate purchase of bot and junk traffic” • “evaluating effectiveness via pixels (not all publishers agree to do that)” • “more free analytics is needed”

29 IAB Russia Digital Advertisers Barometer – 2016
Targeting • “effective targeting in online video”capabilities • “personalization of advertising offer when using retargeting” • “precisely targeted interactive advertising” • “dynamic mobile formats across all channels, not only on myTarget and Facebook” • “a clearer division of [settings] in Yandex for desktop and mobile campaigns” • “dynamic retargeting in Yandex is needed”
Agency-side services • “ability of digital agencies to speak the same language with traditional agencies and clients” • “use of advanced tools in agencies” • “high-quality design services at an affordable rate
Other • “expansion to mobile” • “cross-media placements” • “capability to advertise pharmaceutical goods and services in Google AdWords, Vkontakte” • “flexible services with CPO and CPA paying models” • “we prefer buying clicks or visits and only a few are offering them so far • “there is not enough time to keep up with tracking of everything”

30IAB Russia Digital Advertisers Barometer – 2016
5. Marketing Mix
According to the respondents, only half of their brands marketing budgets is actually directed on advertising (for purchase of advertising space in media). The average share of advertising spending is 49 percent of total marketing budget and 50 percent of interactive marketing budget.
Only 44 percent of advertisers allocate the biggest part (at least 70 percent) of their online marketing budgets to advertising itself - and a comparable proportion of respondents (40 percent) indicated that advertising accounts for less than 40 percent of their internet marketing budget.
5.1. Marketing and Advertising Spend
Fig. 5.1. Approximately what share of your marketing / online marketing budget accounts for advertising itself?
Speaking of the structure of internet marketing budgets, the increased share of advertising expenditure is typical for “online only” companies and/or companies that advertise entirely online (on average they spent on advertising 60 percent of marketing budgets), as well as for retailers (57 percent).
5.2. The Number of Advertising Channels Used
Some of the research questions were about offline media – the respondents were asked if their brands use TV, radio, print and outdoor advertising. Given the option «other» (by which the majority of respondents meant BTL - sampling, point of sale marketing, sponsorship) respondents could specify from 1 to 6 media channels they use (including online advertising).
less than 15%
15-35%
40-60%
70-85%
90% and more

31 IAB Russia Digital Advertisers Barometer – 2016
According to the research, only 22 percent of advertisers surveyed use solely interactive advertising – others combine it with offline channels, and only one in eight uses just one offline channel. Sixty-nine percent of advertisers use three or more channels (including at least two offline ones).
Fig. 5.2. Advertiser distribution by the number of used advertising channels
The number of utilized advertising channels by nature is highly dependent on the advertiser category – there are three times more of those who advertise entirely in digital among “online born” companies (vs. “offline born”), whereas brick-and-mortar advertisers (especially, manufacturers) are likely to combine four or more advertising channels.
Fig. 5.3. The number of used advertising channels: comparison by advertiser category
1 channel (online)
2 channels
3 channels
4 channels
5 channels and more

32IAB Russia Digital Advertisers Barometer – 2016
5.3. Beyond Digital: TV, Radio, Print, Outdoor
Among online advertisers the proportions of those who (other than digital) use outdoor, print and TV advertising, are roughly equal. TV advertising loses (by the number of companies who use it among surveyed) to press and outdoor solely due to the fact that it is not used by the vast majority of online brands – even radio advertising is used by a larger number of “online born” companies.
Fig. 5.4. Utilized offline advertising channels
Offline media ranks by popularity vary significantly depending on the advertiser category: TV advertising has the highest «penetration» among manufacturers (with the vast majority also using press and outdoor). The majority of retailers use outdoor advertising – though by popularity it is only slightly ahead of print and radio, and significantly ahead of TV. An absolute favorite for the service sector is outdoor.
Fig. 5.5. Utilized offline advertising channels: comparison by advertiser category

33 IAB Russia Digital Advertisers Barometer – 2016
6. Digital Mix
6.1. Utilized Tools of Interactive Advertising
The overwhelming majority of online advertisers (more than 85 percent of those surveyed) use search (contextual) ads and banner ads. Also, the following formats have the penetra-tion of more than 60 percent: targeted advertising (in social networks), mobile advertising, performance-based advertising (CPA/lead generation), video advertising (digital video) and email advertising. Out of the remaining ad formats included in the questionnaire, only sponsorship and native advertising are those that are used by more than one-third of advertisers.
Fig. 6.1. Utilized advertising formats
The set of used advertising formats differs significantly for “online born” and “offline born” companies. There are six types of advertising that used almost by all online com-panies (by more than 80 percent in each case), these are: search advertising, banners, targeted advertising, mobile, CPA and email. Moreover, CPA (performance marketing) is the second popular after search. For offline companies there are only two tools that are used by almost everyone, these are banner ads and search ads (on a par with each other). They are followed (with the penetration of less than 75 percent though) by targeted advertising and digital video.
Among offline companies the share of those who use video ads is 2.2 times higher than for online companies; the same difference is observed for rich media. At the same time, a much lower proportion of “offline born” companies uses CPA-advertising and email advertising.

34IAB Russia Digital Advertisers Barometer – 2016
Similar differences can be observed when comparing digital tools used by manufac-turers, retailers and services. Manufacturers are the most likely (vs. other categories) to use digital video and rich media, as well as sponsorship and native advertising, but they are far behind when it comes to performance-based advertising and email mar-keting. As for the comparison of retailers and service companies, the difference in their arsenals of digital tools is rather moderate. The retailers somewhat oftener use video ads and classifieds, and more rarely (albeit slightly) – CPA marketing, sponsorship and in-game advertising.
Fig. 6.2. Utilized advertising formats: comparison of online and offline companies
Fig. 6.3. Utilized advertising formats: comparison by company type
Legend to Fig. 6.2 and 6.3: 1 – search (contextual) advertising2 – sbanner advertising3 – stargeted advertising4 – smobile advertising5 – sCPA/lead generation6 – svideo advertising
7 – semail advertising8 – ssponsorship9 – snative advertising10 – srich media11 – sclassifieds12 – sin-game advertising
6.2. The Number of Digital Tools Used
In the question “What types of interactive advertising does the brand you represent use?” the respondents chose an average about seven (6.8) tools out of twelve positions listed. Only 26 percent marked less than 6 tools.

35 IAB Russia Digital Advertisers Barometer – 2016
Fig. 6.4. Advertiser distribution by the number of used digital advertising tools
The use of a wide range of digital-tools is typical for the following advertisers:• those who have increased their digital ad spend in 2015 for more than one-fifth (7,8)• those who advertise (other than online) in at least 3 offline channels (7,6)
6.3. Digital Budget Structure
According to the survey, two base segments of the market - search and banner ads – take only half of online advertising budgets (51 percent), while the second half of the budget is distributed among multiple smaller segments. Relatively new tools - CPA, digital video, targeted advertising and mobile advertising - in total amount to 32 percent of budgets.
Fig. 6.5. Online ad budgets distribution by segment
Looking only at the answers of the advertisers who use a specific advertising tool, we see that the companies spend on search ads on average 38 percent of their budgets, 19 percent on CPA, 17 and 16 percent – on banners and digital video, respectively. The companies that use targeted advertising, mobile advertising and special projects, on average spend on each of them 9 percent of their advertising budgets; for classifieds, rich media and email these numbers are 8 percent, 7 percent and 6 percent, respectively.
Search
Banners
CPA/Lead Generation
Digital Video
Targeted advertising (in social media)
Mobile
Sponsorships
Other

36IAB Russia Digital Advertisers Barometer – 2016
It should be admitted the distribution above is a classic example of the tyranny of averages and to a large extent it depends on the balance of manufacturers and retailers in the survey sample. On average, “offline born” companies allocate 37 percent of their online adver-tising budgets to branding formats – banner ads, video ads, sponsorship (and traditional banners take up just slightly less than a half of this amount). “Online born” companies spend on branding formats on average only 11 percent of their online ad budgets, and almost all of this funds are distributed in favor of banners. The proportions of digital video and sponsorship in their interactive ad budgets in comparison to offline advertisers are, on average, thirteen and seven times less, respectively.
At the same time, in their budgets “online born” companies have a three times larger share of CPA advertising (14 percentage points) than that of offline companies; their share of search advertising is also larger – by one-third (11 percentage points).
Fig. 6.6. Online ad budgets distribution by segment: comparison of online and offline advertisers
The features of digital spend structure specific to “offline born” advertisers, are particularly clearly seen among manufacturers - on average they spend 56 percent of their digital budgets on branding formats (compared to 12 percent for retailers and services), and only 22 percent – on search and performance advertising (versus 66 percent and 59 percent, respectively).
Banner ads
Digital video
Sponsorships
Email advertising
Mobile advertising
Targeted advertising
CPA/lead generation
Search advertising
Other

37 IAB Russia Digital Advertisers Barometer – 2016
Fig. 6.7. Online ad budgets distribution by segments: comparison by advertiser category
Banner ads
Digital video
Sponsorships
Email advertising
Mobile advertising
Targeted advertising
CPA/lead generation
Search advertising
Other
Yet another factor that has a very strong influence on digital ad spend distribution (and is itself, of course, highly dependent on advertiser type) is a role of digital in overall advertising strategy. It is likely for advertisers with low digital share (less than 15 per-cent of overall ad spending) to allocate the majority of their digital budget to branding formats – on average, 42 percent goes there and this is more than the share of search or of all other digital segments combined. At the same time, those advertisers who direct to digital about half of their advertising budgets or more, on average allocate for branding tools only about 10% of their overall interactive ad advertising. If to recalculate the data presented as a percentage of total advertising budget, it appears that the share of digital branding formats for all categories of advertisers on average does not exceed 8 percent of overall advertising budget, whereas for example the share of search advertising is 3 percent for advertisers with a small digital share in their advertising budget and 56 per-cent for advertisers, that spend on digital all or almost all of their advertising budget.
The chart with individual types of advertising tools shows that this dependence on digital share is particularly strong for digital video and sponsorships – they are given a signifi-cant share of interactive budgets only from advertisers who direct to online less than 15 percent of their total advertising budget.
Advertisers with large digital share, in addition to search advertising, also give a higher priority to performance advertising. Targeted and mobile advertising can be considered as the most versatile digital tools, for they are equally in demand by all segments of ad-vertisers, regardless of what part of their advertising budget accounts for digital.

38IAB Russia Digital Advertisers Barometer – 2016
Fig. 6.10. Share of digital tools in interactive advertising budget depending on the share of digital in overall ad spending
6.4. Dynamics of Advertising Tools: Fact and Expectations
The comparison of survey findings from 2016 and those from the previous years (2014-2015) shows a significant increase in penetration of four online advertising tools: mobile, CPA, native advertising and classifieds (for the rest of digital tools it shows a stable user share or minor multidirectional fluctuations, which can be explained simply by changes in sampling structure).
Fig. 6.8. Online ad budgets distribution by the share of digital in overall ad spending
Fig. 6.9. Shares of digital tools in overall advertising budget: comparison by digital share
banner adsCPA/lead generationdigital video
targeted advertisingmobile advertising
sponsorships email advertising
* CPA advertising, targeted advertising, mobile advertising, email marketing, native advertising, classifieds
39 IAB Russia Digital Advertisers Barometer – 2016
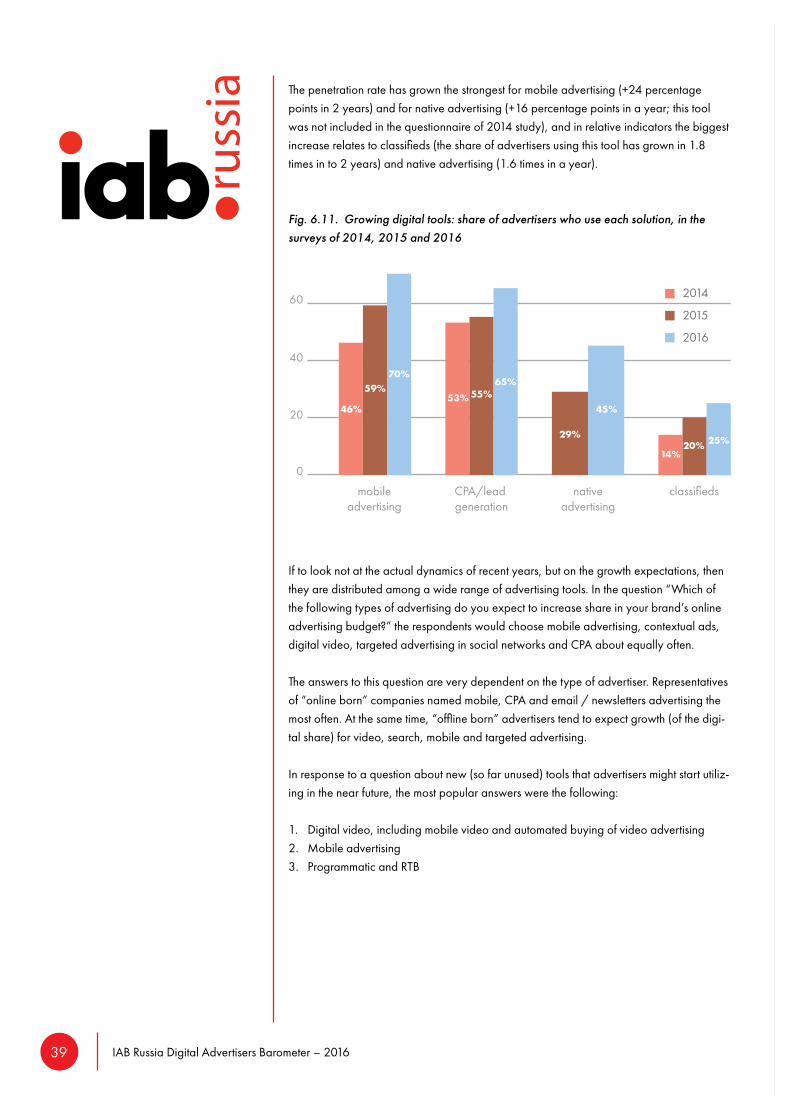
The penetration rate has grown the strongest for mobile advertising (+24 percentage points in 2 years) and for native advertising (+16 percentage points in a year; this tool was not included in the questionnaire of 2014 study), and in relative indicators the biggest increase relates to classifieds (the share of advertisers using this tool has grown in 1.8 times in to 2 years) and native advertising (1.6 times in a year).
Fig. 6.11. Growing digital tools: share of advertisers who use each solution, in the surveys of 2014, 2015 and 2016
If to look not at the actual dynamics of recent years, but on the growth expectations, then they are distributed among a wide range of advertising tools. In the question “Which of the following types of advertising do you expect to increase share in your brand’s online advertising budget?” the respondents would choose mobile advertising, contextual ads, digital video, targeted advertising in social networks and CPA about equally often.
The answers to this question are very dependent on the type of advertiser. Representatives of “online born” companies named mobile, CPA and email / newsletters advertising the most often. At the same time, “offline born” advertisers tend to expect growth (of the digi-tal share) for video, search, mobile and targeted advertising.
In response to a question about new (so far unused) tools that advertisers might start utiliz-ing in the near future, the most popular answers were the following:
1. Digital video, including mobile video and automated buying of video advertising2. Mobile advertising3. Programmatic and RTB

40IAB Russia Digital Advertisers Barometer – 2016
Fig. 6.12. Which of the following types of advertising do you expect to increase share in your brand’s online advertising budget?
When the respondents were asked directly about types of digital solutions their brand “can start using this or next year,” native advertising showed the biggest potential for growth – if now it is used by only 43 percent of advertisers, in the next year and a half 36 percent of brands are willing to include it into their pools. Other solutions that show a great growth potential are cross-platform media planning (unified for desktop and mobile audiences) and systems for automated generation and optimization of advertising. The lowest growing potential, in terms of the number of advertisers using a tool, relates to retargeting (because it is already used by the overwhelming majority of the companies surveyed), performance marketing and geo-targeting (LBA) – for these instruments the number of responses “will definitely start using” is only slightly higher than the number of “will definitely not start using” (performance marketing also has got the maximum share of “undecided” responses).
Fig. 6.13. Which new interactive advertising solutions and formats does your brand already use or can start using this or next year?
Legend to Fig. 6.13: 1 – Retargeting2 – Real-time algorithmic buying (RTB)3 – Automated optimization of ad campaigns 4 – CPA/CPO/Lead Generation5 – Native advertising6 – Location-based advertising7 – Cross-platform (desktop + mobile) media planning8 – Automated generation/ optimization of advertising messages

41 IAB Russia Digital Advertisers Barometer – 2016
6.5. Online Marketing Beyond Advertising
As noted above, on average, only 50% of interactive marketing budgets (judging by the responses of the respondents themselves) is allocated to the actual purchase of adver-tising. An additional question “What other significant areas of expenditure (aside from online advertising) are included in your online promotion budget?” allows us estimate approximate structure of digital budgets in their BTL component.
Most often the respondents named (the question was open-ended) SMM (non-advertising promotion in social networks) SEO (search engine optimization), as well as the creation of websites and content (it must be taken into account that many companies, especially online, do not include these costs into marketing budgets), working with data (including analytics, CRM, data management) and advertising creation.
Respondents’ answers on digital budget distribution between advertising and other ex-penditures allow us to roughly estimate an average share of individual expenditures items in overall interactive budget. The top three areas (each with a share of about 10 percent) are SEO, SMM and advertising creation.
Fig. 6.14. What other significant areas of expenditure (aside from online advertising) are included in your online promotion budget?” (open-ended question)
Fig. 6.15. Main digital non-advertising expenditures: estimate of an average share in online marketing budgets
42IAB Russia Digital Advertisers Barometer – 2016
7. Market Mobilization
7.1. Mobile Position in Digital Strategy
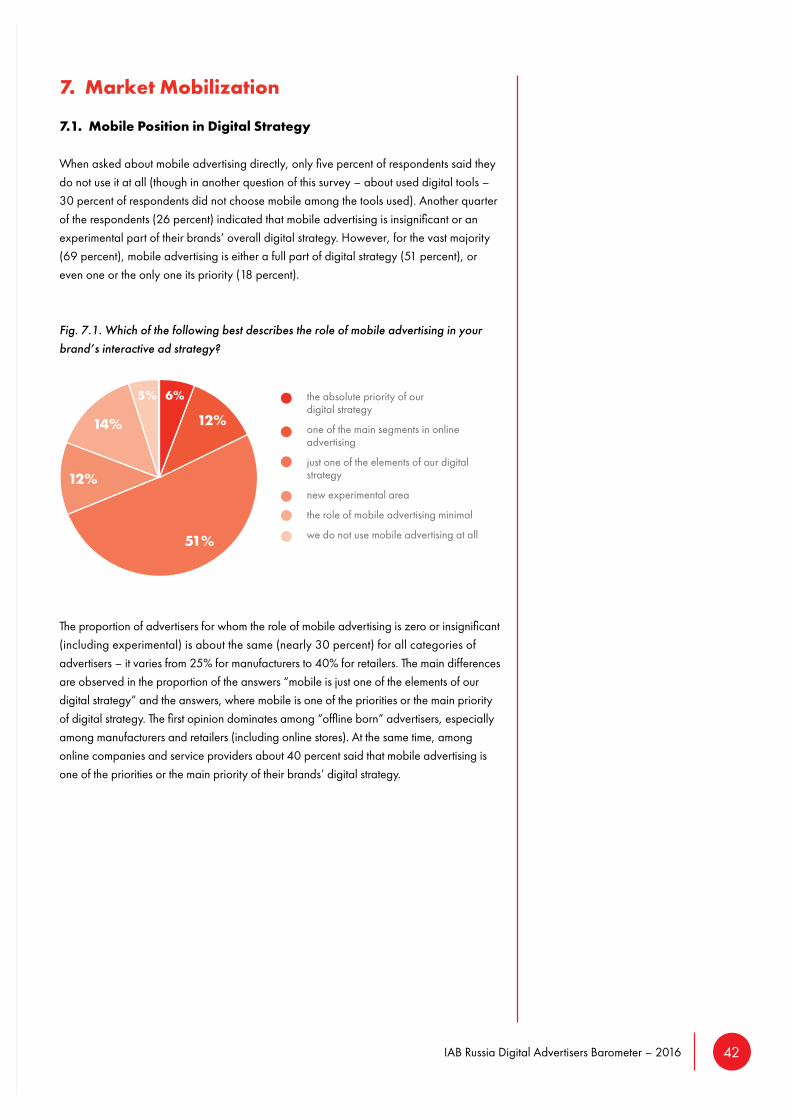
When asked about mobile advertising directly, only five percent of respondents said they do not use it at all (though in another question of this survey – about used digital tools – 30 percent of respondents did not choose mobile among the tools used). Another quarter of the respondents (26 percent) indicated that mobile advertising is insignificant or an experimental part of their brands’ overall digital strategy. However, for the vast majority (69 percent), mobile advertising is either a full part of digital strategy (51 percent), or even one or the only one its priority (18 percent).
Fig. 7.1. Which of the following best describes the role of mobile advertising in your brand’s interactive ad strategy?
The proportion of advertisers for whom the role of mobile advertising is zero or insignificant (including experimental) is about the same (nearly 30 percent) for all categories of advertisers – it varies from 25% for manufacturers to 40% for retailers. The main differences are observed in the proportion of the answers “mobile is just one of the elements of our digital strategy” and the answers, where mobile is one of the priorities or the main priority of digital strategy. The first opinion dominates among “offline born” advertisers, especially among manufacturers and retailers (including online stores). At the same time, among online companies and service providers about 40 percent said that mobile advertising is one of the priorities or the main priority of their brands’ digital strategy.
the absolute priority of our digital strategy
one of the main segments in online advertising
just one of the elements of our digital strategy
new experimental area
the role of mobile advertising minimal
we do not use mobile advertising at all

43 IAB Russia Digital Advertisers Barometer – 2016
Fig. 7.2. The role of mobile advertising in the brand’s digital strategy: comparison by advertiser category
Compared with responses to the same question from the previous year’s research, the share of respondents who find the role of mobile to be key or significant (the answers “absolute priority” and “one of strategy’s elements”) has grown more than 1.5 times (from 45 percent to 69 percent). This growth was caused by a sharp (almost 2.5 times) reduction in the share of answers “mobile advertising is a new and experimental area.” The proportion of advertisers who do not use mobile at all, or for whom its role is minimal, has also decreased, but not that significantly – by 1.8 times, from 18 percent to 10 percent.
Fig. 7.3. The role of mobile advertising in the brand’s digital strategy: 2015 and 2016 years’ responses comparison
the absolute priority of our digital strategy
one of the main segments in online advertising
just one of the elements of our digital strategy
new experimental area
the role of mobile advertising minimal
we do not use mobile advertising at all

44IAB Russia Digital Advertisers Barometer – 2016
7.2. Utilized Mobile Solutions
Considering the versatility of mobile advertising as a concept, respondents were asked a detailed question about types of solutions the brand they represent uses. The responses indicated that the most popular mobile advertising tools are realization of individual tar-geting settings for smartphones (used by 89 percent of respondents), creation of separate ads or adaptation of existing ones for smartphones (86 percent) and website (or landing page) adaptation for smartphones (81 percent). For tablets the similar solutions are used much less frequently – even website (or landing page) adaptation for tablets is utilized by only 58 percent of advertisers. The following solutions are used often for smartphones but not for tablets: advertising creation/adaptation, mobile apps creation, advertising buying via mobile networks. Such options are website/landing page adaptation and LBA, have shown the minimal difference in the frequency of use for smartphones and for tablets.
Fig. 7.4. Which [mobile] solutions and for what devices does your brand use?
Legend for Fig. 7.4: 1 – realization of individual targeting settings for smartphones2 – advertising creation/adaptation3 – website/landing page adaptation4 – mobile apps creation
5 – advertising buying via mobile ad networks6 – mobile-only advertising campaigns7 – advertising buying in mobile apps8 – location-based advertising
Individual targeting settings and separate advertising creatives have become a standard this year alone – even in the last year’s survey just a little more than half of respondents (vs. more than 80 percent in this year’s survey) indicated the use of these solutions for smartphones. Another tool, which popularity is growing fast, is buying advertising via mobile advertising networks.

45 IAB Russia Digital Advertisers Barometer – 2016
Fig. 7.5. Which [mobile] solutions does your brand use [for smartphones]? Comparison of the responses from 2014-2016
Legend to Fig. 7.5: 1 – realization of individual targeting settings for smartphones2 – advertising creation/adaptation3 – website/landing page adaptation4 – mobile apps creation
5 – advertising buying via mobile ad networks6 – mobile-only advertising campaigns7 – advertising buying in mobile apps8 – location-based advertising
According to the 2016 year’s survey, only 13 percent of respondents do not use any of mobile solutions (out of listed in the related question) for smartphones. The majority of other advertisers use at least five out of ten solutions from the questionnaire, including 28 percent who use from seven to ten solutions. The average number of solutions used for smartphones is 4.8 (if to exclude the advertisers who do not use anything, the average rises to 5.6).
The widest range of mobile advertising solutions is utilized by online companies (the aver-age number of solutions for them is 5.7) and service providers (6.1).
Fig. 7.6. The number of mobile solutions used by advertisers for smartphones

46IAB Russia Digital Advertisers Barometer – 2016
The proportion of advertisers who do not use any of mobile solutions for tablets is 2.5 times higher than for smartphones. Only 8 percent use more than six mobile solutions (out of 10 listed) for tablets. The average number of mobile advertising solutions used for tablets is 2.7 (if to exclude the advertisers who do not use any of them, the average rises to 4.2).
Fig. 7.7. The number of mobile solutions used by advertisers for tablets

47 IAB Russia Digital Advertisers Barometer – 2016
8. Metrics and Analytics
8.1. Parameters of Evaluating Advertising Effectiveness
The most popular metric for evaluation of online advertising effectiveness is still website traffic – this parameter is considered by 80 percent of the advertisers surveyed. In the 2014 year’s survey it was an absolute leader (other metrics’ share of usage lagged behind it by at least 18 percentage points), however in this year’s survey such metrics as changes in overall financial performance and number of orders received through the site are almost on a par with it (each got 74-75 percent, and 86 percent of respondents chose at least one of these two metrics).
Fig. 8.1. What metrics does your company track for evaluation of interactive advertising effectiveness?
Online companies’ representatives, as well as retailers and service providers, mentioned the number of online orders and change in overall financial performance even more often than website traffic. At the same time, the most popular metrics for manufacturers were brand recognition and audience engagement in social networks. The first place of traffic in the overall “metrics rating” is solely due to its versatility. This is the only metric that is used by at least 70 percent of respondents across all categories of advertisers.

48IAB Russia Digital Advertisers Barometer – 2016
8.2. Performance Marketing Metrics
Answers to the question about the metrics used in performance-based advertising, have shown that on the one hand respondents actively use multiple metrics (on average they mentioned four metrics as being used, and only one in ten reported just one metric), and on the other hand, confirmed the ongoing focus of the large proportion of advertisers on traffic-related parameters. Numbers of clicks (click-through) is the most popular metric of evaluating performance-based advertising – it is used by 75 percent of respondents (though just 3% used it as the only metric), whereas for other metrics the proportion of usage varies from 34 percent to 58 percent (the second popular metrics after number of clicks is number of purchases on the website, however this metric is most often used as the sole parameter).
Also, the respondents’ answers have showed that a standard set of used metrics is unlikely to be changed significantly in the near future. The proportion of the responses “do not use now, but would like to use” is small for all metrics, ranging from 5 percent to 12 percent (or 15 percent to 23 percent as a percentage of those advertisers who have not yet used the corresponding metrics).
Fig. 8.2. Which metrics does your brand use or plan to use when purchasing performance-based advertising? *
* Data labels indicate the sum of current and potential usage (current usage is indicated in brackets)
It must be admitted that respondents have a certain lack of competence in this area, and that affects the survey results on CPA metrics shown above. Some of advertisers when asked a question “Which metrics does your brand use or plan to use when purchasing performance-based advertising?”, answered not about performance-based advertising specifically, but about evaluation of advertising effectiveness in general (and usually indicated only the number of clicks).

49 IAB Russia Digital Advertisers Barometer – 2016
If we consider only the answers of those advertisers who already use performance-based advertising, it turns out that number of purchases for them is almost as commonly used metric as number of clicks; and even a larger proportion of respondents is focused on number of registrations rather than on landing pages click-through. Also, the advertisers who already use performance-based advertising, indicated the usage of “other” metrics (not listed in the question) 3 times more often.
Fig. 8.3. Performance-based marketing metrics usage depending on the usage of the tools itself
8.3. Utilized Analytical Systems
Free web analytics systems like Google Analytics and Yandex.Metrica remain the main tool for evaluation effectiveness of interactive advertising – they are used by almost all surveyed advertisers. The second popular tool is still private (developed in-house) statistical and analytical services, besides, the proportion of advertisers using these solutions remains practically unchanged for two years – at about 55 percent. As two years ago, online com-panies are 1.5 times more likely to use their own solutions than “offline born” companies.
The proportions of advertisers who use such tools as paid web analytics services, cam-paign audit and conversion tracking tools, ad hoc research, have remained at around 40 percent for each of the three tools. Comparing to 2014 year’s survey, share of paid web analytics services has slightly decreased and share of campaign audit and con-version tracking tools has slightly increased. In addition to developing their own systems, online companies use paid web analytics systems more often, whereas campaign tools and especially ad hoc research are more likely to be used by “offline born” advertisers.

50IAB Russia Digital Advertisers Barometer – 2016
Fig. 8.4. What tools does your company use for evaluation effectiveness of interactive advertising?

51 IAB Russia Digital Advertisers Barometer – 2016
9. Advertiser Category
9.1. Manufacturers
Among all advertisers surveyed more than one-third (38 percent, including 50 percent within the category “offline born” advertisers) are manufacturer representatives (for exam-ple, from FMCG and Automotive). This category differs the most by their answers from the rest of the respondents. Many of these differences have been already noted in the previous sections of the report, the following is a brief overview of the most important and significant of them.
Advertisers who belong to the category of manufacturers:
• Have a more conservative approach to increasing interactive advertising budgets. Judging by the survey results, the average increase of digital budgets in this category in 2015 was 11 percent, this year they are growing by additional 7 percent (this is by 6 percentage points and 13 percentage points, respectively, lower than for all respondents). Their response rate on digital budgets growing this year by at least one-fifth is by 20 percentage points than among all respondents.
• Most often indicate mobile audience growth (+10 percentage points comparing to all respondents) and the overall growth of online audience (+9 percentage points) as the growth drivers for share of digital in ad budgets, while interactive ad effectiveness is a less significant driver for this category of advertisers.
• Particularly often mention such barriers to faster increase of digital in advertising budgets, as inability to reduce advertising spending on other media, conservative management and lack of online audience reach.
• Less often agree with the statement that “online advertising is the most efficient of all types of advertising.”
• More often combine digital advertising with TV (+19 percentage points) and radio (+12 percentage points).
• More often used such digital tools as video ads (+23 percentage points), rich media (+21 percentage points) and special projects (+21 percentage points), and are less likely to use email (-27 percentage points), performance marketing (-20 percentage points) and targeted advertising in social networks (-9 percentage points).
• On average, allocate 60 percent of their digital budgets to banner ads, video ads, rich media, and sponsorship – compared to 30 percent for all respondents (and 11 percent respondents outside manufacturers category).
• Allocate on search advertising on average 2.2 times less share of their digital budgets vs. an average advertiser (17 percent vs. 38 percent).
• Often expect a further growth of video advertising share in their digital budgets (+18 percentage points compared to the average for all respondents) and usually do not expect growth in the share of performance marketing and email marketing.

52IAB Russia Digital Advertisers Barometer – 2016
• Rarely use and often do not even plan to use location-based advertising (LBA) and systems of automatic generation and customization of advertising messages; the share of manufacturers using retargeting is also below average.
• Less than average estimate mobile advertising as “an absolute priority” or “one of the main elements of” interactive advertising, and more than average answer “mobile advertising is just one of the elements of our digital strategy.”
• More often than average evaluate online advertising effectiveness through such metrics as brand recognition and user engagement in social networks – and rarely evaluate number of calls, orders, changes in financial performance.
9.2. Retailers vs. Service providers
The overwhelming majority (89 percent) of those respondents who are not manufactur-ers, are either retailers (of goods) or service providers, and both these categories include “purely online” companies, as well as “offline born” advertisers. The differences in the responses of retailers and service providers are not as significant as their common dis-tinctions from manufacturers responses. However, it is still possible to identify a number of important ones:
• Retailers are leading (at least, according to the survey) by the rate of advertising budgets growth both in terms of online and offline spending.
• Aside from online advertising effectiveness and dynamic targeting and retargeting capabilities (which are equally important for both categories of respondents), another important factor of digital share growth for retailers is a wide choice of specific audi-ences to target, while for service providers some of the most important drivers are measurability of interactive advertising and growth of mobile online audience.
• Among the barriers to digital share growth retailers more often (than service provid-ers) note such factors as high cost of online advertising, insufficient online audience reach (it can be assumed that they meant consumers in small towns) and lack of quali-fied professionals in digital advertising.
• The only statistically significant difference between retailers and service providers in their answers about the use of digital tools is about video advertising. Share of retail-ers who use this type of advertising is by 18 percentage points higher.
• Also, comparing to service providers, retailers direct on average a larger share of their digital budgets on contextual advertising and less – to CPA and mobile advertising.
• From twenty-five to thirty percent of retailers expect growth in the share of banner advertising and video advertising, whereas among service providers there are prac-tically no such expectations (and service providers are 3 times more likely to give an answer that the share of each of these digital tools will not change).

53 IAB Russia Digital Advertisers Barometer – 2016
• Among retailers, there is a higher proportion of advertisers who already use such tools as automatic optimization of advertising campaigns and location-based adver-tising (LBA). Retailers also more often say that in the near future they can start using RTB-platforms for advertising buying.
• Among service providers, the share of advertisers, for whom mobile advertising is an absolute priority or at least one of the priorities in interactive advertising, is four times higher comparing to retailers.
• When evaluating the effectiveness of advertising campaigns retailers are less likely (than service providers) to use paid web analytics services and campaign audit and conversion tracking systems. They are also less likely to use such metric as the number of calls generated by advertising.
9.3. Opinions of Individual Advertiser Segments
Even with a small number of respondents surveyed in each of the individual advertiser segments (from 6 to 16 companies), we still can identify statistically significant differences in their opinions and estimates – when deviations from the average constitute tens of per-cent. The brightest and most significant of these differences are listed below:
• Automotive, Real Estate and Banking are the segments that feel the most positive and aggressive towards digital (in each of these segments from 80 percent to 100 percent of respondents answered that they are increasing share of digital in their advertising budget). FMCG brands and retailers of consumer electronics and home goods can be classified as “conservatives” – in these categories only about half of respondents claimed to increase digital share in their advertising budgets.
• The main digital growth driver for Automotive is wide rich selection of online audi-ences for targeting. The key driver for FMCG is already mobile audience growth of mobile users and mobile media consumption, while for Pharmaceuticals such driver is a general increase in number of internet users (for other segments the survey has not showed the presence of a single dominant driver).
• When asked about barriers to more rapid increase of digital share, Automotive chose “inability of interactive advertising to solve certain marketing tasks” 2.5 times more often than average, and the respondents from FMCG segment were 3 times more likely to choose the answer “inability to reduce ad spending in other media.”
• Targeted advertising in social networks is used by 100 percent of respondents from Banking, Automotive and Real Estate, and only by half of FMCG and Pharma adver-tisers. Similar results were obtained for email marketing as well: it used by 84 percent of respondents from Banking, Automotive and Real Estate, and by only 21 percent of advertisers from FMCG and Pharma segments.
• CPA-advertising (performance-based) is used by more than 90 percent of respond-ents from Banking and Automotive (here Real Estate lags behind) and by only one-third of respondents from FMCG and Pharma segments.

54IAB Russia Digital Advertisers Barometer – 2016
• The majority of respondents from Banking segment suggest that digital budget dis-tribution among the types of interactive advertising will remain virtually unchanged. Automotive segment has a prevailing expectation of growth of performance market-ing share, and the majority in FMCG expect the future growth of digital video share.
• In general, the proportion of digital advertising budgets varies from 10-15 percent for FMCG and Pharma segments to 50-60 percent for Automobile, Home Improvement & DIY and Real Estate (see Section 4.3 for more details).

55 IAB Russia Digital Advertisers Barometer – 2016
About IAB Russia
The Interactive Advertising Bureau (IAB) Russia
A non-commercial partnership for interactive advertising promotion is a part of an international IAB association. The main objective is to grow and develop interactive advertising market. IAB branches successfully operate in 43 countries on 4 continents.
Priority areas of The Interactive Advertising Bureau (IAB) Russia are the following:
z� Educational activities; z� Formation of industry standards, guidelines and glossaries;z� Organizing industrial events, including MIXX Conference and MIXX Awards;z� Conducting research in the field of online advertising, taking into account international methodologies and best practices
Contacts: 3-3 Polkovaya St., 4th Floor, Moscow, 127018
Tel/fax: +7 (495) 662 39 88
email: [email protected]
www.iabrus.ru

56IAB Russia Digital Advertisers Barometer – 2016
Data Insight Research Agency
Founded in 2010, the company specializes in internet and e-commerce researches. The key areas of the company’s research are the following:
1. Online advertising, online advertising services, interactive advertising technologies, online audience behavior.
2. E-commerce, including physical goods, travel and educational services, audience behavior online and mobile.
3. E-commerce providers and services, e-commerce infrastructure and ecosystem.
4. Startups, investments into online startups, investment funds.
Our core competence is analysis of non-complete and heterogeneous information, search for non-standard data sources, data comparison and data combination. Any estimates and results we publish are cross-checked by multiple methods to get consistent outcomes.
Our services:
1. Ad-hoc research for online companies, investment companies, services, etc. Ask us for examples or come to us with the specific task and we will think about specific solution.
2. Ready-made reports on different online segments. You can obtain the list of existing reports on our website or by phone.
3. Consultancy for online projects on different stages on the issues of development strategy, marketing, technologies.
4. Monitoring news of e-commerce, online advertising, tech startups.
5. Research for presentations / content-products for company’s information support and new products launch.
Contacts:
Tel./Fax: +7 (495) 540 59 06
email: [email protected]
www.datainsight.ru

The study “IAB Russia Digital Advertisers Barometer – 2016 ” was ordered and funded by IAB Russia Conducted by Data Insight Research Agency
Russian Version, October 2016English Version, December 2016English Version Editor: Tatiana Firsova
For all questions regarding this study please contact:[email protected]