highway safety plan - california office of traffic · pdf file•highway safety plan...
TRANSCRIPT

HIGHWAY SAFETY PLAN
Federal Fiscal Year 2014
(October 1, 2013 through September 30, 2014)
PREPARED FOR
U. S. DEPARTMENT OF TRANSPORTATION
NATIONAL HIGHWAY TRAFFIC SAFETY ADMINISTRATION
PREPARED BY
OFFICE OF TRAFFIC SAFETY
Christopher J. Murphy, Director


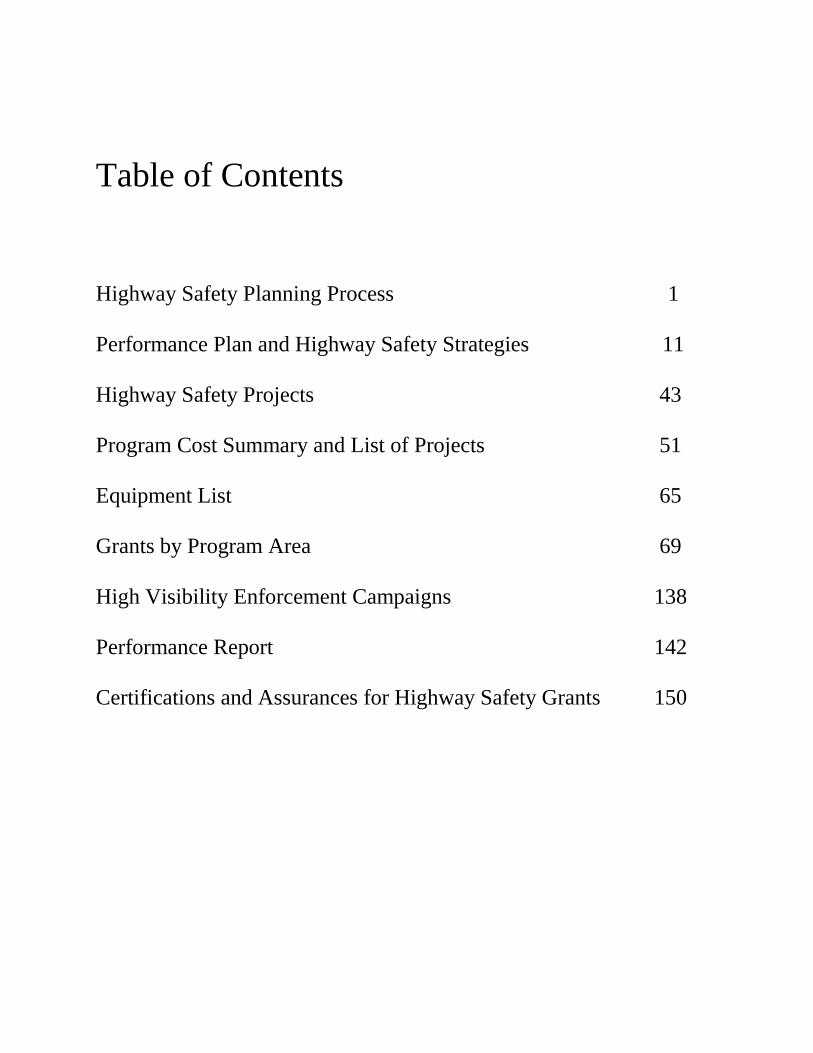
Table of Contents
Highway Safety Planning Process 1
Performance Plan and Highway Safety Strategies 11
Highway Safety Projects 43
Program Cost Summary and List of Projects 51
Equipment List 65
Grants by Program Area 69
High Visibility Enforcement Campaigns 138
Performance Report 142
Certifications and Assurances for Highway Safety Grants 150

1
HIGHWAY SAFETY
PLANNING PROCESS

2
3
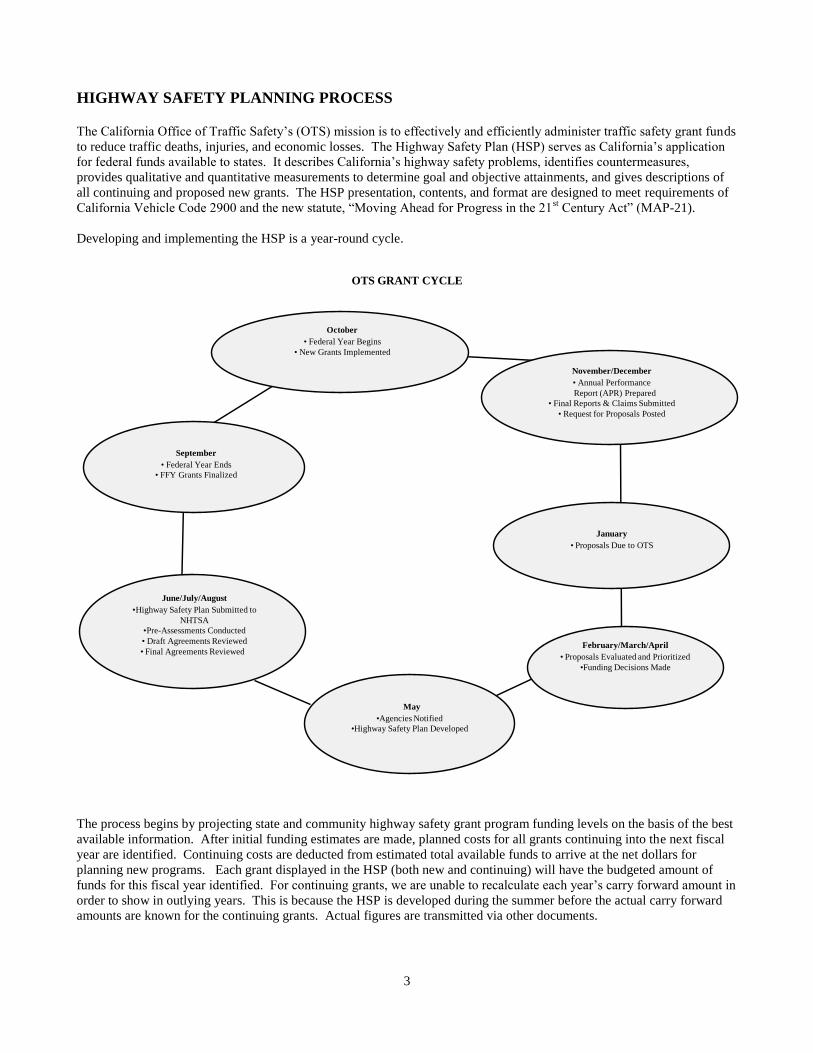
HIGHWAY SAFETY PLANNING PROCESS The California Office of Traffic Safety’s (OTS) mission is to effectively and efficiently administer traffic safety grant funds
to reduce traffic deaths, injuries, and economic losses. The Highway Safety Plan (HSP) serves as California’s application
for federal funds available to states. It describes California’s highway safety problems, identifies countermeasures,
provides qualitative and quantitative measurements to determine goal and objective attainments, and gives descriptions of
all continuing and proposed new grants. The HSP presentation, contents, and format are designed to meet requirements of
California Vehicle Code 2900 and the new statute, “Moving Ahead for Progress in the 21st Century Act” (MAP-21).
Developing and implementing the HSP is a year-round cycle.
The process begins by projecting state and community highway safety grant program funding levels on the basis of the best
available information. After initial funding estimates are made, planned costs for all grants continuing into the next fiscal
year are identified. Continuing costs are deducted from estimated total available funds to arrive at the net dollars for
planning new programs. Each grant displayed in the HSP (both new and continuing) will have the budgeted amount of
funds for this fiscal year identified. For continuing grants, we are unable to recalculate each year’s carry forward amount in
order to show in outlying years. This is because the HSP is developed during the summer before the actual carry forward
amounts are known for the continuing grants. Actual figures are transmitted via other documents.
November/December
• Annual Performance
Report (APR) Prepared
• Final Reports & Claims Submitted
• Request for Proposals Posted
January
• Proposals Due to OTS
February/March/April
• Proposals Evaluated and Prioritized
•Funding Decisions Made
May
•Agencies Notified
•Highway Safety Plan Developed
OTS GRANT CYCLE
June/July/August
•Highway Safety Plan Submitted to
NHTSA
•Pre-Assessments Conducted
• Draft Agreements Reviewed
• Final Agreements Reviewed
September
• Federal Year Ends
• FFY Grants Finalized
October
• Federal Year Begins
• New Grants Implemented
4
The grants are designed to address federally designated traffic safety priority areas that include Police Traffic Services,
Alcohol-Impaired Driving, Drug-Impaired Driving, Occupant Protection, Distracted Driving, Pedestrian and Bicycle
Safety, Emergency Medical Services, Motorcycle Safety, and Traffic Records/Roadway Safety. These priority areas
correspond directly to specific problems in California.
Data Sources
The National Highway Traffic Safety Association (NHTSA) defines a highway safety collision problem as “an identifiable
subgroup of drivers, pedestrians, vehicles or roadways that is statistically higher in collision experience compared to normal
expectations.” The fact that a subgroup is over represented in collisions may suggest there is some characteristic of the
subgroup that contributes to the collisions. A contributing factor can be defined as an identifiable characteristic of drivers,
pedestrians, vehicles, or roadways that are statistically higher in collision experience as compared to normal expectations.
Problem identification involves the study of relationships between collisions and the characteristics of population, licensed
drivers, registered vehicles and vehicle miles. Drivers can be classified into subgroups according to age, sex, etc. Vehicles
can be divided into subgroups according to year, make, body style, etc. Roads can be divided into subgroups according to
number of lanes, type of surface, political subdivision, etc. Collisions can be further analyzed in terms of the time, day and
month; age and sex of drivers; primary collision factor; and safety equipment usage.
Other factors also influence motor vehicle collisions and should be considered in conducting comparative analyses between
jurisdictions. For example, variations in composition of population, modes of transportation and highway system,
economic conditions, climate, and effective strength of law enforcement agencies can be influential. The selection of
collision comparisons requires the exercise of judgment.
Isolating and identifying a contributing factor is a great advantage in the planning and selection of countermeasures. If
contributing characteristics can be identified and corrected, the collision experience of the subgroup can be improved,
resulting in a reduction of traffic collision fatalities and injuries.
OTS uses data sources to identify emerging problem areas as well as to verify the problems identified by the agencies that
have submitted proposals for funding consideration. Traffic safety data and information are available from the following
sources:
OTS Collision Rankings - The OTS rankings were developed so that individual cities can compare their city’s traffic
safety statistics to those of other cities with similar-sized populations. In recent years, media, researchers and the public
have taken an interest in the OTS Rankings via the OTS website. A variety of items are compared, including collisions
and/or victims involving alcohol and several other primary collision factors, pedestrians, bicycles, motorcycles, as well as
DUI arrests, age variables, and population and vehicle miles traveled factors. Cities can use these comparisons to see what
areas they may have problems with and where they are doing well. The results help cities and OTS identify emerging or
ongoing traffic safety problem areas which can be targeted for more in-depth analysis. OTS staff solicits proposals from
agencies that have significant problems, but who have not submitted proposals to address them. City rankings are for
incorporated cities only. County rankings include all roads – state, county and local – and all jurisdictions – CHP, Sheriff,
Police and special districts. Additional data elements can be added to the database as needed. OTS staff is trained to use
the database as an additional tool for problem identification. Staff knowledge, experience and judgment continue to be
important considerations in identifying problems and selecting jurisdictions for funding.
Fatality Analysis Reporting System (FARS) - Contains census data of fatal traffic crashes within the 50 states, the
District of Columbia and Puerto Rico. To be included in FARS, a crash must involve a motor vehicle traveling on a traffic
way customarily open to the public and result in the death of a person (occupant of a vehicle or a non-occupant) within 30
days of the crash. FARS, operational since 1975, collects information on over 100 different coded data elements that
characterize the crash, the vehicle, and the people involved.
State Traffic Safety Information (STSI) - This website provides traffic safety performance (core outcome) measures for
all 50 states by using FARS data. These performance measures were developed by NHTSA and the Governors Highway
Safety Association (GHSA). The website includes charts, graphs, and color coded maps that show trends, county
information, and a comparison to national statistics.
5
The Statewide Integrated Traffic Records System (SWITRS) - This system provides statewide collision-related data on
all types of roadways, except private roads. The California Highway Patrol (CHP) receives collision reports (Form 555)
from local police agencies, in addition to collision reports from all their own area offices and maintains the statewide
database.
The Department of Motor Vehicles Driving Under the Influence Management Information System Report (DUI
MIS Report) - This report establishes and maintains a data monitoring system to evaluate the efficacy of intervention
programs for persons convicted of DUI in order to provide accurate and up-to-date comprehensive statistics to enhance the
ability to make informed and timely policy decisions. The report combines and cross references DUI data from CHP,
Department of Justice (DOJ), and Department of Motor Vehicles (DMV) and presents them in a single reference. It also
evaluates the effectiveness of court and administrative sanctions on convicted DUI offenders.
The Transportation System Network (TSN) combined with the Traffic Accident Surveillance and Analysis System.
(TASAS) - These systems provide data pertaining to state and interstate highways and include detailed data on the location
of collisions and roadway descriptions. The California Department of Transportation (Caltrans) maintains this database.
The Automated Management Information System (AMIS) - This DMV system contains records on all registered motor
vehicles and all licensed drivers within the state.
The DUI Arrest and Conviction File - The DOJ maintains a record of all DUI arrests made within the state, including the
final disposition of each case.
Driver’s License Conviction Report - The DMV produces a report that reflects the volume of vehicle sections violated
that included a conviction.
Census Data - The State Department of Finance provides population estimates.
Participants in the Process
OTS involves many participants in the process of developing grants and addressing traffic safety problems to help
California achieve its traffic safety goals. For example, the OTS Director is an active member of the Strategic Highway
Safety Plan (SHSP) Executive Steering Committee, which approves action items from 17 identified challenge area
committees. The OTS Director also participates in the annual the Transportation Directors’ Committee that meets to
discuss high priority traffic safety issues. The outcomes of these high level meetings often results in future funding for
significant problem areas.
Several OTS staff members act in a co-lead capacity on eight of the following 17 behavioral challenge area committees:
Challenge Area 1 – Reduce Impaired Driving Related Fatalities
Challenge Area 3 – Ensure Drivers are Licensed and Competent
Challenge Area 4 – Increase Use of Safety Belts and Child Safety Seats
Challenge Area 6 – Reduce Young Driver Fatalities
Challenge Area 10 – Reduce Speeding and Aggressive Driving
Challenge Area 12 – Improve Motorcycle Safety
Challenge Area 16 – Improve Data Collection, Access, and Analysis
Challenge Area 17 – Reduce Distracted Driving
The challenge area committee co-leads facilitate and lead team discussions as well as the development of recommended
action items that are brought to the SHSP Executive Committee for approval. Other participants include local law
enforcement agencies, emergency medical services, engineers, health educators, advocacy groups, and other interested
stakeholders from governmental and private agencies. As a result of many approved action items, OTS provides funding
for projects related to these action items. Additional outcomes include great collaboration of stakeholders with institutional
highway safety knowledge, executive leadership driving priority issues, completion of 135 of the 152 action items, and
more importantly the reduction of the overall goal to reduce the California roadway fatality rate to less than 1.0 fatality per
100 million vehicle miles traveled by 2010.
6
Over the past year, OTS has initiated the development of Quarterly Law Enforcement Roundtable meetings in more than 20
counties. Included in these meetings is representation from local District Attorneys’ offices, Crime Lab staff, local law
enforcement, CHP, and OTS. These meetings were developed for the purpose of identifying challenges and strategies
related to DUI and DUID enforcement, prosecution, and training. The valuable input received from these critical
stakeholders assists OTS in funding future countermeasures and strategies.
Selection Process
OTS screens grantee applicants against both quantitative and qualitative criteria. The proposals are rated against several
criteria including potential traffic safety impact; collision statistics and rankings; seriousness of identified problems; and
performance on previous grants.
Proposals from state and local agencies are carefully evaluated and selected for maximum statewide impact. OTS identifies
applicant agencies with the greatest need and likelihood for success. The OTS proposal review process ensures that funded
grants meet statewide performance goals as outlined in the annual HSP. By the deadline of January 15, 2013, OTS had
received 335 proposal requests for Federal Fiscal Year 2014 (FFY 2014) funding.
In March 2013, OTS Regional Coordinators completed their analyses of these proposals and presented funding
recommendations to OTS management. The Director finalized these recommendations and, on April 19, 2013, submitted
an Issue Memorandum to the California State Transportation Agency (CSTA) Agency Secretary, Brian Kelly, presenting
OTS’ funding recommendations. On May 14, 2013 the CSTA Agency Secretary approved OTS’ recommendations for
funding for FFY 2014. OTS submitted a draft HSP to the CSTA Agency Secretary for approval on May 30, 2013. Once
approved by CSTA, OTS submits the HSP to the National Highway Traffic Safety Administration (NHTSA)
Region 9 Office on July 1, 2013.
OTS’ goal is to process 90 percent of all new grants by October 1, 2013. OTS grant regional coordinators monitor grantee
performance throughout the year through onsite assessments, onsite pre-operational reviews, quarterly performance reports,
grantee performance reviews, e-mail correspondence regarding grant revisions and general operational questions, and
telephone conversations and meetings to discuss programmatic and fiscal issues.
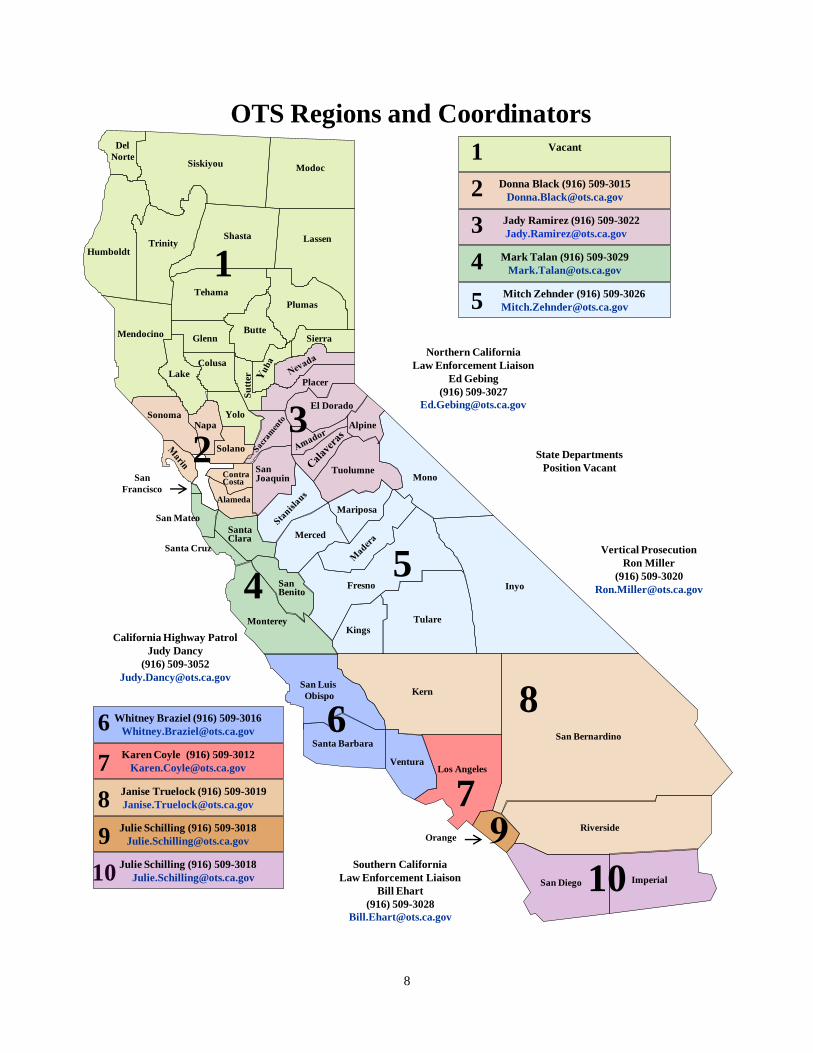
OTS is organized by regions within the state. There are ten regions with 12 Regional Coordinators assigned to 271 grants.
The regional grant assignments provide OTS Regional Coordinators the ability to network with cities and encourage
proposal submittals from agencies with disproportionate traffic safety problems and from those who may not have received
a recent or a prior OTS grant. Another advantage of regional grant assignments is that local governmental agencies only
have to contact a single OTS regional coordinator for information on various program areas. The regional concepts helps
build synergy within the region and is resulting in more comprehensive local grant programs. Additionally, the OTS
regional grant assignments allow the regional coordinators to develop expertise in all program areas.
Because the coordinators are familiar with their region, they have helped to develop regional grants whereby one agency is
the host and becomes the conduit for funding for several other agencies. This streamlines the process for all the local
agencies as well as for OTS program and fiscal staff. To complement the regional assignments, OTS assigns individual
coordinators to serve as program area specialists for the various program areas. Refer to page 7 for appropriate OTS
Regional Coordinator and Program Area Specialist contact information. By the end of July, each OTS Regional
Coordinator conducted a pre-funding assessment of each grantee new to the OTS process. At this meeting, the final
negotiations of the agreement terms are conducted, deciding on the level of grantee effort required to meet the goals and
objectives, and level of funding.
Program/Grant Development
The process for FFY 2014 (FFY 2014) new grants selection included the following major steps:
Conduct problem identification.
Establish goals and objectives.
Review proposals.
Develop funding recommendations.
Present funding recommendations to the CSTA Agency Secretary for approval.
Prepare HSP.
7
Prepare “pre-draft” grant agreements.
Conduct pre-funding grant assessments.
Review draft grant agreements.
Approve final grant agreements.
Conduct pre-operational reviews.
The OTS grant program stresses a community-based approach giving communities the flexibility to structure highway
safety programs in a way that meets their needs yet in a manner consistent with OTS’ statewide goals. Virtually all strata
of society will be reached including various ethnic groups, infants, children, teens, young adults and the elderly.
OTS funded grants address federally designated traffic safety priority areas that include police traffic services, alcohol,
other drugs, distracted driving, occupant protection, pedestrian and bicycle safety, emergency medical services, motorcycle
safety, and traffic records and engineering. Grants funded in the police traffic services; alcohol-impaired driving, drug-
impaired driving, motorcycles, occupant protection, and pedestrian/bicycle safety are measured against aggressive yet
attainable goals. The remaining priority areas (emergency medical services, traffic records, traffic engineering) support
traffic safety goals through improved problem identification and analysis, along with better response times to collisions.
8
Del
Norte
Humboldt
SiskiyouModoc
LassenShastaTrinity
Tehama
Plumas
SierraButte
Glenn
Placer
Colusa
Mendocino
Lake
SonomaNapa
Yolo
Su
tter
El Dorado
Alpine
MonoTuolumneSan
Joaquin
Solano
ContraCostaSan
Francisco
San Mateo
Santa Cruz
Alameda
SantaClara Merced
Mariposa
SanBenito
Monterey
Fresno Inyo
KingsTulare
KernSan Luis
Obispo
Santa Barbara
VenturaLos Angeles
San Bernardino
RiversideOrange
San Diego Imperial
OTS Regions and Coordinators
Mark Talan (916) 509-3029
Julie Schilling (916) 509-3018
Janise Truelock (916) 509-3019
Mitch Zehnder (916) 509-3026
45
3
1
2
7
6
4
5
8
9
Vacant
Jady Ramirez (916) 509-3022
8
10
Donna Black (916) 509-3015
Karen Coyle (916) 509-3012
Whitney Braziel (916) 509-3016
Rev.5/10/2012
Vertical Prosecution
Ron Miller
(916) 509-3020
Southern California
Law Enforcement Liaison
Bill Ehart
(916) 509-3028
7
6
1
2
3
Northern California
Law Enforcement Liaison
Ed Gebing
(916) 509-3027
State Departments
Position Vacant
10Julie Schilling (916) 509-3018
California Highway Patrol
Judy Dancy
(916) 509-3052
9
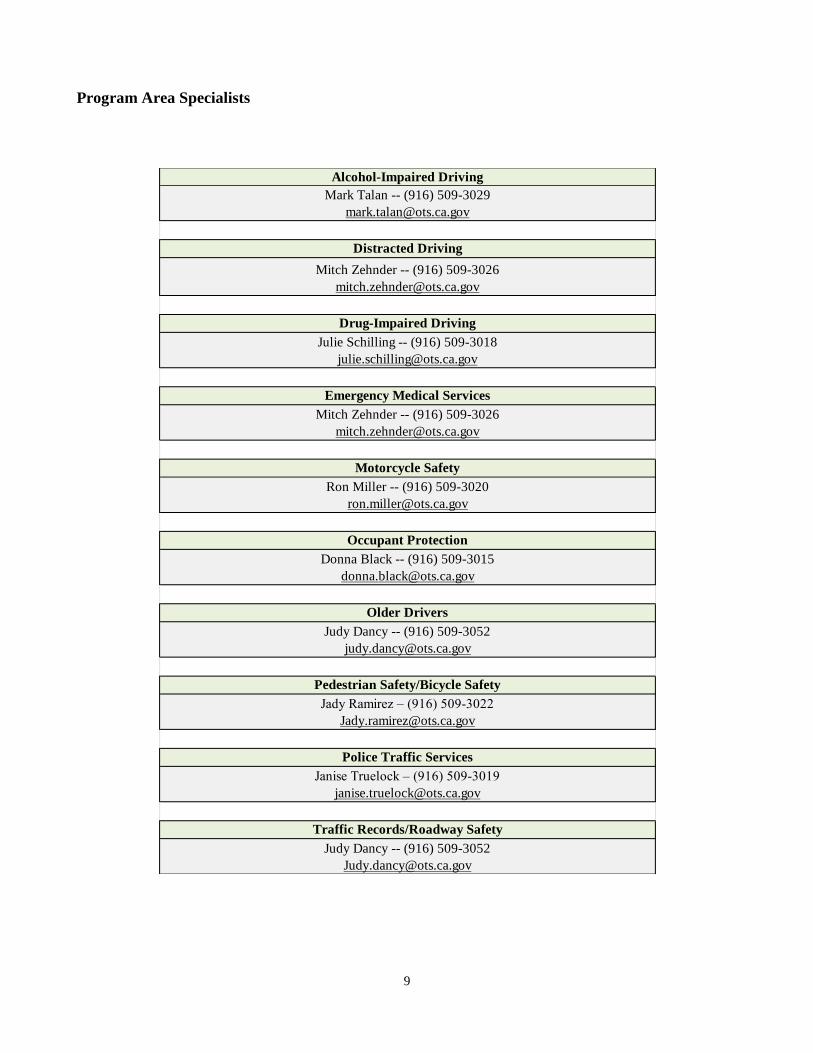
Program Area Specialists
Alcohol-Impaired Driving
Mark Talan -- (916) 509-3029
Distracted Driving
Mitch Zehnder -- (916) 509-3026
Drug-Impaired Driving
Julie Schilling -- (916) 509-3018
Emergency Medical Services
Mitch Zehnder -- (916) 509-3026
Motorcycle Safety
Ron Miller -- (916) 509-3020
Occupant Protection
Donna Black -- (916) 509-3015
Older Drivers
Judy Dancy -- (916) 509-3052
Pedestrian Safety/Bicycle Safety
Jady Ramirez – (916) 509-3022
Police Traffic Services
Janise Truelock – (916) 509-3019
Traffic Records/Roadway Safety
Judy Dancy -- (916) 509-3052

10
11
PERFORMANCE PLAN
AND HIGHWAY SAFETY STRATEGIES

12
13
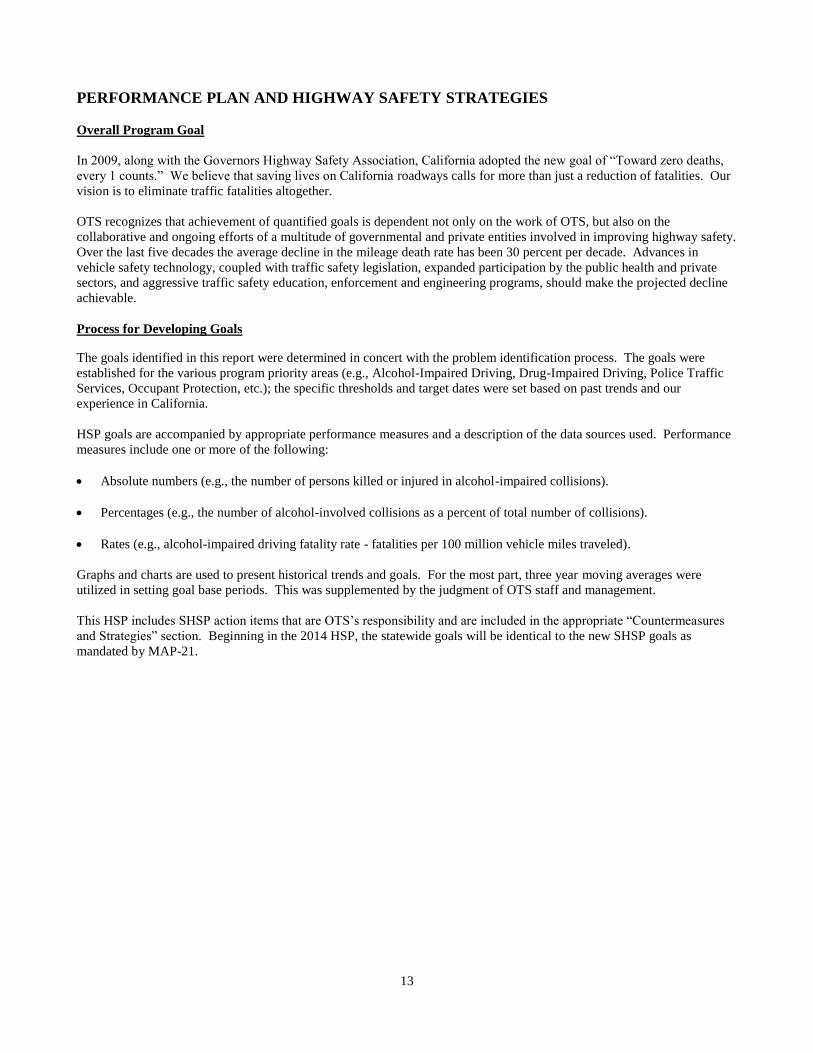
PERFORMANCE PLAN AND HIGHWAY SAFETY STRATEGIES
Overall Program Goal
In 2009, along with the Governors Highway Safety Association, California adopted the new goal of “Toward zero deaths,
every 1 counts.” We believe that saving lives on California roadways calls for more than just a reduction of fatalities. Our
vision is to eliminate traffic fatalities altogether.
OTS recognizes that achievement of quantified goals is dependent not only on the work of OTS, but also on the
collaborative and ongoing efforts of a multitude of governmental and private entities involved in improving highway safety.
Over the last five decades the average decline in the mileage death rate has been 30 percent per decade. Advances in
vehicle safety technology, coupled with traffic safety legislation, expanded participation by the public health and private
sectors, and aggressive traffic safety education, enforcement and engineering programs, should make the projected decline
achievable.
Process for Developing Goals
The goals identified in this report were determined in concert with the problem identification process. The goals were
established for the various program priority areas (e.g., Alcohol-Impaired Driving, Drug-Impaired Driving, Police Traffic
Services, Occupant Protection, etc.); the specific thresholds and target dates were set based on past trends and our
experience in California.
HSP goals are accompanied by appropriate performance measures and a description of the data sources used. Performance
measures include one or more of the following:
Absolute numbers (e.g., the number of persons killed or injured in alcohol-impaired collisions).
Percentages (e.g., the number of alcohol-involved collisions as a percent of total number of collisions).
Rates (e.g., alcohol-impaired driving fatality rate - fatalities per 100 million vehicle miles traveled).
Graphs and charts are used to present historical trends and goals. For the most part, three year moving averages were
utilized in setting goal base periods. This was supplemented by the judgment of OTS staff and management.
This HSP includes SHSP action items that are OTS’s responsibility and are included in the appropriate “Countermeasures
and Strategies” section. Beginning in the 2014 HSP, the statewide goals will be identical to the new SHSP goals as
mandated by MAP-21.
14
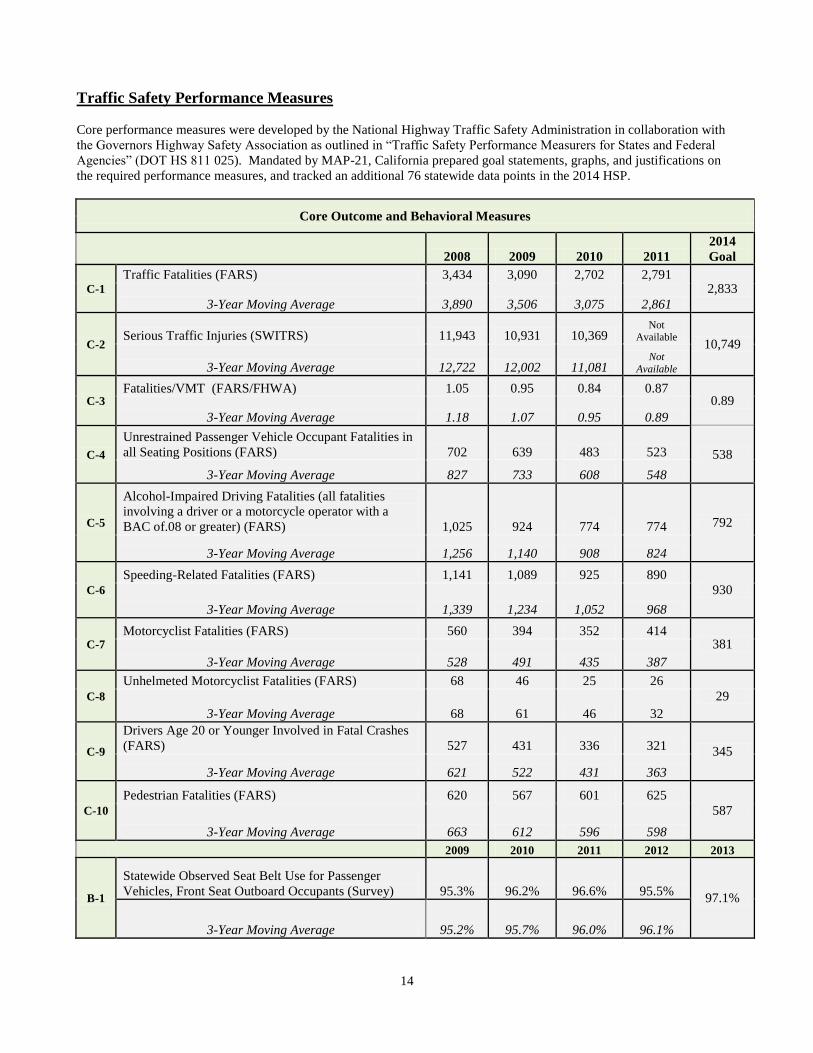
Traffic Safety Performance Measures
Core performance measures were developed by the National Highway Traffic Safety Administration in collaboration with
the Governors Highway Safety Association as outlined in “Traffic Safety Performance Measurers for States and Federal
Agencies” (DOT HS 811 025). Mandated by MAP-21, California prepared goal statements, graphs, and justifications on
the required performance measures, and tracked an additional 76 statewide data points in the 2014 HSP.
Core Outcome and Behavioral Measures
2008 2009 2010 2011
2014
Goal
C-1
Traffic Fatalities (FARS) 3,434 3,090 2,702 2,791 2,833
3-Year Moving Average 3,890 3,506 3,075 2,861
C-2 Serious Traffic Injuries (SWITRS) 11,943 10,931 10,369
Not Available
10,749
3-Year Moving Average 12,722 12,002 11,081 Not
Available
C-3 Fatalities/VMT (FARS/FHWA) 1.05 0.95 0.84 0.87
0.89
3-Year Moving Average 1.18 1.07 0.95 0.89
C-4
Unrestrained Passenger Vehicle Occupant Fatalities in
all Seating Positions (FARS) 702 639 483 523 538
3-Year Moving Average 827 733 608 548
C-5
Alcohol-Impaired Driving Fatalities (all fatalities
involving a driver or a motorcycle operator with a
BAC of.08 or greater) (FARS) 1,025 924 774 774 792
3-Year Moving Average 1,256 1,140 908 824
C-6
Speeding-Related Fatalities (FARS) 1,141 1,089 925 890 930
3-Year Moving Average 1,339 1,234 1,052 968
C-7 Motorcyclist Fatalities (FARS) 560 394 352 414
381
3-Year Moving Average 528 491 435 387
C-8
Unhelmeted Motorcyclist Fatalities (FARS) 68 46 25 26
29
3-Year Moving Average 68 61 46 32
C-9
Drivers Age 20 or Younger Involved in Fatal Crashes
(FARS) 527 431 336 321 345
3-Year Moving Average 621 522 431 363
C-10
Pedestrian Fatalities (FARS) 620 567 601 625
587
3-Year Moving Average 663 612 596 598
2009 2010 2011 2012 2013
B-1
Statewide Observed Seat Belt Use for Passenger
Vehicles, Front Seat Outboard Occupants (Survey) 95.3% 96.2% 96.6% 95.5% 97.1%
3-Year Moving Average 95.2% 95.7% 96.0% 96.1%
15
2014 California Traffic Safety Survey
All states are required to report its annual statewide survey that tracks driver attitudes and awareness of highway safety
enforcement and communication activities and self-reported driving behavior. In July 2014, through an OTS grant, the
University of California, Berkeley, Safe Transportation Research and Education Center will contract with a survey research
firm to develop and administer a statewide survey to establish baseline public opinion measures of driving under the
influence of alcohol and other drugs, distracted driving, and seat belt use. The survey will also inquire about knowledge of
public awareness campaigns, such as “Report Drunk Drivers – Call 911” and sobriety checkpoint programs.
Intercept interviews (approximately five minutes) will be conducted of approximately 1,600 drivers at 60 gas stations in 15
counties throughout California. The geographical distribution of the counties and the number of surveys conducted at each
location will be determined in a manner that will result in a sample population representative of California’s driving population
distribution throughout the state. The surveys also will be representative of the age and gender distribution of California
drivers. The following are anticipated questions:
In your opinion, what are the biggest safety problems on California roadways?
In your opinion, what is the MOST serious distraction for drivers?
How often in the past 30 days have you talked on a hand-held cell phone while driving?
How often in the past 30 days have you talked on a hands-free cell phone while driving?
How often in the past 30 days have you texted or e-mailed while driving?
Do you believe using a ‘hands-free’ cell phone is safer than a hand-held phone while driving?
Do you talk less, more or the same amount on your cell phone because of the ‘hands-free’ law?
Have you EVER made a driving mistake while talking on a cell phone? (For example; missed a turn, driving too slowly or
trailing too close.)
Have you ever been hit or nearly hit by a driver who was talking or texting on a cell phone?
Do you believe that either men or women use cell phones or text more often while driving?
Do you recall hearing or seeing “Report Drunk Drivers – Call 911” in the past six months?
Do you think the “Report Drunk Drivers – Call 911” program has helped police make more DUI arrests?
In your opinion – is the “Report Drunk Drivers – Call 911” program resulting in fewer drunk drivers on the roadways?
Since seeing or hearing “Report Drunk Drivers – Call 911” are you less likely to drive after drinking too much?
In the past six months, have you seen or heard anything about police setting up sobriety/DUI checkpoints to catch drunk
drivers?
Do you support the use of sobriety/DUI checkpoints?
In the past 30 days, did you drive when you thought you had too much alcohol to drive safely?
How serious of a problem is driving under the influence of drugs: legal and illegal?
Do you believe the penalty for driving under the influence of drugs is as serious as the penalty for driving under the
influence of alcohol?
In your opinion, should the penalty for driving under the influence of drugs be more serious, less serious or the same as the
penalty for drinking and driving?
How often do you wear a seatbelt?
Do you recall hearing or seeing “Click it or Ticket” in the past six months?
Do you think the chances of being stopped for not wearing a seatbelt have changed because of it the “Click it or Ticket”
campaign?
Are you aware of the law requiring drivers to move over safely or slow down when approaching stationary vehicles that
display flashing lights, like police, Caltrans, or tow trucks?
16
Activity Measures FFY 2014 (Oct. 1, 2012 - Sept. 30, 2013)
A-1: Seat Belt Citations Issued During Grant Funded
Enforcement Activities
Data will be collected and reported in the 2014 Annual
Performance Report
A-2: Impaired Driving Arrests Made During Grant
Funded Enforcement Activities
A-3: Speeding Citations Issued During Grant Funded
Enforcement Activities
Calendar Years
Additional Activity Measures 2008 2009 2010 2011 2012
Statewide DUI Arrests* 214,811 208,531 195,879 180,212 Not Available
Statewide DUI Conviction Rate** 79% 77% Available
January 2014
Available
January 2015
Available
January 2016
Statewide Seat Belt Violation Convictions*** 392,724 336,785 238,761 260,026 259,888
Statewide Child Restraint Violation Convictions*** 16,118 15,085 13,411 11,791 9,555
Statewide Speeding Convictions 1,868,360 1,868,202 1,734,258 1,613,877 1,477,208
Hand-held Cell Phone Convictions N/A 301,833 361,260 460,487 425,041
Texting Convictions N/A 2,845 7,924 14,886 21,059
Hand-held Device by Someone Under Age 18 N/A 1,228 904 732 114
Calendar Years
Additional Outcome Measures 2008 2009 2010 2011
Rural Fatalities/VMT (FARS/FHWA) 2.26 2.27 2.00 Not Available
Urban Fatalities/VMT (FARS/FHWA) 0.79 0.66 0.59 Not Available
Mileage Death Rate (Fatalities Per 100 Million Vehicle
Miles Traveled (SWITRS) 1.05 0.95 0.84 Not Available
Motor Vehicle Fatalities, Age 16 -19 (FARS) 290 258 181 187
Male 203 167 124 123
Female 87 91 57 64
17
Calendar Years
Additional Outcome Measures 2008 2009 2010 2011
Motor Vehicle Driver Fatalities, Age 16-19 (FARS) 154 94 75 77
Male 119 71 54 54
Female 35 23 21 23
Fatality Rate Per 100,000 Population (FARS) 9.38 8.36 7.28 7.40
Total Motor Vehicle Injuries (SWITRS) 241,873 232,777 227,510 Not Available
Motor Vehicle Injuries, Age 16 -19 (SWITRS) 25,307 23,577 22,172 Not Available
Hit-and-Run Fatal Collisions (FARS) 271 206 234 234
Hit-and-Run Injury Collisions (SWITRS) 16,930 15,439 14,548 Not Available
Hit-and-Run Fatalities (FARS) 299 218 251 242
Hit-and-Run Injuries (SWITRS) 22,627 21,069 18,789 Not Available
Fatal Collisions between 2100-0300 (FARS) 904 755 682 714
Injury Collisions between 2100-0300 (SWITRS) 22,635 21,074 20,287 Not Available
Motor Vehicle Fatalities between 2100-0300 (FARS) 990 841 748 790
Motor Vehicle Injuries between 2100-0300 (SWITRS) 33,169 31,028 29,731 Not Available
Calendar Years
Alcohol-Impaired Driving 2008 2009 2010 2011
Alcohol-Impaired Driving Fatality Rate -- Fatalities
Per 100 Million Vehicle Miles Traveled (FARS) --
California 0.31 0.28 0.31 0.24
Alcohol-Impaired Driving Fatality Rate -- Fatalities
Per 100 Million Vehicle Miles Traveled (FARS) --
National 0.39 0.36 0.39 0.34
Percent of Alcohol-Impaired Driving Fatalities 30% 30% 28% 28%
Driver Fatalities Age 16 -19 with BAC=.08+ (FARS) 33 29 18 16
Male 27 21 15 12
Female 6 7 3 5
Alcohol-Related Fatalities (at least one driver or
nonoccupant had a BAC of .01 or greater) (FARS) 1,425 1,301 1,123 1,112
Alcohol-Related Injuries (SWITRS) 28,463 26,058 24,080 Not Available
Alcohol Related Injuries Age 16 -19 (SWITRS) 2,961 2,649 2,439 Not Available
18
Calendar Years Alcohol-Impaired Driving 2008 2009 2010 2011
Driver Fatalities Age 16-19 with BAC=.01+ (FARS) 41 34 23 19
Male 34 27 19 15
Female 7 7 4 5
Driver Fatalities Age 20-25 with BAC=.01+ (FARS) 166 159 126 139
Male 146 133 104 112
Female 20 26 22 27
Calendar Years
Bicycles 2008 2009 2010 2011
2014
Goal
Bicyclist Fatalities (FARS) 109 99 100 114 98
3-Year Moving Average 120 106 103 104
Bicyclist Injuries (SWITRS) 11,760 12,043 12,553 Not Available
Bicyclist Fatalities Under Age 15 (FARS) 15 10 4 12
Bicyclist Injuries Under Age 15 (SWITRS) 1,993 1,915 1,731 Not Available
Unhelmeted Bicyclist Fatalities (FARS) 102 98 100 114
Calendar Years
Distracted Driving 2011 2012 2013
Cell Phone and Texting Survey 7.3% 10.8% 7.8%
Calendar Years
Drug-Impaired Driving 2008 2009 2010 2011
Drivers Killed, Tested Positive for Drugs 26% 28% 30% 30%
Calendar Years
Motorcycles 2008 2009 2010 2011
Total Motorcycle Registrations (DMV) 824,244 809,129 808,634 818,650
Motorcyclist Fatalities per 100,000 Motorcycle
Registrations (FARS, DMV) 68 49 44 51
Motorcyclist Injuries (SWITRS) 11,764 10,479 9,911 Not Available
Percent of Known Helmeted Motorcyclist Fatalities
(FARS) 88% 88% 93% 94%
Percent of Improperly Licensed Motorcycle Operator
Fatalities (FARS) 37% 32% 33% 35%
Motorcycle Rider (Operator) Fatalities with BAC
=.08+ (FARS) 143 89 89 86
Motorcycle Rider (Operator) Fatalities (FARS) 537 385 341 386
Percent of Motorcycle Rider (Operator) Fatalities with
BAC=.08+ (FARS) 27% 23% 26% 22%
Percent of Motorcyclists At-Fault in Fatal Motorcycle
Collisions (SWITRS) 70% 69% 70% Not Available
Percent of Motorcyclists At-Fault in Injury Motorcycle
Collisions (SWITRS) 58% 34% 57% Not Available
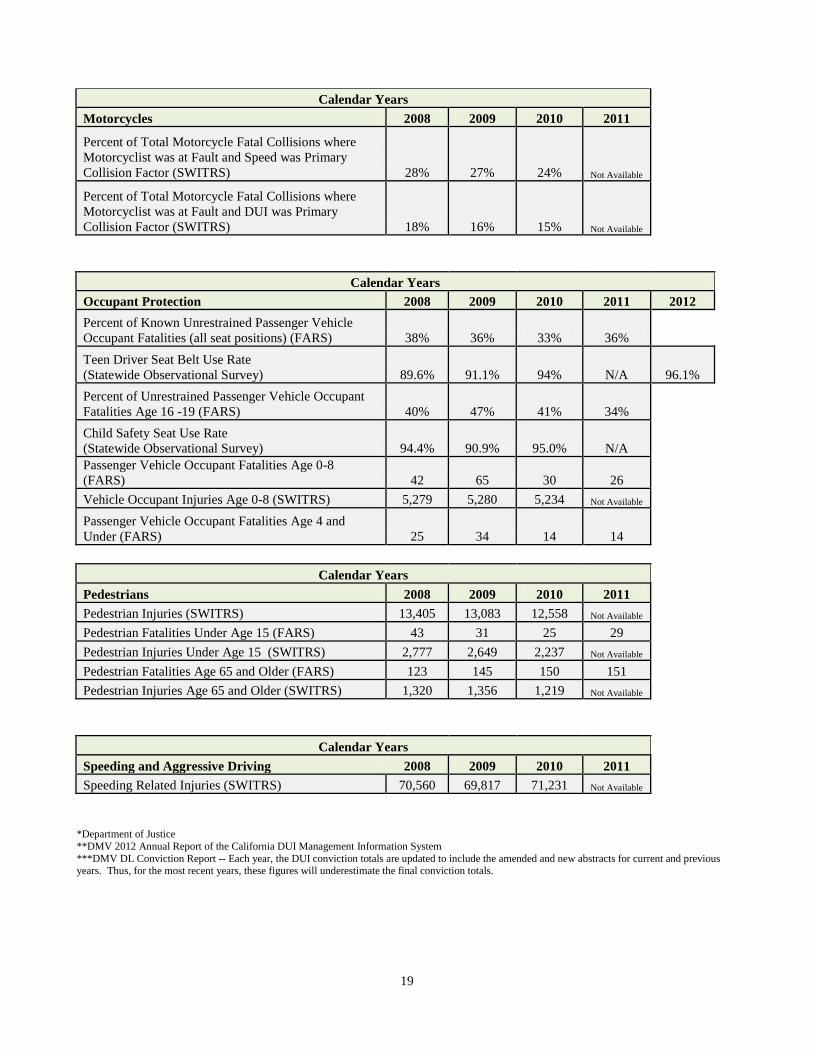
19
Calendar Years
Motorcycles 2008 2009 2010 2011
Percent of Total Motorcycle Fatal Collisions where
Motorcyclist was at Fault and Speed was Primary
Collision Factor (SWITRS) 28% 27% 24% Not Available
Percent of Total Motorcycle Fatal Collisions where
Motorcyclist was at Fault and DUI was Primary
Collision Factor (SWITRS) 18% 16% 15% Not Available
Calendar Years
Occupant Protection 2008 2009 2010 2011 2012
Percent of Known Unrestrained Passenger Vehicle
Occupant Fatalities (all seat positions) (FARS) 38% 36% 33% 36%
Teen Driver Seat Belt Use Rate
(Statewide Observational Survey) 89.6% 91.1% 94% N/A 96.1%
Percent of Unrestrained Passenger Vehicle Occupant
Fatalities Age 16 -19 (FARS) 40% 47% 41% 34%
Child Safety Seat Use Rate
(Statewide Observational Survey) 94.4% 90.9% 95.0% N/A
Passenger Vehicle Occupant Fatalities Age 0-8
(FARS) 42 65 30 26
Vehicle Occupant Injuries Age 0-8 (SWITRS) 5,279 5,280 5,234 Not Available
Passenger Vehicle Occupant Fatalities Age 4 and
Under (FARS) 25 34 14 14
Calendar Years
Pedestrians 2008 2009 2010 2011
Pedestrian Injuries (SWITRS) 13,405 13,083 12,558 Not Available
Pedestrian Fatalities Under Age 15 (FARS) 43 31 25 29
Pedestrian Injuries Under Age 15 (SWITRS) 2,777 2,649 2,237 Not Available
Pedestrian Fatalities Age 65 and Older (FARS) 123 145 150 151
Pedestrian Injuries Age 65 and Older (SWITRS) 1,320 1,356 1,219 Not Available
Calendar Years
Speeding and Aggressive Driving 2008 2009 2010 2011
Speeding Related Injuries (SWITRS) 70,560 69,817 71,231 Not Available
*Department of Justice
**DMV 2012 Annual Report of the California DUI Management Information System
***DMV DL Conviction Report -- Each year, the DUI conviction totals are updated to include the amended and new abstracts for current and previous years. Thus, for the most recent years, these figures will underestimate the final conviction totals.
20
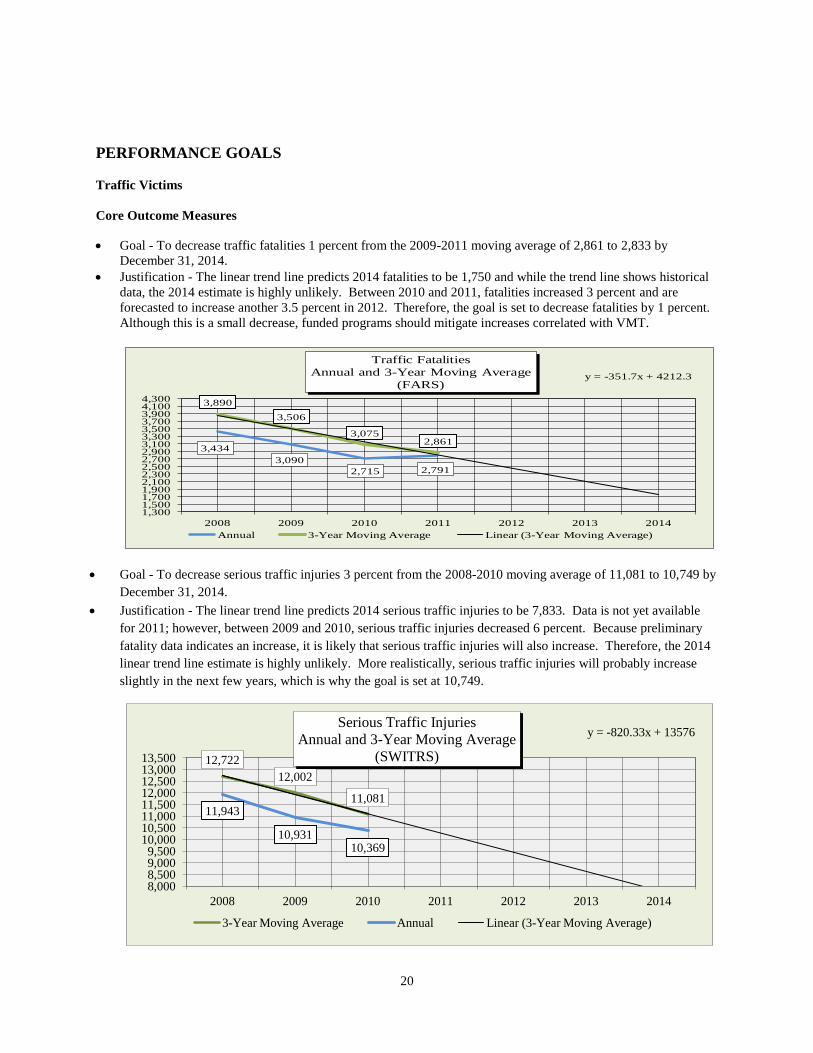
PERFORMANCE GOALS
Traffic Victims
Core Outcome Measures
Goal - To decrease traffic fatalities 1 percent from the 2009-2011 moving average of 2,861 to 2,833 by
December 31, 2014.
Justification - The linear trend line predicts 2014 fatalities to be 1,750 and while the trend line shows historical
data, the 2014 estimate is highly unlikely. Between 2010 and 2011, fatalities increased 3 percent and are
forecasted to increase another 3.5 percent in 2012. Therefore, the goal is set to decrease fatalities by 1 percent.
Although this is a small decrease, funded programs should mitigate increases correlated with VMT.
Goal - To decrease serious traffic injuries 3 percent from the 2008-2010 moving average of 11,081 to 10,749 by
December 31, 2014.
Justification - The linear trend line predicts 2014 serious traffic injuries to be 7,833. Data is not yet available
for 2011; however, between 2009 and 2010, serious traffic injuries decreased 6 percent. Because preliminary
fatality data indicates an increase, it is likely that serious traffic injuries will also increase. Therefore, the 2014
linear trend line estimate is highly unlikely. More realistically, serious traffic injuries will probably increase
slightly in the next few years, which is why the goal is set at 10,749.
3,434
3,090
2,715 2,791
3,890
3,506
3,0752,861
y = -351.7x + 4212.3
1,3001,5001,7001,9002,1002,3002,5002,7002,9003,1003,3003,5003,7003,9004,1004,300
2008 2009 2010 2011 2012 2013 2014
Traffic Fatalities
Annual and 3-Year Moving Average
(FARS)
Annual 3-Year Moving Average Linear (3-Year Moving Average)
12,722
12,002
11,081 11,943
10,931 10,369
y = -820.33x + 13576 y = -820.33x + 13576
8,000 8,500 9,000 9,500
10,000 10,500 11,000 11,500 12,000 12,500 13,000 13,500
2008 2009 2010 2011 2012 2013 2014
Serious Traffic Injuries
Annual and 3-Year Moving Average
(SWITRS)
3-Year Moving Average Annual Linear (3-Year Moving Average)
21
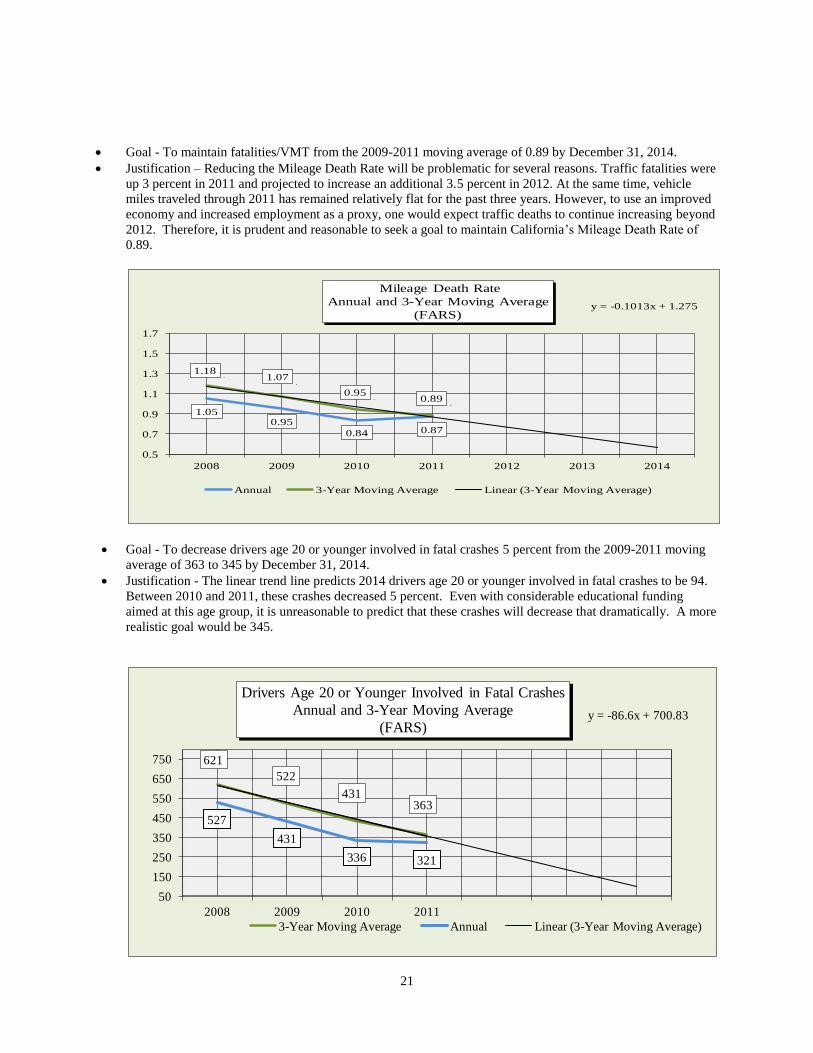
Goal - To maintain fatalities/VMT from the 2009-2011 moving average of 0.89 by December 31, 2014.
Justification – Reducing the Mileage Death Rate will be problematic for several reasons. Traffic fatalities were
up 3 percent in 2011 and projected to increase an additional 3.5 percent in 2012. At the same time, vehicle
miles traveled through 2011 has remained relatively flat for the past three years. However, to use an improved
economy and increased employment as a proxy, one would expect traffic deaths to continue increasing beyond
2012. Therefore, it is prudent and reasonable to seek a goal to maintain California’s Mileage Death Rate of
0.89.
Goal - To decrease drivers age 20 or younger involved in fatal crashes 5 percent from the 2009-2011 moving
average of 363 to 345 by December 31, 2014.
Justification - The linear trend line predicts 2014 drivers age 20 or younger involved in fatal crashes to be 94.
Between 2010 and 2011, these crashes decreased 5 percent. Even with considerable educational funding
aimed at this age group, it is unreasonable to predict that these crashes will decrease that dramatically. A more
realistic goal would be 345.
1.050.95
0.84 0.87
1.181.07
0.950.89
y = -0.1013x + 1.275
0.5
0.7
0.9
1.1
1.3
1.5
1.7
2008 2009 2010 2011 2012 2013 2014
Mileage Death Rate
Annual and 3-Year Moving Average
(FARS)
Annual 3-Year Moving Average Linear (3-Year Moving Average)
621
522
431363
527
431
336 321
y = -86.6x + 700.83 y = -86.6x + 700.83
50
150
250
350
450
550
650
750
2008 2009 2010 2011
Drivers Age 20 or Younger Involved in Fatal Crashes
Annual and 3-Year Moving Average
(FARS)
3-Year Moving Average Annual Linear (3-Year Moving Average)
22
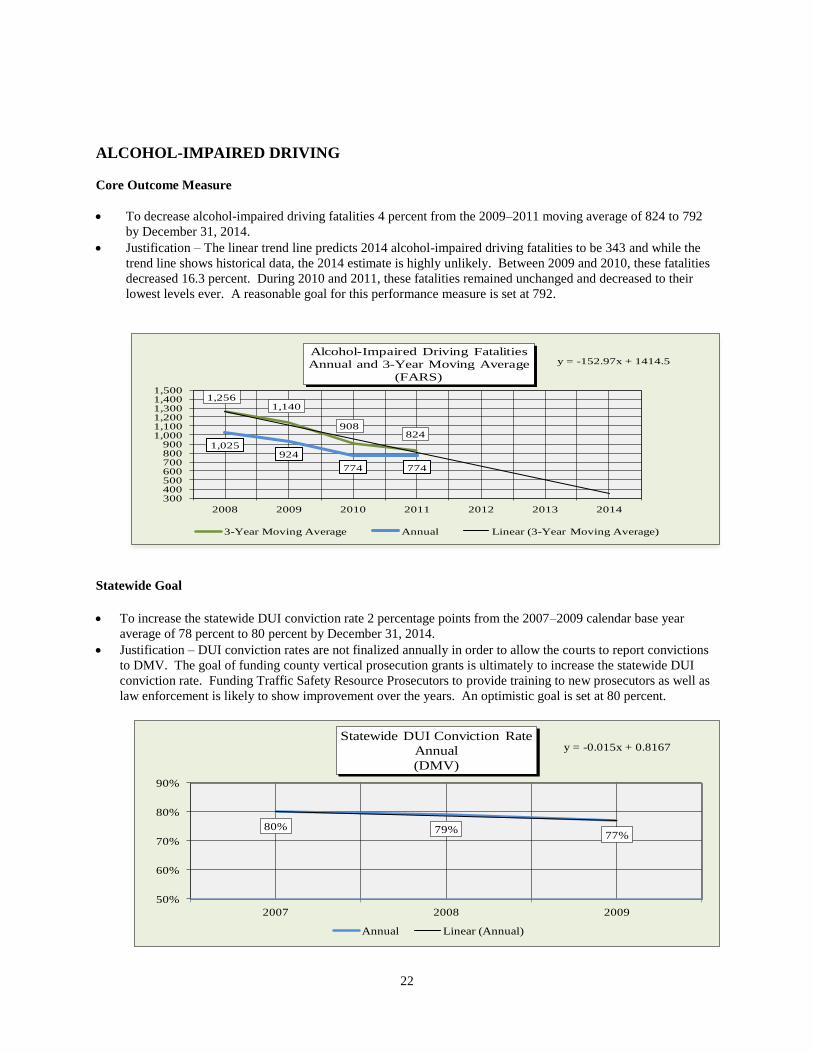
ALCOHOL-IMPAIRED DRIVING
Core Outcome Measure
To decrease alcohol-impaired driving fatalities 4 percent from the 2009–2011 moving average of 824 to 792
by December 31, 2014.
Justification – The linear trend line predicts 2014 alcohol-impaired driving fatalities to be 343 and while the
trend line shows historical data, the 2014 estimate is highly unlikely. Between 2009 and 2010, these fatalities
decreased 16.3 percent. During 2010 and 2011, these fatalities remained unchanged and decreased to their
lowest levels ever. A reasonable goal for this performance measure is set at 792.
Statewide Goal
To increase the statewide DUI conviction rate 2 percentage points from the 2007–2009 calendar base year
average of 78 percent to 80 percent by December 31, 2014.
Justification – DUI conviction rates are not finalized annually in order to allow the courts to report convictions
to DMV. The goal of funding county vertical prosecution grants is ultimately to increase the statewide DUI
conviction rate. Funding Traffic Safety Resource Prosecutors to provide training to new prosecutors as well as
law enforcement is likely to show improvement over the years. An optimistic goal is set at 80 percent.
1,2561,140
908824
1,025924
774 774
y = -152.97x + 1414.5
300400500600700800900
1,0001,1001,2001,3001,4001,500
2008 2009 2010 2011 2012 2013 2014
Alcohol-Impaired Driving Fatalities
Annual and 3-Year Moving Average
(FARS)
3-Year Moving Average Annual Linear (3-Year Moving Average)
80% 79%77%
y = -0.015x + 0.8167
50%
60%
70%
80%
90%
2007 2008 2009
Statewide DUI Conviction Rate
Annual
(DMV)
Annual Linear (Annual)
23
Funded Grant Goals
To reduce the number of persons killed in alcohol-involved collisions 5 percent by September 30, 2014.
To reduce the number of persons injured in alcohol-involved collisions 6 percent by September 30, 2014.
To reduce hit-and-run fatal collisions 5 percent by September 30, 2014.
To reduce hit-and-run injury collisions 5 percent by September 30, 2014.
To reduce nighttime (2100 - 0259 hours) fatal collisions 5 percent by September 30, 2014.
To reduce nighttime (2100 - 0259 hours) injury collisions 5 percent by September 30, 2014.
To reduce Had Been Drinking (HBD) drivers under age 21 in fatal and injury collisions 5 percent by
September 30, 2014.
To reduce the number of motorcyclists killed in alcohol-involved collisions 5 percent by September 30, 2014.
To reduce the number of motorcyclists injured in alcohol-involved collisions 5 percent by September 30, 2014.
Countermeasures and Strategies
Increase frequency, consistency, and publicity of sobriety checkpoint operations by law enforcement agencies
in regions with the highest fatality rates. (SHSP Action 1.1)
Fund a comprehensive statewide “Sobriety Checkpoint” program to include CHP and local law enforcement
agencies to conduct checkpoints during the “Drive Sober or Get Pulled Over” mobilization periods in
December 13, 2013 – January 1, 2014, and August 15 – September 2, 2014. To promote sustained enforcement,
CHP and local law enforcement agencies collectively serving at least 50 percent of California’s population or
serving geographic subdivisions that account for at least 50 percent of California’s alcohol-related fatalities will
conduct checkpoints not less than quarterly. The 2014 Annual Evaluation Report will report the degree to
which the sustained enforcement strategy was carried out and the results of the enforcement operations.
(SHSP Action 1.1)
Encourage and increase statewide crime laboratory support and distribution of portable evidential breath testing
devices to allow for increased use by law enforcement personnel. (SHSP Action 1.2)
Fund the Statewide Traffic Safety Resource Prosecutor (TSRP) program which includes one program director
and four regional DUI prosecutors. This program will provide specialized DUI prosecution training and
monitoring, technical support to counties with DUI vertical prosecution programs, and litigation support in
complex DUI or vehicular homicide trials. (SHSP Action 1.3)
Coordinate with the California District Attorneys Association, a Drug-Impaired Driving Seminar in the spring
of 2014, for 100 law enforcement personnel and 100 prosecutors from across California who work on
misdemeanor or felony drug-impairment cases. The course coordinated by the California Traffic Safety
Resource Prosecutors and law enforcement representatives will assist law enforcement and prosecutors in
developing the knowledge and skills necessary to evaluate, prepare, and try cases involving drug-impaired
driving fatalities. (SHSP Action 1.3)
24
Promote implementation of vertical prosecution of DUI offenders. (SHSP Action 1.4)
Expand DUI vertical prosecution program from twenty to twenty-two counties. (SHSP Action 1.4)
Institute programs that provide intense monitoring of “worst-of-the-worst” repeat DUI offenders.
(SHSP Action 1.5)
Develop a uniform and consistent system for hospital staff to notify law enforcement upon the arrival of a
person who has been involved in a traffic collision in which alcohol may have been involved.
(SHSP Action 1.6)
Increase DUI conviction rates by surveying counties with disproportionately low DUI conviction rates to
determine corrective action needed to improve conviction rates. (SHSP Action 1.7)
Increase by 15 percent the number of law enforcement officers who are trained and certified as Drug
Recognition Evaluator (DRE) officers. (SHSP Action 1.8)
Fund the Department of Alcoholic Beverage Control to award local law enforcement agencies
mini-grants to conduct underage drinking prevention and enforcement activities including Minor Decoy and
Shoulder Tap operations. (SHSP Action 1.11)
Increase publicity of the DUI Management Information System annual report to law enforcement, alcohol
program providers, and the courts. (SHSP Action 1.17)
Develop and implement targeted communication and court training to improve compliance with mandated court
sentencing provisions and abstract reporting for DUI. (SHSP Action 1.18)
Expand the implementation of young driver programs such as: Start Smart, Right Turn, Teen Smart, Every 15
Minutes, Friday Night Live, Sober Graduation, and Target Responsibility for Alcohol Connected Emergencies (TRACE), and encourage development of new programs. (SHSP Action 6.5)
Fund and mandate a newly developed Police Officer Standards Training (POST) certified DUI Checkpoints –
Planning and Management course designed to help law enforcement prepare, execute, and supervise a
successful DUI checkpoint.
Continue and enhance a “peer-to-peer” program, Teens in the Driver Seat.
Fund local agencies to implement proven educational programs to middle and high school students that may
include Real DUI Trials, Real DUI Sentencing, and multi-media presentations. These innovative programs
bring to school auditoriums actual DUI court trials and the sentencing of actual convicted DUI offenders to
increase awareness about the consequences of drinking and driving. (SHSP Action 6.5)
Promote the “Report Drunk Drivers – Call 911” and “Drive Sober or Get Pulled Over” Campaigns.
Fund alcohol wet lab and field certification training for POST DRE Academies.
Fund “corridor DUI programs” that select corridors based on data showing disproportionate numbers of DUI
collisions and convening task forces to implement identified solutions.
Fund statewide NHTSA-certified Standardized Field Sobriety Testing (SFST) training to traffic and patrol
officers.
Fund DUI education efforts in college campus communities.
25
Fund comprehensive community alcohol programs that include enforcement, public education, community
organization, and judicial liaison and training.
Fund community based DUI prevention and education efforts including booths, crashed-car exhibits and multi-
media presentations at schools and community events, and the expansion of victim impact panels and law
enforcement recognition programs.
Expand “Avoid DUI” campaigns (regional, multi-agency high visibility enforcement) to involve more allied
agencies and college campuses during the NHTSA Winter and Summer Mobilizations from mid-August
through Labor Day and mid-December through New Year’s Day. Operations also will be deployed on
Memorial Day and Independence Day weekends, Halloween, Super Bowl Sunday, St. Patrick’s Day, Cinco de
Mayo, and during local special events with identified DUI problems.
Expand multi-agency “Avoid DUI” media campaigns as a coordinated effort with regional sobriety checkpoints,
task force operations, warrant/probation operations and local saturation patrols, along with court stings against
drivers with suspended driver licenses, to bring about the awareness of the dangers of drunk driving.
Expand the multi-agency “Avoid DUI” campaigns to increase training for officers participating in enforcement
efforts and conduct officer recognition programs in coordination with Mothers Against Drunk Driving
(MADD).
Fund training and technical assistance to schools, colleges, and community groups statewide to assist in the
development of youth-driven anti-DUI campaigns.
To conduct highly publicized motorcycle safety DUI Saturation Patrol(s) in areas or during events with
motorcycle incidents or collisions resulting from DUI drivers/motorcyclists.
26
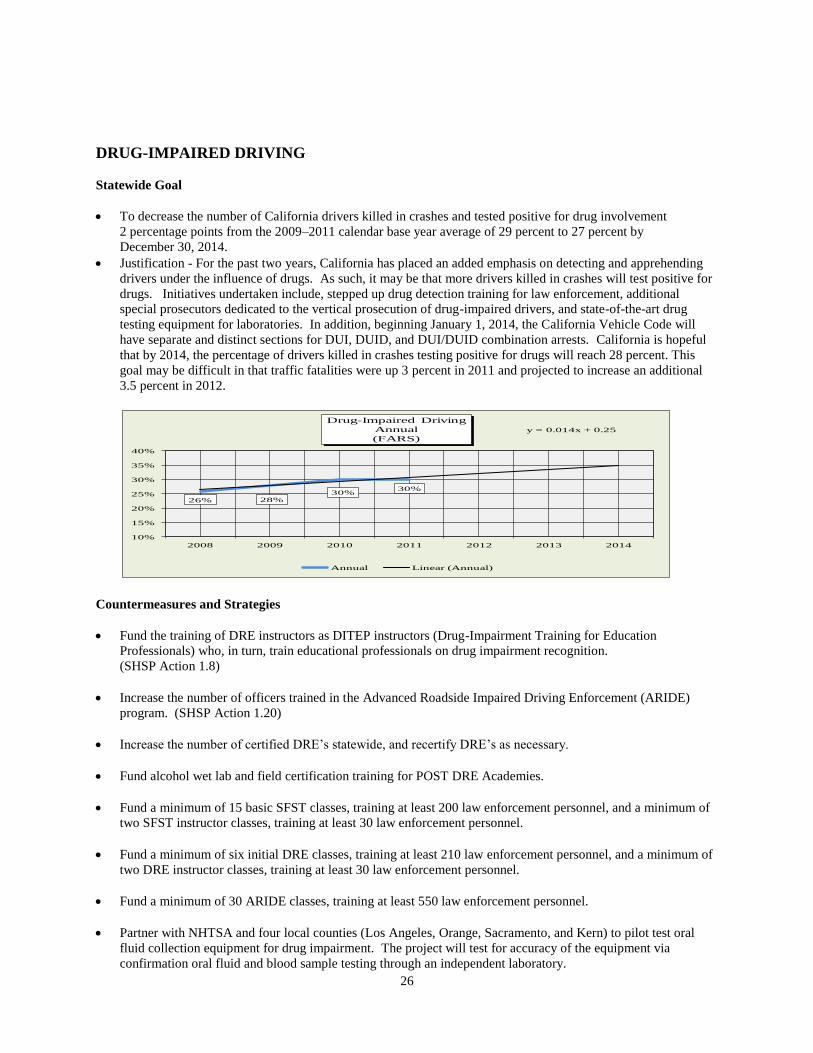
DRUG-IMPAIRED DRIVING
Statewide Goal
To decrease the number of California drivers killed in crashes and tested positive for drug involvement
2 percentage points from the 2009–2011 calendar base year average of 29 percent to 27 percent by
December 30, 2014.
Justification - For the past two years, California has placed an added emphasis on detecting and apprehending
drivers under the influence of drugs. As such, it may be that more drivers killed in crashes will test positive for
drugs. Initiatives undertaken include, stepped up drug detection training for law enforcement, additional
special prosecutors dedicated to the vertical prosecution of drug-impaired drivers, and state-of-the-art drug
testing equipment for laboratories. In addition, beginning January 1, 2014, the California Vehicle Code will
have separate and distinct sections for DUI, DUID, and DUI/DUID combination arrests. California is hopeful
that by 2014, the percentage of drivers killed in crashes testing positive for drugs will reach 28 percent. This
goal may be difficult in that traffic fatalities were up 3 percent in 2011 and projected to increase an additional
3.5 percent in 2012.
Countermeasures and Strategies
Fund the training of DRE instructors as DITEP instructors (Drug-Impairment Training for Education
Professionals) who, in turn, train educational professionals on drug impairment recognition.
(SHSP Action 1.8)
Increase the number of officers trained in the Advanced Roadside Impaired Driving Enforcement (ARIDE)
program. (SHSP Action 1.20)
Increase the number of certified DRE’s statewide, and recertify DRE’s as necessary.
Fund alcohol wet lab and field certification training for POST DRE Academies.
Fund a minimum of 15 basic SFST classes, training at least 200 law enforcement personnel, and a minimum of
two SFST instructor classes, training at least 30 law enforcement personnel.
Fund a minimum of six initial DRE classes, training at least 210 law enforcement personnel, and a minimum of
two DRE instructor classes, training at least 30 law enforcement personnel.
Fund a minimum of 30 ARIDE classes, training at least 550 law enforcement personnel.
Partner with NHTSA and four local counties (Los Angeles, Orange, Sacramento, and Kern) to pilot test oral
fluid collection equipment for drug impairment. The project will test for accuracy of the equipment via
confirmation oral fluid and blood sample testing through an independent laboratory.
26% 28%30%
30%
y = 0.014x + 0.25
10%
15%
20%
25%
30%
35%
40%
2008 2009 2010 2011 2012 2013 2014
Drug-Impaired Driving
Annual
(FARS)
Annual Linear (Annual)
27
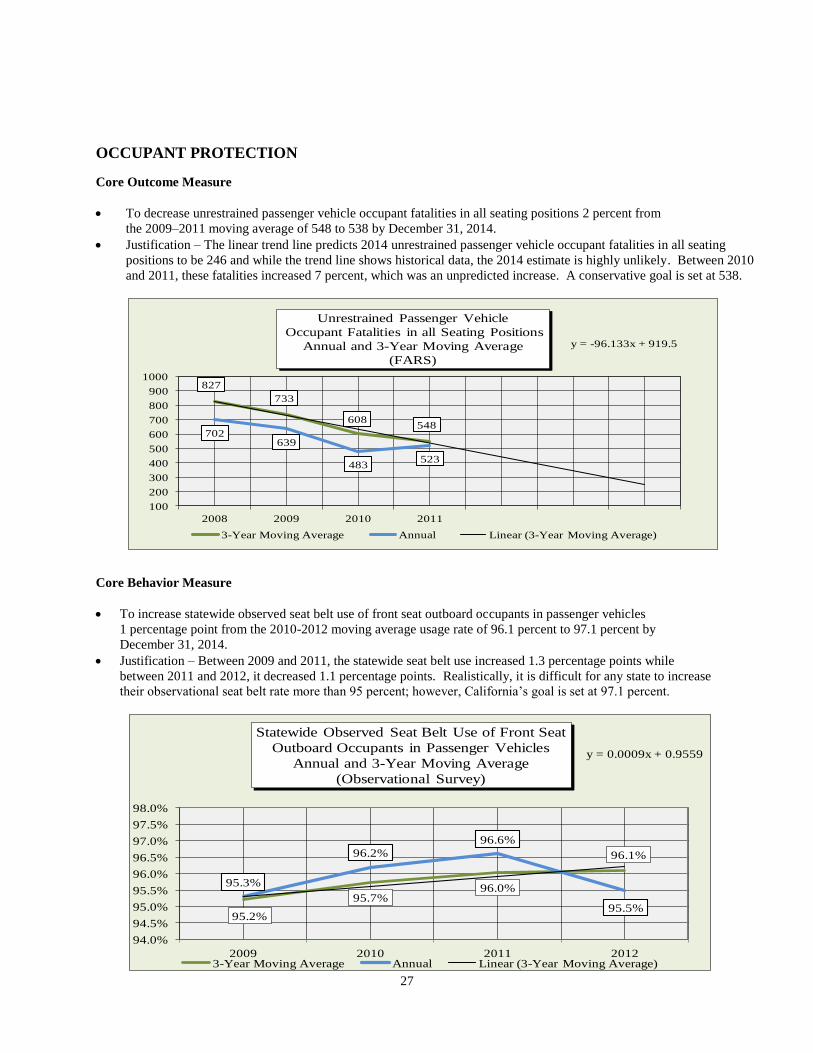
OCCUPANT PROTECTION
Core Outcome Measure
To decrease unrestrained passenger vehicle occupant fatalities in all seating positions 2 percent from
the 2009–2011 moving average of 548 to 538 by December 31, 2014.
Justification – The linear trend line predicts 2014 unrestrained passenger vehicle occupant fatalities in all seating
positions to be 246 and while the trend line shows historical data, the 2014 estimate is highly unlikely. Between 2010
and 2011, these fatalities increased 7 percent, which was an unpredicted increase. A conservative goal is set at 538.
Core Behavior Measure
To increase statewide observed seat belt use of front seat outboard occupants in passenger vehicles
1 percentage point from the 2010-2012 moving average usage rate of 96.1 percent to 97.1 percent by
December 31, 2014.
Justification – Between 2009 and 2011, the statewide seat belt use increased 1.3 percentage points while
between 2011 and 2012, it decreased 1.1 percentage points. Realistically, it is difficult for any state to increase
their observational seat belt rate more than 95 percent; however, California’s goal is set at 97.1 percent.
827
733
608548
702639
483523
y = -96.133x + 919.5
100
200
300
400
500
600
700
800
900
1000
2008 2009 2010 2011
Unrestrained Passenger Vehicle
Occupant Fatalities in all Seating Positions
Annual and 3-Year Moving Average
(FARS)
3-Year Moving Average Annual Linear (3-Year Moving Average)
95.2%
95.7%96.0%
96.1%
95.3%
96.2%
96.6%
95.5%
y = 0.0009x + 0.9559
94.0%
94.5%
95.0%
95.5%
96.0%
96.5%
97.0%
97.5%
98.0%
2009 2010 2011 2012
Statewide Observed Seat Belt Use of Front Seat
Outboard Occupants in Passenger Vehicles
Annual and 3-Year Moving Average
(Observational Survey)
3-Year Moving Average Annual Linear (3-Year Moving Average)
28
Funded Grant Goals
To increase seat belt compliance 5 percentage points by September 30, 2014.
To increase child safety seat usage 6 percentage points by September 30, 2014.
To reduce the number of vehicle occupants killed and injured under the age of eight by 10 percent by
September 30, 2014.
Countermeasures and Strategies
Occupant Protection – General
Increase occupant restraint enforcement operations and include information on correct usage as well as publicity
to raise public awareness of the law and its enforcement. (SHSP Action 4.2)
Develop occupant protection educational programs among multicultural and diverse ethnic populations.
Conduct spring and summer statewide surveys of seat belt usage rate of front-seat occupants and infant/toddlers
in any vehicle position.
Urge the media to report occupant restraint usage as a part of every collision.
Encourage participation in statewide and national Public Information and Education campaigns and join with
NHTSA to conduct the “Click It or Ticket” and National Child Passenger Safety Awareness Week.
Seat Belt Safety
Illuminate the “Click it or Ticket” message during the NHTSA mobilization on approximately 325 fixed
freeway changeable message signs.
Encourage law enforcement agencies to participate in the “Click it or Ticket” campaign.
Child Passenger Safety
Educate parents, caregivers, law enforcement, emergency services personnel, health care providers on the child
safety seat, booster seat, and back seat law including seating positions for children in air bag equipped vehicles,
and raise the awareness of vehicle/child safety seat compatibility.
(SHSP Action 4.2)
Work closely with community-based organizations to promote correct child safety use at both the neighborhood
and community levels, including low income, culturally diverse, foster families and child protective service
workers. (SHSP Action 4.2)
Continue to promote child safety seat “checkups” to educate parents and caregivers on correct child safety seat
usage. (SHSP Action 4.2)
Provide ongoing occupant protection program and epidemiological technical assistance.
(SHSP Action 4.2)
29
Establish new child safety seat “fitting stations” to ensure proper installation and instructions of occupant
restraints in vehicles. (SHSP Action 4.9)
Develop a program that increases the accuracy of California child passenger safety (CPS) occupant protection
misuse data. (SHSP Action 4.10)
Increase the number of new CPS Violator Education Programs. (SHSP Action 4.12)
Using Section 2011 funds, OTS will promote California’s new booster seat safety law which went into effect on
January 1, 2012, and requires children under age eight (there are exceptions for those 4’9” but younger than
eight) to ride in a safety seat or booster, in the back seat of a motor vehicle.
Continue the NHTSA’s standardized CPS Technician and Instructor Training Programs, and renewal and
update refresher classes.
Continue building the capacity of the 61 local health departments' SB 1073 (Chapter 1223, Statues of 1991)
programs to work effectively with the local courts, law enforcement, referral agencies, home and day care
providers, preschools, hospital and clinic providers, schools, private industry, media, and community agencies.
Provide technical and programmatic teleconferences for CPS Instructors and Technicians.
Provide CPS educational resources to law enforcement agencies.
Provide a toll-free CPS Helpline in English and Spanish.
Other Drivers:
Establish a Senior Driver Traffic Safety Program providing classroom education, alternative transportation
resources/referrals and evaluations to older drivers. (SHSP Action 9.1)
Provide training to law enforcement, health professionals, and students in San Diego County of older driver
sensitivities and impairments.
Provide education and public awareness of railroad highway grade crossings and rights-of-way.
30
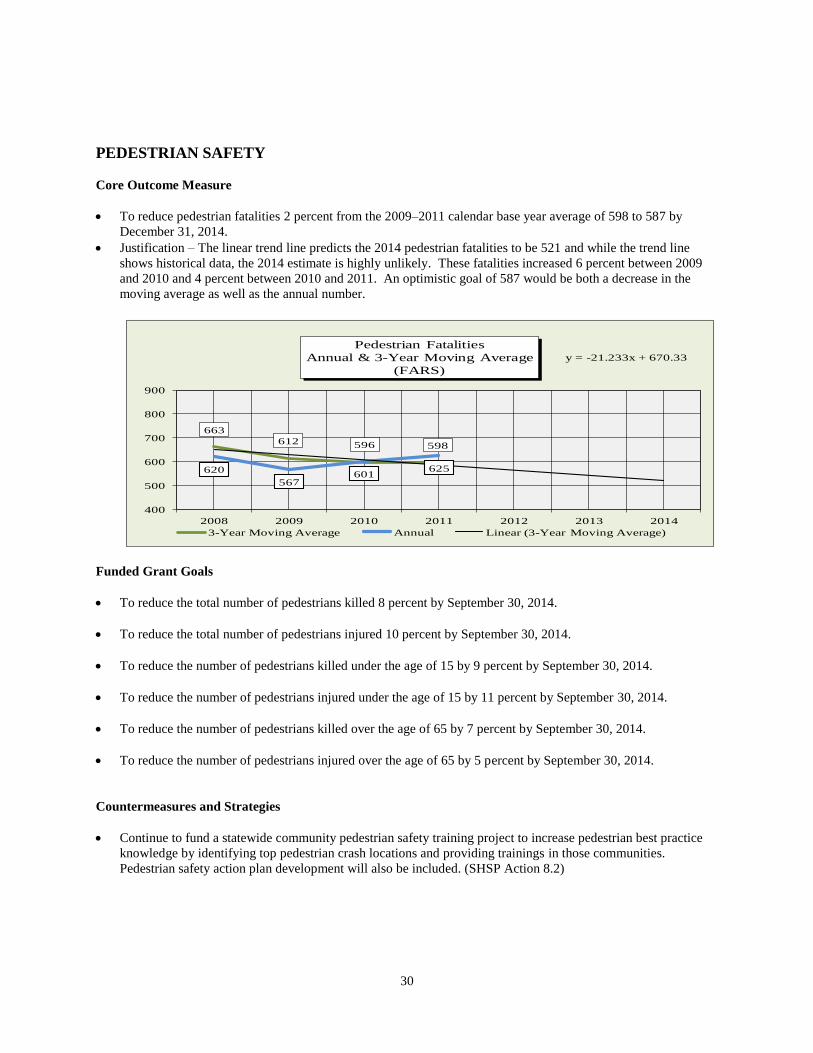
PEDESTRIAN SAFETY
Core Outcome Measure
To reduce pedestrian fatalities 2 percent from the 2009–2011 calendar base year average of 598 to 587 by
December 31, 2014.
Justification – The linear trend line predicts the 2014 pedestrian fatalities to be 521 and while the trend line
shows historical data, the 2014 estimate is highly unlikely. These fatalities increased 6 percent between 2009
and 2010 and 4 percent between 2010 and 2011. An optimistic goal of 587 would be both a decrease in the
moving average as well as the annual number.
Funded Grant Goals
To reduce the total number of pedestrians killed 8 percent by September 30, 2014.
To reduce the total number of pedestrians injured 10 percent by September 30, 2014.
To reduce the number of pedestrians killed under the age of 15 by 9 percent by September 30, 2014.
To reduce the number of pedestrians injured under the age of 15 by 11 percent by September 30, 2014.
To reduce the number of pedestrians killed over the age of 65 by 7 percent by September 30, 2014.
To reduce the number of pedestrians injured over the age of 65 by 5 percent by September 30, 2014.
Countermeasures and Strategies
Continue to fund a statewide community pedestrian safety training project to increase pedestrian best practice
knowledge by identifying top pedestrian crash locations and providing trainings in those communities.
Pedestrian safety action plan development will also be included. (SHSP Action 8.2)
663
612 596 598
620
567601
625
y = -21.233x + 670.33
400
500
600
700
800
900
2008 2009 2010 2011 2012 2013 2014
Pedestrian Fatalities
Annual & 3-Year Moving Average
(FARS)
3-Year Moving Average Annual Linear (3-Year Moving Average)
31
Form a task force to assist pedestrian safety action plan development, to facilitate training delivery, and to
establish pedestrian safety improvement programs in California’s urban and rural communities.
(SHSP Action 8.3)
Continue to fund the University of California Berkeley Technology Transfer Program to provide free Pedestrian
Safety Assessments to cities; it enables cities to systematically identify pedestrian safety issues/problems and
effective remedial options. Improved pedestrian safety and improved pedestrian infrastructure in turn leads to
enhanced community walkability and economic vitality. (SHSP Action 8.4)
Encourage the implementation of statewide traffic safety programs, task force and advisory committees that
focus on pedestrian safety issues and walkability such as the California Safe Routes to School Program and the
California Pedestrian Advisory Committee (CalPed). (SHSP Action 8.5)
Assist local jurisdictions develop their master plans to improve overall traffic safety by implementing pedestrian
flashing beacons and pedestrian countdown signals. Flashing beacons alert drivers of pedestrians in
intersections and/or crosswalks. Pedestrian countdown signals alert the pedestrian of safe crossing time. These
devices must be installed off the Federal Aid System. (SHSP Action 8.6)
Continue to support programs that encourage active transportation and seek to implement Complete Streets
measures that provide safe access for all roadway users. (Complete Streets ensures that bicyclists, pedestrians
and motorists of all ages and abilities are able to move safely along and across corridors. This applies equally
in rural, suburban, and urban areas.) (SHSP Action 8.8)
Fund a pedestrian safety corridor project to reduce vehicle-related fatalities and injuries along, up to three, high-
collision highway (corridor) segments. This program includes a public education and awareness campaign and
enhanced enforcement.
Increase the awareness of driver and pedestrian traffic safety through specially tailored safe behavior programs.
Continue intensive age-specific public education campaigns and outreach addressing safer driving and walking
behaviors for high-risk populations and locations to create positive and safer attitudes among younger
pedestrians and reinforce traffic safety responsibility.
Provide educational presentations to targeted communities with high pedestrian collisions.
32
BICYCLE SAFETY
Statewide Goal
To reduce bicyclist fatalities 3 percent from the 2009–2011 base year average of 104 to 101 by December 31,
2014.
Justification – The linear trend line predicts bicyclist fatalities to be 86 and while the trend line shows historical
data, the 2014 estimate is highly unlikely. Between 2010 and 2011, these fatalities actually increased 13
percent. All bicyclist fatalities in 2010 and 2011 were unhelmeted. An optimistic goal of 101 would be both a
decrease in the moving average as well as the annual number.
Funded Grant Goals
To reduce the total number of bicyclists killed in traffic related collisions 10 percent by September 30, 2014.
To reduce the total number of bicyclists injured in traffic related collisions 10 percent by September 30, 2014.
To reduce the number of bicyclists killed in traffic related collisions under the age of 15 by 7 percent by
September 30, 2014.
To reduce the number of bicyclists injured in traffic related collisions under the age of 15 by 10 percentage
points by September 30, 2014.
To increase bicycle helmet compliance for children aged 5 to 18 by 25 percentage points by September 30,
2014.
120
106
103 104
109
99 100
114
y = -4.9x + 120.33
80
90
100
110
120
130
2008 2009 2010 2011 2012 2013 2014
Bicyclist Fatalities
Annual and 3-Year Moving Average
(FARS)
3-Year Moving Average Annual Linear (3-Year Moving Average)
33
Countermeasures and Strategies
Support the California Department of Transportation (Caltrans) Complete Streets Implementation Action Plan.
(SHSP Action 13.5)
Conduct interactive traffic safety rodeos and update presentations targeting elementary, middle and high
schools, and community groups. (SHSP Action 13.8)
Promote safety helmet distribution and incentive programs, as well as enforcement. (SHSP Action 13.2)
Conduct aggressive public information and education campaigns for diverse markets. (SHSP Action 13.11)
Implement court diversion courses for children under 18 years of age, who are cited for safety helmet
compliance violations and pedestrian and bicycle laws.
34
MOTORCYCLE SAFETY
Core Outcome Measures
To decrease motorcyclist fatalities 2 percent from the 2009–2011 calendar base year average of 387 to 381 by
December 31, 2014.
Justification – The trend line predicts 2014 motorcyclist fatalities to be 244 and while the trend line shows
historical data, the 2014 estimate is highly unlikely. California saw a dramatic decrease, 26 percent between
2008 and 2009; however, between 2010 and 2011, these fatalities increased 15 percent. Preliminary 2012 data
indicates little change from 2011. Considering the fluctuation over the past several years, a modest decrease of
2 percent will pose a challenging goal.
To decrease unhelmeted motorcyclist fatalities 10 percent from the 2009-2011 calendar base year average of 32
to 29 by December 31, 2014.
Justification – The linear trend line predicts off-the-chart unhelmeted motorcyclist fatalities for 2014. Between
2010 and 2011, these fatalities increased 4 percent. It is probable that these fatalities may slightly increase over
the next few years. A reasonable goal is set at 29.
528491
435
387
560
394352
414
y = -48x + 550
200
300
400
500
600
700
2008 2009 2010 2011 2012 2013 2014
Motorcyclist Fatalities
Annual and 3-Year Moving Average
(FARS)
3-Year Moving Average Annual Linear (Annual)
6861
46
32
68
46
25 26
y = -12.033x + 81.833
0
10
20
30
40
50
60
70
80
2008 2009 2010 2011 2012 2013 2014
Unhelmeted Motorcyclist Fatalities
Annual and 3-Year Moving Average
(FARS)
3-Year Moving Average Annual Linear (3-Year Moving Average)
35
Countermeasures and Strategies
Develop a more comprehensive program to promote motorcycle safety.
Continue the educational awareness campaign using a variety of media including internet, television, movie
theaters and printed material.
Conduct a statewide survey of motorcycle riders and other vehicle drivers regarding the opinions and behaviors
related to motorcycle lane splitting. (SHSP Action 12.17)
Implement a public education campaign specific to motorcycle lane splitting educating drivers what is safe and
prudent, and providing motorcyclists with general guidelines for safety. (SHSP Action 12.18)
Conduct motorcycle helmet exchange to reduce the use of non-DOT-compliant helmets and survey previous
and current participants to evaluate the effectiveness of the pilot exchange program. (Draft SHSP Action 12.19)
Determine injury and medical outcomes of collision-involved California motorcyclists, related to helmet type,
lane-splitting, and other characteristics. (Draft SHSP Action 12.20)
Develop collision maps and data tables to identify and improve safety at locations with high concentrations of
motorcycle collisions and to help agencies understand local motorcycle collision characteristics and target
countermeasures. (Draft SHSP Action 12.21)
Include the following recommended strategies and best practices from NHTSA’s 2008 Motorcycle Safety
Assessment Report:
Increase the OTS leadership role for a comprehensive motorcycle safety program by providing grant
support to further SHSP Challenge Area 12 (Motorcycle Safety) goals and objectives.
Incorporate into appropriate grants special enforcement operations geared toward primary collision factor
violations that result in motorcycle crashes.
Explore opportunities to create regional or countywide cooperation for networking, information sharing,
joint operations and coordination to more effectively solve traffic safety problems instead of displacing
them.
Create a public information campaign to promote motorist awareness of motorcycles, emphasizing the
reasons why motorists do not see motorcycles and motorcyclists’ vulnerability in traffic crashes.
Include motorcycle-specific messages in larger impaired-driving campaigns commensurate with the
number of impaired motorcycle riding fatalities.
Develop and conduct a new study on motorcycle helmet usage.
36
POLICE TRAFFIC SERVICES
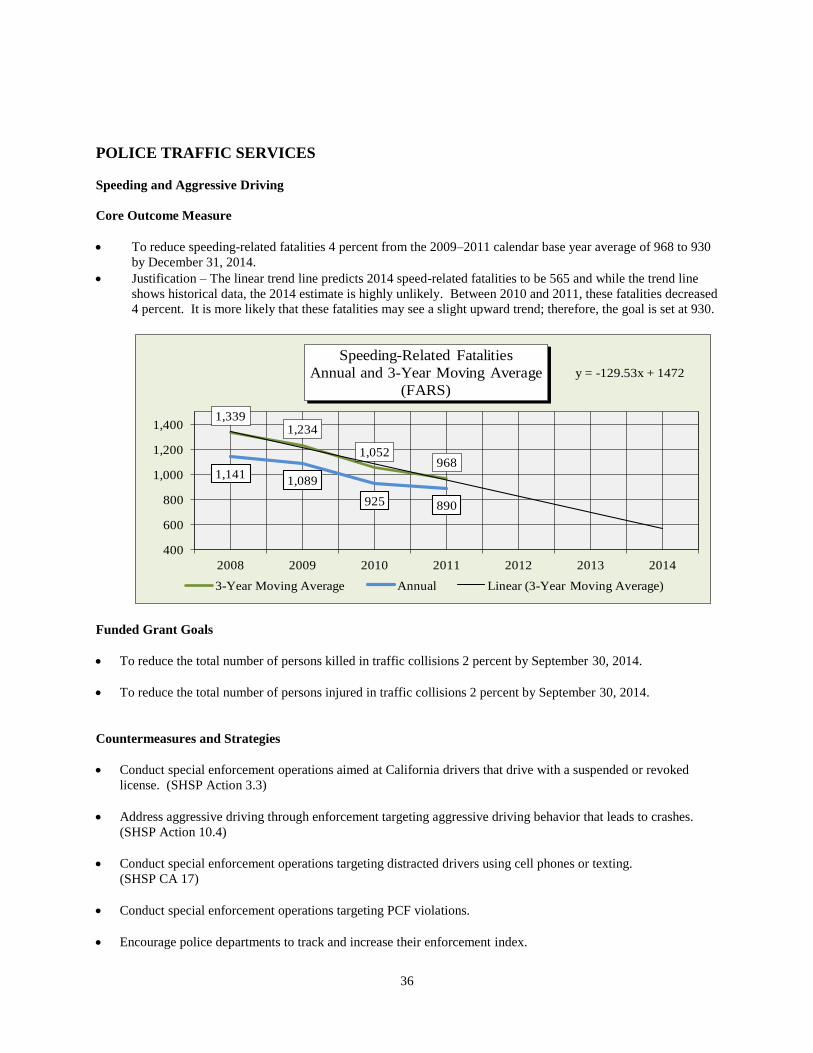
Speeding and Aggressive Driving
Core Outcome Measure
To reduce speeding-related fatalities 4 percent from the 2009–2011 calendar base year average of 968 to 930
by December 31, 2014.
Justification – The linear trend line predicts 2014 speed-related fatalities to be 565 and while the trend line
shows historical data, the 2014 estimate is highly unlikely. Between 2010 and 2011, these fatalities decreased
4 percent. It is more likely that these fatalities may see a slight upward trend; therefore, the goal is set at 930.
Funded Grant Goals
To reduce the total number of persons killed in traffic collisions 2 percent by September 30, 2014.
To reduce the total number of persons injured in traffic collisions 2 percent by September 30, 2014.
Countermeasures and Strategies
Conduct special enforcement operations aimed at California drivers that drive with a suspended or revoked
license. (SHSP Action 3.3)
Address aggressive driving through enforcement targeting aggressive driving behavior that leads to crashes.
(SHSP Action 10.4)
Conduct special enforcement operations targeting distracted drivers using cell phones or texting.
(SHSP CA 17)
Conduct special enforcement operations targeting PCF violations.
Encourage police departments to track and increase their enforcement index.
1,3391,234
1,052968
1,1411,089
925 890
y = -129.53x + 1472
400
600
800
1,000
1,200
1,400
2008 2009 2010 2011 2012 2013 2014
Speeding-Related Fatalities
Annual and 3-Year Moving Average
(FARS)
3-Year Moving Average Annual Linear (3-Year Moving Average)
37
Fund full-time officers, overtime, lidar and radar units, DUI trailers, visible display radar trailers, changeable
message signs, geographical information systems, motorcycles, and preliminary alcohol screening devices,
portable evidential breath testing devices, automated citation devices, and computer equipment.
Conduct illegal-street racing enforcement training to California law enforcement agencies.
Continue programs with the University of California, Berkeley to conduct no cost enforcement and engineering
evaluations as a service to cities and counties seeking to improve traffic safety in their communities.
Encourage the involvement of community-based organizations in program planning and participation in
activities to promote traffic safety.
Use “Geographical Information Systems” to identify high collision, arrest, and citation locations for
enforcement and engineering countermeasures.
Conduct Courthouse and Probation Office sting operations of traffic offenders with licensure sanctions who fail
to obey their suspension or revocation of licensure.
Fund “Corridor Safety Programs” that select corridors based on data identifying them as having a
disproportionate number of collisions, convene a task force, identify factors contributing to the traffic safety
problem(s), develop an action plan, and implement identified solutions.
Conduct highly publicized special motorcycle safety enforcement operations in areas or during events with a
high number of motorcycle incidents or collisions resulting from unsafe speed, DUI, following too closely,
unsafe lane changes, improper turning and other primary collision factors by motorcyclists and other drivers.
Promote traffic enforcement training for patrol officers.
Continue to deploy visible display message/radar trailers.
Increase occupant restraint enforcement operations and include information on correct usage as well as publicity
to raise public awareness of the law and its enforcement.
Deliver safety presentations to targeted populations.
38
DISTRACTED DRIVING
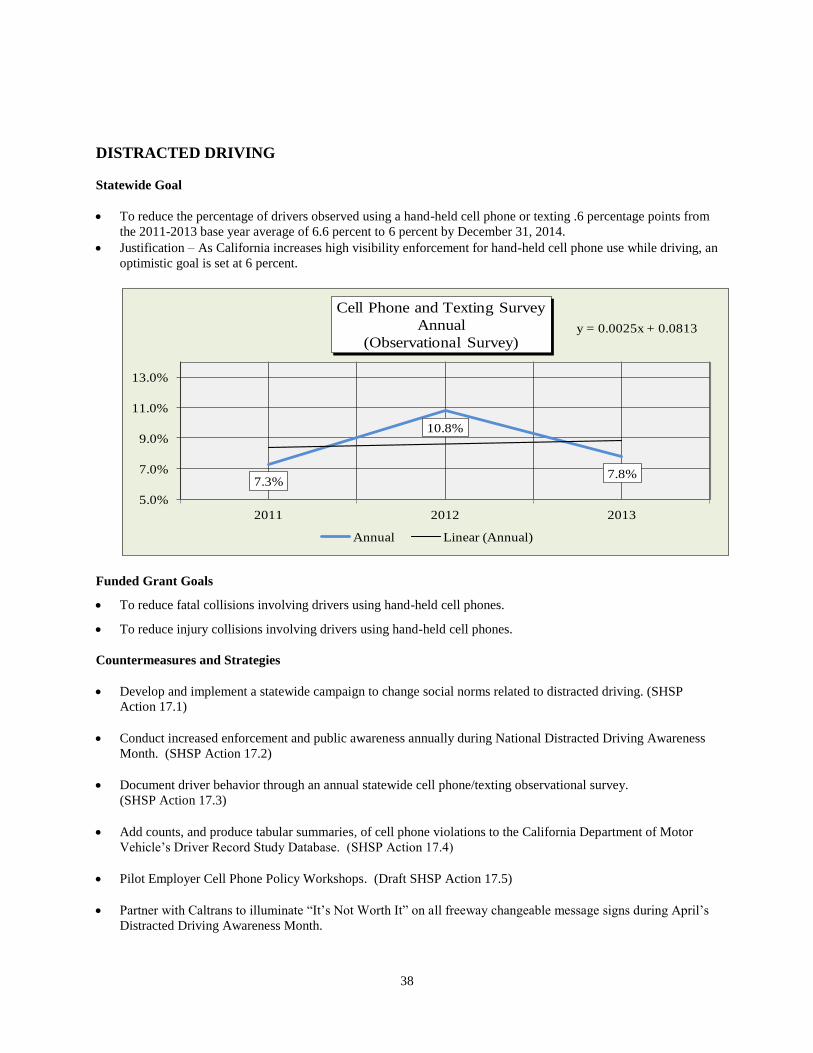
Statewide Goal
To reduce the percentage of drivers observed using a hand-held cell phone or texting .6 percentage points from
the 2011-2013 base year average of 6.6 percent to 6 percent by December 31, 2014.
Justification – As California increases high visibility enforcement for hand-held cell phone use while driving, an
optimistic goal is set at 6 percent.
Funded Grant Goals
To reduce fatal collisions involving drivers using hand-held cell phones.
To reduce injury collisions involving drivers using hand-held cell phones.
Countermeasures and Strategies
Develop and implement a statewide campaign to change social norms related to distracted driving. (SHSP
Action 17.1)
Conduct increased enforcement and public awareness annually during National Distracted Driving Awareness
Month. (SHSP Action 17.2)
Document driver behavior through an annual statewide cell phone/texting observational survey.
(SHSP Action 17.3)
Add counts, and produce tabular summaries, of cell phone violations to the California Department of Motor
Vehicle’s Driver Record Study Database. (SHSP Action 17.4)
Pilot Employer Cell Phone Policy Workshops. (Draft SHSP Action 17.5)
Partner with Caltrans to illuminate “It’s Not Worth It” on all freeway changeable message signs during April’s
Distracted Driving Awareness Month.
7.3%
10.8%
7.8%
y = 0.0025x + 0.0813
5.0%
7.0%
9.0%
11.0%
13.0%
2011 2012 2013
Cell Phone and Texting Survey
Annual
(Observational Survey)
Annual Linear (Annual)
39
Continue and create media partnerships to air Distracted Driving PSAs, present local and national stories, and
announce zero tolerance cell phone and texting enforcement.
Fund “Impact Teen Drivers” through a CHP grant that provides education to teens.
Collaborate with Network of Employers for Traffic Safety (NETS) and National Safety Council (NSC) to
promote and encourage the adoption of a model cell phone policy for public and private organizations.
Encourage the National Occupant Protection User Survey (NOPUS) to segregate cell phone observation use by
state.
Educate teens, parents, and employees not to call their family or friends when they know the recipient is driving
and to include a distracted driving message to their no answer voice mail greeting such as, I’m either driving or
away from the phone right now.” Additionally, encourage parents, caregivers, and others who drive children to
be proper role models and not use their cell phones while driving.
40
EMERGENCY MEDICAL SERVICES
Statewide Goals
To improve emergency medical services (EMS) to traffic collision victims in rural California communities by
identifying and supporting programs that facilitate the delivery of quality emergency services within the
“critical hour.”
To improve California’s emergency medical services delivery system through the replacement of outdated and
unreliable extrication equipment.
To continue to assess and improve California’s emergency medical services communications system.
Funded Grant Goal
To decrease the average response time for the arrival of appropriate equipment at collision sites in rural areas.
Countermeasures and Strategies
Provide funds for regional grants for the purchase of hydraulic and pneumatic extrication equipment.
Promote state-certified extrication training programs.
Promote partnerships to support and coordinate comprehensive and integrated injury control systems.
Promote public/private partnerships.
Promote community involvement in traffic safety.
Provide funds for advanced training in modern rescue techniques, including new car technology and the
requisite difficulties and dangers associated with airbags, hybrid vehicles, fuel cell technology and similar high-
tech automobiles and devices.
41
TRAFFIC RECORDS/ROADWAY SAFETY
Funded Grant Goals
To establish Citywide and Countywide Geographic Information Systems (GIS) and/or other Automated
Collision Analysis Systems including hardware, software and network cabling or other linking media to enable
data sharing between enforcement agencies, Departments of Public Works and other related agencies.
To ensure public works and enforcement agencies have timely access to current and complete traffic data
necessary to identify, isolate and analyze critical traffic safety issues.
To improve local traffic engineering departments’ customer service by reducing the time required to produce
and track collision reports and also by reducing by 50 percent the time that it takes to identify and analyze high
collision locations.
Countermeasures and Strategies
Incorporate recommendations from the January 2011 Traffic Records Assessment into the Strategic Plan.
Survey a sample of California drivers to determine their habits and opinions on selected traffic safety issues.
Continue funding for Speed Feedback Signs in conjunction with increased law enforcement to actively engage
motorists and apprise them of their vehicle speed and the allowable speed limit on roadways off the Federal Aid
System.
Encourage grants that involve multi-agency/multi-municipality data systems and to fund cooperative goals
including data sharing and resource and data pooling.
Increase outreach and educational efforts to reduce the number of collisions, injuries and deaths involving
motorists and workers in highway work zones.
Ensure engineering and enforcement agencies have timely access to current and complete traffic data necessary
to identify, isolate and analyze critical traffic safety issues.
Support automation grants to reduce report preparation time and to reduce the lag time between incident and
system input.
Provide timely tracking, identification, analysis and graphing of collision and citation data that is to be shared
with various departments within the city, through a GIS capable computer program.
Support the creation of a web-based viewing and analysis system that allows users to query specific SWITRS
data, interactively build maps in real time, and incorporate additional data in these maps.
Continue with enhancements to the California EMS Information System.
Continue with the obtaining and the deployment of hardware and software for a statewide automated citation
system, which will interface with all judicial jurisdictions within the state, which is capable of electronic
citation data transmissions.
Enhance the integrity of the Department of Motor Vehicles License Database.
42
PUBLIC RELATIONS, ADVERTISING AND MARKETING
OTS Goals
Continue and increase efforts to aggressively pursue successful local, regional and statewide traffic safety
media relations, public awareness and social norming campaigns that have an impact on behavioral change,
foster positive relationships, and create effective traffic safety education and outreach programs.
Include safe driving messages in all campaigns, so that incidents of traffic collisions will result in fewer injuries
and more lives saved.
Support the OTS mission of reducing traffic deaths, injuries and economic losses in all public relations,
advertising and marketing efforts.
Countermeasures and Strategies
Local and Regional media: work directly with OTS grantees in the development of media materials including
news releases, coordination of events, and specialty articles for publication – all designed to garner increased
earned media and positive public awareness of traffic safety messages. Work directly with media outlets to be
the first and primary resource for accurate, timely, and expert information on traffic safety issues.
Current Campaigns: Activities surround various campaigns, including: “Click It or Ticket,” “Drive Sober or
Get Pulled Over,” “Report Drunk Drivers – Call 911,” Holiday DUI Crackdown, Sports and Venue Marketing,
Distracted Driving and various regional “Avoid DUI” campaigns targeting the impaired driver.
Advertising/Marketing: OTS Public Affairs enlists the assistance of local, statewide and national media in anti-
DUI and anti-distracted driving campaigns and initiatives; and promotion of seat belt use. Enhance media reach
by partnering with NHTSA, CHP, Caltrans, DMV, ABC and law enforcement agencies throughout the state.
Through its Sports and Venue Marketing program, target both specific demographics and general audiences
with anti-DUI, distracted driving and occupant protection messages.
All campaigns and strategies include marketing to underserved segments of California’s population.
43
HIGHWAY SAFETY PROJECTS

44
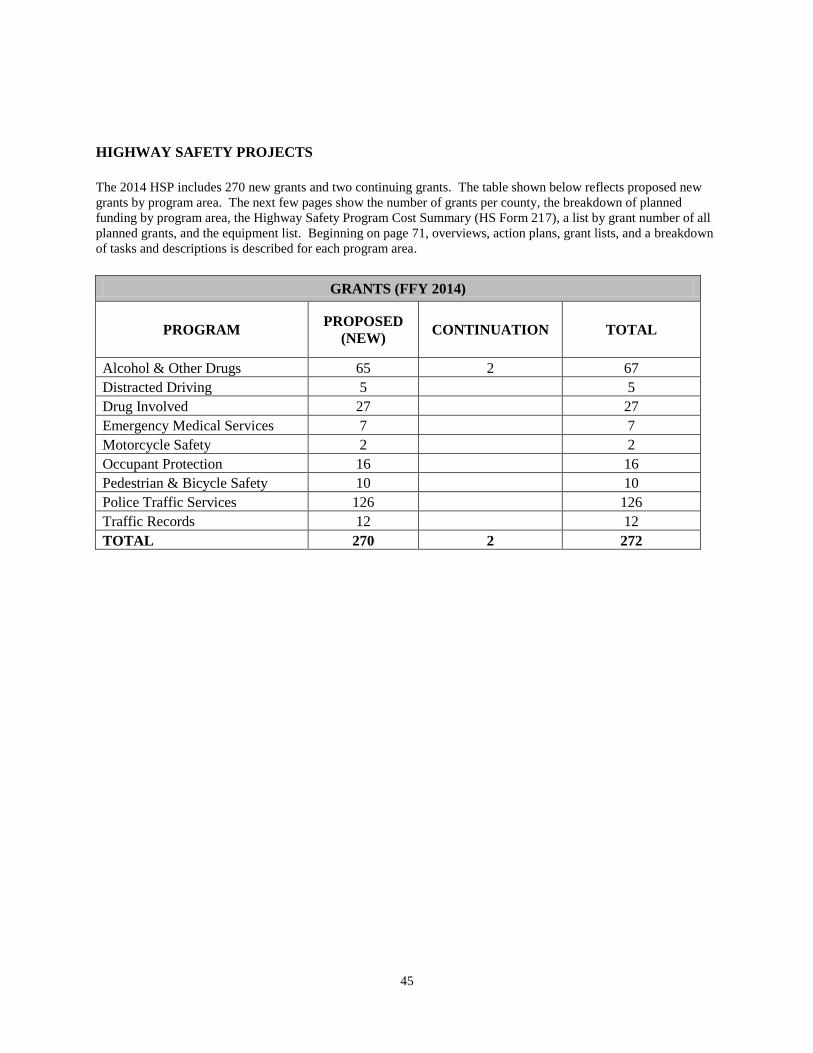
45
HIGHWAY SAFETY PROJECTS
The 2014 HSP includes 270 new grants and two continuing grants. The table shown below reflects proposed new
grants by program area. The next few pages show the number of grants per county, the breakdown of planned
funding by program area, the Highway Safety Program Cost Summary (HS Form 217), a list by grant number of all
planned grants, and the equipment list. Beginning on page 71, overviews, action plans, grant lists, and a breakdown
of tasks and descriptions is described for each program area.
GRANTS (FFY 2014)
PROGRAM PROPOSED
(NEW) CONTINUATION TOTAL
Alcohol & Other Drugs 65 2 67
Distracted Driving 5 5
Drug Involved 27 27
Emergency Medical Services 7 7
Motorcycle Safety 2 2
Occupant Protection 16 16
Pedestrian & Bicycle Safety 10 10
Police Traffic Services 126 126
Traffic Records 12 12
TOTAL 270 2 272
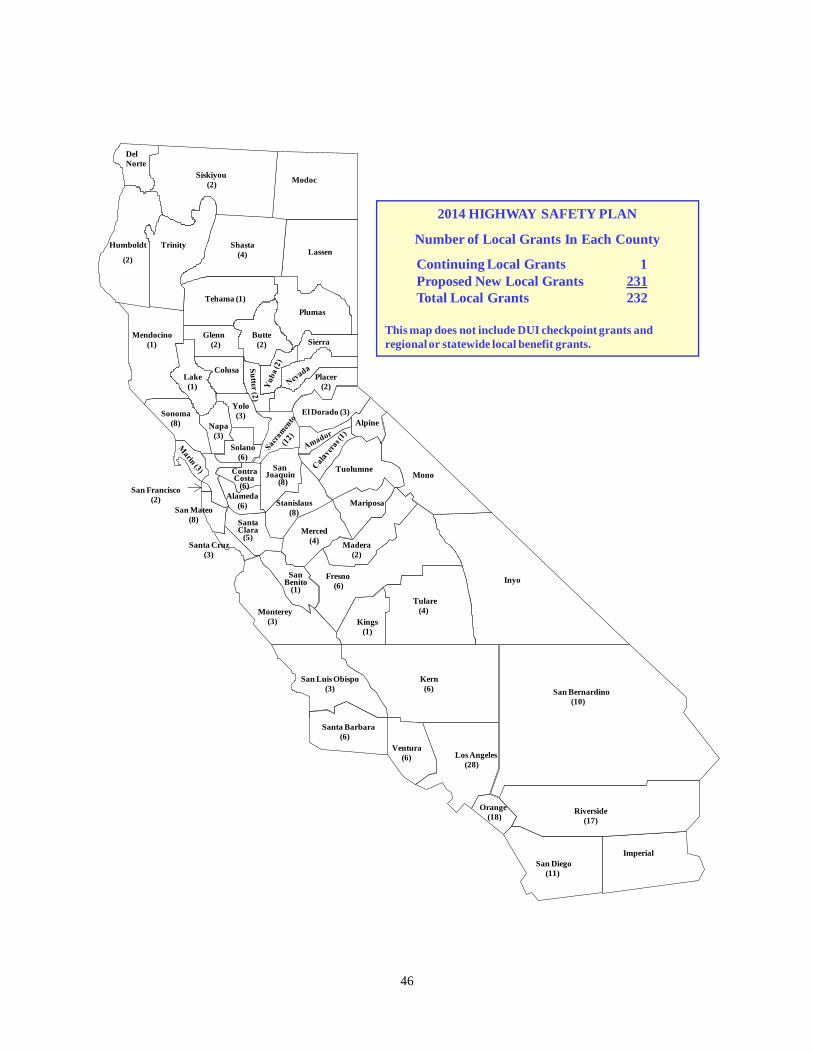
46
1
Del
Norte
Humboldt
(2)
Siskiyou
(2)Modoc
LassenShasta
(4)
Trinity
Tehama (1)
Plumas
Sierra Butte
(2)
Glenn
(2)
Placer
(2)
Colusa
Mendocino
(1)
Lake
(1)
Sonoma
(8) Napa
(3)
Yolo
(3) El Dorado (3)
Alpine
MonoTuolumneSan
Joaquin(8)
Solano
(6)
ContraCosta
(6)San Francisco
(2)
San Mateo
(8)
Santa Cruz
(3)
Alameda
(6)
SantaClara
(5)
Stanislaus
(8)
Merced
(4)
Mariposa
Madera
(2)
SanBenito
(1)
Monterey
(3)
Fresno
(6)Inyo
Kings
(1)
Tulare
(4)
Kern
(6)
San Luis Obispo
(3)
Santa Barbara
(6)
Ventura
(6) Los Angeles
(28)
San Bernardino
(10)
Riverside
(17)
Orange
(18)
San Diego
(11)
Imperial
2014 HIGHWAY SAFETY PLAN
Number of Local Grants In Each County
Continuing Local Grants 1
Proposed New Local Grants 231
Total Local Grants 232
This map does not include DUI checkpoint grants and
regional or statewide local benefit grants.
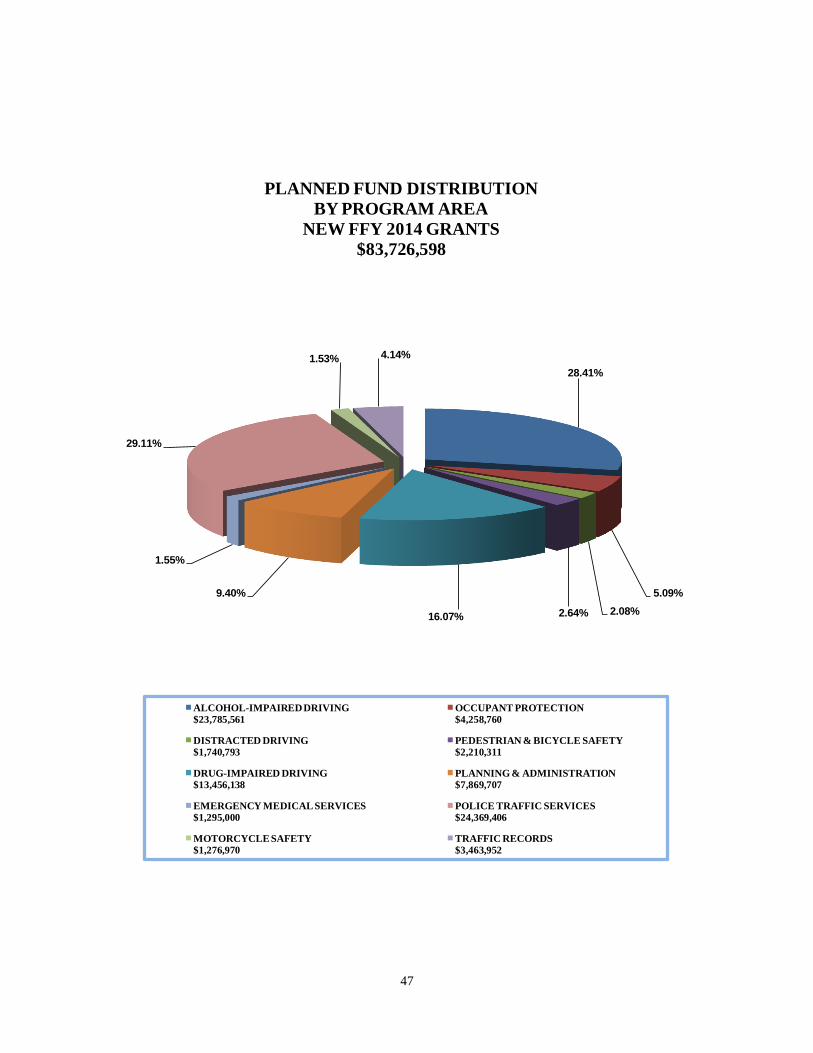
47
28.41%
5.09%
2.08%2.64%16.07%
9.40%
1.55%
29.11%
1.53% 4.14%
PLANNED FUND DISTRIBUTION
BY PROGRAM AREA
NEW FFY 2014 GRANTS
$83,726,598
ALCOHOL-IMPAIRED DRIVING
$23,785,561
OCCUPANT PROTECTION
$4,258,760
DISTRACTED DRIVING
$1,740,793
PEDESTRIAN & BICYCLE SAFETY
$2,210,311
DRUG-IMPAIRED DRIVING
$13,456,138
PLANNING & ADMINISTRATION
$7,869,707
EMERGENCY MEDICAL SERVICES
$1,295,000
POLICE TRAFFIC SERVICES
$24,369,406
MOTORCYCLE SAFETY
$1,276,970
TRAFFIC RECORDS
$3,463,952
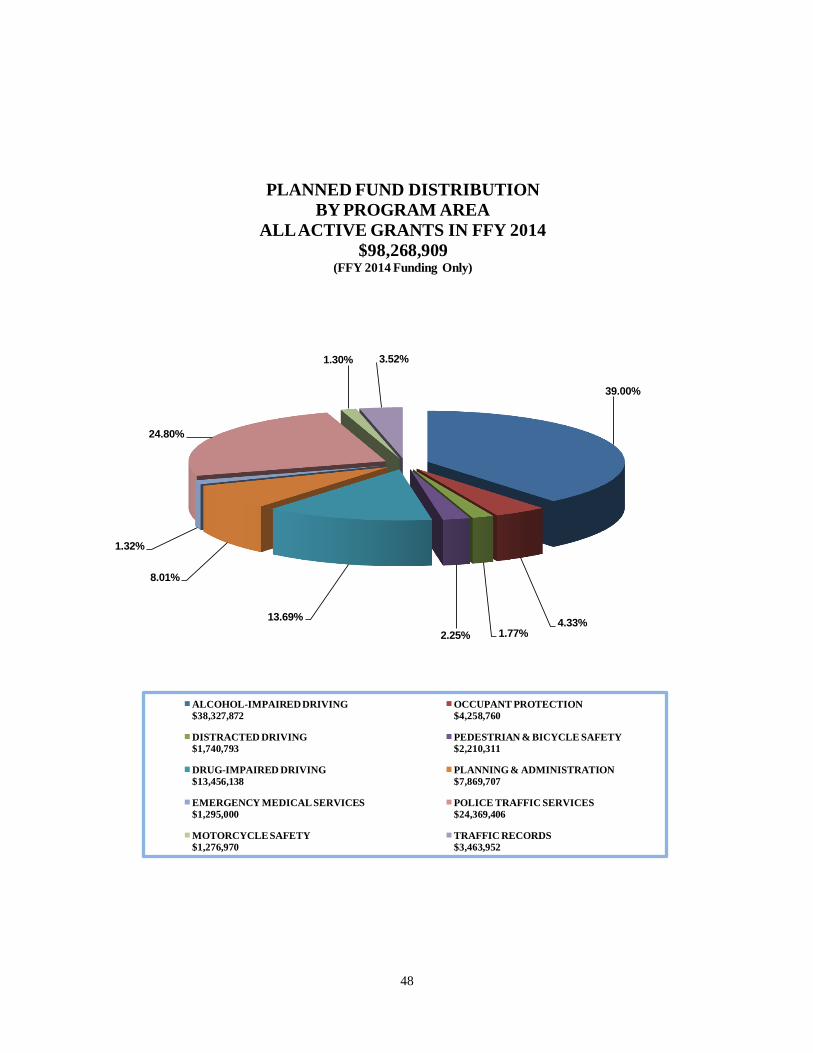
48
39.00%
4.33%1.77%2.25%
13.69%
8.01%
1.32%
24.80%
1.30% 3.52%
PLANNED FUND DISTRIBUTION
BY PROGRAM AREA
ALL ACTIVE GRANTS IN FFY 2014
$98,268,909(FFY 2014 Funding Only)
ALCOHOL-IMPAIRED DRIVING
$38,327,872
OCCUPANT PROTECTION
$4,258,760
DISTRACTED DRIVING
$1,740,793
PEDESTRIAN & BICYCLE SAFETY
$2,210,311
DRUG-IMPAIRED DRIVING
$13,456,138
PLANNING & ADMINISTRATION
$7,869,707
EMERGENCY MEDICAL SERVICES
$1,295,000
POLICE TRAFFIC SERVICES
$24,369,406
MOTORCYCLE SAFETY
$1,276,970
TRAFFIC RECORDS
$3,463,952
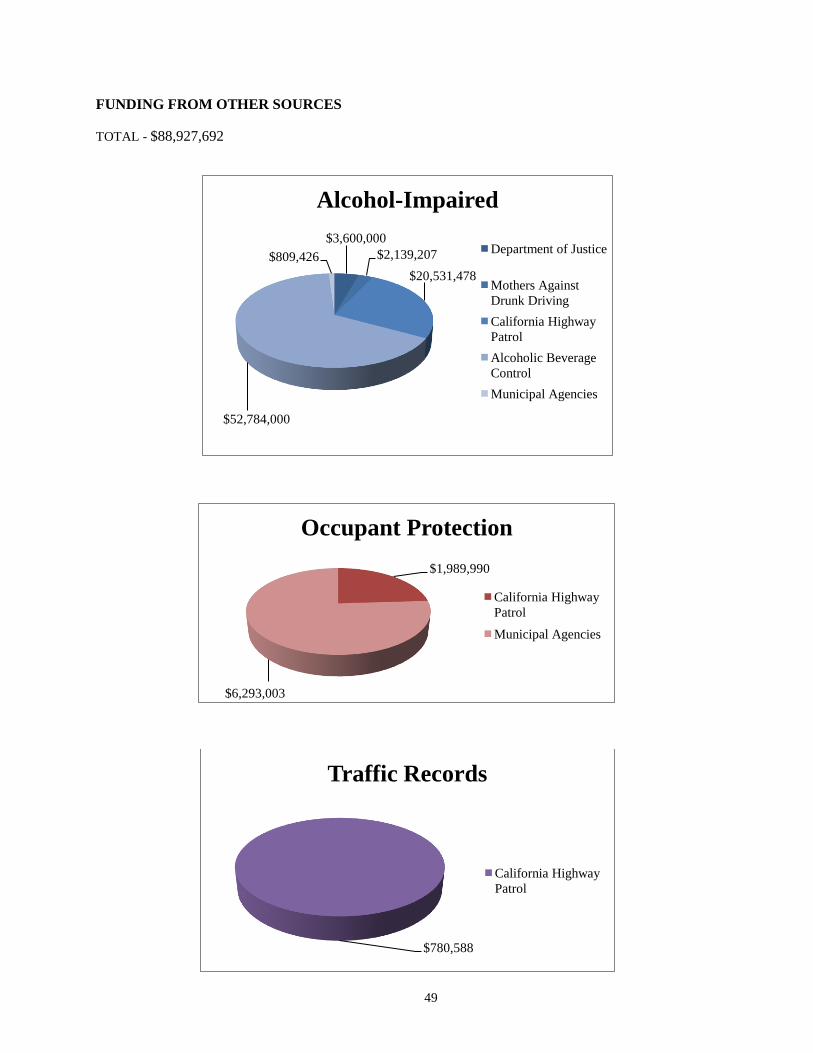
49
FUNDING FROM OTHER SOURCES
TOTAL - $88,927,692
$3,600,000
$2,139,207
$20,531,478
$52,784,000
$809,426
Alcohol-Impaired
Department of Justice
Mothers Against
Drunk Driving
California Highway
Patrol
Alcoholic Beverage
Control
Municipal Agencies
$1,989,990
$6,293,003
Occupant Protection
California Highway
Patrol
Municipal Agencies
$780,588
Traffic Records
California Highway
Patrol

50
51
PROGRAM COST SUMMARY
AND
LIST OF PROJECTS

52
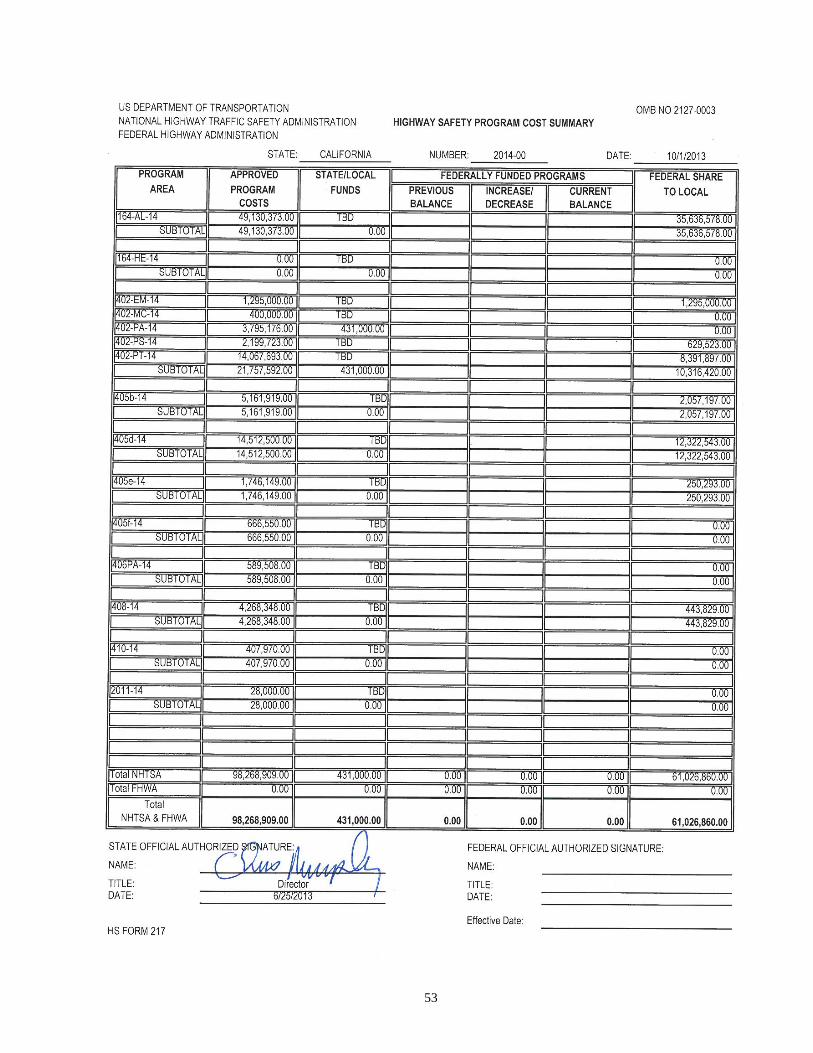
53
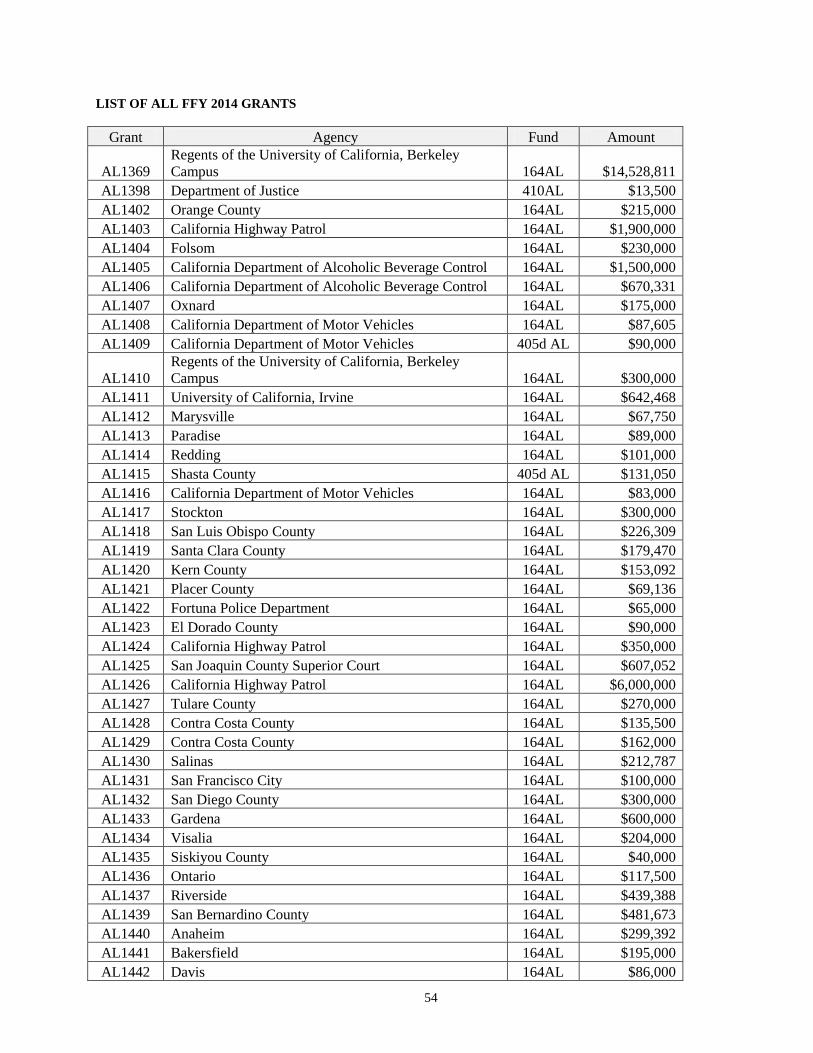
54
LIST OF ALL FFY 2014 GRANTS
Grant Agency Fund Amount
AL1369
Regents of the University of California, Berkeley
Campus 164AL $14,528,811
AL1398 Department of Justice 410AL $13,500
AL1402 Orange County 164AL $215,000
AL1403 California Highway Patrol 164AL $1,900,000
AL1404 Folsom 164AL $230,000
AL1405 California Department of Alcoholic Beverage Control 164AL $1,500,000
AL1406 California Department of Alcoholic Beverage Control 164AL $670,331
AL1407 Oxnard 164AL $175,000
AL1408 California Department of Motor Vehicles 164AL $87,605
AL1409 California Department of Motor Vehicles 405d AL $90,000
AL1410
Regents of the University of California, Berkeley
Campus 164AL $300,000
AL1411 University of California, Irvine 164AL $642,468
AL1412 Marysville 164AL $67,750
AL1413 Paradise 164AL $89,000
AL1414 Redding 164AL $101,000
AL1415 Shasta County 405d AL $131,050
AL1416 California Department of Motor Vehicles 164AL $83,000
AL1417 Stockton 164AL $300,000
AL1418 San Luis Obispo County 164AL $226,309
AL1419 Santa Clara County 164AL $179,470
AL1420 Kern County 164AL $153,092
AL1421 Placer County 164AL $69,136
AL1422 Fortuna Police Department 164AL $65,000
AL1423 El Dorado County 164AL $90,000
AL1424 California Highway Patrol 164AL $350,000
AL1425 San Joaquin County Superior Court 164AL $607,052
AL1426 California Highway Patrol 164AL $6,000,000
AL1427 Tulare County 164AL $270,000
AL1428 Contra Costa County 164AL $135,500
AL1429 Contra Costa County 164AL $162,000
AL1430 Salinas 164AL $212,787
AL1431 San Francisco City 164AL $100,000
AL1432 San Diego County 164AL $300,000
AL1433 Gardena 164AL $600,000
AL1434 Visalia 164AL $204,000
AL1435 Siskiyou County 164AL $40,000
AL1436 Ontario 164AL $117,500
AL1437 Riverside 164AL $439,388
AL1439 San Bernardino County 164AL $481,673
AL1440 Anaheim 164AL $299,392
AL1441 Bakersfield 164AL $195,000
AL1442 Davis 164AL $86,000
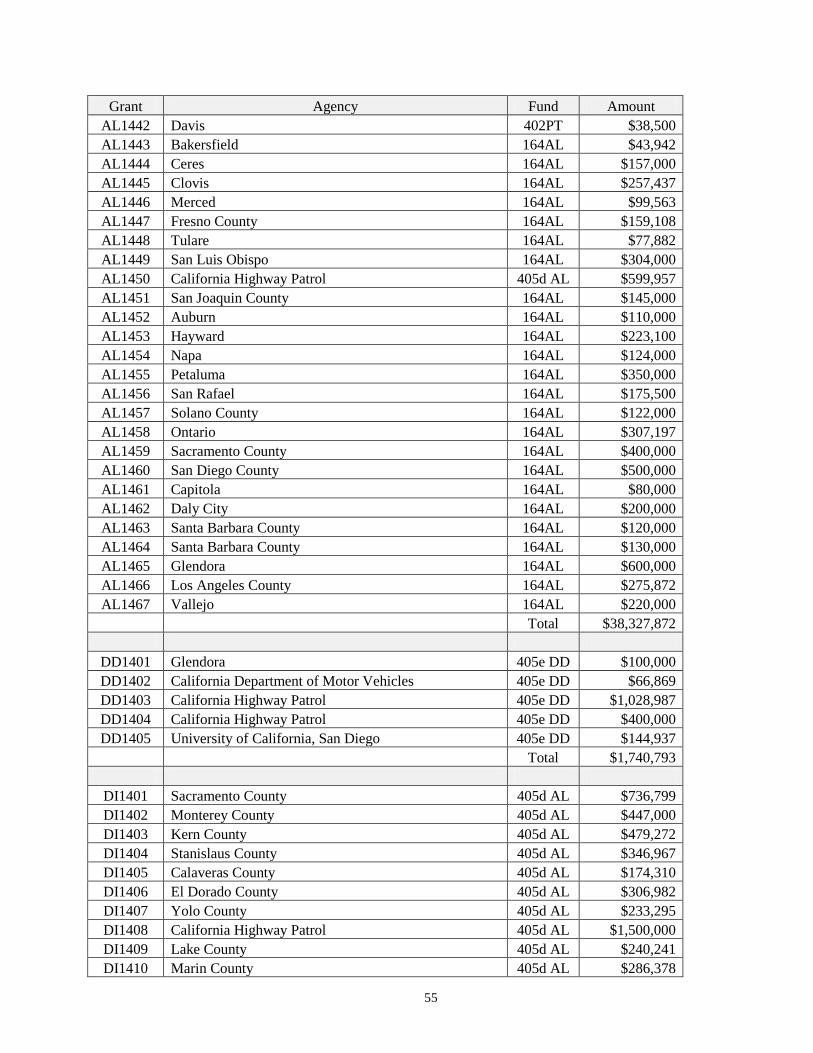
55
Grant Agency Fund Amount
AL1442 Davis 402PT $38,500
AL1443 Bakersfield 164AL $43,942
AL1444 Ceres 164AL $157,000
AL1445 Clovis 164AL $257,437
AL1446 Merced 164AL $99,563
AL1447 Fresno County 164AL $159,108
AL1448 Tulare 164AL $77,882
AL1449 San Luis Obispo 164AL $304,000
AL1450 California Highway Patrol 405d AL $599,957
AL1451 San Joaquin County 164AL $145,000
AL1452 Auburn 164AL $110,000
AL1453 Hayward 164AL $223,100
AL1454 Napa 164AL $124,000
AL1455 Petaluma 164AL $350,000
AL1456 San Rafael 164AL $175,500
AL1457 Solano County 164AL $122,000
AL1458 Ontario 164AL $307,197
AL1459 Sacramento County 164AL $400,000
AL1460 San Diego County 164AL $500,000
AL1461 Capitola 164AL $80,000
AL1462 Daly City 164AL $200,000
AL1463 Santa Barbara County 164AL $120,000
AL1464 Santa Barbara County 164AL $130,000
AL1465 Glendora 164AL $600,000
AL1466 Los Angeles County 164AL $275,872
AL1467 Vallejo 164AL $220,000
Total $38,327,872
DD1401 Glendora 405e DD $100,000
DD1402 California Department of Motor Vehicles 405e DD $66,869
DD1403 California Highway Patrol 405e DD $1,028,987
DD1404 California Highway Patrol 405e DD $400,000
DD1405 University of California, San Diego 405e DD $144,937
Total $1,740,793
DI1401 Sacramento County 405d AL $736,799
DI1402 Monterey County 405d AL $447,000
DI1403 Kern County 405d AL $479,272
DI1404 Stanislaus County 405d AL $346,967
DI1405 Calaveras County 405d AL $174,310
DI1406 El Dorado County 405d AL $306,982
DI1407 Yolo County 405d AL $233,295
DI1408 California Highway Patrol 405d AL $1,500,000
DI1409 Lake County 405d AL $240,241
DI1410 Marin County 405d AL $286,378
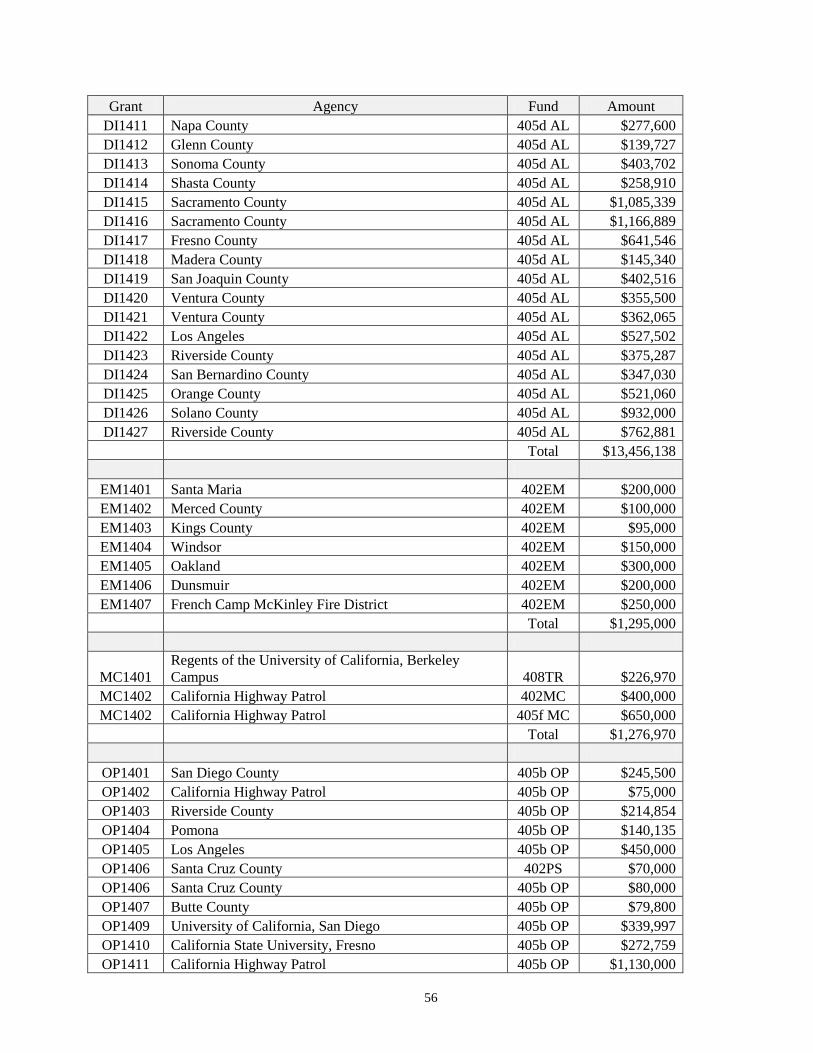
56
Grant Agency Fund Amount
DI1411 Napa County 405d AL $277,600
DI1412 Glenn County 405d AL $139,727
DI1413 Sonoma County 405d AL $403,702
DI1414 Shasta County 405d AL $258,910
DI1415 Sacramento County 405d AL $1,085,339
DI1416 Sacramento County 405d AL $1,166,889
DI1417 Fresno County 405d AL $641,546
DI1418 Madera County 405d AL $145,340
DI1419 San Joaquin County 405d AL $402,516
DI1420 Ventura County 405d AL $355,500
DI1421 Ventura County 405d AL $362,065
DI1422 Los Angeles 405d AL $527,502
DI1423 Riverside County 405d AL $375,287
DI1424 San Bernardino County 405d AL $347,030
DI1425 Orange County 405d AL $521,060
DI1426 Solano County 405d AL $932,000
DI1427 Riverside County 405d AL $762,881
Total $13,456,138
EM1401 Santa Maria 402EM $200,000
EM1402 Merced County 402EM $100,000
EM1403 Kings County 402EM $95,000
EM1404 Windsor 402EM $150,000
EM1405 Oakland 402EM $300,000
EM1406 Dunsmuir 402EM $200,000
EM1407 French Camp McKinley Fire District 402EM $250,000
Total $1,295,000
MC1401
Regents of the University of California, Berkeley
Campus 408TR $226,970
MC1402 California Highway Patrol 402MC $400,000
MC1402 California Highway Patrol 405f MC $650,000
Total $1,276,970
OP1401 San Diego County 405b OP $245,500
OP1402 California Highway Patrol 405b OP $75,000
OP1403 Riverside County 405b OP $214,854
OP1404 Pomona 405b OP $140,135
OP1405 Los Angeles 405b OP $450,000
OP1406 Santa Cruz County 402PS $70,000
OP1406 Santa Cruz County 405b OP $80,000
OP1407 Butte County 405b OP $79,800
OP1409 University of California, San Diego 405b OP $339,997
OP1410 California State University, Fresno 405b OP $272,759
OP1411 California Highway Patrol 405b OP $1,130,000
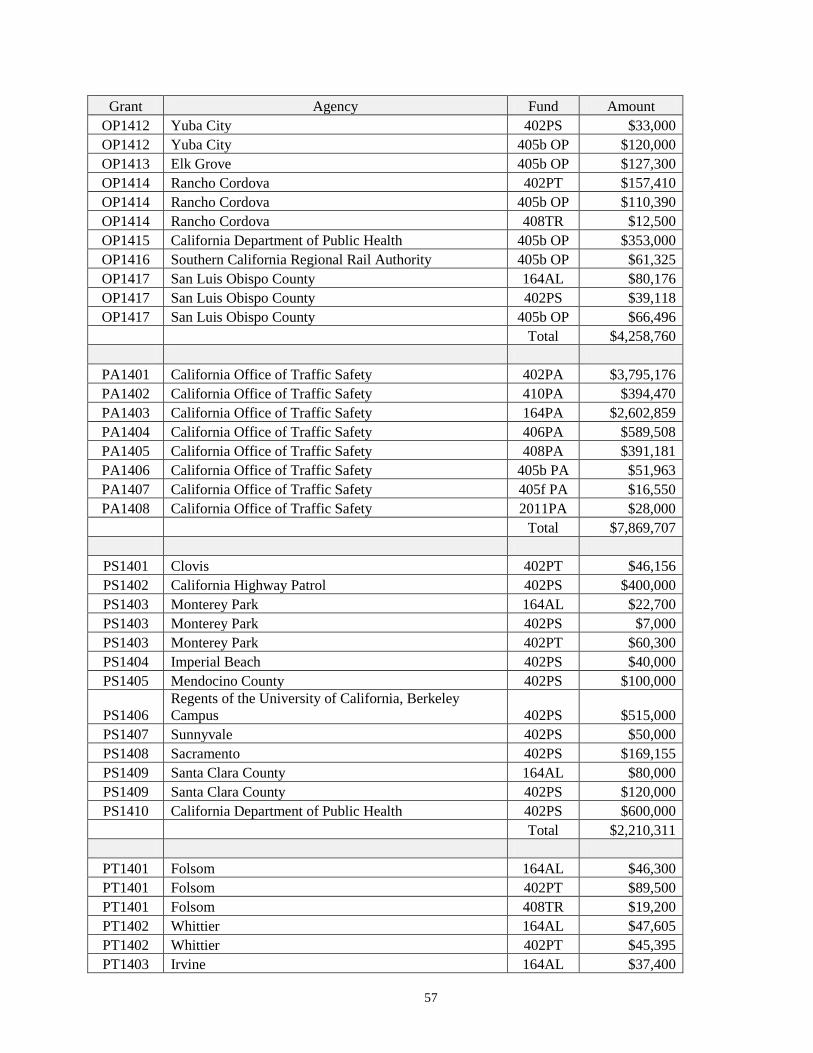
57
Grant Agency Fund Amount
OP1412 Yuba City 402PS $33,000
OP1412 Yuba City 405b OP $120,000
OP1413 Elk Grove 405b OP $127,300
OP1414 Rancho Cordova 402PT $157,410
OP1414 Rancho Cordova 405b OP $110,390
OP1414 Rancho Cordova 408TR $12,500
OP1415 California Department of Public Health 405b OP $353,000
OP1416 Southern California Regional Rail Authority 405b OP $61,325
OP1417 San Luis Obispo County 164AL $80,176
OP1417 San Luis Obispo County 402PS $39,118
OP1417 San Luis Obispo County 405b OP $66,496
Total $4,258,760
PA1401 California Office of Traffic Safety 402PA $3,795,176
PA1402 California Office of Traffic Safety 410PA $394,470
PA1403 California Office of Traffic Safety 164PA $2,602,859
PA1404 California Office of Traffic Safety 406PA $589,508
PA1405 California Office of Traffic Safety 408PA $391,181
PA1406 California Office of Traffic Safety 405b PA $51,963
PA1407 California Office of Traffic Safety 405f PA $16,550
PA1408 California Office of Traffic Safety 2011PA $28,000
Total $7,869,707
PS1401 Clovis 402PT $46,156
PS1402 California Highway Patrol 402PS $400,000
PS1403 Monterey Park 164AL $22,700
PS1403 Monterey Park 402PS $7,000
PS1403 Monterey Park 402PT $60,300
PS1404 Imperial Beach 402PS $40,000
PS1405 Mendocino County 402PS $100,000
PS1406
Regents of the University of California, Berkeley
Campus 402PS $515,000
PS1407 Sunnyvale 402PS $50,000
PS1408 Sacramento 402PS $169,155
PS1409 Santa Clara County 164AL $80,000
PS1409 Santa Clara County 402PS $120,000
PS1410 California Department of Public Health 402PS $600,000
Total $2,210,311
PT1401 Folsom 164AL $46,300
PT1401 Folsom 402PT $89,500
PT1401 Folsom 408TR $19,200
PT1402 Whittier 164AL $47,605
PT1402 Whittier 402PT $45,395
PT1403 Irvine 164AL $37,400
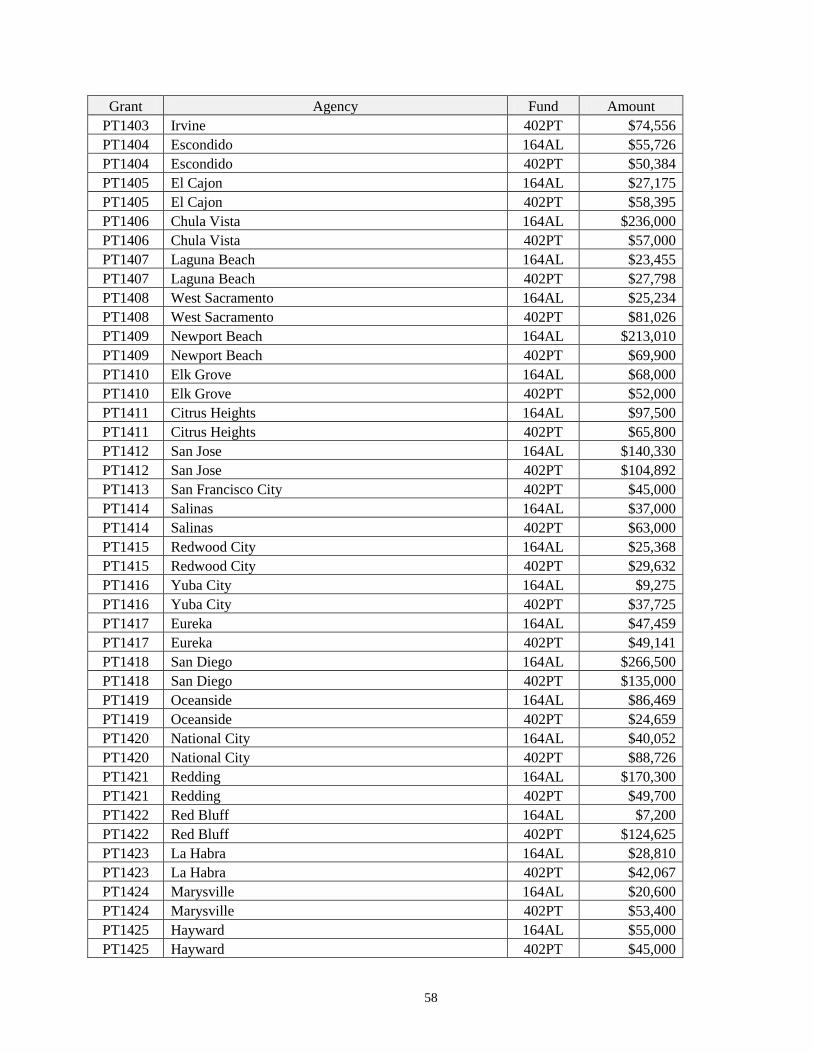
58
Grant Agency Fund Amount
PT1403 Irvine 402PT $74,556
PT1404 Escondido 164AL $55,726
PT1404 Escondido 402PT $50,384
PT1405 El Cajon 164AL $27,175
PT1405 El Cajon 402PT $58,395
PT1406 Chula Vista 164AL $236,000
PT1406 Chula Vista 402PT $57,000
PT1407 Laguna Beach 164AL $23,455
PT1407 Laguna Beach 402PT $27,798
PT1408 West Sacramento 164AL $25,234
PT1408 West Sacramento 402PT $81,026
PT1409 Newport Beach 164AL $213,010
PT1409 Newport Beach 402PT $69,900
PT1410 Elk Grove 164AL $68,000
PT1410 Elk Grove 402PT $52,000
PT1411 Citrus Heights 164AL $97,500
PT1411 Citrus Heights 402PT $65,800
PT1412 San Jose 164AL $140,330
PT1412 San Jose 402PT $104,892
PT1413 San Francisco City 402PT $45,000
PT1414 Salinas 164AL $37,000
PT1414 Salinas 402PT $63,000
PT1415 Redwood City 164AL $25,368
PT1415 Redwood City 402PT $29,632
PT1416 Yuba City 164AL $9,275
PT1416 Yuba City 402PT $37,725
PT1417 Eureka 164AL $47,459
PT1417 Eureka 402PT $49,141
PT1418 San Diego 164AL $266,500
PT1418 San Diego 402PT $135,000
PT1419 Oceanside 164AL $86,469
PT1419 Oceanside 402PT $24,659
PT1420 National City 164AL $40,052
PT1420 National City 402PT $88,726
PT1421 Redding 164AL $170,300
PT1421 Redding 402PT $49,700
PT1422 Red Bluff 164AL $7,200
PT1422 Red Bluff 402PT $124,625
PT1423 La Habra 164AL $28,810
PT1423 La Habra 402PT $42,067
PT1424 Marysville 164AL $20,600
PT1424 Marysville 402PT $53,400
PT1425 Hayward 164AL $55,000
PT1425 Hayward 402PT $45,000
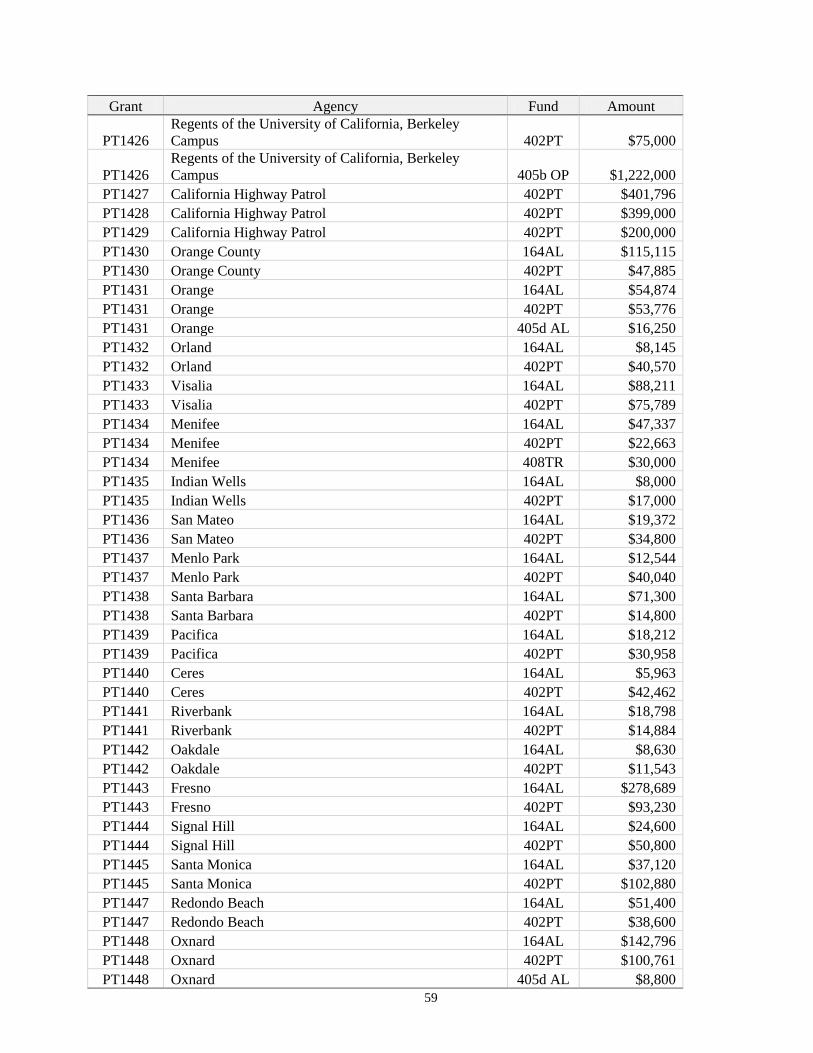
59
Grant Agency Fund Amount
PT1426
Regents of the University of California, Berkeley
Campus 402PT $75,000
PT1426
Regents of the University of California, Berkeley
Campus 405b OP $1,222,000
PT1427 California Highway Patrol 402PT $401,796
PT1428 California Highway Patrol 402PT $399,000
PT1429 California Highway Patrol 402PT $200,000
PT1430 Orange County 164AL $115,115
PT1430 Orange County 402PT $47,885
PT1431 Orange 164AL $54,874
PT1431 Orange 402PT $53,776
PT1431 Orange 405d AL $16,250
PT1432 Orland 164AL $8,145
PT1432 Orland 402PT $40,570
PT1433 Visalia 164AL $88,211
PT1433 Visalia 402PT $75,789
PT1434 Menifee 164AL $47,337
PT1434 Menifee 402PT $22,663
PT1434 Menifee 408TR $30,000
PT1435 Indian Wells 164AL $8,000
PT1435 Indian Wells 402PT $17,000
PT1436 San Mateo 164AL $19,372
PT1436 San Mateo 402PT $34,800
PT1437 Menlo Park 164AL $12,544
PT1437 Menlo Park 402PT $40,040
PT1438 Santa Barbara 164AL $71,300
PT1438 Santa Barbara 402PT $14,800
PT1439 Pacifica 164AL $18,212
PT1439 Pacifica 402PT $30,958
PT1440 Ceres 164AL $5,963
PT1440 Ceres 402PT $42,462
PT1441 Riverbank 164AL $18,798
PT1441 Riverbank 402PT $14,884
PT1442 Oakdale 164AL $8,630
PT1442 Oakdale 402PT $11,543
PT1443 Fresno 164AL $278,689
PT1443 Fresno 402PT $93,230
PT1444 Signal Hill 164AL $24,600
PT1444 Signal Hill 402PT $50,800
PT1445 Santa Monica 164AL $37,120
PT1445 Santa Monica 402PT $102,880
PT1447 Redondo Beach 164AL $51,400
PT1447 Redondo Beach 402PT $38,600
PT1448 Oxnard 164AL $142,796
PT1448 Oxnard 402PT $100,761
PT1448 Oxnard 405d AL $8,800
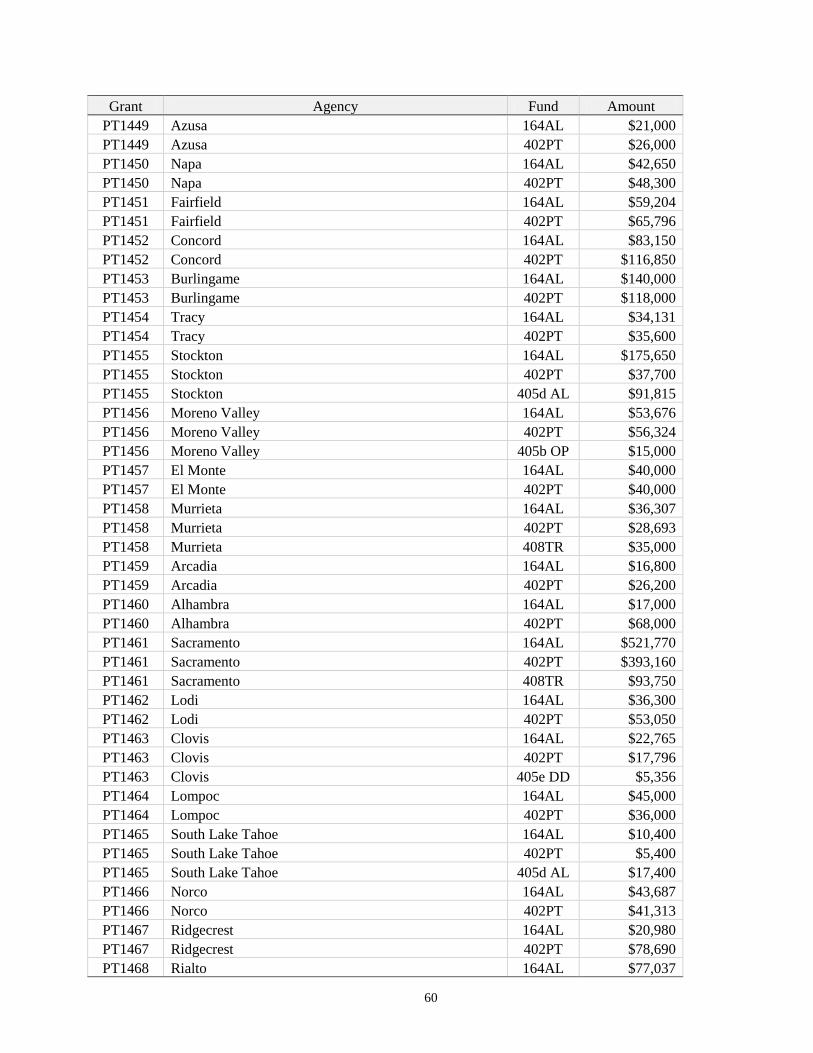
60
Grant Agency Fund Amount
PT1449 Azusa 164AL $21,000
PT1449 Azusa 402PT $26,000
PT1450 Napa 164AL $42,650
PT1450 Napa 402PT $48,300
PT1451 Fairfield 164AL $59,204
PT1451 Fairfield 402PT $65,796
PT1452 Concord 164AL $83,150
PT1452 Concord 402PT $116,850
PT1453 Burlingame 164AL $140,000
PT1453 Burlingame 402PT $118,000
PT1454 Tracy 164AL $34,131
PT1454 Tracy 402PT $35,600
PT1455 Stockton 164AL $175,650
PT1455 Stockton 402PT $37,700
PT1455 Stockton 405d AL $91,815
PT1456 Moreno Valley 164AL $53,676
PT1456 Moreno Valley 402PT $56,324
PT1456 Moreno Valley 405b OP $15,000
PT1457 El Monte 164AL $40,000
PT1457 El Monte 402PT $40,000
PT1458 Murrieta 164AL $36,307
PT1458 Murrieta 402PT $28,693
PT1458 Murrieta 408TR $35,000
PT1459 Arcadia 164AL $16,800
PT1459 Arcadia 402PT $26,200
PT1460 Alhambra 164AL $17,000
PT1460 Alhambra 402PT $68,000
PT1461 Sacramento 164AL $521,770
PT1461 Sacramento 402PT $393,160
PT1461 Sacramento 408TR $93,750
PT1462 Lodi 164AL $36,300
PT1462 Lodi 402PT $53,050
PT1463 Clovis 164AL $22,765
PT1463 Clovis 402PT $17,796
PT1463 Clovis 405e DD $5,356
PT1464 Lompoc 164AL $45,000
PT1464 Lompoc 402PT $36,000
PT1465 South Lake Tahoe 164AL $10,400
PT1465 South Lake Tahoe 402PT $5,400
PT1465 South Lake Tahoe 405d AL $17,400
PT1466 Norco 164AL $43,687
PT1466 Norco 402PT $41,313
PT1467 Ridgecrest 164AL $20,980
PT1467 Ridgecrest 402PT $78,690
PT1468 Rialto 164AL $77,037
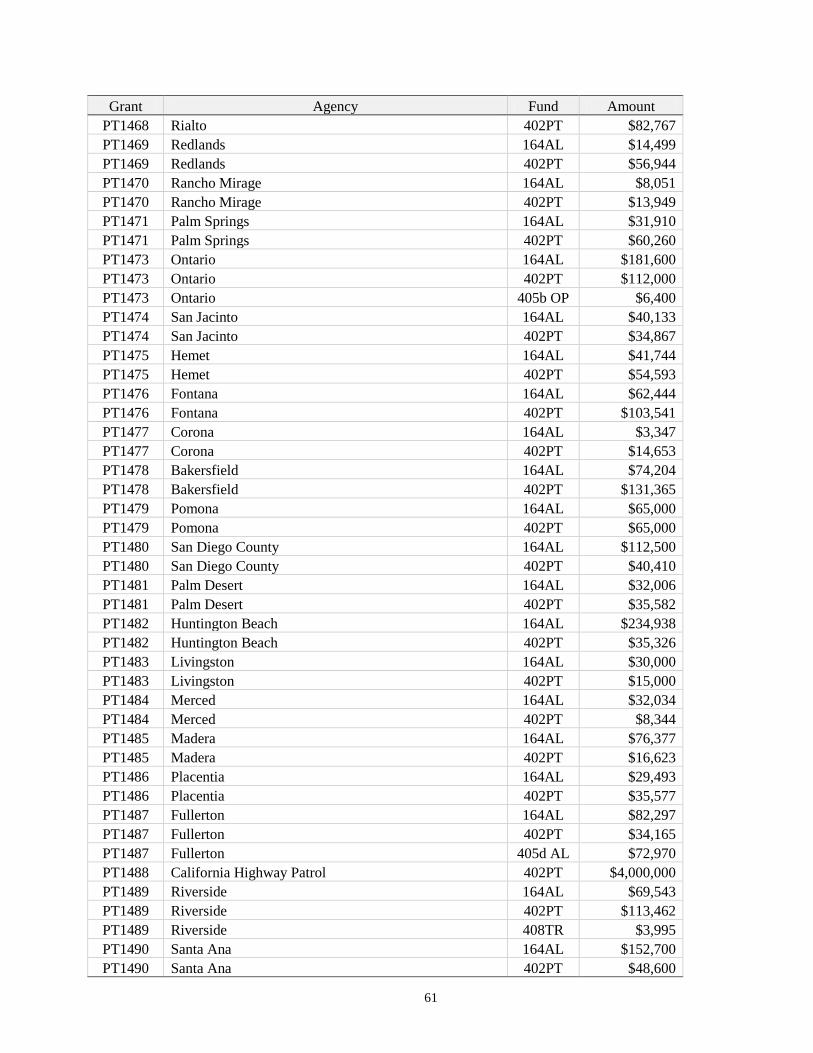
61
Grant Agency Fund Amount
PT1468 Rialto 402PT $82,767
PT1469 Redlands 164AL $14,499
PT1469 Redlands 402PT $56,944
PT1470 Rancho Mirage 164AL $8,051
PT1470 Rancho Mirage 402PT $13,949
PT1471 Palm Springs 164AL $31,910
PT1471 Palm Springs 402PT $60,260
PT1473 Ontario 164AL $181,600
PT1473 Ontario 402PT $112,000
PT1473 Ontario 405b OP $6,400
PT1474 San Jacinto 164AL $40,133
PT1474 San Jacinto 402PT $34,867
PT1475 Hemet 164AL $41,744
PT1475 Hemet 402PT $54,593
PT1476 Fontana 164AL $62,444
PT1476 Fontana 402PT $103,541
PT1477 Corona 164AL $3,347
PT1477 Corona 402PT $14,653
PT1478 Bakersfield 164AL $74,204
PT1478 Bakersfield 402PT $131,365
PT1479 Pomona 164AL $65,000
PT1479 Pomona 402PT $65,000
PT1480 San Diego County 164AL $112,500
PT1480 San Diego County 402PT $40,410
PT1481 Palm Desert 164AL $32,006
PT1481 Palm Desert 402PT $35,582
PT1482 Huntington Beach 164AL $234,938
PT1482 Huntington Beach 402PT $35,326
PT1483 Livingston 164AL $30,000
PT1483 Livingston 402PT $15,000
PT1484 Merced 164AL $32,034
PT1484 Merced 402PT $8,344
PT1485 Madera 164AL $76,377
PT1485 Madera 402PT $16,623
PT1486 Placentia 164AL $29,493
PT1486 Placentia 402PT $35,577
PT1487 Fullerton 164AL $82,297
PT1487 Fullerton 402PT $34,165
PT1487 Fullerton 405d AL $72,970
PT1488 California Highway Patrol 402PT $4,000,000
PT1489 Riverside 164AL $69,543
PT1489 Riverside 402PT $113,462
PT1489 Riverside 408TR $3,995
PT1490 Santa Ana 164AL $152,700
PT1490 Santa Ana 402PT $48,600
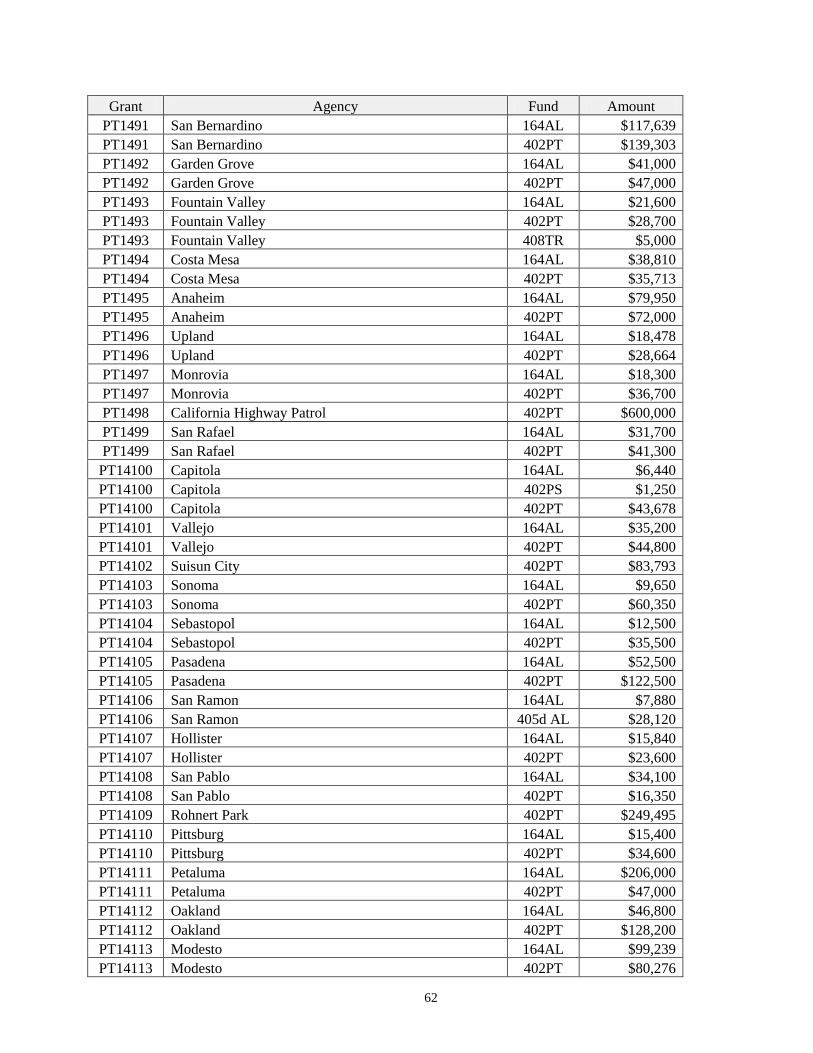
62
Grant Agency Fund Amount
PT1491 San Bernardino 164AL $117,639
PT1491 San Bernardino 402PT $139,303
PT1492 Garden Grove 164AL $41,000
PT1492 Garden Grove 402PT $47,000
PT1493 Fountain Valley 164AL $21,600
PT1493 Fountain Valley 402PT $28,700
PT1493 Fountain Valley 408TR $5,000
PT1494 Costa Mesa 164AL $38,810
PT1494 Costa Mesa 402PT $35,713
PT1495 Anaheim 164AL $79,950
PT1495 Anaheim 402PT $72,000
PT1496 Upland 164AL $18,478
PT1496 Upland 402PT $28,664
PT1497 Monrovia 164AL $18,300
PT1497 Monrovia 402PT $36,700
PT1498 California Highway Patrol 402PT $600,000
PT1499 San Rafael 164AL $31,700
PT1499 San Rafael 402PT $41,300
PT14100 Capitola 164AL $6,440
PT14100 Capitola 402PS $1,250
PT14100 Capitola 402PT $43,678
PT14101 Vallejo 164AL $35,200
PT14101 Vallejo 402PT $44,800
PT14102 Suisun City 402PT $83,793
PT14103 Sonoma 164AL $9,650
PT14103 Sonoma 402PT $60,350
PT14104 Sebastopol 164AL $12,500
PT14104 Sebastopol 402PT $35,500
PT14105 Pasadena 164AL $52,500
PT14105 Pasadena 402PT $122,500
PT14106 San Ramon 164AL $7,880
PT14106 San Ramon 405d AL $28,120
PT14107 Hollister 164AL $15,840
PT14107 Hollister 402PT $23,600
PT14108 San Pablo 164AL $34,100
PT14108 San Pablo 402PT $16,350
PT14109 Rohnert Park 402PT $249,495
PT14110 Pittsburg 164AL $15,400
PT14110 Pittsburg 402PT $34,600
PT14111 Petaluma 164AL $206,000
PT14111 Petaluma 402PT $47,000
PT14112 Oakland 164AL $46,800
PT14112 Oakland 402PT $128,200
PT14113 Modesto 164AL $99,239
PT14113 Modesto 402PT $80,276
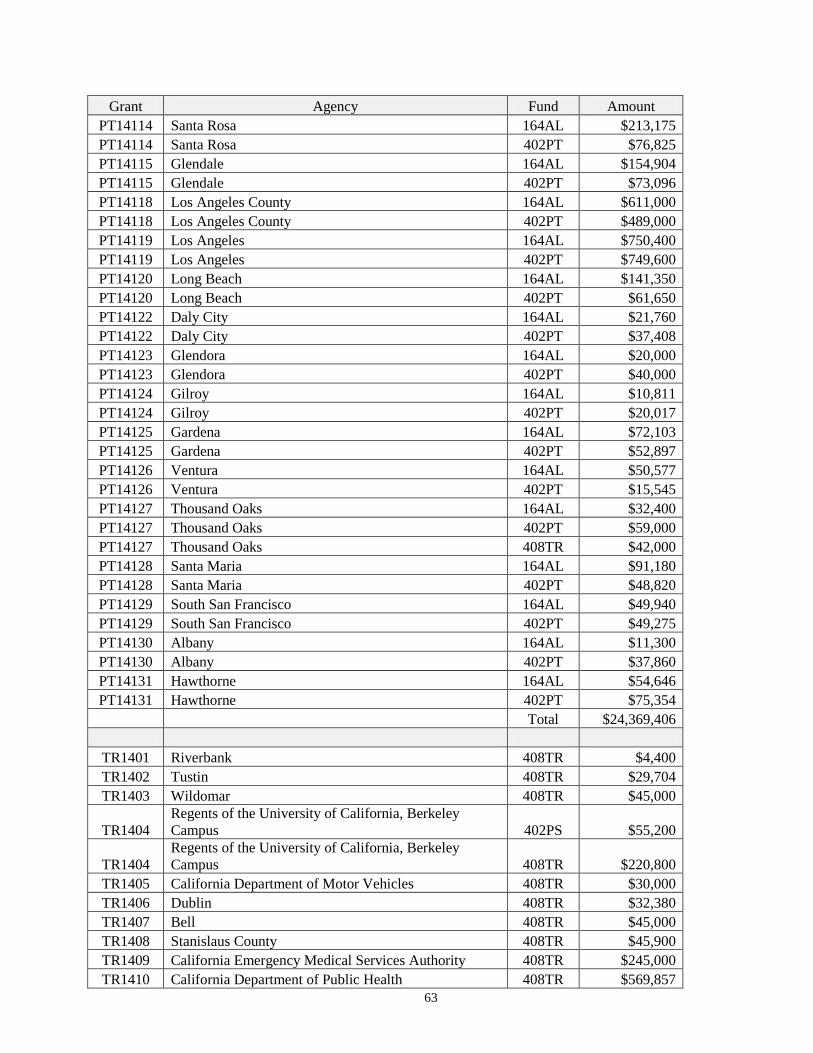
63
Grant Agency Fund Amount
PT14114 Santa Rosa 164AL $213,175
PT14114 Santa Rosa 402PT $76,825
PT14115 Glendale 164AL $154,904
PT14115 Glendale 402PT $73,096
PT14118 Los Angeles County 164AL $611,000
PT14118 Los Angeles County 402PT $489,000
PT14119 Los Angeles 164AL $750,400
PT14119 Los Angeles 402PT $749,600
PT14120 Long Beach 164AL $141,350
PT14120 Long Beach 402PT $61,650
PT14122 Daly City 164AL $21,760
PT14122 Daly City 402PT $37,408
PT14123 Glendora 164AL $20,000
PT14123 Glendora 402PT $40,000
PT14124 Gilroy 164AL $10,811
PT14124 Gilroy 402PT $20,017
PT14125 Gardena 164AL $72,103
PT14125 Gardena 402PT $52,897
PT14126 Ventura 164AL $50,577
PT14126 Ventura 402PT $15,545
PT14127 Thousand Oaks 164AL $32,400
PT14127 Thousand Oaks 402PT $59,000
PT14127 Thousand Oaks 408TR $42,000
PT14128 Santa Maria 164AL $91,180
PT14128 Santa Maria 402PT $48,820
PT14129 South San Francisco 164AL $49,940
PT14129 South San Francisco 402PT $49,275
PT14130 Albany 164AL $11,300
PT14130 Albany 402PT $37,860
PT14131 Hawthorne 164AL $54,646
PT14131 Hawthorne 402PT $75,354
Total $24,369,406
TR1401 Riverbank 408TR $4,400
TR1402 Tustin 408TR $29,704
TR1403 Wildomar 408TR $45,000
TR1404
Regents of the University of California, Berkeley
Campus 402PS $55,200
TR1404
Regents of the University of California, Berkeley
Campus 408TR $220,800
TR1405 California Department of Motor Vehicles 408TR $30,000
TR1406 Dublin 408TR $32,380
TR1407 Bell 408TR $45,000
TR1408 Stanislaus County 408TR $45,900
TR1409 California Emergency Medical Services Authority 408TR $245,000
TR1410 California Department of Public Health 408TR $569,857
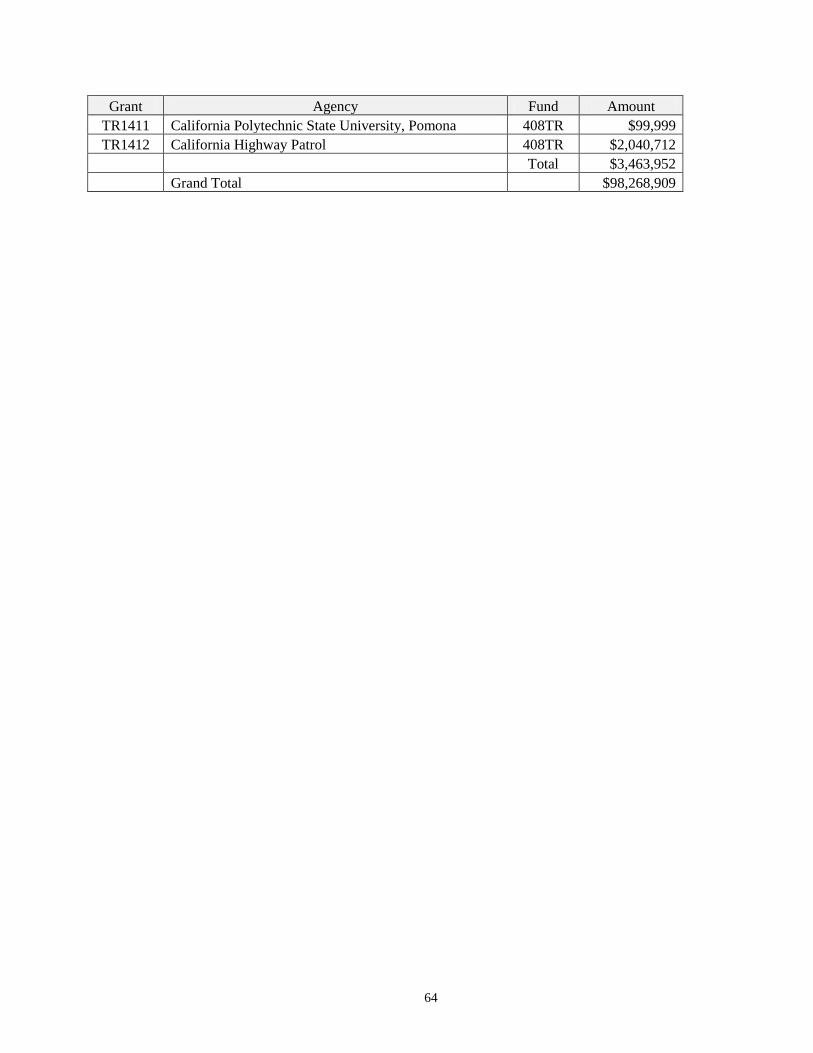
64
Grant Agency Fund Amount
TR1411 California Polytechnic State University, Pomona 408TR $99,999
TR1412 California Highway Patrol 408TR $2,040,712
Total $3,463,952
Grand Total
$98,268,909

65
EQUIPMENT LIST

66
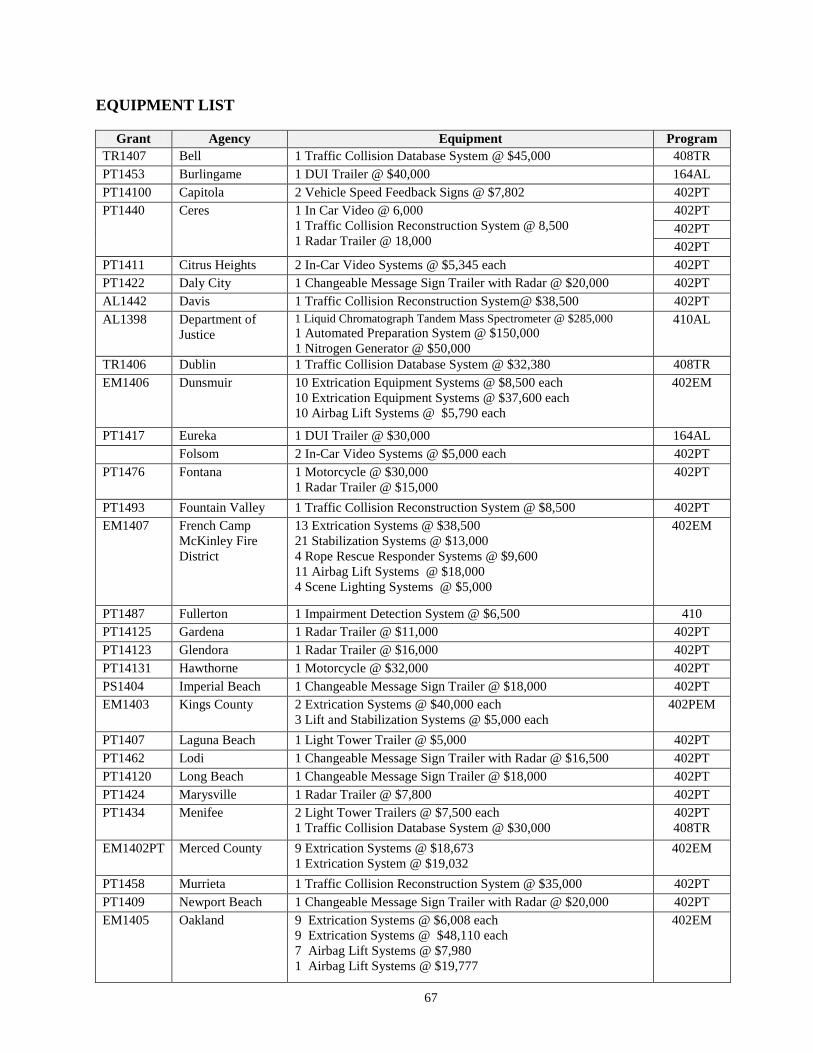
67
EQUIPMENT LIST
Grant Agency Equipment Program
TR1407 Bell 1 Traffic Collision Database System @ $45,000 408TR
PT1453 Burlingame 1 DUI Trailer @ $40,000 164AL
PT14100 Capitola 2 Vehicle Speed Feedback Signs @ $7,802 402PT
PT1440 Ceres 1 In Car Video @ 6,000
1 Traffic Collision Reconstruction System @ 8,500
1 Radar Trailer @ 18,000
402PT
402PT
402PT
PT1411 Citrus Heights 2 In-Car Video Systems @ $5,345 each 402PT
PT1422 Daly City 1 Changeable Message Sign Trailer with Radar @ $20,000 402PT
AL1442 Davis 1 Traffic Collision Reconstruction System@ $38,500 402PT
AL1398 Department of
Justice
1 Liquid Chromatograph Tandem Mass Spectrometer @ $285,000
1 Automated Preparation System @ $150,000
1 Nitrogen Generator @ $50,000
410AL
TR1406 Dublin 1 Traffic Collision Database System @ $32,380 408TR
EM1406 Dunsmuir 10 Extrication Equipment Systems @ $8,500 each
10 Extrication Equipment Systems @ $37,600 each
10 Airbag Lift Systems @ $5,790 each
402EM
PT1417 Eureka 1 DUI Trailer @ $30,000 164AL
Folsom 2 In-Car Video Systems @ $5,000 each 402PT
PT1476 Fontana 1 Motorcycle @ $30,000
1 Radar Trailer @ $15,000
402PT
PT1493 Fountain Valley 1 Traffic Collision Reconstruction System @ $8,500 402PT
EM1407 French Camp
McKinley Fire
District
13 Extrication Systems @ $38,500
21 Stabilization Systems @ $13,000
4 Rope Rescue Responder Systems @ $9,600
11 Airbag Lift Systems @ $18,000
4 Scene Lighting Systems @ $5,000
402EM
PT1487 Fullerton 1 Impairment Detection System @ $6,500 410
PT14125 Gardena 1 Radar Trailer @ $11,000 402PT
PT14123 Glendora 1 Radar Trailer @ $16,000 402PT
PT14131 Hawthorne 1 Motorcycle @ $32,000 402PT
PS1404 Imperial Beach 1 Changeable Message Sign Trailer @ $18,000 402PT
EM1403 Kings County 2 Extrication Systems @ $40,000 each
3 Lift and Stabilization Systems @ $5,000 each
402PEM
PT1407 Laguna Beach 1 Light Tower Trailer @ $5,000 402PT
PT1462 Lodi 1 Changeable Message Sign Trailer with Radar @ $16,500 402PT
PT14120 Long Beach 1 Changeable Message Sign Trailer @ $18,000 402PT
PT1424 Marysville 1 Radar Trailer @ $7,800 402PT
PT1434 Menifee 2 Light Tower Trailers @ $7,500 each
1 Traffic Collision Database System @ $30,000
402PT
408TR
EM1402PT Merced County 9 Extrication Systems @ $18,673
1 Extrication System @ $19,032
402EM
PT1458 Murrieta 1 Traffic Collision Reconstruction System @ $35,000 402PT
PT1409 Newport Beach 1 Changeable Message Sign Trailer with Radar @ $20,000 402PT
EM1405 Oakland 9 Extrication Systems @ $6,008 each
9 Extrication Systems @ $48,110 each
7 Airbag Lift Systems @ $7,980
1 Airbag Lift Systems @ $19,777
402EM
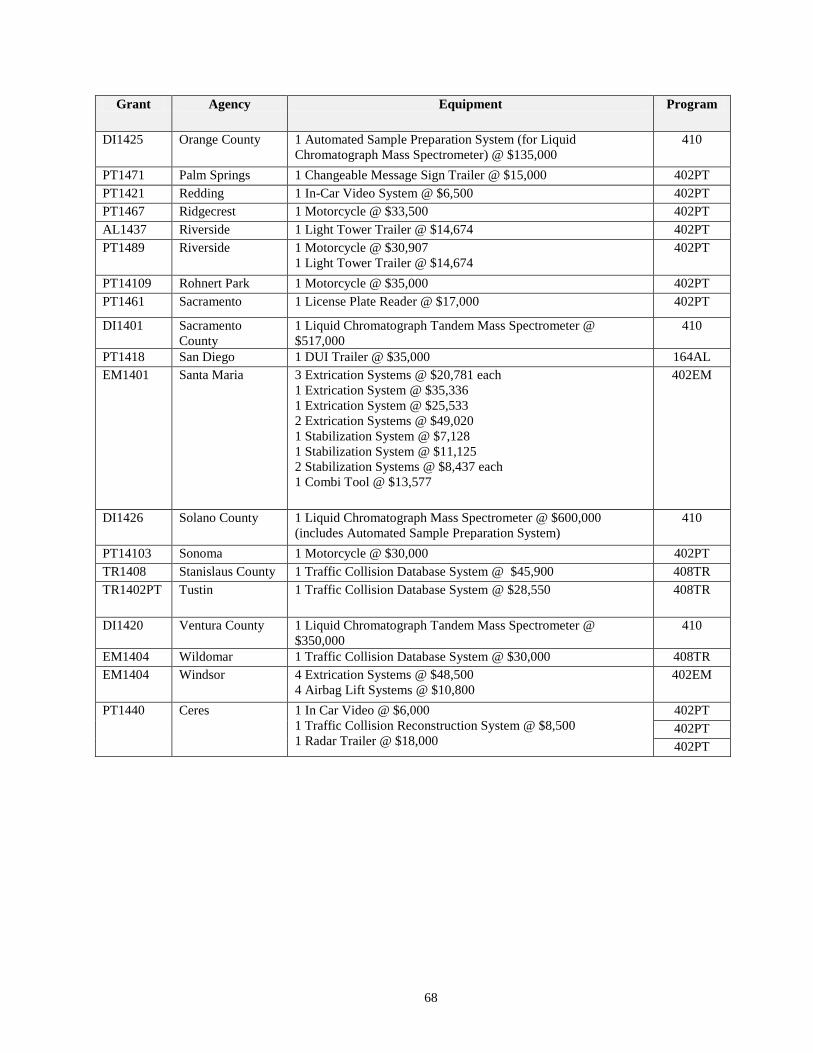
68
Grant Agency Equipment Program
DI1425 Orange County 1 Automated Sample Preparation System (for Liquid
Chromatograph Mass Spectrometer) @ $135,000
410
PT1471 Palm Springs 1 Changeable Message Sign Trailer @ $15,000 402PT
PT1421 Redding 1 In-Car Video System @ $6,500 402PT
PT1467 Ridgecrest 1 Motorcycle @ $33,500 402PT
AL1437 Riverside 1 Light Tower Trailer @ $14,674 402PT
PT1489 Riverside 1 Motorcycle @ $30,907
1 Light Tower Trailer @ $14,674
402PT
PT14109 Rohnert Park 1 Motorcycle @ $35,000 402PT
PT1461 Sacramento 1 License Plate Reader @ $17,000 402PT
DI1401 Sacramento
County
1 Liquid Chromatograph Tandem Mass Spectrometer @
$517,000
410
PT1418 San Diego 1 DUI Trailer @ $35,000 164AL
EM1401 Santa Maria 3 Extrication Systems @ $20,781 each
1 Extrication System @ $35,336
1 Extrication System @ $25,533
2 Extrication Systems @ $49,020
1 Stabilization System @ $7,128
1 Stabilization System @ $11,125
2 Stabilization Systems @ $8,437 each
1 Combi Tool @ $13,577
402EM
DI1426 Solano County 1 Liquid Chromatograph Mass Spectrometer @ $600,000
(includes Automated Sample Preparation System)
410
PT14103 Sonoma 1 Motorcycle @ $30,000 402PT
TR1408 Stanislaus County 1 Traffic Collision Database System @ $45,900 408TR
TR1402PT Tustin 1 Traffic Collision Database System @ $28,550 408TR
DI1420 Ventura County 1 Liquid Chromatograph Tandem Mass Spectrometer @
$350,000
410
EM1404 Wildomar 1 Traffic Collision Database System @ $30,000 408TR
EM1404 Windsor 4 Extrication Systems @ $48,500
4 Airbag Lift Systems @ $10,800
402EM
PT1440 Ceres 1 In Car Video @ $6,000
1 Traffic Collision Reconstruction System @ $8,500
1 Radar Trailer @ $18,000
402PT
402PT
402PT
69
GRANTS BY
PROGRAM AREA

70
71
PROGRAM PLANNING AND ADMINISTRATION
PROGRAM OVERVIEW
The Planning and Administration program area includes those activities and costs necessary for the overall management and
operations of OTS. These activities include:
Identifying the state's most significant traffic safety problems.
Prioritizing problems and developing methods for the distribution of funds.
Developing the annual Highway Safety Plan (HSP).
Recommending individual grants to be funded.
Developing planned grants.
Monitoring grants.
Evaluating accomplishments.
Preparing a variety of program and grant reports.
Conducting Grantee Performance Reviews.
Contracting with the Department of Finance to conduct grantee compliance audits.
Increasing public awareness and community support.
Participating in SHSP challenge team meetings, various traffic safety committees, and task forces.
Generally promoting and coordinating traffic safety in California.
Hosting the Governors Highway Safety Association’s Annual Meeting.
Planning and conducting the OTS Leadership and Training Seminar every other year.
Creating public awareness campaigns and providing staff and spokespersons for all annual national campaigns, e.g.,
Child Passenger Safety Week; Drunk Driving, Over the Limit, Under Arrest, etc.
Providing regional fiscal and operations trainings to all applicable grant personnel annually.
Conducting workshops on OTS grant funding to several different conferences each year.
Current Status
OTS includes a staff of 32 full-time positions and two retired annuitants responsible for the activities listed previously. The
Director is responsible for the entire California program and serves as the Governor's Highway Safety Representative. As the
Governor's Representative, the OTS Director participates in activities impacting the highway safety program nationwide.
The Operations Division develops the HSP and is responsible for the implementation of the grants with both state and local
entities. In addition, activities within the various program areas are administered through this division. The Administration
and Program Support Division encompasses fiscal, business services, and clerical support. The Information Technology
Division provides information technology services and support.
72
Training
Training needs are identified to improve overall staff skills needed in the day-to-day operations of the office. A training
matrix was developed to identify available trainings to specific job duties. Managers use this matrix as a staff development
tool. In addition, there is a demand for program specific training for various traffic safety professionals throughout the state.
Program specific training has enhanced the abilities of traffic safety professionals to conduct exemplary programs furthering
the cause of traffic safety in California. Examples of some of the training programs include:
Highway Safety Program Management -. This training course provided by the Transportation Safety Institute in
Oklahoma would provide vital training to new regional coordinators on planning, managing, and evaluation of
traffic safety programs. The program covers a vast array of timely issues including enforcement, legislation,
partnerships, deterrence, occupant protection, impaired driving, motorcycle, & speed with emphasis on research and
best practices.
Pedestrian Management Training - This course will enable pedestrian safety program managers to better develop,
facilitate and support comprehensive pedestrian safety programs to reduce pedestrian crashes and create more
walkable communities.
Skills Building Workshops - Various brief workshop sessions designed to build skills may be scheduled. These may
include writing, team building, analyst skills, contracting, presentation skills, etc. Attendance at these workshops
will result in improved job performance.
Computer Training Courses - Courses designed to provide OTS staff with the knowledge necessary to operate the
software programs installed on our computer system. Attendance at the courses will increase knowledge in
operating skills for all users and provide the system administrator and backup administrator with the skills to
maintain and support the computer system.
Program and Grant Specific Workshops/Seminars - A number of program specific training sessions are supported or
planned by OTS staff and occasionally included in individual local programs. Various workshops and seminars will
be conducted for grantee agencies in the OTS regions on grant specific information.
Goals and Performance Measures
It is the goal of the Planning and Administration program to provide the management, supervision and support services for
the activities necessary to operate the traffic safety program in the State of California. The performance measures to support
this goal include:
To develop a coordinated HSP/Performance Plan to submit to CSTA Acting Secretary by June 1, 2013, and to
NHTSA by July 1, 2013.
To provide documentation on qualifications for special funded incentive programs.
To develop, coordinate, monitor and administratively evaluate traffic safety grants identified in the Plan.
To submit the Annual Performance Report to the CSTA Secretary by December 1, 2013.
To utilize all available means for improving and promoting the California traffic safety program.
TASKS
Task 1 - Operation of the Program
Costs included in this program area include the salaries of the Governor's Highway Safety Representative, management,
fiscal and clerical support personnel, and most operating costs. That portion of all other OTS personnel salaries, as well as
certain operating expenses directly related to program development, coordination, monitoring, evaluation and auditing are
charged to the appropriate program area.
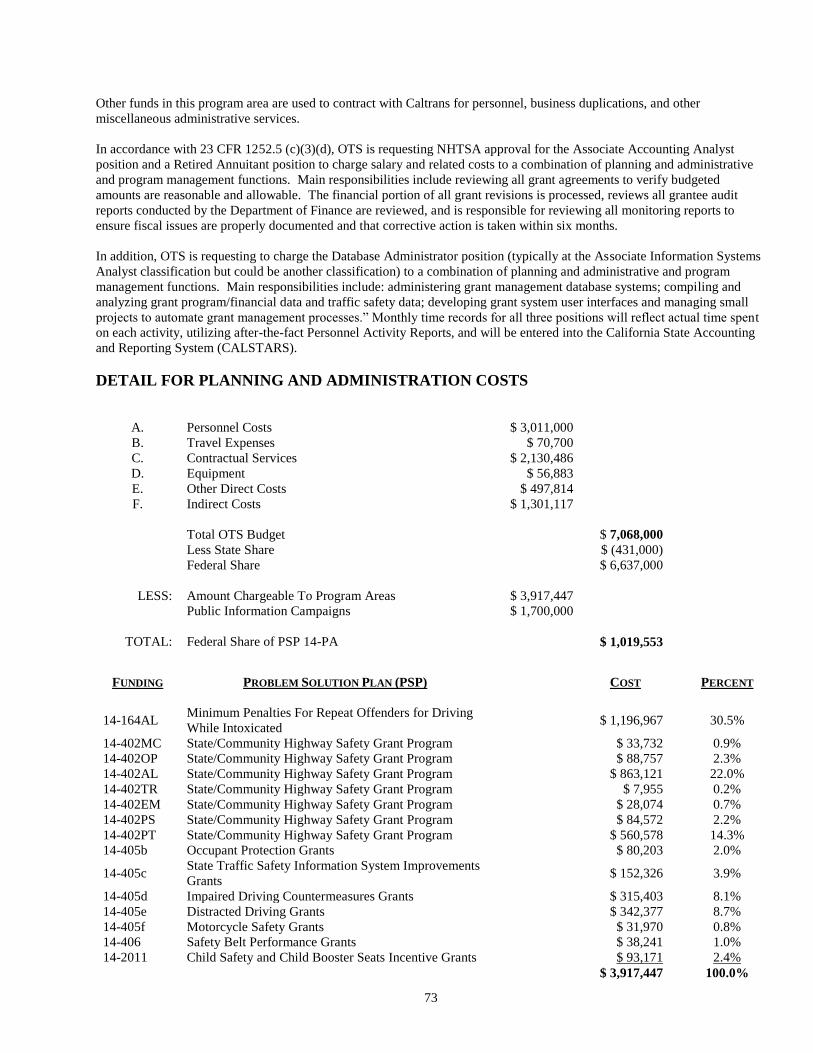
73
Other funds in this program area are used to contract with Caltrans for personnel, business duplications, and other
miscellaneous administrative services.
In accordance with 23 CFR 1252.5 (c)(3)(d), OTS is requesting NHTSA approval for the Associate Accounting Analyst
position and a Retired Annuitant position to charge salary and related costs to a combination of planning and administrative
and program management functions. Main responsibilities include reviewing all grant agreements to verify budgeted
amounts are reasonable and allowable. The financial portion of all grant revisions is processed, reviews all grantee audit
reports conducted by the Department of Finance are reviewed, and is responsible for reviewing all monitoring reports to
ensure fiscal issues are properly documented and that corrective action is taken within six months.
In addition, OTS is requesting to charge the Database Administrator position (typically at the Associate Information Systems
Analyst classification but could be another classification) to a combination of planning and administrative and program
management functions. Main responsibilities include: administering grant management database systems; compiling and
analyzing grant program/financial data and traffic safety data; developing grant system user interfaces and managing small
projects to automate grant management processes.” Monthly time records for all three positions will reflect actual time spent
on each activity, utilizing after-the-fact Personnel Activity Reports, and will be entered into the California State Accounting
and Reporting System (CALSTARS).
DETAIL FOR PLANNING AND ADMINISTRATION COSTS
A. Personnel Costs $ 3,011,000
B. Travel Expenses $ 70,700
C. Contractual Services $ 2,130,486
D. Equipment $ 56,883
E. Other Direct Costs $ 497,814
F. Indirect Costs $ 1,301,117
Total OTS Budget
$ 7,068,000
Less State Share
$ (431,000)
Federal Share
$ 6,637,000
LESS: Amount Chargeable To Program Areas $ 3,917,447
Public Information Campaigns $ 1,700,000
TOTAL: Federal Share of PSP 14-PA
$ 1,019,553
FUNDING PROBLEM SOLUTION PLAN (PSP)
COST PERCENT
14-164AL Minimum Penalties For Repeat Offenders for Driving
While Intoxicated $ 1,196,967
30.5%
14-402MC State/Community Highway Safety Grant Program
$ 33,732 0.9%
14-402OP State/Community Highway Safety Grant Program
$ 88,757 2.3%
14-402AL State/Community Highway Safety Grant Program
$ 863,121 22.0%
14-402TR State/Community Highway Safety Grant Program
$ 7,955 0.2%
14-402EM State/Community Highway Safety Grant Program
$ 28,074 0.7%
14-402PS State/Community Highway Safety Grant Program
$ 84,572 2.2%
14-402PT State/Community Highway Safety Grant Program
$ 560,578 14.3%
14-405b Occupant Protection Grants
$ 80,203 2.0%
14-405c State Traffic Safety Information System Improvements
Grants $ 152,326
3.9%
14-405d Impaired Driving Countermeasures Grants
$ 315,403 8.1%
14-405e Distracted Driving Grants
$ 342,377 8.7%
14-405f Motorcycle Safety Grants
$ 31,970 0.8%
14-406 Safety Belt Performance Grants
$ 38,241 1.0%
14-2011 Child Safety and Child Booster Seats Incentive Grants
$ 93,171 2.4%
$ 3,917,447 100.0%
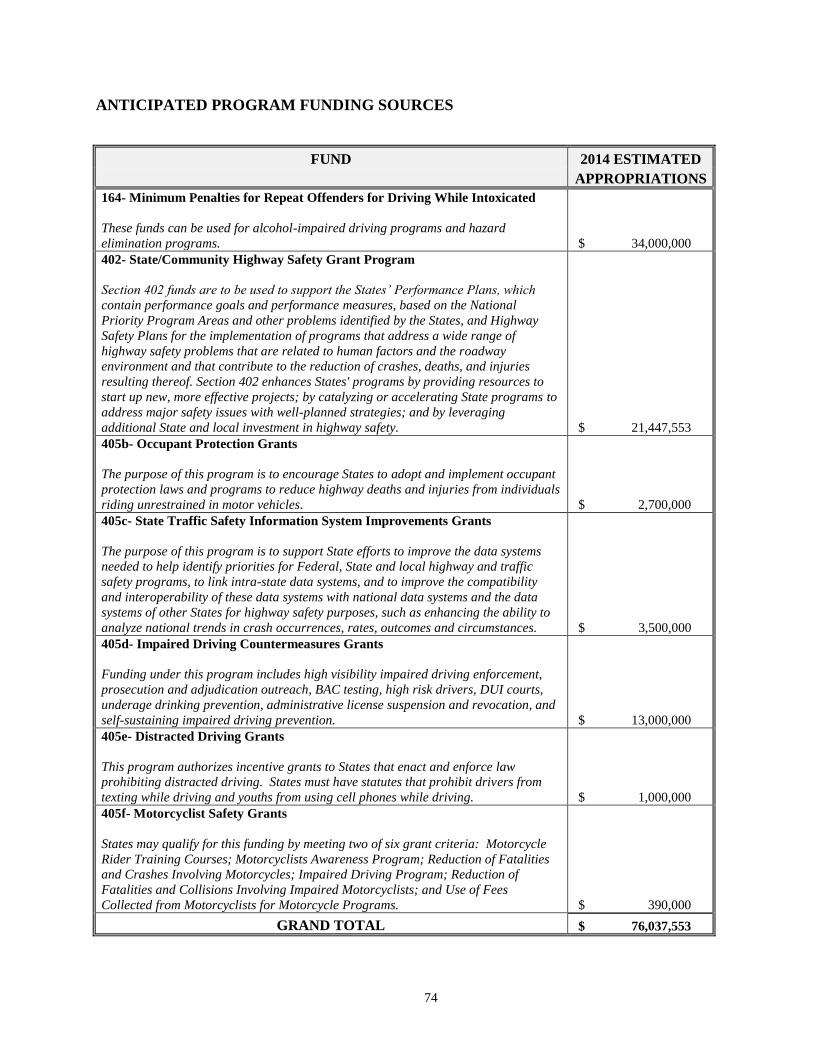
74
ANTICIPATED PROGRAM FUNDING SOURCES
FUND 2014 ESTIMATED
APPROPRIATIONS
164- Minimum Penalties for Repeat Offenders for Driving While Intoxicated
These funds can be used for alcohol-impaired driving programs and hazard
elimination programs. $ 34,000,000
402- State/Community Highway Safety Grant Program
Section 402 funds are to be used to support the States’ Performance Plans, which
contain performance goals and performance measures, based on the National
Priority Program Areas and other problems identified by the States, and Highway
Safety Plans for the implementation of programs that address a wide range of
highway safety problems that are related to human factors and the roadway
environment and that contribute to the reduction of crashes, deaths, and injuries
resulting thereof. Section 402 enhances States' programs by providing resources to
start up new, more effective projects; by catalyzing or accelerating State programs to
address major safety issues with well-planned strategies; and by leveraging
additional State and local investment in highway safety. $ 21,447,553
405b- Occupant Protection Grants
The purpose of this program is to encourage States to adopt and implement occupant
protection laws and programs to reduce highway deaths and injuries from individuals
riding unrestrained in motor vehicles. $ 2,700,000
405c- State Traffic Safety Information System Improvements Grants
The purpose of this program is to support State efforts to improve the data systems
needed to help identify priorities for Federal, State and local highway and traffic
safety programs, to link intra-state data systems, and to improve the compatibility
and interoperability of these data systems with national data systems and the data
systems of other States for highway safety purposes, such as enhancing the ability to
analyze national trends in crash occurrences, rates, outcomes and circumstances. $ 3,500,000
405d- Impaired Driving Countermeasures Grants
Funding under this program includes high visibility impaired driving enforcement,
prosecution and adjudication outreach, BAC testing, high risk drivers, DUI courts,
underage drinking prevention, administrative license suspension and revocation, and
self-sustaining impaired driving prevention. $ 13,000,000
405e- Distracted Driving Grants
This program authorizes incentive grants to States that enact and enforce law
prohibiting distracted driving. States must have statutes that prohibit drivers from
texting while driving and youths from using cell phones while driving. $ 1,000,000
405f- Motorcyclist Safety Grants
States may qualify for this funding by meeting two of six grant criteria: Motorcycle
Rider Training Courses; Motorcyclists Awareness Program; Reduction of Fatalities
and Crashes Involving Motorcycles; Impaired Driving Program; Reduction of
Fatalities and Collisions Involving Impaired Motorcyclists; and Use of Fees
Collected from Motorcyclists for Motorcycle Programs. $ 390,000
GRAND TOTAL $ 76,037,553
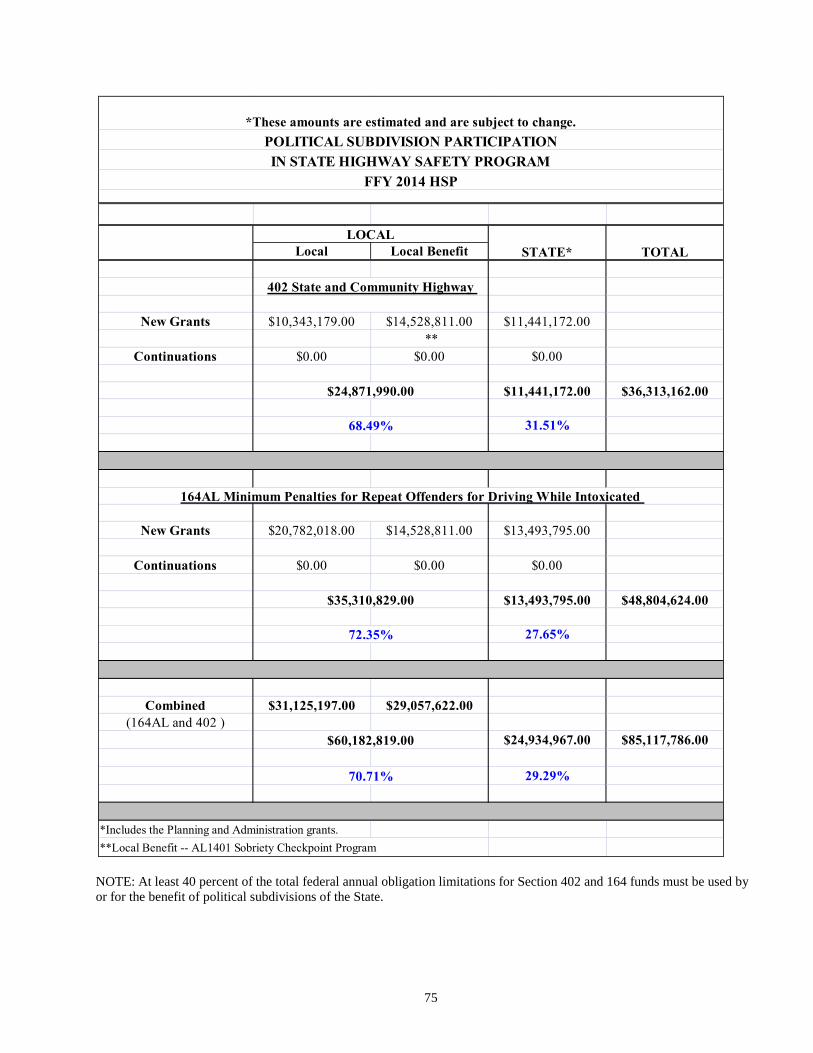
75
NOTE: At least 40 percent of the total federal annual obligation limitations for Section 402 and 164 funds must be used by
or for the benefit of political subdivisions of the State.
Local Local Benefit
New Grants $10,343,179.00 $14,528,811.00 $11,441,172.00
**
Continuations $0.00 $0.00 $0.00
$11,441,172.00 $36,313,162.00
31.51%
New Grants $20,782,018.00 $14,528,811.00 $13,493,795.00
Continuations $0.00 $0.00 $0.00
$13,493,795.00 $48,804,624.00
27.65%
Combined $31,125,197.00 $29,057,622.00
(164AL and 402 )
$24,934,967.00 $85,117,786.00
29.29%
*Includes the Planning and Administration grants.
**Local Benefit -- AL1401 Sobriety Checkpoint Program
70.71%
*These amounts are estimated and are subject to change.
POLITICAL SUBDIVISION PARTICIPATION
IN STATE HIGHWAY SAFETY PROGRAM
FFY 2014 HSP
72.35%
$60,182,819.00
$35,310,829.00
68.49%
LOCAL
STATE*
$24,871,990.00
402 State and Community Highway
TOTAL
164AL Minimum Penalties for Repeat Offenders for Driving While Intoxicated
76
ALCOHOL-IMPAIRED DRIVING
PROGRAM OVERVIEW
According to NHTSA, 32,367 people died in traffic crashes in 2011 in the United States, including an estimated 9,878 people
who were killed in drunk driving crashes involving a vehicle driver or a motorcycle operator with a blood alcohol
concentration (BAC) of .08 grams per deciliter (g/dL) or higher (NHTSA/FARS, 2011).
In California, Alcohol-Impaired Driving Fatalities (fatalities in crashes involving at least one driver or motorcycle operator
with a Blood Alcohol Content (BAC) of .08 or greater) remained the same at 774 in 2010 to 774 in 2011. The 2010 and 2011
figures were the lowest DUI death totals ever.
In 2011, 28 percent of all traffic fatalities were alcohol-impaired driving fatalities (includes all fatalities involving a driver or
motorcycle operator with a BAC of .08 or greater). California is better than the national average of 31 percent.
DUI arrests have dropped in 2010 to 195,879 as compared to 208,531 in 2009.
In 2010, the 21-24 age group had the highest percentage of drivers in fatal crashes with BAC levels of 0.08 or higher – 34
percent.
The Department of Motor Vehicles (DMV), Driving Under the Influence (DUI) Management Information System (MIS)
Report also states that among convicted DUI offenders in 2009, 73.0 percent were first offenders and 27.0 percent were
repeat offenders (one or more prior convictions within the previous ten years). The proportion of repeat offenders has
decreased considerably since 1989, when it stood at
37 percent.
OTS recognizes the magnitude of the problem and continues to aggressively address impaired driving through grant funded
grants that use proven countermeasures to reduce impaired driving.
The Federal Bureau of Investigation 2010 report estimates that 1.4 million drunk driving arrests (DUI) are made each year. In
the United States, conviction rate data was used as a base for estimating that 1 million to 1.2 million of the people arrested for
DUI are convicted and that 50 to 75 percent of all offenders drive on a suspended license.
Research shows that DUI checkpoints increase the public’s attention and with news coverage of DUI enforcement efforts,
can help reduce alcohol-related crashes. Utilizing this methodology, OTS will continue to fund and start new traffic safety
grants that use DUI enforcement, public education, adjudication, intervention, training, prevention programs, and equipment.
Many potential offenders are deterred from drinking and driving only if there is a public perception that they will be caught
and punished.
OTS will develop and continue to implement successful and innovative programs such as alcohol education and awareness
aimed at reducing problems associated with underage high school and college drinking. OTS will also continue to fund
youth prevention grants that engage parents, schools, communities, all levels of government, all social systems that interface
with youth, and youth themselves in a coordinated effort to prevent and reduce the incidents of underage drinking and driving
in California.
According to 2011 FARS data, drivers age 20 or younger involved in fatal crashes dropped 4.4 percent from 336 in 2010 to
321 in 2011.
Repeat DUI offenders continue to present a hazard to the public. According to the Century Council’s Hardcore Drunk
Driving Judicial Guide, repeat DUI offenders who drive with a high blood alcohol concentration (BAC) of .15 or above and
have more than one drunken driving arrest are considered hardcore drunk drivers. These drivers are responsible for 68
percent of alcohol-related traffic fatalities and are 385 times more likely to be involved in a crash. Drivers with BAC levels
in excess of .15 are only one percent of all drivers on weekend nights; however, they are involved in nearly 50 percent of all
fatal crashes during that time.
77
NHTSA, in a 2004 report, concluded enforcement strategies that deter most law-abiding citizens are not as effective with
repeat offenders. Jail time along with alternative sanctions seem to make lasting changes in behavior of repeat DUI offenders.
Imposing longer licensing sanctions and the use of ignition interlock devices, along with the impoundment of vehicles in
coordination with DUI Courts and alcohol use assessment have shown successes in reducing recidivism.
ACTION PLANS
OTS realizes that no one approach is effective for every community. Grantees are encouraged to develop programs that
address specific needs for their city and to implement programs that include multiple components. Grantees’ efforts
primarily will focus on increased enforcement, public awareness, education, and prosecution.
Enforcement and Public Awareness
Priority funding was given to cities that ranked the highest in alcohol involved fatal and injury collisions compared to cities
with the same size populations. OTS funded 119 Selective Traffic Enforcement Program (STEP) grants (PT Section –
beginning on page 102) to local law enforcement agencies to conduct DUI saturation patrols, as well as warrant details, court
stings, and stake out operations for the worst-of-the-worst repeat DUI offenders.
OTS continues to expand and promote the “Avoid DUI” program concept in FFY 2014. This campaign provides increased
DUI enforcement by partnering with local law enforcement, Sheriff Departments, CHP and other special police departments
during holiday periods with increased incidents of alcohol-involved collisions. The “Avoid DUI” program publicizes the
multi-agency DUI task forces using high-visibility sobriety checkpoints and task force operations along with local DUI
saturation patrols through an intense media campaign. The “Avoid DUI” anti-DUI deployments occur during the two
NHSTA mobilization periods; the Winter Campaign – Mid-December through New Year’s Weekend and the Summer
Campaign – Mid-August through Labor Day weekend. Additionally, the “Avoid DUI” programs target the holiday periods
during Memorial Day and Independence Day weekends. OTS has now built upon the “Avoid DUI” program to have a
sustained enforcement effort by funding enforcement operations during other weekends with identified DUI incidents, such
as Halloween, NFL’s Super Bowl Sunday, St. Patrick’s Day, Cinco de Mayo and other local events with impaired drivers
impacting highway safety. The OTS campaign message “Report Drunk Drivers – Call 911” has proven to be a deterrent and
will continue to be a theme driven through the media effort along with the “Designated Driver” message and NHTSA’s
“Drive Sober or Get Pulled Over.” During the NHTSA mobilization periods, approximately 325 fixed freeway changeable
message signs illuminate the “Report Drunk Drivers – Call 911” message.
OTS will fund a comprehensive statewide Sobriety Checkpoint Program for local law enforcement agencies to conduct
checkpoints during national mobilization periods in addition to checkpoints throughout the year.
The Department of Alcoholic Beverage Control will be funded to award local law enforcement agencies mini-grants to
conduct underage drinking prevention and enforcement activities including Minor Decoy, Shoulder Tap, Trap Door, Target
Responsibility for Alcohol Connected Emergencies (TRACE), Informed Merchants Preventing Alcohol-Related Crime
Tendencies (IMPACT), and Retail Operating Standards Task Force (ROSTF) operations.
Education
OTS will continue funding live DUI court proceedings (trials and/or sentencing) in California high schools in order to
provide students the opportunity to see, up close, the consequences of driving under the influence to individual drivers and
crash victims in their own communities. “A Life Interrupted” and “The Big Picture” will also be included as funded as
alcohol awareness programming in high schools. The CHP will continue to expand the number of mini-grants awarded to
local agencies to conduct the “Every 15 Minutes” and “Sober Graduation” programs. “Impact Teen Driver” and “Teens in the
Driver Seat” peer safety programs will be implemented and supported throughout the state. In addition, multiple agencies are
participating in a comprehensive approach to reducing the increasing alcohol-related traffic crashes near college campuses
and surrounding communities.
78
The Regents of the University of California (UCI Health Education Center) will continue to partner with RADD to promote
and implement a model designated driver rewards program throughout California. In addition, this year the project will bring
aboard The Bacchus Network to specifically enhance educational efforts by providing training on evidence-based strategies
on impaired driving prevention. The project emphasizes campus and community partnerships in order to identify and support
effective impaired driving prevention efforts. The goal is to combine environmental, marketing, and educational strategies to
reduce alcohol related motor vehicle deaths and injuries among individuals 21-34 years of age throughout California.
Prosecution
In order to increase the level of accountability of high risk repeat DUI offenders and reduce recidivism, approximately
$10 million dollars has been dedicated to fund the statewide Traffic Safety Resource Prosecutor (TSRP) program, a DUI
Court in San Joaquin County and vertical prosecution programs for the City of Los Angeles and for Calaveras, El Dorado,
Fresno, Glenn, Kern, Lake, Madera, Marin, Monterey, Napa, Orange, Riverside, Sacramento, San Bernardino, San Joaquin,
Shasta, Solano, Sonoma, Stanislaus, Ventura, and Yolo counties and DUI courts in San Joaquin County. The TSRP program
is funded through the California District Attorneys Association to provide training, mentoring, and increase conviction rates
statewide. The TSRP Program includes one program director and four regional DUI prosecutors. The DUI prosecutors will
provide specialized DUI prosecution training and monitoring, technical support to counties with DUI vertical prosecution
programs, and litigation support in complex DUI or vehicular homicide trials.
Training
OTS is funding a Police Officer Standards Training (POST) certified course; DUI Checkpoints - Planning and Management,
designed to help prepare, execute, and supervise a successful checkpoint for each grant awarded to a law enforcement
agency. This training will ensure that supervisors can prepare for the checkpoint by examining their local records and
conducting proper site surveys prior to selecting a checkpoint location. Supervisors will learn how to determine the “Neutral
Method” for stopping cars and planning for the volume of traffic through their Checkpoint. The course also covers case law
and courtroom testimony required by supervisory personnel to ensure successful prosecution and meeting the standards of
Ingersoll 8.
TASKS
Task 1 - Program Development and Administrative Coordination
This task provides for the necessary staff time and expenses incurred by OTS that are directly related to the planning,
development, coordination, monitoring, auditing, and evaluation of grants within this program area, and the preparation of
the 2014 HSP. Funding is also provided in this task for the printing of brochures and pamphlets, distributing literature and
media materials developed through successful grants, or obtained from other sources. Assistance is also provided under this
task to individuals to attend and participate in committees, training sessions, educational meetings or conferences.
Task 2 - DUI Enforcement/Education/Public Information
There are currently no grants planned or continued under this task.
Task 3 - Enforcement/Education/and Public Information
This task provides for the continued focus on traffic safety through enforcement, training for law enforcement personnel and
alcohol retailers, and public education through outreach.
Task 4 - College and Younger Age Youth Programs
This task provides for alcohol education and awareness programs, which focus on ages from middle school through college.
DUI prevention programs for high schools and university campuses will also expand elements from previous successful
programs. The expanded programs will include components addressing use of seat belts, bicycle and pedestrian safety
elements.
Task 5 - Judicial Support/Legal Process
This task provides for one grant that supports a specialized court to track DUI offenders through vertical prosecution and DUI
courts. The San Joaquin County DUI Court Program is designed to stop repeat offenders from driving while impaired and re-
offending. The goal of this program is to reduce recidivism among impaired drivers thereby reducing alcohol and/or drug-
involved collisions, injuries and fatalities. The DUI Court provides an intensive program using judicial supervision, periodic
alcohol/drug testing, mandated treatment where needed and the use of incentives and sanctions to make behavior changes.
Collaboration with local law enforcement and a multi-cultural awareness component complete the DUI Court program.
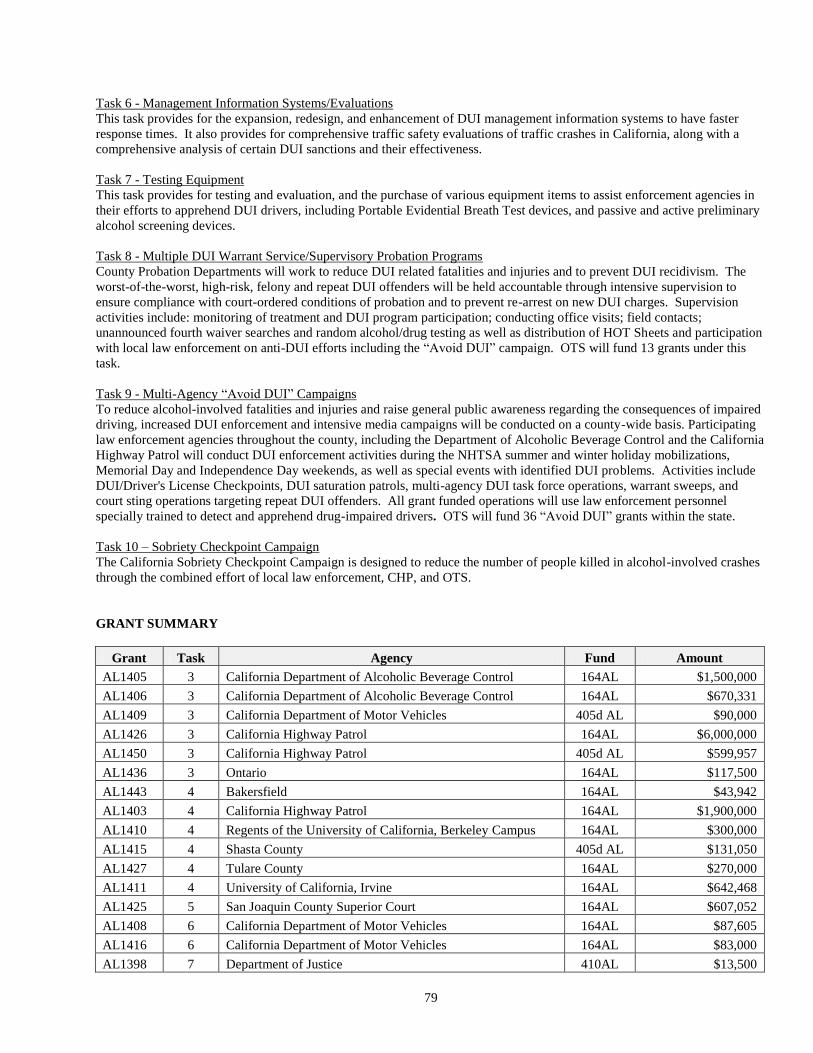
79
Task 6 - Management Information Systems/Evaluations
This task provides for the expansion, redesign, and enhancement of DUI management information systems to have faster
response times. It also provides for comprehensive traffic safety evaluations of traffic crashes in California, along with a
comprehensive analysis of certain DUI sanctions and their effectiveness.
Task 7 - Testing Equipment
This task provides for testing and evaluation, and the purchase of various equipment items to assist enforcement agencies in
their efforts to apprehend DUI drivers, including Portable Evidential Breath Test devices, and passive and active preliminary
alcohol screening devices.
Task 8 - Multiple DUI Warrant Service/Supervisory Probation Programs
County Probation Departments will work to reduce DUI related fatalities and injuries and to prevent DUI recidivism. The
worst-of-the-worst, high-risk, felony and repeat DUI offenders will be held accountable through intensive supervision to
ensure compliance with court-ordered conditions of probation and to prevent re-arrest on new DUI charges. Supervision
activities include: monitoring of treatment and DUI program participation; conducting office visits; field contacts;
unannounced fourth waiver searches and random alcohol/drug testing as well as distribution of HOT Sheets and participation
with local law enforcement on anti-DUI efforts including the “Avoid DUI” campaign. OTS will fund 13 grants under this
task.
Task 9 - Multi-Agency “Avoid DUI” Campaigns
To reduce alcohol-involved fatalities and injuries and raise general public awareness regarding the consequences of impaired
driving, increased DUI enforcement and intensive media campaigns will be conducted on a county-wide basis. Participating
law enforcement agencies throughout the county, including the Department of Alcoholic Beverage Control and the California
Highway Patrol will conduct DUI enforcement activities during the NHTSA summer and winter holiday mobilizations,
Memorial Day and Independence Day weekends, as well as special events with identified DUI problems. Activities include
DUI/Driver's License Checkpoints, DUI saturation patrols, multi-agency DUI task force operations, warrant sweeps, and
court sting operations targeting repeat DUI offenders. All grant funded operations will use law enforcement personnel
specially trained to detect and apprehend drug-impaired drivers. OTS will fund 36 “Avoid DUI” grants within the state.
Task 10 – Sobriety Checkpoint Campaign
The California Sobriety Checkpoint Campaign is designed to reduce the number of people killed in alcohol-involved crashes
through the combined effort of local law enforcement, CHP, and OTS.
GRANT SUMMARY
Grant Task Agency Fund Amount
AL1405 3 California Department of Alcoholic Beverage Control 164AL $1,500,000
AL1406 3 California Department of Alcoholic Beverage Control 164AL $670,331
AL1409 3 California Department of Motor Vehicles 405d AL $90,000
AL1426 3 California Highway Patrol 164AL $6,000,000
AL1450 3 California Highway Patrol 405d AL $599,957
AL1436 3 Ontario 164AL $117,500
AL1443 4 Bakersfield 164AL $43,942
AL1403 4 California Highway Patrol 164AL $1,900,000
AL1410 4 Regents of the University of California, Berkeley Campus 164AL $300,000
AL1415 4 Shasta County 405d AL $131,050
AL1427 4 Tulare County 164AL $270,000
AL1411 4 University of California, Irvine 164AL $642,468
AL1425 5 San Joaquin County Superior Court 164AL $607,052
AL1408 6 California Department of Motor Vehicles 164AL $87,605
AL1416 6 California Department of Motor Vehicles 164AL $83,000
AL1398 7 Department of Justice 410AL $13,500
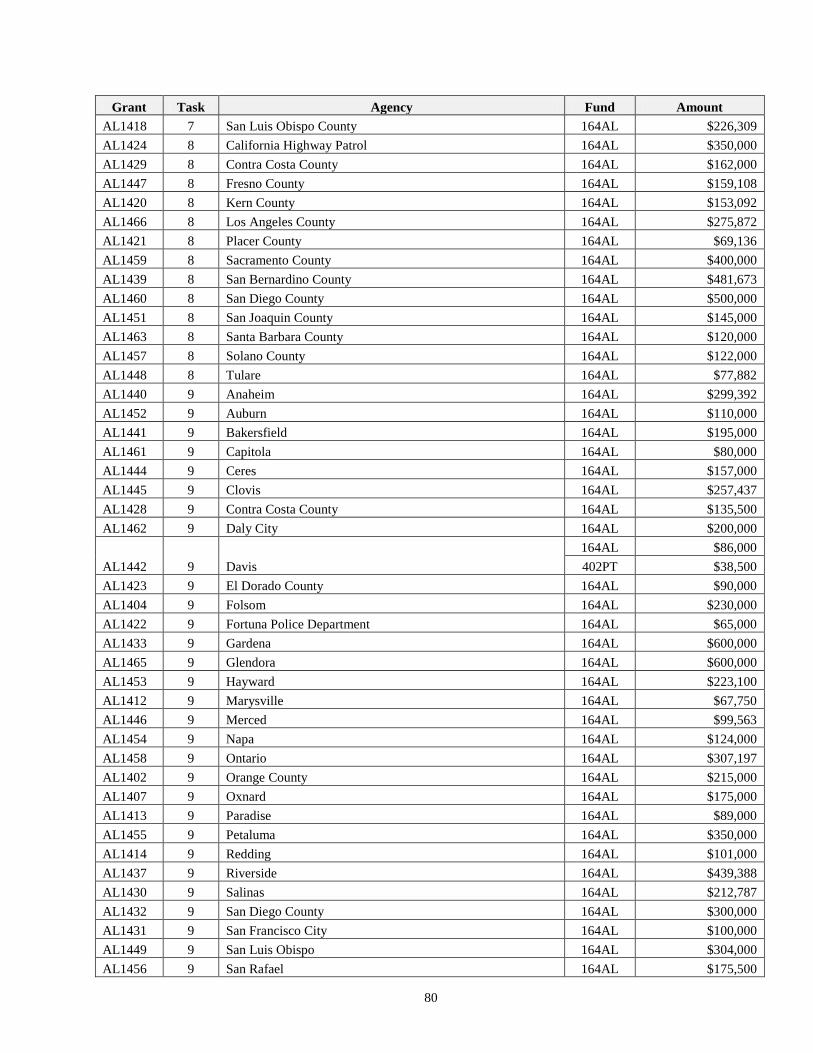
80
Grant Task Agency Fund Amount
AL1418 7 San Luis Obispo County 164AL $226,309
AL1424 8 California Highway Patrol 164AL $350,000
AL1429 8 Contra Costa County 164AL $162,000
AL1447 8 Fresno County 164AL $159,108
AL1420 8 Kern County 164AL $153,092
AL1466 8 Los Angeles County 164AL $275,872
AL1421 8 Placer County 164AL $69,136
AL1459 8 Sacramento County 164AL $400,000
AL1439 8 San Bernardino County 164AL $481,673
AL1460 8 San Diego County 164AL $500,000
AL1451 8 San Joaquin County 164AL $145,000
AL1463 8 Santa Barbara County 164AL $120,000
AL1457 8 Solano County 164AL $122,000
AL1448 8 Tulare 164AL $77,882
AL1440 9 Anaheim 164AL $299,392
AL1452 9 Auburn 164AL $110,000
AL1441 9 Bakersfield 164AL $195,000
AL1461 9 Capitola 164AL $80,000
AL1444 9 Ceres 164AL $157,000
AL1445 9 Clovis 164AL $257,437
AL1428 9 Contra Costa County 164AL $135,500
AL1462 9 Daly City 164AL $200,000
AL1442 9 Davis
164AL $86,000
402PT $38,500
AL1423 9 El Dorado County 164AL $90,000
AL1404 9 Folsom 164AL $230,000
AL1422 9 Fortuna Police Department 164AL $65,000
AL1433 9 Gardena 164AL $600,000
AL1465 9 Glendora 164AL $600,000
AL1453 9 Hayward 164AL $223,100
AL1412 9 Marysville 164AL $67,750
AL1446 9 Merced 164AL $99,563
AL1454 9 Napa 164AL $124,000
AL1458 9 Ontario 164AL $307,197
AL1402 9 Orange County 164AL $215,000
AL1407 9 Oxnard 164AL $175,000
AL1413 9 Paradise 164AL $89,000
AL1455 9 Petaluma 164AL $350,000
AL1414 9 Redding 164AL $101,000
AL1437 9 Riverside 164AL $439,388
AL1430 9 Salinas 164AL $212,787
AL1432 9 San Diego County 164AL $300,000
AL1431 9 San Francisco City 164AL $100,000
AL1449 9 San Luis Obispo 164AL $304,000
AL1456 9 San Rafael 164AL $175,500
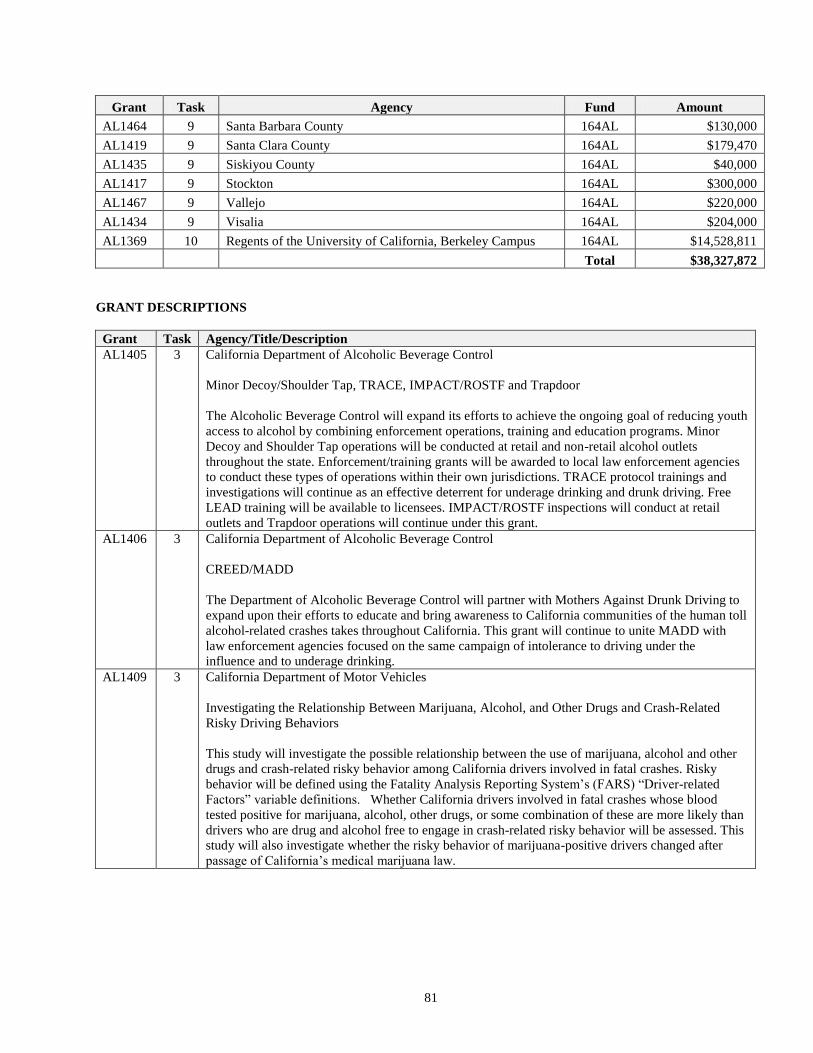
81
Grant Task Agency Fund Amount
AL1464 9 Santa Barbara County 164AL $130,000
AL1419 9 Santa Clara County 164AL $179,470
AL1435 9 Siskiyou County 164AL $40,000
AL1417 9 Stockton 164AL $300,000
AL1467 9 Vallejo 164AL $220,000
AL1434 9 Visalia 164AL $204,000
AL1369 10 Regents of the University of California, Berkeley Campus 164AL $14,528,811
Total $38,327,872
GRANT DESCRIPTIONS
Grant Task Agency/Title/Description
AL1405 3 California Department of Alcoholic Beverage Control
Minor Decoy/Shoulder Tap, TRACE, IMPACT/ROSTF and Trapdoor
The Alcoholic Beverage Control will expand its efforts to achieve the ongoing goal of reducing youth
access to alcohol by combining enforcement operations, training and education programs. Minor
Decoy and Shoulder Tap operations will be conducted at retail and non-retail alcohol outlets
throughout the state. Enforcement/training grants will be awarded to local law enforcement agencies
to conduct these types of operations within their own jurisdictions. TRACE protocol trainings and
investigations will continue as an effective deterrent for underage drinking and drunk driving. Free
LEAD training will be available to licensees. IMPACT/ROSTF inspections will conduct at retail
outlets and Trapdoor operations will continue under this grant.
AL1406 3 California Department of Alcoholic Beverage Control
CREED/MADD
The Department of Alcoholic Beverage Control will partner with Mothers Against Drunk Driving to
expand upon their efforts to educate and bring awareness to California communities of the human toll
alcohol-related crashes takes throughout California. This grant will continue to unite MADD with
law enforcement agencies focused on the same campaign of intolerance to driving under the
influence and to underage drinking.
AL1409 3 California Department of Motor Vehicles
Investigating the Relationship Between Marijuana, Alcohol, and Other Drugs and Crash-Related
Risky Driving Behaviors
This study will investigate the possible relationship between the use of marijuana, alcohol and other
drugs and crash-related risky behavior among California drivers involved in fatal crashes. Risky
behavior will be defined using the Fatality Analysis Reporting System’s (FARS) “Driver-related
Factors” variable definitions. Whether California drivers involved in fatal crashes whose blood
tested positive for marijuana, alcohol, other drugs, or some combination of these are more likely than
drivers who are drug and alcohol free to engage in crash-related risky behavior will be assessed. This
study will also investigate whether the risky behavior of marijuana-positive drivers changed after
passage of California’s medical marijuana law.
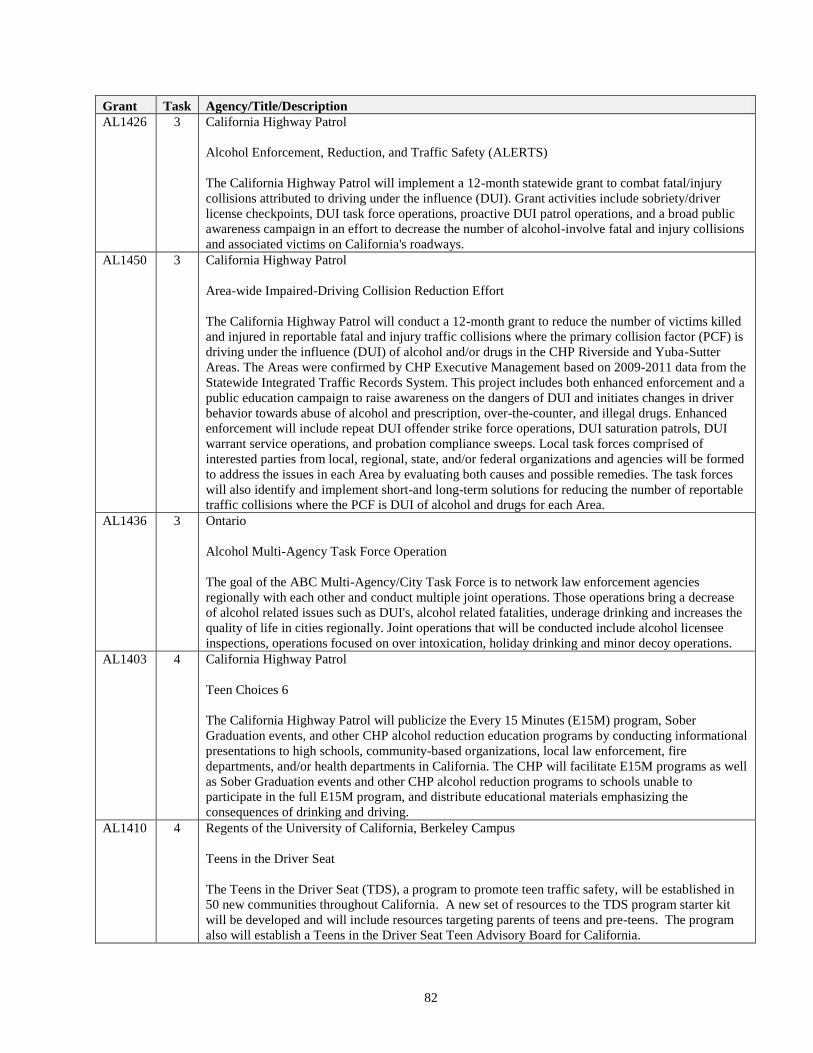
82
Grant Task Agency/Title/Description
AL1426 3 California Highway Patrol
Alcohol Enforcement, Reduction, and Traffic Safety (ALERTS)
The California Highway Patrol will implement a 12-month statewide grant to combat fatal/injury
collisions attributed to driving under the influence (DUI). Grant activities include sobriety/driver
license checkpoints, DUI task force operations, proactive DUI patrol operations, and a broad public
awareness campaign in an effort to decrease the number of alcohol-involve fatal and injury collisions
and associated victims on California's roadways.
AL1450 3 California Highway Patrol
Area-wide Impaired-Driving Collision Reduction Effort
The California Highway Patrol will conduct a 12-month grant to reduce the number of victims killed
and injured in reportable fatal and injury traffic collisions where the primary collision factor (PCF) is
driving under the influence (DUI) of alcohol and/or drugs in the CHP Riverside and Yuba-Sutter
Areas. The Areas were confirmed by CHP Executive Management based on 2009-2011 data from the
Statewide Integrated Traffic Records System. This project includes both enhanced enforcement and a
public education campaign to raise awareness on the dangers of DUI and initiates changes in driver
behavior towards abuse of alcohol and prescription, over-the-counter, and illegal drugs. Enhanced
enforcement will include repeat DUI offender strike force operations, DUI saturation patrols, DUI
warrant service operations, and probation compliance sweeps. Local task forces comprised of
interested parties from local, regional, state, and/or federal organizations and agencies will be formed
to address the issues in each Area by evaluating both causes and possible remedies. The task forces
will also identify and implement short-and long-term solutions for reducing the number of reportable
traffic collisions where the PCF is DUI of alcohol and drugs for each Area.
AL1436 3 Ontario
Alcohol Multi-Agency Task Force Operation
The goal of the ABC Multi-Agency/City Task Force is to network law enforcement agencies
regionally with each other and conduct multiple joint operations. Those operations bring a decrease
of alcohol related issues such as DUI's, alcohol related fatalities, underage drinking and increases the
quality of life in cities regionally. Joint operations that will be conducted include alcohol licensee
inspections, operations focused on over intoxication, holiday drinking and minor decoy operations.
AL1403 4 California Highway Patrol
Teen Choices 6
The California Highway Patrol will publicize the Every 15 Minutes (E15M) program, Sober
Graduation events, and other CHP alcohol reduction education programs by conducting informational
presentations to high schools, community-based organizations, local law enforcement, fire
departments, and/or health departments in California. The CHP will facilitate E15M programs as well
as Sober Graduation events and other CHP alcohol reduction programs to schools unable to
participate in the full E15M program, and distribute educational materials emphasizing the
consequences of drinking and driving.
AL1410 4 Regents of the University of California, Berkeley Campus
Teens in the Driver Seat
The Teens in the Driver Seat (TDS), a program to promote teen traffic safety, will be established in
50 new communities throughout California. A new set of resources to the TDS program starter kit
will be developed and will include resources targeting parents of teens and pre-teens. The program
also will establish a Teens in the Driver Seat Teen Advisory Board for California.
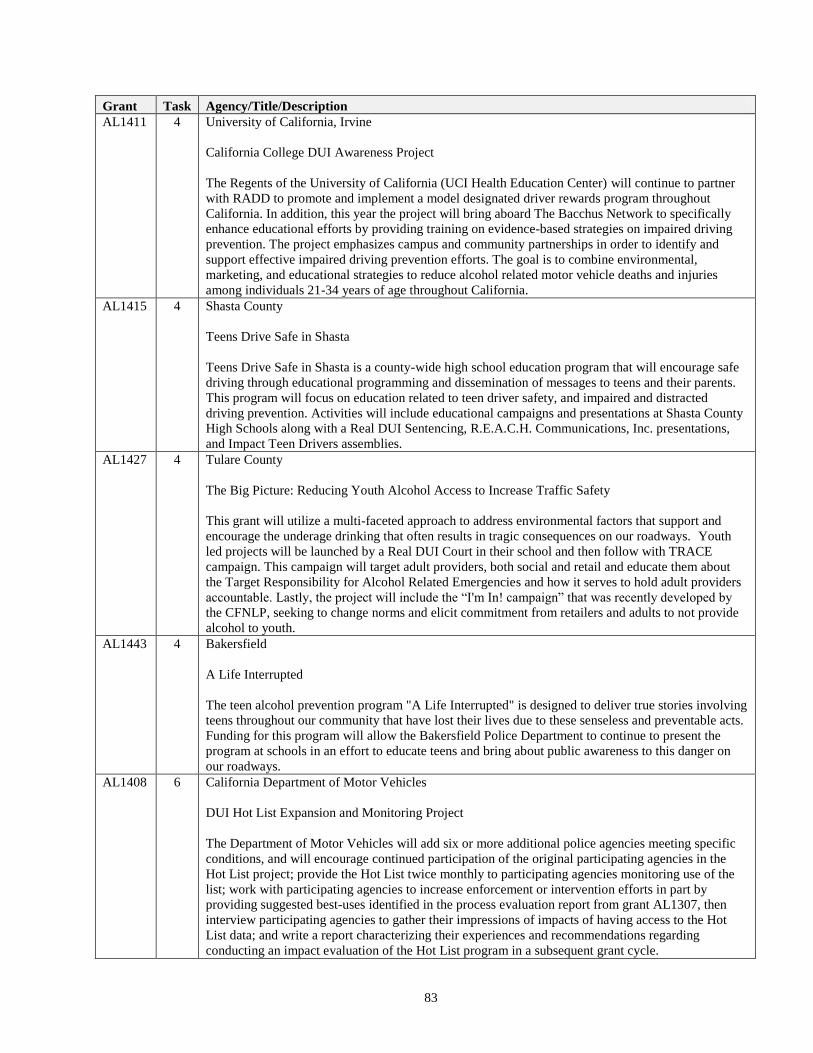
83
Grant Task Agency/Title/Description
AL1411 4 University of California, Irvine
California College DUI Awareness Project
The Regents of the University of California (UCI Health Education Center) will continue to partner
with RADD to promote and implement a model designated driver rewards program throughout
California. In addition, this year the project will bring aboard The Bacchus Network to specifically
enhance educational efforts by providing training on evidence-based strategies on impaired driving
prevention. The project emphasizes campus and community partnerships in order to identify and
support effective impaired driving prevention efforts. The goal is to combine environmental,
marketing, and educational strategies to reduce alcohol related motor vehicle deaths and injuries
among individuals 21-34 years of age throughout California.
AL1415 4 Shasta County
Teens Drive Safe in Shasta
Teens Drive Safe in Shasta is a county-wide high school education program that will encourage safe
driving through educational programming and dissemination of messages to teens and their parents.
This program will focus on education related to teen driver safety, and impaired and distracted
driving prevention. Activities will include educational campaigns and presentations at Shasta County
High Schools along with a Real DUI Sentencing, R.E.A.C.H. Communications, Inc. presentations,
and Impact Teen Drivers assemblies.
AL1427 4 Tulare County
The Big Picture: Reducing Youth Alcohol Access to Increase Traffic Safety
This grant will utilize a multi-faceted approach to address environmental factors that support and
encourage the underage drinking that often results in tragic consequences on our roadways. Youth
led projects will be launched by a Real DUI Court in their school and then follow with TRACE
campaign. This campaign will target adult providers, both social and retail and educate them about
the Target Responsibility for Alcohol Related Emergencies and how it serves to hold adult providers
accountable. Lastly, the project will include the “I'm In! campaign” that was recently developed by
the CFNLP, seeking to change norms and elicit commitment from retailers and adults to not provide
alcohol to youth.
AL1443 4 Bakersfield
A Life Interrupted
The teen alcohol prevention program "A Life Interrupted" is designed to deliver true stories involving
teens throughout our community that have lost their lives due to these senseless and preventable acts.
Funding for this program will allow the Bakersfield Police Department to continue to present the
program at schools in an effort to educate teens and bring about public awareness to this danger on
our roadways.
AL1408 6 California Department of Motor Vehicles
DUI Hot List Expansion and Monitoring Project
The Department of Motor Vehicles will add six or more additional police agencies meeting specific
conditions, and will encourage continued participation of the original participating agencies in the
Hot List project; provide the Hot List twice monthly to participating agencies monitoring use of the
list; work with participating agencies to increase enforcement or intervention efforts in part by
providing suggested best-uses identified in the process evaluation report from grant AL1307, then
interview participating agencies to gather their impressions of impacts of having access to the Hot
List data; and write a report characterizing their experiences and recommendations regarding
conducting an impact evaluation of the Hot List program in a subsequent grant cycle.
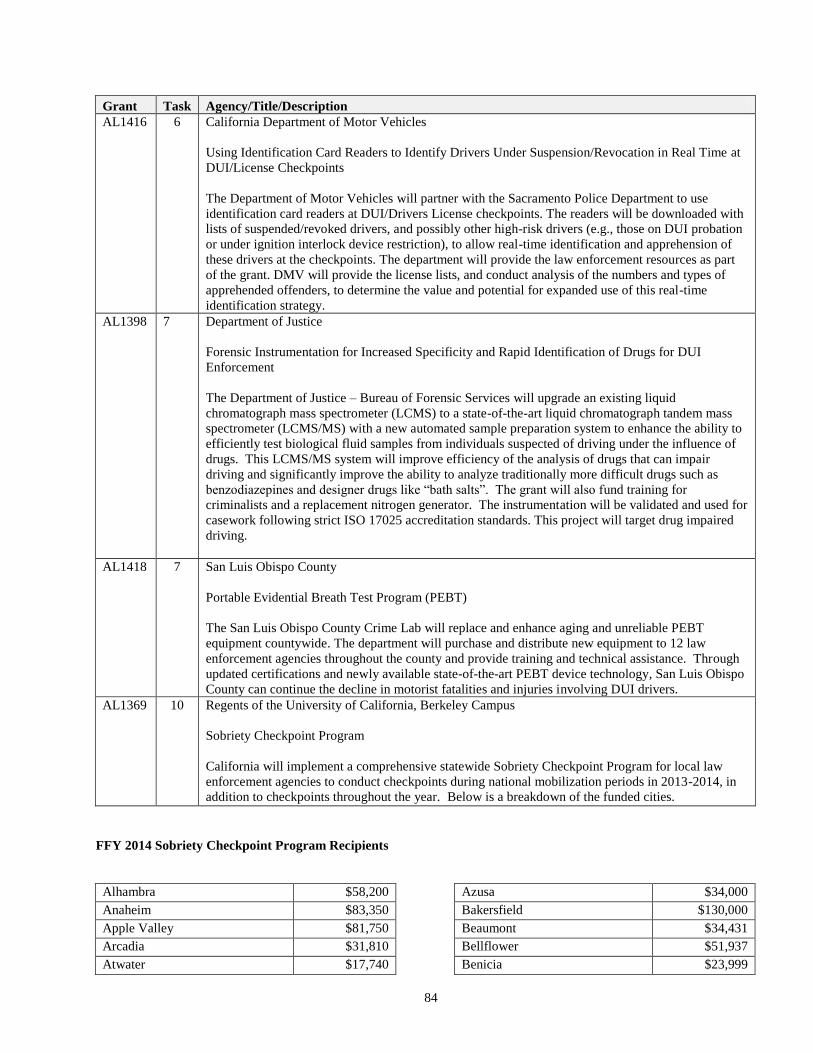
84
Grant Task Agency/Title/Description
AL1416 6 California Department of Motor Vehicles
Using Identification Card Readers to Identify Drivers Under Suspension/Revocation in Real Time at
DUI/License Checkpoints
The Department of Motor Vehicles will partner with the Sacramento Police Department to use
identification card readers at DUI/Drivers License checkpoints. The readers will be downloaded with
lists of suspended/revoked drivers, and possibly other high-risk drivers (e.g., those on DUI probation
or under ignition interlock device restriction), to allow real-time identification and apprehension of
these drivers at the checkpoints. The department will provide the law enforcement resources as part
of the grant. DMV will provide the license lists, and conduct analysis of the numbers and types of
apprehended offenders, to determine the value and potential for expanded use of this real-time
identification strategy.
AL1398 7 Department of Justice
Forensic Instrumentation for Increased Specificity and Rapid Identification of Drugs for DUI
Enforcement
The Department of Justice – Bureau of Forensic Services will upgrade an existing liquid
chromatograph mass spectrometer (LCMS) to a state-of-the-art liquid chromatograph tandem mass
spectrometer (LCMS/MS) with a new automated sample preparation system to enhance the ability to
efficiently test biological fluid samples from individuals suspected of driving under the influence of
drugs. This LCMS/MS system will improve efficiency of the analysis of drugs that can impair
driving and significantly improve the ability to analyze traditionally more difficult drugs such as
benzodiazepines and designer drugs like “bath salts”. The grant will also fund training for
criminalists and a replacement nitrogen generator. The instrumentation will be validated and used for
casework following strict ISO 17025 accreditation standards. This project will target drug impaired
driving.
AL1418 7 San Luis Obispo County
Portable Evidential Breath Test Program (PEBT)
The San Luis Obispo County Crime Lab will replace and enhance aging and unreliable PEBT
equipment countywide. The department will purchase and distribute new equipment to 12 law
enforcement agencies throughout the county and provide training and technical assistance. Through
updated certifications and newly available state-of-the-art PEBT device technology, San Luis Obispo
County can continue the decline in motorist fatalities and injuries involving DUI drivers.
AL1369 10 Regents of the University of California, Berkeley Campus
Sobriety Checkpoint Program
California will implement a comprehensive statewide Sobriety Checkpoint Program for local law
enforcement agencies to conduct checkpoints during national mobilization periods in 2013-2014, in
addition to checkpoints throughout the year. Below is a breakdown of the funded cities.
FFY 2014 Sobriety Checkpoint Program Recipients
Alhambra $58,200
Anaheim $83,350
Apple Valley $81,750
Arcadia $31,810
Atwater $17,740
Azusa $34,000
Bakersfield $130,000
Beaumont $34,431
Bellflower $51,937
Benicia $23,999
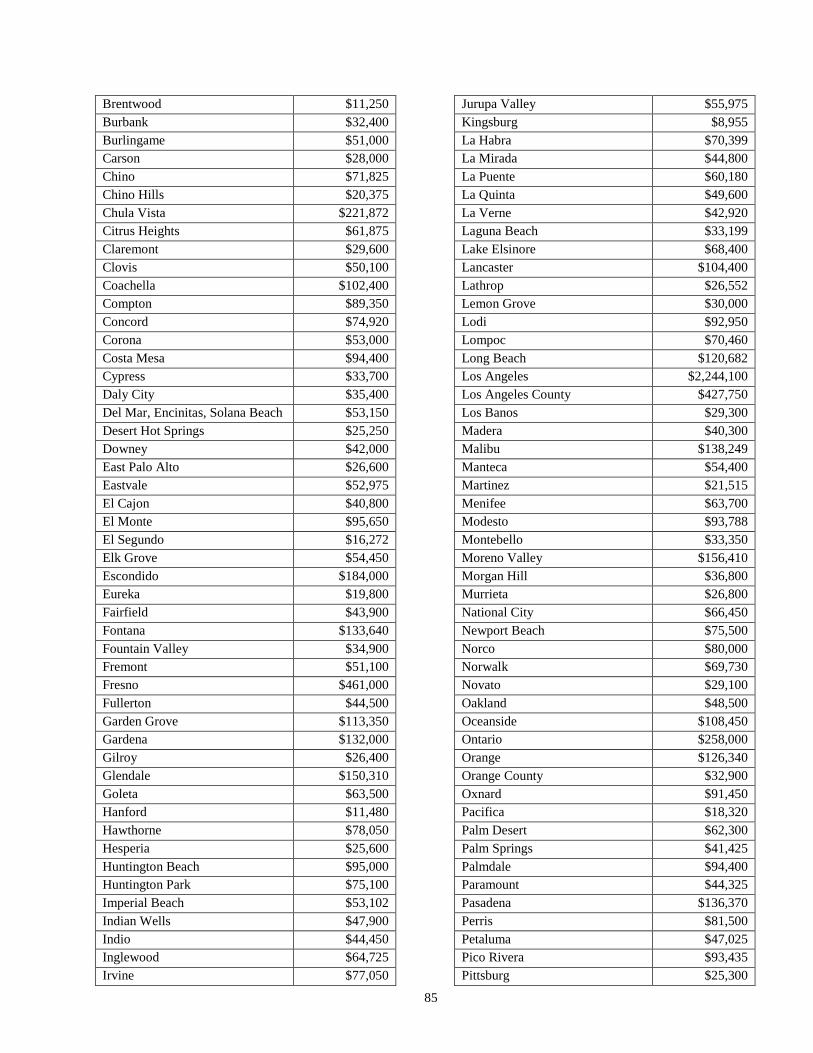
85
Brentwood $11,250
Burbank $32,400
Burlingame $51,000
Carson $28,000
Chino $71,825
Chino Hills $20,375
Chula Vista $221,872
Citrus Heights $61,875
Claremont $29,600
Clovis $50,100
Coachella $102,400
Compton $89,350
Concord $74,920
Corona $53,000
Costa Mesa $94,400
Cypress $33,700
Daly City $35,400
Del Mar, Encinitas, Solana Beach $53,150
Desert Hot Springs $25,250
Downey $42,000
East Palo Alto $26,600
Eastvale $52,975
El Cajon $40,800
El Monte $95,650
El Segundo $16,272
Elk Grove $54,450
Escondido $184,000
Eureka $19,800
Fairfield $43,900
Fontana $133,640
Fountain Valley $34,900
Fremont $51,100
Fresno $461,000
Fullerton $44,500
Garden Grove $113,350
Gardena $132,000
Gilroy $26,400
Glendale $150,310
Goleta $63,500
Hanford $11,480
Hawthorne $78,050
Hesperia $25,600
Huntington Beach $95,000
Huntington Park $75,100
Imperial Beach $53,102
Indian Wells $47,900
Indio $44,450
Inglewood $64,725
Irvine $77,050
Jurupa Valley $55,975
Kingsburg $8,955
La Habra $70,399
La Mirada $44,800
La Puente $60,180
La Quinta $49,600
La Verne $42,920
Laguna Beach $33,199
Lake Elsinore $68,400
Lancaster $104,400
Lathrop $26,552
Lemon Grove $30,000
Lodi $92,950
Lompoc $70,460
Long Beach $120,682
Los Angeles $2,244,100
Los Angeles County $427,750
Los Banos $29,300
Madera $40,300
Malibu $138,249
Manteca $54,400
Martinez $21,515
Menifee $63,700
Modesto $93,788
Montebello $33,350
Moreno Valley $156,410
Morgan Hill $36,800
Murrieta $26,800
National City $66,450
Newport Beach $75,500
Norco $80,000
Norwalk $69,730
Novato $29,100
Oakland $48,500
Oceanside $108,450
Ontario $258,000
Orange $126,340
Orange County $32,900
Oxnard $91,450
Pacifica $18,320
Palm Desert $62,300
Palm Springs $41,425
Palmdale $94,400
Paramount $44,325
Pasadena $136,370
Perris $81,500
Petaluma $47,025
Pico Rivera $93,435
Pittsburg $25,300
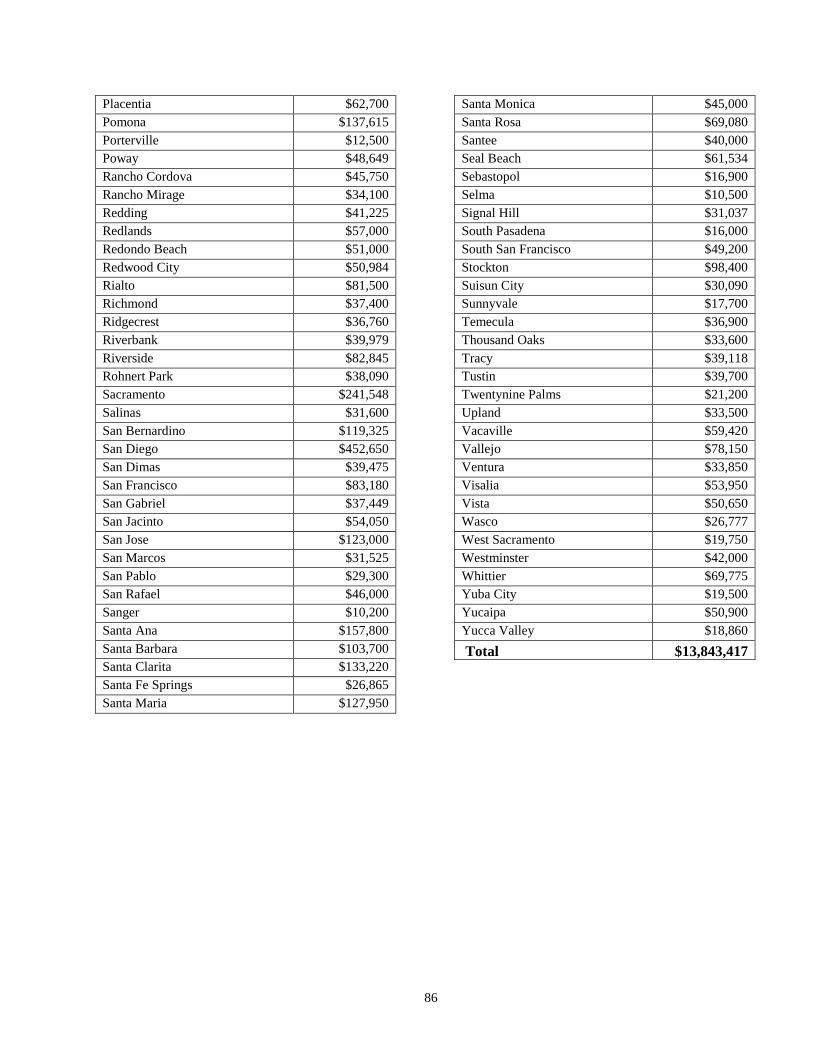
86
Placentia $62,700
Pomona $137,615
Porterville $12,500
Poway $48,649
Rancho Cordova $45,750
Rancho Mirage $34,100
Redding $41,225
Redlands $57,000
Redondo Beach $51,000
Redwood City $50,984
Rialto $81,500
Richmond $37,400
Ridgecrest $36,760
Riverbank $39,979
Riverside $82,845
Rohnert Park $38,090
Sacramento $241,548
Salinas $31,600
San Bernardino $119,325
San Diego $452,650
San Dimas $39,475
San Francisco $83,180
San Gabriel $37,449
San Jacinto $54,050
San Jose $123,000
San Marcos $31,525
San Pablo $29,300
San Rafael $46,000
Sanger $10,200
Santa Ana $157,800
Santa Barbara $103,700
Santa Clarita $133,220
Santa Fe Springs $26,865
Santa Maria $127,950
Santa Monica $45,000
Santa Rosa $69,080
Santee $40,000
Seal Beach $61,534
Sebastopol $16,900
Selma $10,500
Signal Hill $31,037
South Pasadena $16,000
South San Francisco $49,200
Stockton $98,400
Suisun City $30,090
Sunnyvale $17,700
Temecula $36,900
Thousand Oaks $33,600
Tracy $39,118
Tustin $39,700
Twentynine Palms $21,200
Upland $33,500
Vacaville $59,420
Vallejo $78,150
Ventura $33,850
Visalia $53,950
Vista $50,650
Wasco $26,777
West Sacramento $19,750
Westminster $42,000
Whittier $69,775
Yuba City $19,500
Yucaipa $50,900
Yucca Valley $18,860
Total $13,843,417
87
OTS places a high priority on funding cities with the most significant DUI problems. As shown below, nearly all the Top 50
DUI Cities have received a DUI checkpoint grant as well as a STEP grant.
Top 50 DUI Cities 2010 Fatalities & Injuries
Number of DUI
Checkpoints
STEP Grant
Awarded
1 Los Angeles 2,247 160 x
2 San Diego 696 48 x
3 San Jose 409 12 x
4 Sacramento 326 24 x
5 San Francisco 323 10 x
6 Bakersfield 228 13 x
7 Long Beach 215 12 x
8 Santa Ana 200 22 x
9 Oxnard 163 12 x
10 Anaheim 159 8 x
11 Fresno 152 60 x
12 Oakland 136 4 x
13 Huntington Beach 136 10 x
14 Riverside 129 6 x
15 Modesto 124 18 x
16 Stockton 122 12 x
17 Orange 120 4 x
18 Escondido 106 16 x
19 San Bernardino 105 18 x
20 Oceanside 97 10 x
21 Chula Vista 95 24 x
22 Newport Beach 85 6 x
23 Santa Barbara 84 24 x
24 Pomona 82 12 x
25 Santa Rosa 82 8 x
26 Hawthorne 82 7 x
27 Costa Mesa 80 10 x
28 Santa Maria 79 18 x
29 Palm Springs 78 8 x
30 Fontana 76 16 x
31 Fullerton 76 4 x
32 Fremont 72 7 *
33 Hemet 71 * x
34 Santa Monica 71 4 x
35 Concord 70 6 x
36 Moreno Valley 70 18 x
37 Ontario 69 20 x
38 Garden Grove 68 14 x
39 Downey 67 4 *
40 Thousand Oaks 63 6 x
41 Lancaster 62 12 x
42 Santa Clarita 60 14 x
43 Vallejo 60 8 x
44 Berkeley 58 * *
45 Citrus Heights 58 8 x
88
Top 50 DUI Cities 2010 Fatalities & Injuries
Number of DUI
Checkpoints
STEP Grant
Awarded
46 Roseville 57 * *
47 Torrance 55 * *
48 West Covina 55 * *
49 Visalia 54 12 x
50 Napa 54 * x
*did not apply for funding
89
DISTRACTED DRIVING PROGRAM OVERVIEW
National Research
In the 21st century driver distraction has emerged as a new and significant traffic safety concern. Distractions are not new;
however, the number and complexities of distractions has increased substantially. 1 Distractions can be visual, manual, and/or
cognitive. Cell phone use and texting are the most commonly discussed forms of driver distraction, but all of the following
activities can also be considered potentially distracting: eating or drinking; adjusting vehicle controls (radio, A/C); interacting
with passengers; grooming; using electronic devices (PDA, smart phone, iPod, computer, GPS navigation unit); and using in-
vehicle technology. While numerous potential distractions exist for drivers, there is broad recognition that technological
distractions, particularly talking and texting on cell phones represent a primary and growing concern. U.S. Department of
Transportation Secretary Ray LaHood recently stated the need to “…raise awareness and change the way people think about
distracted driving.” 2The problem promises only to grow, as portable electronic devices become more accessible, specialized,
or specifically manufactured for use in motor vehicles, and their use becomes ubiquitous.
Public awareness of the dangers of mobile phone use and driving suggests a conflict between public perception of the
dangers associated with mobile phone use, and the behavior, or use, of mobile phones. While most drivers have reported it is
unacceptable for drivers to talk on hand-held phones, to send a text message or e-mail, most also reported engaging in this
behavior. 3 There is also a lack of understanding about the difference between hand-held and hands-free use of mobile
phones. The same American Automobile Association Foundation for Traffic Safety (AAAFTS) study reported that while 71
percent of drivers believed it was unacceptable to talk on hand-held phones and drive, only 38 percent believed it was
unacceptable to talk on hands-free phones and drive. The National Safety Council (NSC) has released a report, however, that
says that research has not identified that hands-free phones offer safety benefits. Problems such as inattention blindness,
slowed reaction and response times and weaving among lanes of traffic are associated with both hands-free and hand-held
phones. 4
With the significant market penetration of mobile phones over the last 15 years 5, the percentage of drivers talking and texting
on cell phones continues to increase rapidly, although estimates of the magnitude of distracted driving and associated crashes
vary due to the difficulty of identifying distracted driving and attributing crashes to it. The estimated proportion of crashes
and/or near-crashes attributed at least in part to distracted driving (excluding drowsy driving) varies from 16 percent to 22
percent. 6 Table 1 provides a breakdown of fatal crashes, drivers and fatalities in crashes involving driver distraction by year
in the US between 2004 and 2009.
In a recent survey of 1,219 drivers age 18 and over conducted by the Insurance Institute for Highway Safety, over 40 percent
of drivers said they talked on the phone while driving “at least a few times per week” and 19 percent reported they talked on
the phone while driving every day. 7 In recent years, government groups and researchers have reported on the involvement of
driver distraction in crashes.
1Regan, Lee & Young (2008), Driver Distraction: Theory, Effects, and Mitigation: CRC Press
2http://www.distraction.gov/files/press-release/dot0410508forweb.pdf
3http://www.aaafoundation.org/pdf/distraction.pdf
4National Safety Council. Understanding the Distracted Brain. March 2010.
http://www.nsc.org/safety_road/Distracted_Driving/Documents/Dstrct_Drvng_White_Paper_Fnl%282%29.pdf 5National Safety Council. Understanding the Distracted Brain. March 2010.
http://www.nsc.org/safety_road/Distracted_Driving/Documents/Dstrct_Drvng_White_Paper_Fnl%282%29.pdf 6NHTSA, Traffic Safety Facts. An Examination of Driver Distraction as Recorded in NHTSA Databases. September 2009,
DOT HS 811 216. http://www-nrd.nhtsa.dot.gov/Pubs/811216.pdf 7 IIHS, Phoning While Driving, Feb. 27, 2010
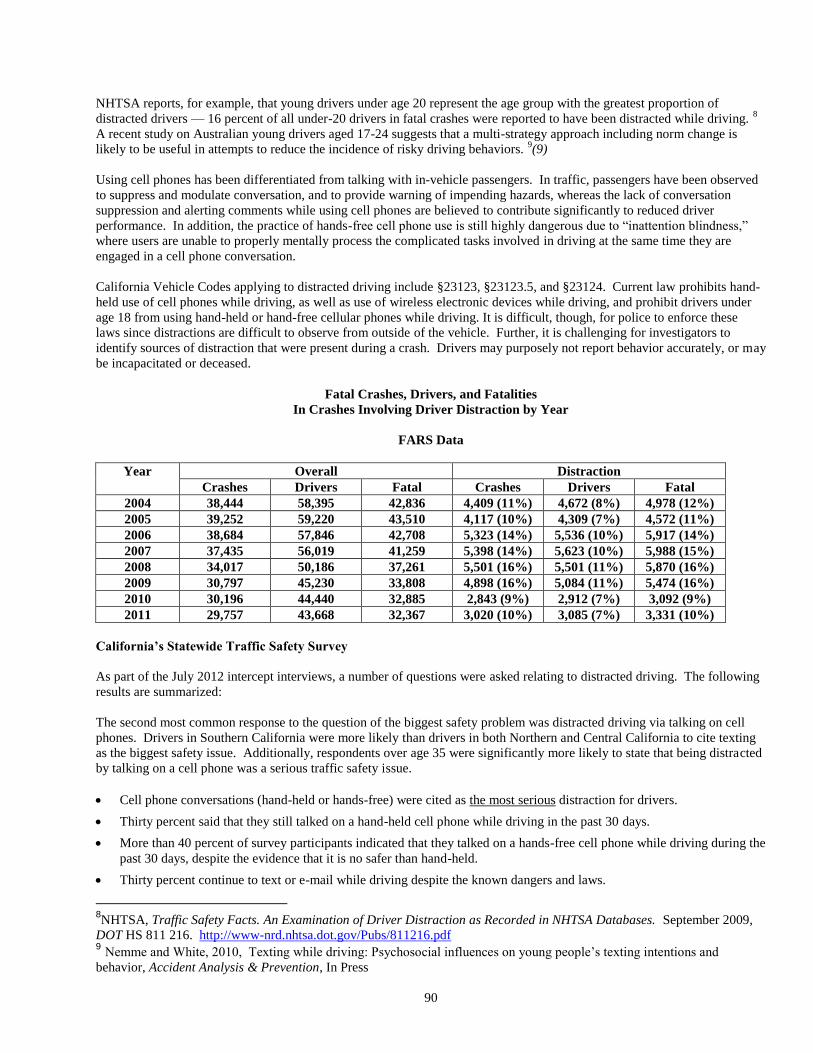
90
NHTSA reports, for example, that young drivers under age 20 represent the age group with the greatest proportion of
distracted drivers — 16 percent of all under-20 drivers in fatal crashes were reported to have been distracted while driving. 8
A recent study on Australian young drivers aged 17-24 suggests that a multi-strategy approach including norm change is
likely to be useful in attempts to reduce the incidence of risky driving behaviors. 9(9)
Using cell phones has been differentiated from talking with in-vehicle passengers. In traffic, passengers have been observed
to suppress and modulate conversation, and to provide warning of impending hazards, whereas the lack of conversation
suppression and alerting comments while using cell phones are believed to contribute significantly to reduced driver
performance. In addition, the practice of hands-free cell phone use is still highly dangerous due to “inattention blindness,”
where users are unable to properly mentally process the complicated tasks involved in driving at the same time they are
engaged in a cell phone conversation.
California Vehicle Codes applying to distracted driving include §23123, §23123.5, and §23124. Current law prohibits hand-
held use of cell phones while driving, as well as use of wireless electronic devices while driving, and prohibit drivers under
age 18 from using hand-held or hand-free cellular phones while driving. It is difficult, though, for police to enforce these
laws since distractions are difficult to observe from outside of the vehicle. Further, it is challenging for investigators to
identify sources of distraction that were present during a crash. Drivers may purposely not report behavior accurately, or may
be incapacitated or deceased.
Fatal Crashes, Drivers, and Fatalities
In Crashes Involving Driver Distraction by Year
FARS Data
Year Overall Distraction
Crashes Drivers Fatal Crashes Drivers Fatal
2004 38,444 58,395 42,836 4,409 (11%) 4,672 (8%) 4,978 (12%)
2005 39,252 59,220 43,510 4,117 (10%) 4,309 (7%) 4,572 (11%)
2006 38,684 57,846 42,708 5,323 (14%) 5,536 (10%) 5,917 (14%)
2007 37,435 56,019 41,259 5,398 (14%) 5,623 (10%) 5,988 (15%)
2008 34,017 50,186 37,261 5,501 (16%) 5,501 (11%) 5,870 (16%)
2009 30,797 45,230 33,808 4,898 (16%) 5,084 (11%) 5,474 (16%)
2010 30,196 44,440 32,885 2,843 (9%) 2,912 (7%) 3,092 (9%)
2011 29,757 43,668 32,367 3,020 (10%) 3,085 (7%) 3,331 (10%)
California’s Statewide Traffic Safety Survey
As part of the July 2012 intercept interviews, a number of questions were asked relating to distracted driving. The following
results are summarized:
The second most common response to the question of the biggest safety problem was distracted driving via talking on cell
phones. Drivers in Southern California were more likely than drivers in both Northern and Central California to cite texting
as the biggest safety issue. Additionally, respondents over age 35 were significantly more likely to state that being distracted
by talking on a cell phone was a serious traffic safety issue.
Cell phone conversations (hand-held or hands-free) were cited as the most serious distraction for drivers.
Thirty percent said that they still talked on a hand-held cell phone while driving in the past 30 days.
More than 40 percent of survey participants indicated that they talked on a hands-free cell phone while driving during the
past 30 days, despite the evidence that it is no safer than hand-held.
Thirty percent continue to text or e-mail while driving despite the known dangers and laws.
8NHTSA, Traffic Safety Facts. An Examination of Driver Distraction as Recorded in NHTSA Databases. September 2009,
DOT HS 811 216. http://www-nrd.nhtsa.dot.gov/Pubs/811216.pdf 9 Nemme and White, 2010, Texting while driving: Psychosocial influences on young people’s texting intentions and
behavior, Accident Analysis & Prevention, In Press
91
A total of 33.8 percent of respondents indicated they talk less on cell phones since the hands-free law went into effect.
Roughly 45 percent of participants indicated that they had made a mistake while talking on a cell phone while driving.
Sixty percent reported having been hit or nearly hit by a driver who was talking or texting on a cell phone.
California’s Statewide Observational Survey of Cell Phone and Texting Use Among California Drivers
In March 2013, California conducted the third annual observational survey of cell phone and texting use by drivers. The
percentage of drivers actively using cell phones at any one time dropped from 10.8 percent in 2012 to 7.6 percent in 2013,
nearly returning to the baseline 2011 total of 7.3 percent. The largest drop, 33 percent, was from those holding a cell phone
to their ear. A similar nationwide survey conducted by NHTSA in 2009 showed a combined usage of nine percent.
Researchers conducted observations of over 6000 vehicles at 130 intersections in 17 counties and found the following:
2.3 percent were talking into a hand-held phone, either at their ear or in their hand
2.8 percent were talking into a Bluetooth, speaker phone or headset
2.5 percent were texting or otherwise manipulating a mobile device
ACTION PLANS
OTS and CHP continue to lead SHSP Challenge Area 17 – Reduce Distracted Driving. Both departments will continue work
on the approved action items, as well as focus on at least two new additional action items for the Steering Committee’s
review and approval.
Over the past three years, California has spearheaded the largest statewide efforts during the National Distracted Awareness
Month and they were deemed a huge success. OTS and CHP enlisted the assistance of over 265 local law enforcement
agencies to conduct “zero tolerance” enforcement operations during the entire month of April. In addition to enforcement
efforts, the “It’s NOT Worth It” public awareness campaign was launched with TV and radio commercials, as well as
billboards, gas station pump toppers, and social media. Caltrans also contributed by illuminating the message over their
freeway changeable message signs.
In March 2014, OTS will contract with a research firm to conduct the Fourth Annual Cell Phone/Texting Observational
Survey and efforts will continue during National Distracted Awareness Month in April 2014. In addition, OTS will develop
and implement a statewide, adult-targeted distracted driving campaign using paid media, earned media, PSAs, outreach, and
public relations strategies.
In 2013, California was selected by NHTSA to participate in an expanded Distracted Driving High Visibility Enforcement
Demonstration program similar to the 2010 pilot including Syracuse, New York and Hartford, Connecticut. In this program,
local law enforcement agencies and the CHP offices in nine counties in the Sacramento Valley region conducted enforcement
focusing on distracted driving violations during a ten-day wave in December and two-week waves in March and June.
NHTSA complimented enforcement by providing a large media campaign using the slogan, “Phone in One Hand, Ticket in
the Other.” OTS is hopeful that as demonstrated in similar high visibility enforcement campaigns, the research will show
that this countermeasure will prevent fatalities and injuries associated with distracted driving, more specifically caused by the
use of hand-held cell phones and texting while driving. The evaluation of this demonstration project should be published in
2014.
OTS will again partner with Sacramento Gannett ABC affiliate to continue The Great Hang Up Campaign. The campaign
includes airing Distracted Driving PSAs, creation of weekly distracted driving oriented news stories, distracted driving
materials at events, web and Facebook ads and pages, monthly morning talk show segments, and on-air campaign
promotions.
The following talking points are listed on the OTS website along with other links associated with distracted driving, as well
as the SHSP Talking Points site:
92
Distracted driving is a serious traffic safety concern that puts all road users at risk, joining alcohol and speeding as
leading factors in fatal and serious injury crashes.
As the impacts of distracted driving are being felt at an increasing rate, primarily due to the recent surge in cell
phone use and text messaging while driving, the SHSP Steering Committee added the first new Challenge Area
since the plans inception.
The primary source of driver inattention is use of a wireless device. Drivers who use hand-held devices are four
times as likely to get into crashes serious enough to injure themselves (Hoskings, Young & Regan, 2006). Driving
while using a cell phone reduces the amount of brain activity associated with driving by 37 percent, resulting in
“inattention blindness” – your brain isn’t seeing what’s right in front of you because it’s too busy with your call.
According to NHTSA, a total of 3,092 people died in 2010 in crashes involving a distracted driver (9.4 percent of
total fatalities), and an additional 416,000 were injured in the United States (NHTSA, 2012). Nationally, the
younger, inexperienced drivers under 20 years old have the highest proportion of distraction-related fatal crashes at
11 percent (NHTSA, 2012).
A lack of meaningful and useful data is a hindrance to combating the problem.
Using a cell phone use while driving, whether it’s hand-held or hands-free, delays a driver's reactions as much as
having a blood alcohol concentration at the legal limit of .08 percent.
While all distractions can endanger drivers’ safety, texting is the most alarming because it involves multiple types of
distraction. Dialing and texting can take a driver’s eyes from the roadway for five seconds or longer, while most
crashes have less than three seconds reaction time.
Nationally nine percent of fatal crashes in 2010 were reported as distraction-affected collisions and eighteen percent
of injury crashes in 2010 involved reports of distracted driving (NHTSA, 2012).
Of those killed in distracted-driving-related crashed nationally, 13.2 percent involved reports of a cell phone as a
distraction (NHTSA, 2012).
The portion of drivers reportedly distracted at the time of the fatal crashes increased from 7 percent in 2005 to 11
percent in 2009 (NHTSA, Traffic Safety Facts 2009).
Nationally, the proportion of fatalities reportedly associated with driver distraction increased from 10 percent in
2005 to 16 percent in 2009. During that time, fatal crashes with reported driver distraction also increased from 10
percent to 16 percent.(NHTSA, Traffic Safety Facts 2009)
Of those drivers reportedly distracted during a fatal crash, the 20-to-29-year-old age group had the greatest
proposition of drivers distracted by cell phones at 26 percent (NHTSA, 2012).
Between 2012 and 2013, an observational survey of cell phone use by drivers took place within the state, looking for
hand-held and hands-free talking as well as texting and other use of mobile devices while driving. The overall rate
was 7.6 percent of drivers on the road using cell phones at any given daylight time, down from 10.8 percent in 2012.
TASKS
Task 1 - Program Development and Administrative Coordination
This task provides for the necessary staff time and expenses incurred by OTS that are directly related to the planning,
development, coordination, monitoring, auditing, and evaluation of grants within this program area, and the preparation of
the 2014 HSP. Funding is also provided in this task for the printing of brochures and pamphlets, distributing literature and
media materials developed through successful grants, or obtained from other sources. Assistance is also provided under this
task to individuals to attend and participate in committees, training sessions, or educational meetings or conferences.
Task 2 - Enforcement, Public Education and Public Information
This task provides funding for statewide public information, education, and media campaign focusing on the dangers of
distracted driving, texting and using a cell phone while driving. In addition, an effort will be geared towards teen drivers.
Task 3 – Evaluation
This task provides funding for one grant to evaluate sample data of driver’s licenses and the association of distracted driving
citations and crashes.
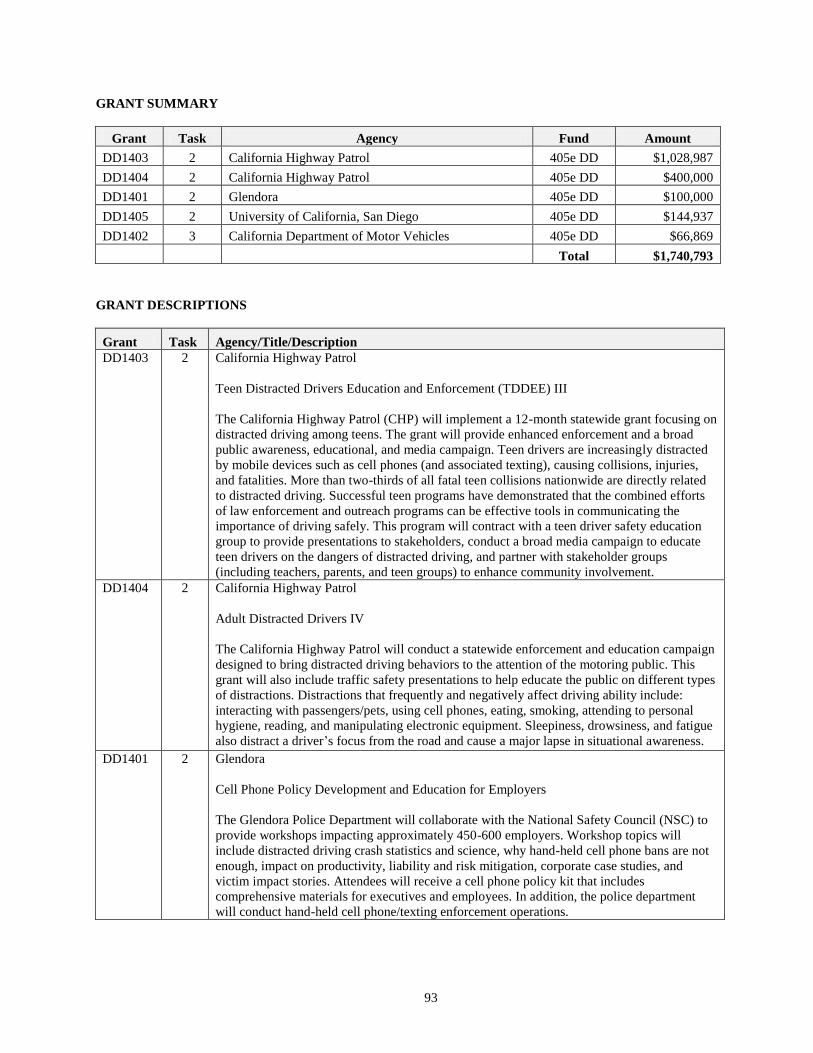
93
GRANT SUMMARY
Grant Task Agency Fund Amount
DD1403 2 California Highway Patrol 405e DD $1,028,987
DD1404 2 California Highway Patrol 405e DD $400,000
DD1401 2 Glendora 405e DD $100,000
DD1405 2 University of California, San Diego 405e DD $144,937
DD1402 3 California Department of Motor Vehicles 405e DD $66,869
Total $1,740,793
GRANT DESCRIPTIONS
Grant Task Agency/Title/Description
DD1403 2 California Highway Patrol
Teen Distracted Drivers Education and Enforcement (TDDEE) III
The California Highway Patrol (CHP) will implement a 12-month statewide grant focusing on
distracted driving among teens. The grant will provide enhanced enforcement and a broad
public awareness, educational, and media campaign. Teen drivers are increasingly distracted
by mobile devices such as cell phones (and associated texting), causing collisions, injuries,
and fatalities. More than two-thirds of all fatal teen collisions nationwide are directly related
to distracted driving. Successful teen programs have demonstrated that the combined efforts
of law enforcement and outreach programs can be effective tools in communicating the
importance of driving safely. This program will contract with a teen driver safety education
group to provide presentations to stakeholders, conduct a broad media campaign to educate
teen drivers on the dangers of distracted driving, and partner with stakeholder groups
(including teachers, parents, and teen groups) to enhance community involvement.
DD1404 2 California Highway Patrol
Adult Distracted Drivers IV
The California Highway Patrol will conduct a statewide enforcement and education campaign
designed to bring distracted driving behaviors to the attention of the motoring public. This
grant will also include traffic safety presentations to help educate the public on different types
of distractions. Distractions that frequently and negatively affect driving ability include:
interacting with passengers/pets, using cell phones, eating, smoking, attending to personal
hygiene, reading, and manipulating electronic equipment. Sleepiness, drowsiness, and fatigue
also distract a driver’s focus from the road and cause a major lapse in situational awareness.
DD1401 2 Glendora
Cell Phone Policy Development and Education for Employers
The Glendora Police Department will collaborate with the National Safety Council (NSC) to
provide workshops impacting approximately 450-600 employers. Workshop topics will
include distracted driving crash statistics and science, why hand-held cell phone bans are not
enough, impact on productivity, liability and risk mitigation, corporate case studies, and
victim impact stories. Attendees will receive a cell phone policy kit that includes
comprehensive materials for executives and employees. In addition, the police department
will conduct hand-held cell phone/texting enforcement operations.
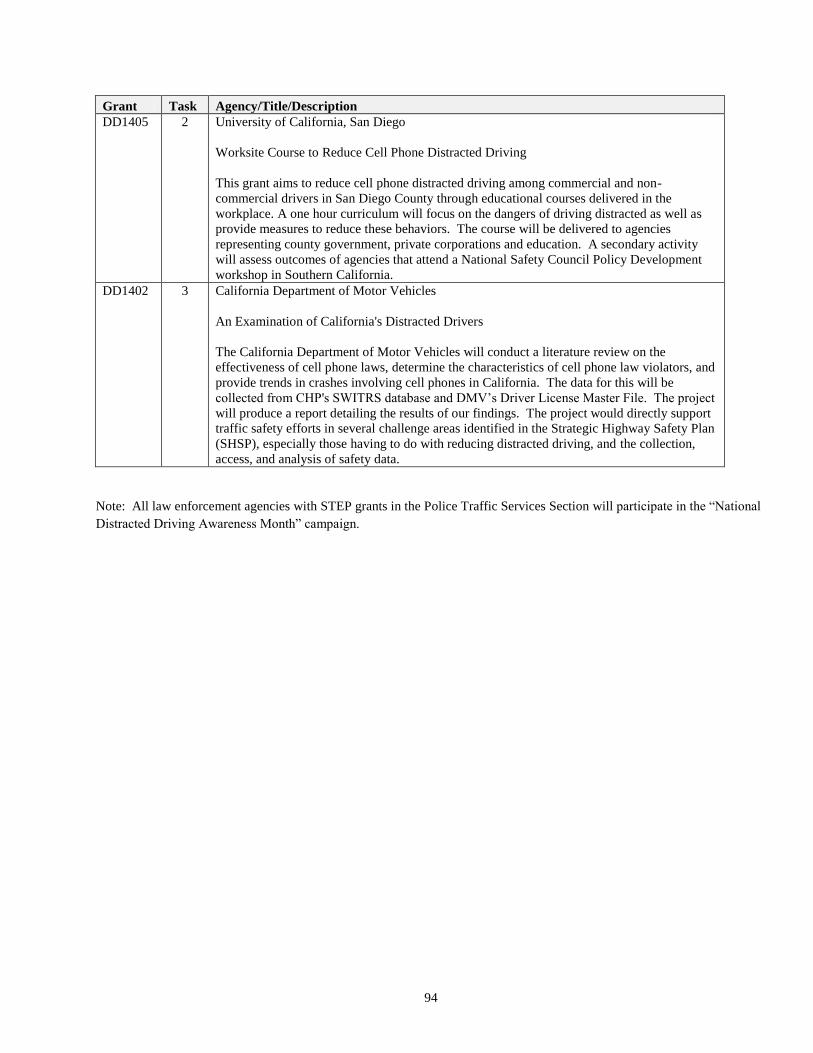
94
Grant Task Agency/Title/Description
DD1405 2 University of California, San Diego
Worksite Course to Reduce Cell Phone Distracted Driving
This grant aims to reduce cell phone distracted driving among commercial and non-
commercial drivers in San Diego County through educational courses delivered in the
workplace. A one hour curriculum will focus on the dangers of driving distracted as well as
provide measures to reduce these behaviors. The course will be delivered to agencies
representing county government, private corporations and education. A secondary activity
will assess outcomes of agencies that attend a National Safety Council Policy Development
workshop in Southern California.
DD1402 3 California Department of Motor Vehicles
An Examination of California's Distracted Drivers
The California Department of Motor Vehicles will conduct a literature review on the
effectiveness of cell phone laws, determine the characteristics of cell phone law violators, and
provide trends in crashes involving cell phones in California. The data for this will be
collected from CHP's SWITRS database and DMV’s Driver License Master File. The project
will produce a report detailing the results of our findings. The project would directly support
traffic safety efforts in several challenge areas identified in the Strategic Highway Safety Plan
(SHSP), especially those having to do with reducing distracted driving, and the collection,
access, and analysis of safety data.
Note: All law enforcement agencies with STEP grants in the Police Traffic Services Section will participate in the “National
Distracted Driving Awareness Month” campaign.
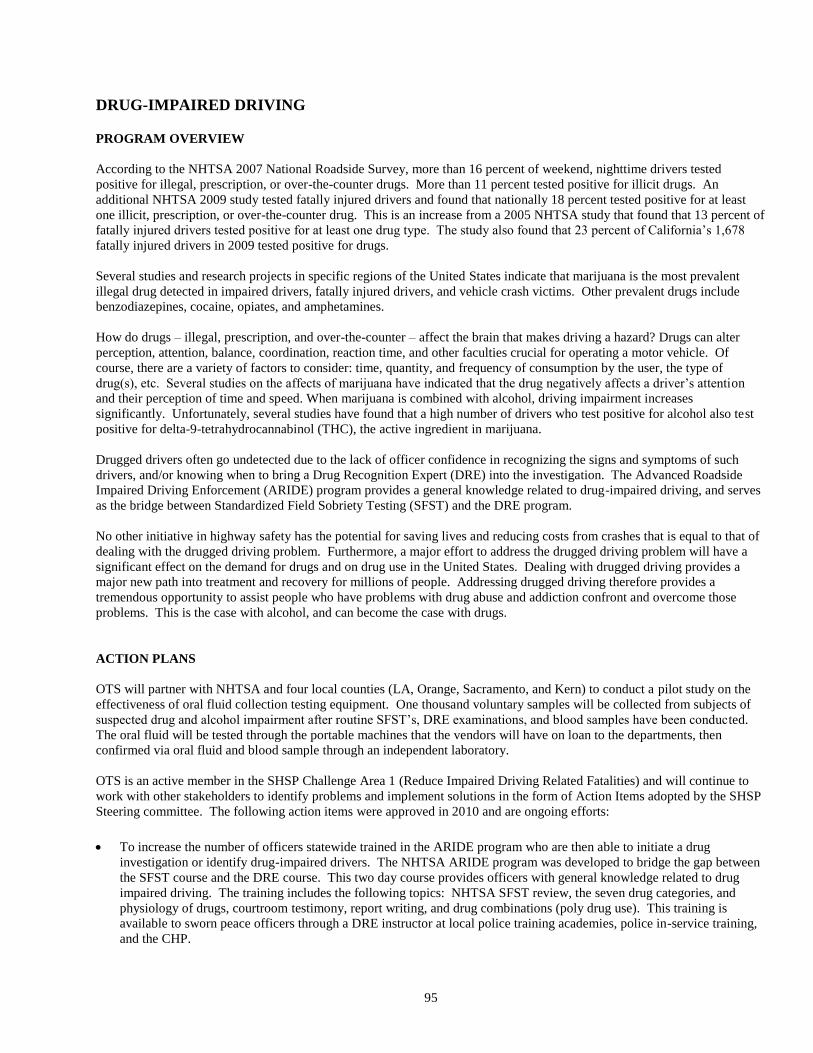
95
DRUG-IMPAIRED DRIVING PROGRAM OVERVIEW
According to the NHTSA 2007 National Roadside Survey, more than 16 percent of weekend, nighttime drivers tested
positive for illegal, prescription, or over-the-counter drugs. More than 11 percent tested positive for illicit drugs. An
additional NHTSA 2009 study tested fatally injured drivers and found that nationally 18 percent tested positive for at least
one illicit, prescription, or over-the-counter drug. This is an increase from a 2005 NHTSA study that found that 13 percent of
fatally injured drivers tested positive for at least one drug type. The study also found that 23 percent of California’s 1,678
fatally injured drivers in 2009 tested positive for drugs.
Several studies and research projects in specific regions of the United States indicate that marijuana is the most prevalent
illegal drug detected in impaired drivers, fatally injured drivers, and vehicle crash victims. Other prevalent drugs include
benzodiazepines, cocaine, opiates, and amphetamines.
How do drugs – illegal, prescription, and over-the-counter – affect the brain that makes driving a hazard? Drugs can alter
perception, attention, balance, coordination, reaction time, and other faculties crucial for operating a motor vehicle. Of
course, there are a variety of factors to consider: time, quantity, and frequency of consumption by the user, the type of
drug(s), etc. Several studies on the affects of marijuana have indicated that the drug negatively affects a driver’s attention
and their perception of time and speed. When marijuana is combined with alcohol, driving impairment increases
significantly. Unfortunately, several studies have found that a high number of drivers who test positive for alcohol also test
positive for delta-9-tetrahydrocannabinol (THC), the active ingredient in marijuana.
Drugged drivers often go undetected due to the lack of officer confidence in recognizing the signs and symptoms of such
drivers, and/or knowing when to bring a Drug Recognition Expert (DRE) into the investigation. The Advanced Roadside
Impaired Driving Enforcement (ARIDE) program provides a general knowledge related to drug-impaired driving, and serves
as the bridge between Standardized Field Sobriety Testing (SFST) and the DRE program.
No other initiative in highway safety has the potential for saving lives and reducing costs from crashes that is equal to that of
dealing with the drugged driving problem. Furthermore, a major effort to address the drugged driving problem will have a
significant effect on the demand for drugs and on drug use in the United States. Dealing with drugged driving provides a
major new path into treatment and recovery for millions of people. Addressing drugged driving therefore provides a
tremendous opportunity to assist people who have problems with drug abuse and addiction confront and overcome those
problems. This is the case with alcohol, and can become the case with drugs.
ACTION PLANS
OTS will partner with NHTSA and four local counties (LA, Orange, Sacramento, and Kern) to conduct a pilot study on the
effectiveness of oral fluid collection testing equipment. One thousand voluntary samples will be collected from subjects of
suspected drug and alcohol impairment after routine SFST’s, DRE examinations, and blood samples have been conducted.
The oral fluid will be tested through the portable machines that the vendors will have on loan to the departments, then
confirmed via oral fluid and blood sample through an independent laboratory.
OTS is an active member in the SHSP Challenge Area 1 (Reduce Impaired Driving Related Fatalities) and will continue to
work with other stakeholders to identify problems and implement solutions in the form of Action Items adopted by the SHSP
Steering committee. The following action items were approved in 2010 and are ongoing efforts:
To increase the number of officers statewide trained in the ARIDE program who are then able to initiate a drug
investigation or identify drug-impaired drivers. The NHTSA ARIDE program was developed to bridge the gap between
the SFST course and the DRE course. This two day course provides officers with general knowledge related to drug
impaired driving. The training includes the following topics: NHTSA SFST review, the seven drug categories, and
physiology of drugs, courtroom testimony, report writing, and drug combinations (poly drug use). This training is
available to sworn peace officers through a DRE instructor at local police training academies, police in-service training,
and the CHP.
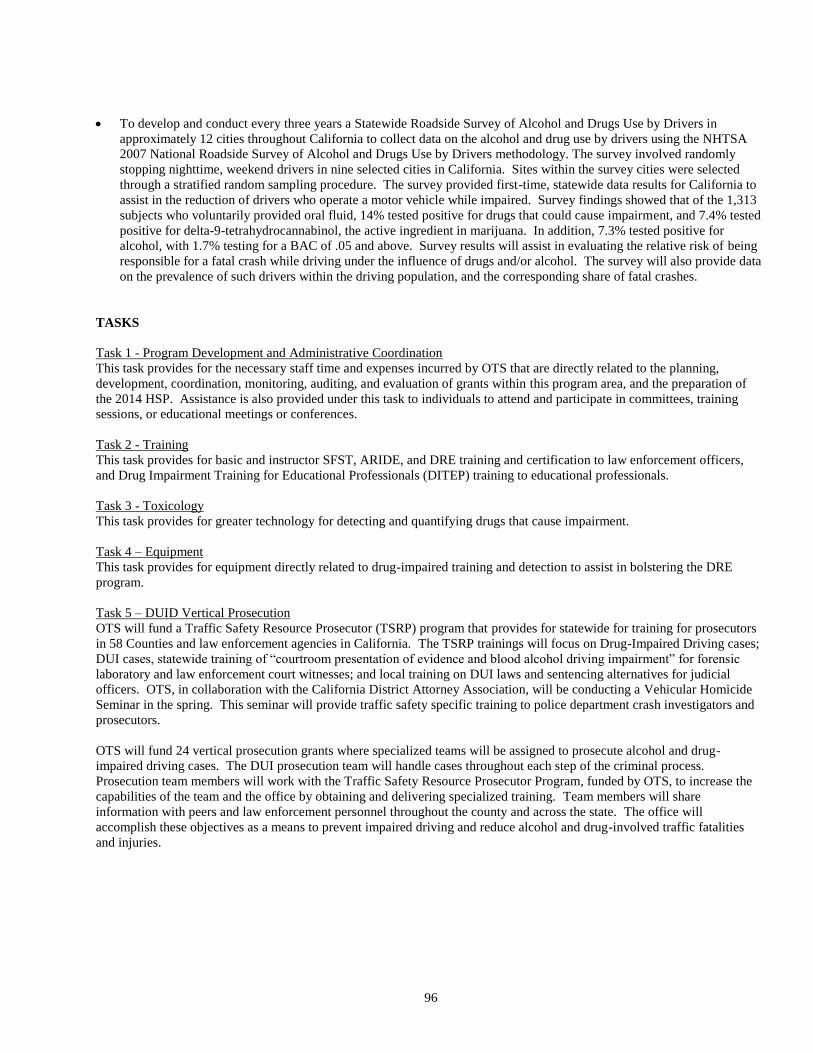
96
To develop and conduct every three years a Statewide Roadside Survey of Alcohol and Drugs Use by Drivers in
approximately 12 cities throughout California to collect data on the alcohol and drug use by drivers using the NHTSA
2007 National Roadside Survey of Alcohol and Drugs Use by Drivers methodology. The survey involved randomly
stopping nighttime, weekend drivers in nine selected cities in California. Sites within the survey cities were selected
through a stratified random sampling procedure. The survey provided first-time, statewide data results for California to
assist in the reduction of drivers who operate a motor vehicle while impaired. Survey findings showed that of the 1,313
subjects who voluntarily provided oral fluid, 14% tested positive for drugs that could cause impairment, and 7.4% tested
positive for delta-9-tetrahydrocannabinol, the active ingredient in marijuana. In addition, 7.3% tested positive for
alcohol, with 1.7% testing for a BAC of .05 and above. Survey results will assist in evaluating the relative risk of being
responsible for a fatal crash while driving under the influence of drugs and/or alcohol. The survey will also provide data
on the prevalence of such drivers within the driving population, and the corresponding share of fatal crashes.
TASKS
Task 1 - Program Development and Administrative Coordination
This task provides for the necessary staff time and expenses incurred by OTS that are directly related to the planning,
development, coordination, monitoring, auditing, and evaluation of grants within this program area, and the preparation of
the 2014 HSP. Assistance is also provided under this task to individuals to attend and participate in committees, training
sessions, or educational meetings or conferences.
Task 2 - Training
This task provides for basic and instructor SFST, ARIDE, and DRE training and certification to law enforcement officers,
and Drug Impairment Training for Educational Professionals (DITEP) training to educational professionals.
Task 3 - Toxicology
This task provides for greater technology for detecting and quantifying drugs that cause impairment.
Task 4 – Equipment
This task provides for equipment directly related to drug-impaired training and detection to assist in bolstering the DRE
program.
Task 5 – DUID Vertical Prosecution
OTS will fund a Traffic Safety Resource Prosecutor (TSRP) program that provides for statewide for training for prosecutors
in 58 Counties and law enforcement agencies in California. The TSRP trainings will focus on Drug-Impaired Driving cases;
DUI cases, statewide training of “courtroom presentation of evidence and blood alcohol driving impairment” for forensic
laboratory and law enforcement court witnesses; and local training on DUI laws and sentencing alternatives for judicial
officers. OTS, in collaboration with the California District Attorney Association, will be conducting a Vehicular Homicide
Seminar in the spring. This seminar will provide traffic safety specific training to police department crash investigators and
prosecutors.
OTS will fund 24 vertical prosecution grants where specialized teams will be assigned to prosecute alcohol and drug-
impaired driving cases. The DUI prosecution team will handle cases throughout each step of the criminal process.
Prosecution team members will work with the Traffic Safety Resource Prosecutor Program, funded by OTS, to increase the
capabilities of the team and the office by obtaining and delivering specialized training. Team members will share
information with peers and law enforcement personnel throughout the county and across the state. The office will
accomplish these objectives as a means to prevent impaired driving and reduce alcohol and drug-involved traffic fatalities
and injuries.
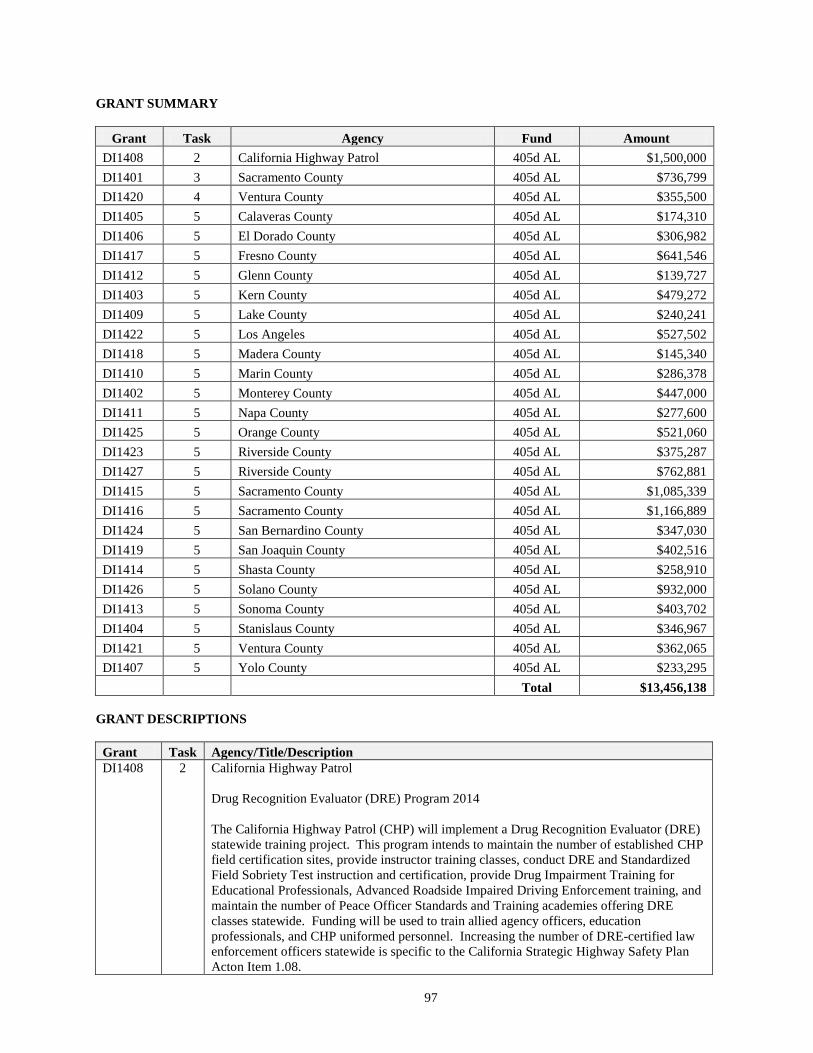
97
GRANT SUMMARY
Grant Task Agency Fund Amount
DI1408 2 California Highway Patrol 405d AL $1,500,000
DI1401 3 Sacramento County 405d AL $736,799
DI1420 4 Ventura County 405d AL $355,500
DI1405 5 Calaveras County 405d AL $174,310
DI1406 5 El Dorado County 405d AL $306,982
DI1417 5 Fresno County 405d AL $641,546
DI1412 5 Glenn County 405d AL $139,727
DI1403 5 Kern County 405d AL $479,272
DI1409 5 Lake County 405d AL $240,241
DI1422 5 Los Angeles 405d AL $527,502
DI1418 5 Madera County 405d AL $145,340
DI1410 5 Marin County 405d AL $286,378
DI1402 5 Monterey County 405d AL $447,000
DI1411 5 Napa County 405d AL $277,600
DI1425 5 Orange County 405d AL $521,060
DI1423 5 Riverside County 405d AL $375,287
DI1427 5 Riverside County 405d AL $762,881
DI1415 5 Sacramento County 405d AL $1,085,339
DI1416 5 Sacramento County 405d AL $1,166,889
DI1424 5 San Bernardino County 405d AL $347,030
DI1419 5 San Joaquin County 405d AL $402,516
DI1414 5 Shasta County 405d AL $258,910
DI1426 5 Solano County 405d AL $932,000
DI1413 5 Sonoma County 405d AL $403,702
DI1404 5 Stanislaus County 405d AL $346,967
DI1421 5 Ventura County 405d AL $362,065
DI1407 5 Yolo County 405d AL $233,295
Total $13,456,138
GRANT DESCRIPTIONS
Grant Task Agency/Title/Description
DI1408 2 California Highway Patrol
Drug Recognition Evaluator (DRE) Program 2014
The California Highway Patrol (CHP) will implement a Drug Recognition Evaluator (DRE)
statewide training project. This program intends to maintain the number of established CHP
field certification sites, provide instructor training classes, conduct DRE and Standardized
Field Sobriety Test instruction and certification, provide Drug Impairment Training for
Educational Professionals, Advanced Roadside Impaired Driving Enforcement training, and
maintain the number of Peace Officer Standards and Training academies offering DRE
classes statewide. Funding will be used to train allied agency officers, education
professionals, and CHP uniformed personnel. Increasing the number of DRE-certified law
enforcement officers statewide is specific to the California Strategic Highway Safety Plan
Acton Item 1.08.
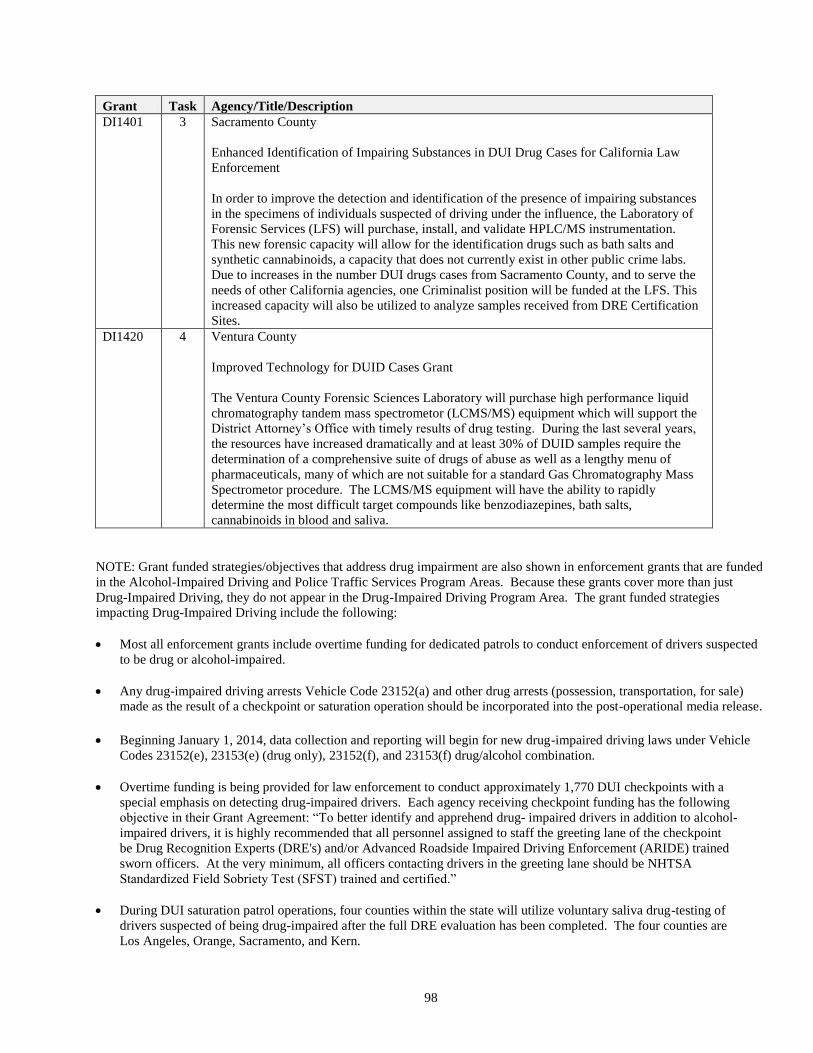
98
Grant Task Agency/Title/Description
DI1401 3 Sacramento County
Enhanced Identification of Impairing Substances in DUI Drug Cases for California Law
Enforcement
In order to improve the detection and identification of the presence of impairing substances
in the specimens of individuals suspected of driving under the influence, the Laboratory of
Forensic Services (LFS) will purchase, install, and validate HPLC/MS instrumentation.
This new forensic capacity will allow for the identification drugs such as bath salts and
synthetic cannabinoids, a capacity that does not currently exist in other public crime labs.
Due to increases in the number DUI drugs cases from Sacramento County, and to serve the
needs of other California agencies, one Criminalist position will be funded at the LFS. This
increased capacity will also be utilized to analyze samples received from DRE Certification
Sites.
DI1420 4 Ventura County
Improved Technology for DUID Cases Grant
The Ventura County Forensic Sciences Laboratory will purchase high performance liquid
chromatography tandem mass spectrometor (LCMS/MS) equipment which will support the
District Attorney’s Office with timely results of drug testing. During the last several years,
the resources have increased dramatically and at least 30% of DUID samples require the
determination of a comprehensive suite of drugs of abuse as well as a lengthy menu of
pharmaceuticals, many of which are not suitable for a standard Gas Chromatography Mass
Spectrometor procedure. The LCMS/MS equipment will have the ability to rapidly
determine the most difficult target compounds like benzodiazepines, bath salts,
cannabinoids in blood and saliva.
NOTE: Grant funded strategies/objectives that address drug impairment are also shown in enforcement grants that are funded
in the Alcohol-Impaired Driving and Police Traffic Services Program Areas. Because these grants cover more than just
Drug-Impaired Driving, they do not appear in the Drug-Impaired Driving Program Area. The grant funded strategies
impacting Drug-Impaired Driving include the following:
Most all enforcement grants include overtime funding for dedicated patrols to conduct enforcement of drivers suspected
to be drug or alcohol-impaired.
Any drug-impaired driving arrests Vehicle Code 23152(a) and other drug arrests (possession, transportation, for sale)
made as the result of a checkpoint or saturation operation should be incorporated into the post-operational media release.
Beginning January 1, 2014, data collection and reporting will begin for new drug-impaired driving laws under Vehicle
Codes 23152(e), 23153(e) (drug only), 23152(f), and 23153(f) drug/alcohol combination.
Overtime funding is being provided for law enforcement to conduct approximately 1,770 DUI checkpoints with a
special emphasis on detecting drug-impaired drivers. Each agency receiving checkpoint funding has the following
objective in their Grant Agreement: “To better identify and apprehend drug- impaired drivers in addition to alcohol-
impaired drivers, it is highly recommended that all personnel assigned to staff the greeting lane of the checkpoint
be Drug Recognition Experts (DRE's) and/or Advanced Roadside Impaired Driving Enforcement (ARIDE) trained
sworn officers. At the very minimum, all officers contacting drivers in the greeting lane should be NHTSA
Standardized Field Sobriety Test (SFST) trained and certified.”
During DUI saturation patrol operations, four counties within the state will utilize voluntary saliva drug-testing of
drivers suspected of being drug-impaired after the full DRE evaluation has been completed. The four counties are
Los Angeles, Orange, Sacramento, and Kern.

99
A minimum of 30 Advanced Roadside Impaired Driving Enforcement (ARIDE) trainings will be conducted for at least
550 officers statewide.
A minimum of six initial DRE classes will be conducted training at least 210 law enforcement officers.
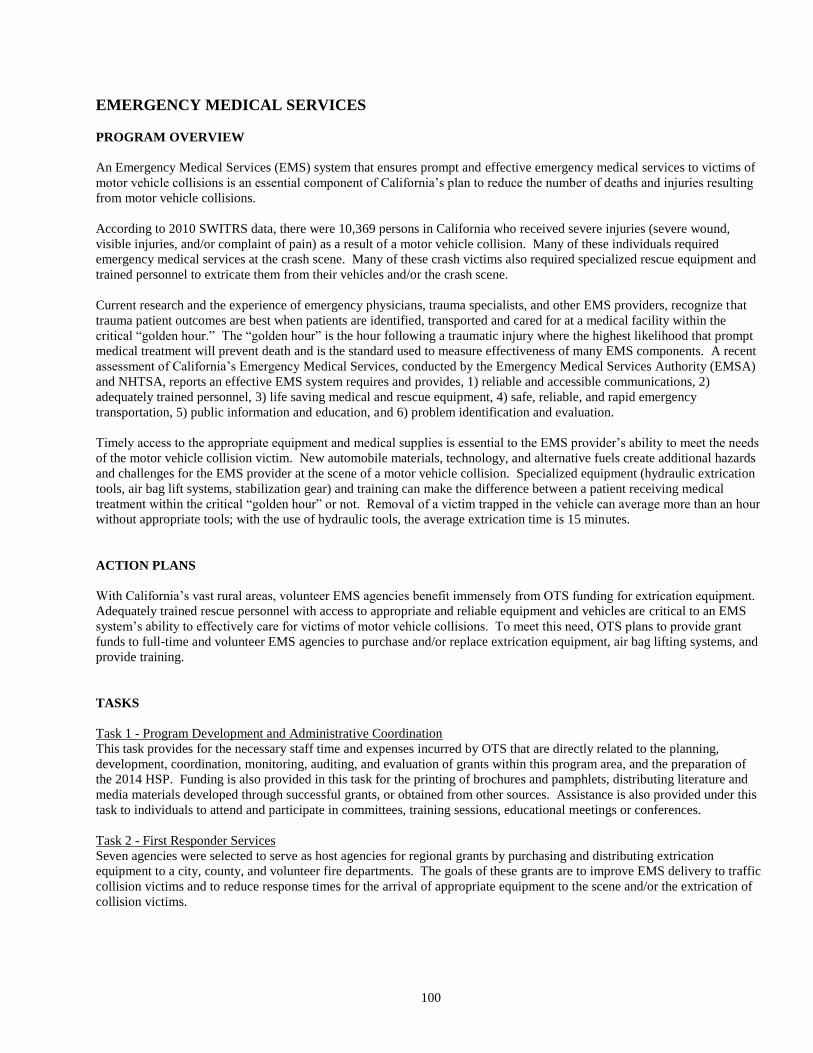
100
EMERGENCY MEDICAL SERVICES
PROGRAM OVERVIEW
An Emergency Medical Services (EMS) system that ensures prompt and effective emergency medical services to victims of
motor vehicle collisions is an essential component of California’s plan to reduce the number of deaths and injuries resulting
from motor vehicle collisions.
According to 2010 SWITRS data, there were 10,369 persons in California who received severe injuries (severe wound,
visible injuries, and/or complaint of pain) as a result of a motor vehicle collision. Many of these individuals required
emergency medical services at the crash scene. Many of these crash victims also required specialized rescue equipment and
trained personnel to extricate them from their vehicles and/or the crash scene.
Current research and the experience of emergency physicians, trauma specialists, and other EMS providers, recognize that
trauma patient outcomes are best when patients are identified, transported and cared for at a medical facility within the
critical “golden hour.” The “golden hour” is the hour following a traumatic injury where the highest likelihood that prompt
medical treatment will prevent death and is the standard used to measure effectiveness of many EMS components. A recent
assessment of California’s Emergency Medical Services, conducted by the Emergency Medical Services Authority (EMSA)
and NHTSA, reports an effective EMS system requires and provides, 1) reliable and accessible communications, 2)
adequately trained personnel, 3) life saving medical and rescue equipment, 4) safe, reliable, and rapid emergency
transportation, 5) public information and education, and 6) problem identification and evaluation.
Timely access to the appropriate equipment and medical supplies is essential to the EMS provider’s ability to meet the needs
of the motor vehicle collision victim. New automobile materials, technology, and alternative fuels create additional hazards
and challenges for the EMS provider at the scene of a motor vehicle collision. Specialized equipment (hydraulic extrication
tools, air bag lift systems, stabilization gear) and training can make the difference between a patient receiving medical
treatment within the critical “golden hour” or not. Removal of a victim trapped in the vehicle can average more than an hour
without appropriate tools; with the use of hydraulic tools, the average extrication time is 15 minutes.
ACTION PLANS
With California’s vast rural areas, volunteer EMS agencies benefit immensely from OTS funding for extrication equipment.
Adequately trained rescue personnel with access to appropriate and reliable equipment and vehicles are critical to an EMS
system’s ability to effectively care for victims of motor vehicle collisions. To meet this need, OTS plans to provide grant
funds to full-time and volunteer EMS agencies to purchase and/or replace extrication equipment, air bag lifting systems, and
provide training.
TASKS
Task 1 - Program Development and Administrative Coordination
This task provides for the necessary staff time and expenses incurred by OTS that are directly related to the planning,
development, coordination, monitoring, auditing, and evaluation of grants within this program area, and the preparation of
the 2014 HSP. Funding is also provided in this task for the printing of brochures and pamphlets, distributing literature and
media materials developed through successful grants, or obtained from other sources. Assistance is also provided under this
task to individuals to attend and participate in committees, training sessions, educational meetings or conferences.
Task 2 - First Responder Services
Seven agencies were selected to serve as host agencies for regional grants by purchasing and distributing extrication
equipment to a city, county, and volunteer fire departments. The goals of these grants are to improve EMS delivery to traffic
collision victims and to reduce response times for the arrival of appropriate equipment to the scene and/or the extrication of
collision victims.

101
GRANT SUMMARY
Grant Task Agency Fund Amount
EM1406 2 Dunsmuir 402EM $200,000
EM1407 2 French Camp McKinley Fire District 402EM $250,000
EM1403 2 Kings County 402EM $95,000
EM1402 2 Merced County 402EM $100,000
EM1405 2 Oakland 402EM $300,000
EM1401 2 Santa Maria 402EM $200,000
EM1404 2 Windsor 402EM $150,000
Total $1,295,000
102
MOTORCYCLE SAFETY
PROGRAM OVERVIEW
In 2009, motorcycle fatalities saw their first drop since 1998, marking the end to an 11-year, 175 percent increase.
Motorcycle fatalities decreased 10.7 percent from 394 in 2009 to 352 in 2010, while motorcycle registrations decreased less
than one percent from 809,129 in 2009 to 808,634 in 2010. In 2011, 414 motorcycle riders were killed in California, a 15
percent increase from 2010 and ending the two-year trend of reduced fatalities. Preliminary 2012 fatality numbers indicate
very little change in the number of riders killed compared to 2011. The leveling-off of the number of riders killed occurred
despite an increase in the number of registered motorcycles of nearly 2 percent in 2012.
Pursuant to California Vehicle Code Section 2930-2935, the CHP Commissioner is responsible for administering the
California Motorcyclist Safety Program (CMSP), the state’s official novice motorcycle safety training program since July
1987. As such, the CHP currently contracts with the Motorcycle Safety Foundation to deliver the CMSP. The CMSP
currently operates at 137 training ranges. Since the CMSP’s launch, over 850,000 students have been trained. In 2012,
CMSP trained 63,942 students, a 3.6 percent increase over the 61,709 trained in 2011. OTS is currently a member of the
California Motorcyclists Safety Program (CMSP) Advisory Committee chaired by CHP. The committee acts in an advisory
capacity for the California Motorcyclists Safety Program which is a statewide motorcycle rider training program.
Pursuant to state statute, funding for motorcycle safety training is consistently available on an annual basis; $2 from every
motorcycle registration is placed into the California Motorcyclist Safety Fund (CMSF). The CHP receives an annual
legislative appropriation of $2,278,000 from the CMSF to operate the CMSP. An additional amount of $250,000 from the
State Penalty Assessment Fund is deposited into the CMSF for CMSP operation.
Effective January 1, 1992, everyone riding a motorcycle in California is required to wear a helmet that meets established
federal safety standards. Although there have been several attempts to have the law amended or repealed, attempts have not
succeeded due in part to data provided by SWITRS reflecting information before and after implementation of the helmet law.
ACTION PLANS
OTS plays a leading role on the Strategic Highway Safety Plan - Challenge Area 12 workgroup to Improve Motorcycle
Safety. Challenge Area 12 includes Co-Leads from CHP and DMV and representatives from Caltrans, local law enforcement
and other motorcycle safety stakeholders. OTS and the other CA-12 partners continue to work on SNAPs (Safety Needs
Action Plan) including a motorcycle crash data collection project examining helmet usage, injury types, actual blood alcohol
concentration levels, and lane splitting data. These data points are not currently captured by the CHP’s Statewide Integrated
Traffic Records System but are invaluable in determining collision trends and new strategies to reduce motorcycle-involved
fatal and injury collisions. OTS liaisons with motorcycle rights organizations and other motorcycle stakeholders to develop
strategies and to distribute information about the state’s motorcycle safety efforts.
In September 2008, OTS, in conjunction with NHTSA, conducted California’s first Motorcycle Safety Assessment. This
evaluation provided OTS an outside review of California’s motorcycle safety program(s). NHTSA provided a nationally
recognized team of experts to evaluate current status and provide recommendations for improvements/enhancements on
programs related to motorcycles and motorcycle safety. Recommendations related to enforcement and public awareness are
being incorporated into grants to local law enforcement agencies and the CHP.
OTS will fund public awareness efforts through law enforcement grants. These grants include outreach at a variety of
motorcycle events. Activities include booths providing information about training, DOT- compliant helmets and other
protective gear, as well as safe and sober riding. OTS funded an exhibit trailer housing two motorcycles that were involved
in fatal crashes. The trailer will continue to be displayed at motorcycle events as a means to raise awareness among
motorcyclists and other drivers about need to share the road and to ride and drive safe and sober.
Law enforcement also will conduct highly publicized motorcycle safety enforcement operations targeting areas and events
with significant motorcycle traffic. The operations will focus on impaired driving/riding and primary collision factor
violations by riders and other vehicle drivers that contribute to motorcycle collisions. Every motorcycle safety enforcement
operation will be accompanied by earned-media efforts that will inform the public of the enforcement operation and increase
awareness about motorcycle safety.
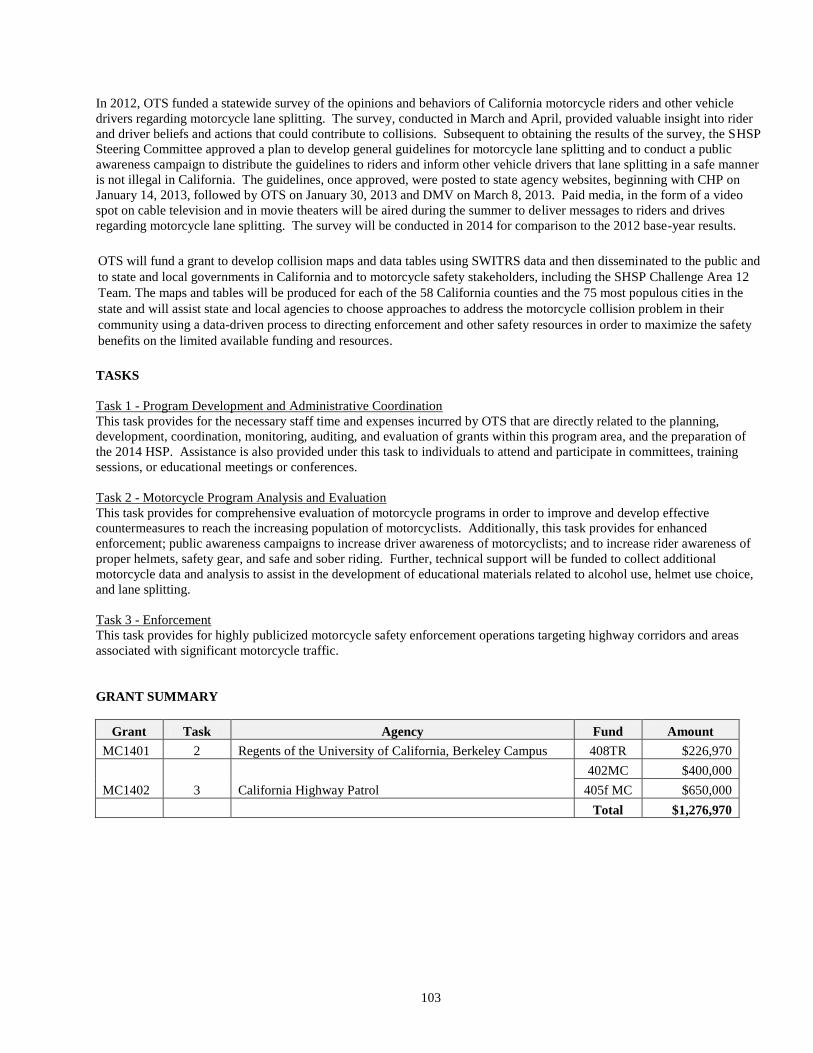
103
In 2012, OTS funded a statewide survey of the opinions and behaviors of California motorcycle riders and other vehicle
drivers regarding motorcycle lane splitting. The survey, conducted in March and April, provided valuable insight into rider
and driver beliefs and actions that could contribute to collisions. Subsequent to obtaining the results of the survey, the SHSP
Steering Committee approved a plan to develop general guidelines for motorcycle lane splitting and to conduct a public
awareness campaign to distribute the guidelines to riders and inform other vehicle drivers that lane splitting in a safe manner
is not illegal in California. The guidelines, once approved, were posted to state agency websites, beginning with CHP on
January 14, 2013, followed by OTS on January 30, 2013 and DMV on March 8, 2013. Paid media, in the form of a video
spot on cable television and in movie theaters will be aired during the summer to deliver messages to riders and drives
regarding motorcycle lane splitting. The survey will be conducted in 2014 for comparison to the 2012 base-year results.
OTS will fund a grant to develop collision maps and data tables using SWITRS data and then disseminated to the public and
to state and local governments in California and to motorcycle safety stakeholders, including the SHSP Challenge Area 12
Team. The maps and tables will be produced for each of the 58 California counties and the 75 most populous cities in the
state and will assist state and local agencies to choose approaches to address the motorcycle collision problem in their
community using a data-driven process to directing enforcement and other safety resources in order to maximize the safety
benefits on the limited available funding and resources.
TASKS
Task 1 - Program Development and Administrative Coordination
This task provides for the necessary staff time and expenses incurred by OTS that are directly related to the planning,
development, coordination, monitoring, auditing, and evaluation of grants within this program area, and the preparation of
the 2014 HSP. Assistance is also provided under this task to individuals to attend and participate in committees, training
sessions, or educational meetings or conferences.
Task 2 - Motorcycle Program Analysis and Evaluation
This task provides for comprehensive evaluation of motorcycle programs in order to improve and develop effective
countermeasures to reach the increasing population of motorcyclists. Additionally, this task provides for enhanced
enforcement; public awareness campaigns to increase driver awareness of motorcyclists; and to increase rider awareness of
proper helmets, safety gear, and safe and sober riding. Further, technical support will be funded to collect additional
motorcycle data and analysis to assist in the development of educational materials related to alcohol use, helmet use choice,
and lane splitting.
Task 3 - Enforcement
This task provides for highly publicized motorcycle safety enforcement operations targeting highway corridors and areas
associated with significant motorcycle traffic.
GRANT SUMMARY
Grant Task Agency Fund Amount
MC1401 2 Regents of the University of California, Berkeley Campus 408TR $226,970
MC1402 3 California Highway Patrol
402MC $400,000
405f MC $650,000
Total $1,276,970
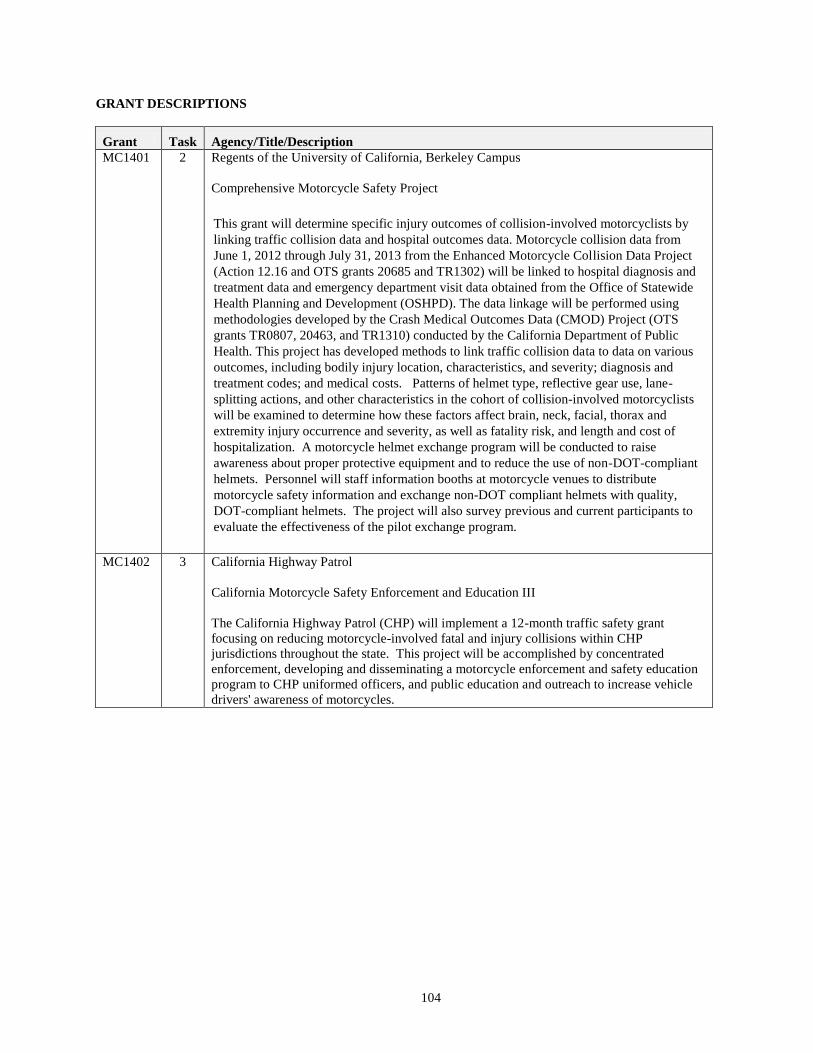
104
GRANT DESCRIPTIONS
Grant Task Agency/Title/Description
MC1401 2 Regents of the University of California, Berkeley Campus
Comprehensive Motorcycle Safety Project
This grant will determine specific injury outcomes of collision-involved motorcyclists by
linking traffic collision data and hospital outcomes data. Motorcycle collision data from
June 1, 2012 through July 31, 2013 from the Enhanced Motorcycle Collision Data Project
(Action 12.16 and OTS grants 20685 and TR1302) will be linked to hospital diagnosis and
treatment data and emergency department visit data obtained from the Office of Statewide
Health Planning and Development (OSHPD). The data linkage will be performed using
methodologies developed by the Crash Medical Outcomes Data (CMOD) Project (OTS
grants TR0807, 20463, and TR1310) conducted by the California Department of Public
Health. This project has developed methods to link traffic collision data to data on various
outcomes, including bodily injury location, characteristics, and severity; diagnosis and
treatment codes; and medical costs. Patterns of helmet type, reflective gear use, lane-
splitting actions, and other characteristics in the cohort of collision-involved motorcyclists
will be examined to determine how these factors affect brain, neck, facial, thorax and
extremity injury occurrence and severity, as well as fatality risk, and length and cost of
hospitalization. A motorcycle helmet exchange program will be conducted to raise
awareness about proper protective equipment and to reduce the use of non-DOT-compliant
helmets. Personnel will staff information booths at motorcycle venues to distribute
motorcycle safety information and exchange non-DOT compliant helmets with quality,
DOT-compliant helmets. The project will also survey previous and current participants to
evaluate the effectiveness of the pilot exchange program.
MC1402 3 California Highway Patrol
California Motorcycle Safety Enforcement and Education III
The California Highway Patrol (CHP) will implement a 12-month traffic safety grant
focusing on reducing motorcycle-involved fatal and injury collisions within CHP
jurisdictions throughout the state. This project will be accomplished by concentrated
enforcement, developing and disseminating a motorcycle enforcement and safety education
program to CHP uniformed officers, and public education and outreach to increase vehicle
drivers' awareness of motorcycles.
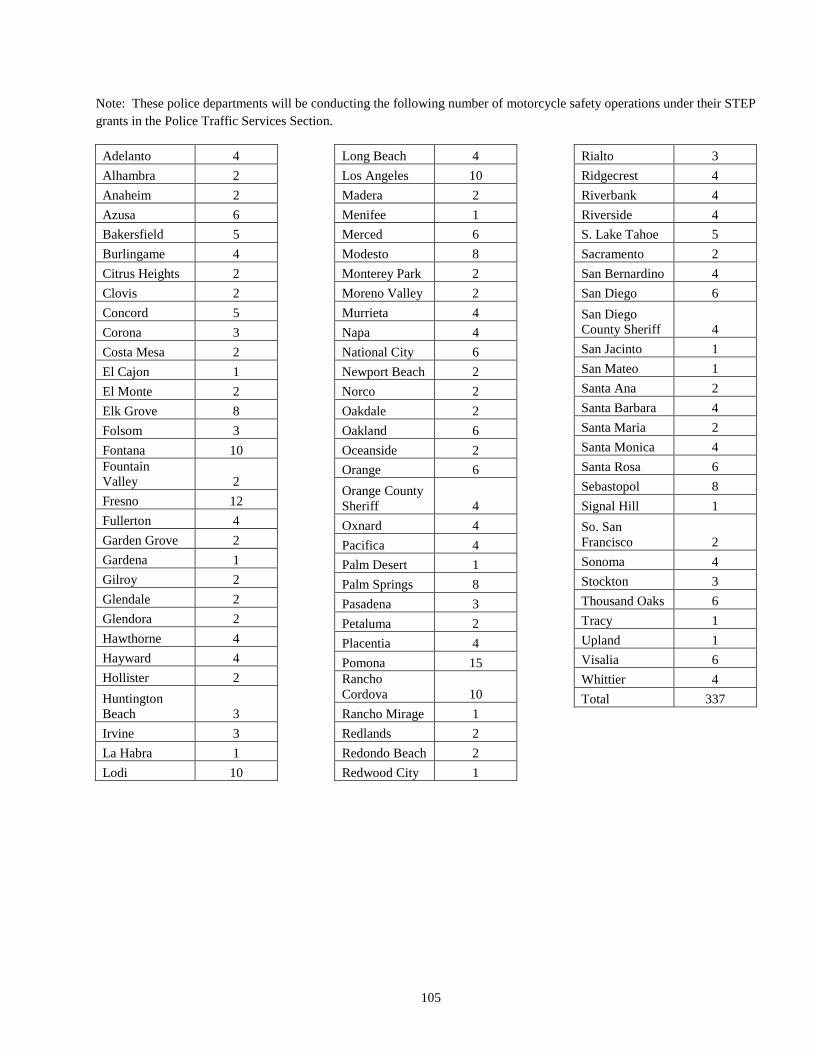
105
Note: These police departments will be conducting the following number of motorcycle safety operations under their STEP
grants in the Police Traffic Services Section.
Adelanto 4
Alhambra 2
Anaheim 2
Azusa 6
Bakersfield 5
Burlingame 4
Citrus Heights 2
Clovis 2
Concord 5
Corona 3
Costa Mesa 2
El Cajon 1
El Monte 2
Elk Grove 8
Folsom 3
Fontana 10
Fountain
Valley 2
Fresno 12
Fullerton 4
Garden Grove 2
Gardena 1
Gilroy 2
Glendale 2
Glendora 2
Hawthorne 4
Hayward 4
Hollister 2
Huntington
Beach 3
Irvine 3
La Habra 1
Lodi 10
Long Beach 4
Los Angeles 10
Madera 2
Menifee 1
Merced 6
Modesto 8
Monterey Park 2
Moreno Valley 2
Murrieta 4
Napa 4
National City 6
Newport Beach 2
Norco 2
Oakdale 2
Oakland 6
Oceanside 2
Orange 6
Orange County
Sheriff 4
Oxnard 4
Pacifica 4
Palm Desert 1
Palm Springs 8
Pasadena 3
Petaluma 2
Placentia 4
Pomona 15
Rancho
Cordova 10
Rancho Mirage 1
Redlands 2
Redondo Beach 2
Redwood City 1
Rialto 3
Ridgecrest 4
Riverbank 4
Riverside 4
S. Lake Tahoe 5
Sacramento 2
San Bernardino 4
San Diego 6
San Diego
County Sheriff 4
San Jacinto 1
San Mateo 1
Santa Ana 2
Santa Barbara 4
Santa Maria 2
Santa Monica 4
Santa Rosa 6
Sebastopol 8
Signal Hill 1
So. San
Francisco 2
Sonoma 4
Stockton 3
Thousand Oaks 6
Tracy 1
Upland 1
Visalia 6
Whittier 4
Total 337
106
OCCUPANT PROTECTION
PROGRAM OVERVIEW
Seat Belts
California’s 2012 seat belt use rate is 95.5 percent (August 2012), this represents 35.9 million persons wearing seat belts.
NHTSA estimates that 1,135 Californian lives were saved at the current seat belt use rate. However, the fact remains that
1,695,096 Californians are not utilizing restraint systems, and are therefore, at higher risk for death or injury, if involved in a
collision. In California, the percent of restrained passenger vehicle occupant fatalities (all seat positions) decreased from 67
percent in 2010 to 64 percent in 2011. California is much better than the national average of 46 percent and no state is better
than California. NHTSA estimates that about half or 260 of the 521 known unrestrained fatalities would be alive today had
they simply buckled up.
In 2012, California conducted its eighth teen statewide seat belt observational survey. The 2012 survey teen seat belt use rate
is 96.1 percent, up from 94 percent in 2010. While the teen seat belt compliance rate has increased 9.5 percentage points
since the first survey in 2004 with a rate of 86.6, more efforts need to be focused on that population. In 2010, the percent of
unrestrained passenger vehicle occupant “teenaged” fatalities was 41 percent. Of the five largest states in terms of total
traffic fatalities, (California, Florida, Texas, Pennsylvania, and North Carolina), California has the best rate. Since restraints
are about 50 percent effective in preventing a fatality, NHTSA estimates that half or 25 of the 50 teens would be alive today
had they simply buckled up.
Persons considered “high-risk,” (e.g., teens, non-English speakers, and those in the lower socioeconomic classes) remain
involved in a disproportionate number of fatal and injury collisions. The rich diversity that typifies many communities in
California contributes to the vitality and strength of the state as a whole. At the same time, it presents a number of challenges
for health departments, law enforcement, and community based organizations committed to addressing occupant protection.
This high-risk group requires special education and programs targeting cultural and language barriers. In California, we
continue to see an increase in ethnic and linguistic groups. According to the new projections by the California’s Department
of Finance Demographics Unit, the Hispanic populations will constitute the majority of California by 2020. By the middle of
the century, the projections indicate that Hispanics will represent 47 percent of the state’s population, with Caucasians
comprising 31 percent, the Asian population at 13.5 percent; the African American population at 4.6 percent, and Multiracial
persons 3.6 percent. Both American Indian and Hawaiian/Pacific Islander groups will each make up less than one percent of
the state by 2050. Media campaigns will target teens, Spanish, and non-English speaking populations. In addition, health
departments will utilize networks and relationships with ethnic communities to address traffic safety issues for the
populations they represent.
Child Passenger Safety (CPS)
California’s child safety seat use rate is 91.6 percent (August 2012). Child passenger safety remains a difficult topic to
master because of the constant technical changes in laws and regulations, and development of new products. California’s
focus is to increase the child passenger safety compliance rate. Programs will train NHTSA Child Passenger Safety
technicians and instructors, but most of all, conduct child passenger safety restraint checkups, create fitting stations and
conduct educational presentations.
National research on the effectiveness of child safety seats has found them to reduce fatal injury by
71 percent for infants (less than one year old) and by 54 percent for toddlers (1-4 years old) in passenger cars. For infants
and toddlers in light trucks, the corresponding reductions are 58 percent and 59 percent, respectively (National Center for
Statistics and Analysis – Lives Saved Calculations for Infants and Toddlers, March 2005). Passenger vehicle occupant
fatalities (age 0-8) decreased 53.9 percent from 65 in 2009 to 30 in 2010.
Using Section 2011 funds, OTS will promote California’s new booster seat safety law which went into effect on January 1,
2012 and requires children under age 8 (there are exceptions for those 4’9” but younger than 8) to ride in a safety seat or
booster, in the back seat of a motor vehicle. This new law will impact more than 1.1 million children in California. OTS will
continue to work with the California Highway Patrol, California Department of Public Health, and child passenger safety
advocates to develop educational materials on the new law, purchase child safety seats and booster seats, train parents and
107
officers on child passenger safety laws, and increase the number of NHTSA Child Passenger Safety Technicians. The
materials will include citation-sized cards for law enforcement officers and hand-outs for parents, hospitals, daycare facilities,
and schools. Child safety seats and booster seats also will be purchased and distributed at child safety seat checkups.
ACTION PLANS
California’s population grew less than one percent between July 1, 2011 and July 1, 2012 (California Department of Finance
2012 Demographic Report). This represents 256,000 new residents during the state fiscal year and continues the pattern of
modest growth rates over the past few years. The current growth rate of 0.70 percent is about the same as last year’s
population growth. OTS continues much needed funding to keep up with the new population totals, provide an ongoing
effective occupant protection program that assures the public is educated and motivated to use seat belts and child safety seats
on every ride. A combination of legislative mandates, enforcement, public information campaigns, education, and incentives
are necessary to achieve significant, lasting increases in occupant restraint usage.
The purpose of the 405 incentive grant program is to reinforce key elements of a strategy to encourage states to enact and
strengthen occupant protection laws and provide for the enforcement efforts related to the laws. The program will provide
for NHTSA’s Standardized Child Passenger Safety Training, the certification and re-certification program for the technician
and instructor level candidates, and provide for child passenger safety seat check-ups and fitting stations. The California
Department of Public Health (CDPH) provides assistance to OTS with the statewide coordination of child passenger safety
efforts in California. Through the Vehicle Occupant Safety Program, CDPH staff assists local agencies by providing
technician training and resources to counties and regions in need.
The fine for not wearing a seat belt or a driver allowing an unrestrained passenger is approximately $162 a first offense and
$285 for a second offense. Child passenger restraint violations are $490 for a first offense and $1,105 for a second offense.
TASKS
Task 1 - Program Development and Administrative Coordination
This task provides for the necessary staff time and expenses incurred by OTS that are directly related to the planning,
development, coordination, monitoring, auditing, and evaluation of grants within this program area, and the preparation of
the 2014 HSP. Funding is also provided in this task for the printing of brochures and pamphlets, distributing literature and
media materials developed through successful grants, or obtained from other sources. Assistance is also provided under this
task to individuals to attend and participate in committees, training sessions, educational meetings or conferences.
Task 2 - Comprehensive Community Occupant Protection Grants
These grants conducted by county health departments, cities, and law enforcement agencies include activities with schools,
universities, churches, medical facilities, law enforcement, courts, media, civic groups, large and small businesses,
governmental agencies, etc. These grants develop child safety seat programs that educate and train on the correct use of
safety belts and child safety seats. Activities include: conducting media events, public information campaigns, child safety
seat check-ups, child safety seat and seat belt surveys, educational presentations, providing NHTSA Certified Child
Passenger Safety Technician training; court diversion classes; disseminating educational literature; distributing no cost child
safety seats to low income families; and serving as fitting stations.
Task 3 – Statewide Occupant Protection Grants
These grants conducted by the Department of Public Health and California Highway Patrol will increase safety belt and child
safety seat education. Activities include: conducting media events, public information campaigns, child safety seat checkups,
child safety seat and seat belt surveys, educational presentations; disseminating educational literature; providing NHTSA
Certified Child Passenger Safety Technician training; distributing no cost child safety seats to low income families.
Task 4 - Statewide Usage Surveys
This task includes a grant for statewide observational seat belt, teen seat belt, and child safety seat usage rates.
Task 5 – Other Drivers
These grants will provide training and public awareness to the community and stakeholders related to older drivers, the
intellectually disabled, and motorists who drive near railroad crossings.
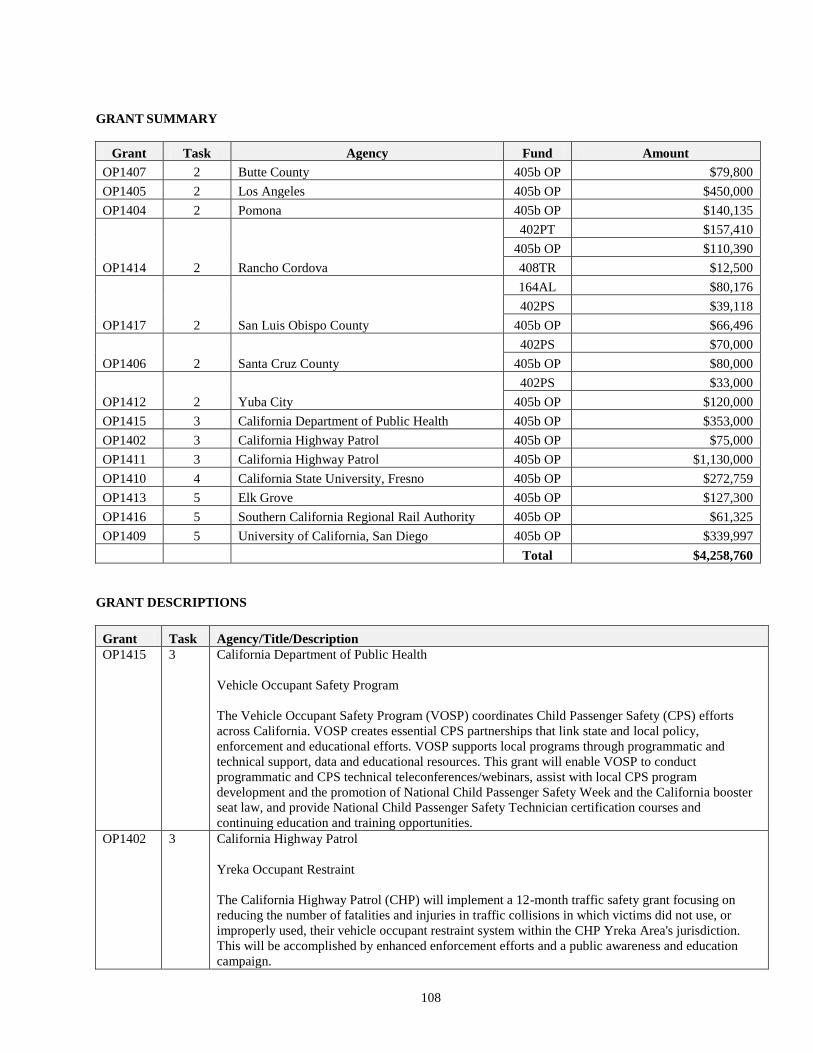
108
GRANT SUMMARY
Grant Task Agency Fund Amount
OP1407 2 Butte County 405b OP $79,800
OP1405 2 Los Angeles 405b OP $450,000
OP1404 2 Pomona 405b OP $140,135
OP1414 2 Rancho Cordova
402PT $157,410
405b OP $110,390
408TR $12,500
OP1417 2 San Luis Obispo County
164AL $80,176
402PS $39,118
405b OP $66,496
OP1406 2 Santa Cruz County
402PS $70,000
405b OP $80,000
OP1412 2 Yuba City
402PS $33,000
405b OP $120,000
OP1415 3 California Department of Public Health 405b OP $353,000
OP1402 3 California Highway Patrol 405b OP $75,000
OP1411 3 California Highway Patrol 405b OP $1,130,000
OP1410 4 California State University, Fresno 405b OP $272,759
OP1413 5 Elk Grove 405b OP $127,300
OP1416 5 Southern California Regional Rail Authority 405b OP $61,325
OP1409 5 University of California, San Diego 405b OP $339,997
Total $4,258,760
GRANT DESCRIPTIONS
Grant Task Agency/Title/Description
OP1415 3 California Department of Public Health
Vehicle Occupant Safety Program
The Vehicle Occupant Safety Program (VOSP) coordinates Child Passenger Safety (CPS) efforts
across California. VOSP creates essential CPS partnerships that link state and local policy,
enforcement and educational efforts. VOSP supports local programs through programmatic and
technical support, data and educational resources. This grant will enable VOSP to conduct
programmatic and CPS technical teleconferences/webinars, assist with local CPS program
development and the promotion of National Child Passenger Safety Week and the California booster
seat law, and provide National Child Passenger Safety Technician certification courses and
continuing education and training opportunities.
OP1402 3 California Highway Patrol
Yreka Occupant Restraint
The California Highway Patrol (CHP) will implement a 12-month traffic safety grant focusing on
reducing the number of fatalities and injuries in traffic collisions in which victims did not use, or
improperly used, their vehicle occupant restraint system within the CHP Yreka Area's jurisdiction.
This will be accomplished by enhanced enforcement efforts and a public awareness and education
campaign.
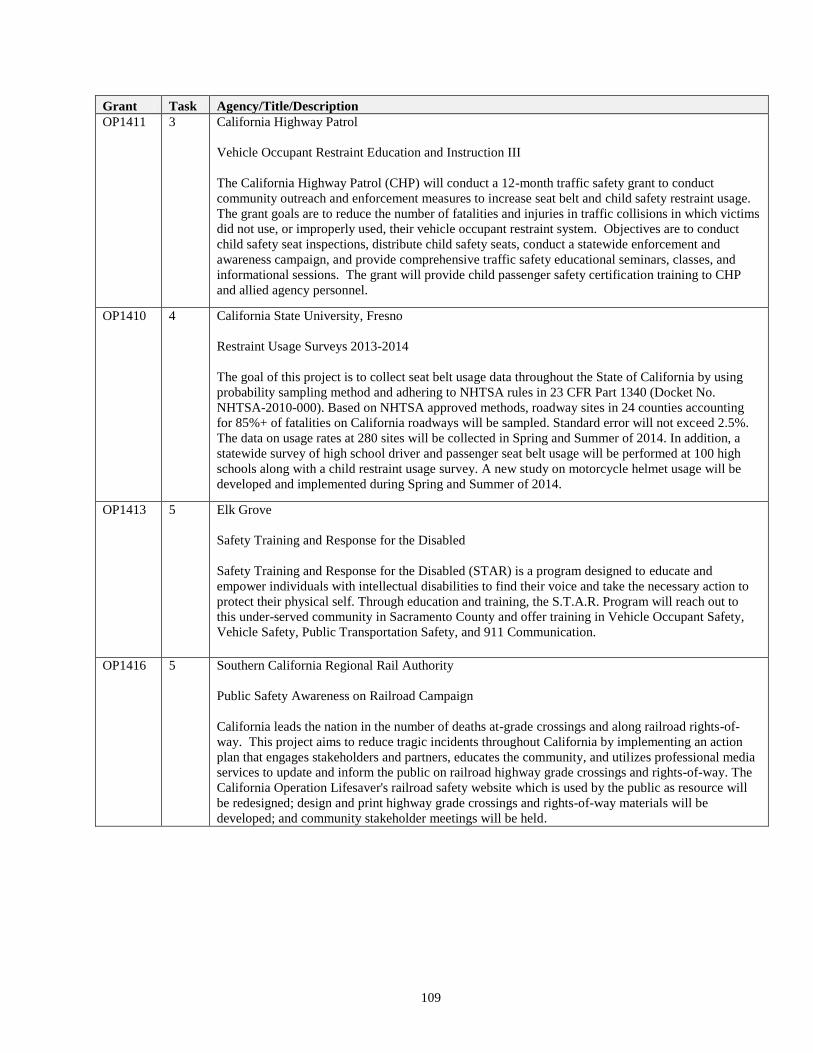
109
Grant Task Agency/Title/Description
OP1411 3 California Highway Patrol
Vehicle Occupant Restraint Education and Instruction III
The California Highway Patrol (CHP) will conduct a 12-month traffic safety grant to conduct
community outreach and enforcement measures to increase seat belt and child safety restraint usage.
The grant goals are to reduce the number of fatalities and injuries in traffic collisions in which victims
did not use, or improperly used, their vehicle occupant restraint system. Objectives are to conduct
child safety seat inspections, distribute child safety seats, conduct a statewide enforcement and
awareness campaign, and provide comprehensive traffic safety educational seminars, classes, and
informational sessions. The grant will provide child passenger safety certification training to CHP
and allied agency personnel.
OP1410 4 California State University, Fresno
Restraint Usage Surveys 2013-2014
The goal of this project is to collect seat belt usage data throughout the State of California by using
probability sampling method and adhering to NHTSA rules in 23 CFR Part 1340 (Docket No.
NHTSA-2010-000). Based on NHTSA approved methods, roadway sites in 24 counties accounting
for 85%+ of fatalities on California roadways will be sampled. Standard error will not exceed 2.5%.
The data on usage rates at 280 sites will be collected in Spring and Summer of 2014. In addition, a
statewide survey of high school driver and passenger seat belt usage will be performed at 100 high
schools along with a child restraint usage survey. A new study on motorcycle helmet usage will be
developed and implemented during Spring and Summer of 2014.
OP1413 5 Elk Grove
Safety Training and Response for the Disabled
Safety Training and Response for the Disabled (STAR) is a program designed to educate and
empower individuals with intellectual disabilities to find their voice and take the necessary action to
protect their physical self. Through education and training, the S.T.A.R. Program will reach out to
this under-served community in Sacramento County and offer training in Vehicle Occupant Safety,
Vehicle Safety, Public Transportation Safety, and 911 Communication.
OP1416 5 Southern California Regional Rail Authority
Public Safety Awareness on Railroad Campaign
California leads the nation in the number of deaths at-grade crossings and along railroad rights-of-
way. This project aims to reduce tragic incidents throughout California by implementing an action
plan that engages stakeholders and partners, educates the community, and utilizes professional media
services to update and inform the public on railroad highway grade crossings and rights-of-way. The
California Operation Lifesaver's railroad safety website which is used by the public as resource will
be redesigned; design and print highway grade crossings and rights-of-way materials will be
developed; and community stakeholder meetings will be held.
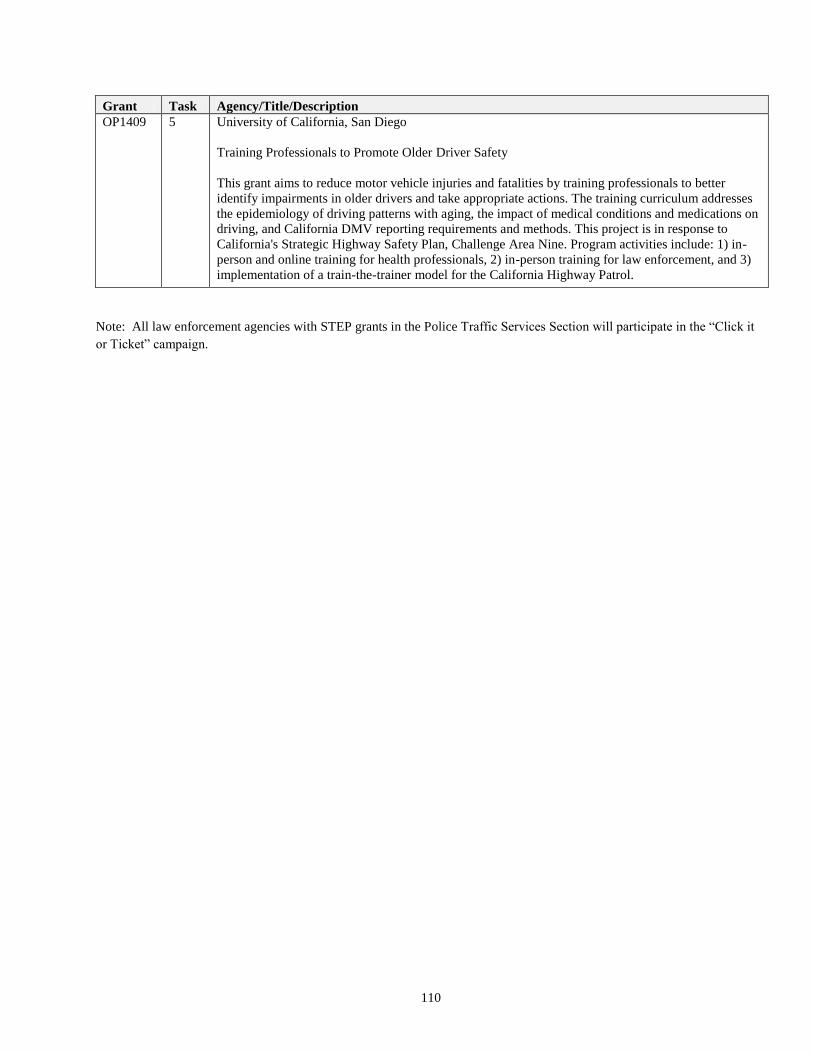
110
Grant Task Agency/Title/Description
OP1409 5 University of California, San Diego
Training Professionals to Promote Older Driver Safety
This grant aims to reduce motor vehicle injuries and fatalities by training professionals to better
identify impairments in older drivers and take appropriate actions. The training curriculum addresses
the epidemiology of driving patterns with aging, the impact of medical conditions and medications on
driving, and California DMV reporting requirements and methods. This project is in response to
California's Strategic Highway Safety Plan, Challenge Area Nine. Program activities include: 1) in-
person and online training for health professionals, 2) in-person training for law enforcement, and 3)
implementation of a train-the-trainer model for the California Highway Patrol.
Note: All law enforcement agencies with STEP grants in the Police Traffic Services Section will participate in the “Click it
or Ticket” campaign.
111
PEDESTRIAN AND BICYCLE SAFETY
PROGRAM OVERVIEW
Pedestrian Safety
Pedestrian fatalities increased 4 percent from 601 in 2010 to 625 in 2011. Pedestrian fatalities represent 22 percent of total
traffic fatalities in California, significantly exceeding the national average of 13 percent.
Promoting pedestrian safety in California has never been more important, and now communities across the state have an
important new tool for conducting public education and outreach. “It’s Up to Us” is a creative new public education
campaign that seeks to reduce pedestrian injury and death. Campaign materials are available free of charge at and include a
series of 18 media template materials. Materials can be used “as is” or customized to address local needs. The campaign
guide explains what the campaign is and how to make it work in communities. “It’s Up to Us” is funded by the California
Office of Traffic Safety through a collaborative project with the Pedestrian Safety Program of the California Department of
Public Health (CDPH).
In 2009, CDPH produced a comprehensive workbook, Communication for Pedestrian Safety: Risk, Response and Change,
which provides communities with a “how to guide” for applying risk communication and norm change principles and
practices to pedestrian safety. In 2010-2011, CDPH conducted workbook trainings – and used that training – to inform the
development of “It’s Up to Us.” Communities and advocates are urged to use these publicly funded materials and resources
to save pedestrian lives. It’s up to all of us to make a difference.
Pedestrian Safety Assessments (PSA) improve pedestrian safety within California communities, as it enables cities to
systematically identify pedestrian safety issues/problems and effective remedial options. Improved pedestrian safety and
improved pedestrian infrastructure in turn can lead to enhanced walkability and economic vitality of communities. With
funding from OTS, the Institute of Transportation Studies Technology Transfer Program (Tech Transfer), University of
California Berkeley, continues to offer Pedestrian Safety Assessments (PSA) as a free statewide service to California
cities/communities.
The need to continue the efforts to address pedestrian safety among populations for which English is not their first language
is alarming. In some communities, almost 100 percent of the pedestrian victims are non-English speakers. The last census
showed a dramatic change in demographics in the last ten years, resulting in an increase in pedestrian population unfamiliar
with the rules of the road, signage, and traffic management systems.
School zones have been identified as danger zones for aggressive driving habits and behaviors. Communities have taken
ownership of these areas by partnering with law enforcement, school officials, community-based organizations, advocacy
groups, parent-teacher associations, engineers and others to increase safety around local schools and decrease the alarming
number of children who are killed or injured on their way to and from school.
Technology geared toward increased pedestrian safety warrants implementation and evaluation. The efficiency of these
devices is identified in some of the funded programs. The strategy toward pedestrian safety includes active school zone signs
and in-pavement lighted crosswalks.
Bicycle Safety
Bicyclist fatalities increased 13 percent from 100 in 2010 to 114 in 2011. Bicyclist fatalities represent less than one percent
of total traffic fatalities in California.
Following the rules of the roads while riding a bicycle may increase the chances of avoiding traffic collisions with vehicles.
Bicycle or safety helmets have been shown to significantly reduce the risk of head and brain injury. In fact, it is estimated
that as many as seven out of every eight bicycle related fatalities among children could have been prevented with a bicycle
helmet.
112
Adults continued to represent a significant segment of the population “at-risk” for injury in a collision. Environmental issues,
health concerns and increased traffic congestion have driven many communities and individuals to emphasize alternative
means of commuting. Programs originated by employers, environmental groups, the healthcare community, and others
encourage cycling among adults. As a result, it is not uncommon to find more adults riding bicycles.
ACTION PLANS
Motor vehicle traffic poses a serious threat to children in neighborhoods, or near schools and parks. In order to achieve a safe
environment for bicyclists and pedestrians, efforts that use the three E’s of Education, Enforcement and Engineering, need to
be made toward the following goals:
Slowing vehicle speeds.
Reducing pedestrian risks at street crossing locations.
Improve awareness of and visibility between motor vehicles, pedestrians and bicyclists.
Improve pedestrian, bicyclist and motorist behaviors.
Traffic laws to be complied with by all users.
By changing and improving behaviors, injuries and fatalities resulting from vehicle crashes would decline significantly,
raising the level of quality of life, especially in residential areas. Parents have the need to feel at ease with the notion of their
children playing outside, walking to and from school and enjoying their neighborhood.
According to the Transportation of America, five California areas ranked nationally in the top 30 most dangerous
metropolitan cities for pedestrians. Three of the five areas are being funded in FY 2014 including Sacramento, Los Angles,
and Santa Clara.
TASKS
Task 1 - Program Development and Administrative Coordination
This task provides for the necessary staff time and expenses incurred by OTS that are directly related to the planning,
development, coordination, monitoring, auditing, and evaluation of grants within this program area, and the preparation of
the 2014 HSP. This task also includes assistance to staff to attend and participate in committees, training sessions,
educational meetings or conferences.
Task 2 - Pedestrian and Bicycle Safety Programs
This task provides funds for grants that target bicycle and pedestrian safety through the school system and local communities.
Activities to be conducted for these grants include traffic safety rodeos at schools and community events; traffic safety
workshops tailored for targeted audience; helmet distribution programs; bicycle and pedestrian diversion alternatives for cited
youth; and increased enforcement around schools. The main goals of these grants are to decrease the number of fatal and
injured victims resulting from traffic collisions with bicyclists and/or pedestrians, and to increase public awareness of traffic
safety practices for pedestrians, bicyclists and motorists.
Task 3 - Pedestrian and Bicycle Safety Programs for Populations At Risk
There is one grant funded under this task focusing on the older Chinese population in a Southern California community.
Task 4 - Comprehensive Traffic Safety Programs
These programs exercise multiple approaches in addressing more than one traffic safety need. These include media activity,
traffic safety rodeos, educational presentations, and enforcement geared to focus on more than one traffic safety area.
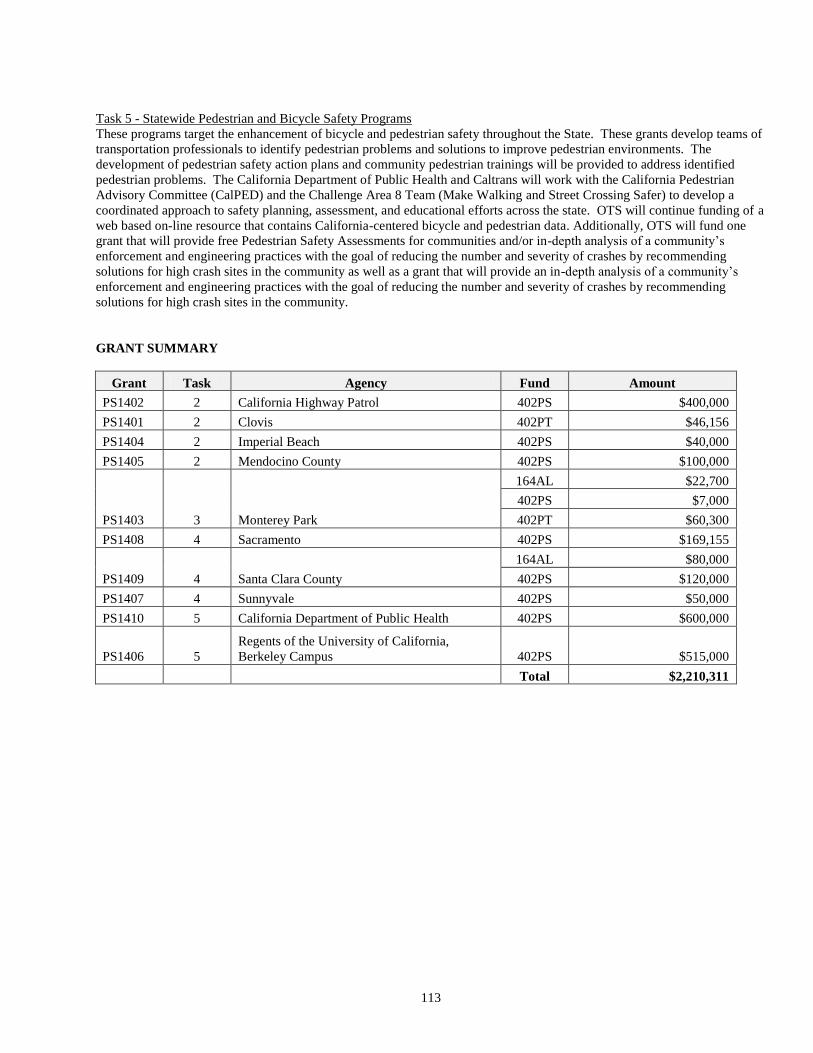
113
Task 5 - Statewide Pedestrian and Bicycle Safety Programs
These programs target the enhancement of bicycle and pedestrian safety throughout the State. These grants develop teams of
transportation professionals to identify pedestrian problems and solutions to improve pedestrian environments. The
development of pedestrian safety action plans and community pedestrian trainings will be provided to address identified
pedestrian problems. The California Department of Public Health and Caltrans will work with the California Pedestrian
Advisory Committee (CalPED) and the Challenge Area 8 Team (Make Walking and Street Crossing Safer) to develop a
coordinated approach to safety planning, assessment, and educational efforts across the state. OTS will continue funding of a
web based on-line resource that contains California-centered bicycle and pedestrian data. Additionally, OTS will fund one
grant that will provide free Pedestrian Safety Assessments for communities and/or in-depth analysis of a community’s
enforcement and engineering practices with the goal of reducing the number and severity of crashes by recommending
solutions for high crash sites in the community as well as a grant that will provide an in-depth analysis of a community’s
enforcement and engineering practices with the goal of reducing the number and severity of crashes by recommending
solutions for high crash sites in the community.
GRANT SUMMARY
Grant Task Agency Fund Amount
PS1402 2 California Highway Patrol 402PS $400,000
PS1401 2 Clovis 402PT $46,156
PS1404 2 Imperial Beach 402PS $40,000
PS1405 2 Mendocino County 402PS $100,000
PS1403 3 Monterey Park
164AL $22,700
402PS $7,000
402PT $60,300
PS1408 4 Sacramento 402PS $169,155
PS1409 4 Santa Clara County
164AL $80,000
402PS $120,000
PS1407 4 Sunnyvale 402PS $50,000
PS1410 5 California Department of Public Health 402PS $600,000
PS1406 5
Regents of the University of California,
Berkeley Campus 402PS $515,000
Total $2,210,311
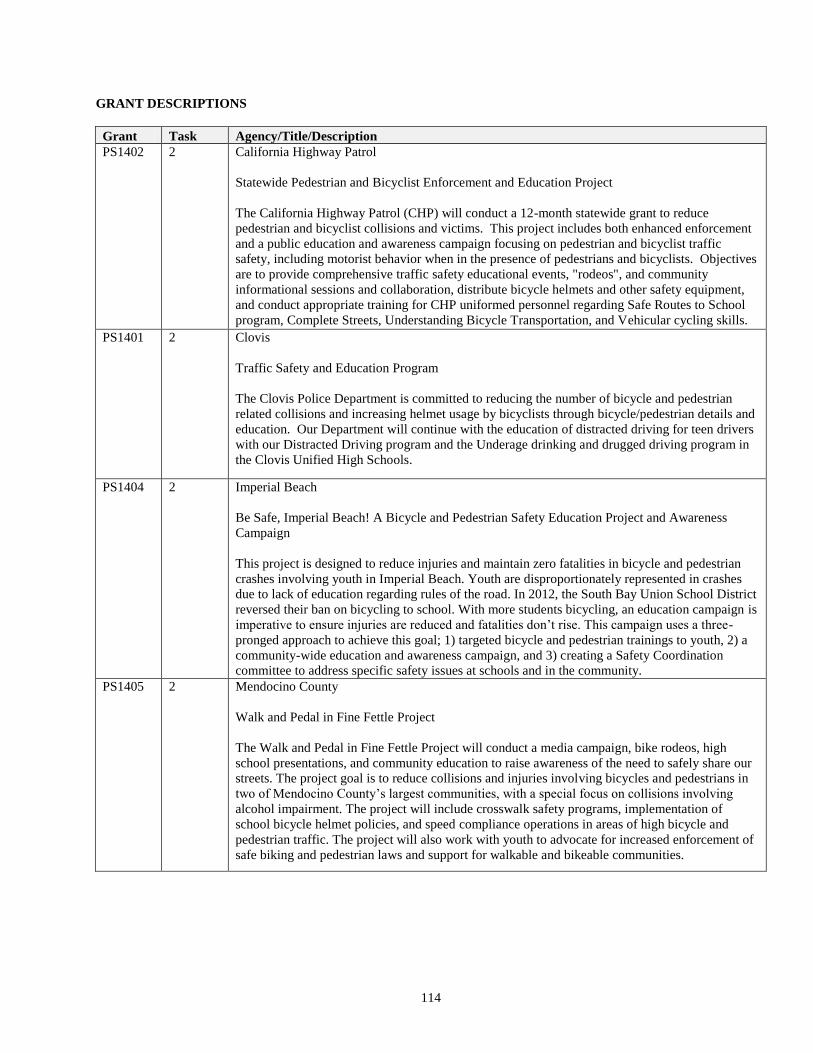
114
GRANT DESCRIPTIONS
Grant Task Agency/Title/Description
PS1402 2 California Highway Patrol
Statewide Pedestrian and Bicyclist Enforcement and Education Project
The California Highway Patrol (CHP) will conduct a 12-month statewide grant to reduce
pedestrian and bicyclist collisions and victims. This project includes both enhanced enforcement
and a public education and awareness campaign focusing on pedestrian and bicyclist traffic
safety, including motorist behavior when in the presence of pedestrians and bicyclists. Objectives
are to provide comprehensive traffic safety educational events, "rodeos", and community
informational sessions and collaboration, distribute bicycle helmets and other safety equipment,
and conduct appropriate training for CHP uniformed personnel regarding Safe Routes to School
program, Complete Streets, Understanding Bicycle Transportation, and Vehicular cycling skills.
PS1401 2 Clovis
Traffic Safety and Education Program
The Clovis Police Department is committed to reducing the number of bicycle and pedestrian
related collisions and increasing helmet usage by bicyclists through bicycle/pedestrian details and
education. Our Department will continue with the education of distracted driving for teen drivers
with our Distracted Driving program and the Underage drinking and drugged driving program in
the Clovis Unified High Schools.
PS1404 2 Imperial Beach
Be Safe, Imperial Beach! A Bicycle and Pedestrian Safety Education Project and Awareness
Campaign
This project is designed to reduce injuries and maintain zero fatalities in bicycle and pedestrian
crashes involving youth in Imperial Beach. Youth are disproportionately represented in crashes
due to lack of education regarding rules of the road. In 2012, the South Bay Union School District
reversed their ban on bicycling to school. With more students bicycling, an education campaign is
imperative to ensure injuries are reduced and fatalities don’t rise. This campaign uses a three-
pronged approach to achieve this goal; 1) targeted bicycle and pedestrian trainings to youth, 2) a
community-wide education and awareness campaign, and 3) creating a Safety Coordination
committee to address specific safety issues at schools and in the community.
PS1405 2 Mendocino County
Walk and Pedal in Fine Fettle Project
The Walk and Pedal in Fine Fettle Project will conduct a media campaign, bike rodeos, high
school presentations, and community education to raise awareness of the need to safely share our
streets. The project goal is to reduce collisions and injuries involving bicycles and pedestrians in
two of Mendocino County’s largest communities, with a special focus on collisions involving
alcohol impairment. The project will include crosswalk safety programs, implementation of
school bicycle helmet policies, and speed compliance operations in areas of high bicycle and
pedestrian traffic. The project will also work with youth to advocate for increased enforcement of
safe biking and pedestrian laws and support for walkable and bikeable communities.
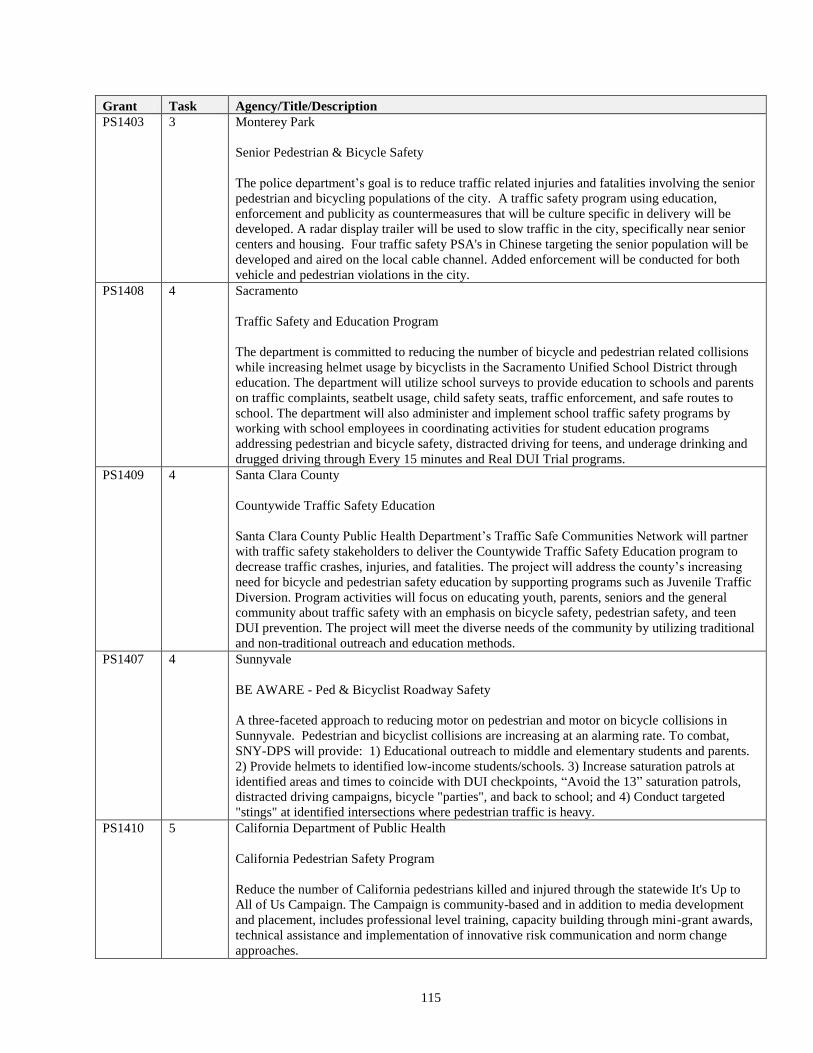
115
Grant Task Agency/Title/Description
PS1403 3 Monterey Park
Senior Pedestrian & Bicycle Safety
The police department’s goal is to reduce traffic related injuries and fatalities involving the senior
pedestrian and bicycling populations of the city. A traffic safety program using education,
enforcement and publicity as countermeasures that will be culture specific in delivery will be
developed. A radar display trailer will be used to slow traffic in the city, specifically near senior
centers and housing. Four traffic safety PSA's in Chinese targeting the senior population will be
developed and aired on the local cable channel. Added enforcement will be conducted for both
vehicle and pedestrian violations in the city.
PS1408 4 Sacramento
Traffic Safety and Education Program
The department is committed to reducing the number of bicycle and pedestrian related collisions
while increasing helmet usage by bicyclists in the Sacramento Unified School District through
education. The department will utilize school surveys to provide education to schools and parents
on traffic complaints, seatbelt usage, child safety seats, traffic enforcement, and safe routes to
school. The department will also administer and implement school traffic safety programs by
working with school employees in coordinating activities for student education programs
addressing pedestrian and bicycle safety, distracted driving for teens, and underage drinking and
drugged driving through Every 15 minutes and Real DUI Trial programs.
PS1409 4 Santa Clara County
Countywide Traffic Safety Education
Santa Clara County Public Health Department’s Traffic Safe Communities Network will partner
with traffic safety stakeholders to deliver the Countywide Traffic Safety Education program to
decrease traffic crashes, injuries, and fatalities. The project will address the county’s increasing
need for bicycle and pedestrian safety education by supporting programs such as Juvenile Traffic
Diversion. Program activities will focus on educating youth, parents, seniors and the general
community about traffic safety with an emphasis on bicycle safety, pedestrian safety, and teen
DUI prevention. The project will meet the diverse needs of the community by utilizing traditional
and non-traditional outreach and education methods.
PS1407 4 Sunnyvale
BE AWARE - Ped & Bicyclist Roadway Safety
A three-faceted approach to reducing motor on pedestrian and motor on bicycle collisions in
Sunnyvale. Pedestrian and bicyclist collisions are increasing at an alarming rate. To combat,
SNY-DPS will provide: 1) Educational outreach to middle and elementary students and parents.
2) Provide helmets to identified low-income students/schools. 3) Increase saturation patrols at
identified areas and times to coincide with DUI checkpoints, “Avoid the 13” saturation patrols,
distracted driving campaigns, bicycle "parties", and back to school; and 4) Conduct targeted
"stings" at identified intersections where pedestrian traffic is heavy.
PS1410 5 California Department of Public Health
California Pedestrian Safety Program
Reduce the number of California pedestrians killed and injured through the statewide It's Up to
All of Us Campaign. The Campaign is community-based and in addition to media development
and placement, includes professional level training, capacity building through mini-grant awards,
technical assistance and implementation of innovative risk communication and norm change
approaches.
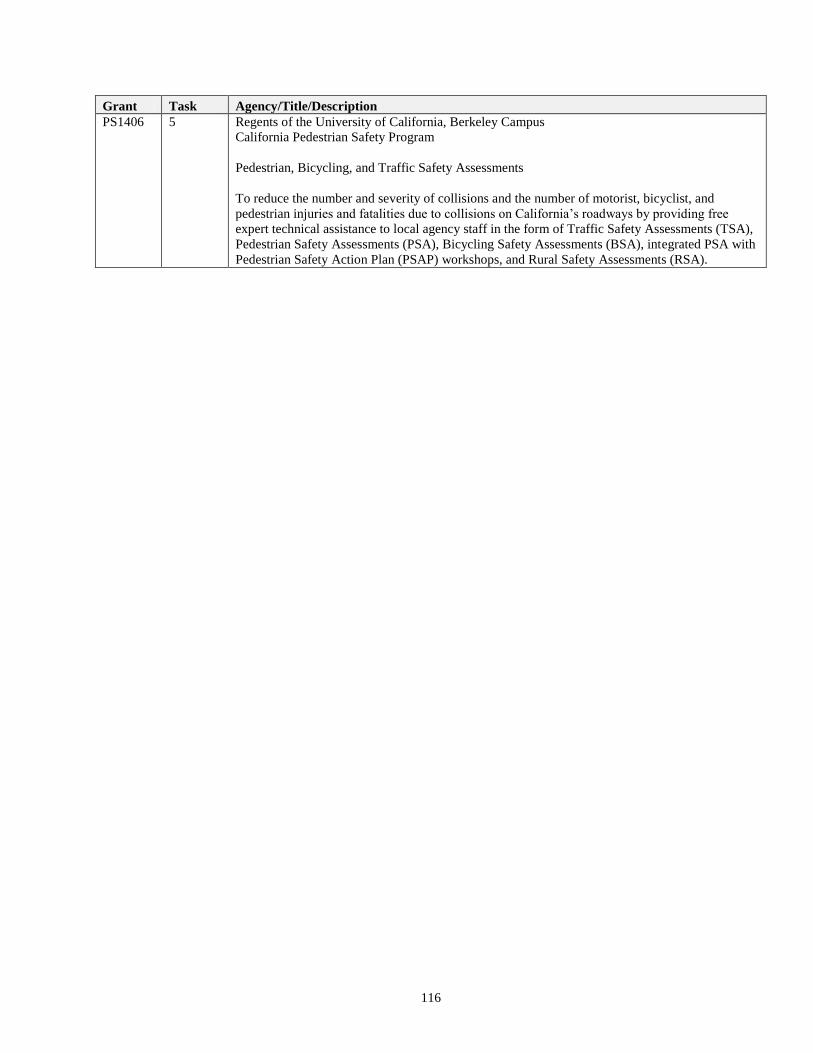
116
Grant Task Agency/Title/Description
PS1406 5 Regents of the University of California, Berkeley Campus
California Pedestrian Safety Program
Pedestrian, Bicycling, and Traffic Safety Assessments
To reduce the number and severity of collisions and the number of motorist, bicyclist, and
pedestrian injuries and fatalities due to collisions on California’s roadways by providing free
expert technical assistance to local agency staff in the form of Traffic Safety Assessments (TSA),
Pedestrian Safety Assessments (PSA), Bicycling Safety Assessments (BSA), integrated PSA with
Pedestrian Safety Action Plan (PSAP) workshops, and Rural Safety Assessments (RSA).
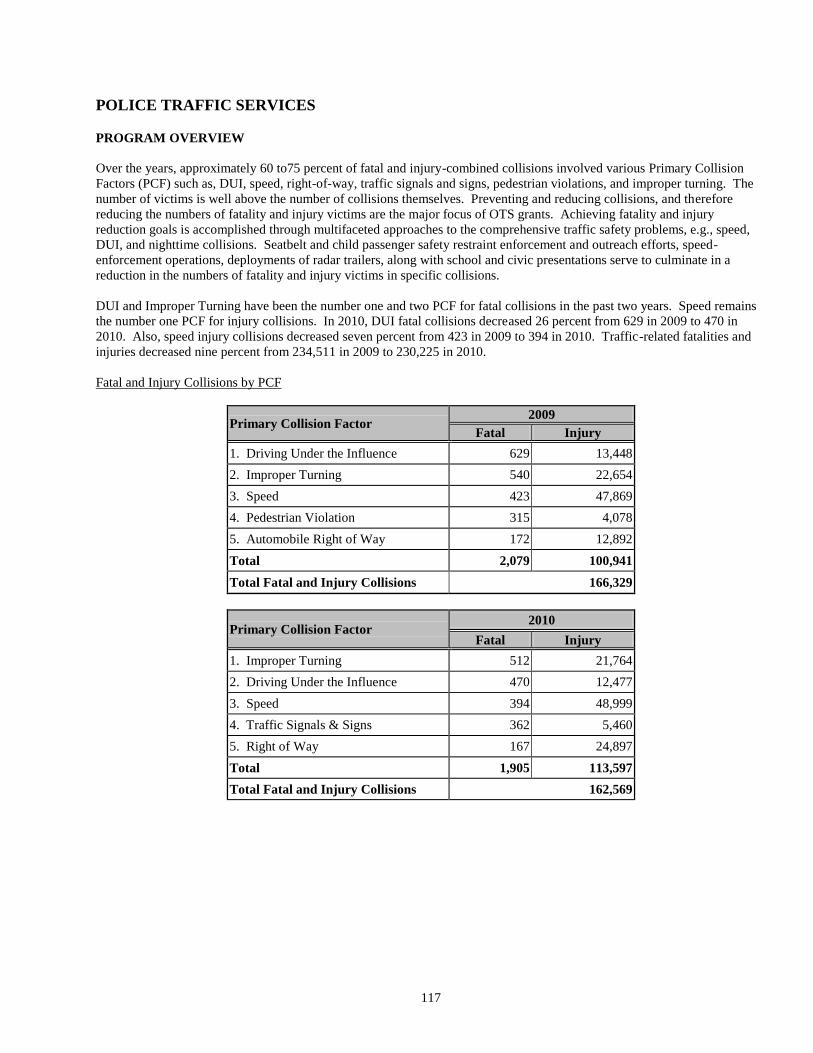
117
POLICE TRAFFIC SERVICES
PROGRAM OVERVIEW
Over the years, approximately 60 to75 percent of fatal and injury-combined collisions involved various Primary Collision
Factors (PCF) such as, DUI, speed, right-of-way, traffic signals and signs, pedestrian violations, and improper turning. The
number of victims is well above the number of collisions themselves. Preventing and reducing collisions, and therefore
reducing the numbers of fatality and injury victims are the major focus of OTS grants. Achieving fatality and injury
reduction goals is accomplished through multifaceted approaches to the comprehensive traffic safety problems, e.g., speed,
DUI, and nighttime collisions. Seatbelt and child passenger safety restraint enforcement and outreach efforts, speed-
enforcement operations, deployments of radar trailers, along with school and civic presentations serve to culminate in a
reduction in the numbers of fatality and injury victims in specific collisions.
DUI and Improper Turning have been the number one and two PCF for fatal collisions in the past two years. Speed remains
the number one PCF for injury collisions. In 2010, DUI fatal collisions decreased 26 percent from 629 in 2009 to 470 in
2010. Also, speed injury collisions decreased seven percent from 423 in 2009 to 394 in 2010. Traffic-related fatalities and
injuries decreased nine percent from 234,511 in 2009 to 230,225 in 2010.
Fatal and Injury Collisions by PCF
Primary Collision Factor 2009
Fatal Injury
1. Driving Under the Influence 629 13,448
2. Improper Turning 540 22,654
3. Speed 423 47,869
4. Pedestrian Violation 315 4,078
5. Automobile Right of Way 172 12,892
Total 2,079 100,941
Total Fatal and Injury Collisions 166,329
Primary Collision Factor 2010
Fatal Injury
1. Improper Turning 512 21,764
2. Driving Under the Influence 470 12,477
3. Speed 394 48,999
4. Traffic Signals & Signs 362 5,460
5. Right of Way 167 24,897
Total 1,905 113,597
Total Fatal and Injury Collisions 162,569
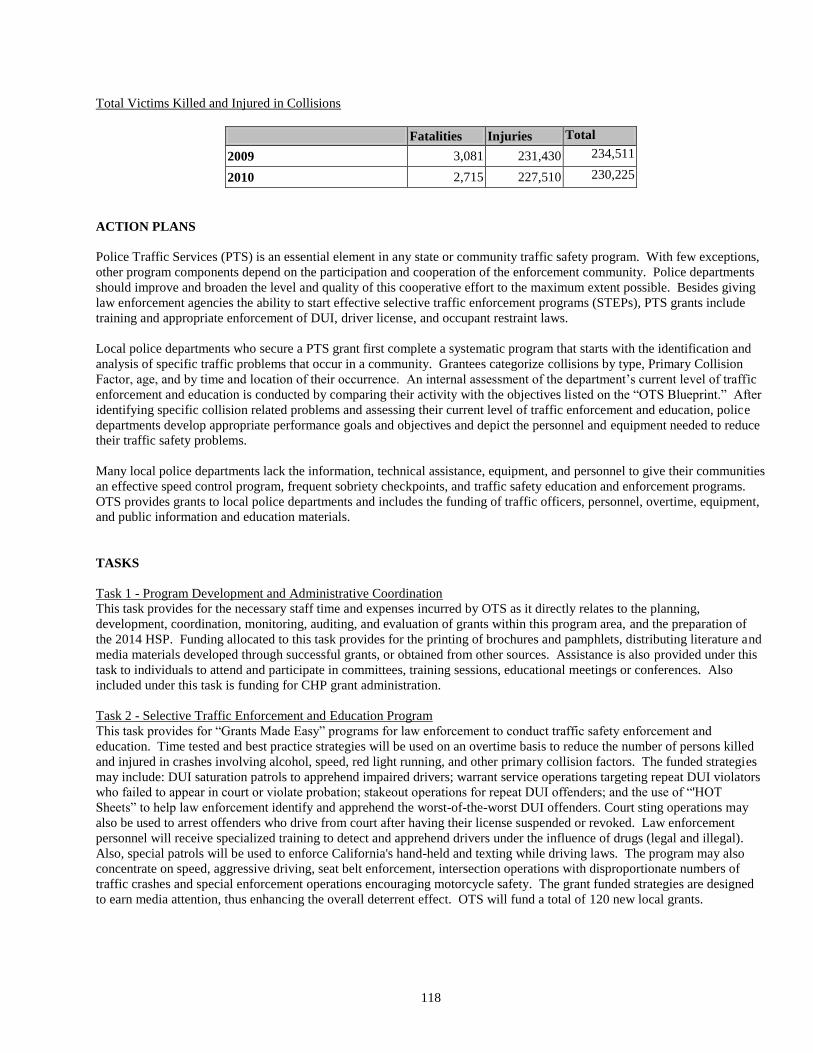
118
Total Victims Killed and Injured in Collisions
Fatalities Injuries Total
2009 3,081 231,430 234,511
2010 2,715 227,510 230,225
ACTION PLANS
Police Traffic Services (PTS) is an essential element in any state or community traffic safety program. With few exceptions,
other program components depend on the participation and cooperation of the enforcement community. Police departments
should improve and broaden the level and quality of this cooperative effort to the maximum extent possible. Besides giving
law enforcement agencies the ability to start effective selective traffic enforcement programs (STEPs), PTS grants include
training and appropriate enforcement of DUI, driver license, and occupant restraint laws.
Local police departments who secure a PTS grant first complete a systematic program that starts with the identification and
analysis of specific traffic problems that occur in a community. Grantees categorize collisions by type, Primary Collision
Factor, age, and by time and location of their occurrence. An internal assessment of the department’s current level of traffic
enforcement and education is conducted by comparing their activity with the objectives listed on the “OTS Blueprint.” After
identifying specific collision related problems and assessing their current level of traffic enforcement and education, police
departments develop appropriate performance goals and objectives and depict the personnel and equipment needed to reduce
their traffic safety problems.
Many local police departments lack the information, technical assistance, equipment, and personnel to give their communities
an effective speed control program, frequent sobriety checkpoints, and traffic safety education and enforcement programs.
OTS provides grants to local police departments and includes the funding of traffic officers, personnel, overtime, equipment,
and public information and education materials.
TASKS
Task 1 - Program Development and Administrative Coordination
This task provides for the necessary staff time and expenses incurred by OTS as it directly relates to the planning,
development, coordination, monitoring, auditing, and evaluation of grants within this program area, and the preparation of
the 2014 HSP. Funding allocated to this task provides for the printing of brochures and pamphlets, distributing literature and
media materials developed through successful grants, or obtained from other sources. Assistance is also provided under this
task to individuals to attend and participate in committees, training sessions, educational meetings or conferences. Also
included under this task is funding for CHP grant administration.
Task 2 - Selective Traffic Enforcement and Education Program
This task provides for “Grants Made Easy” programs for law enforcement to conduct traffic safety enforcement and
education. Time tested and best practice strategies will be used on an overtime basis to reduce the number of persons killed
and injured in crashes involving alcohol, speed, red light running, and other primary collision factors. The funded strategies
may include: DUI saturation patrols to apprehend impaired drivers; warrant service operations targeting repeat DUI violators
who failed to appear in court or violate probation; stakeout operations for repeat DUI offenders; and the use of “'HOT
Sheets” to help law enforcement identify and apprehend the worst-of-the-worst DUI offenders. Court sting operations may
also be used to arrest offenders who drive from court after having their license suspended or revoked. Law enforcement
personnel will receive specialized training to detect and apprehend drivers under the influence of drugs (legal and illegal).
Also, special patrols will be used to enforce California's hand-held and texting while driving laws. The program may also
concentrate on speed, aggressive driving, seat belt enforcement, intersection operations with disproportionate numbers of
traffic crashes and special enforcement operations encouraging motorcycle safety. The grant funded strategies are designed
to earn media attention, thus enhancing the overall deterrent effect. OTS will fund a total of 120 new local grants.
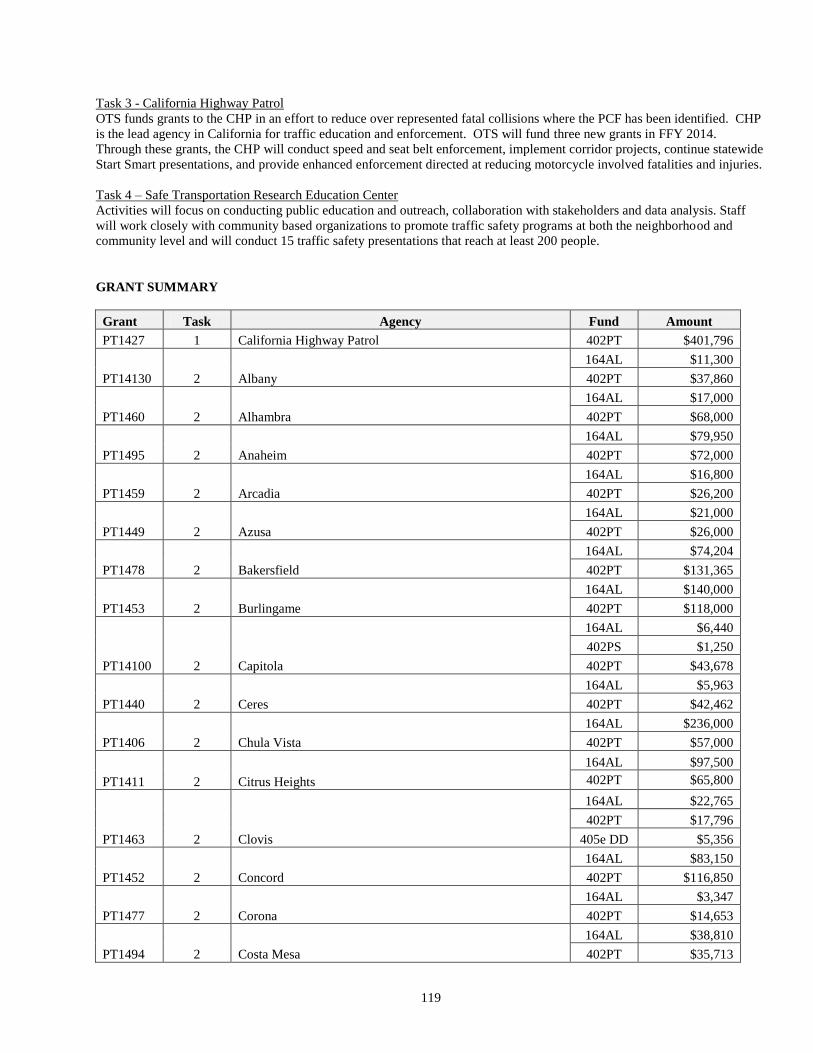
119
Task 3 - California Highway Patrol
OTS funds grants to the CHP in an effort to reduce over represented fatal collisions where the PCF has been identified. CHP
is the lead agency in California for traffic education and enforcement. OTS will fund three new grants in FFY 2014.
Through these grants, the CHP will conduct speed and seat belt enforcement, implement corridor projects, continue statewide
Start Smart presentations, and provide enhanced enforcement directed at reducing motorcycle involved fatalities and injuries.
Task 4 – Safe Transportation Research Education Center
Activities will focus on conducting public education and outreach, collaboration with stakeholders and data analysis. Staff
will work closely with community based organizations to promote traffic safety programs at both the neighborhood and
community level and will conduct 15 traffic safety presentations that reach at least 200 people.
GRANT SUMMARY
Grant Task Agency Fund Amount
PT1427 1 California Highway Patrol 402PT $401,796
PT14130 2 Albany
164AL $11,300
402PT $37,860
PT1460 2 Alhambra
164AL $17,000
402PT $68,000
PT1495 2 Anaheim
164AL $79,950
402PT $72,000
PT1459 2 Arcadia
164AL $16,800
402PT $26,200
PT1449 2 Azusa
164AL $21,000
402PT $26,000
PT1478 2 Bakersfield
164AL $74,204
402PT $131,365
PT1453 2 Burlingame
164AL $140,000
402PT $118,000
PT14100 2 Capitola
164AL $6,440
402PS $1,250
402PT $43,678
PT1440 2 Ceres
164AL $5,963
402PT $42,462
PT1406 2 Chula Vista
164AL $236,000
402PT $57,000
PT1411 2 Citrus Heights
164AL $97,500
402PT $65,800
PT1463 2 Clovis
164AL $22,765
402PT $17,796
405e DD $5,356
PT1452 2 Concord
164AL $83,150
402PT $116,850
PT1477 2 Corona
164AL $3,347
402PT $14,653
PT1494 2 Costa Mesa
164AL $38,810
402PT $35,713
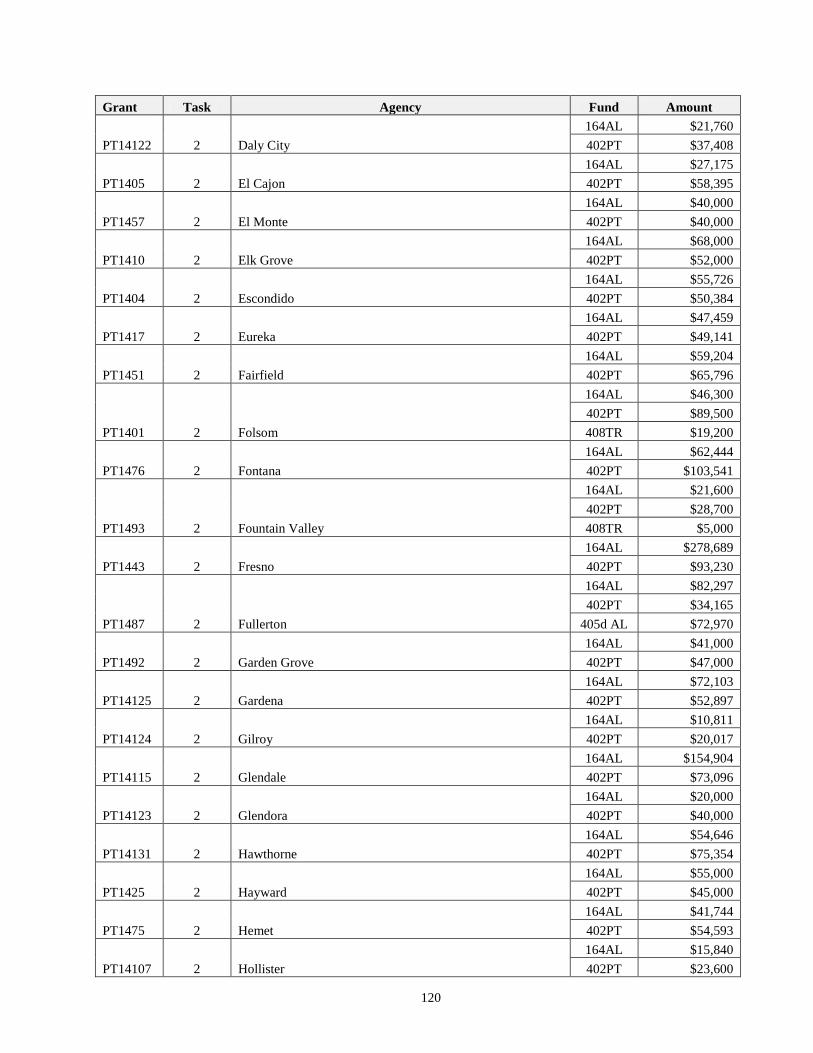
120
Grant Task Agency Fund Amount
PT14122 2 Daly City
164AL $21,760
402PT $37,408
PT1405 2 El Cajon
164AL $27,175
402PT $58,395
PT1457 2 El Monte
164AL $40,000
402PT $40,000
PT1410 2 Elk Grove
164AL $68,000
402PT $52,000
PT1404 2 Escondido
164AL $55,726
402PT $50,384
PT1417 2 Eureka
164AL $47,459
402PT $49,141
PT1451 2 Fairfield
164AL $59,204
402PT $65,796
PT1401 2 Folsom
164AL $46,300
402PT $89,500
408TR $19,200
PT1476 2 Fontana
164AL $62,444
402PT $103,541
PT1493 2 Fountain Valley
164AL $21,600
402PT $28,700
408TR $5,000
PT1443 2 Fresno
164AL $278,689
402PT $93,230
PT1487 2 Fullerton
164AL $82,297
402PT $34,165
405d AL $72,970
PT1492 2 Garden Grove
164AL $41,000
402PT $47,000
PT14125 2 Gardena
164AL $72,103
402PT $52,897
PT14124 2 Gilroy
164AL $10,811
402PT $20,017
PT14115 2 Glendale
164AL $154,904
402PT $73,096
PT14123 2 Glendora
164AL $20,000
402PT $40,000
PT14131 2 Hawthorne
164AL $54,646
402PT $75,354
PT1425 2 Hayward
164AL $55,000
402PT $45,000
PT1475 2 Hemet
164AL $41,744
402PT $54,593
PT14107 2 Hollister
164AL $15,840
402PT $23,600
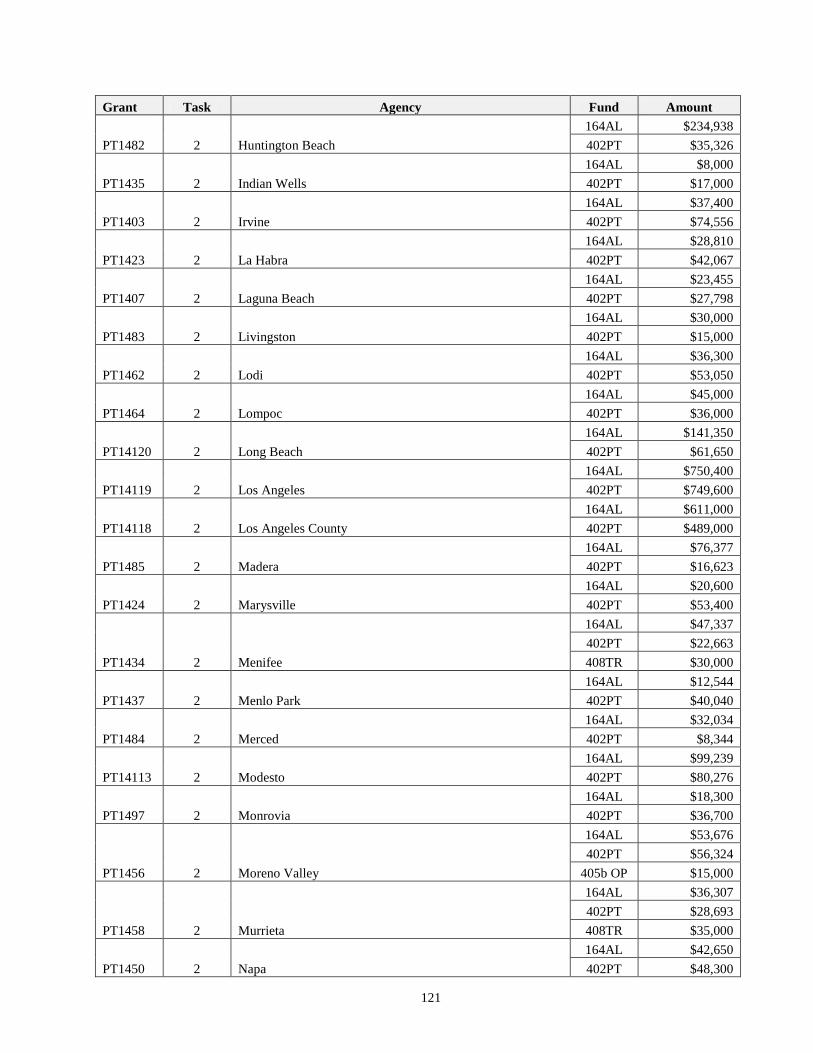
121
Grant Task Agency Fund Amount
PT1482 2 Huntington Beach
164AL $234,938
402PT $35,326
PT1435 2 Indian Wells
164AL $8,000
402PT $17,000
PT1403 2 Irvine
164AL $37,400
402PT $74,556
PT1423 2 La Habra
164AL $28,810
402PT $42,067
PT1407 2 Laguna Beach
164AL $23,455
402PT $27,798
PT1483 2 Livingston
164AL $30,000
402PT $15,000
PT1462 2 Lodi
164AL $36,300
402PT $53,050
PT1464 2 Lompoc
164AL $45,000
402PT $36,000
PT14120 2 Long Beach
164AL $141,350
402PT $61,650
PT14119 2 Los Angeles
164AL $750,400
402PT $749,600
PT14118 2 Los Angeles County
164AL $611,000
402PT $489,000
PT1485 2 Madera
164AL $76,377
402PT $16,623
PT1424 2 Marysville
164AL $20,600
402PT $53,400
PT1434 2 Menifee
164AL $47,337
402PT $22,663
408TR $30,000
PT1437 2 Menlo Park
164AL $12,544
402PT $40,040
PT1484 2 Merced
164AL $32,034
402PT $8,344
PT14113 2 Modesto
164AL $99,239
402PT $80,276
PT1497 2 Monrovia
164AL $18,300
402PT $36,700
PT1456 2 Moreno Valley
164AL $53,676
402PT $56,324
405b OP $15,000
PT1458 2 Murrieta
164AL $36,307
402PT $28,693
408TR $35,000
PT1450 2 Napa
164AL $42,650
402PT $48,300
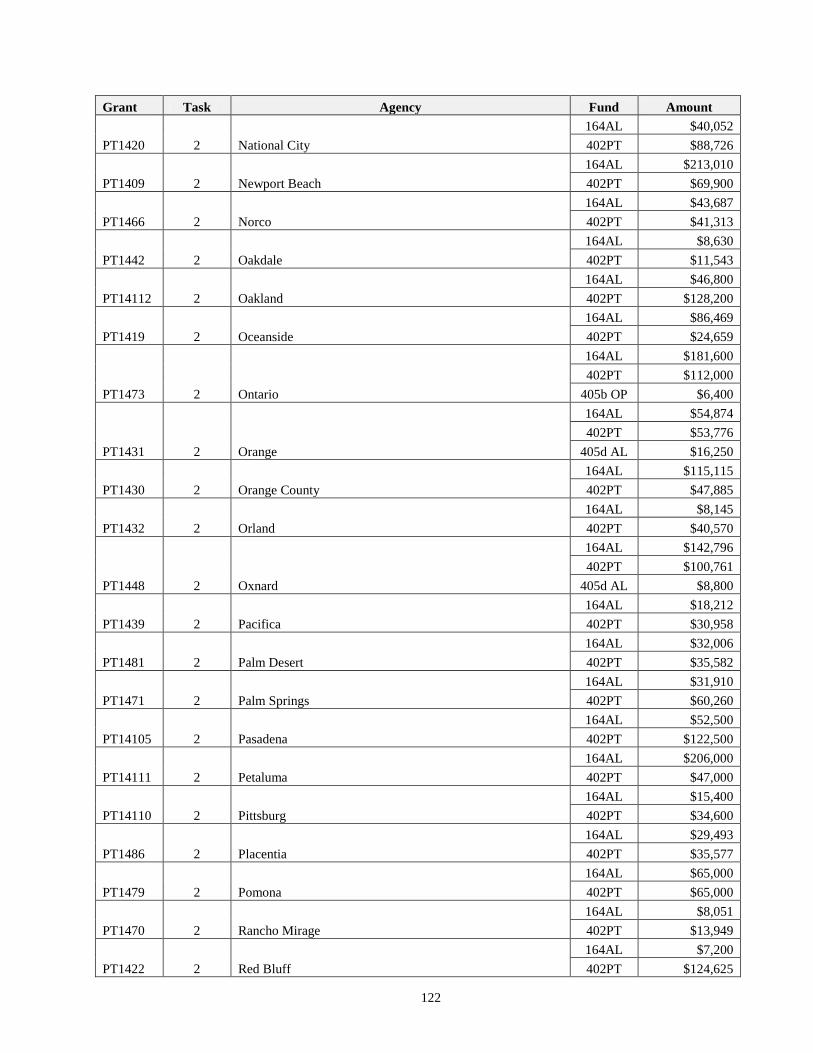
122
Grant Task Agency Fund Amount
PT1420 2 National City
164AL $40,052
402PT $88,726
PT1409 2 Newport Beach
164AL $213,010
402PT $69,900
PT1466 2 Norco
164AL $43,687
402PT $41,313
PT1442 2 Oakdale
164AL $8,630
402PT $11,543
PT14112 2 Oakland
164AL $46,800
402PT $128,200
PT1419 2 Oceanside
164AL $86,469
402PT $24,659
PT1473 2 Ontario
164AL $181,600
402PT $112,000
405b OP $6,400
PT1431 2 Orange
164AL $54,874
402PT $53,776
405d AL $16,250
PT1430 2 Orange County
164AL $115,115
402PT $47,885
PT1432 2 Orland
164AL $8,145
402PT $40,570
PT1448 2 Oxnard
164AL $142,796
402PT $100,761
405d AL $8,800
PT1439 2 Pacifica
164AL $18,212
402PT $30,958
PT1481 2 Palm Desert
164AL $32,006
402PT $35,582
PT1471 2 Palm Springs
164AL $31,910
402PT $60,260
PT14105 2 Pasadena
164AL $52,500
402PT $122,500
PT14111 2 Petaluma
164AL $206,000
402PT $47,000
PT14110 2 Pittsburg
164AL $15,400
402PT $34,600
PT1486 2 Placentia
164AL $29,493
402PT $35,577
PT1479 2 Pomona
164AL $65,000
402PT $65,000
PT1470 2 Rancho Mirage
164AL $8,051
402PT $13,949
PT1422 2 Red Bluff
164AL $7,200
402PT $124,625
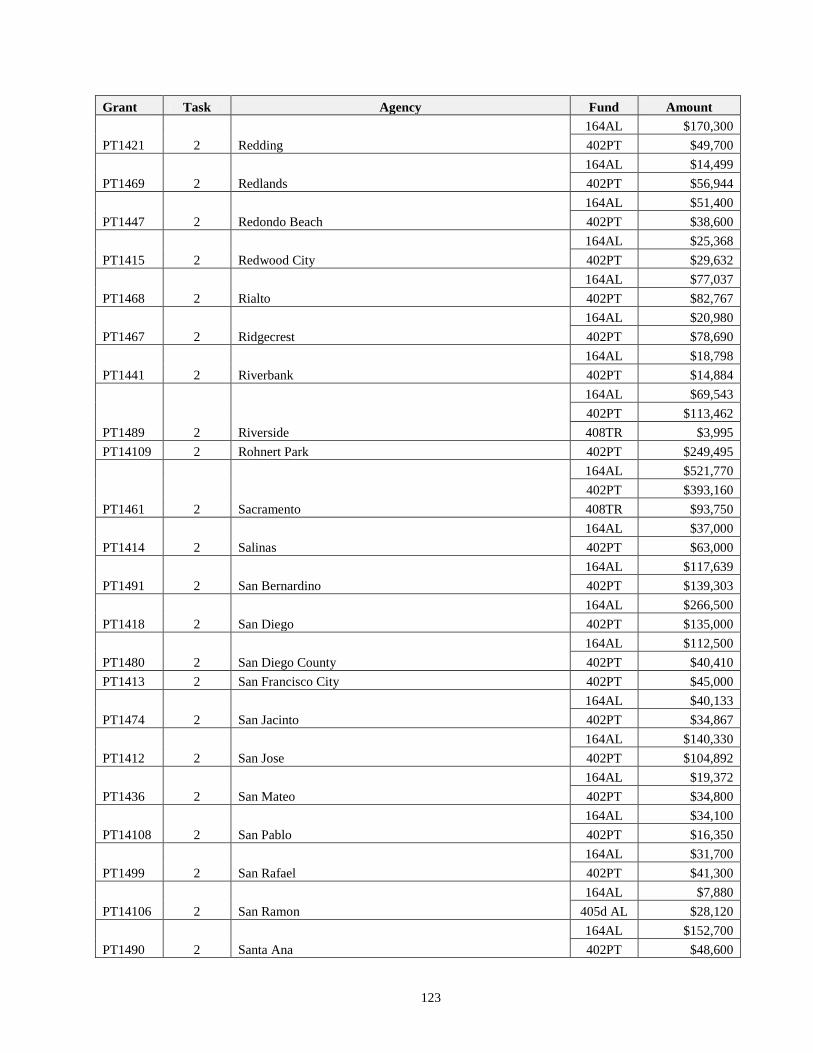
123
Grant Task Agency Fund Amount
PT1421 2 Redding
164AL $170,300
402PT $49,700
PT1469 2 Redlands
164AL $14,499
402PT $56,944
PT1447 2 Redondo Beach
164AL $51,400
402PT $38,600
PT1415 2 Redwood City
164AL $25,368
402PT $29,632
PT1468 2 Rialto
164AL $77,037
402PT $82,767
PT1467 2 Ridgecrest
164AL $20,980
402PT $78,690
PT1441 2 Riverbank
164AL $18,798
402PT $14,884
PT1489 2 Riverside
164AL $69,543
402PT $113,462
408TR $3,995
PT14109 2 Rohnert Park 402PT $249,495
PT1461 2 Sacramento
164AL $521,770
402PT $393,160
408TR $93,750
PT1414 2 Salinas
164AL $37,000
402PT $63,000
PT1491 2 San Bernardino
164AL $117,639
402PT $139,303
PT1418 2 San Diego
164AL $266,500
402PT $135,000
PT1480 2 San Diego County
164AL $112,500
402PT $40,410
PT1413 2 San Francisco City 402PT $45,000
PT1474 2 San Jacinto
164AL $40,133
402PT $34,867
PT1412 2 San Jose
164AL $140,330
402PT $104,892
PT1436 2 San Mateo
164AL $19,372
402PT $34,800
PT14108 2 San Pablo
164AL $34,100
402PT $16,350
PT1499 2 San Rafael
164AL $31,700
402PT $41,300
PT14106 2 San Ramon
164AL $7,880
405d AL $28,120
PT1490 2 Santa Ana
164AL $152,700
402PT $48,600
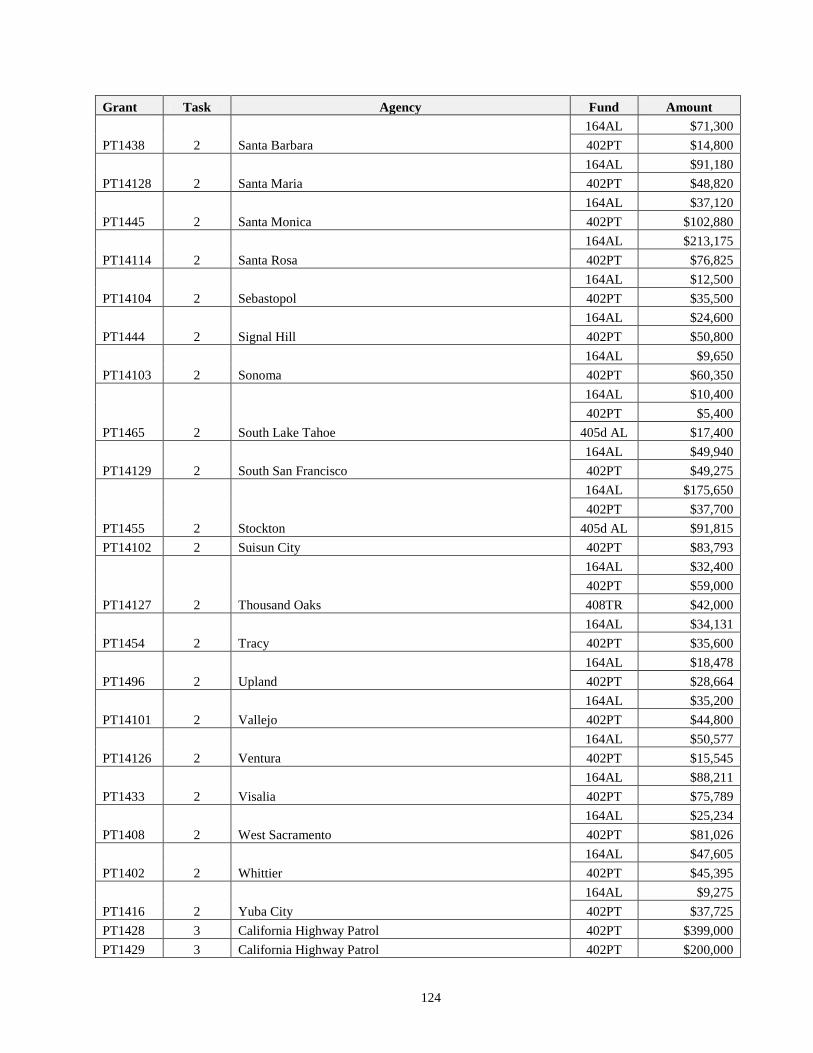
124
Grant Task Agency Fund Amount
PT1438 2 Santa Barbara
164AL $71,300
402PT $14,800
PT14128 2 Santa Maria
164AL $91,180
402PT $48,820
PT1445 2 Santa Monica
164AL $37,120
402PT $102,880
PT14114 2 Santa Rosa
164AL $213,175
402PT $76,825
PT14104 2 Sebastopol
164AL $12,500
402PT $35,500
PT1444 2 Signal Hill
164AL $24,600
402PT $50,800
PT14103 2 Sonoma
164AL $9,650
402PT $60,350
PT1465 2 South Lake Tahoe
164AL $10,400
402PT $5,400
405d AL $17,400
PT14129 2 South San Francisco
164AL $49,940
402PT $49,275
PT1455 2 Stockton
164AL $175,650
402PT $37,700
405d AL $91,815
PT14102 2 Suisun City 402PT $83,793
PT14127 2 Thousand Oaks
164AL $32,400
402PT $59,000
408TR $42,000
PT1454 2 Tracy
164AL $34,131
402PT $35,600
PT1496 2 Upland
164AL $18,478
402PT $28,664
PT14101 2 Vallejo
164AL $35,200
402PT $44,800
PT14126 2 Ventura
164AL $50,577
402PT $15,545
PT1433 2 Visalia
164AL $88,211
402PT $75,789
PT1408 2 West Sacramento
164AL $25,234
402PT $81,026
PT1402 2 Whittier
164AL $47,605
402PT $45,395
PT1416 2 Yuba City
164AL $9,275
402PT $37,725
PT1428 3 California Highway Patrol 402PT $399,000
PT1429 3 California Highway Patrol 402PT $200,000
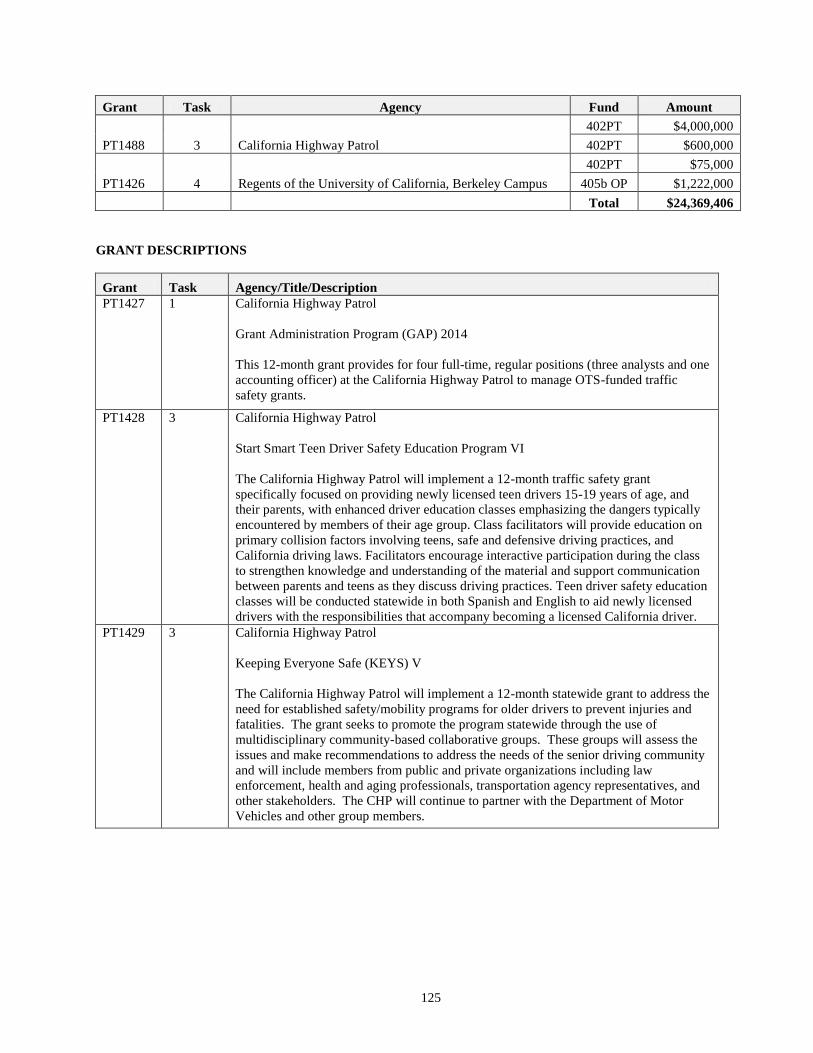
125
Grant Task Agency Fund Amount
PT1488 3 California Highway Patrol
402PT $4,000,000
402PT $600,000
PT1426 4 Regents of the University of California, Berkeley Campus
402PT $75,000
405b OP $1,222,000
Total $24,369,406
GRANT DESCRIPTIONS
Grant Task Agency/Title/Description
PT1427 1 California Highway Patrol
Grant Administration Program (GAP) 2014
This 12-month grant provides for four full-time, regular positions (three analysts and one
accounting officer) at the California Highway Patrol to manage OTS-funded traffic
safety grants.
PT1428 3 California Highway Patrol
Start Smart Teen Driver Safety Education Program VI
The California Highway Patrol will implement a 12-month traffic safety grant
specifically focused on providing newly licensed teen drivers 15-19 years of age, and
their parents, with enhanced driver education classes emphasizing the dangers typically
encountered by members of their age group. Class facilitators will provide education on
primary collision factors involving teens, safe and defensive driving practices, and
California driving laws. Facilitators encourage interactive participation during the class
to strengthen knowledge and understanding of the material and support communication
between parents and teens as they discuss driving practices. Teen driver safety education
classes will be conducted statewide in both Spanish and English to aid newly licensed
drivers with the responsibilities that accompany becoming a licensed California driver.
PT1429 3 California Highway Patrol
Keeping Everyone Safe (KEYS) V
The California Highway Patrol will implement a 12-month statewide grant to address the
need for established safety/mobility programs for older drivers to prevent injuries and
fatalities. The grant seeks to promote the program statewide through the use of
multidisciplinary community-based collaborative groups. These groups will assess the
issues and make recommendations to address the needs of the senior driving community
and will include members from public and private organizations including law
enforcement, health and aging professionals, transportation agency representatives, and
other stakeholders. The CHP will continue to partner with the Department of Motor
Vehicles and other group members.
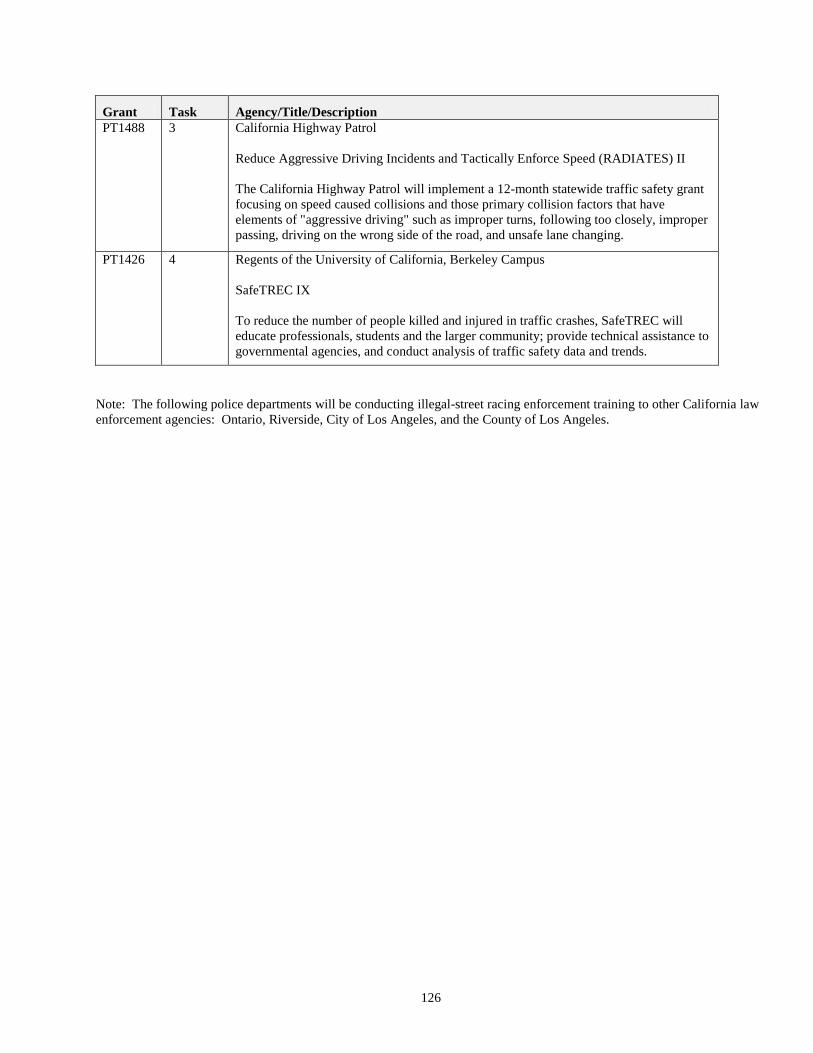
126
Grant Task Agency/Title/Description
PT1488 3 California Highway Patrol
Reduce Aggressive Driving Incidents and Tactically Enforce Speed (RADIATES) II
The California Highway Patrol will implement a 12-month statewide traffic safety grant
focusing on speed caused collisions and those primary collision factors that have
elements of "aggressive driving" such as improper turns, following too closely, improper
passing, driving on the wrong side of the road, and unsafe lane changing.
PT1426 4 Regents of the University of California, Berkeley Campus
SafeTREC IX
To reduce the number of people killed and injured in traffic crashes, SafeTREC will
educate professionals, students and the larger community; provide technical assistance to
governmental agencies, and conduct analysis of traffic safety data and trends.
Note: The following police departments will be conducting illegal-street racing enforcement training to other California law
enforcement agencies: Ontario, Riverside, City of Los Angeles, and the County of Los Angeles.
127
PUBLIC RELATIONS, ADVERTISING AND MARKETING
PROGRAM OVERVIEW
OTS employs one fulltime staff person – an Assistant Director of Marketing and Public Affairs – who oversees: media
relations and public relations for traffic safety issues and initiatives for the entire state of California; a marketing contract that
assists the OTS in directing media buys, marketing activities and public awareness campaign planning and execution, video
and audio public service announcement (PSA) production, media event planning, print and graphic materials; and assisting in
and reviewing the media and press related efforts and activities of all OTS grantees.
ACTION PLAN
In 2014, OTS will focus on generating earned media for a wide and deep variety of traffic safety initiatives through targeted
DUI, distracted driving and seat belt campaigns and through active grants – all designed toward lowering the Mileage Death
Rate and increasing statewide seat belt use. This approach includes providing increased media assistance to local grantees on
proven and new, innovative programs and continuing to target under-represented groups, target audiences, and the general
population with traffic safety messages.
OTS Public Affairs will be utilizing its contractor, Katz and Associates Public Relations, in support of many of these
initiatives. The Contractor assists OTS in campaign development, media buys, advertising services, graphic design,
publication production and various other marketing activities that are designed to assist the State in creating awareness of
traffic safety programs and initiatives and reach its goal of reducing fatalities and injuries due to traffic crashes.
OTS will maintain its anti-DUI messaging on billboards across the state. We will refine and bring new strategies to bear
regarding the newly emerging distracted driving and drug-impaired driving issues. We will persist with efforts to keep
problem areas such as motorcycle safety, occupant protection, bicycle and pedestrian safety in the public eye.
TASKS
Task 1 - Public Relations
Statewide Campaigns
OTS Public Affairs will spearhead several key public awareness campaigns during FFY 2014. Key campaigns will include
California’s December Holiday DUI Crackdown (also see Paid Advertising), as well as Distracted Driving (also see Paid
Advertising), “Click It or Ticket,” Child Passenger Safety Week, Motorcycle and Bicycle Safety Months, and DUI
enforcement campaigns around other major holiday periods: Memorial Day, Independence Day, and Labor Day weekends,
as well as St. Patrick's Day, Cinco de Mayo and Halloween celebration periods.
All campaigns will rely heavily upon earned media to educate Californians about safe driving practices, including distracted
driving, seat belt use, child passenger safety and impaired driving. Moving forward, OTS will also continue to expand
partnerships with CHP, the DMV, Caltrans, ABC and other state and federal agencies on various programs and campaigns.
Partnerships
OTS has an established track record of developing successful partnerships to raise awareness of important traffic safety
issues. OTS partners represent a variety of community groups; traffic safety industry representatives; local, regional and
state government agencies; as well as general business and industry organizations.
Public/Private partnerships are very important to OTS’ long-term planning. These partnerships are designed to augment
resources, extend outreach to diverse audiences and at-risk communities, and extend marketing opportunities. Past and
current partners have supported teen anti-DUI programs, DUI Crackdown Month, year-round DUI efforts, Child Passenger
Safety, safety belt use, distracted driving, and bicycle and pedestrian issues, to name a few. OTS will build upon existing
partnerships and forge new alliances to support and facilitate the distribution of its traffic safety messages, as well as its own
training seminars, meetings and community events.
128
OTS Tracks Newsletter
The Office’s primary publication to its stakeholders, OTS Tracks, is now in its 21st year of production. Its audience is more
than 3,000 traffic safety practitioners, law enforcement and fire departments, members of the media, legislators, and key
stakeholder groups. Content includes news about OTS initiatives, staff, and stories from local grantees on their people,
work and successes, as well as perspectives from the OTS Director.
OTS Website and Social Media
Grantees, law enforcement agencies, and other traffic safety stakeholders are increasingly reliant on the OTS website for
topical information on everything from grant application information to new data on a plethora of traffic safety subjects. The
news media and researchers are using the OTS site as a valued resource.
The website is geared to the needs of its primary audiences. Potential and current grantees make up the bulk of those visiting
the site, with media, researchers, stakeholders and the general public following along successively. The site was formatted
with this usage in mind.
OTS staff is currently in the process of an update to the look of the website, with some changes also likely to its content and
functionality. These will be in keeping with the State of California style updates underway as well as retooling for better
navigation.
OTS joined in the Social Media revolution by inaugurating the OTS Facebook presence - www.facebook.com/CaliforniaOTS
- in December of 2009. The use and growth of the OTS Facebook presence has been overwhelmingly positive,
with phenomenal growth to a current level of nearly 32,000 “likes”. The monthly rate of impressions varies greatly
depending on whether we are in an actively promoted campaign, but has reached as high as 60 million. It serves as an agency
information and public engagement presence for OTS. This social media platform allows OTS to communicate with all
California motorists with real-time updates, life saving resources and engaging applications. The site is updated daily with
news, engaging posts, videos, photos, contests, polls, pledge badges, Smartphone apps, links and more. 2014 will see further
expansion and use as Facebook continues its growth as a major communication medium, particularly with our target
demographics.
In March 2010, OTS expanded its social media presence with the advent of a dedicated OTS YouTube Channel -
http://www.youtube.com/user/californiaots - featuring videos ranging from California state agency produced PSAs to crash
victim videos to special OTS produced videos solely for social media, to appropriate videos from other organizations.
In late 2011, OTS initiated a presence on Twitter - http://twitter.com/#!/OTS_CA. Daily “tweets” provide engaging and
often informative communications and garnered over 5,700 followers by early 2014.
OTS will continuously monitor the ever-changing universe of social media, evaluating current strategies while staying
mindful of what new technologies may be beneficial in the future. OTS used Instagram as part of a young demographic
engagement during the latest December DUI Crackdown campaign
Media Relations
Bringing together expert resources in media relations, public affairs and community outreach, OTS Public Affairs offers an
array of services, including: media relations, marketing, event logistics, creative writing, and campaign management. In
2014, OTS Public Affairs will be continuing its successful targeted outreach to major media representatives to expand its role
as the primary source for traffic safety information in the state.
OTS Public Affairs is a “one-stop shop” resource for all of its grantees, whether organizing a media event or assisting in
garnering earned media through press releases, press events and the placement of specialty stories or op/eds. OTS works
with grantees when needed to foster positive relations with the media covering their traffic safety programs.
129
Grantee Support
Integrating media into all grant programs on the local level is a key goal and objective in OTS Public Affairs. The office
routinely assists grantees in the execution of media events, framing key messages, and arranging media interviews. In
addition, OTS Public Affairs directs the message on news releases, specialty articles and publicly distributed material penned
by local grantees and community-based organizations. 2013 saw an expansion in the number of press release templates, fact
sheets and other materials made available to grantees. We will maintain this level in 2014 unless new issues, programs or
circumstances show the need for greater or fewer. The vast majority of grantees have begun using these materials to
streamline their public relations efforts and provide an increased professional look to their media communications. Use of
these templates has now become nearly universal, garnering increased and regular news media mention for grant activities.
Task 2 - Paid Advertising
During 2014, the campaigns that OTS may be using paid media include the December DUI Crackdown, Distracted Driving,
and other campaigns as they arise. In addition, OTS will continue a year-round outdoor advertising/billboard campaign
promoting anti-DUI messages.
OTS Public Affairs will receive comprehensive reports from its marketing, advertising and public affairs contractor after each
campaign detailing all aspects of the campaigns and listing actual audience impressions. OTS and grantees track press
coverage generated by campaigns.
$300,000 DUI Crackdown
$750,000 Comprehensive Billboard
$300,000 Distracted Driving
$1,350,000 Fund to be determined upon payment
The following table reflects grants active in FFY 2014 with paid media in their budgets:
Grant # Agency Campaign Budget
AL1426 California Highway Patrol Alcohol Enforcement, Reduction, and
Traffic Safety $630,000
MC1402 California Highway Patrol California Motorcycle Safety
Enforcement and Education $500,000
DD1403 California Highway Patrol Teen Distracted Drivers Education and
Enforcement $550,000
Total $1,680,000
Task 3 - Marketing
Sports and Entertainment Marketing
Since its inception 19 years ago, the OTS Sports & Venue Marketing program has become an enduring model for sports
partnerships and traffic safety. While the 2014 schedule of events won’t be announced until after the New Year, campaign
venues being explored include partnerships with California-based professional baseball, soccer, basketball and football teams
as well as radio station sponsored events and concert and other entertainment venues. Target audiences for this marketing are
primarily young males, and secondarily families with children. The messaging is occupant protection, impaired driving, and
distracted driving.
130
General Marketing
OTS has an extensive, year-round effort in place to produce and place as much “public service” materials as possible in the
media. This comes in the form of television and radio public service announcements and billboard placement. Although
there is no cost for airing and displaying the media, there are production and installation costs. This marketing had a paid
media equivalent of over $3 million in 2012. The messaging is occupant protection, impaired driving, and distracted driving.
$150,000 Professional & Collegiate Sports Teams
$40,000 Professional Sports Team Radio Coverage
$50,000 Entertainment/Concert Venues
$20,000 Targeted Radio Station On-Air, Web, Social Media, and Hosted Events
$60,000 PSA Production, Placement and Installation
$320,000 Fund to be determined upon payment
131
TRAFFIC RECORDS/ROADWAY SAFETY
PROGRAM OVERVIEW
The traffic records system encompasses the hardware, software, personnel, and procedures that capture, store, transmit,
analyze, and interpret traffic safety data. The data that are managed by this system include the crash, driver licensing and
history, vehicle registration and titling along with commercial motor vehicle, roadway, injury control, citation/adjudication,
and exposure information. The relationships among these systems are depicted below as an interlocking set of related
information. For traffic safety purposes, crash data are at the center of this "honeycomb" of information.
While the geographic size of California and its large population has made centralization of traffic records difficult, OTS and
the state Traffic Records Coordinating Committee (TRCC) continues working towards centralization of all state traffic
records as a primary goal in order to facilitate data sharing and data exchange among state traffic safety stakeholders. In the
meantime however, various aspects of traffic records are still being collected and maintained by a variety of responsible
agencies.
Currently, the primary data repository for all crash report records is the SWITRS. Installed and maintained by the CHP in
1974, SWITRS collects and stores collision-related reports from state and local law enforcement agencies and makes the data
available to state and local agencies upon request. Over the years since inception, SWITRS has undergone both major and
minor programming development in response to advances in computing capabilities and technology. Some of the more
recent improvements to the SWITRS program have been the introduction of on line crash data query capabilities, the
collection and storage of crash location GIS coordinates and the addition of new data fields in the state crash report. A very
recent improvement to the SWITRS program has been the development of electronic crash reporting. In the beta testing mode
at the moment, this very recent improvement will enable allied agencies to electronically submit completed crash reports
directly into the SWITRS system which will significantly reduce data entry by CHP SWITRS personnel and the lag time
between the time of the incident and input of a crash record.
The Traffic Accident Surveillance and Analysis System (TASAS), maintained by Caltrans, is a supplemental repository of
collision data extracted from the SWITRS database that contains highway engineering data on over 15,000 miles of state
highways, including over 19,000 intersections and 14,000 ramp sections. TASAS does not include local (city or county)
streets or roadway data. Quarterly, reports are generated identifying state highway locations that have significantly high
concentrations of collisions.
DMV maintains a large statewide computer network to record all registered motor vehicles and licensed drivers (and some
unlicensed). The system generates a transcript for every person cited or arrested for a traffic violation who is subsequently
convicted, or who defaults on bail and is forwarded by the courts to DMV. The resulting transcript becomes the basis for an
entry into the Automated Management Information System (AMIS), even if the person arrested is not a licensed driver. If a
citation is issued or an arrest is made in connection with a collision, the record of a collision involving a specific driver will
be included in the file.
Advances in computer technology have enabled the DMV to establish a direct electronic link to nearly all of the municipal
courts within the State. By means of this linkage, nearly all traffic court judges have access to complete and current driver
histories, thereby making the penalties imposed by the court more in keeping with the actual and current driving record of the
individual. DMV continues to expand this capability and is placing as many courts as possible on-line.
The DOJ system maintains a record of arrests made within the state, including the final disposition of each case. This record
system shows all arrests, regardless of traffic involvement, and identifies specific vehicle code violations.
The EMSA has established a statewide database for emergency medical response reporting, including response times to
collisions and subsequent treatment of collision victims. In the EMS system, all regional trauma systems store and retrieve
medical data, with a certain mandated core data transmitted to the EMSA system. The California EMS Information System
(CEMSIS) is now programmed to receive EMS and Trauma Center data from participating local EMS Agencies. Increased
participation is expected in FY 2011-12. A process is now in place to revise QI indicators that will be programmed into
CEMSIS for end-user use. CEMSIS-Trauma is currently receiving data on critically injured trauma patients representing 51
trauma centers. EMS linkage is necessary for the sensitivity index computation, and provides traffic engineers and traffic law
enforcement personnel invaluable information on morbidity and mortality rates.
132
All cities and counties maintain traffic-related records, including data on local roadways. Many agencies report optimal
effectiveness can be achieved by maintaining a local system that includes in some cases, substantially more data elements
than are currently contained in the statewide systems. A local system typically includes collision records, records of arrests
and citations, and crash data on local streets and roads.
Local agencies in California have identified specific difficulties in using SWITRS, primarily the time lag in receiving reports
and the inconsistencies in the identification of local street names. For smaller cities, these problems do not represent major
obstacles; but larger communities require an automated collision database system to provide in part, a more timely record, a
more accurate identification of crashes, and ability to analyze collision trends and locations. OTS will continue to address
the need for local systems by continuing to provide hardware and software to local grantees that are compatible with
SWITRS. Many local agencies are implementing, or exploring the feasibility of implementing local GIS based traffic record
systems.
In January 2011, OTS and NHTSA facilitated a traffic records assessment for the State of California. A team of
professionals with backgrounds and expertise in the several component areas of traffic records data systems (crash,
driver/vehicle, traffic engineering, enforcement and adjudication, and EMS/Trauma data systems) conducted the assessment.
The scope of this assessment covered all of the components of a traffic records system. The purpose was to determine
whether the traffic records system in California is capable of supporting management’s needs to identify the State’s highway
safety problems, to manage the countermeasures applied to reduce or eliminate those problems, and to evaluate those
programs for their effectiveness.
During the assessment, the team noted progress achieved by the State resulting from implementing some of the remedies
suggested during the 2005 assessment, as well as other noteworthy improvements that have been accomplished since the
2005 assessment. The team also pointed out that it was worthy to note that many of the projects in the State’s various safety
plans are linked to recommendations from the 2005 assessment with emphasis on crash, citation and injury surveillance
records. The team also reported that the TRCC was a “well functioning committee and embraced by its members as a
valuable vehicle for moving many of the traffic records projects forward.”
In addition to the NHTSA sponsored traffic records assessment, as part of the TRCC’s ongoing effort to develop a long term
statewide traffic records strategic plan, the TRCC’ strategic planning group participated in an FHWA sponsored Peer-to-Peer
Conference in September 2010 and the FHWA Crash Data Improvement Program (CDIP) in February 2012. The Peer-to-
Peer conference provided members of the TRCC Strategic Planning Group with the opportunity to interact with our peers
from North Carolina, the State of Washington, and Michigan.
During the Peer-to-Peer conference, members of the TRCC strategic planning group focused on identifying common issues
with our peer states related to general crash issues, timeliness of crash report submission, accuracy and completeness of
reports, consistency of crash data, and integration of data and accessibility of crash data among traffic safety stakeholders.
The CDIP provided an evaluation of the Crash Data Production and Location processes currently in use in California. The
evaluators made recommendations for improvements of these processes and systems. The results of the conference and
evaluation are being used by the group as part of the long term strategic plan.
ACTION PLANS
OTS is in the process of reviewing and developing strategies for implementing the recommendations of the 2011 Traffic
Records Assessment. The TRCC strategic planning group is developing a long term statewide traffic records strategic plan
based upon the 2011 Traffic Records Assessment recommendations and the noteworthy solutions to common issues
identified during the Peer-to-Peer conference and CDIP evaluation. The TRCC strategic planning group is comprised of
representatives from state and local agencies including OTS. They are tasked with oversight of the development of the
Traffic Records Strategic Plan. FHWA provided consultants to assist the TRCC Strategic Planning Group in developing a
comprehensive Strategic Safety Data Plan. The draft plan was submitted to the SHSP Steering Committee for the approval
process in early 2013.
OTS remains committed to providing funds to agencies on both the city and county level to purchase fully automated
collision and citation records and analysis systems. OTS is confident that once implemented these systems will decrease the
agency resources needed to maintain collision and citation statistical data. These systems are also expected to reduce the
frequency and possibly the severity of traffic collisions in each jurisdiction where the systems are implemented.
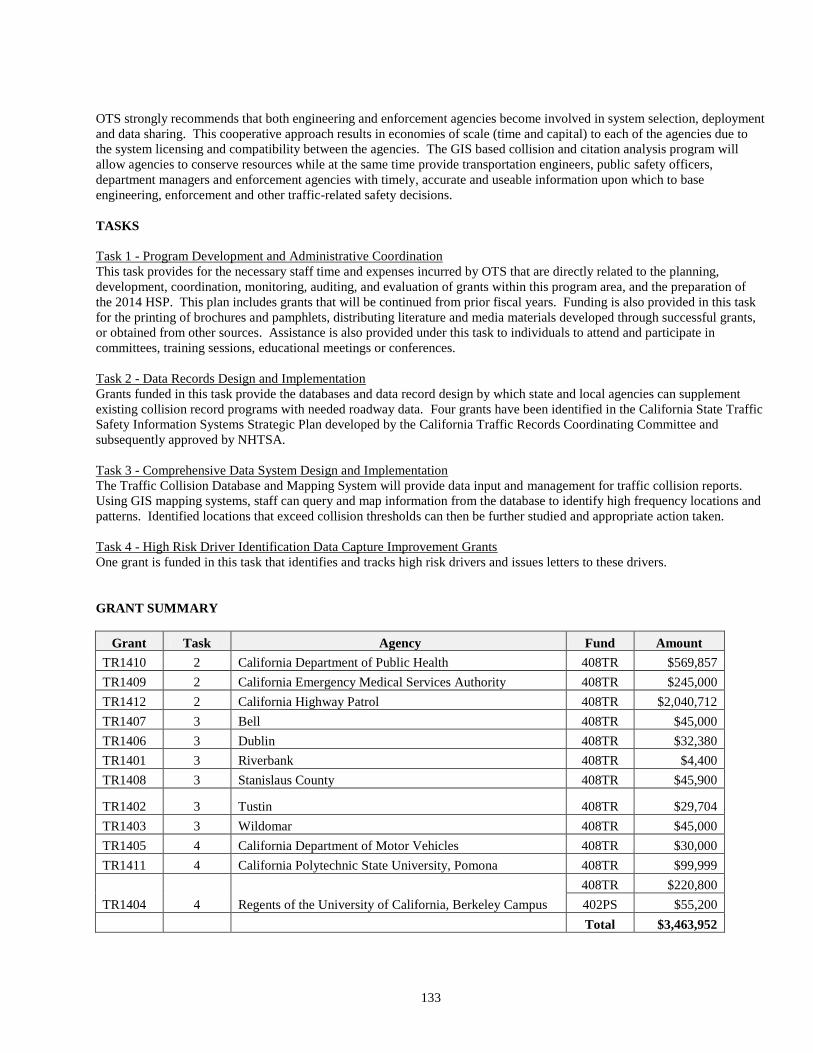
133
OTS strongly recommends that both engineering and enforcement agencies become involved in system selection, deployment
and data sharing. This cooperative approach results in economies of scale (time and capital) to each of the agencies due to
the system licensing and compatibility between the agencies. The GIS based collision and citation analysis program will
allow agencies to conserve resources while at the same time provide transportation engineers, public safety officers,
department managers and enforcement agencies with timely, accurate and useable information upon which to base
engineering, enforcement and other traffic-related safety decisions.
TASKS
Task 1 - Program Development and Administrative Coordination
This task provides for the necessary staff time and expenses incurred by OTS that are directly related to the planning,
development, coordination, monitoring, auditing, and evaluation of grants within this program area, and the preparation of
the 2014 HSP. This plan includes grants that will be continued from prior fiscal years. Funding is also provided in this task
for the printing of brochures and pamphlets, distributing literature and media materials developed through successful grants,
or obtained from other sources. Assistance is also provided under this task to individuals to attend and participate in
committees, training sessions, educational meetings or conferences.
Task 2 - Data Records Design and Implementation
Grants funded in this task provide the databases and data record design by which state and local agencies can supplement
existing collision record programs with needed roadway data. Four grants have been identified in the California State Traffic
Safety Information Systems Strategic Plan developed by the California Traffic Records Coordinating Committee and
subsequently approved by NHTSA.
Task 3 - Comprehensive Data System Design and Implementation
The Traffic Collision Database and Mapping System will provide data input and management for traffic collision reports.
Using GIS mapping systems, staff can query and map information from the database to identify high frequency locations and
patterns. Identified locations that exceed collision thresholds can then be further studied and appropriate action taken.
Task 4 - High Risk Driver Identification Data Capture Improvement Grants
One grant is funded in this task that identifies and tracks high risk drivers and issues letters to these drivers.
GRANT SUMMARY
Grant Task Agency Fund Amount
TR1410 2 California Department of Public Health 408TR $569,857
TR1409 2 California Emergency Medical Services Authority 408TR $245,000
TR1412 2 California Highway Patrol 408TR $2,040,712
TR1407 3 Bell 408TR $45,000
TR1406 3 Dublin 408TR $32,380
TR1401 3 Riverbank 408TR $4,400
TR1408 3 Stanislaus County 408TR $45,900
TR1402 3 Tustin 408TR $29,704
TR1403 3 Wildomar 408TR $45,000
TR1405 4 California Department of Motor Vehicles 408TR $30,000
TR1411 4 California Polytechnic State University, Pomona 408TR $99,999
TR1404 4 Regents of the University of California, Berkeley Campus
408TR $220,800
402PS $55,200
Total $3,463,952
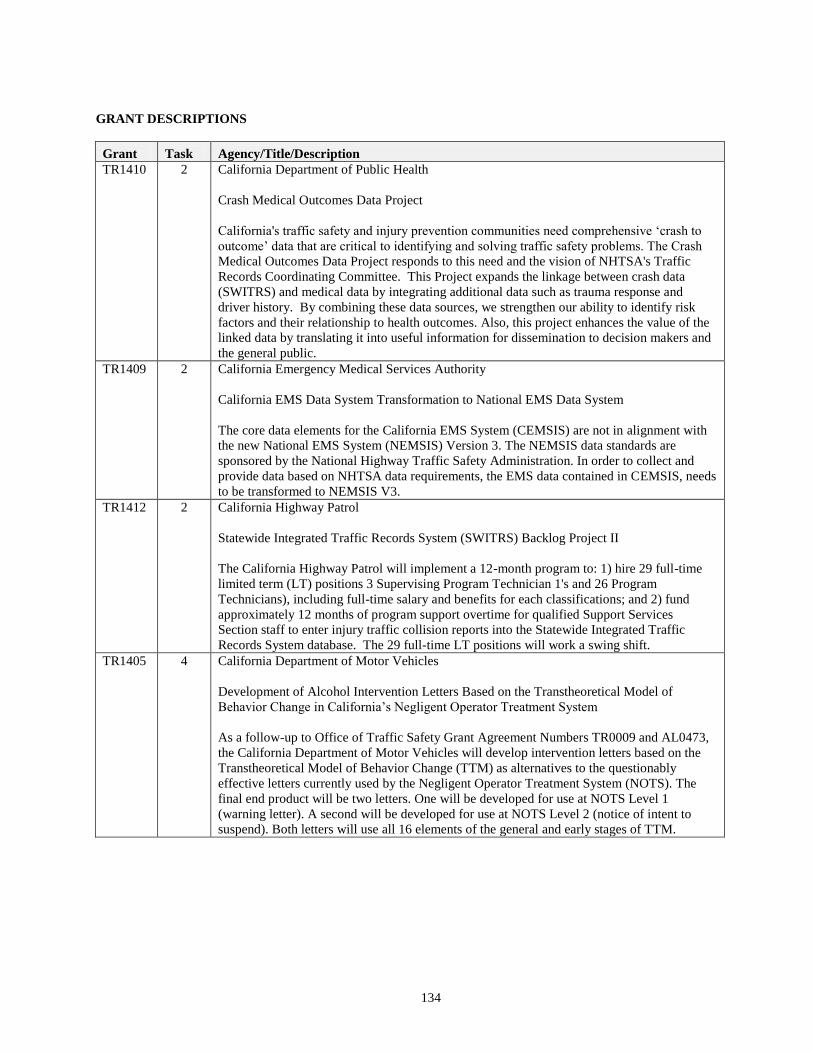
134
GRANT DESCRIPTIONS
Grant Task Agency/Title/Description
TR1410 2 California Department of Public Health
Crash Medical Outcomes Data Project
California's traffic safety and injury prevention communities need comprehensive ‘crash to
outcome’ data that are critical to identifying and solving traffic safety problems. The Crash
Medical Outcomes Data Project responds to this need and the vision of NHTSA's Traffic
Records Coordinating Committee. This Project expands the linkage between crash data
(SWITRS) and medical data by integrating additional data such as trauma response and
driver history. By combining these data sources, we strengthen our ability to identify risk
factors and their relationship to health outcomes. Also, this project enhances the value of the
linked data by translating it into useful information for dissemination to decision makers and
the general public.
TR1409 2 California Emergency Medical Services Authority
California EMS Data System Transformation to National EMS Data System
The core data elements for the California EMS System (CEMSIS) are not in alignment with
the new National EMS System (NEMSIS) Version 3. The NEMSIS data standards are
sponsored by the National Highway Traffic Safety Administration. In order to collect and
provide data based on NHTSA data requirements, the EMS data contained in CEMSIS, needs
to be transformed to NEMSIS V3.
TR1412 2 California Highway Patrol
Statewide Integrated Traffic Records System (SWITRS) Backlog Project II
The California Highway Patrol will implement a 12-month program to: 1) hire 29 full-time
limited term (LT) positions 3 Supervising Program Technician 1's and 26 Program
Technicians), including full-time salary and benefits for each classifications; and 2) fund
approximately 12 months of program support overtime for qualified Support Services
Section staff to enter injury traffic collision reports into the Statewide Integrated Traffic
Records System database. The 29 full-time LT positions will work a swing shift.
TR1405 4 California Department of Motor Vehicles
Development of Alcohol Intervention Letters Based on the Transtheoretical Model of
Behavior Change in California’s Negligent Operator Treatment System
As a follow-up to Office of Traffic Safety Grant Agreement Numbers TR0009 and AL0473,
the California Department of Motor Vehicles will develop intervention letters based on the
Transtheoretical Model of Behavior Change (TTM) as alternatives to the questionably
effective letters currently used by the Negligent Operator Treatment System (NOTS). The
final end product will be two letters. One will be developed for use at NOTS Level 1
(warning letter). A second will be developed for use at NOTS Level 2 (notice of intent to
suspend). Both letters will use all 16 elements of the general and early stages of TTM.
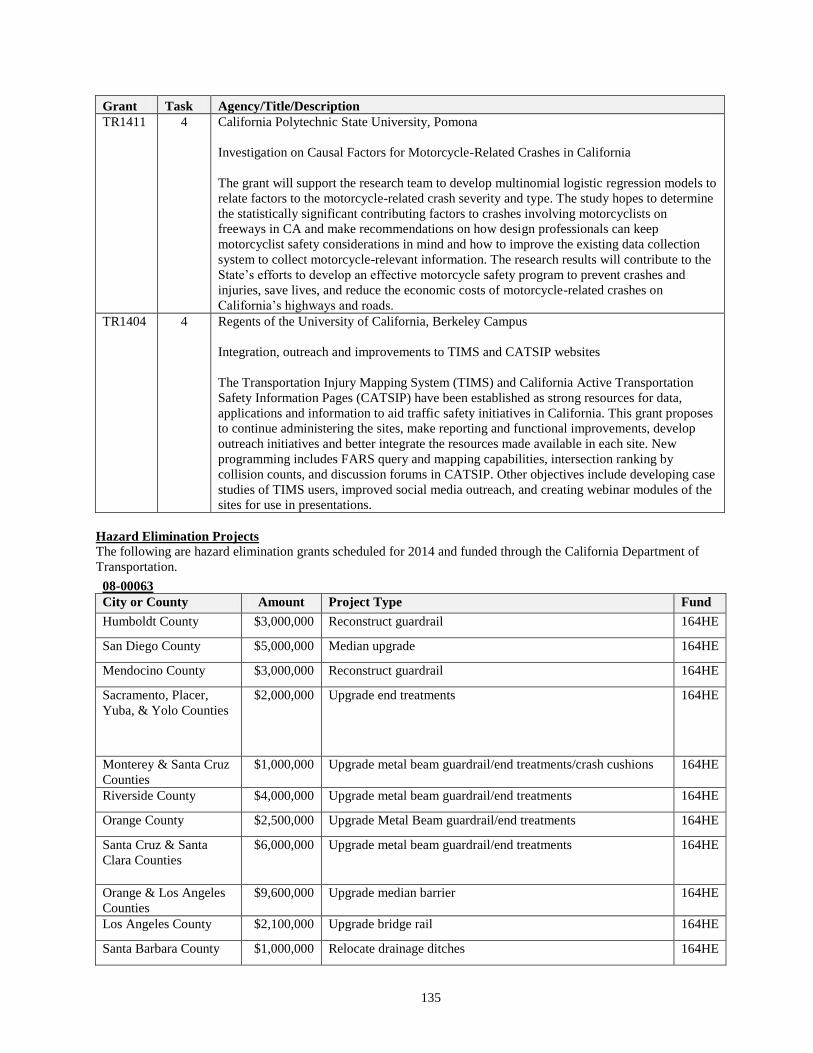
135
Grant Task Agency/Title/Description
TR1411 4 California Polytechnic State University, Pomona
Investigation on Causal Factors for Motorcycle-Related Crashes in California
The grant will support the research team to develop multinomial logistic regression models to
relate factors to the motorcycle-related crash severity and type. The study hopes to determine
the statistically significant contributing factors to crashes involving motorcyclists on
freeways in CA and make recommendations on how design professionals can keep
motorcyclist safety considerations in mind and how to improve the existing data collection
system to collect motorcycle-relevant information. The research results will contribute to the
State’s efforts to develop an effective motorcycle safety program to prevent crashes and
injuries, save lives, and reduce the economic costs of motorcycle-related crashes on
California’s highways and roads.
TR1404 4 Regents of the University of California, Berkeley Campus
Integration, outreach and improvements to TIMS and CATSIP websites
The Transportation Injury Mapping System (TIMS) and California Active Transportation
Safety Information Pages (CATSIP) have been established as strong resources for data,
applications and information to aid traffic safety initiatives in California. This grant proposes
to continue administering the sites, make reporting and functional improvements, develop
outreach initiatives and better integrate the resources made available in each site. New
programming includes FARS query and mapping capabilities, intersection ranking by
collision counts, and discussion forums in CATSIP. Other objectives include developing case
studies of TIMS users, improved social media outreach, and creating webinar modules of the
sites for use in presentations.
Hazard Elimination Projects
The following are hazard elimination grants scheduled for 2014 and funded through the California Department of
Transportation.
08-00063
City or County Amount Project Type Fund
Humboldt County $3,000,000 Reconstruct guardrail 164HE
San Diego County $5,000,000 Median upgrade 164HE
Mendocino County $3,000,000 Reconstruct guardrail 164HE
Sacramento, Placer,
Yuba, & Yolo Counties
$2,000,000 Upgrade end treatments 164HE
Monterey & Santa Cruz
Counties
$1,000,000 Upgrade metal beam guardrail/end treatments/crash cushions 164HE
Riverside County $4,000,000 Upgrade metal beam guardrail/end treatments 164HE
Orange County $2,500,000 Upgrade Metal Beam guardrail/end treatments 164HE
Santa Cruz & Santa
Clara Counties
$6,000,000 Upgrade metal beam guardrail/end treatments 164HE
Orange & Los Angeles
Counties
$9,600,000 Upgrade median barrier 164HE
Los Angeles County $2,100,000 Upgrade bridge rail 164HE
Santa Barbara County $1,000,000 Relocate drainage ditches 164HE
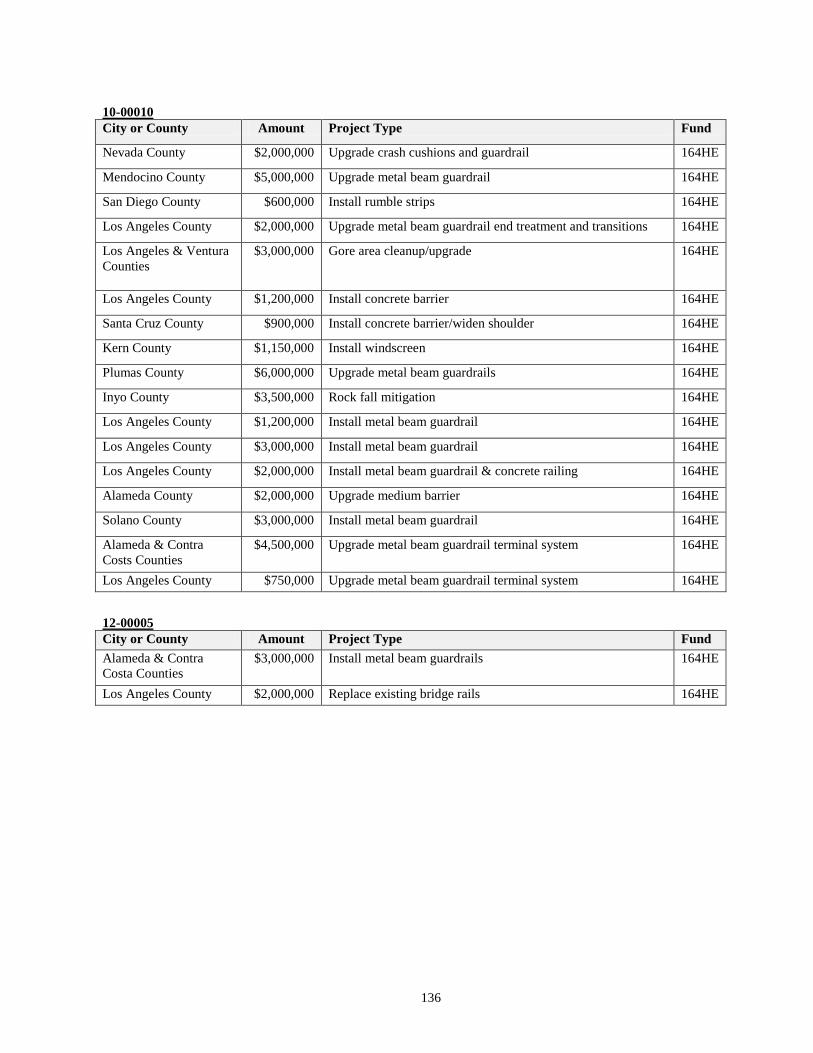
136
10-00010
City or County Amount Project Type Fund
Nevada County $2,000,000 Upgrade crash cushions and guardrail 164HE
Mendocino County $5,000,000 Upgrade metal beam guardrail 164HE
San Diego County $600,000 Install rumble strips 164HE
Los Angeles County $2,000,000 Upgrade metal beam guardrail end treatment and transitions 164HE
Los Angeles & Ventura
Counties
$3,000,000 Gore area cleanup/upgrade 164HE
Los Angeles County $1,200,000 Install concrete barrier 164HE
Santa Cruz County $900,000 Install concrete barrier/widen shoulder 164HE
Kern County $1,150,000 Install windscreen 164HE
Plumas County $6,000,000 Upgrade metal beam guardrails 164HE
Inyo County $3,500,000 Rock fall mitigation 164HE
Los Angeles County $1,200,000 Install metal beam guardrail 164HE
Los Angeles County $3,000,000 Install metal beam guardrail 164HE
Los Angeles County $2,000,000 Install metal beam guardrail & concrete railing 164HE
Alameda County $2,000,000 Upgrade medium barrier 164HE
Solano County $3,000,000 Install metal beam guardrail 164HE
Alameda & Contra
Costs Counties
$4,500,000 Upgrade metal beam guardrail terminal system 164HE
Los Angeles County $750,000 Upgrade metal beam guardrail terminal system 164HE
12-00005
City or County Amount Project Type Fund
Alameda & Contra
Costa Counties
$3,000,000 Install metal beam guardrails 164HE
Los Angeles County $2,000,000 Replace existing bridge rails 164HE
137
HIGH VISIBILITY
ENFORCEMENT CAMPAIGNS

138
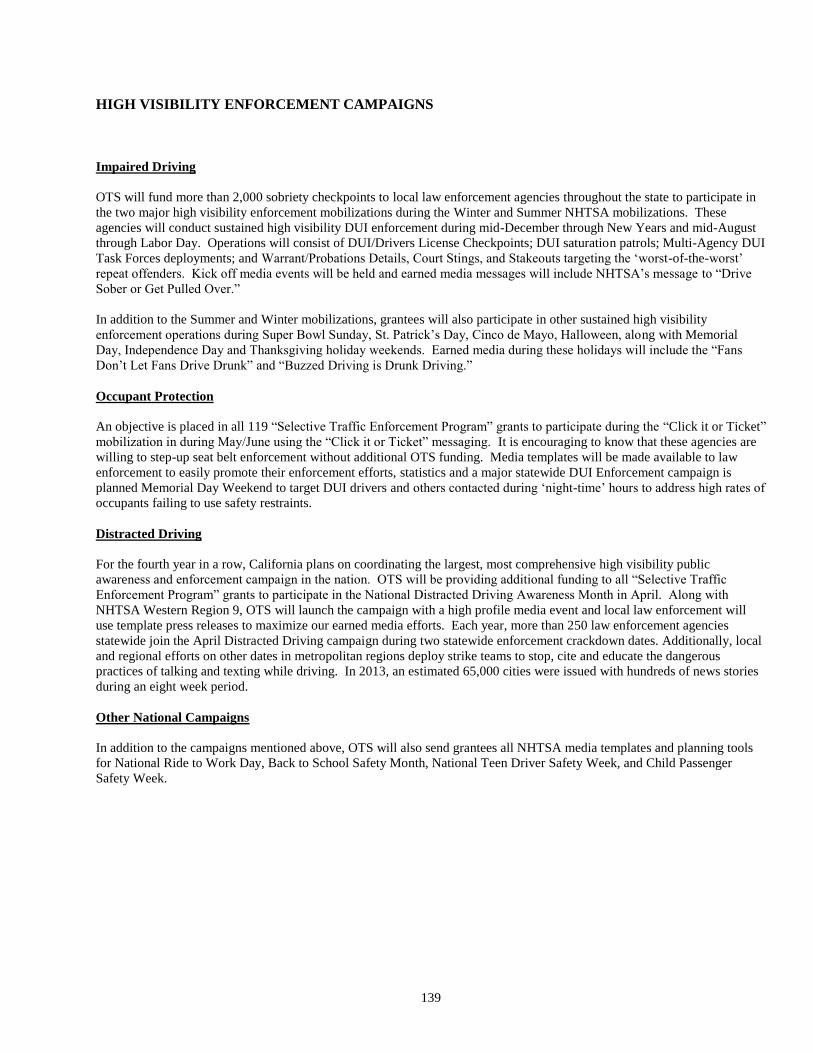
139
HIGH VISIBILITY ENFORCEMENT CAMPAIGNS
Impaired Driving
OTS will fund more than 2,000 sobriety checkpoints to local law enforcement agencies throughout the state to participate in
the two major high visibility enforcement mobilizations during the Winter and Summer NHTSA mobilizations. These
agencies will conduct sustained high visibility DUI enforcement during mid-December through New Years and mid-August
through Labor Day. Operations will consist of DUI/Drivers License Checkpoints; DUI saturation patrols; Multi-Agency DUI
Task Forces deployments; and Warrant/Probations Details, Court Stings, and Stakeouts targeting the ‘worst-of-the-worst’
repeat offenders. Kick off media events will be held and earned media messages will include NHTSA’s message to “Drive
Sober or Get Pulled Over.”
In addition to the Summer and Winter mobilizations, grantees will also participate in other sustained high visibility
enforcement operations during Super Bowl Sunday, St. Patrick’s Day, Cinco de Mayo, Halloween, along with Memorial
Day, Independence Day and Thanksgiving holiday weekends. Earned media during these holidays will include the “Fans
Don’t Let Fans Drive Drunk” and “Buzzed Driving is Drunk Driving.”
Occupant Protection
An objective is placed in all 119 “Selective Traffic Enforcement Program” grants to participate during the “Click it or Ticket”
mobilization in during May/June using the “Click it or Ticket” messaging. It is encouraging to know that these agencies are
willing to step-up seat belt enforcement without additional OTS funding. Media templates will be made available to law
enforcement to easily promote their enforcement efforts, statistics and a major statewide DUI Enforcement campaign is
planned Memorial Day Weekend to target DUI drivers and others contacted during ‘night-time’ hours to address high rates of
occupants failing to use safety restraints.
Distracted Driving
For the fourth year in a row, California plans on coordinating the largest, most comprehensive high visibility public
awareness and enforcement campaign in the nation. OTS will be providing additional funding to all “Selective Traffic
Enforcement Program” grants to participate in the National Distracted Driving Awareness Month in April. Along with
NHTSA Western Region 9, OTS will launch the campaign with a high profile media event and local law enforcement will
use template press releases to maximize our earned media efforts. Each year, more than 250 law enforcement agencies
statewide join the April Distracted Driving campaign during two statewide enforcement crackdown dates. Additionally, local
and regional efforts on other dates in metropolitan regions deploy strike teams to stop, cite and educate the dangerous
practices of talking and texting while driving. In 2013, an estimated 65,000 cities were issued with hundreds of news stories
during an eight week period.
Other National Campaigns
In addition to the campaigns mentioned above, OTS will also send grantees all NHTSA media templates and planning tools
for National Ride to Work Day, Back to School Safety Month, National Teen Driver Safety Week, and Child Passenger
Safety Week.

140

141
PERFORMANCE
REPORT
FY 2013

142
143
PERFORMANCE REPORT
California continued to lead the nation in efforts to save lives, prevent injuries and reduce economic losses from traffic
crashes. In FY 2012, OTS awarded $86 million in grants to 232 agencies for all priority program areas. Listed below are the
outcomes for the ten core performance measures, one core behavior measure, three activity measures, and other funded
program goals. California’s 2012 Annual Performance Report can be found on our website at www.ots.ca.gov and includes
more detailed information on project distribution, the Statewide Traffic Safety Intercept Survey, California’s 2012 Traffic
Safety Score Card, Program Area Highlights, and copies of 24 statewide press releases.
Core Performance Measures
C-1: Traffic Fatalities – Fatality Analysis Reporting System (FARS)
To decrease traffic fatalities 12.3 percent from the 2008-2010 calendar base year average of 3,078 to 2,700 by
December 31, 2012.
Result: Traffic fatalities decreased 9.3 percent from the 2008-2010 calendar base year average of 3,078 to 2,791.
C-2: Serious Traffic Injuries – Statewide Integrated Traffic Records System (SWITRS)
To decrease serious traffic injuries 18 percent from the 2008-2010 calendar base year average of 11,081 to 10,200
by December 31, 2012.
Result: Data not yet available.
C-3: Fatalities/VMT (FARS/FHWA)
To decrease fatalities/VMT from the 2006–2008 calendar base year average of 1.18 to 1.03 by December 31, 2012.
Result: Fatalities/VMT decreased .34 points from the 2006-2008 calendar base year average of 1.18 to .84.
C-4: Unrestrained Passenger Vehicle Occupant Fatalities in all Seating Positions (FARS)
To decrease unrestrained passenger vehicle occupant fatalities in all seating positions 22.7 percent from the 2008–
2010 calendar base year average of 608 to 470 by December 31, 2012.
Result: Unrestrained passenger vehicle occupant fatalities in all seating positions decreased 14 percent from the
2008-2010 calendar base year average of 608 to 523.
C-5: Alcohol-Impaired Driving Fatalities (FARS)
To decrease alcohol-impaired driving fatalities 14.1 percent from the 2008–2010 calendar base year average of 907
to 780 by December 31, 2012.
Result: Alcohol-impaired driving fatalities decreased 14.7 percent from the 2008-2010 calendar base year average of
907 to 774.
C-6: Speeding-Related Fatalities (FARS)
To reduce speeding-related fatalities 13.5 percent from the 2008-2010 calendar base year average of 1,051 to 910 by
December 31, 2012.
Result: Speeding-related fatalities decreased 15.4 percent from the 2008-2010 calendar base year average of 1,051 to
890.
C-7: Motorcyclist Fatalities (FARS)
To decrease motorcyclist fatalities 21.4 percent from the 2008–2010 calendar base year average of 435 to 342 by
December 31, 2012.
Result: Motorcyclist fatalities decreased 4.9 percent from the calendar base year average of 435 to 414.
C-8: Unhelmeted Motorcyclist Fatalities (FARS)
To decrease unhelmeted motorcyclist fatalities 50 percent from the 2008–2010 calendar base year average of 46 to
23 by December 31, 2012.
Result: Unhelmeted motorcyclist fatalities decreased 43.5 percent from the 2008-2010 calendar base year average of
46 to 26.
144
C-9: Drivers Age 20 or Younger Involved in Fatal Crashes (FARS)
To decrease drivers age 20 or younger involved in fatal crashes 23.5 percent from the 2008-2010 calendar base year
average of 431 to 330 by December 31, 2012.
Result: Drivers age 20 or younger involved in fatal crashes decreased 25.6 percent from the 2008-2010 calendar
base year average of 431 to 321.
C-10: Pedestrian Fatalities (FARS)
To reduce pedestrian fatalities 1.1 percent from the 2008-2010 calendar base year average of 596 to 590 by
December 31, 2012.
Result: Pedestrian fatalities increased 4.7 percent from the 2008-2010 calendar base year average of 596 to 625.
Core Behavior Measure
B-1: Statewide Observed Seat Belt Use of Front Seat Outboard Occupants in Passenger Vehicles (Survey)
To increase statewide observed seat belt use of front seat outboard occupants in passenger vehicles .7 percentage
points from the 2008-2010 calendar base year average usage rate of 96 percent to 96.7 percent by December 31,
2012.
Result: Observed seat belt use of front seat outboard occupants in passenger vehicles decreased .2 percentage points
from 95.7 percent to 95.5 percent.
Activity Measures
A-1: Seat Belt Citations Issued During Grant Funded Enforcement Activities – 4,181
A-2: Impaired Driving Arrests Made During Grant Funded Enforcement Activities – 17,695
A-3: Speeding Citations Issued During Grant Funded Enforcement Activities – 37,418
Funded Goals
Alcohol-Impaired Driving
To reduce the number of persons killed in alcohol-involved collisions 5 percent by September 30, 2012.
Result: Persons killed in alcohol-involved collisions decreased 14.3 percent from 175 to 150.
To reduce the number of persons injured in alcohol-involved collisions 6 percent by September 30, 2012.
Result: Persons injured in alcohol-involved collisions increased .06 percent from 6,150 to 6,181.
To reduce hit-and-run fatal collisions 5 percent by September 30, 2012.
Result: Hit-and-run fatal collisions increased 5 percent from 88 to 92.
To reduce hit-and-run injury collisions 5 percent by September 30, 2012.
Result: Hit-and-run fatal collisions decreased 7.6 percent from 12,277 to 11,356.
To reduce nighttime (2100 - 0300 hours) fatal collisions 5 percent by September 30, 2012.
Result: Nighttime (2100 - 0300 hours) fatal collisions increased 7 percent from 192 to 207.
To reduce nighttime (2100 - 0300 hours) injury collisions 5 percent by September 30, 2012.
Result: Nighttime (2100 - 0300 hours) injury collisions decreased 8.2 percent from 8,226 to 7,552.
To reduce the number of motorcyclists killed in alcohol-involved collisions 5 percent by September 30, 2012.
Result: Motorcyclists killed in alcohol-involved collisions decreased 5.3 percent from 19 to 18.
To reduce the number of motorcyclists injured in alcohol-involved collisions 5 percent by September 30, 2012.
Result: Motorcyclists injured in alcohol-involved collisions increased 25.4 percent from 94 to 126.
145
Bicycle Safety
To reduce the total number of bicyclists killed in traffic- related collisions 10 percent by September 30, 2012.
Result: Bicyclists killed in traffic-related collisions was maintained at 0.
To reduce the total number of bicyclists injured in traffic- related collisions 10 percent by September 30, 2012.
Result: Bicyclists injured in traffic-related collisions increased 16 percent from 148 to 175.
To increase bicycle helmet compliance for children aged five to 18 by 25 percentage points by September 30, 2012.
Result: Bicycle helmet compliance for children aged five to 18 increased 30 percentage points from 34 percent to 64
percent.
To reduce the number of bicyclists killed in traffic-related collisions under the age of 15 by seven percent by September 30,
2012.
Result: Bicyclists killed in traffic-related collisions under the age of 15 was maintained at 0.
To reduce the number of bicyclists injured in traffic-related collisions under the age of 15 by ten percent by September 30,
2012.
Result: Bicyclists injured in traffic-related collisions under the age of 15 decreased 34 percent from 15 to 10.
Emergency Medical Services
To decrease the average response time for the arrival of appropriate equipment at collision sites in rural areas.
Result: Average response time for the arrival of appropriate equipment at collision sites in rural areas decreased
from 20 minutes to 12 minutes.
Occupant Protection
To increase seat belt compliance 5 percentage points by September 30, 2012.
Result: Seat belt compliance increased 2 percentage points from 94 percent to 96 percent.
To increase child safety seat usage 6 percentage points by September 30, 2012.
Result: Child safety seat usage increased 2 percentage points from 82 percent to 84 percent.
To reduce the number of vehicle occupants killed and injured under the age of six by ten percent by September 30, 2012.
Result: Vehicle occupants killed and injured under the age of six decreased 14 percent from 79 to 68.
Pedestrian Safety
To reduce the total number of pedestrians killed 8 percent by September 30, 2012.
Result: Pedestrians killed decreased 40 percent from five to two.
To reduce the total number of pedestrians injured 10 percent by September 30, 2012.
Result: Pedestrians injured increased 3 percent from 153 to 157.
To reduce the number of pedestrians killed under the age of 15 by 9 percent by September 30, 2012.
Result: Pedestrians killed under the age of 15 was maintained at 0.
To reduce the number of pedestrians injured under the age of 15 by 11 percent by September 30, 2012.
Result: Pedestrians injured under the age of 15 was maintained at 14.
To reduce the number of pedestrians killed over the age of 65 by 7 percent by September 30, 2012.
Result: Pedestrians injured under the age of 15 was maintained at 0.
146
To reduce the number of pedestrians injured over the age of 65 by 5 percent by September 30, 2012.
Result: Pedestrians injured over the age of 65 increased 67 percent from 1 to 3.
Police Traffic Services
To reduce the total number of persons killed in traffic collisions 2 percent by September 30, 2012.
Result: Persons killed in traffic collisions increased 3.1 percent from 751 to 775.
To reduce the total number of persons injured in traffic collisions 2 percent by September 30, 2012.
Result: Persons killed in traffic collisions decreased 3.1 percent from 82,097 to 79,589.
Roadway Safety/Traffic Records
To establish citywide and countywide Geographic Information Systems (GIS) and/or other automated collision analysis
systems including hardware, software and network cabling or other linking media to enable data sharing between
enforcement agencies, Departments of Public Works and other related agencies.
To ensure public works and enforcement agencies have timely access to current and complete traffic data necessary to
identify, isolate and analyze critical traffic safety issues.
To improve the Traffic Engineering Department’s customer service by reducing the time required to produce and track
collision reports and also by reducing by 50 percent the time that it takes to identify and analyze high collision locations.
One rural county and one urban city were funded for new Traffic Collision Data Analysis and Mapping systems.
The systems replaced manual input databases or paper files, allowing Traffic Engineers access to extensive collision
analysis tools, automated standard reports, and mapping of collision locations.
Public Relations, Marketing and Advertising
OTS Marketing and Public Affairs supports the OTS mission of reducing deaths, injuries and economic losses resulting from
traffic crashes by creating and implementing comprehensive public awareness programs designed to improve and encourage
safe driving practices statewide. In addition, these efforts are intended to make safe driving the behavior of choice for all
Californians, including at-risk and under-served communities. OTS recognizes the challenge of reaching a diverse and
widespread population of over 38 million people, and creates its public awareness efforts to best and most effectively reach
them.
Results included the following:
In FFY 2012, OTS Public Affairs was instrumental in the successful implementation of multiple statewide and regional
campaigns and outreach efforts. More Californians and visitors are being reached with traffic safety messaging, in more
ways, than ever before.
Holiday DUI Crackdown Campaign
In conjunction with the state’s comprehensive regional and county “Avoid DUI” taskforces, OTS partnered with the CHP,
Alcoholic Beverage Control (ABC), DMV and Department of Transportation (Caltrans), among others, to conduct the state’s
annual winter holiday anti-DUI campaign. The OTS portion of the effort generated more than 200 million audience
impressions from earned media placements, paid advertising and public service announcements. Collectively the campaign
generated more than $2 million in added value.
Distracted Driving
OTS led the second year of the largest, most comprehensive high visibility public awareness and enforcement campaign in
the nation. The campaign generated 300 million impressions and $3 million in added value. After several months of low-level
activity following the initial 2011 campaign launch, OTS led an all-out effort throughout April’s second annual National
Distracted Driving Month. The “Don’t Be a Distracted Driving Zombie” theme highlighted the reduction in driving brain
activity when engaged in talking or texting on cell phones. OTS, along with efforts by the CHP, Caltrans, DMV, and local
jurisdictions, held multiple press events, utilized paid media, public service media, earned media, and social media
147
extensively. OTS continued the relationship with the Gannett Company’s Sacramento television station with an integrated
distracted driving media campaign.
Sports and Venue Marketing
OTS continues to lead the nation when it comes to using sports and entertainment venues as a means to reach the public with
life-saving traffic safety messages. As FFY 2012 marked the program’s eighteenth year in California, OTS continued to
partner with professional sports teams and entertainment venues to promote key programs, including seat belt use, impaired
driving, distracted driving and youth safety education. Our partners included the Los Angeles Angels of Anaheim; TEAM
Coalition; Clear Channel radio in Fresno; the San Francisco Giants; the Sacramento River Cats; the Golden State Warriors;
the San Jose Sharks; 91X radio in San Diego; Stanford, San Jose, Fresno State, and San Diego State football; Live Nation
Concert Productions; and the California State Fair.
Seat Belt Mobilizations
In FFY 2012, the decision was made to de-emphasize the large “Click It or Ticket” public awareness campaigns that had
been utilized in the past. This was due to the phenomenal 96.6 percent seat belt usage rate reported in 2011. Although there
was no paid media or heavy outreach campaigns, OTS continued with some earned media both on a statewide and local level,
plus the over 650 permanent road signs remain in place. All indications were that both the media and public were under the
impression that “Click It or Ticket” special enforcement was continuing unabated. The usage rate also remained nearly
constant.
Grantee Media Relations
OTS Public Affairs regularly provides technical assistance to local grantees in their communications and outreach efforts. In
FFY 2012, Public Affairs supported grantees in the development of press materials and the planning of media events. OTS
assisted local grantees by developing over 25 press release templates for their use. The templates were made available on the
OTS website for easy downloading and use. OTS aided grantees by participating in print and broadcast media interviews to
underscore the key points regarding impaired driving, occupant protection, distracted driving, and police traffic services,
among others. Nearly 200 grant kickoff press releases and over 700 operation/activity press releases from grantees were
reviewed and edited as needed. Media campaigns costing $1.3 million were implemented by the CHP to support statewide
and local enforcement and education efforts.
Social Media
FFY 2012 saw a marked expansion of OTS presence on social media. Facebook “likes” jumped from around 3,000 up to a
high of nearly 25,000. OTS Facebook is unique among state highway safety sites in that we stress engagement first and
message second. A combination of eye-catching graphics, contests, quizzes, photos, videos and choreographed
conversational interaction are all designed to immediately and constantly bring in visitors and keep them returning. As they
stay, the traffic safety messaging is subtly, and sometimes directly, insinuated into the conversation. Additionally, 2012 saw
the expansion of OTS presence on Twitter, also relying heavily on pulling in followers with choreographed conversational
interaction. It boasts over 3,100 followers. The OTS YouTube Channel has been effectively used as a landing spot for
“viralized” videos. The distracted driving campaign relied on it, with one video viewed nearly 15,000 in three days, while the
thirty second broadcast PSA has been viewed been viewed there more than 16,000 times.
On-Going Outdoor Advertising
OTS invested heavily in outdoor billboard display advertising, bringing the “Report Drunk Drivers. Call 911” message to
drivers in all major California urban markets. A nine month campaign that utilized billboards, augmented by mobile display
units, radio ads and streaming audio sources, garnered nearly one billion adult impressions.
Institutional Partnering
OTS continued to build on highly successful cooperative promotional activities with NHTSA, Mothers Against Drunk
Driving (MADD), and other national institutions, as well as many industry groups such as 7-11 Markets, CBS and Clear
Channel Outdoor, KXTV, and Live Nation Entertainment. OTS partnerships with other state agencies have been particularly
effective, including the DMV, CHP, ABC, Department of Public Health, and Caltrans. The use of Caltrans changeable
message signs for traffic safety during the holiday “DUI Crackdown” and “Click It or Ticket” periods, the “It’s Not Worth
It!” distracted driving campaign, and special enforcement periods, have reached tens of millions of freeway drivers
repeatedly with the traffic safety message.

148
149
CERTIFICATIONS AND ASSURANCES
FOR HIGHWAY SAFETY GRANTS

150
151
CERTIFICATION AND ASSURANCES FOR HIGHWAY SAFETY GRANTS
Each fiscal year the State must sign these Certifications and Assurances that it complies with all requirements including
applicable Federal statutes and regulations that are in effect during the grant period. (Requirements that also apply to sub-
recipients are noted under the applicable caption.)
In my capacity as the Governor’s Representative for Highway Safety, I hereby provide the following certifications and
assurances:
GENERAL REQUIREMENTS
To the best of my personal knowledge, the information submitted in the Highway Safety Plan in support of the State’s
application for Section 402 and Section 405 grants is accurate and complete. (Incomplete or incorrect information may result
in the disapproval of the Highway Safety Plan.)
The Governor is the responsible official for the administration of the State highway safety program through a State highway
safety agency that has adequate powers and is suitably equipped and organized (as evidenced by appropriate oversight
procedures governing such areas as procurement, financial administration, and the use, management, and disposition of
equipment) to carry out the program. (23
U.S.C. 402(b)(1)(A))
The State will comply with applicable statutes and regulations, including but not limited to:
• 23 U.S.C. Chapter 4—Highway Safety Act of 1966, as amended
• 49 CFR Part 18—Uniform Administrative Requirements for Grants and Cooperative Agreements to State and Local
Governments
• 23 CFR Part 1200—Uniform Procedures for State Highway Safety Grant Programs
The State has submitted appropriate documentation for review to the single point of contact designated by the Governor to
review Federal programs, as required by Executive Order 12372 (Intergovernmental
Review of Federal Programs).
FEDERAL FUNDING ACCOUNTABILITY AND TRANSPARENCY ACT (FFATA)
The State will comply with FFATA guidance, OMB Guidance on FFATA Sub-award and Executive Compensation
Reporting, August 27, 2010, (https://www. fsrs.gov/documents/OMB_Guidance_on_ FFATA_Subaward_and_Executive_
Compensation_Reporting_08272010.pdf) by reporting to FSRS.gov for each sub-grant awarded:
• Name of the entity receiving the award;
• Amount of the award;
• Information on the award including transaction type, funding agency, the North American Industry Classification System
code or Catalog of Federal Domestic Assistance number (where applicable), program source;
• Location of the entity receiving the award and the primary location of performance under the award, including the city,
State, congressional district, and country; and an award title descriptive of the purpose of each funding action;
• A unique identifier (DUNS);
152
• The names and total compensation of the five most highly compensated officers of the entity if:
(i) the entity in the preceding fiscal year received—
(I) 80 percent or more of its annual gross revenues in Federal awards;
(II) $25,000,000 or more in annual gross revenues from Federal awards; and
(ii) the public does not have access to information about the compensation of the senior executives of the entity through
periodic reports filed under section 13(a) or
15(d) of the Securities Exchange Act of 1934 (15 U.S.C. 78m(a), 78o(d)) or section 6104 of the Internal Revenue Code of
1986;
• Other relevant information specified by OMB guidance.
NONDISCRIMINATION (applies to sub-recipients as well as States)
The State highway safety agency will comply with all Federal statutes and implementing regulations relating to
nondiscrimination. These include but are not limited to:
(a) Title VI of the Civil Rights Act of 1964 (Pub. L. 88–352), which prohibits discrimination on the basis of race, color or
national origin (and 49 CFR Part 21);
(b) Title IX of the Education Amendments of 1972, as amended (20 U.S.C. 1681–1683 and 1685–1686), which prohibits
discrimination on the basis of sex;
(c) Section 504 of the Rehabilitation Act of 1973, as amended (29 U.S.C. 794), and the Americans with Disabilities Act of
1990 (Pub. L. 101–336), as amended (42 U.S.C. 12101, et seq.), which prohibits discrimination on the basis of disabilities
(and 49 CFR Part 27);
(d) the Age Discrimination Act of 1975, as amended (42 U.S.C. 6101–6107), which prohibits discrimination on the basis of
age;
(e) the Civil Rights Restoration Act of 1987 (Pub. L.100–259), which requires Federal-aid recipients and all sub-recipients to
prevent discrimination and ensure nondiscrimination in all of their programs and activities;
(f) the Drug Abuse Office and Treatment Act of 1972 (Pub. L. 92–255), as amended, relating to nondiscrimination on the
basis of drug abuse;
(g) the comprehensive Alcohol Abuse and Alcoholism Prevention, Treatment and Rehabilitation Act of 1970 (Pub. L. 91–
616), as amended, relating to nondiscrimination on the basis of alcohol abuse or alcoholism;
(h) Sections 523 and 527 of the Public Health Service Act of 1912, as amended (42 U.S.C. 290dd–3 and 290ee–3), relating to
confidentiality of alcohol and drug abuse patient records;
(i) Title VIII of the Civil Rights Act of 1968, as amended (42 U.S.C. 3601, et seq.), relating to nondiscrimination in the sale,
rental or financing of housing;
(j) any other nondiscrimination provisions in the specific statute(s) under which application for Federal assistance is being
made; and
(k) the requirements of any other nondiscrimination statute(s) which may apply to the application.
153
THE DRUG-FREE WORKPLACE ACT OF 1988 (41 U.S.C. 8103)
The State will provide a drug-free workplace by:
• Publishing a statement notifying employees that the unlawful manufacture, distribution, dispensing, possession or use of a
controlled substance is prohibited in the grantee’s workplace and specifying the actions that will be taken against employees
for violation of such prohibition;
• Establishing a drug-free awareness program to inform employees about:
The dangers of drug abuse in the workplace.
The grantee’s policy of maintaining a drug-free workplace.
Any available drug counseling, rehabilitation, and employee assistance programs.
The penalties that may be imposed upon employees for drug violations occurring in the workplace.
Making it a requirement that each employee engaged in the performance of the grant be given a copy of the
statement required by paragraph (a).
• Notifying the employee in the statement required by paragraph (a) that, as a condition of employment under the grant, the
employee will—
Abide by the terms of the statement.
Notify the employer of any criminal drug statute conviction for a violation occurring in the workplace no later than
five days after such conviction.
• Notifying the agency within ten days after receiving notice under subparagraph (d)(2) from an employee or otherwise
receiving actual notice of such conviction.
• Taking one of the following actions, within 30 days of receiving notice under subparagraph (d)(2), with respect to any
employee who is so convicted—
Taking appropriate personnel action against such an employee, up to and including termination.
Requiring such employee to participate satisfactorily in a drug abuse assistance or rehabilitation program approved
for such purposes by a Federal, State, or local health, law enforcement, or other appropriate agency.
• Making a good faith effort to continue to maintain a drug-free workplace through implementation of all of the paragraphs
above.
BUY AMERICA ACT (applies to sub-recipients as well as States)
The State will comply with the provisions of the Buy America Act (49 U.S.C. 5323(j)), which contains the following
requirements:
Only steel, iron and manufactured products produced in the United States may be purchased with Federal funds unless the
Secretary of Transportation determines that such domestic purchases would be inconsistent with the public interest, that such
materials are not reasonably available and of a satisfactory quality, or that inclusion of domestic materials will increase the
cost of the overall project contract by more than 25 percent. Clear justification for the purchase of non-domestic items must
be in the form of a waiver request submitted to and approved by the Secretary of Transportation.
POLITICAL ACTIVITY (HATCH ACT) (applies to sub-recipients as well as States)
The State will comply with provisions of the Hatch Act (5 U.S.C. 1501–1508) which limits the political activities of
employees whose principal employment activities are funded in whole or in part with Federal funds.
154
CERTIFICATION REGARDING FEDERAL LOBBYING (applies to sub-recipients as well as States)
Certification for Contracts, Grants, Loans, and Cooperative Agreements
The undersigned certifies, to the best of his or her knowledge and belief, that:
1. No Federal appropriated funds have been paid or will be paid, by or on behalf of the undersigned, to any person for
influencing or attempting to influence an officer or employee of any agency, a Member of Congress, an officer or
employee of Congress, or an employee of a Member of Congress in connection with the awarding of any Federal
contract, the making of any Federal grant, the making of any Federal loan, the entering into of any cooperative
agreement, and the extension, continuation, renewal, amendment, or modification of any Federal contract, grant, loan, or
cooperative agreement.
2. If any funds other than Federal appropriated funds have been paid or will be paid to any person for influencing or
attempting to influence an officer or employee of any agency, a Member of Congress, an officer or employee of
Congress, or an employee of a Member of Congress in connection with this Federal contract, grant, loan, or cooperative
agreement, the undersigned shall complete and submit Standard Form-LLL, ‘‘Disclosure Form to Report Lobbying,’’ in
accordance with its instructions.
3. The undersigned shall require that the language of this certification be included in the award documents for all sub-
award at all tiers (including subcontracts, sub-grants, and contracts under grant, loans, and cooperative agreements) and
that all sub-recipients shall certify and disclose accordingly.
This certification is a material representation of fact upon which reliance was placed when this transaction was made or
entered into. Submission of this certification is a prerequisite for making or entering into this transaction imposed by section
1352, title 31, U.S. Code. Any person who fails to file the required certification shall be subject to a civil penalty of not less
than $10,000 and not more than $100,000 for each such failure.
RESTRICTION ON STATE LOBBYING (applies to sub-recipients as well as States)
None of the funds under this program will be used for any activity specifically designed to urge or influence a State or local
legislator to favor or oppose the adoption of any specific legislative proposal pending before any State or local legislative
body. Such activities include both direct and indirect (e.g., ‘‘grassroots’’) lobbying activities, with one exception. This does
not preclude a State official whose salary is supported with NHTSA funds from engaging in direct communications with
State or local legislative officials, in accordance with customary State practice, even if such communications urge legislative
officials to favor or oppose the adoption of a specific pending legislative proposal.
CERTIFICATION REGARDING DEBARMENT AND SUSPENSION (applies to sub-recipients as well as States)
Instructions for Primary Certification -- By signing and submitting this proposal, the prospective primary participant is
providing the certification set out below.
1. The inability of a person to provide the certification required below will not necessarily result in denial of
participation in this covered transaction. The prospective participant shall submit an explanation of why it cannot
provide the certification set out below. The certification or explanation will be considered in connection with the
department or agency’s determination whether to enter into this transaction. However, failure of the prospective
primary participant to furnish a certification or an explanation shall disqualify such person from participation in this
transaction.
2. The certification in this clause is a material representation of fact upon which reliance was placed when the
department or agency determined to enter into this transaction. If it is later determined that the prospective primary
participant knowingly rendered an erroneous certification, in addition to other remedies available to the Federal
Government, the department or agency may terminate this transaction for cause or default.
155
3. The prospective primary participant shall provide immediate written notice to the department or agency to which this
proposal is submitted if at any time the prospective primary participant learns its certification was erroneous when
submitted or has become erroneous by reason of changed circumstances.
4. The terms covered transaction, debarred, suspended, ineligible, lower tier covered transaction, participant, person,
primary covered transaction, principal, proposal, and voluntarily excluded, as used in this clause, have the meaning
set out in the Definitions and coverage sections of 49 CFR Part 29. You may contact the department or agency to
which this proposal is being submitted for assistance in obtaining a copy of those regulations.
5. The prospective primary participant agrees by submitting this proposal that, should the proposed covered transaction
be entered into, it shall not knowingly enter into any lower tier covered transaction with a person who is proposed
for debarment under 48 CFR Part 9, subpart 9.4, debarred, suspended, declared ineligible, or voluntarily excluded
from participation in this covered transaction, unless authorized by the department or agency entering into this
transaction.
6. The prospective primary participant further agrees by submitting this proposal that it will include the clause titled
‘‘Certification Regarding Debarment, Suspension, Ineligibility and Voluntary Exclusion-Lower Tier Covered
Transaction,’’ provided by the department or agency entering into this covered transaction, without modification, in
all lower tier covered transactions and in all solicitations for lower tier covered transactions.
7. A participant in a covered transaction may rely upon a certification of a prospective participant in a lower tier
covered transaction that it is not proposed for debarment under 48 CFR Part 9, subpart 9.4, debarred, suspended,
ineligible, or voluntarily excluded from the covered transaction, unless it knows that the certification is erroneous. A
participant may decide the method and frequency by which it determines the eligibility of its principals. Each
participant may, but is not required to, check the list of Parties Excluded from Federal Procurement and Non-
procurement Programs.
8. Nothing contained in the foregoing shall be construed to require establishment of a system of records in order to
render in good faith the certification required by this clause. The knowledge and information of a participant is not
required to exceed that which is normally possessed by a prudent person in the ordinary course of business dealings.
9. Except for transactions authorized under paragraph 6 of these instructions, if a participant in a covered transaction
knowingly enters into a lower tier covered transaction with a person who is proposed for debarment under 48 CFR
Part 9, subpart 9.4, suspended, debarred, ineligible, or voluntarily excluded from participation in this transaction, in
addition to other remedies available to the Federal Government, the department or agency may terminate this
transaction for cause or default.
Certification Regarding Debarment, Suspension, and Other Responsibility Matters-Primary Covered Transactions
(1) The prospective primary participant certifies to the best of its knowledge and belief, that its principals:
(a) Are not presently debarred, suspended, proposed for debarment, declared ineligible, or voluntarily excluded by
any Federal department or agency;
(b) Have not within a three-year period preceding this proposal been convicted of or had a civil judgment rendered
against them for commission of fraud or a criminal offense in connection with obtaining, attempting to obtain, or performing
a public (Federal, State or local) transaction or contract under a public transaction; violation of Federal or State antitrust
statutes or commission of embezzlement, theft, forgery, bribery, falsification or destruction of record, making false
statements, or receiving stolen property;
(c) Are not presently indicted for or otherwise criminally or civilly charged by a governmental entity (Federal, State
or Local) with commission of any of the offenses enumerated in paragraph (1)(b) of this certification; and
(d) Have not within a three-year period preceding this application/proposal had one or more public transactions
(Federal, State, or local) terminated for cause or default.
156
(2) Where the prospective primary participant is unable to certify to any of the Statements in this certification, such
prospective participant shall attach an explanation to this proposal.
Instructions for Lower Tier Certification
1. By signing and submitting this proposal, the prospective lower tier participant is providing the certification set out
below.
2. The certification in this clause is a material representation of fact upon which reliance was placed when this
transaction was entered into. If it is later determined that the prospective lower tier participant knowingly rendered an
erroneous certification, in addition to other remedies available to the Federal government, the department or agency with
which this transaction originated may pursue available remedies, including suspension and/or debarment.
3. The prospective lower tier participant shall provide immediate written notice to the person to which this proposal
is submitted if at any time the prospective lower tier participant learns that its certification was erroneous when submitted or
has become erroneous by reason of changed circumstances.
4. The terms covered transaction, debarred, suspended, ineligible, lower tier covered transaction, participant, person,
primary covered transaction, principal, proposal, and voluntarily excluded, as used in this clause, have the meanings set out
in the Definition and Coverage sections of 49 CFR Part 29. You may contact the person to whom this proposal is submitted
for assistance in obtaining a copy of those regulations.
5. The prospective lower tier participant agrees by submitting this proposal that, should the proposed covered
transaction be entered into, it shall not knowingly enter into any lower tier covered transaction with a person who is proposed
for debarment under 48 CFR Part 9, subpart 9.4, debarred, suspended, declared ineligible, or voluntarily excluded from
participation in this covered transaction, unless authorized by the department or agency with which this transaction
originated.
6. The prospective lower tier participant further agrees by submitting this proposal
that it will include the clause titled ‘‘Certification Regarding Debarment, Suspension, Ineligibility and Voluntary
Exclusion—Lower Tier Covered Transaction,’’ without modification, in all lower tier covered transactions and in all
solicitations for lower tier covered transactions. (See below)
7. A participant in a covered transaction may rely upon a certification of a prospective participant in a lower tier
covered transaction that it is not proposed for debarment under 48 CFR Part 9, subpart 9.4, debarred, suspended, ineligible, or
voluntarily excluded from the covered transaction, unless it knows that the certification is erroneous. A participant may
decide the method and frequency by which it determines the eligibility of its principals. Each participant may, but is not
required to, check the List of Parties Excluded from Federal Procurement and Non-procurement Programs.
8. Nothing contained in the foregoing shall be construed to require establishment of a system of records in order to
render in good faith the certification required by this clause. The knowledge and information of a participant is not required
to exceed that which is normally possessed by a prudent person in the ordinary course of business dealings.
9. Except for transactions authorized under paragraph 5 of these instructions, if a participant in a covered transaction
knowingly enters into a lower tier covered transaction with a person who is proposed for debarment under 48 CFR Part 9,
subpart 9.4, suspended, debarred, ineligible, or voluntarily excluded from participation in this transaction, in addition to other
remedies available to the Federal government, the department or agency with which this transaction originated may pursue
available remedies, including suspension and/or debarment.
Certification Regarding Debarment, Suspension, Ineligibility and Voluntary Exclusion—Lower Tier Covered
Transactions:
1. The prospective lower tier participant certifies, by submission of this proposal, that neither it nor its principals is presently
debarred, suspended, proposed for debarment, declared ineligible, or voluntarily excluded from participation in this
transaction by any Federal department or agency.
2. Where the prospective lower tier participant is unable to certify to any of the statements in this certification, such
prospective participant shall attach an explanation to this proposal.
157
POLICY ON SEAT BELT USE
In accordance with Executive Order 13043, Increasing Seat Belt Use in the United States, dated April 16, 1997, the Grantee
is encouraged to adopt and enforce on-the-job seat belt use policies and programs for its employees when operating
company-owned, rented, or personally-owned vehicles. The National Highway Traffic Safety Administration (NHTSA) is
responsible for providing leadership and guidance in support of this Presidential initiative. For information on how to
implement such a program, or statistics on the potential benefits and cost-savings to your company or organization, please
visit the Buckle Up America section on NHTSA’s Web site at www.nhtsa.dot.gov. Additional resources are available from
the Network of Employers for Traffic Safety (NETS), a public-private partnership headquartered in the Washington, DC
metropolitan area, and dedicated to improving the traffic safety practices of employers and employees. NETS is prepared to
provide technical assistance, a simple, user-friendly program kit, and an award for achieving the President’s goal of 90
percent seat belt use. NETS can be contacted at 1 (888) 221–0045 or visit its Web site at www.trafficsafety.org.
POLICY ON BANNING TEXT MESSAGING WHILE DRIVING
In accordance with Executive Order 13513, Federal Leadership On Reducing Text Messaging While Driving, and DOT
Order 3902.10, Text Messaging While Driving, States are encouraged to adopt and enforce workplace safety policies to
decrease crashed caused by distracted driving, including policies to ban text messaging while driving company-owned or -
rented vehicles, Government-owned, leased or rented vehicles, or privately-owned when on official Government business or
when performing any work on or behalf of the Government. States are also encouraged to conduct workplace safety
initiatives in a manner commensurate with the size of the business, such as establishment of new rules and programs or re-
evaluation of existing programs to prohibit text messaging while driving, and education, awareness, and other outreach to
employees about the safety risks associated with texting while driving.
ENVIRONMENTAL IMPACT
The Governor’s Representative for Highway Safety has reviewed the State’s Fiscal Year highway safety planning document
and hereby declares that no significant environmental impact will result from implementing this Highway Safety Plan. If,
under a future revision, this Plan is modified in a manner that could result in a significant environmental impact and trigger
the need for an environmental review, this office is prepared to take the action necessary to comply with the National
Environmental Policy Act of 1969 (42 U.S.C. 4321, et seq.) and the implementing regulations of the Council on
Environmental Quality (40 CFR Parts 1500–1517).
SECTION 402 REQUIREMENTS
The political subdivisions of this State are authorized, as part of the State highway safety program, to carry out within their
jurisdictions local highway safety programs which have been approved by the Governor and are in accordance with the
uniform guidelines promulgated by the Secretary of Transportation. (23 U.S.C. 402(b)(1)(B))
At least 40 percent (or 95 percent, as applicable) of all Federal funds apportioned to this State under 23 U.S.C. 402 for this
fiscal year will be expended by or for the benefit of the political subdivision of the State in carrying out local highway safety
programs (23 U.S.C. 402(b)(1)(C), 402(h)(2)), unless this requirement is waived in writing. The State’s highway safety
program provides adequate and reasonable access for the safe and convenient movement of physically handicapped persons,
including those in wheelchairs, across curbs constructed or replaced on or after July 1, 1976, at all pedestrian crosswalks. (23
U.S.C.402(b)(1)(D))
The State will provide for an evidenced- based traffic safety enforcement program to prevent traffic violations, crashes, and
crash fatalities and injuries in areas most at risk for such incidents. (23 U.S.C. 402(b)(1)(E))
The State will implement activities in support of national highway safety goals to reduce motor vehicle related fatalities that
also reflect the primary data-related crash factors within the State as identified by the State highway safety planning process,
including:
158
• Participation in the National high- visibility law enforcement mobilizations;
• Sustained enforcement of statutes addressing impaired driving, occupant protection, and driving in excess of posted speed
limits;
• An annual statewide seat belt use survey in accordance with 23 CFR Part 1340 for the measurement of State seat belt use
rates;
• Development of statewide data systems to provide timely and effective data analysis to support allocation of highway safety
resources;
• Coordination of Highway Safety Plan, data collection, and information systems with the State strategic highway safety plan,
as defined in 23 U.S.C. 148(a).
(23 U.S.C. 402(b)(1)(F))
The State will actively encourage all relevant law enforcement agencies in the State to follow the guidelines established for
vehicular pursuits issued by the International Association of Chiefs of Police that are currently in effect. (23 U.S.C. 402(j))
The State will not expend Section 402 funds to carry out a program to purchase, operate, or maintain an automated traffic
enforcement system. (23 U.S.C. 402(c)(4))
I understand that failure to comply with applicable Federal statutes and regulations may subject State officials to civil or
criminal penalties and/or place the State in a high risk grantee status in accordance with 49 CFR 18.12.
I sign these Certifications and Assurances based on personal knowledge, after appropriate inquiry, and I understand that the
Government will rely on these representations in awarding grant funds.
_______________
Governor’s Representative for Highway Safety
State of California
For FFY 2014
May 30, 2013

159