guts. hcl technologies ltd.10 hcl technol ogies lt d . hcl technologies today hcl technologies...
TRANSCRIPT
HCL Technologies Ltd.
G U T S .
At HCL there ’s on ly one th ing more important than bra ins.

3
4
6
8
9
10
12
13
27
38
43
45
55
C O N T E N T S
Chairman’s Message
Brand HCL: “Courage – Guts – Fearlessness”
HCL Milestones
Key Financials
The Management
HCL Technologies Today
HCL’s Capital Transaction Initiatives
HCL’s Service Offerings
HCL’s Industry Solutions
Dare to Win
Quality
Management Discussion and Analysis
Consolidated Financials

YOU HAVE LESS FEAR.
You don’t have more courage
when you are young.

At HCL there’s only one thing more important than brains.
GUTS

HCL is India’s original garage IT start up story. For 29 years, HCL has stood for invention, re-invention, and creativity. Our DNA reflects restlessness for listening to and responding to the heartbeat of our stakeholders.
Though HCL is a 3 decade old enterprise and HCL Technologies already amongst the Big 5 of Indian IT Service Companies, we are the youngest. Its only been 5 years since we went public. During this time we have unleashed strategic changes to reinvent ourselves and are now on the cusp of a significant transformation. We have over the last few years quietly but determinedly gone about our job of transforming the company, taking bold and courageous steps.
If there is something that separates HCL from others it is our spirit of entrepreneurship, a burning desire to ensure customer satisfaction, and the guts to do things which carry risk but deliver a commensurate reward as well. This has found expression in our “FEARless” advertising campaign where we tried to communicate the fact that HCL has the courage and guts to reinvent itself, continually. Let me explain why we believe we can make a difference to our stakeholders.
First, among all the IT companies, our portfolio of services is perhaps the best balanced. We have depth across 4 broad segments; Product Engineering & Technology Services, Applications, Infrastructure & BPO. We rank No.1 in Infrastructure, No. 2 in Product Engineering & Technology Services, No.3 in BPO, and No. 5 in Applications. So our goal of a balanced portfolio and leadership within them has now taken definite shape. Each business is now on a profitable growth track with demonstrable beach head practices. We saw the future of these services early on and backed them solidly. Today their numbers are a testimony to the wisdom of our strategic choices. Product Engineering & Technology Services had been our core business when we began our 2001-02 portfolio rebalancing exercise. Today we do cutting edge work for global customers in domains such as Aerospace, Semiconductors, Consumer & Retail, BFS, Life Sciences, Telecom, etc. with our deep knowledge of practices in Technology, Applications, Infrastructure, and BPO. I do want to mention that our Applications business which was developed with both organic and inorganic means is today a creditable No.5 in 3 years time.
We have invested solidly in our physical infrastructure which now boasts of world class facilities and 3 campuses in the making, in Noida, Bangalore, and Chennai. We have 24,000 employees spread across 6 cities. Our HR practices not only focus on strengthening technical skills but are shaping leaders for the future.
HCL pursued a landmark strategy of inorganic growth over the last few years with huge payoffs. Over the early part of 2005 we bought out stakes of 6 subsidiaries that have been significant contributors to our growth. There are two stars of which we are particularly proud of; the first is HCL Capital Market Services (CMS), the erstwhile Deutsche Software Ltd (DSL), which today is a business in excess of $100million in revenues. The other is the British Telecom JV which not only gave us a global footprint but which led to the largest BPO order in Indian history, of $150 million. These transactions represent HCL’s landmark “carve out” strategy where we have literally “carved out” departments of large firms as cost centers and monetized it by way of a capital transaction delivering value for both partners. Such global transactions and value creation have few parallels within Indian firms.
We have now demonstrated over the last several quarters that we can grow all our business lines profitably. Both revenues and EBITDA have grown. Over the last 8 quarters our run rate is up by 90% and EBITDA is up 130%.
HCL Technologies has a robust balance sheet. Our net worth of $871 million, Cash of $457 million, and cash flow of $137 million, gives us a solidity not only to invest and aggressively grow our organic business but also to pursue inorganic growth.
We have avoided the distractions of the short term to keep a single minded focus on the long term, and ultimately in doing what is good for the overall business and our stakeholders.
With best regards,Shiv Nadar
Dear Friend,
BRAND HCL “Courage – Guts – Fearlessness”Beginning FY’05, HCL kicked off many initiatives as part of Project Heartbeat-its strategy to reinvent HCL as a
valuable global Technology and IT brand which has not missed a single heartbeat in the ever changing, dynamic IT
landscape.
HCL is India’s original IT start up founded by Shiv Nadar, Ajai Chowdhry, and a few other passionate entrepreneurs in
1976, 3 decades ago. It has grown to become a $2.5 billion enterprise by 30th June, 2005, pitch forking it into the
big league of Indian corporates. All this in an industry that a generation ago would never have been seen IT as an area
of Indian strength.
At a time when India was closed to the outside world it took HCL’s extraordinary vision to have not only taken the
bold courageous steps into the future but also to have ridden the IT wave. This is symbolized in a sense of
“fearlessness”, which has found expression in the “Courage – Guts – Fearlessness” campaign launched this year. As
HCL commenced its 30th year of business on 11th August, 2005 we wish to remind our stakeholdersthat within a
large, 3 decade old organization with many firsts, there exists all the virtues of youth, courage, guts, and fearlessness.
The genesis of this campaign is primarily a simple one – to inform and provoke HCL’s key stakeholders (customers,
employees, investors, and the Indian and international community) to recognize one of the iconic Indian brands that
symbolizes the spirit of a resurgent India.
Today, HCL is uniquely positioned in the IT space with offerings straddling software and BPO services as well as IT
hardware, system integration and distribution of technology and telecom products. The HCL enterprise operates
through two entities listed in India- HCL Technologies and HCL Infosystems. While HCL Technologies is the IT and
BPO service arm of HCL, HCL Infosystems is the IT hardware and system integration arm operating in the domestic
market.
Going forward the brand will be anchored in its core values of Leading, Inventing, and Re-inventing the Technology
and IT space. Ultimately HCL aspires to become one of India’s truly recognizable global brands.

COURAGE.
GUTS
FEARLESSNESS
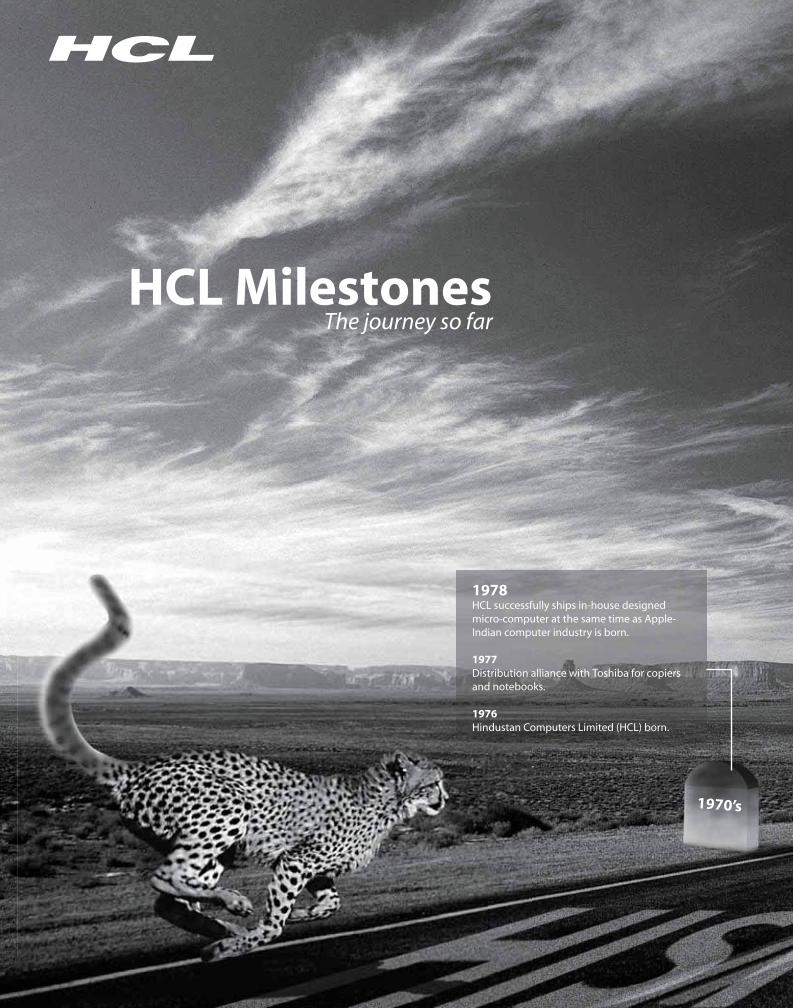
HCL Milestones
1978HCL successfully ships in-house designed micro-computer at the same time as Apple-Indian computer industry is born.
1977Distribution alliance with Toshiba for copiers and notebooks.
1976Hindustan Computers Limited (HCL) born.
1970’s
The journey so far
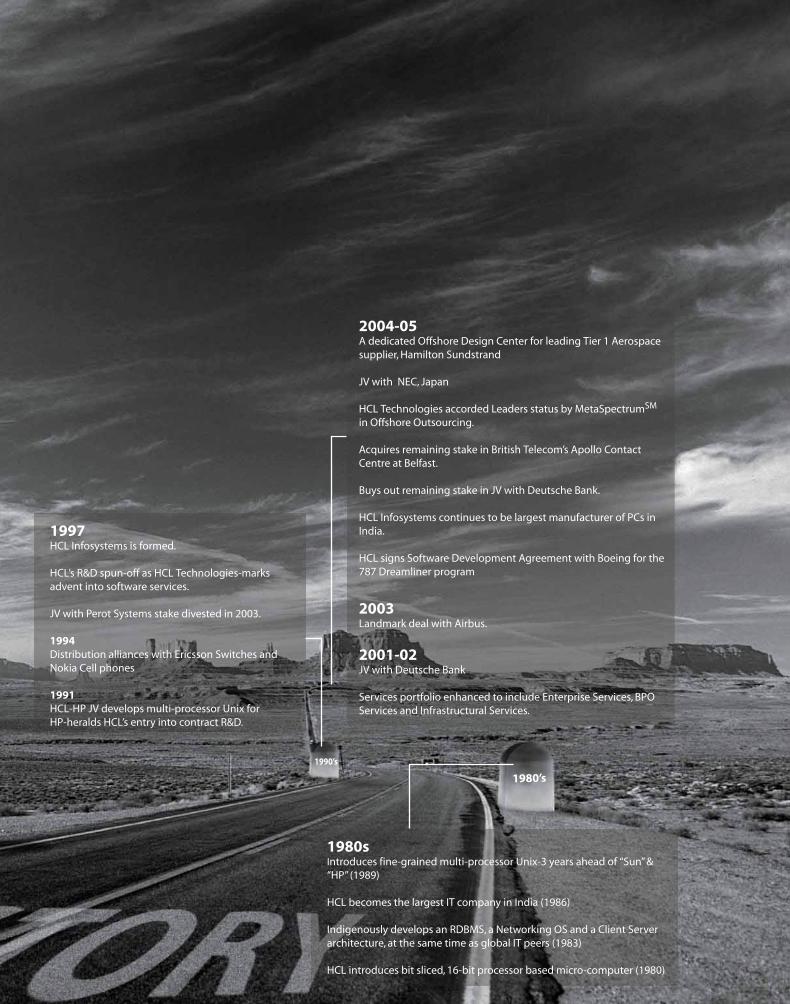
1980sIntroduces fine-grained multi-processor Unix-3 years ahead of “Sun” & “HP” (1989)
HCL becomes the largest IT company in India (1986)
Indigenously develops an RDBMS, a Networking OS and a Client Server architecture, at the same time as global IT peers (1983)
HCL introduces bit sliced, 16-bit processor based micro-computer (1980)
1997HCL Infosystems is formed.
HCL’s R&D spun-off as HCL Technologies-marks advent into software services.
JV with Perot Systems stake divested in 2003.
1994Distribution alliances with Ericsson Switches and Nokia Cell phones
1991HCL-HP JV develops multi-processor Unix for HP-heralds HCL’s entry into contract R&D.
2004-05A dedicated Offshore Design Center for leading Tier 1 Aerospace supplier, Hamilton Sundstrand
JV with NEC, Japan
HCL Technologies accorded Leaders status by MetaSpectrumSM in Offshore Outsourcing.
Acquires remaining stake in British Telecom’s Apollo Contact Centre at Belfast.
Buys out remaining stake in JV with Deutsche Bank.
HCL Infosystems continues to be largest manufacturer of PCs in India.
HCL signs Software Development Agreement with Boeing for the 787 Dreamliner program
2003Landmark deal with Airbus.
2001-02JV with Deutsche Bank
Services portfolio enhanced to include Enterprise Services, BPO Services and Infrastructural Services.
1980’s
1990’s
08 H C L T E C H N O L O G I E S L T D .
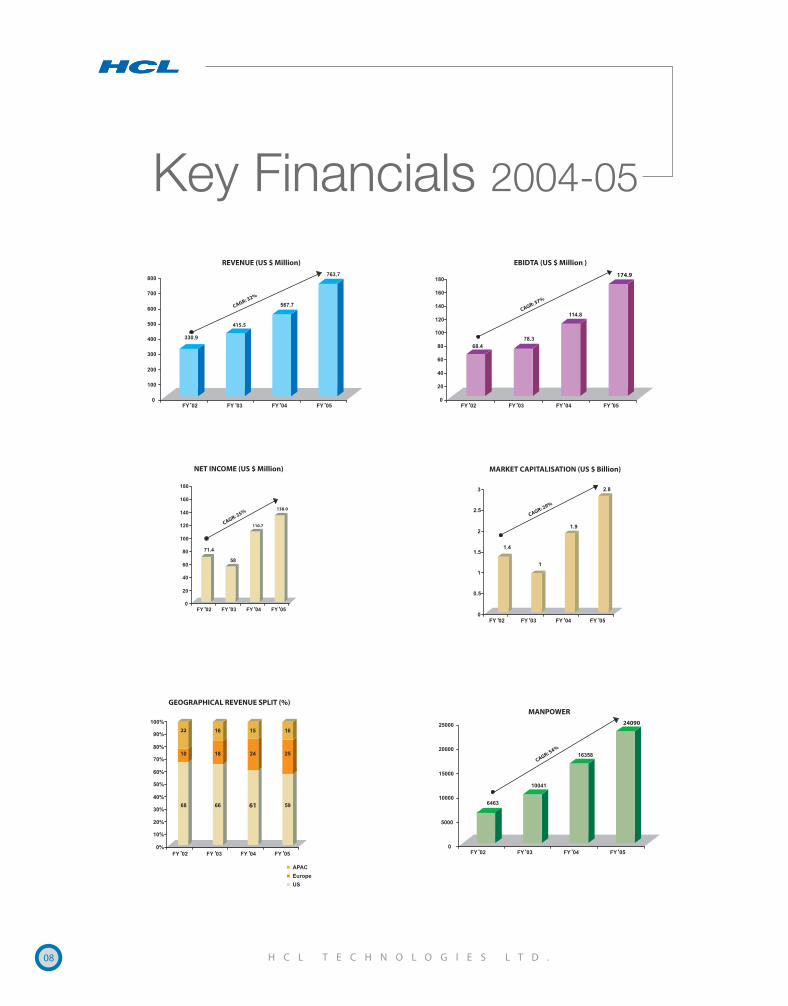
Key Financials 2004-05
CAGR: 37%
EBIDTA (US $ Million )
22
61
GEOGRAPHICAL REVENUE SPLIT (%)
CAGR: 25%
NET INCOME (US $ Million)
CAGR: 29%
MARKET CAPITALISATION (US $ Billion)
CAGR: 54%
MANPOWER
CAGR: 32%
415.5
REVENUE (US $ Million)
110.7
138.0
24090
174.9
09
SHIV NADARChief Executive Officer
RANJIT NARASIMHANExecutive Vice President President & CEO – BPO Division
R. VAIDYANATHANExecutive Vice PresidentExtended Organisation
AMITAVA ROYSenior Corporate Vice PresidentHead – Enterprise Consulting Services
ANIL KUMAR CHANANASenior Corporate Vice President - Finance
GUNASEELAN NARAYANANSenior Corporate Vice President Head - Technology Consulting Services
PREM K. ASIJASenior Corporate Vice PresidentExecutive Vice President - BPO Division
SHAMSHER KHORANASenior Corporate Vice President Head - America Business
V. RAMAKRISHNA Corporate Vice President Head - Capital Markets
ANANT GUPTACorporate Vice PresidentHead - Infrastructure Services Division
DANIEL J. MORRISCorporate Vice PresidentHead - Insurance Vertical
G H RAOCorporate Vice President
J VIJAYCorporate Vice President Head - ASEAN Business
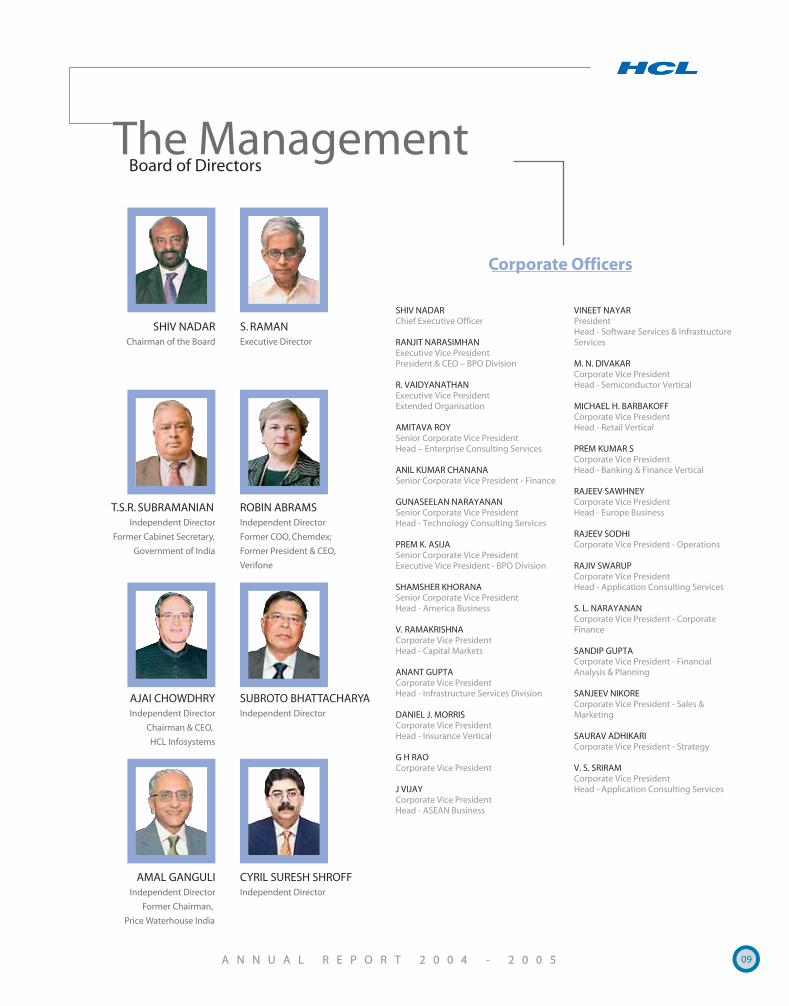
The ManagementBoard of Directors
SHIV NADARChairman of the Board
S. RAMANExecutive Director
AJAI CHOWDHRYIndependent Director
Chairman & CEO,
HCL Infosystems
ROBIN ABRAMSIndependent Director
Former COO, Chemdex;
Former President & CEO,
Verifone
CYRIL SURESH SHROFFIndependent Director
SUBROTO BHATTACHARYAIndependent Director
T.S.R. SUBRAMANIANIndependent Director
Former Cabinet Secretary,
Government of India
AMAL GANGULIIndependent Director
Former Chairman,
Price Waterhouse India
Corporate Officers
VINEET NAYARPresident Head - Software Services & Infrastructure Services
M. N. DIVAKAR Corporate Vice President Head - Semiconductor Vertical
MICHAEL H. BARBAKOFFCorporate Vice President Head - Retail Vertical
PREM KUMAR SCorporate Vice PresidentHead - Banking & Finance Vertical
RAJEEV SAWHNEYCorporate Vice PresidentHead - Europe Business
RAJEEV SODHICorporate Vice President - Operations
RAJIV SWARUPCorporate Vice PresidentHead - Application Consulting Services
S. L. NARAYANANCorporate Vice President - Corporate Finance
SANDIP GUPTACorporate Vice President - Financial Analysis & Planning
SANJEEV NIKORECorporate Vice President - Sales & Marketing
SAURAV ADHIKARICorporate Vice President - Strategy
V. S. SRIRAM Corporate Vice President Head - Application Consulting Services
10 H C L T E C H N O L O G I E S L T D .
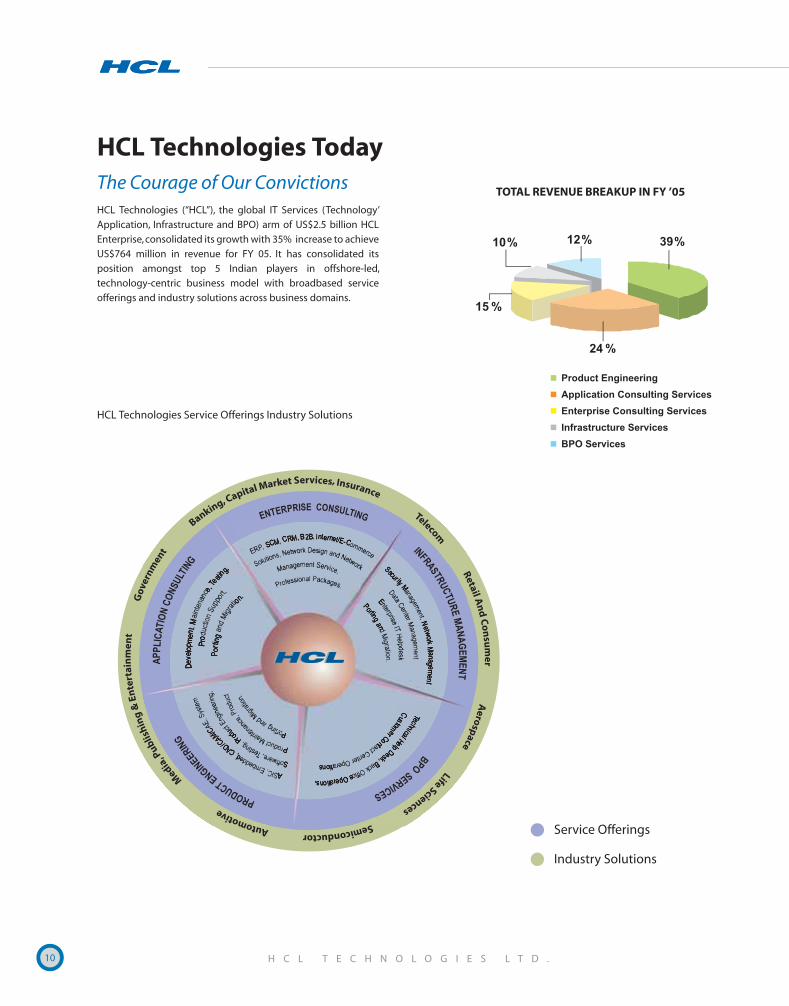
HCL Technologies Today
HCL Technologies (“HCL”), the global IT Services (Technology’
Application, Infrastructure and BPO) arm of US$2.5 billion HCL
Enterprise, consolidated its growth with 35% increase to achieve
US$764 million in revenue for FY 05. It has consolidated its
position amongst top 5 Indian players in offshore-led,
technology-centric business model with broadbased service
offerings and industry solutions across business domains.
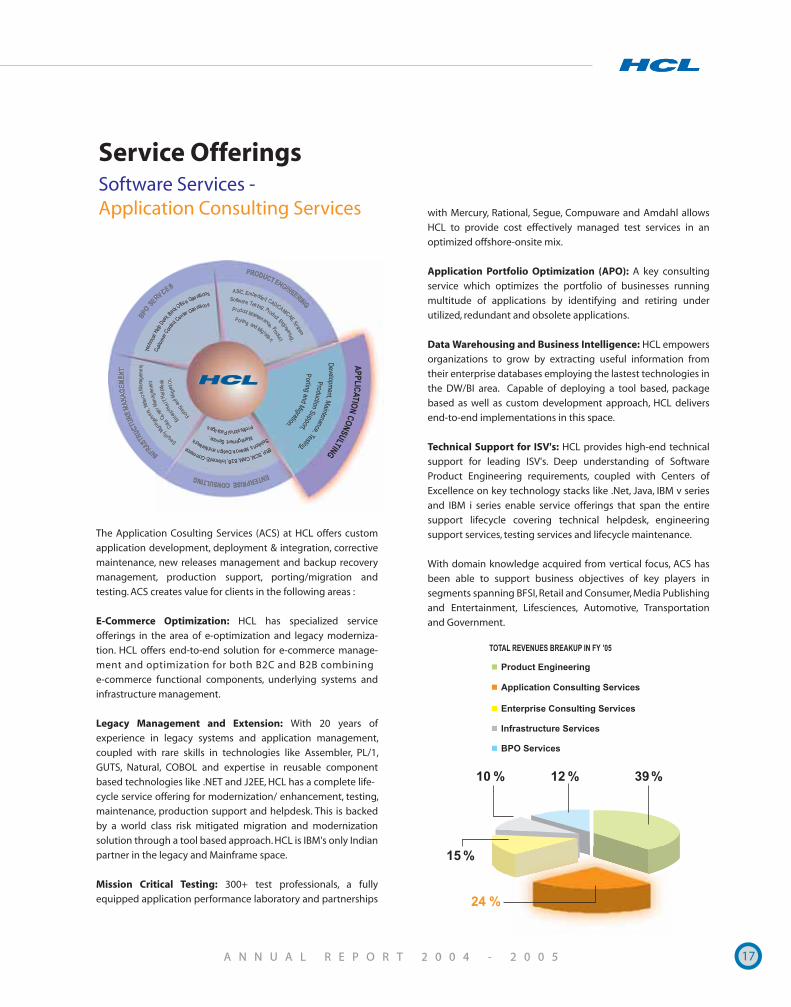
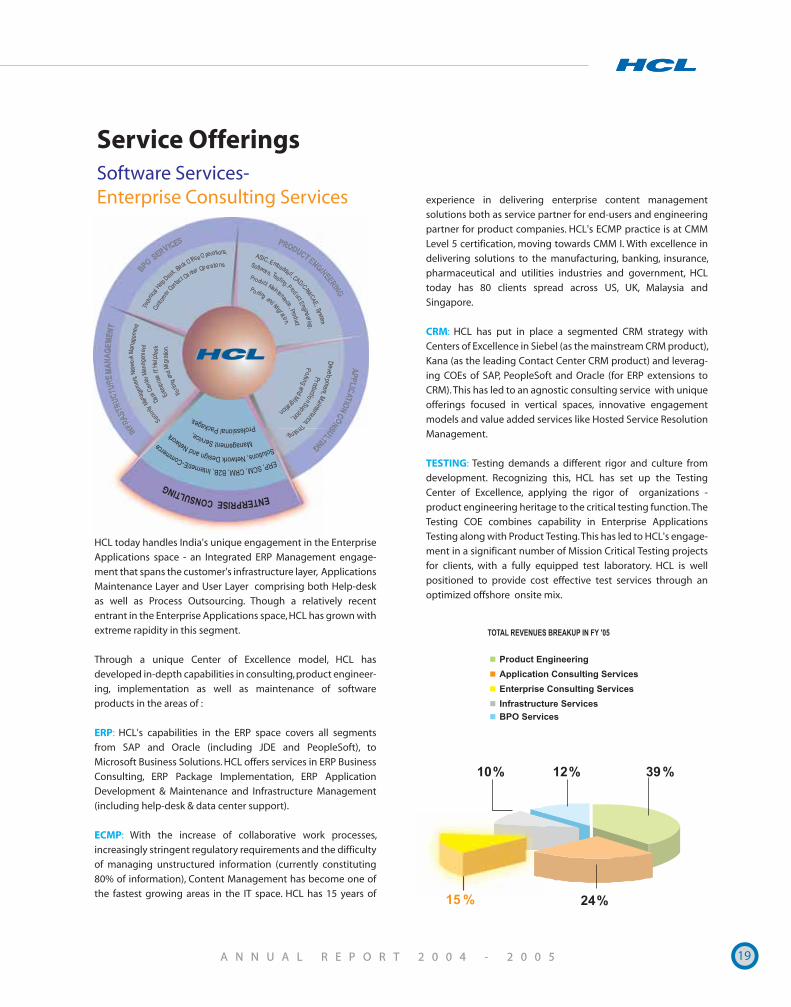
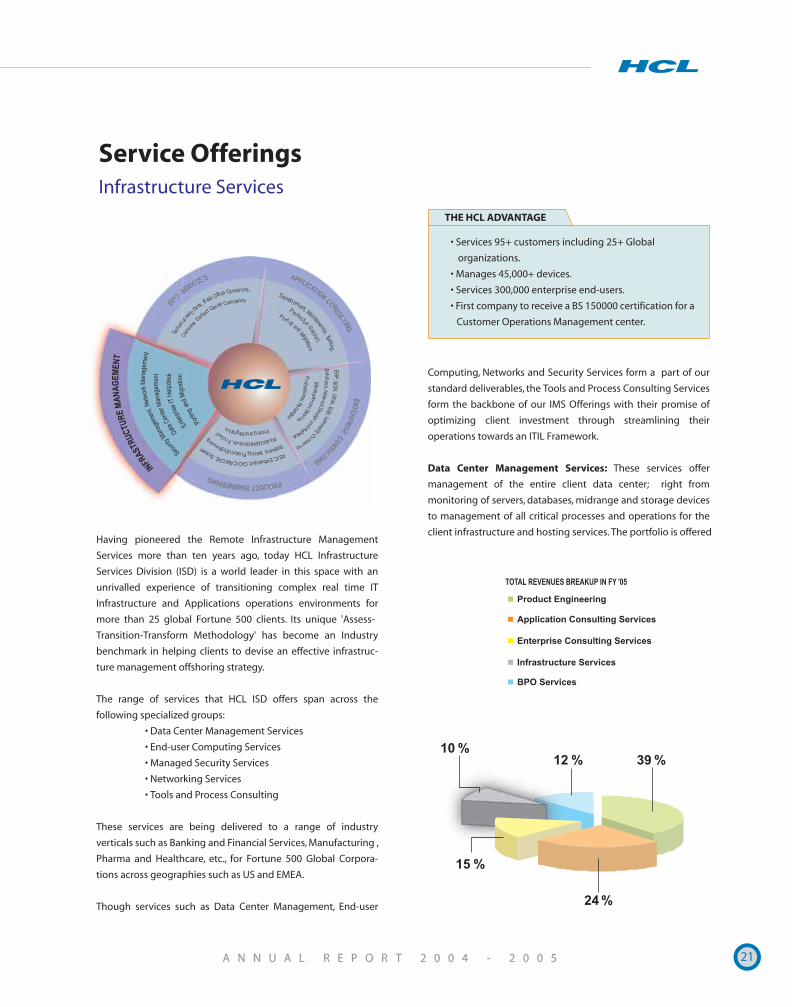
TOTAL REVENUE BREAKUP IN FY ’05
Service Offerings
Industry Solutions
HCL Technologies Service Offerings Industry Solutions
The Courage of Our Convictions
11
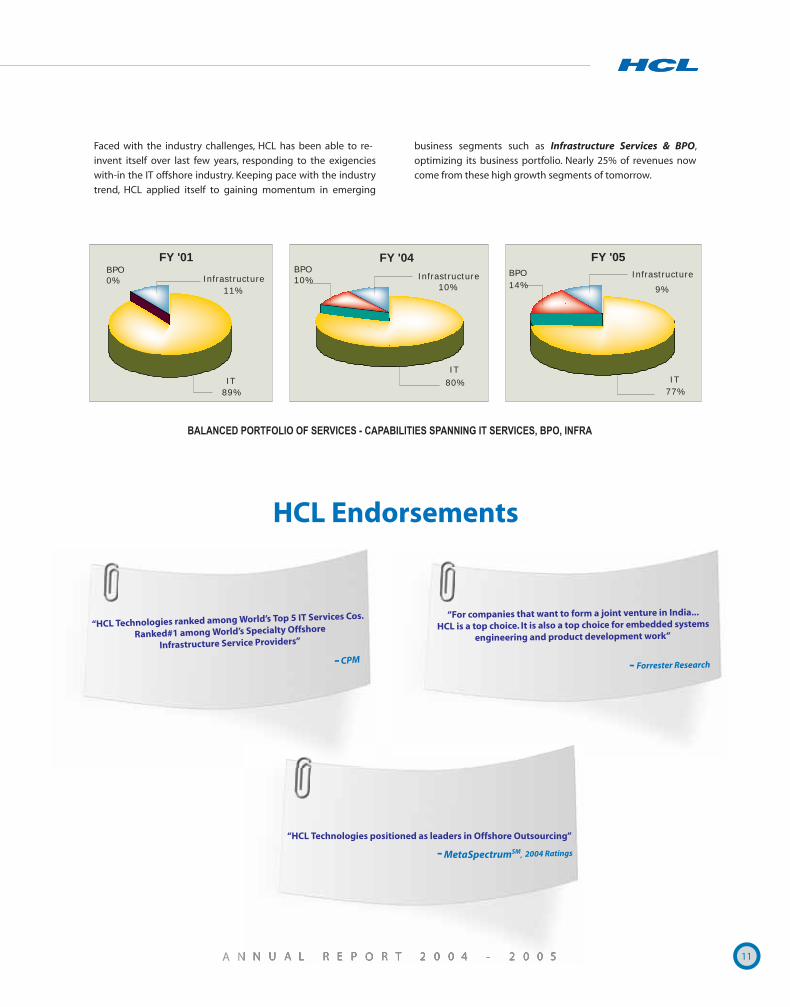
Faced with the industry challenges, HCL has been able to re-
invent itself over last few years, responding to the exigencies
with-in the IT offshore industry. Keeping pace with the industry
trend, HCL applied itself to gaining momentum in emerging
FY '05
IT 77%
Infrastructure
9%
BPO14%
FY '04
IT 80%
Infrastructure10%
BPO10%
FY '01
BPO0%
IT 89%
Infrastructure11%
business segments such as Infrastructure Services & BPO,
optimizing its business portfolio. Nearly 25% of revenues now
come from these high growth segments of tomorrow.
HCL Endorsements
“HCL Technologies positioned as leaders in Offshore Outsourcing”
“HCL Technologies ranked among World’s Top 5 IT Services Cos.
Ranked#1 among World’s Specialty Offshore
Infrastructure Service Providers”
“For companies that want to form a joint venture in India...
HCL is a top choice. It is also a top choice for embedded systems
engineering and product development work”
Forrester Research
MetaSpectrumSM,
HCL’s Capital Transaction Initiatives
HCL’s “Carve-out” strategy is unique as it creates two sources of
value to our partner. The first is the conventional outsourcing
savings, and the second, the value created at the time of exit
from the Joint Venture. In the process we create a vibrant
customer focused organization with deep domain skills. This is a
clear “Win-Win” proposition.
The HCL “Carve-out” strategy literally extracts the non-revenue
generating, non-core business processes and departments or by
converting specific process/department fixed costs into variable
costs of the company. It allows a company to outsource
complete process/departments without the normal cost bulge
from day one.
Two case studies :
(1) Deutsche Software Ltd (DSL): In September 2001, HCL
acquired a 51% stake in Deutsche Software Ltd. (DSL), Deutsche
Bank AG’s IT services subsidiary in India. Deutsche Software had
experience and an established track record of providing IT
services to Deutsche Bank’s internal customers. From 450
employees, at the time of formation of the partnership, this
entity has grown to around 3000 employees and registered a
400% growth in revenue.
In 2004-05, HCL successfully concluded the joint venture by
acquiring the balance 49% of the stake by issuing equity shares
and fully integrating the entity into HCL as a division – now
called HCL Capital Market Services (CMS) . HCL CMS deepened its
domain expertise and is now not only the Center of Excellence
that brings together expertise in areas of Operations, Technol-
ogy and Infrastructure to provide integrated, best-in class
services to the global financial services community, but this
“HCL’s unique and internationally recognized model creates enterprise value by monetizing partner “non core-non revenue generating” processes and departments by carving them out into a joint venture and providing a visible exit to all partners. This is over and above the conven-tional outsourcing revenue savings…”
12
landmark deal makes Deutsche Bank HCL’s second largest
shareholder. This is a clear “Win-Win” for both partners.
(2) British Telecom Contact Center: HCL entered into a
strategic alliance with British Telecom (BT) in October 2001, to
provide contact centre services through BT’s 400 seat Apollo
Contact Center at Belfast, Northern Ireland (UK). HCL acquired a
90% equity stake in Apollo Contact Centre with British Telecom
holding the remaining 10%.
The landmark transaction was the first by an Indian IT company
in establishing an overseas BPO business. This was an early move
in integrating HCL’s global delivery capabilities. This Belfast
based JV grew from 350 to 1600 employees and recorded a
revenue growth of 200% over the 2001 to 2005 period. HCL
became in the process the largest Indian employer in Northern
Ireland (UK), recognized by the Northern Ireland government as
well as by Tony Blair, Prime Minister of UK.
The deal consolidated HCL’s relationship with BT leading to the
largest BPO deal ever in the history of the Indian industry – a
record $160 million over 5 years, establishing HCL among the
leaders in the BPO space.
A successful conclusion of this JV was achieved in 2004-05
through an acquisition of the remaining 10% stake, once again,
demonstrating HCL’s ability to create value from carve-outs.
HCL concluded out five JVs in 2004-05 by buying out the stakes
of its partners and in the process acquired domain expertise,
lowered costs for the partners and their customers, and created
significant enterprise value for all stakeholders.
Creating Enterprise Value Through Carve-outs
“For companies that want to form a join venture in India…...HCL is a top choice.”
Forrester-April 7, 2004
H C L T E C H N O L O G I E S L T D .
13
HCL’s Service Offerings
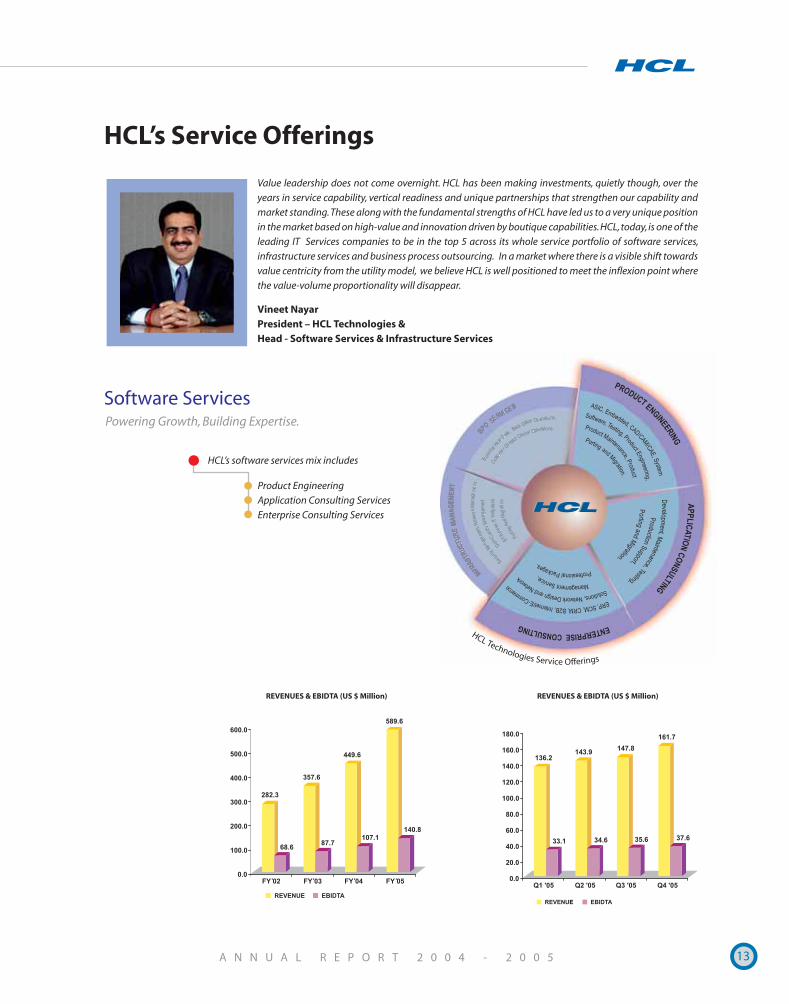
Value leadership does not come overnight. HCL has been making investments, quietly though, over the
years in service capability, vertical readiness and unique partnerships that strengthen our capability and
market standing. These along with the fundamental strengths of HCL have led us to a very unique position
in the market based on high-value and innovation driven by boutique capabilities. HCL, today, is one of the
leading IT Services companies to be in the top 5 across its whole service portfolio of software services,
infrastructure services and business process outsourcing. In a market where there is a visible shift towards
value centricity from the utility model, we believe HCL is well positioned to meet the inflexion point where
the value-volume proportionality will disappear.
Vineet NayarPresident – HCL Technologies &Head - Software Services & Infrastructure Services
Software ServicesPowering Growth, Building Expertise.
REVENUES & EBIDTA (US $ Million) REVENUES & EBIDTA (US $ Million)
HCL Technologies Service Offerings
HCL’s software services mix includes
Product Engineering
Application Consulting Services
Enterprise Consulting Services
14
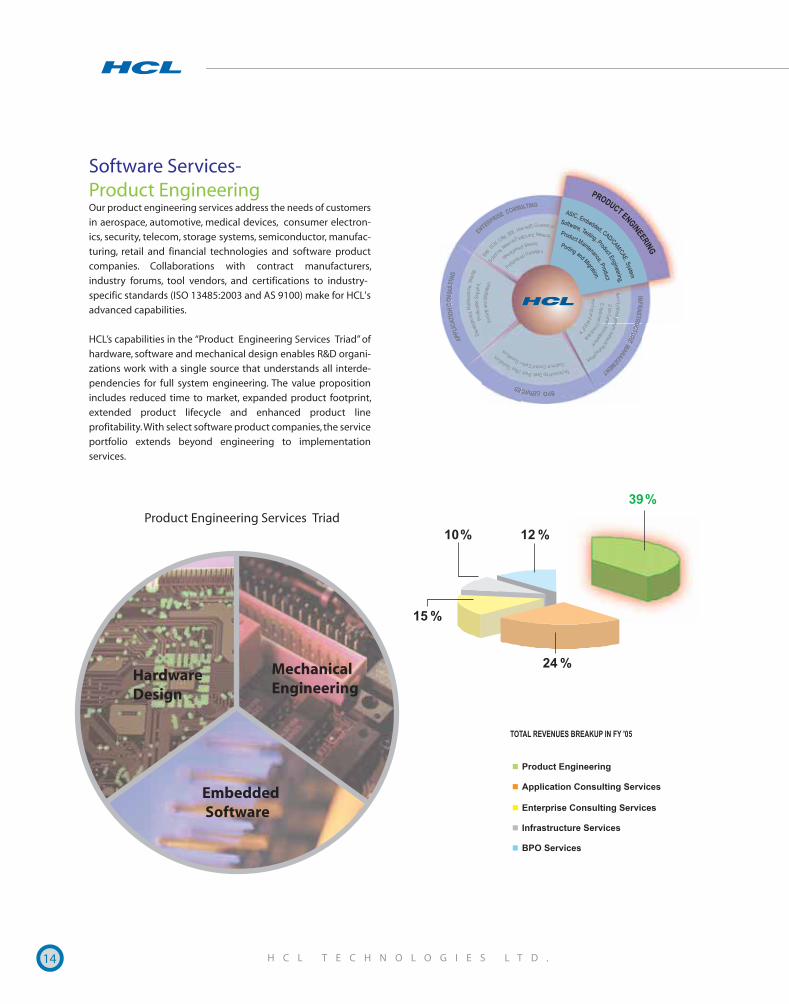
Software Services-Product Engineering Our product engineering services address the needs of customers
in aerospace, automotive, medical devices, consumer electron-
ics, security, telecom, storage systems, semiconductor, manufac-
turing, retail and financial technologies and software product
companies. Collaborations with contract manufacturers,
industry forums, tool vendors, and certifications to industry-
specific standards (ISO 13485:2003 and AS 9100) make for HCL's
advanced capabilities.
HCL’s capabilities in the “Product Engineering Services Triad” of
hardware, software and mechanical design enables R&D organi-
zations work with a single source that understands all interde-
pendencies for full system engineering. The value proposition
includes reduced time to market, expanded product footprint,
extended product lifecycle and enhanced product line
profitability. With select software product companies, the service
portfolio extends beyond engineering to implementation
services.
Hardware Design
Mechanical Engineering
Embedded Software
Product Engineering Services Triad

16 H C L T E C H N O L O G I E S L T D .
HCL is working with the world's largest manufacturer
of micro processors for PC and server applications.
The project is for CD integration and validation. This
CD is shipped along with the client's motherboards.
HCL is associated with a leading provider of efficient
storage utilization through integrated discovery,
visualization, reporting, and management of storage
resources. HCL is managing their high-end devices in
storage area networks.
A leading provider of high speed broadband
communications semiconductors and MIPS-based
processors, has entrusted HCL with the task to
develop a Voice-over Internet Protocol (VoIP) Analog
Terminal Adapter (ATA). The ATA is to provide a
gateway to connect the existing home network to
the Wide Area Network (WAN).
A leading semiconductor foundry that provides
advanced foundry standards, CMOS logic, high
voltage & mixed signal, RF technologies has engaged
HCL in Computer Integrated Manufacturing, MES
shop floor upgradation.
A major airborne electronics systems company and
HCL are jointly developing a portable in-flight
entertainment system targeted at passengers
demanding powerful entertainment stations at their
seats.
A global provider of mobile multi-media devices has
commissioned to work on their next generation 3G
mobile phone. The client has chosen HCL as the “Best
Outsourcing Partner” from a list of 31 Indian &
Japanese vendors.
A global provider of enterprise & small business
communications solutions has commissioned HCL to
develop an Enterprise Management System to bring
centralized management, administration provision-
ing and operations capabilities.
KEY ENGAGEMENTS
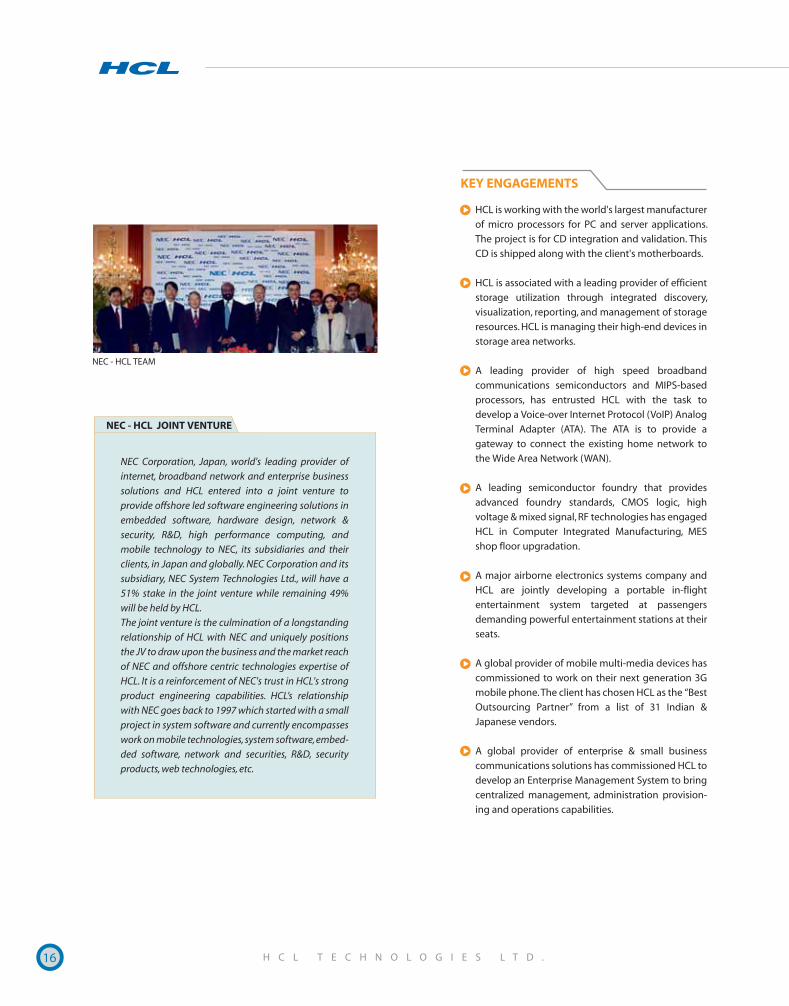
NEC Corporation, Japan, world's leading provider of
internet, broadband network and enterprise business
solutions and HCL entered into a joint venture to
provide offshore led software engineering solutions in
embedded software, hardware design, network &
security, R&D, high performance computing, and
mobile technology to NEC, its subsidiaries and their
clients, in Japan and globally. NEC Corporation and its
subsidiary, NEC System Technologies Ltd., will have a
51% stake in the joint venture while remaining 49%
will be held by HCL.
The joint venture is the culmination of a longstanding
relationship of HCL with NEC and uniquely positions
the JV to draw upon the business and the market reach
of NEC and offshore centric technologies expertise of
HCL. It is a reinforcement of NEC's trust in HCL's strong
product engineering capabilities. HCL’s relationship
with NEC goes back to 1997 which started with a small
project in system software and currently encompasses
work on mobile technologies, system software, embed-
ded software, network and securities, R&D, security
products, web technologies, etc.
NEC - HCL JOINT VENTURE
NEC - HCL TEAM
17
Service Offerings
The Application Cosulting Services (ACS) at HCL offers custom
application development, deployment & integration, corrective
maintenance, new releases management and backup recovery
management, production support, porting/migration and
testing. ACS creates value for clients in the following areas :
E-Commerce Optimization: HCL has specialized service
offerings in the area of e-optimization and legacy moderniza-
tion. HCL offers end-to-end solution for e-commerce manage-
ment and optimization for both B2C and B2B combining
e-commerce functional components, underlying systems and
infrastructure management.
Legacy Management and Extension: With 20 years of
experience in legacy systems and application management,
coupled with rare skills in technologies like Assembler, PL/1,
GUTS, Natural, COBOL and expertise in reusable component
based technologies like .NET and J2EE, HCL has a complete life-
cycle service offering for modernization/ enhancement, testing,
maintenance, production support and helpdesk. This is backed
by a world class risk mitigated migration and modernization
solution through a tool based approach. HCL is IBM's only Indian
partner in the legacy and Mainframe space.
Mission Critical Testing: 300+ test professionals, a fully
equipped application performance laboratory and partnerships
with Mercury, Rational, Segue, Compuware and Amdahl allows
HCL to provide cost effectively managed test services in an
optimized offshore-onsite mix.
Application Portfolio Optimization (APO): A key consulting
service which optimizes the portfolio of businesses running
multitude of applications by identifying and retiring under
utilized, redundant and obsolete applications.
Data Warehousing and Business Intelligence: HCL empowers
organizations to grow by extracting useful information from
their enterprise databases employing the lastest technologies in
the DW/BI area. Capable of deploying a tool based, package
based as well as custom development approach, HCL delivers
end-to-end implementations in this space.
Technical Support for ISV's: HCL provides high-end technical
support for leading ISV's. Deep understanding of Software
Product Engineering requirements, coupled with Centers of
Excellence on key technology stacks like .Net, Java, IBM v series
and IBM i series enable service offerings that span the entire
support lifecycle covering technical helpdesk, engineering
support services, testing services and lifecycle maintenance.
With domain knowledge acquired from vertical focus, ACS has
been able to support business objectives of key players in
segments spanning BFSI, Retail and Consumer, Media Publishing
and Entertainment, Lifesciences, Automotive, Transportation
and Government.
Software Services - Application Consulting Services
18
HCL has been engaged by a leading IT solutions provider in the
international banking, healthcare and financial services markets
for the outsourcing of the development and maintenance of
their flagship Commercial Lending product, on loan origination
and tracking.
With the objective of reducing their operating costs & providing
value added services to their end customers, a leading exchange
operator and technology solution provider for exchanges in
Europe chose to partner with HCL. HCL worked on customiza-
tion of two major products depending upon the needs of
existing customers as well as new installations across the globe.
A leading bank in SE Asia, as a part of their strategy for 2004-
2005,is setting up a call center in Malaysia. HCL has been
assigned the task of managing the vendors and the project on
behalf of the client, provide technical consultancy, test the
deliverables and roll out the application.
For a leading re-insurer in US, HCL developed and successfully
implemented a Rating Work Bench Application. The workbench
is in its third version and the fourth version is currently being
developed. HCL also developed a Web-enabled Underwriting
application which is used for analyzing client data at the time of
policy renewal or in case of a new prospect. A Portfolio
Underwriting Review System was also developed using three-
tier client server architecture.
HCL implemented this web-based workflow system for Public
Utility Commission of a State in USA. The system integrates
automated process management, imaging and content
management through a central electronic repository for
handling complaints, enquiries, tariff rate case filings, staff
reports, Commission agendas and orders. This system has
received various awards and appreciation from FileNet and
Client.
HCL developed a statewide N-tier web-based system to provide
several thousand users, concurrent access to WIA-related
applications and support job related services provided to the
citizens by four State agencies. The system integrated with other
program areas providing needed services such as job services,
unemployment insurance, DHS' Support Services, and other job
training services.
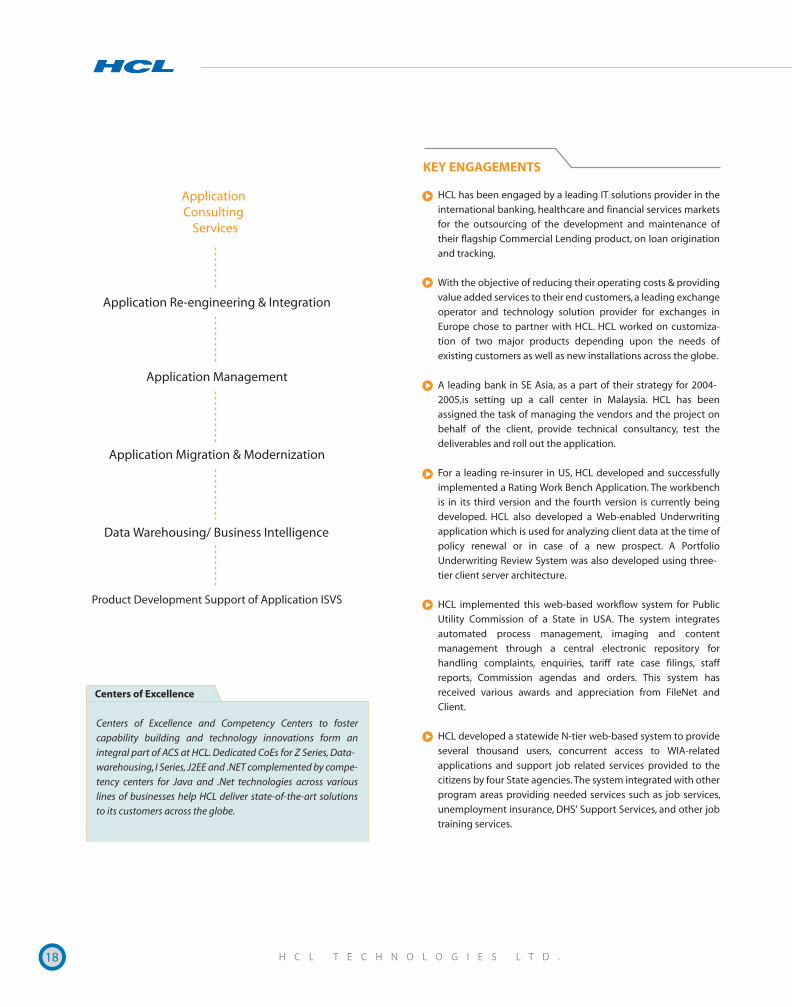
Application Consulting
Services
Application Re-engineering & Integration
Application Management
Application Migration & Modernization
Data Warehousing/ Business Intelligence
Product Development Support of Application ISVS
Centers of Excellence
Centers of Excellence and Competency Centers to foster
capability building and technology innovations form an
integral part of ACS at HCL. Dedicated CoEs for Z Series, Data-
warehousing. I Series, J2EE and .NET complemented by compe-
tency centers for Java and .Net technologies across various
lines of businesses help HCL deliver state-of-the-art solutions
to its customers across the globe.
,
KEY ENGAGEMENTS
19
Service Offerings
HCL today handles India's unique engagement in the Enterprise
Applications space - an Integrated ERP Management engage-
ment that spans the customer's infrastructure layer, Applications
Maintenance Layer and User Layer comprising both Help-desk
as well as Process Outsourcing. Though a relatively recent
entrant in the Enterprise Applications space, HCL has grown with
extreme rapidity in this segment.
Through a unique Center of Excellence model, HCL has
developed in-depth capabilities in consulting, product engineer-
ing, implementation as well as maintenance of software
products in the areas of :
ERP: HCL's capabilities in the ERP space covers all segments
from SAP and Oracle (including JDE and PeopleSoft), to
Microsoft Business Solutions. HCL offers services in ERP Business
Consulting, ERP Package Implementation, ERP Application
Development & Maintenance and Infrastructure Management
(including help-desk & data center support).
ECMP: With the increase of collaborative work processes,
increasingly stringent regulatory requirements and the difficulty
of managing unstructured information (currently constituting
80% of information), Content Management has become one of
the fastest growing areas in the IT space. HCL has 15 years of
experience in delivering enterprise content management
solutions both as service partner for end-users and engineering
partner for product companies. HCL's ECMP practice is at CMM
Level 5 certification, moving towards CMM I. With excellence in
delivering solutions to the manufacturing, banking, insurance,
pharmaceutical and utilities industries and government, HCL
today has 80 clients spread across US, UK, Malaysia and
Singapore.
CRM: HCL has put in place a segmented CRM strategy with
Centers of Excellence in Siebel (as the mainstream CRM product),
Kana (as the leading Contact Center CRM product) and leverag-
ing COEs of SAP, PeopleSoft and Oracle (for ERP extensions to
CRM). This has led to an agnostic consulting service with unique
offerings focused in vertical spaces, innovative engagement
models and value added services like Hosted Service Resolution
Management.
TESTING: Testing demands a different rigor and culture from
development. Recognizing this, HCL has set up the Testing
Center of Excellence, applying the rigor of organizations -
product engineering heritage to the critical testing function. The
Testing COE combines capability in Enterprise Applications
Testing along with Product Testing. This has led to HCL's engage-
ment in a significant number of Mission Critical Testing projects
for clients, with a fully equipped test laboratory. HCL is well
positioned to provide cost effective test services through an
optimized offshore onsite mix.
Software Services- Enterprise Consulting Services
20
WebMethods
• HCL has been recognized as a significant offshore player in
the SAP implementation and maintenance through the
outstanding partner award 2004 presented by SAP in March
2005. We have a proven track record of 100+ Go Lives over 8
years of expertise in SAP.
• HCL was awarded the Best CRM Implementation Award
2004 for Bank Islam in Malaysia. The Award for Outstanding
Contribution to Oracle Projects was presented to us by
North American Manufacturing Competency Center.
• HCL is the only Indian IT company to provide upgrade
service for customers to move to Siebel 7.8.
Awards & Achievements
For one of the largest banks in the world, HCL has implemented
a Siebel system that has been benchmarked as being one of the
best across the industry on an exhaustive set of chosen param-
eters.
For a global leader in Embedded Software & Services, HCL has
followed up a successful implementation with high quality
monitoring for diverse modules in manufacturing, financials and
CRM.
For a leading Water Services company based in UK, HCL has
implemented the SAP IS Utilities Solution and SAP Asset Life
Cycle Management (ALM).
For a multinational German based bank, HCL provides mainte-
nance, enhancements and fresh developments for a diverse
system portfolio, thus helping it produce consolidated, timely
and accurate financial statements & reports.
For a global provider of IT products and Services, HCL is harmo-
nizing systems across 13 countries under one global template by
migrating them to SAP R/3. This is one of the largest on going
SAP implementations worldwide.
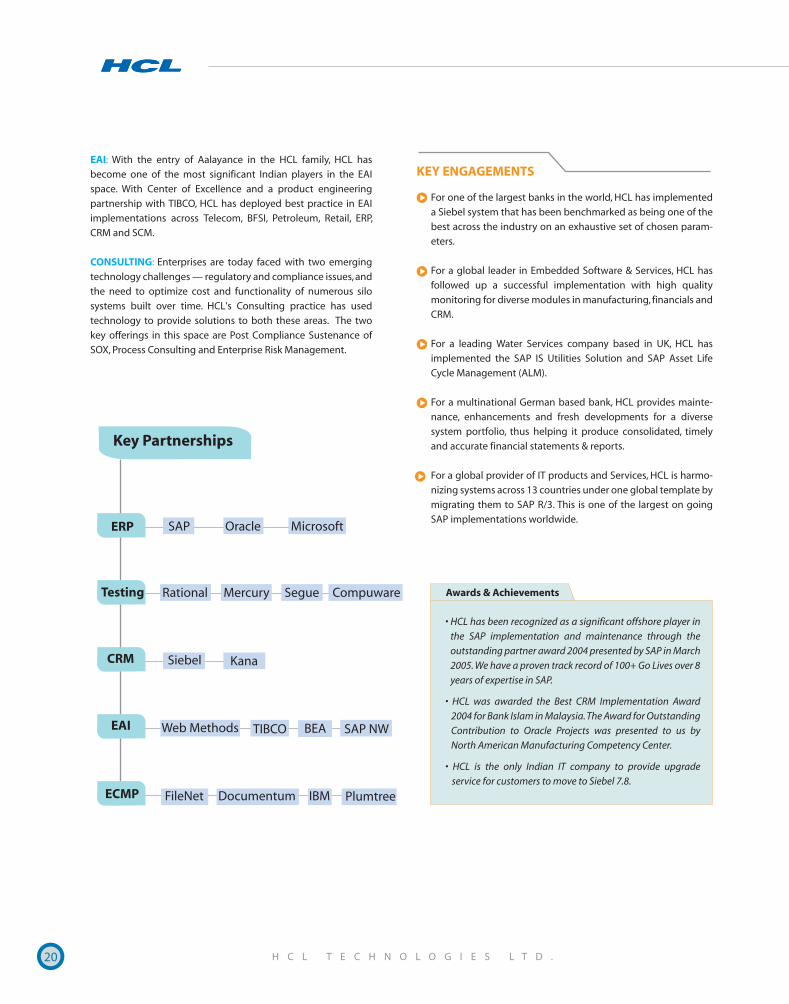
Key Partnerships
SAP
Rational
CRM
ECMP
EAI: With the entry of Aalayance in the HCL family, HCL has
become one of the most significant Indian players in the EAI
space. With Center of Excellence and a product engineering
partnership with TIBCO, HCL has deployed best practice in EAI
implementations across Telecom, BFSI, Petroleum, Retail, ERP,
CRM and SCM.
CONSULTING: Enterprises are today faced with two emerging
technology challenges — regulatory and compliance issues, and
the need to optimize cost and functionality of numerous silo
systems built over time. HCL's Consulting practice has used
technology to provide solutions to both these areas. The two
key offerings in this space are Post Compliance Sustenance of
SOX, Process Consulting and Enterprise Risk Management.
ERP Oracle Microsoft
Testing
Siebel
EAI
FileNet
Mercury Segue Compuware
Kana
TIBCO SAP NWBEA
Documentum IBM Plumtree
Web Methods
KEY ENGAGEMENTS
21
Service Offerings
Having pioneered the Remote Infrastructure Management
Services more than ten years ago, today HCL Infrastructure
Services Division (ISD) is a world leader in this space with an
unrivalled experience of transitioning complex real time IT
Infrastructure and Applications operations environments for
more than 25 global Fortune 500 clients. Its unique 'Assess-
Transition-Transform Methodology' has become an Industry
benchmark in helping clients to devise an effective infrastruc-
ture management offshoring strategy.
The range of services that HCL ISD offers span across the
following specialized groups:
• Data Center Management Services
• End-user Computing Services
• Managed Security Services
• Networking Services
• Tools and Process Consulting
These services are being delivered to a range of industry
verticals such as Banking and Financial Services, Manufacturing ,
Pharma and Healthcare, etc., for Fortune 500 Global Corpora-
tions across geographies such as US and EMEA.
Though services such as Data Center Management, End-user
Computing, Networks and Security Services form a part of our
standard deliverables, the Tools and Process Consulting Services
form the backbone of our IMS Offerings with their promise of
optimizing client investment through streamlining their
operations towards an ITIL Framework.
Data Center Management Services: These services offer
management of the entire client data center; right from
monitoring of servers, databases, midrange and storage devices
to management of all critical processes and operations for the
client infrastructure and hosting services. The portfolio is offered
Infrastructure Services
THE HCL ADVANTAGE
• Services 95+ customers including 25+ Global
organizations.
• Manages 45,000+ devices.
• Services 300,000 enterprise end-users.
• First company to receive a BS 150000 certification for a
Customer Operations Management center.
22
to customers based on their unique needs, varying from Produc-
tion Support to Data Center Operations and Level 2, Level 3
Support plus there is also tie-up with third party vendors for
hosting the client data centers. These services leverage the
expertise of best of breed service providers and in-house
capabilities to deliver best-in-class services to its client which
guarantee strategic and financial benefits.
End-user Computing Services: This family of services includes
management of workstation hardware and software compo-
nents for daily organizational use and provides technical
support and maintenance for end users. The service offering
includes:
·Enterprise Help-desk Services: HCL provides customer
support services on a global basis for clients in North
America, South America, Europe, Asia/Pacific and Austra-
lia. Our approach in delivering help-desk services focuses
on analytical modeling and delivering services for optimal
client satisfaction.
·Centralized Remote Desktop Management Services:
Encompass services like Asset Management, Desktop
Security Management, Desktop Configuration Manage-
ment, Mobile Device Management and Remote Trouble-
shooting. Our COE approach for device management
gives customers complete control over their end-user
devices and provides benefits such as reduced cost and
enhanced security and compliance.
Managed Security Services: HCL offers end-to-end security
solutions right from defining Information Security strategy,
developing security frameworks, security policy formulation,
perimeter security solutions, content security solutions and
professional services including developing IT Security
frameworks for regulatory compliance (SOX, HIPAA, etc.), security
audits based on BS7799 standards and consulting services. The
portfolio also includes 24/7 monitoring and management of
security solutions deployed, visibility and advance reporting,
advanced event co-relation to enable real time incident
detection, event alerting and improved incidence response time.
Experts Services have also been added to specifically offer
remote anti-virus management services to clients in alliance
with a leading anti-virus solution provider.
These services are rendered from BS7799 certified security
operations center, which also has the distinction of being
amongst the few BS15000 compliant security services delivery
centers across the world.
Network Services: A decade of experience and market leader-
ship in the managed networks domain has helped HCL
understand the paradigm shift from uptime aware to response
time aware networks. HCL's managed network services offer
leading networking solutions that help improve the application
response time without any increase in the bandwidth. The core
of these services lie in unique tools “SmartManage” and “My
Dashboard”, which assist network administrators in preventing
disruptions and bottlenecks from impeding connectivity while
enabling them to maximize value from their networks. The
services offered include QoS Engineering and Effectiveness
Service, Application Response Time Assurance, Data, Voice and
Video Management Services, etc.
Tools & Process Consulting: Leveraging HCL's experience in
infrastructure management delivered through world class
processes and best-of-breed tools, this service addresses two
key components of IT Infrastructure management - Process
Methodology and Management Tools. The expertise built
around various technology domains for databases, operating
systems, messaging systems and a business applications is
shared through propositions like:
•Tool Implementation (Architecture & Design,
Deployment & Configuration)
• Tool Re-engineering (Mapping Best Practices,
Customizations, Optimization, Consolidation)
• Tool Integration
•Tool Administration and Maintenance (Threshold
Setting, Performance Tuning)
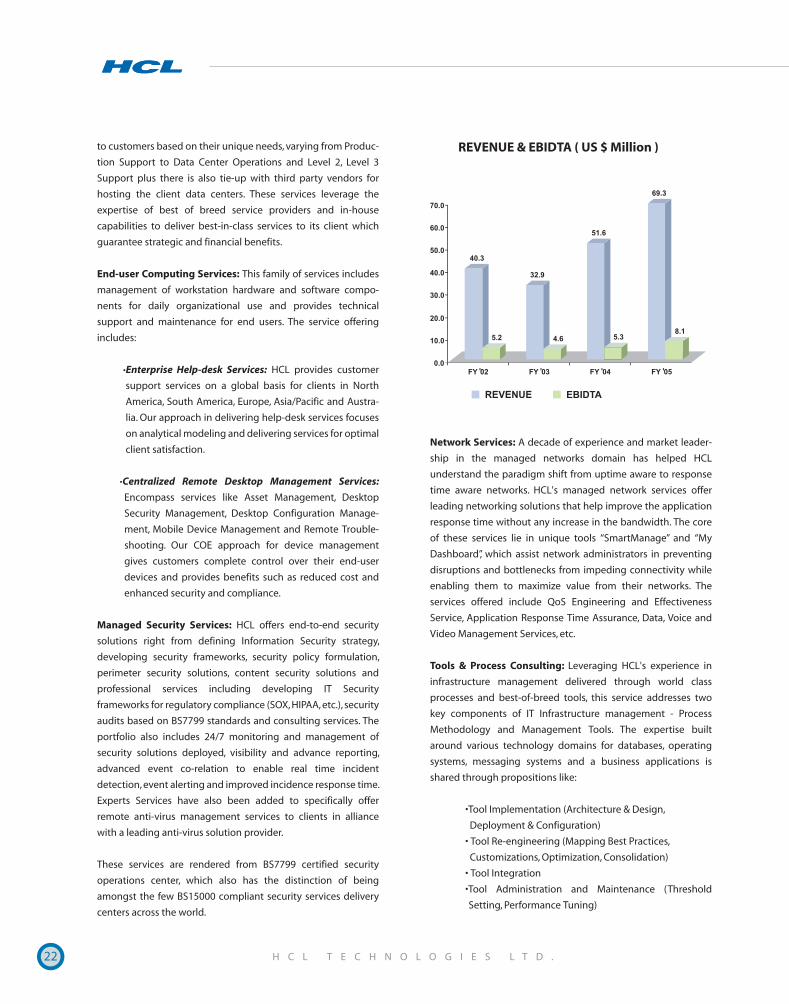
REVENUE & EBIDTA ( US $ Million )
23
Rated No. 1 “Infrastructure Management Service Provider” by CMP (world´s leading IT publication group).
Frost & Sullivan, the leading UK research firm rates HCL ISD as the No. 1 “Managed Security Services Provider”.
IDC-Dataquest Survey: In their January 2005 audit of customer satisfaction, IDC & Dataquest ranked HCL’s Infrastructure Services Division as the No.1 Service
On the processes side HCL ISD deliver y operations are
ISO 9000:2001 certified and based on best practices as defined
by IT Infrastructure Library (ITIL). To ensure the highest safety
standards for information security, we have undergone BS7799
certification. The division periodically provides process consul-
tancy to clients and has already obtained BS15000 certification
for a Fortune 500 client.
Provider on different parameters of customer satisfac-tion. This survey involved not only Indian companies but also all other MNC's in infrastructure management space that are operating through India. Ranked for the second year consecutively as the No. 1 Network Services (VSAT) Provider, Network Management Service Provider and Security Services Provider in India by Voice & Data 100 Survey.
Ranked No. 3 in the Network Integrators rankings in India with highest services revenue amongst the top 3 NIs in the country by Voice&Data 100 Survey.
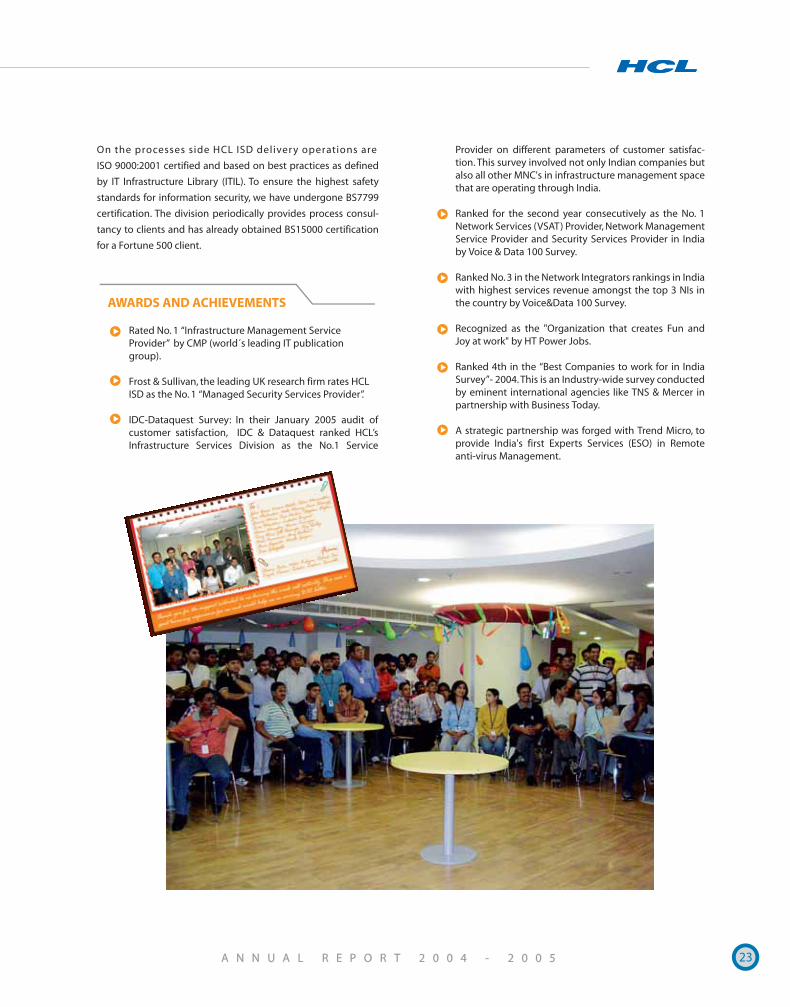
Recognized as the "Organization that creates Fun and Joy at work" by HT Power Jobs.
Ranked 4th in the “Best Companies to work for in India Survey”- 2004. This is an Industry-wide survey conducted by eminent international agencies like TNS & Mercer in partnership with Business Today.
A strategic partnership was forged with Trend Micro, to provide India's first Experts Services (ESO) in Remote anti-virus Management.
AWARDS AND ACHIEVEMENTS
24
Service Offerings
HCL’s BPO division represents one of our most significant
strategic business extensions and investments to date. The focus
and commitment to BPO is based around HCL's global client
base and relationships, related technology domain expertise
(such as CRM/ ERP/ SCM/ Imaging/ Workflow) and relevant
industry practices (such as Financial Services, Retail and
Telecom).
In only its third full year of operations, HCL's BPO division has
breached the $100 million revenue barrier to enter the select
Top 3 of India's third party BPO service providers a rise of nine
positions from the previous year.
HCL pursued its global offshore - nearshore strategy for its BPO
Services to provide seamless delivery to the client. In Northern
Ireland (UK). HCL acquired the balance 10% stake from BT in the
Apollo Contact Centre where it had invested in 90% sharehold-
ing in 2001, now making it a wholly-owned subsidiary of the
company. Thus, HCL has emerged as an example of reverse
investment into the UK from India creating significant employ-
ment opportunities. Both the operational units of HCL BPO India
and Northern Ireland (UK) contributed almost in equal measure
to the top line, achieving profitability levels that were
significantly superior to relevant geographic industry norms. The
sustained rate of growth in Northern Ireland (UK) necessitated
acquisition of a second delivery center located at Armagh in
December 2004.
BPO Services
“This year has been especially fruitful for us with revenues almost doubling from $56 million to over a $100
million and our headcount increasing from 4300 to close to 7000.
Our accomplishments in 2004 -05 have validated our belief in ourselves and has set the foundation for a
profitably sustainable business. We now plan to surge ahead with a concerted stress on acquiring new
business and targeting new regions and avenues for growth.”
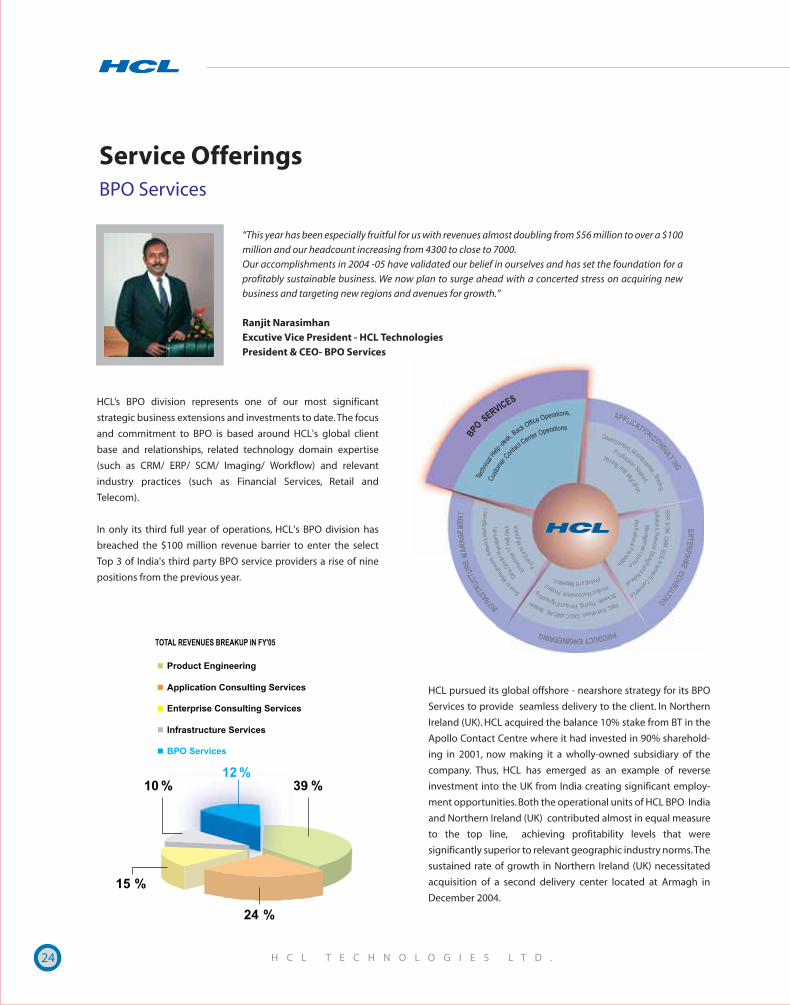
Ranjit Narasimhan Excutive Vice President - HCL Technologies President & CEO- BPO Services
25
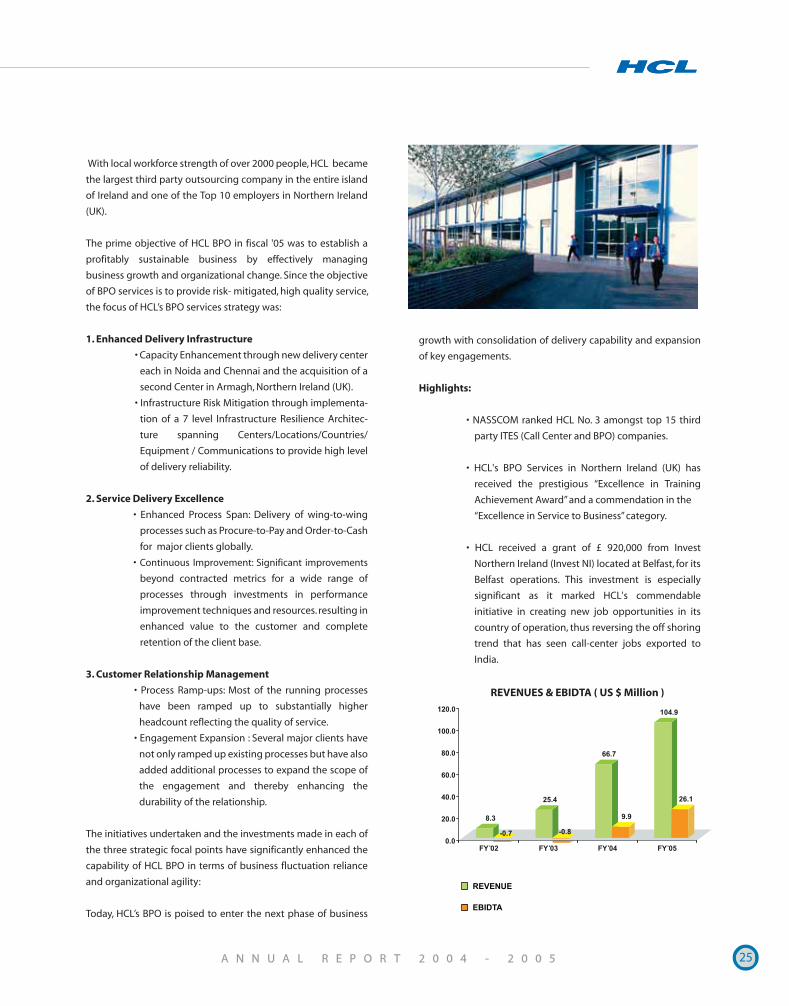
REVENUES & EBIDTA ( US $ Million )
With local workforce strength of over 2000 people, HCL became
the largest third party outsourcing company in the entire island
of Ireland and one of the Top 10 employers in Northern Ireland
(UK).
The prime objective of HCL BPO in fiscal '05 was to establish a
profitably sustainable business by effectively managing
business growth and organizational change. Since the objective
of BPO services is to provide risk- mitigated, high quality service,
the focus of HCL’s BPO services strategy was:
1. Enhanced Delivery Infrastructure
• Capacity Enhancement through new delivery center
each in Noida and Chennai and the acquisition of a
second Center in Armagh, Northern Ireland (UK).
• Infrastructure Risk Mitigation through implementa-
tion of a 7 level Infrastructure Resilience Architec-
ture spanning Centers/Locations/Countries/
Equipment / Communications to provide high level
of delivery reliability.
2. Service Delivery Excellence
• Enhanced Process Span: Delivery of wing-to-wing
processes such as Procure-to-Pay and Order-to-Cash
for major clients globally.
• Continuous Improvement: Significant improvements
beyond contracted metrics for a wide range of
processes through investments in performance
improvement techniques and resources. resulting in
enhanced value to the customer and complete
retention of the client base.
3. Customer Relationship Management
• Process Ramp-ups: Most of the running processes
have been ramped up to substantially higher
headcount reflecting the quality of service.
• Engagement Expansion : Several major clients have
not only ramped up existing processes but have also
added additional processes to expand the scope of
the engagement and thereby enhancing the
durability of the relationship.
The initiatives undertaken and the investments made in each of
the three strategic focal points have significantly enhanced the
capability of HCL BPO in terms of business fluctuation reliance
and organizational agility:
Today, HCL’s BPO is poised to enter the next phase of business
growth with consolidation of delivery capability and expansion
of key engagements.
Highlights:
• NASSCOM ranked HCL No. 3 amongst top 15 third
party ITES (Call Center and BPO) companies.
• HCL's BPO Services in Northern Ireland (UK) has
received the prestigious “Excellence in Training
Achievement Award” and a commendation in the
“Excellence in Service to Business” category.
• HCL received a grant of £ 920,000 from Invest
Northern Ireland (Invest NI) located at Belfast, for its
Belfast operations. This investment is especially
significant as it marked HCL's commendable
initiative in creating new job opportunities in its
country of operation, thus reversing the off shoring
trend that has seen call-center jobs exported to
India.
26
KEY ENGAGEMENTS
HCL is providing technical help-desk support services to a leading manufacturer/marketer of award winning removable flash memory cards, USB flash drives, card readers and ATA controller technology solutions.
Our client is a leading US based manufacturer of equipments used to fabricate microprocessors with operations in US, Europe, Asia, etc. HCL has been selected to process both machine down orders for the client. A 24x7 campaign, the orders are received through e-mail, fax and phone and the complete process is enabled through SAP.
HCL is running a B, 2B out bound collection campaign for a US based supplier of postal meters. Our client's solutions include a wide range of mailing and document technologies, efficiency, management services and one-to-one management expertise.
For leading cellular services provider in India who caters to both landline and mobile segment in the market , HCL is handling an inbound customer support services campaign.
HCL Advantage
• First Indian BPO company tto receive the COPC
certification for collections services.
• Perdue Benchmark
• ISO 9001: 2002 and BS7799 Certification.
• Process improvement through Six Sigma.
• Enhancing process delivery capability from non-core,
rule-set based services to core expertise knowledge
based services.
• Certified for over 22 processes spanning Front Office
and Back Office.
• Multi-lingual capability in 6 ASEAN and 8 European
languages.
• Established methodologies – POEM process evalua-
tion matrix and ARMOR delivery methodology.
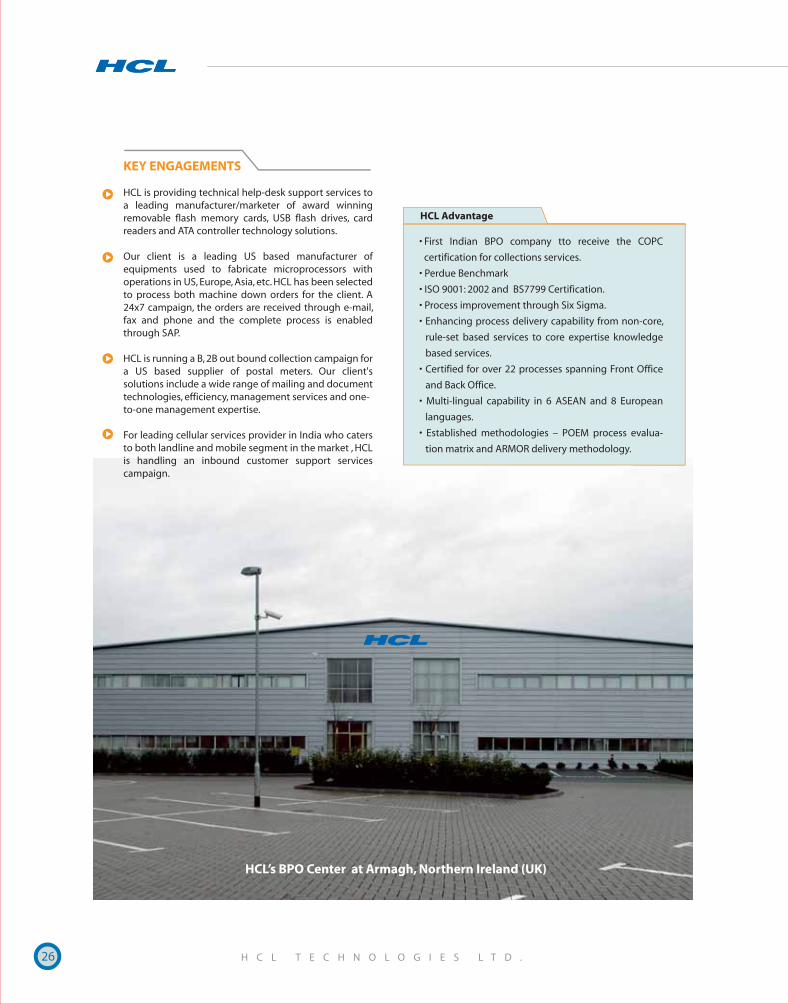
HCL’s BPO Center at Armagh, Northern Ireland (UK)
27
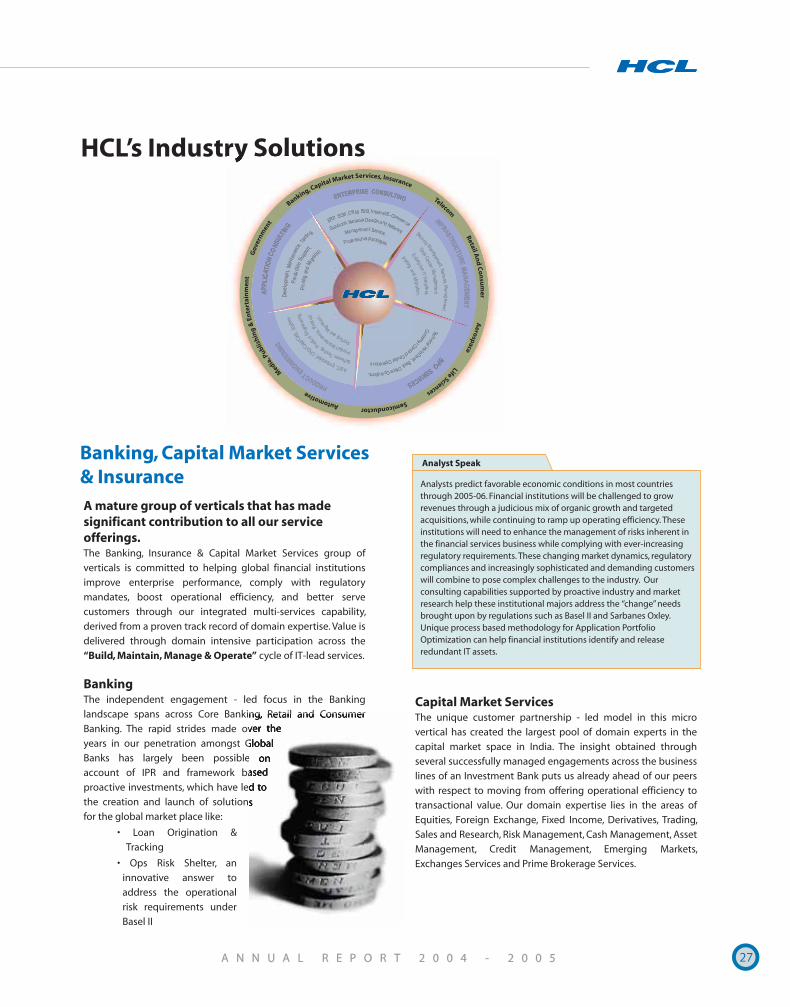
HCL’s Industry Solutions
Banking, Capital Market Services & InsuranceA mature group of verticals that has made significant contribution to all our service offerings.The Banking, Insurance & Capital Market Services group of
verticals is committed to helping global financial institutions
improve enterprise performance, comply with regulatory
mandates, boost operational efficiency, and better serve
customers through our integrated multi-services capability,
derived from a proven track record of domain expertise. Value is
delivered through domain intensive participation across the
“Build, Maintain, Manage & Operate” cycle of IT-lead services.
BankingThe independent engagement - led focus in the Banking
landscape spans across Core Banking, Retail and Consumer
Banking. The rapid strides made over the
years in our penetration amongst Global
Banks has largely been possible on
account of IPR and framework based
proactive investments, which have led to
the creation and launch of solutions
for the global market place like:
• Loan Origination &
Tracking
• Ops Risk Shelter, an
innovative answer to
address the operational
risk requirements under
Basel II
Capital Market ServicesThe unique customer partnership - led model in this micro
vertical has created the largest pool of domain experts in the
capital market space in India. The insight obtained through
several successfully managed engagements across the business
lines of an Investment Bank puts us already ahead of our peers
with respect to moving from offering operational efficiency to
transactional value. Our domain expertise lies in the areas of
Equities, Foreign Exchange, Fixed Income, Derivatives, Trading,
Sales and Research, Risk Management, Cash Management, Asset
Management, Credit Management, Emerging Markets,
Exchanges Services and Prime Brokerage Services.
Analysts predict favorable economic conditions in most countries through 2005-06. Financial institutions will be challenged to grow revenues through a judicious mix of organic growth and targeted acquisitions, while continuing to ramp up operating efficiency. These institutions will need to enhance the management of risks inherent in the financial services business while complying with ever-increasing regulatory requirements. These changing market dynamics, regulatory compliances and increasingly sophisticated and demanding customers will combine to pose complex challenges to the industry. Our consulting capabilities supported by proactive industry and market research help these institutional majors address the “change” needs brought upon by regulations such as Basel II and Sarbanes Oxley. Unique process based methodology for Application Portfolio Optimization can help financial institutions identify and release redundant IT assets.
Analyst Speak
28
Over 2000 person years of experience in providing market leading
solutions to the Insurance segment coupled with ruthless focus on
building domain & functional expertise has helped HCL to reduce
the cost, risk and time to market for new insurance solutions by over
20%. This is a testimony to our emphasis on Value over plain Cost
Subtraction. An achievement facilitated through the development
of Insurance Solution Accelerators.
The domain focus has been corroborated by Gartner in the recent
report on Insurance Outsourcing with rating of Mature in Life,
Property and Casualty ITO apart from rating of Moderate for BPO and
the recognition of our expertise in Reinsurance ITO.
For the second year, HCL has been awarded the LOMA Excellence in
Education - a reaffirmation of the importance HCL attaches to
domain expertise.
Our Insurance process and functional experience includes Sales and
Marketing (Agency/Brokerage), Underwriting, Policy Administration,
Claims Processing, Compensation, Marketing, Actuarial (Valuation
and Statutory Reporting), Management Reporting, Data Warehous-
ing, Workflow and Imaging, CRM and ERP.
HCL’s Insurance Practice has been rated as “Mature” in its capability to support Life and Property & Casualty (P&C) Insurance IT Outsourcing (ITO) projects by Gartner. HCL is also one of the top two companies, which are present across all insurance product segments and has been rated as “Emerging” in the BPO – Life and P&C Insurance
Gartner rates HCL’s Insurance Practice “Mature”
KEY ENGAGEMENTS - BANKING
A leading Life Insurer chose HCL as its Strategic Offshore
Partner in October 2004. HCL will be helping the client undergo
a complete business transformation to enable this client to
become more customer centric and realize greater value from
their operating platform.
Farm Bureau Financial Services (FBFS) is part of FBL Financial
Group, which underwrites, markets, and distributes life
insurance, annuities, and mutual funds. FBL also manages all
aspects of three Farm Bureau affiliated property-casualty
insurance companies. HCL has been chosen to provide
business analysis, systems development, and project manage-
ment support for a number of initiatives at FBFS.
KEY ENGAGEMENTS - INSURANCE
A Leading Exchange Operator & Technology Solutions Provider
for Exchanges in Europe engaged HCL to work on customization
of two major products depending upon the needs of existing
customers as well as new installations across the globe, to
reduce their operating costs & provide value added services to
their end customers. The users of these products are external
traders and market makers. The system is a set of modular
subsystems that handle and match orders, disseminate informa-
tion and can be interfaced to external clearing systems. HCL will
be responsible for customizations and future enhancements of
these modular subsystems.
HCL has been chosen by Security and Exchange Board of India
for implementing an Integrated Market Surveillance System
(IMSS)to analyze market irregularities and identify suspected
market offenders and market entities. Once the system is built,
the IMSS will be the equivalent of an integrated surveillance
system across 27 exchanges, including 23 regional exchanges as
well as the two majors for both equities and derivatives.
Insurance
HCL has been awarded a project to develop corporate credit
rating systems for the lending business of a leading national
bank in India. This rating system covers the entire commer-
cial and corporate lending business of the bank and includes
small, medium and large corporates. The business, manage-
ment and organization parameters are considered for rating
and the system also offers the flexibility of comparison
between corporates.
HCL won a large order to execute a comprehensive Loans
Origination system for a leading financial services group in
Malaysia, comprising consumer loans, commercial loans and
a collateral management system. This win against an
established product vendor, goes a long way in validating
the practice's investments in solution sets and reusable
components. This approach will substantially reduce the
KEY ENGAGEMENTS - CAPITAL MARKETS
time to implement the solution, thereby increasing the ROI
for the client.
A global multi-national bank in Malaysia has entrusted HCL
with the task of building interfaces between an internation-
ally renowned Credit scoring engine and their lending
systems. These lending systems were developed by HCL and
are being maintained by HCL.
One of the largest financial institutions in South East Asia
selected HCL of strategic offshore partner for a comprehen-
sive project to interact with various technology providers to
implement the call center.
29
Our rich experience of 7500 person years in building sector
specific capabilities is dominantly exhibited in our present
standing in telecom sector. HCL covers the breath of telecom
structures from equipment manufacturers, service providers to
software vendors with its integrated offerings of software
services, business process and infrastructure management. Our
end-to-end capabilities from Product Engineering to Enterprise
Applications to BPO have led to:
• IP development such as protocol,
stacks, frameworks and solution
accelerators
• Development of mobile applications and convergence
solutions in the triple play arena
• Significant engagements in the billing applications
including core rating engines
• The largest engagement in the BPO space run by an India
based ESP with BT around critical business
processes, which directly impact revenue
Our strong partnerships with leading
processor companies, EMS vendors
and players in the OS space, help us in
our unique time-to-market proposition.
Today HCL takes pride in its relationships with
Tier 1 service providers like BT and a global player in networking
equipment.
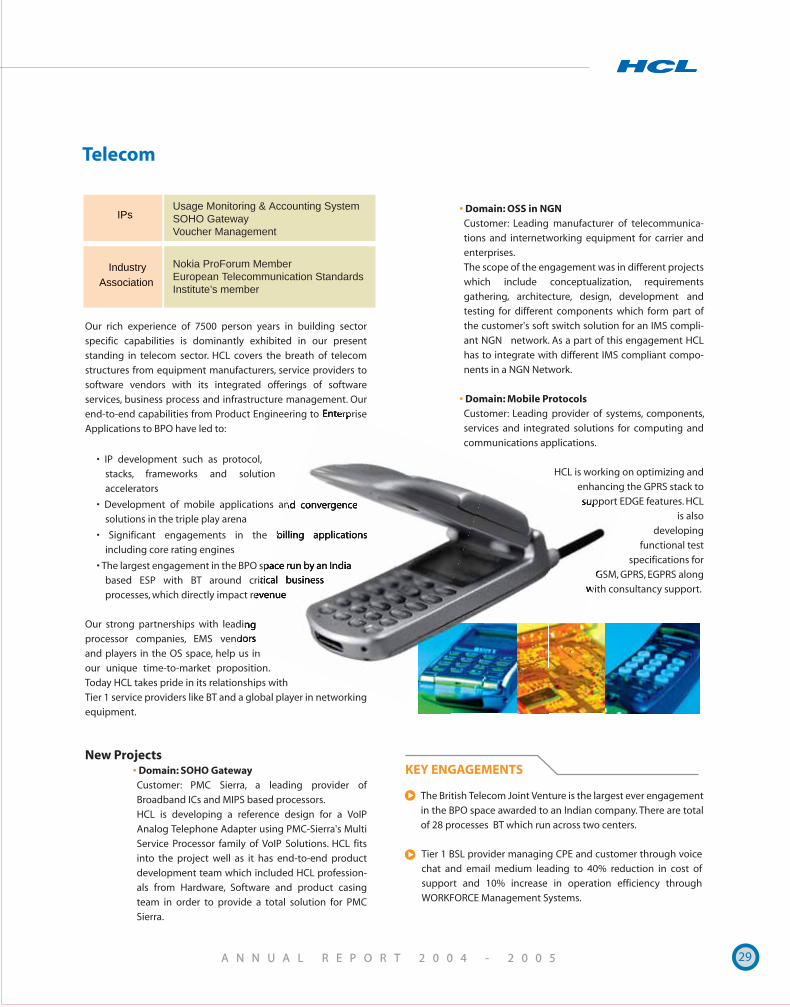
New Projects • Domain: SOHO Gateway
Customer: PMC Sierra, a leading provider of
Broadband ICs and MIPS based processors.
HCL is developing a reference design for a VoIP
Analog Telephone Adapter using PMC-Sierra's Multi
Service Processor family of VoIP Solutions. HCL fits
into the project well as it has end-to-end product
development team which included HCL profession-
als from Hardware, Software and product casing
team in order to provide a total solution for PMC
Sierra.
• Domain: OSS in NGNCustomer: Leading manufacturer of telecommunica-
tions and internetworking equipment for carrier and
enterprises.
The scope of the engagement was in different projects
which include conceptualization, requirements
gathering, architecture, design, development and
testing for different components which form part of
the customer's soft switch solution for an IMS compli-
ant NGN network. As a part of this engagement HCL
has to integrate with different IMS compliant compo-
nents in a NGN Network.
• Domain: Mobile ProtocolsCustomer: Leading provider of systems, components,
services and integrated solutions for computing and
communications applications.
HCL is working on optimizing and
enhancing the GPRS stack to
support EDGE features. HCL
is also
developing
functional test
specifications for
GSM, GPRS, EGPRS along
with consultancy support.
Telecom
Tier 1 BSL provider managing CPE and customer through voice
chat and email medium leading to 40% reduction in cost of
support and 10% increase in operation efficiency through
WORKFORCE Management Systems.
IPs
Industry
Association
Nokia ProForum Member
European Telecommunication Standards
Institute’s member
Usage Monitoring & Accounting System
SOHO Gateway
Voucher Management
The British Telecom Joint Venture is the largest ever engagement
in the BPO space awarded to an Indian company. There are total
of 28 processes BT which run across two centers.
KEY ENGAGEMENTS
30
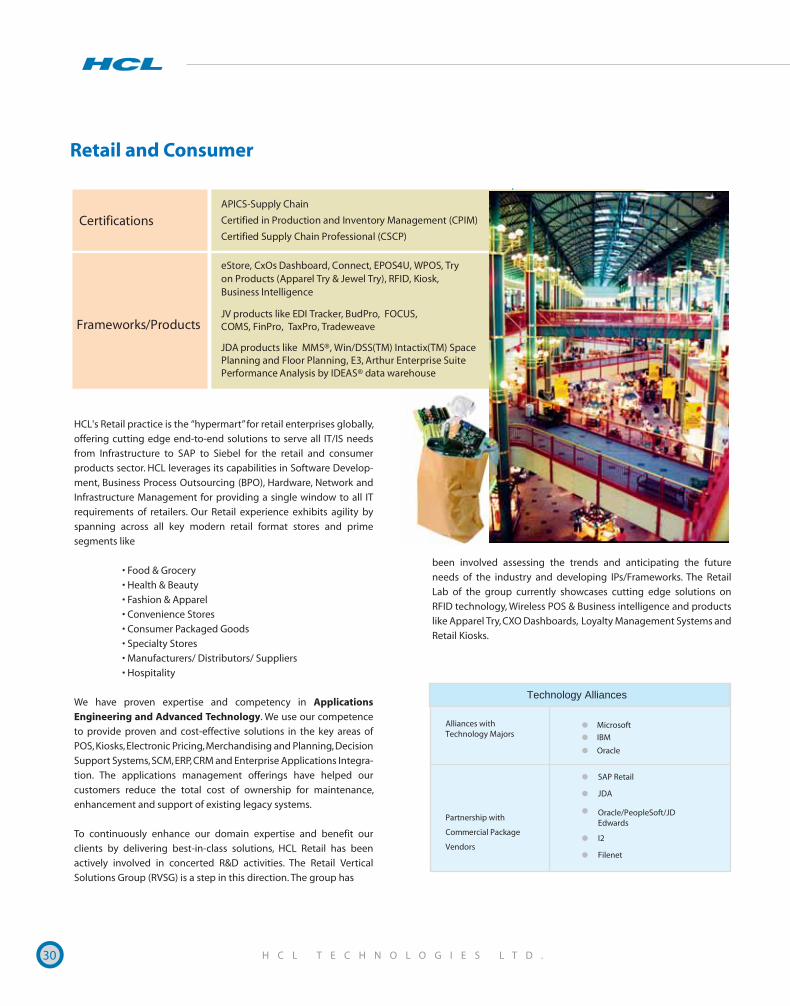
HCL's Retail practice is the “hypermart” for retail enterprises globally,
offering cutting edge end-to-end solutions to serve all IT/IS needs
from Infrastructure to SAP to Siebel for the retail and consumer
products sector. HCL leverages its capabilities in Software Develop-
ment, Business Process Outsourcing (BPO), Hardware, Network and
Infrastructure Management for providing a single window to all IT
requirements of retailers. Our Retail experience exhibits agility by
spanning across all key modern retail format stores and prime
segments like
• Food & Grocery
• Health & Beauty
• Fashion & Apparel
• Convenience Stores
• Consumer Packaged Goods
• Specialty Stores
• Manufacturers/ Distributors/ Suppliers
• Hospitality
We have proven expertise and competency in Applications Engineering and Advanced Technology. We use our competence
to provide proven and cost-effective solutions in the key areas of
POS, Kiosks, Electronic Pricing, Merchandising and Planning, Decision
Support Systems, SCM, ERP, CRM and Enterprise Applications Integra-
tion. The applications management offerings have helped our
customers reduce the total cost of ownership for maintenance,
enhancement and support of existing legacy systems.
To continuously enhance our domain expertise and benefit our
clients by delivering best-in-class solutions, HCL Retail has been
actively involved in concerted R&D activities. The Retail Vertical
Solutions Group (RVSG) is a step in this direction. The group has
Retail and Consumer
Frameworks/Products
Certifications Certified in Production and Inventory Management (CPIM)
APICS-Supply Chain
Certified Supply Chain Professional (CSCP)
eStore, CxOs Dashboard, Connect, EPOS4U, WPOS, Try on Products (Apparel Try & Jewel Try), RFID, Kiosk, Business Intelligence
JV products like EDI Tracker, BudPro, FOCUS, COMS, FinPro, TaxPro, Tradeweave
JDA products like MMS®, Win/DSS(TM) Intactix(TM) Space Planning and Floor Planning, E3, Arthur Enterprise Suite Performance Analysis by IDEAS® data warehouse
been involved assessing the trends and anticipating the future
needs of the industry and developing IPs/Frameworks. The Retail
Lab of the group currently showcases cutting edge solutions on
RFID technology, Wireless POS & Business intelligence and products
like Apparel Try, CXO Dashboards, Loyalty Management Systems and
Retail Kiosks.
Technology Alliances
Partnership with
Commercial Package
Vendors
Microsoft
IBM
Oracle
SAP Retail
JDA
Oracle/PeopleSoft/JD Edwards
I2
Filenet
Alliances with Technology Majors
31
Key Collaboration-HCL Jones
Joint Venture between HCL & Jones Apparel GroupHCL formed a joint venture with Jones Apparel Group (JAG), a
Fortune 500 US$ 4.6 billion apparel major. The JV has been a
strong win-win opportunity for both the partners. JAG draws
from our vast technology experience and HCL has exposure
to JAG's domain expertise in apparel, footwear and fashion
retailing. The JV has successfully served the IT needs for JAG
and all its divisions like Nine West, JNY, Polo, etc., in the past 3
years. With its proven solutions the JV plans to go to market
and will help solve the unique business challenges of the
apparel industry.
Aerospace
HCL signed a partnership agreement with JDA to become the prime
implementer for JDA solutions in India and the preferred implemen-
tation partner for APAC. This partnership lays the foundation of a
strong and mutually beneficial relationship between both companies
and uniquely positions JDA, the partnership vehicle, to leverage the
strengths of both the partners.
HCL is engaged with GSI Commerce, a leading outsource
solution provider for the entire spectrum of e-Commerce, in
providing the application enhancement and maintenance
services, for their various groups and platforms. HCL teams are
primarily working in Web Technologies area, QA Testing group,
DBA group, SCM group for maintenance of JDA applications
(MMS, Retail Ideas), CRM (Epiphany - campaign management)
support.
HCL has set up an Offshore Development Center for a leading
US based supplier of e-business solutions, for retailers to provide
enhancement and maintenance support for their products like
Enterprise1 Big Ticket, Enterprise General Retail and Customer1.
HCL will also be providing professional services support in
customizing the above products for client's customers.
HCL has been involved in a close engagement with the world's
largest apparel company. During the last year, HCL has been
involved in MOJO (Management of Orders through Java
Objects) to develop a unified order management system on
open web based architecture. This engagement addressed all
the order processing requirements of the client.
KEY ENGAGEMENTS
Certification AS9100 AND D0178
HCL's Aerospace practice currently counts several global aerospace
majors including airframe manufacturers, system integrators and
Tier 1 suppliers amongst its clients. Based on proven expertise and
solution delivery, HCL has forged longstanding relationship with
them.
We have consolidated our core avionics skills and its ability to run
complex programs over the last five years. Through consistent
delivery of value to customers, we have been able to take on
complete off-shoring assignments of independent development of
core avionics sub-systems besides customers’ verification and
validation requirements.
The services offered by this practice encompass embedded
software, hardware design, engineering services, test solutions and
applications development. The practice is supported by practitio-
ners combining over 2500 person years of experience in avionics
specific programming languages, methodologies, tools, operating
systems, compilers and standards.
HCL has development experience as per DO-178B requirements
across the complete lifecycle of software development spanning
specification, design, development, testing, verification & validation
and sustenance. This is complemented by end-to-end solutions to
DO-254 standards. HCL has the distinction of being the first India
based ESP to acquire AS9100, which is the de-facto standard for the
Aerospace Industry by BVQI, UK.
One of the major focuses has been development of IPs like avionics
specific O/S-Fault Tolerant Real Time Executive (FTREX), DEX Tool
(Data Extractor and Document generator), MCDC GEN (MCDC
Generator), PCI based ARINC 429 simulator card and ARINC 429 bus
analyzer software.
The service offerings are across the following sub-domains:• Flight Management Systems
• Flight Control Systems
• Cockpit Display & Information Systems
• Flight Warning Systems
• Engine Control Systems
• Air Management Systems
• Auxiliary Power Systems
JDA Alliance
32
KEY ENGAGEMENTS
A leading Indian Aeronautical and Defense establishment
has given HCL Technologies the opportunity to develop
software for the Geographical Image Exploitation System.
One of our key engagements in Indian aerospace industry
involves working on finite element modeling of an
indigenously designed engine.
A US based firm which is a leader in the development,
design, manufacture, and service of control systems and
components for aerospace and related high-technology
markets, has engaged HCL for the qualification of the
Rational Test Real Time tool used in the avionics domain. We
have also executed the project involving requirement based
testing for Rudder control system.
HCL has set up a dedicated design center for product
engineering services in Bangalore for Hamilton Sundstrand,
one of the leading worldwide suppliers of technologically
advanced aerospace and industrial products.
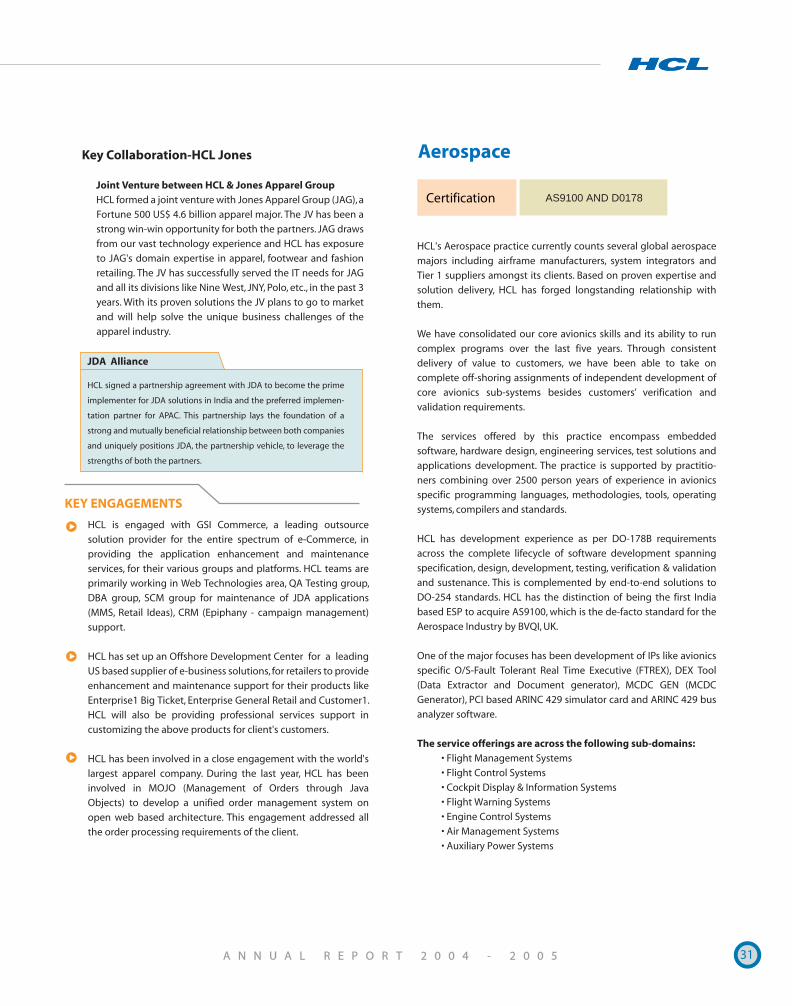
• In-flight entertainment systems
• Communication, navigation and surveillance system
• Air traffic management systems
• GPS based systems
• Simulation systems
• Health management systems
•Tools to support onboard systems' design and development
• Automatic test equipment
• In-flight entertainment system
• Secondary flight control system
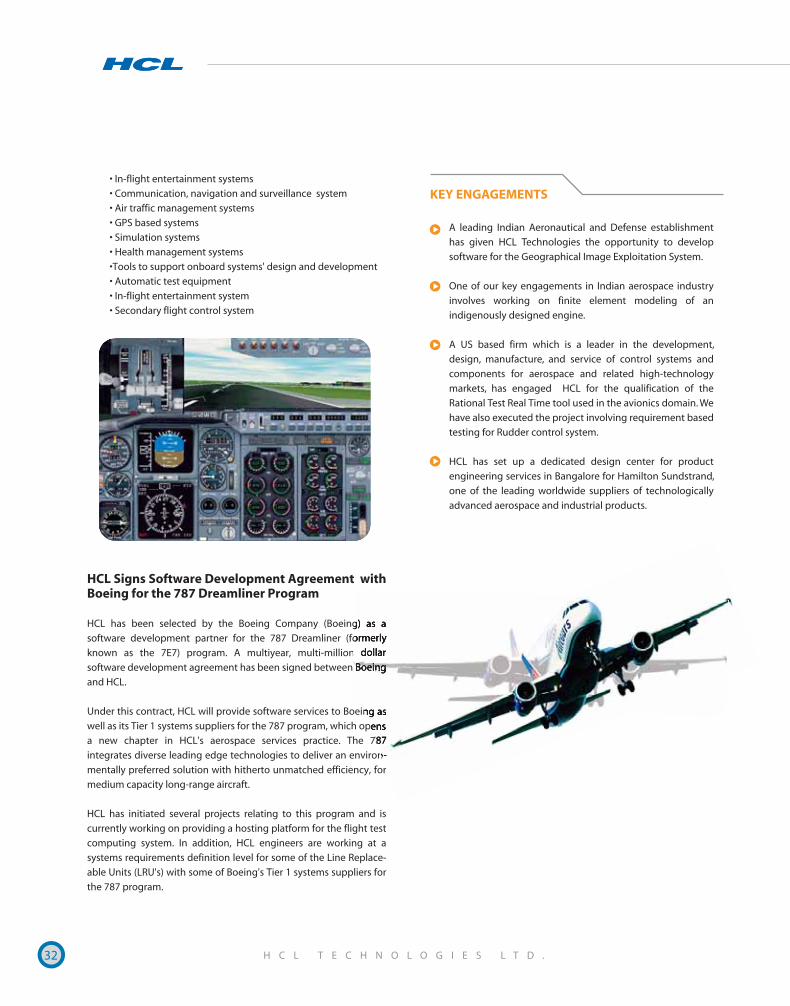
HCL Signs Software Development Agreement with Boeing for the 787 Dreamliner Program
HCL has been selected by the Boeing Company (Boeing) as a
software development partner for the 787 Dreamliner (formerly
known as the 7E7) program. A multiyear, multi-million dollar
software development agreement has been signed between Boeing
and HCL.
Under this contract, HCL will provide software services to Boeing as
well as its Tier 1 systems suppliers for the 787 program, which opens
a new chapter in HCL's aerospace services practice. The 787
integrates diverse leading edge technologies to deliver an environ-
mentally preferred solution with hitherto unmatched efficiency, for
medium capacity long-range aircraft.
HCL has initiated several projects relating to this program and is
currently working on providing a hosting platform for the flight test
computing system. In addition, HCL engineers are working at a
systems requirements definition level for some of the Line Replace-
able Units (LRU's) with some of Boeing's Tier 1 systems suppliers for
the 787 program.

33
Life Sciences
ISO 9001, ISO 13485, BS7799
Pharmaceuticals, Medical devices, Healthcare & ISVs
Certification
Industry Segments
The year 2004-2005 witnessed Life Sciences and Healthcare practice
at HCL focusing on the research and development business segment
primarily in the areas of drug discovery and development for
genomics and proteomics projects as well as bioinformatics solution
development. HCL continues to offer other focused offerings for the
pharmaceutical, medical devices and healthcare segments.
The Life Sciences team, during the course of the year, further
strengthened its domain knowledge by induction of team of
domain analyst in CRO, Healthcare Informatics and Medical Devices
arena. Our Life Sciences practice is now actively concentrating on
clinical data management.
HCL has also been engaged with one of the largest pharmaceuticals
company in India for their order taking process management. HCL
has been delivering significant value for its Life Science and Health-
care customers through the integrated package of process manage-
ment, software services and infrastructure management.
HCL is the first and only Indian company to have an ISO
13485 certification for design and development of medical
devices. Today HCL is engaged with 8 of the Top 15
companies in pharmaceutical sector. It
is one of the few offshore IT
providers for validation services, it
has FDA compliant QMS. HCL is doing
some high-end work for designs across all
classes of medical devices (class I, II, III) with focus on effective risk
management flow for software hazard analysis, failure mode effect
analysis and worst case and reliability analysis.
HCL signed a MoU with the “Supercomputing Facility for
Bioinformatics and Computational Biology” (SCFBio) at IIT Delhi
to work collaboratively on high-end projects in the area of drug
discovery and development, including genomics and
proteomics projects.
One of the big 5 Pharmaceutical Companies has partnered with
HCL for application support and maintenance of its suite of
applications at an enterprise level over a period of next 5 years.
HCL is now working with this client in multiple geographies both
US and Europe.
KEY ENGAGEMENTS
HCL forged alliances to further expand its service offerings in Life
Science domain including partnership with:
a. Waban software, US for
joint product develop-
ment and go to market
b. Tokushima University,
Japan for Bioinformatics
solution development
c. Saila Systems, Japan for
go to market
34
Semiconductor
Over the past 5 years, HCL's
Semiconductor practice has
developed strong relationships
with leading semiconductor
equipment manufacturers, foundries and device makers. These
relationships are based on significant value delivered to all the
players in the industry.
HCL’s Semiconductor practice offers end-to-end solutions in
equipment engineering solutions as well as manufacturing IT
services - Core fab applications including MES and factory automa-
tion solution sets, enterprise applications and partner integration,
infrastructure and process management services. Our expertise
extends beyond product development on Semi equipment and
manufacturing operations inside a semiconductor fab.
High Lights:• HCL's Semiconductor practice has been
chosen for Frost & Sullivan's “2005 Customer
Value Enhancement Award”. This award
recognizes HCL's capability in providing
innovative factory Automation solutions to
the Semiconductor industry.
• HCL became a sponsor member of Power.org,
a collaborated standards organization and developer
community with a mission to revolutionize design of
consumer electronics, networking, automotive and IT
systems.
• HCL has invested in the development of solution sets and
frameworks for Factory automation solutions, which make
the semiconductor equipment and factories compliant to the
Semiconductor Equipment and Materials International (SEMI)
standards. These solution sets, which are HCL's IP, are based
on innovative building-block approach. Such solution sets
and frameworks are used by HCL’s customers for automating
their equipments and fabs, to derive a much faster time-to-
market advantage than using home grown solutions.
• HCL has played an active role in the promotion of SEMI
standards, presenting papers on the benefits of standard
compliance for industry consortiums like International
SEMATECH Manufacturing Initiative (ISMI) to select audience
at various forums.
• As Global Systems Integration partner to Microsoft, we are
working on the latest technologies and platforms like .NET.
Microsoft helps us in software architecting, technology
training and solution certification.
Quality Initiatives
HCL’s rigorous quality processes are acknowledged and endorsed by
our customers. One of the customers leveraged our quality team to
study the control software of particular equipment, analyze the
defects and make recommendations to improve product quality. We
have published a paper on “Predictive feed forward control
Framework -The Panacea to predict and manage ALL that can be
measured” and it was accepted for the “3rd World Congress for
Software Quality”, in Germany, one of only three papers from India.
As a part of our continued effort in quality, besides CMM model, we
have also introduced the Six Sigma approach to improve the quality of
our processes and deliverables, creating better customer satisfaction.
We have successfully upgraded the CIM systems
consisting of shop floor applications, database and
hardware environment for a leading Asian foundry with
very minimal production downtime, surpassing
customer expectations. Our customer has realized
significant increase in production throughput due to
this upgrade.
A leading Automated Test Equipment (ATE) supplier first outsourced the
sustenance of the core test equipment software to us. We have enlarged
the engagement to include new software releases of the existing range
of products, turnkey testing projects and technical help-desk support,
etc., for the client's end customers. We are now offering end-to-end
product development that enhances their entire line of ATE systems with
particular emphasis on instrumentation.
Our engagement with a leading manufacturer of dry strip and rapid
thermal processing (RTP) solutions started with development and
sustenance of embedded equipment software in 2002. Aiming to be a
strategic IT and software outsourcing partner, we expanded our service
offerings for the client and completely implemented SAP at the client's
key facilities worldwide. We also leveraged our understanding of Supply
Chain Management in the semiconductor industry by handling Spare
Part Management for the client. As part of this service proposition, we
directly receive requests for spare parts from the foundries that have
deployed the client's equipment and ensure that the spare parts are
delivered to the foundry, in collaboration with the client's logistics
provider.
We are developing an integrated abstraction layer based on discussions
with the world's leading computer processor maker that helps the
factory applications run independent of the underlying communication
protocols, thus increasing the interoperability and upgradeability of the
various applications running in the factory.
KEY ENGAGEMENTS
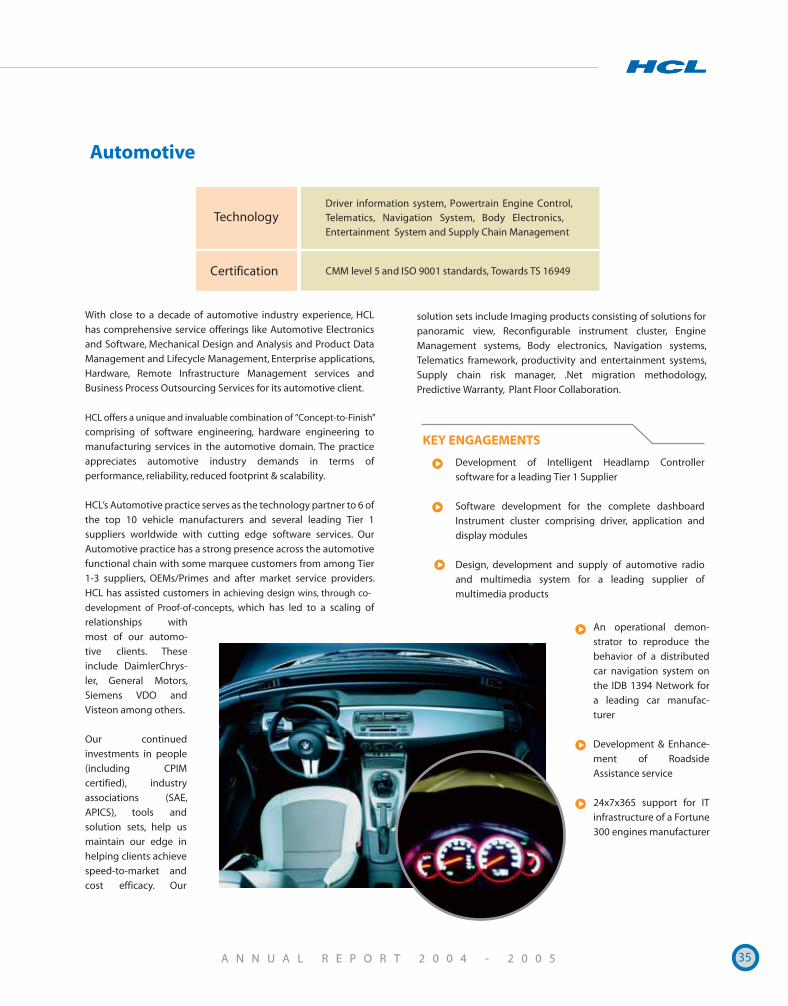
35
Automotive
With close to a decade of automotive industry experience, HCL
has comprehensive service offerings like Automotive Electronics
and Software, Mechanical Design and Analysis and Product Data
Management and Lifecycle Management, Enterprise applications,
Hardware, Remote Infrastructure Management services and
Business Process Outsourcing Services for its automotive client.
HCL offers a unique and invaluable combination of “Concept-to-Finish’
comprising of software engineering, hardware engineering to
manufacturing services in the automotive domain. The practice
appreciates automotive industry demands in terms of
performance, reliability, reduced footprint & scalability.
HCL’s Automotive practice serves as the technology partner to 6 of
the top 10 vehicle manufacturers and several leading Tier 1
suppliers worldwide with cutting edge software services. Our
Automotive practice has a strong presence across the automotive
functional chain with some marquee customers from among Tier
1-3 suppliers, OEMs/Primes and after market service providers.
HCL has assisted customers in achieving design wins, through co-
development of Proof-of-concepts, which has led to a scaling of
relationships with
most of our automo-
tive clients. These
include DaimlerChrys-
ler, General Motors,
Siemens VDO and
Visteon among others.
Our continued
investments in people
(including CPIM
certified), industry
associations (SAE,
APICS), tools and
solution sets, help us
maintain our edge in
helping clients achieve
speed-to-market and
cost efficacy. Our
Technology
Certification
Driver information system, Powertrain Engine Control, Telematics, Navigation System, Body Electronics,
Entertainment System and Supply Chain Management
CMM level 5 and ISO 9001 standards, Towards TS 16949
Development of Intelligent Headlamp Controller
software for a leading Tier 1 Supplier
Software development for the complete dashboard
Instrument cluster comprising driver, application and
display modules
Design, development and supply of automotive radio
and multimedia system for a leading supplier of
multimedia products
KEY ENGAGEMENTS
An operational demon-
strator to reproduce the
behavior of a distributed
car navigation system on
the IDB 1394 Network for
a leading car manufac-
turer
Development & Enhance-
ment of Roadside
Assistance service
24x7x365 support for IT
infrastructure of a Fortune
300 engines manufacturer
solution sets include Imaging products consisting of solutions for
panoramic view, Reconfigurable instrument cluster, Engine
Management systems, Body electronics, Navigation systems,
Telematics framework, productivity and entertainment systems,
Supply chain risk manager, .Net migration methodology,
Predictive Warranty, Plant Floor Collaboration.
36
Media, Publishing & Entertainment
HCL's Media Publishing and Entertainment (MPE) practice has the
privilege of strong relationships with key industry players in both
Publishing and Gaming. Today the MPE industry is focused on
adoption of new generation technologies like DRM and DAM, etc.,
new distribution channels like broadband and wireless networks,
licensed digital content, content security and phenomena of the
combination of game, gaming and gambling. HCL is well poised to
address these market challenges with its service triad
across Software Services, Infrastructure Manage-
ment and Business Process Outsourcing.
HCL's focused service offerings for this
segment are content aggregation, transfor-
mation & editing, asset management,
content security & rights management,
content storage & distribution, enterprise
solutions like ERP, CRM, sales & marketing,
business intelligence, royalties & payment
and BPO. HCL's MPE practice is strongest in
Publishing, Education & Learning, Informa-
tion collection and delivery.
Focus on GamingAssessing the high growth rate for gaming, HCL has strategized its
MPE practice to go full scale for online lottery, commercial gaming
and console gaming. The focus is on game design development,
Back Office Operations, Player Management, Instants Distribution,
Warehousing, Content Development, Pay Tables, Validation services,
Race track, Creative Design, Artwork, character & terrain
modeling, Image Processing and 3D Visualization.
New Domain Initiatives• Domain Specific
• DRM (Digital Rights Management)
• Common Portal for group companies
• ISBN Framework
• Online Book store
• CD ROM publishing
• Search Engine for CD ROM
• Cataloguing & Indexing
• Technology Specific• Work using tool/products like
XyVision and VISTA
• SSO (Single Sign On) Framework
• Identity Management System
• Data Architecture
• Storage Solutions
• Format Conversion
Key PartnershipsMicrosoft, Documentum, Filenet, OpenText, BEA, Plumtree, Lotus
Domino, Fulcrum, Vignette
HCL is working with a leading ISV in the
education domain on various projects.
Some of these are testing & assessment
system, content management system,
online payment system, performance
management system and analytical report-
ing system. Various technologies being
used for these systems are VB6, .NET, VC++,
Web Services, SQL Server, Oracle.
A leading information and collection
delivery provider has entrusted HCL for
majority of its core processes involving
collection, conversion, editing, storage,
retrieval, delivery, business intelligence,
billing & royalties, etc. HCL is working on
their web portals, authoring & submission,
desktop applications, content manage-
ment, online statistics, test automation
suits, etc.
HCL is doing business intelligence work for
a leading book Publisher. All applications
are modeled around data warehousing
technologies - Data extraction; transforma-
tion and loading (ETL) takes place between
source systems and target data warehouse
databases. The technologies used are
mainly AIX Unix, Sun Solarix Unix, Oracle
8i/9i, Business Objects 5.1.7, Informatica
5.1.2, Actuate 6, and Sybase.
KEY ENGAGEMENTS
37
GovernmentHCL, through its wholly-owned subsidiary HCL (Mass) Inc., is
focused on providing solutions to the state and local government
segment in the United States. In a short span of three years the
company has established key relationships in several states such
as Georgia, Florida, New York, Massachusetts, New Hampshire,
Connecticut, Nevada, Missouri, Maryland, Virginia, Colorado,
District of Columbia and Texas.
A dedicated team of nearly 200 consultants which include domain
experts in Health and Human services, Labor, Workers Compensa-
tion and Quasi Judicial Case management applications have come
together to create a range of solutions and established this
practice. The Government business has established strong creden-
tials in Electronic Document and Content Management systems in
partnership with a leading platform provider FileNet. It has grown
by 65% this year and a healthy order backlog situation promises
similar growth this year.
Significant investments have been made in creating a compre-
hensive solution in the space of Health and Human services; Case
Management systems for Welfare programs that include
Workforce Investment Act, Vocational Rehabilitation, Child Care,
Adult Education; Workers Compensations systems; Case Manage-
ment applications for Public Utilities Commission; Fraud investiga-
tion systems.
The Government Solutions business is now poised to grow rapidly
as it offers to the government customers much needed flexibility
and quality software engineering capability at a significant cost
advantage.
Integrated Claims Management Systems for Georgia Division of Workers Compensation: HCL won this contract
to deliver most comprehensive application. The software
covers entire operation of the division right from first report
of injury to adjudication of claims. The system includes EDI,
Data Warehouse and FileNet based document management
and workflow
Service oriented architecture for Division of Welfare, Nevada: HCL won this contract to implement electronic
forms on an enterprise scale for the division. The system is
based on FileNet’s latest P 8 architecture and is going to form
the foundation for all the new applications in the division
Long term maintenance contract for Department of Labor and Welfare, Tennessee: This is a five-year contract
for providing maintenance and enhancement services for
the department for the enterprise case management
application. Built on industry standard J2EE architecture, this
application provides significant knowledge to HCL in the
labor domain area
Vocational Rehabilitation System for the Department of Human Services, Colorado: HCL will build a comprehensive
application to help the state implement an application for
rehabilitating workers displaced due to injury. The applica-
tion is developed using the .net framework and will be a
benchmark application in the area of GUI design as some
users of this application are challenged for sight
Office of Children and Families, New York: HCL built a
comprehensive case management application for the
department in partnership with FileNet. The Application has
been built on Microsoft’s .net platform and is now in produc-
tion use
Georgia recovered more than $6 million in fraudulent food stamp money and $1.5 million in child-care overpayments for fiscal 2005 -- and did so in two days with the help of its new Investigative Services Information System (ISIS) from HCL.Source: Government Technology
KEY ENGAGEMENTS
Reusable components and solutions for:Fraud Management
Quasi judicial case management
Service Oriented Architecture
Electronic Document management and Forms
Case Management for Welfare programs
Unemployment Insurance
Public Utility commissions
Worker’s Compensation systems
Service Offerings:Application Engineering
Application Maintenance
Business Consulting
Legacy Migration
Web Enabling applications
Electronic Document Management and Workflow
Project Management
Systems Integration
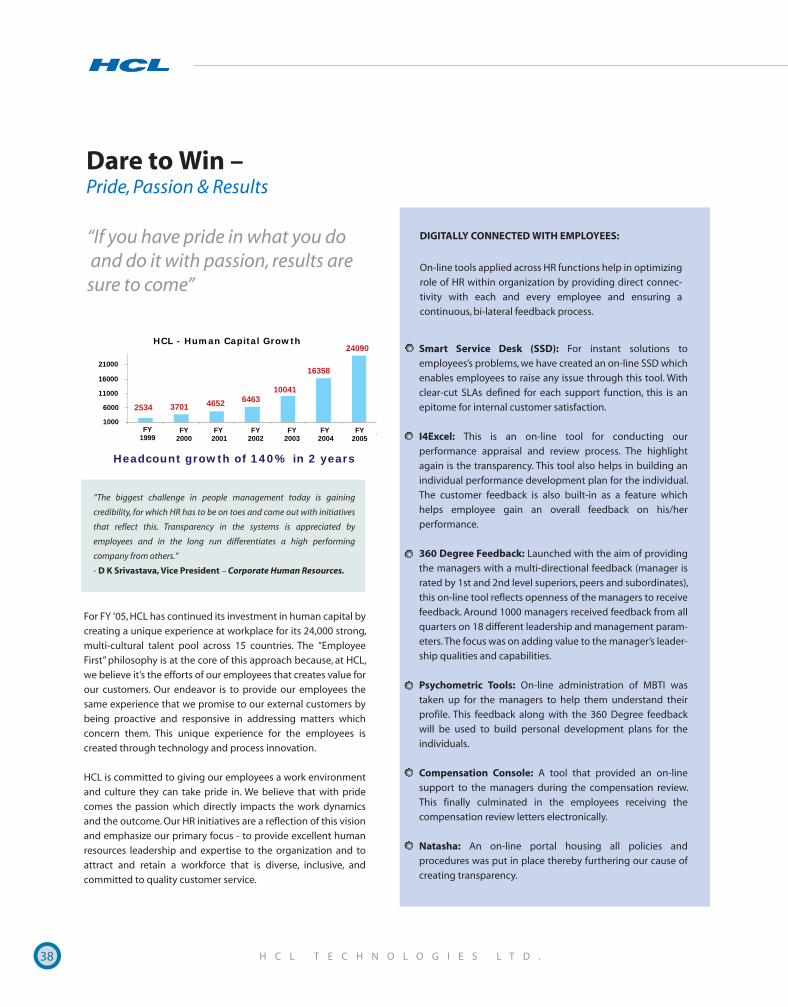
38
Dare to Win – Pride, Passion & Results
For FY ‘05, HCL has continued its investment in human capital by
creating a unique experience at workplace for its 24,000 strong,
multi-cultural talent pool across 15 countries. The “Employee
First” philosophy is at the core of this approach because, at HCL,
we believe it’s the efforts of our employees that creates value for
our customers. Our endeavor is to provide our employees the
same experience that we promise to our external customers by
being proactive and responsive in addressing matters which
concern them. This unique experience for the employees is
created through technology and process innovation.
HCL is committed to giving our employees a work environment
and culture they can take pride in. We believe that with pride
comes the passion which directly impacts the work dynamics
and the outcome. Our HR initiatives are a reflection of this vision
and emphasize our primary focus - to provide excellent human
resources leadership and expertise to the organization and to
attract and retain a workforce that is diverse, inclusive, and
committed to quality customer service.
Smart Service Desk (SSD): For instant solutions to
employees’s problems, we have created an on-line SSD which
enables employees to raise any issue through this tool. With
clear-cut SLAs defined for each support function, this is an
epitome for internal customer satisfaction.
I4Excel: This is an on-line tool for conducting our
performance appraisal and review process. The highlight
again is the transparency. This tool also helps in building an
individual performance development plan for the individual.
The customer feedback is also built-in as a feature which
helps employee gain an overall feedback on his/her
performance.
360 Degree Feedback: Launched with the aim of providing
the managers with a multi-directional feedback (manager is
rated by 1st and 2nd level superiors, peers and subordinates),
this on-line tool reflects openness of the managers to receive
feedback. Around 1000 managers received feedback from all
quarters on 18 different leadership and management param-
eters. The focus was on adding value to the manager’s leader-
ship qualities and capabilities.
Psychometric Tools: On-line administration of MBTI was
taken up for the managers to help them understand their
profile. This feedback along with the 360 Degree feedback
will be used to build personal development plans for the
individuals.
Compensation Console: A tool that provided an on-line
support to the managers during the compensation review.
This finally culminated in the employees receiving the
compensation review letters electronically.
Natasha: An on-line portal housing all policies and
procedures was put in place thereby furthering our cause of
creating transparency.
“The biggest challenge in people management today is gaining
credibility, for which HR has to be on toes and come out with initiatives
that reflect this. Transparency in the systems is appreciated by
employees and in the long run differentiates a high performing
company from others.”
- D K Srivastava, Vice President – Corporate Human Resources.
“If you have pride in what you do and do it with passion, results are sure to come”
HCL - Human Capital Growth
3701
6463
16358
24090
2534
1000
6000
11000
16000
21000
FY
1999
FY
2000
FY
2001
FY
2002
FY
2003
FY
2004
Headcount growth of 140% in 2 years
FY
2005
4652
10041
DIGITALLY CONNECTED WITH EMPLOYEES:
On-line tools applied across HR functions help in optimizing
role of HR within organization by providing direct connec-
tivity with each and every employee and ensuring a
continuous, bi-lateral feedback process.
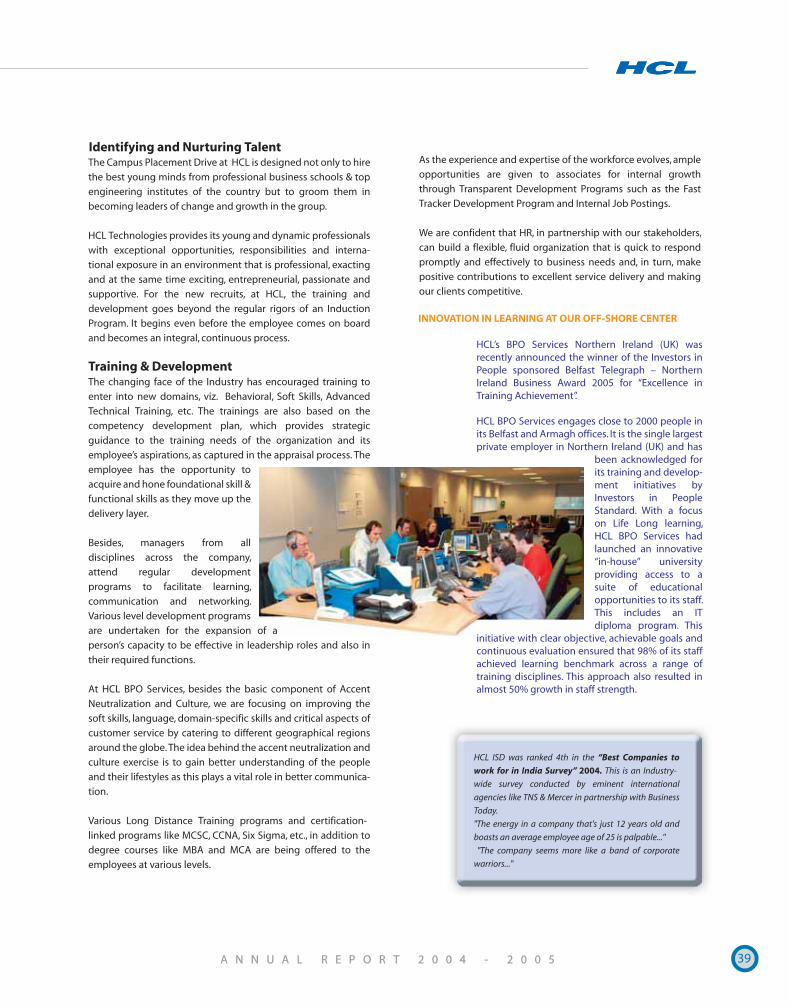
39
As the experience and expertise of the workforce evolves, ample
opportunities are given to associates for internal growth
through Transparent Development Programs such as the Fast
Tracker Development Program and Internal Job Postings.
We are confident that HR, in partnership with our stakeholders,
can build a flexible, fluid organization that is quick to respond
promptly and effectively to business needs and, in turn, make
positive contributions to excellent service delivery and making
our clients competitive.
The Campus Placement Drive at HCL is designed not only to hire
the best young minds from professional business schools & top
engineering institutes of the country but to groom them in
becoming leaders of change and growth in the group.
HCL Technologies provides its young and dynamic professionals
with exceptional opportunities, responsibilities and interna-
tional exposure in an environment that is professional, exacting
and at the same time exciting, entrepreneurial, passionate and
supportive. For the new recruits, at HCL, the training and
development goes beyond the regular rigors of an Induction
Program. It begins even before the employee comes on board
and becomes an integral, continuous process.
Training & DevelopmentThe changing face of the Industry has encouraged training to
enter into new domains, viz. Behavioral, Soft Skills, Advanced
Technical Training, etc. The trainings are also based on the
competency development plan, which provides strategic
guidance to the training needs of the organization and its
employee’s aspirations, as captured in the appraisal process. The
employee has the opportunity to
acquire and hone foundational skill &
functional skills as they move up the
delivery layer.
Besides, managers from all
disciplines across the company,
attend regular development
programs to facilitate learning,
communication and networking.
Various level development programs
are undertaken for the expansion of a
person’s capacity to be effective in leadership roles and also in
their required functions.
At HCL BPO Services, besides the basic component of Accent
Neutralization and Culture, we are focusing on improving the
soft skills, language, domain-specific skills and critical aspects of
customer service by catering to different geographical regions
around the globe. The idea behind the accent neutralization and
culture exercise is to gain better understanding of the people
and their lifestyles as this plays a vital role in better communica-
tion.
Various Long Distance Training programs and certification-
linked programs like MCSC, CCNA, Six Sigma, etc., in addition to
degree courses like MBA and MCA are being offered to the
employees at various levels.
HCL ISD was ranked 4th in the “Best Companies to
work for in India Survey” 2004. This is an Industry-
wide survey conducted by eminent international
agencies like TNS & Mercer in partnership with Business
Today.
"The energy in a company that's just 12 years old and
boasts an average employee age of 25 is palpable..."
"The company seems more like a band of corporate
warriors..."
HCL’s BPO Services Northern Ireland (UK) was recently announced the winner of the Investors in People sponsored Belfast Telegraph – Northern Ireland Business Award 2005 for “Excellence in Training Achievement”.
HCL BPO Services engages close to 2000 people in its Belfast and Armagh offices. It is the single largest private employer in Northern Ireland (UK) and has
been acknowledged for its training and develop-ment initiatives by Investors in People Standard. With a focus on Life Long learning, HCL BPO Services had launched an innovative “in-house” university providing access to a suite of educational opportunities to its staff. This includes an IT diploma program. This
initiative with clear objective, achievable goals and continuous evaluation ensured that 98% of its staff achieved learning benchmark across a range of training disciplines. This approach also resulted in almost 50% growth in staff strength.
INNOVATION IN LEARNING AT OUR OFF-SHORE CENTER
Identifying and Nurturing Talent
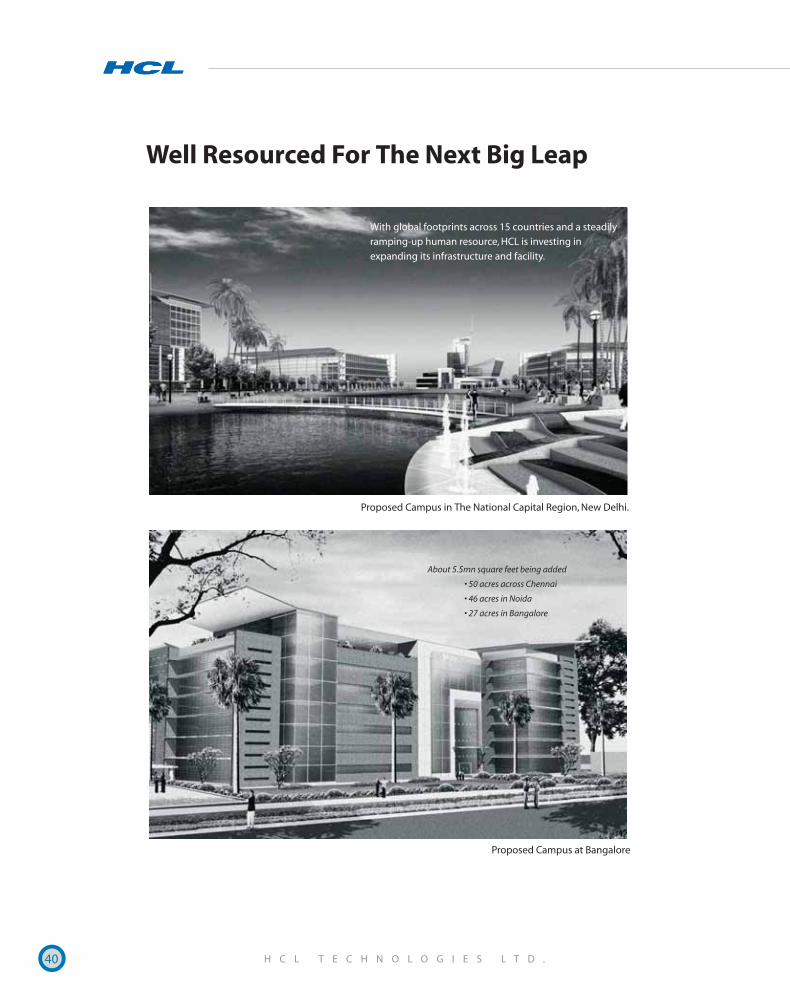
40
Well Resourced For The Next Big Leap
With global footprints across 15 countries and a steadily
ramping-up human resource, HCL is investing in
expanding its infrastructure and facility.
Proposed Campus at Bangalore
About 5.5mn square feet being added
• 50 acres across Chennai
• 46 acres in Noida
• 27 acres in Bangalore
Proposed Campus in The National Capital Region, New Delhi.
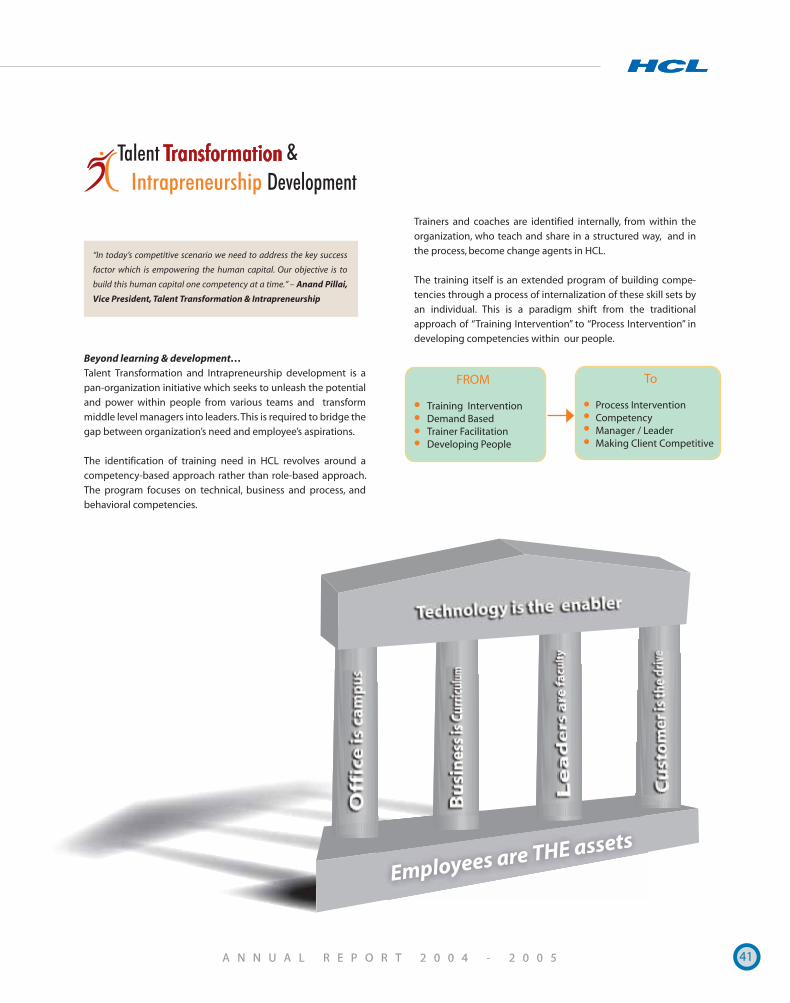
41
Beyond learning & development…Talent Transformation and Intrapreneurship development is a
pan-organization initiative which seeks to unleash the potential
and power within people from various teams and transform
middle level managers into leaders. This is required to bridge the
gap between organization’s need and employee’s aspirations.
The identification of training need in HCL revolves around a
competency-based approach rather than role-based approach.
The program focuses on technical, business and process, and
behavioral competencies.
“In today’s competitive scenario we need to address the key success
factor which is empowering the human capital. Our objective is to
build this human capital one competency at a time.” – Anand Pillai,
Vice President, Talent Transformation & Intrapreneurship
Employees are THE assets
Trainers and coaches are identified internally, from within the
organization, who teach and share in a structured way, and in
the process, become change agents in HCL.
The training itself is an extended program of building compe-
tencies through a process of internalization of these skill sets by
an individual. This is a paradigm shift from the traditional
approach of “Training Intervention” to “Process Intervention” in
developing competencies within our people.
FROM
Training InterventionDemand BasedTrainer FacilitationDeveloping People
To
Process InterventionCompetencyManager / LeaderMaking Client Competitive
42
IntrapreneurshipThe key to attract and retain top talent
The New HR challenges at HCL center around cultivating innova-
tion and creativity within the enterprise. At HCL, we address this
by fostering a culture of “Intrapreneurship” or “Internal –
Entrepreneurship” which is all about turning ideas into business
internal to the organization. Our history is also replete with
instances where employees have transformed ideas into
successful actions resulting in profitable enterprises.
We have initiated a process of institutionalizing “Intrapreneur-
ship” to enable managers to shift from managing opportunities
to creating opportunities. The organization gets structured
around teams that function as small businesses nested together.
These small business teams choose and work-out exchanges
between themselves and with others outside, either as custom-
ers or collaborators, and greatly speed up the process of innova-
tion.
At HCL, we have initiated opening up of information structures
and encouraging individuals to share knowledge, technology,
and skills in pursuit of and exploiting opportunity. Individuals/
teams are not only given the required training and coaching, but
also empowered to take decisions. This has oriented employees
to opportunity, growth and renewal, enabling them to realize
and harness their potential. This has not only created greater
value for our customers, but has also helped HCL in retaining top
managerial talent.
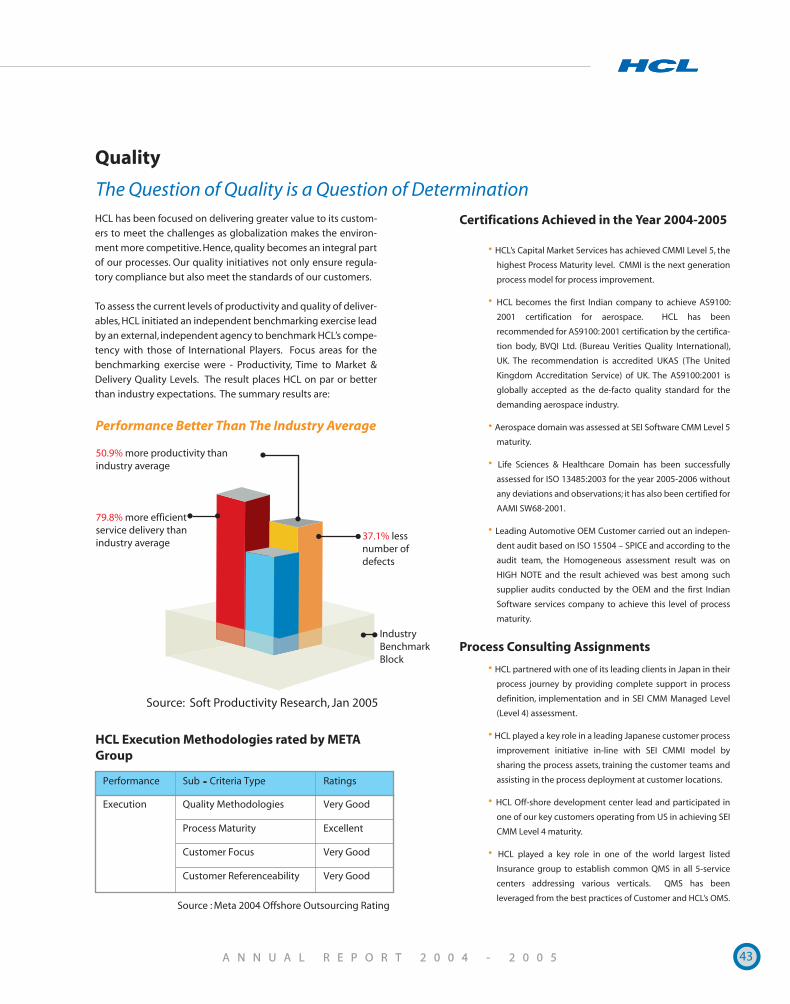
43
Quality
HCL has been focused on delivering greater value to its custom-
ers to meet the challenges as globalization makes the environ-
ment more competitive. Hence, quality becomes an integral part
of our processes. Our quality initiatives not only ensure regula-
tory compliance but also meet the standards of our customers.
To assess the current levels of productivity and quality of deliver-
ables, HCL initiated an independent benchmarking exercise lead
by an external, independent agency to benchmark HCL’s compe-
tency with those of International Players. Focus areas for the
benchmarking exercise were - Productivity, Time to Market &
Delivery Quality Levels. The result places HCL on par or better
than industry expectations. The summary results are:
Performance Better Than The Industry Average
50.9% more productivity than industry average
79.8% more efficient service delivery than industry average
37.1% less number of defects
Industry Benchmark Block
Source: Soft Productivity Research, Jan 2005
Certifications Achieved in the Year 2004-2005
• HCL’s Capital Market Services has achieved CMMI Level 5, the
highest Process Maturity level. CMMI is the next generation
process model for process improvement.
• HCL becomes the first Indian company to achieve AS9100:
2001 certification for aerospace. HCL has been
recommended for AS9100: 2001 certification by the certifica-
tion body, BVQI Ltd. (Bureau Verities Quality International),
UK. The recommendation is accredited UKAS (The United
Kingdom Accreditation Service) of UK. The AS9100:2001 is
globally accepted as the de-facto quality standard for the
demanding aerospace industry.
• Aerospace domain was assessed at SEI Software CMM Level 5
maturity.
• Life Sciences & Healthcare Domain has been successfully
assessed for ISO 13485:2003 for the year 2005-2006 without
any deviations and observations; it has also been certified for
AAMI SW68-2001.
• Leading Automotive OEM Customer carried out an indepen-
dent audit based on ISO 15504 – SPICE and according to the
audit team, the Homogeneous assessment result was on
HIGH NOTE and the result achieved was best among such
supplier audits conducted by the OEM and the first Indian
Software services company to achieve this level of process
maturity.
Process Consulting Assignments
• HCL partnered with one of its leading clients in Japan in their
process journey by providing complete support in process
definition, implementation and in SEI CMM Managed Level
(Level 4) assessment.
• HCL played a key role in a leading Japanese customer process
improvement initiative in-line with SEI CMMI model by
sharing the process assets, training the customer teams and
assisting in the process deployment at customer locations.
• HCL Off-shore development center lead and participated in
one of our key customers operating from US in achieving SEI
CMM Level 4 maturity.
• HCL played a key role in one of the world largest listed
Insurance group to establish common QMS in all 5-service
centers addressing various verticals. QMS has been
leveraged from the best practices of Customer and HCL’s OMS. Source : Meta 2004 Offshore Outsourcing Rating
Performance Sub - Criteria Type Ratings
Quality Methodologies Very Good
Process Maturity Excellent
Customer Focus Very Good
Execution
Customer Referenceability Very Good
HCL Execution Methodologies rated by META Group
The Question of Quality is a Question of Determination
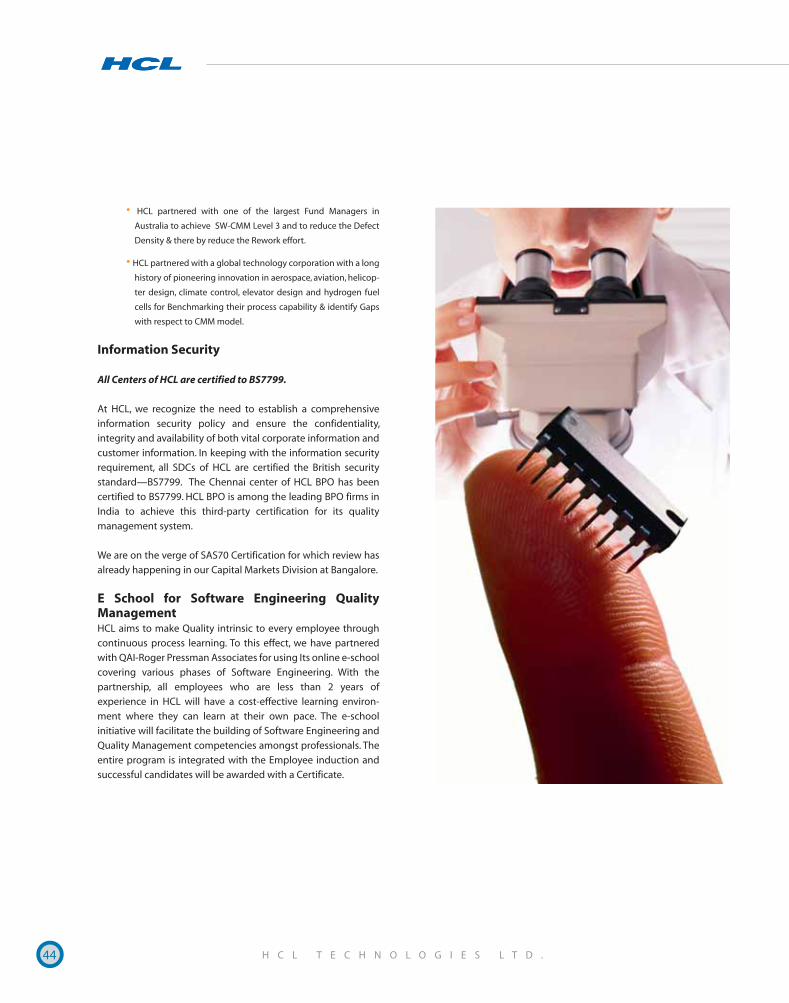
44
• HCL partnered with one of the largest Fund Managers in
Australia to achieve SW-CMM Level 3 and to reduce the Defect
Density & there by reduce the Rework effort.
• HCL partnered with a global technology corporation with a long
history of pioneering innovation in aerospace, aviation, helicop-
ter design, climate control, elevator design and hydrogen fuel
cells for Benchmarking their process capability & identify Gaps
with respect to CMM model.
Information Security
All Centers of HCL are certified to BS7799.
At HCL, we recognize the need to establish a comprehensive
information security policy and ensure the confidentiality,
integrity and availability of both vital corporate information and
customer information. In keeping with the information security
requirement, all SDCs of HCL are certified the British security
standard—BS7799. The Chennai center of HCL BPO has been
certified to BS7799. HCL BPO is among the leading BPO firms in
India to achieve this third-party certification for its quality
management system.
We are on the verge of SAS70 Certification for which review has
already happening in our Capital Markets Division at Bangalore.
E School for Software Engineering Quality ManagementHCL aims to make Quality intrinsic to every employee through
continuous process learning. To this effect, we have partnered
with QAI-Roger Pressman Associates for using Its online e-school
covering various phases of Software Engineering. With the
partnership, all employees who are less than 2 years of
experience in HCL will have a cost-effective learning environ-
ment where they can learn at their own pace. The e-school
initiative will facilitate the building of Software Engineering and
Quality Management competencies amongst professionals. The
entire program is integrated with the Employee induction and
successful candidates will be awarded with a Certificate.
A N N U A L R E P O R T 2 0 0 4 - 2 0 0 5 45
Management Discussion and Analysis
The following discussion of the Company's financial condition and results of operations should be read in conjunction with the consolidated
financial statements and the related disclosure notes. Investors are cautioned that this discussion contains statements that involve risks
and uncertainties. When used in this discussion, 'anticipate', 'believe', 'estimate', 'intend', 'will', and 'expect' and other similar expressions as
they relate to the Company or its business are intended to identify such forward-looking statements. The Company undertakes no obligations
to publicly update or revise any forward-looking statements, whether as a result of new information, future events, or otherwise. Actual
results could differ materially from those discussed in the forward-looking statements due to changes in the market or general economic
conditions and other factors. Factors that could cause or contribute to such changes include those described under the heading 'Risk
Factors' in the Prospectus filed with the Securities and Exchange Board of India (SEBI) as well as factors discussed elsewhere in this report.
Readers are cautioned not to place undue reliance on the forward-looking statements as they speak only as of their dates.
Introduction and Business Overview
HCL Technologies Ltd ('HCL' or the 'Company') is one of India's largest IT services exporter with services spanning IT services as well as IT-
enabled services. The key areas in which the Company provides its services are as indicated below.
Software Services : HCL offers its software services in enterprises software services as well as product engineering services. The enterprise
software services cover custom and package application lifecycles - design, develop, test, implement, maintain, migrate, integrate, upgrade,
roll-out and support. HCL has partnerships with leading software product companies and Centers of Excellence to develop capabilities
which are harnessed to help clients. In product engineering, HCL offers full lifecycle services, from requirements definition to prototype
architecture, development, testing, technical help desk from L0 onwards, field support, maintenance as well as upgradation. With select
software product companies, the service portfolio extends beyond engineering to implementation services.
BPO Services : HCL BPO delivers multi-channel contact management and back office services for select, complex processes in banking,
insurance, manufacturing, retail and telecom. The accent is on advanced customer handling and communication skills, a sensitized approach
for managing client-side process stakeholders, integration with process experts and certifications such as COPC and BS:7799. HCL's BPO
Services are highly regarded for significant, sustained value delivery, bolstered by an incident-free track record and renewal of all major
contracts.
Infrastructure Management Services : HCL's Infrastructure Services enable customers to operate and manage their IT environment making
it available, secure and reliable - always. The services are delivered through ISO 9002, BS:7799 certified Operations and Management Centers
in India. Unique in-house tools provide enhanced visibility into the customer's IT infrastructure to optimize performance, increase availability
and reduce costs.
These service lines are delivered to customers in key verticals such as Aerospace, Automotive, Banking, Capital Markets and Insurance,
Government, Life Sciences, Media, Publishing and Entertainment, Retail and Consumer Semiconductors and Telecom.
The company's technological prowess lies in the dedicated Offshore Development Centers it operates for some of the world's leading
organizations. These centers are located in Bangalore, Chennai, Gurgaon and Noida in India. HCL is the preferred partner to 490 prestigious
organizations in the world, including 66 Global 500 companies. Its presence across 14 countries gives the Company global reach and a vast
rollout support capability. Currently, it serves global markets through offices in America, Asia Pacific, Europe and Japan.
The Current Operating Environment and Outlook
The Indian IT services and IT-enabled services industries continue to grow at a rapid pace driven by the increasing penetration of Indian
vendors in the global IT market. The move towards outsourcing of IT services with India being the most preferred location for this, is aiding
this growth. The Company enjoys a position of pre-eminence in this environment and is poised strongly to capture an increased marketshare
by leveraging its wide service mix and strong client relationships.
The Company's total revenues grew from $55.8 million in fiscal 1996 to $762.0 million in fiscal 2005, representing a CAGR of 33.7%, while
net income grew from $3.2 million in fiscal 1996 to $138.1 million in fiscal 2005, representing a CAGR of 51.9%.
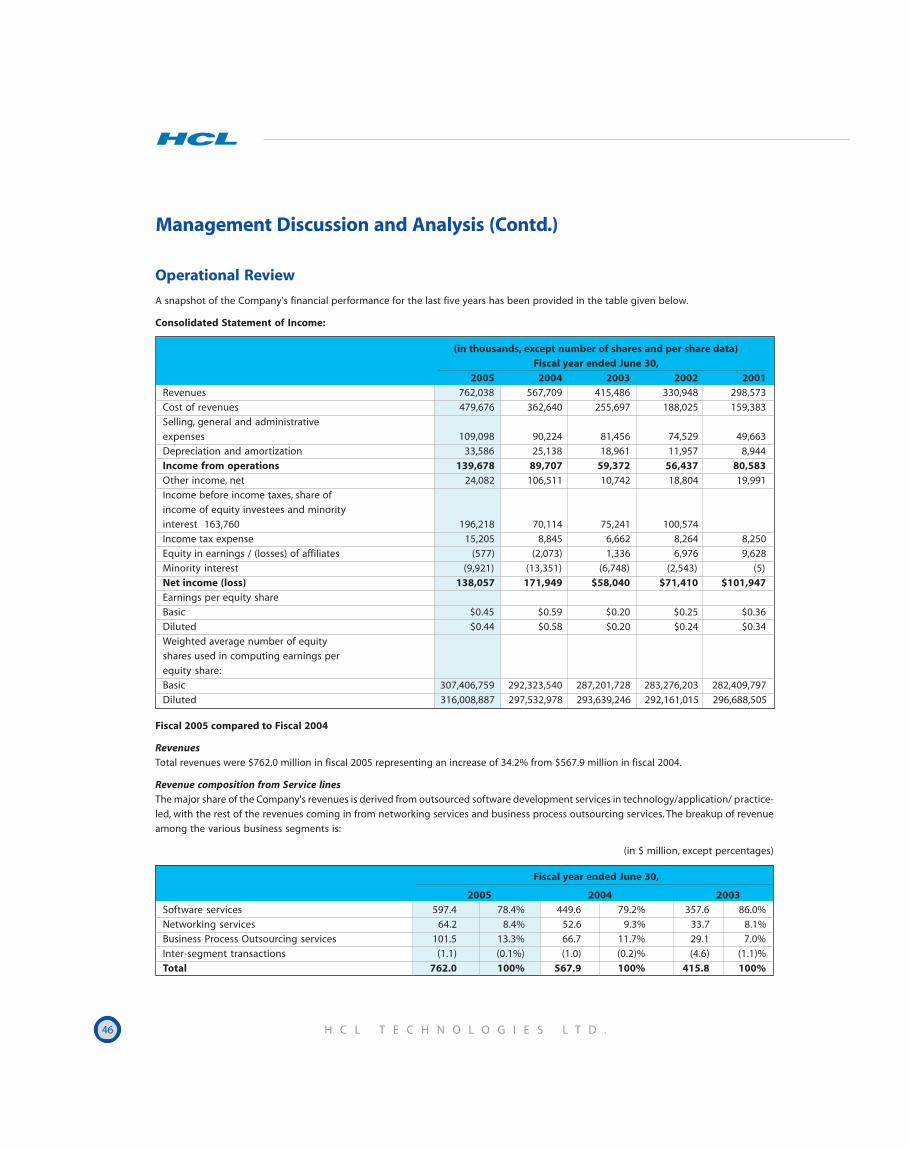
46 H C L T E C H N O L O G I E S L T D .
Management Discussion and Analysis (Contd.)
Operational Review
A snapshot of the Company's financial performance for the last five years has been provided in the table given below.
Consolidated Statement of Income:
(in thousands, except number of shares and per share data)Fiscal year ended June 30,
2005 2004 2003 2002 2001Revenues 762,038 567,709 415,486 330,948 298,573
Cost of revenues 479,676 362,640 255,697 188,025 159,383
Selling, general and administrative
expenses 109,098 90,224 81,456 74,529 49,663
Depreciation and amortization 33,586 25,138 18,961 11,957 8,944
Income from operations 139,678 89,707 59,372 56,437 80,583Other income, net 24,082 106,511 10,742 18,804 19,991
Income before income taxes, share of
income of equity investees and minority
interest 163,760 196,218 70,114 75,241 100,574
Income tax expense 15,205 8,845 6,662 8,264 8,250
Equity in earnings / (losses) of affiliates (577) (2,073) 1,336 6,976 9,628
Minority interest (9,921) (13,351) (6,748) (2,543) (5)
Net income (loss) 138,057 171,949 $58,040 $71,410 $101,947Earnings per equity share
Basic $0.45 $0.59 $0.20 $0.25 $0.36
Diluted $0.44 $0.58 $0.20 $0.24 $0.34
Weighted average number of equity
shares used in computing earnings per
equity share:
Basic 307,406,759 292,323,540 287,201,728 283,276,203 282,409,797
Diluted 316,008,887 297,532,978 293,639,246 292,161,015 296,688,505
Fiscal 2005 compared to Fiscal 2004
RevenuesTotal revenues were $762.0 million in fiscal 2005 representing an increase of 34.2% from $567.9 million in fiscal 2004.
Revenue composition from Service linesThe major share of the Company's revenues is derived from outsourced software development services in technology/application/ practice-
led, with the rest of the revenues coming in from networking services and business process outsourcing services. The breakup of revenue
among the various business segments is:
(in $ million, except percentages)
Fiscal year ended June 30,
2005 2004 2003Software services 597.4 78.4% 449.6 79.2% 357.6 86.0%
Networking services 64.2 8.4% 52.6 9.3% 33.7 8.1%
Business Process Outsourcing services 101.5 13.3% 66.7 11.7% 29.1 7.0%
Inter-segment transactions (1.1) (0.1%) (1.0) (0.2)% (4.6) (1.1)%
Total 762.0 100% 567.9 100% 415.8 100%
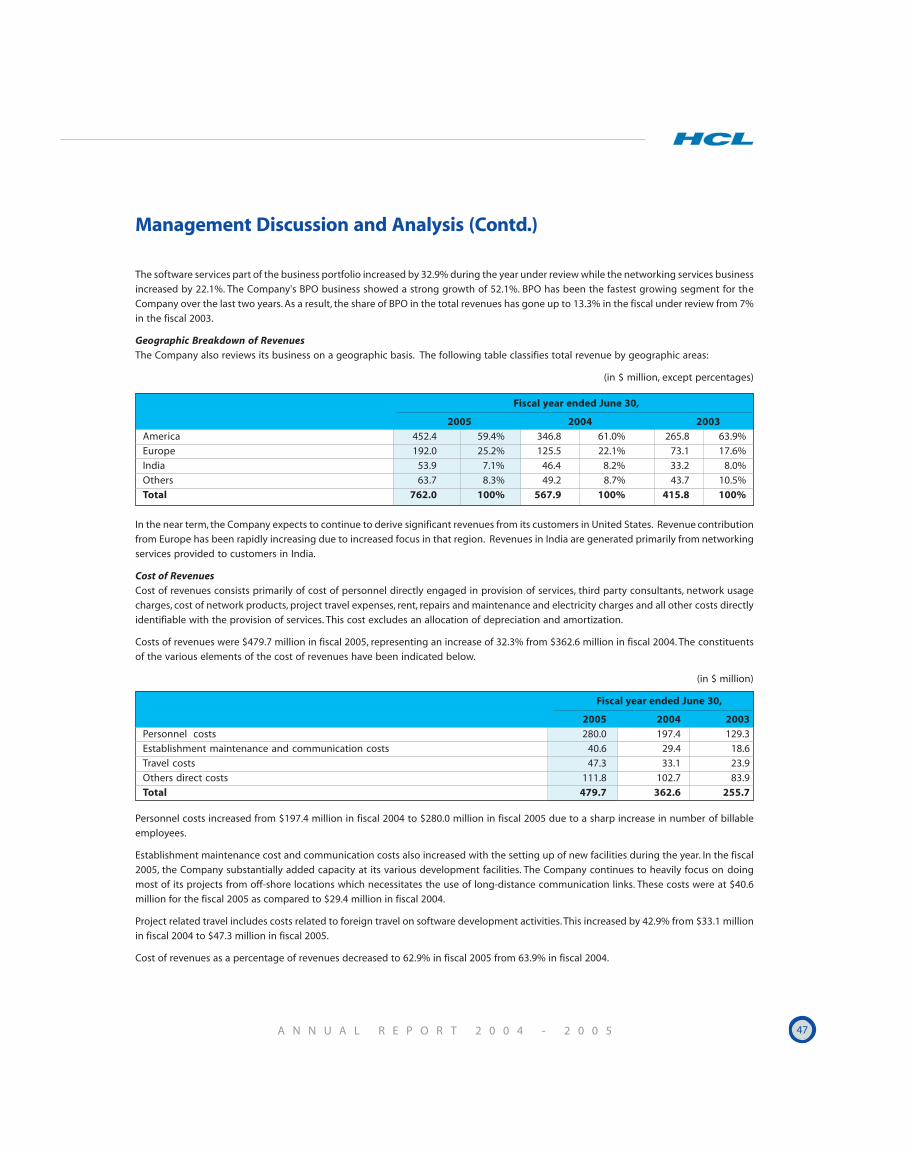
A N N U A L R E P O R T 2 0 0 4 - 2 0 0 5 47
The software services part of the business portfolio increased by 32.9% during the year under review while the networking services business
increased by 22.1%. The Company's BPO business showed a strong growth of 52.1%. BPO has been the fastest growing segment for the
Company over the last two years. As a result, the share of BPO in the total revenues has gone up to 13.3% in the fiscal under review from 7%
in the fiscal 2003.
Geographic Breakdown of RevenuesThe Company also reviews its business on a geographic basis. The following table classifies total revenue by geographic areas:
(in $ million, except percentages)
Fiscal year ended June 30,
2005 2004 2003America 452.4 59.4% 346.8 61.0% 265.8 63.9%
Europe 192.0 25.2% 125.5 22.1% 73.1 17.6%
India 53.9 7.1% 46.4 8.2% 33.2 8.0%
Others 63.7 8.3% 49.2 8.7% 43.7 10.5%
Total 762.0 100% 567.9 100% 415.8 100%
In the near term, the Company expects to continue to derive significant revenues from its customers in United States. Revenue contribution
from Europe has been rapidly increasing due to increased focus in that region. Revenues in India are generated primarily from networking
services provided to customers in India.
Cost of RevenuesCost of revenues consists primarily of cost of personnel directly engaged in provision of services, third party consultants, network usage
charges, cost of network products, project travel expenses, rent, repairs and maintenance and electricity charges and all other costs directly
identifiable with the provision of services. This cost excludes an allocation of depreciation and amortization.
Costs of revenues were $479.7 million in fiscal 2005, representing an increase of 32.3% from $362.6 million in fiscal 2004. The constituents
of the various elements of the cost of revenues have been indicated below.
(in $ million)
Fiscal year ended June 30,
2005 2004 2003Personnel costs 280.0 197.4 129.3
Establishment maintenance and communication costs 40.6 29.4 18.6
Travel costs 47.3 33.1 23.9
Others direct costs 111.8 102.7 83.9
Total 479.7 362.6 255.7
Personnel costs increased from $197.4 million in fiscal 2004 to $280.0 million in fiscal 2005 due to a sharp increase in number of billable
employees.
Establishment maintenance cost and communication costs also increased with the setting up of new facilities during the year. In the fiscal
2005, the Company substantially added capacity at its various development facilities. The Company continues to heavily focus on doing
most of its projects from off-shore locations which necessitates the use of long-distance communication links. These costs were at $40.6
million for the fiscal 2005 as compared to $29.4 million in fiscal 2004.
Project related travel includes costs related to foreign travel on software development activities. This increased by 42.9% from $33.1 million
in fiscal 2004 to $47.3 million in fiscal 2005.
Cost of revenues as a percentage of revenues decreased to 62.9% in fiscal 2005 from 63.9% in fiscal 2004.
Management Discussion and Analysis (Contd.)
48 H C L T E C H N O L O G I E S L T D .
Selling, general and administrative expensesSales and marketing expenses consist primarily of cost of sales personnel and expenses relating to travelling, business promotion activities
and provision for doubtful debts. General and administrative expenses consist primarily of management and support personnel costs,
rent expenses relating to marketing offices, communication expenses including expenses incurred in connection with co-ordination between
marketing offices and offshore development centres, travel expenditure other than project and sales related travel and legal and
administrative costs.
These expenses were $109.1 million in fiscal 2005, representing an increase of 21% from $90.2 million in fiscal 2004. The Company has
achieved growth in revenues by leveraging existing sales and marketing infrastructure. The efforts to control selling, general and
administrative expenses have had a very healthy impact on the profitability of the Company. As a percentage of revenues, these expenses
have fallen to 14.3% as compared to 15.9% in the previous fiscal.
Depreciation and AmortizationDepreciation and amortization was $33.6 million in fiscal 2005 as compared to $25.1 million in 2004. This increase was primarily because of
increased depreciation charges due to substantial infrastructure additions to fixed assets in fiscal 2005.
Income from OperationsAs a result of the foregoing factors, income from operations was $139.7 million in fiscal 2005, representing an increase of 55.7% from $89.7
million in fiscal 2004. Income from operations as a percentage of net revenues increased to 18.3% in fiscal 2005 from 15.8% in fiscal 2004.
Other Income, netOther income, net was $24.1 million in fiscal 2005 as compared to the $106.5 million in fiscal 2004. A substantial part of the other income in
fiscal 2004, to the tune of $ 67.1 million came from profit on the divestment of stake in HCL Perot Systems B.V.(HPS), a joint venture entity
to Perot System Corporation (PSC). Other income for the fiscal under review comprises primarily of interest and dividend income as also
profit on sale of investment securities made as a part of deployment of surplus funds. The Company's investments were primarily in debt-
based Indian mutual funds, fixed income securities of development financial institutions, public sector units and banks, rated AAA/P1+/
A1+, or equivalent. The yields on the Company's liquid assets have been progressively coming down primarily due to a drop in the interest
rates in the Indian economic environment.
Income Tax ExpenseIncome tax expense was $15.2 million in 2005 as compared to $8.8 million in fiscal 2004. The individual entities within the Company file
individual tax returns as per regulations existing in their respective countries of domicile.
A substantial portion of the profits of the Company's India operations are exempt from Indian income taxes being profits attributable to
export operations and profits from undertakings situated in Software Technology Parks (STP). Under the tax holiday, the taxpayer can
utilize an exemption from income tax for a period of any ten consecutive years beginning from financials year when the unit started
operations. The tax holiday in all facilities under STPs expire in stages by 2009. The STP period for certain undertakings have expired on
April 1, 2005. During the year ended June 30, 2000, the Company set-up new undertakings in Software Technology Parks for which exemptions
are available till March 2010.
Share of Income of Equity InvesteesShare of loss of equity investees was $0.6 million in fiscal 2005 as compared to loss of $2.1 million in fiscal 2004. This pertains to the losses
incurred in the Company's affiliate companies HCL Answerthink Inc and Diamondhead Ventures LLP.
Minority interestShare of interest of minority holders for the year was $9.9 million in fiscal 2005 as compared to $13.4 million in fiscal 2004. This pertains to
the interests of the minority shareholders in the companies where HCL has a majority stake namely DSL Software Ltd. (100% stake acquired
by HCL during the fiscal year under review) as also HCL Jones Technologies LLC, a joint venture.
Net IncomeAs a result of the foregoing factors, net income was $138.1 million in fiscal 2005 as compared to $171.9 million in fiscal 2004.
Management Discussion and Analysis (Contd.)
A N N U A L R E P O R T 2 0 0 4 - 2 0 0 5 49
Fiscal 2003 compared to Fiscal 2003
RevenueTotal revenues were $567.7 million in fiscal 2004, representing an increase of 36.6% from $415.5 million in fiscal 2003.
Cost of RevenuesCost of revenues was $362.6 million in fiscal 2004, representing an increase of 41.8% from $255.7 million in fiscal 2003.
This increase was due primarily to increase in personnel costs. Personnel costs increased from $129.3 million in fiscal 2003 to $197.4 million
in fiscal 2004 due to a sharp increase in number of billable employees.
Establishment maintenance cost and communication costs also increased with the setting up of new facilities and were at $29.4 million for
the fiscal 2004 as compared to $18.6 million in fiscal 2003.
Project related travel also increased by 38.4% from $23.9 million in fiscal 2003 to $33.1 million in fiscal 2004.
Cost of revenues as a percentage of net revenues increased to 63.9% in fiscal 2004 from 61.5% in fiscal 2003.
Selling, general and administrative expensesThese expenses were $90.2 million in fiscal 2004, representing an increase of 10.8% from $81.5 million in fiscal 2003. The Company has
achieved growth in revenues by leveraging existing sales and marketing infrastructure. The efforts to control selling, general and
administrative expenses have hade a very healthy impact on the profitability of the Company. As a percentage of net revenues, these
expenses have fallen to 15.9% as compared to 19.6% in the previous fiscal.
Depreciation and AmortizationDepreciation and amortization was $25.1 million in fiscal 2004 as compared to $19.0 million in 2003. This increase was primarily because of
increased depreciation charges due to substantial infrastructure additions to fixed assets in fiscal 2004.
Income from OperationsAs a result of the foregoing factors, income from operations was $89.7 million in fiscal 2004, representing an increase of 51.1% from $59.4
million in fiscal 2003. Income from operations as a percentage of net revenues increased to 15.8% in fiscal 2004 from 14.3% in fiscal 2003.
Other Income, netOther income, net was $106.5 million in fiscal 2004, representing an increase of 895.3% from $10.7 million in fiscal 2003. A substantial part
of the other income, to the tune of $ 67.1 million came from profit on the divestment of stake in HPS to PSC. The remaining other income
comprises primarily of interest and dividend income as also profit on sale of investment securities made as a part of deployment of surplus
funds. The Company's investments were primarily in debt-based Indian mutual funds, fixed income securities of development financial
institutions, public sector units and banks, rated AAA/P1+/A1+, or equivalent.
Income Tax ExpenseIncome tax expense was $8.8 million in fiscal 2004 as compared to $6.7million in 2003.
Share of Income of Equity Investees
Share of loss of equity investees was $2.1 million in fiscal 2004 as compared to an income of $1.3 million in fiscal 2003.
Minority interestShare of interest of minority holders for the year was $13.4 million in fiscal 2004 as compared to $6.7 million in fiscal 2003.
Net IncomeAs a result of the foregoing factors, net income was $171.9 million in fiscal 2004, representing a increase of 196.3% from $58.0 million in
fiscal 2003.
Management Discussion and Analysis (Contd.)
50 H C L T E C H N O L O G I E S L T D .
Review of Financial Condition
Cash and cash equivalents
As of June 30, 2005, the Company had $52.4 million in cash and cash equivalents.
Investment SecuritiesInvestment securities consist of available-for-sale debt and equity securities. Available-for-sale securities are carried at fair value based on
quoted market prices. For debt securities where quoted market prices are not available, fair value is determined using pricing techniques
such as discounted cash flow analysis.
The funds deployed by the Company in investment securities were at $404.4 million as of June 30, 2005 as compared to $419.6 million as
of June 30, 2004. The objective of the Company's corporate treasury is primarily governed by the cash flow requirements and need for
liquidity at various maturity buckets. The instruments are selected accordingly for various maturity profiles to strike the optimum balance
between risk and return. The thrust of the Company's treasury policy is to reduce the credit risk concentration in a bid to achieve the
maximum possible safety, while earning moderate returns from the investment of surplus funds.
The portfolio is monitored on a day-to-day basis and reviewed by the treasury management group on a weekly basis. The recommendations
of treasury management group are placed before the investment committee, consisting of senior officials, for decision-making and
investment decisions are taken accordingly. The investment committee also reviews the broad guidelines and broad parameters on a
regular basis. The Company has a strong back office support to maintain internal controls and financial discipline over the investment
process and its implementation.
The Company believes that its cash balances and liquid assets, cash generated from future operations and its existing credit facilities will
be adequate to satisfy anticipated working capital requirements, capital expenditures and investment commitments for the next twelve
months.
Accounts receivablesAccounts receivables (net of provision for uncollectible receivables) including unbilled receivables as of June 30, 2005 stood at $147.0
million as compared to $107.1 million as of June 30, 2004.
The Company maintains an allowance for uncollectible receivables based on the trade receivables at the end of the year. Factors utilized by
management in determining the adequacy of the allowance include the present and prospective financial condition of the debtor and the
aging of the trade receivables. Allowance for uncollectible receivables aggregated $11.7 million and $5.6 million as of June 30, 2004 and
2005 respectively. The charge to the statement of income with respect to uncollectible receivables was $1.8 million for the year ended June
30, 2005.
Debtors at 19.3% of revenues for the year ended June 30, 2005 represented an outstanding of 70 days as compared to 18.8% for the year
ended June 30, 2004 (69 days).
Investment in affiliates
The Company accounts for investments by the equity method where its investment in the voting stock gives it the ability to exercise
significant influence over the affiliate. The excess of the cost over the underlying net equity of investments in affiliates is allocated to
identifiable assets based on the fair value at the date of acquisition. The unassigned residual value of the excess of the cost over the
underlying net equity is recognized as goodwill. The Company's equity in the profits/losses of affiliates is included in the consolidated
statements of income, unless the carrying amount of an investment is reduced to zero and the Company is under no guaranteed obligation
or otherwise committed to provide further financial support. The Company's share of net assets of affiliates is included in the consolidated
balance sheets.
The Company has equity investments in the following companies / partnership firms, which are accounted for under the equity method:
HCL Answerthink Inc (HCLA)The Company holds a 50% interest in this joint venture entity with Answerthink Inc., USA. The carrying value of the investment in this joint
venture was $0.1million as of June 30, 2005. The Company's equity in the loss of HCLA was nil for the year ended June 30, 2005.
Management Discussion and Analysis (Contd.)
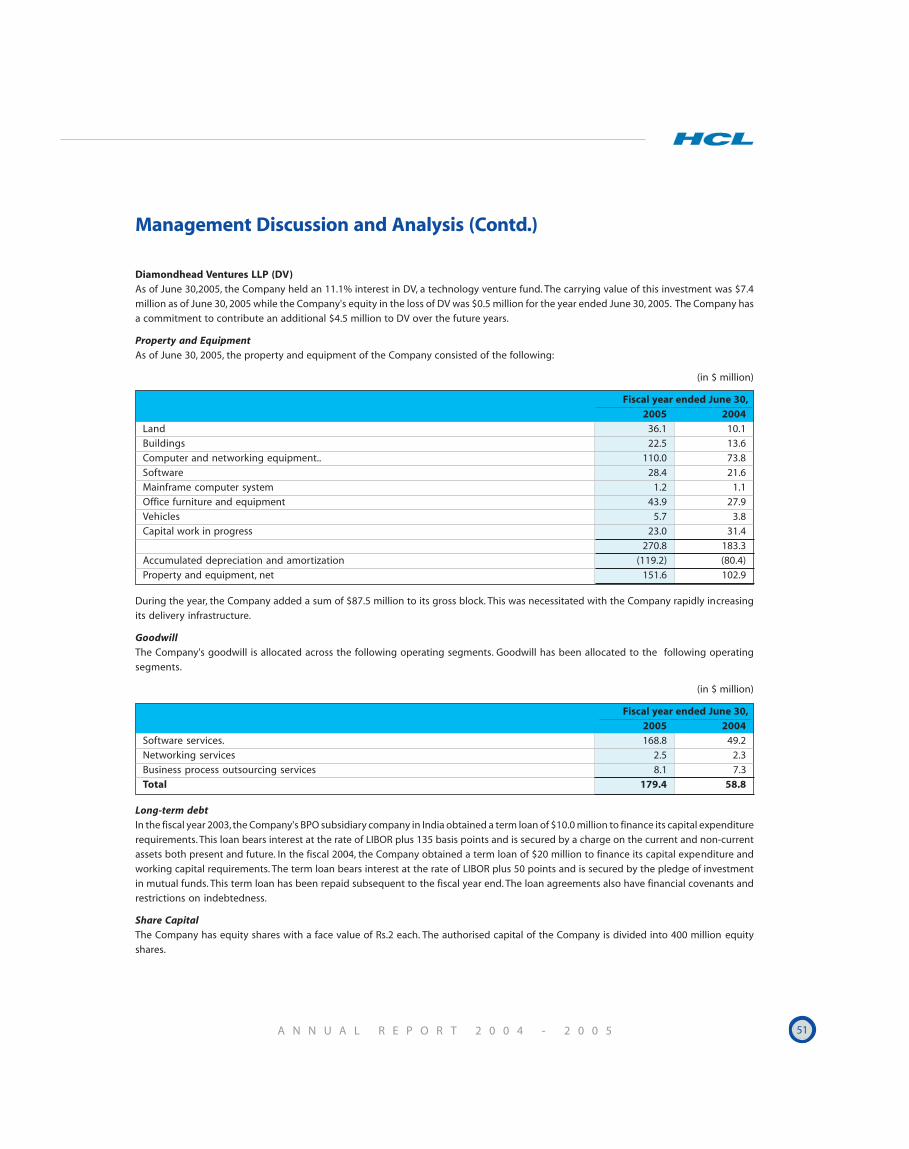
A N N U A L R E P O R T 2 0 0 4 - 2 0 0 5 51
Diamondhead Ventures LLP (DV)As of June 30,2005, the Company held an 11.1% interest in DV, a technology venture fund. The carrying value of this investment was $7.4
million as of June 30, 2005 while the Company's equity in the loss of DV was $0.5 million for the year ended June 30, 2005. The Company has
a commitment to contribute an additional $4.5 million to DV over the future years.
Property and EquipmentAs of June 30, 2005, the property and equipment of the Company consisted of the following:
(in $ million)
Fiscal year ended June 30,
2005 2004Land 36.1 10.1
Buildings 22.5 13.6
Computer and networking equipment.. 110.0 73.8
Software 28.4 21.6
Mainframe computer system 1.2 1.1
Office furniture and equipment 43.9 27.9
Vehicles 5.7 3.8
Capital work in progress 23.0 31.4
270.8 183.3
Accumulated depreciation and amortization (119.2) (80.4)
Property and equipment, net 151.6 102.9
During the year, the Company added a sum of $87.5 million to its gross block. This was necessitated with the Company rapidly increasing
its delivery infrastructure.
GoodwillThe Company's goodwill is allocated across the following operating segments. Goodwill has been allocated to the following operating
segments.
(in $ million)
Fiscal year ended June 30,2005 2004
Software services. 168.8 49.2
Networking services 2.5 2.3
Business process outsourcing services 8.1 7.3
Total 179.4 58.8
Long-term debtIn the fiscal year 2003, the Company's BPO subsidiary company in India obtained a term loan of $10.0 million to finance its capital expenditure
requirements. This loan bears interest at the rate of LIBOR plus 135 basis points and is secured by a charge on the current and non-current
assets both present and future. In the fiscal 2004, the Company obtained a term loan of $20 million to finance its capital expenditure and
working capital requirements. The term loan bears interest at the rate of LIBOR plus 50 points and is secured by the pledge of investment
in mutual funds. This term loan has been repaid subsequent to the fiscal year end. The loan agreements also have financial covenants and
restrictions on indebtedness.
Share CapitalThe Company has equity shares with a face value of Rs.2 each. The authorised capital of the Company is divided into 400 million equity
shares.
Management Discussion and Analysis (Contd.)
52 H C L T E C H N O L O G I E S L T D .
During the year, the issued, subscribed and outstanding shares of the Company increased by 23.2 million. This was consequent to a) the
Company making a preferential allotment of 19.4 million shares to Deutsche Bank in lieu of the Company acquiring the balance 49% stake
in DSI Financial Solutions Pte b) the exercise of 3.8 million shares by employees under the stock option plans.
Dividend Policy
In view of the improved strength of the balance sheet supported by a better visibility of revenues and cash flow streams, the Board of the
Company initiated in April 2003, a practice of considering of quarterly dividends, subject to adequacy of profits and compliance with all
applicable legal requirements.
Liquidity and Capital Resources
Cash Flows from Operating ActivitiesNet cash provided by operating activities increased to $140.8 million in 2005 from $104.7 million in fiscal 2004. The Company has been
financing its working capital needs primarily through internally generated funds. The increase in cash generated from operations was
primarily because of a sharp increase in profitability in the current fiscal. The accounts receivable at the end of fiscal 2005 increased by
$29.6 million as compared to that at the end of fiscal 2004. The increase in accounts receivable is due to an increase in the size of operations
of the Company with the Days of Sales Outstanding remaining almost constant.
Cash Flows from Investing ActivitiesNet cash used in investing activities was $28.4 million and $67.4 million in fiscal 2005 and 2004 respectively. Cash used in investing activities
in fiscal 2005 consisted primarily of $69.9 million used to purchase property and equipment and a sum of $11.6 million used for investment
in business affiliates and payment for business acquisitions. A net sum of $52.7 million was generated from sale of investments.
Cash Flows from Financing ActivitiesNet cash used by financing activities was $114.3 million in 2005 as compared to $23.0 million in 2004.
During the current fiscal, the Company had an outflow of $126.7 million related to payments of dividends to its shareholders.
During the current fiscal, the Company also repayed a short term loan of $2.8 million. A sum of $16.0 million was received by the Company
as proceeds from issuance of equity shares to its employees under Employee Stock Option Schemes.
Risk factors
The key risk factors for the Company are as follows:
Internal Risks
• Business concentration risks
• Mergers and Acquisitions (M & A) execution risks
• Investment portfolio-related risks
External risks
• Competition-related risk
• Employee-related risks
• Technology-related risks
• Currency risk related to fluctuations in the foreign exchange rate
• Geo-political risks
• Risks related to the operating environment
Internal RisksBusiness concentration risksThe Company has taken steps to ensure that it does not become too dependent on any particular set of clients, specific service lines or any
particular geography.
Management Discussion and Analysis (Contd.)
A N N U A L R E P O R T 2 0 0 4 - 2 0 0 5 53
The Company gets its revenues from a total of around 500 clients to ensure this. Given the position of the American continent as the largest
IT spender in the world, a large portion of the Company's revenues comes from this geography. However, conscious efforts are being made
to reduce this dependence. Non-US revenues as a percentage of the total revenues of the Company have been steadily increasing over the
years. The share of non-US revenues for the year under review has gone up to 40.6% from 39% in the previous year.
A very high dependence on certain segments of the IT services market may also pose certain risks in the event of a slowdown impacting
such segments. The Company had recognised this factor and had undertaken multiple initiatives during the fiscal year June 30, 2002 to
rebalance its business portfolio. As a result of these initiatives, the Company has managed to reduce its dependence on its traditional
stronghold of product engineering and now has substantial revenues now coming in from end user applications, business process
outsourcing and infrastructure management services.
M & A execution risksThe Company has been growing on the back of a strategy which leverages both the organic as well as the inorganic route and has undertaken
a series of acquisitions in the previous three fiscal periods. The Company naturally faces a risk with respect to its merger and acquisition
related transactions. The risk exposures in this area are as follows:
a) increase in cost on account of staffing/advisory fees to consultants
b) lapses in due diligence
c) difficulties in integration of acquired entities within the operational fabric
The Company follows a very structured approach in pursuance of its M & A strategy. Many of the risks are mitigated by restricting the
choice of target companies by applying certain rigorous selection criteria as also by proper resourcing of the integration effort.
Investment portfolio related risks
The primary area of risk for the Company's market exposures are related to the interest rate risk on its investment securities. To mitigate
interest rate risk, all surplus funds are invested in avenues upon a review by the investment committee. However, the guiding principles of
all investment decision are safety of investments, followed by liquidity and returns.
External Risks
Competition-related riskThe Indian IT services market remains a very competitive space. The Company is facing competition not only from other large Indian IT
vendors but also global vendors who are increasing their India presence given the popularity of the Indian offshore model.
To maintain its competitive edge in this landscape, the Company has been making significant investment in software engineering processes
and offshore methodologies. All of the Company's software development centres are ISO 9001 certified. Most of the Company's centers
have also obtained Capability Maturity Model (CMM) Level 4 or Level 5 accreditation. The Company has also built a world class sales and
marketing infrastructure to service its global clientele. To achieve maximum penetration within the various target markets with a high
degree of sensitivity to the culture and needs of the local market, the Company has established local companies in each important country.
The Company believes that its rigorous, research oriented approach to identify, qualify and develop relationship has been a key differentiator
in the market place.
Employee-related risksFor any software services company, its human capital is its primary asset. With increase in competitive pressures in the marketplace, the
Company faces the risk of losing key human talent which can impact execution of its projects. To address this, the Company has put in place
all requisite initiatives to ensure that it remains an employer of choice within the competitive landscape. The Company continues to focus
on several training and development initiatives to ensure that its human resource base is kept abreast of the latest developments in
information technology.
Exchange rate riskThe functional currencies for the Company's operations are the respective currencies of the countries in which it operates. Substantially all
of its revenues are generated in U.S. dollars and to a lesser extent, certain European and Asian currencies, while most of its expenses are
incurred in Indian rupees and to a lesser extent, U.S. dollars. As described above, a substantial amount of its investments is held in Indian
Management Discussion and Analysis (Contd.)
54 H C L T E C H N O L O G I E S L T D .
rupees. It also holds investments in certain countries, consisting primarily of investments by its subsidiaries, which are denominated in the
local currency. It is therefore subject to the effects of exchange rate fluctuations between these currencies.
Since the previous fiscal year, the Company has started taking foreign exchange forward covers to hedge completely against foreign
currency fluctuations related to its billed receivables and forecast revenues. The Company does not speculate in foreign currency.
There is some foreign exchange risk which arises from accounts payable to overseas vendors. This risk is partially mitigated as the Company
has receipts in foreign currency from overseas customers and holds some of its cash in foreign currency bank accounts.
Technology-related risksThe Company does not depend on any specific technology and has competencies in a wide variety of software operating environments.
This ensures that it diversifies its technology-related risks as also offer the customers the choice of any technology or platform they are
comfortable with.
Geo-political risksThe Indian subcontinent has seen recurrences of some forms of hostilities between India and Pakistan. There has also been a lot of civil
unrest in other countries of the Asian continent with proximity to India. These can have negative implications for the operations of the
Company. To mitigate these risks and to ensure continued delivery of services to clients irrespective of any geo-political disturbances, the
Company has made adequate investments in disaster recovery and business continuity systems.
Management Discussion and Analysis (Contd.)
A N N U A L R E P O R T 2 0 0 4 - 2 0 0 5 55
HCL TECHNOLOGIES LIMITED
CONSOLIDATED FINANCIAL STATEMENTSAS OF JUNE 30, 2004 AND 2005
AND FOR THE THREE YEARS ENDED JUNE 30, 2005TOGETHER WITH REPORT OF INDEPENDENT AUDITORS
56 H C L T E C H N O L O G I E S L T D .
INDEPENDENT AUDITORS' REPORT
To,
The Board of Directors of HCL Technologies Limited
In our opinion, the accompanying Consolidated Balance Sheets and the related
Consolidated Statements of Income, Stockholders' Equity and Cash Flows present fairly,
in all material respects, the financial position of HCL Technologies Limited and subsidiaries
as at June 30, 2004 and June 30, 2005, and the results of their operations and their cash
flows for the years then ended in conformity with accounting principles generally
accepted in the United States of America. These financial statements are the responsibility
of the Company's management; our responsibility is to express an opinion on these
financial statements based on our audits. We conducted our audits of these statements
in accordance with auditing standards generally accepted in the United States of America,
which require that we plan and perform the audit to obtain reasonable assurance about
whether the financial statements are free of material misstatement. An audit includes
examining, on a test basis, evidence supporting the amounts and disclosures in the
financial statements, assessing the accounting principles used and significant estimates
made by management, and evaluating the overall financial statement presentation. We
believe that our audits provide a reasonable basis for our opinion. The financial statements
of the Company for the year ended June 30, 2003, prior to the adjustment described in
Note 29 and retroactive consolidation of Professional Service Organisation Division of
HCL Infosystems Limited, a company under common control as the Company, as described
in Note 9, were audited by other independent accountants whose report, dated
September 11, 2003 expressed an unqualified opinion on those statements. We also
audited the adjustments described in Note 29 that were applied to adjust the financial
statements for the year ended June 30, 2003. In our opinion, such adjustments are
appropriate and have been properly applied to the prior period financial statements.
PRICE WATERHOUSE
New Delhi, India
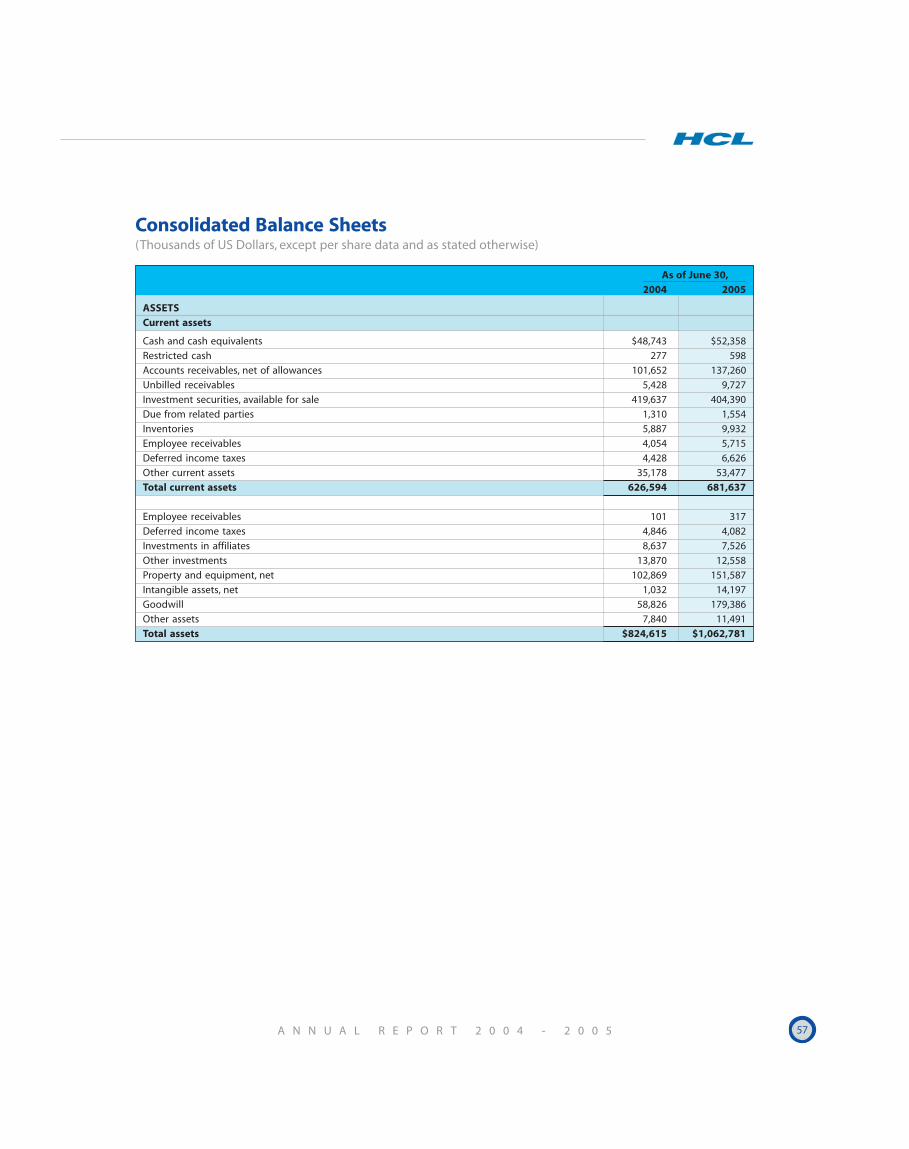
A N N U A L R E P O R T 2 0 0 4 - 2 0 0 5 57
Consolidated Balance Sheets(Thousands of US Dollars, except per share data and as stated otherwise)
As of June 30,
2004 2005
ASSETSCurrent assets
Cash and cash equivalents $48,743 $52,358
Restricted cash 277 598
Accounts receivables, net of allowances 101,652 137,260
Unbilled receivables 5,428 9,727
Investment securities, available for sale 419,637 404,390
Due from related parties 1,310 1,554
Inventories 5,887 9,932
Employee receivables 4,054 5,715
Deferred income taxes 4,428 6,626
Other current assets 35,178 53,477
Total current assets 626,594 681,637
Employee receivables 101 317
Deferred income taxes 4,846 4,082
Investments in affiliates 8,637 7,526
Other investments 13,870 12,558
Property and equipment, net 102,869 151,587
Intangible assets, net 1,032 14,197
Goodwill 58,826 179,386
Other assets 7,840 11,491
Total assets $824,615 $1,062,781
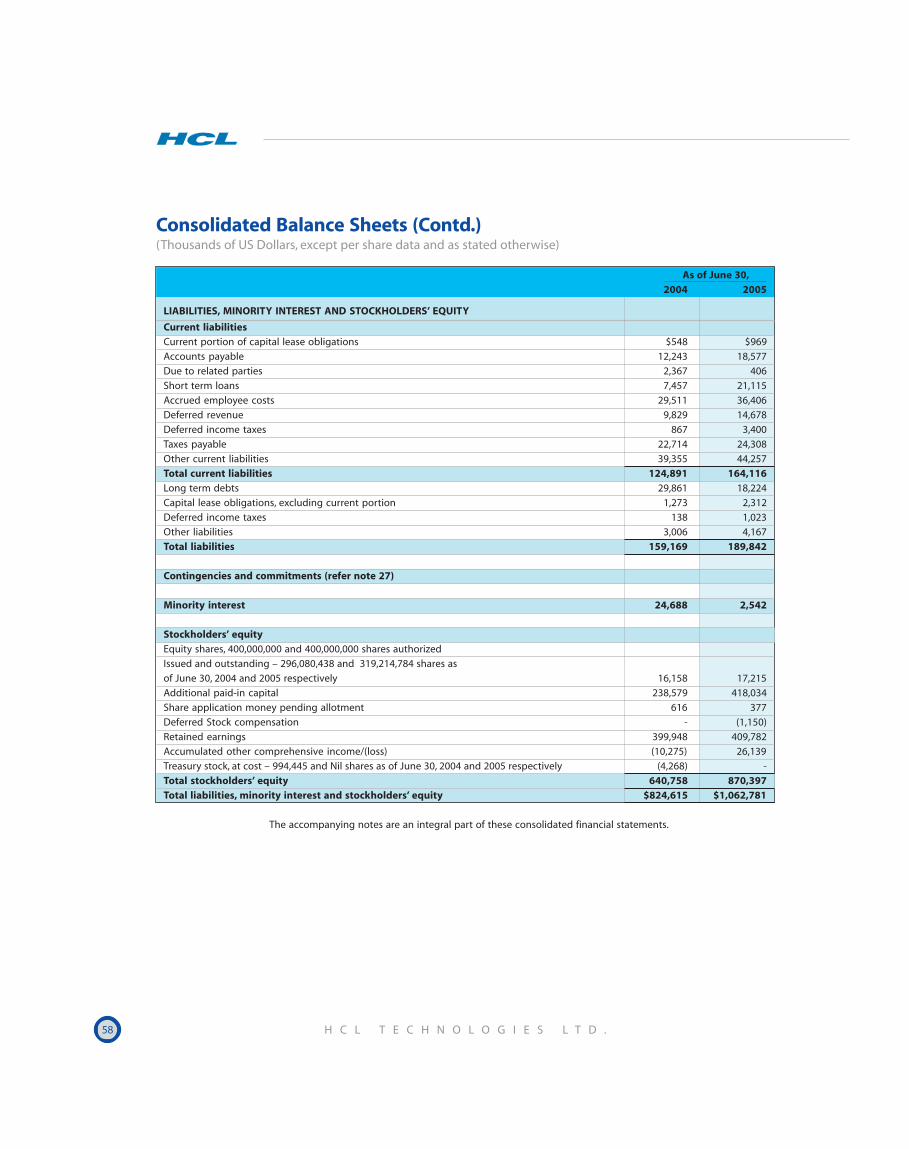
58 H C L T E C H N O L O G I E S L T D .
Consolidated Balance Sheets (Contd.)(Thousands of US Dollars, except per share data and as stated otherwise)
As of June 30,
2004 2005
LIABILITIES, MINORITY INTEREST AND STOCKHOLDERS’ EQUITY
Current liabilitiesCurrent portion of capital lease obligations $548 $969
Accounts payable 12,243 18,577
Due to related parties 2,367 406
Short term loans 7,457 21,115
Accrued employee costs 29,511 36,406
Deferred revenue 9,829 14,678
Deferred income taxes 867 3,400
Taxes payable 22,714 24,308
Other current liabilities 39,355 44,257
Total current liabilities 124,891 164,116Long term debts 29,861 18,224
Capital lease obligations, excluding current portion 1,273 2,312
Deferred income taxes 138 1,023
Other liabilities 3,006 4,167
Total liabilities 159,169 189,842
Contingencies and commitments (refer note 27)
Minority interest 24,688 2,542
Stockholders’ equityEquity shares, 400,000,000 and 400,000,000 shares authorized
Issued and outstanding – 296,080,438 and 319,214,784 shares as
of June 30, 2004 and 2005 respectively 16,158 17,215
Additional paid-in capital 238,579 418,034
Share application money pending allotment 616 377
Deferred Stock compensation - (1,150)
Retained earnings 399,948 409,782
Accumulated other comprehensive income/(loss) (10,275) 26,139
Treasury stock, at cost – 994,445 and Nil shares as of June 30, 2004 and 2005 respectively (4,268) -
Total stockholders’ equity 640,758 870,397Total liabilities, minority interest and stockholders’ equity $824,615 $1,062,781
The accompanying notes are an integral part of these consolidated financial statements.
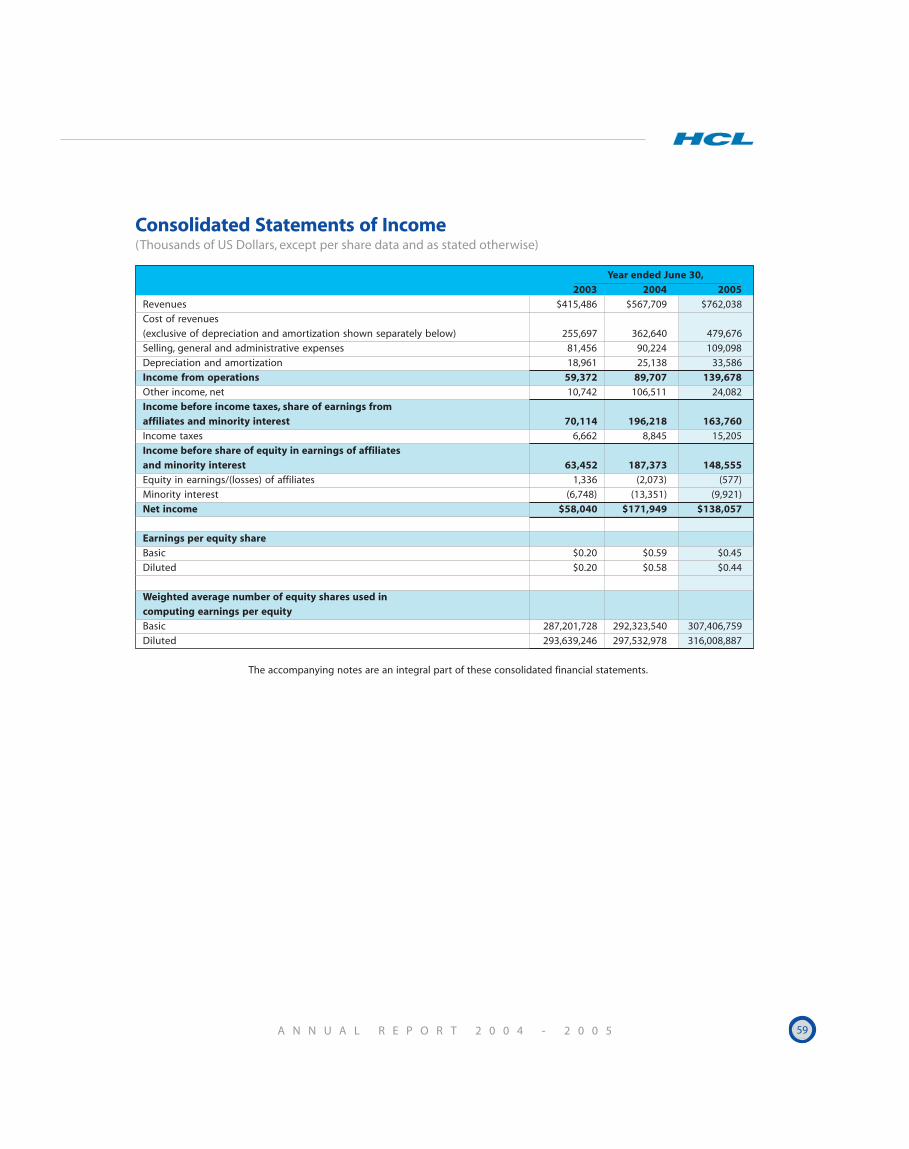
A N N U A L R E P O R T 2 0 0 4 - 2 0 0 5 59
Consolidated Statements of Income(Thousands of US Dollars, except per share data and as stated otherwise)
Year ended June 30,
2003 2004 2005Revenues $415,486 $567,709 $762,038
Cost of revenues
(exclusive of depreciation and amortization shown separately below) 255,697 362,640 479,676
Selling, general and administrative expenses 81,456 90,224 109,098
Depreciation and amortization 18,961 25,138 33,586
Income from operations 59,372 89,707 139,678Other income, net 10,742 106,511 24,082
Income before income taxes, share of earnings fromaffiliates and minority interest 70,114 196,218 163,760Income taxes 6,662 8,845 15,205
Income before share of equity in earnings of affiliatesand minority interest 63,452 187,373 148,555Equity in earnings/(losses) of affiliates 1,336 (2,073) (577)
Minority interest (6,748) (13,351) (9,921)
Net income $58,040 $171,949 $138,057
Earnings per equity shareBasic $0.20 $0.59 $0.45
Diluted $0.20 $0.58 $0.44
Weighted average number of equity shares used incomputing earnings per equityBasic 287,201,728 292,323,540 307,406,759
Diluted 293,639,246 297,532,978 316,008,887
The accompanying notes are an integral part of these consolidated financial statements.
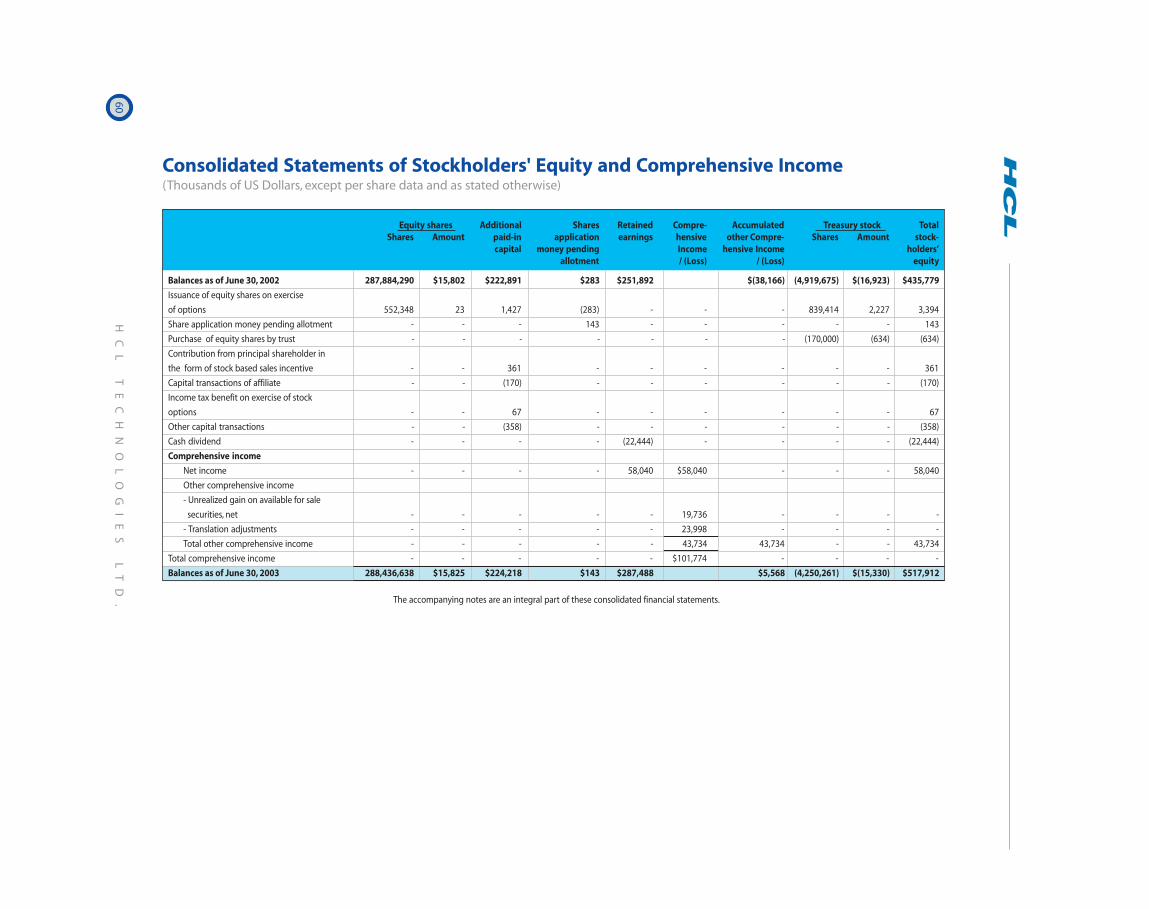
60H
CL
T
EC
HN
OL
OG
IE
S
LT
D.
Consolidated Statements of Stockholders' Equity and Comprehensive Income(Thousands of US Dollars, except per share data and as stated otherwise)
Equity shares Additional Shares Retained Compre- Accumulated Treasury stock TotalShares Amount paid-in application earnings hensive other Compre- Shares Amount stock-
capital money pending Income hensive Income holders’allotment / (Loss) / (Loss) equity
Balances as of June 30, 2002 287,884,290 $15,802 $222,891 $283 $251,892 $(38,166) (4,919,675) $(16,923) $435,779
Issuance of equity shares on exercise
of options 552,348 23 1,427 (283) - - - 839,414 2,227 3,394
Share application money pending allotment - - - 143 - - - - - 143
Purchase of equity shares by trust - - - - - - - (170,000) (634) (634)
Contribution from principal shareholder in
the form of stock based sales incentive - - 361 - - - - - - 361
Capital transactions of affiliate - - (170) - - - - - - (170)
Income tax benefit on exercise of stock
options - - 67 - - - - - - 67
Other capital transactions - - (358) - - - - - - (358)
Cash dividend - - - - (22,444) - - - - (22,444)
Comprehensive income
Net income - - - - 58,040 $58,040 - - - 58,040
Other comprehensive income
- Unrealized gain on available for sale
securities, net - - - - - 19,736 - - - -
- Translation adjustments - - - - - 23,998 - - - -
Total other comprehensive income - - - - - 43,734 43,734 - - 43,734
Total comprehensive income - - - - - $101,774 - - - -
Balances as of June 30, 2003 288,436,638 $15,825 $224,218 $143 $287,488 $5,568 (4,250,261) $(15,330) $517,912
The accompanying notes are an integral part of these consolidated financial statements.
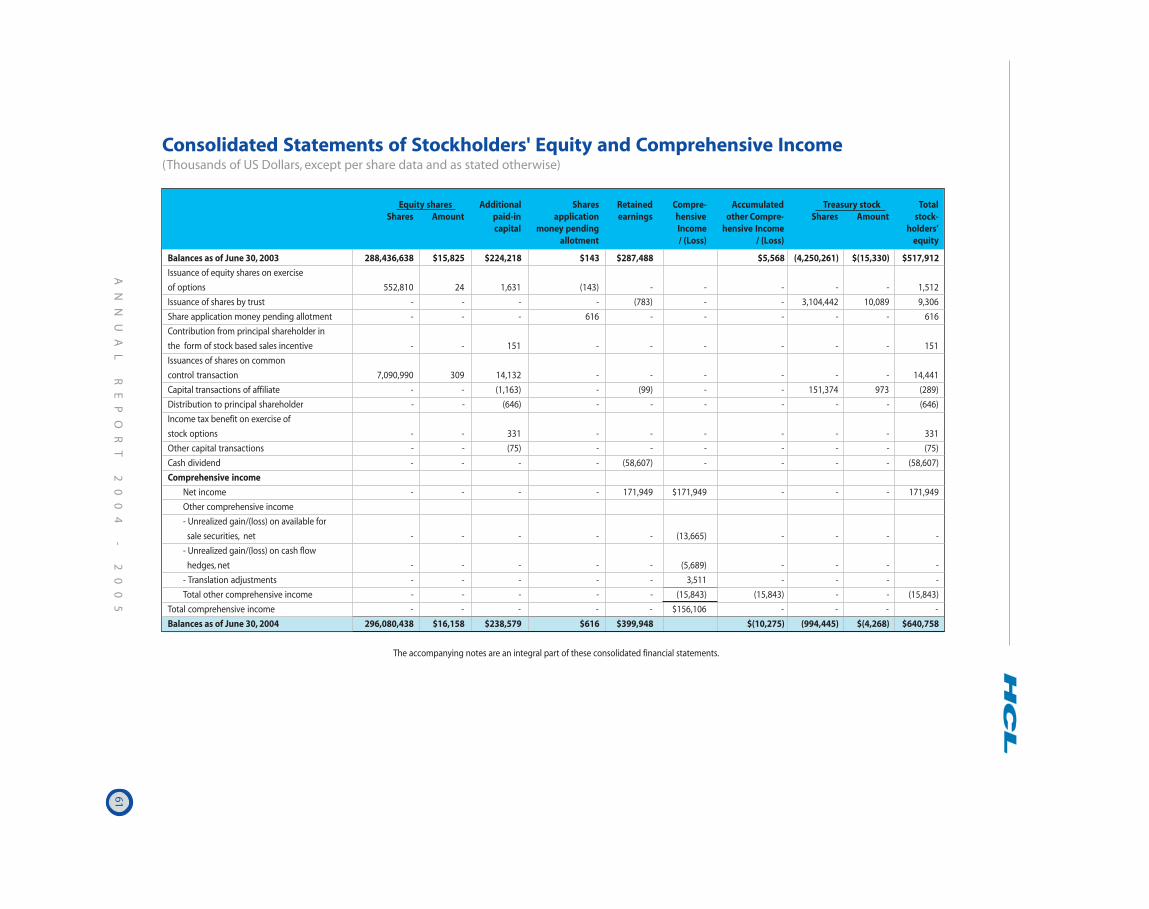
AN
NU
AL
R
EP
OR
T
20
04
-
2
00
561
Consolidated Statements of Stockholders' Equity and Comprehensive Income(Thousands of US Dollars, except per share data and as stated otherwise)
Equity shares Additional Shares Retained Compre- Accumulated Treasury stock TotalShares Amount paid-in application earnings hensive other Compre- Shares Amount stock-
capital money pending Income hensive Income holders’allotment / (Loss) / (Loss) equity
Balances as of June 30, 2003 288,436,638 $15,825 $224,218 $143 $287,488 $5,568 (4,250,261) $(15,330) $517,912
Issuance of equity shares on exercise
of options 552,810 24 1,631 (143) - - - - - 1,512
Issuance of shares by trust - - - - (783) - - 3,104,442 10,089 9,306
Share application money pending allotment - - - 616 - - - - - 616
Contribution from principal shareholder in
the form of stock based sales incentive - - 151 - - - - - - 151
Issuances of shares on common
control transaction 7,090,990 309 14,132 - - - - - - 14,441
Capital transactions of affiliate - - (1,163) - (99) - - 151,374 973 (289)
Distribution to principal shareholder - - (646) - - - - - - (646)
Income tax benefit on exercise of
stock options - - 331 - - - - - - 331
Other capital transactions - - (75) - - - - - - (75)
Cash dividend - - - - (58,607) - - - - (58,607)
Comprehensive income
Net income - - - - 171,949 $171,949 - - - 171,949
Other comprehensive income
- Unrealized gain/(loss) on available for
sale securities, net - - - - - (13,665) - - - -
- Unrealized gain/(loss) on cash flow
hedges, net - - - - - (5,689) - - - -
- Translation adjustments - - - - - 3,511 - - - -
Total other comprehensive income - - - - - (15,843) (15,843) - - (15,843)
Total comprehensive income - - - - - $156,106 - - - -
Balances as of June 30, 2004 296,080,438 $16,158 $238,579 $616 $399,948 $(10,275) (994,445) $(4,268) $640,758
The accompanying notes are an integral part of these consolidated financial statements.
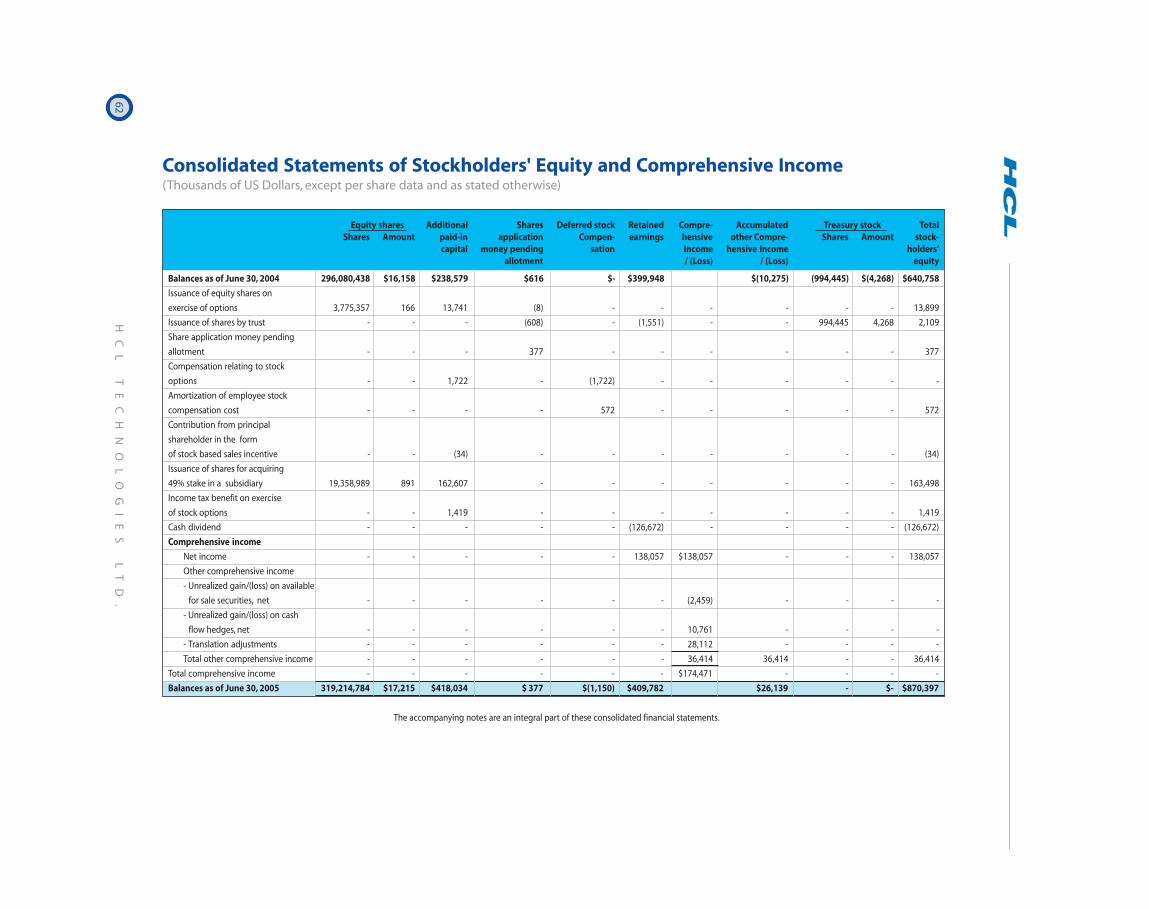
62H
CL
T
EC
HN
OL
OG
IE
S
LT
D.
Consolidated Statements of Stockholders' Equity and Comprehensive Income(Thousands of US Dollars, except per share data and as stated otherwise)
Equity shares Additional Shares Deferred stock Retained Compre- Accumulated Treasury stock TotalShares Amount paid-in application Compen- earnings hensive other Compre- Shares Amount stock-
capital money pending sation Income hensive Income holders’allotment / (Loss) / (Loss) equity
Balances as of June 30, 2004 296,080,438 $16,158 $238,579 $616 $- $399,948 $(10,275) (994,445) $(4,268) $640,758
Issuance of equity shares on
exercise of options 3,775,357 166 13,741 (8) - - - - - - 13,899
Issuance of shares by trust - - - (608) - (1,551) - - 994,445 4,268 2,109
Share application money pending
allotment - - - 377 - - - - - - 377
Compensation relating to stock
options - - 1,722 - (1,722) - - - - - -
Amortization of employee stock
compensation cost - - - - 572 - - - - - 572
Contribution from principal
shareholder in the form
of stock based sales incentive - - (34) - - - - - - - (34)
Issuance of shares for acquiring
49% stake in a subsidiary 19,358,989 891 162,607 - - - - - - - 163,498
Income tax benefit on exercise
of stock options - - 1,419 - - - - - - - 1,419
Cash dividend - - - - - (126,672) - - - - (126,672)
Comprehensive income
Net income - - - - - 138,057 $138,057 - - - 138,057
Other comprehensive income
- Unrealized gain/(loss) on available
for sale securities, net - - - - - - (2,459) - - - -
- Unrealized gain/(loss) on cash
flow hedges, net - - - - - - 10,761 - - - -
- Translation adjustments - - - - - - 28,112 - - - -
Total other comprehensive income - - - - - - 36,414 36,414 - - 36,414
Total comprehensive income - - - - - - $174,471 - - - -
Balances as of June 30, 2005 319,214,784 $17,215 $418,034 $ 377 $(1,150) $409,782 $26,139 - $- $870,397
The accompanying notes are an integral part of these consolidated financial statements.
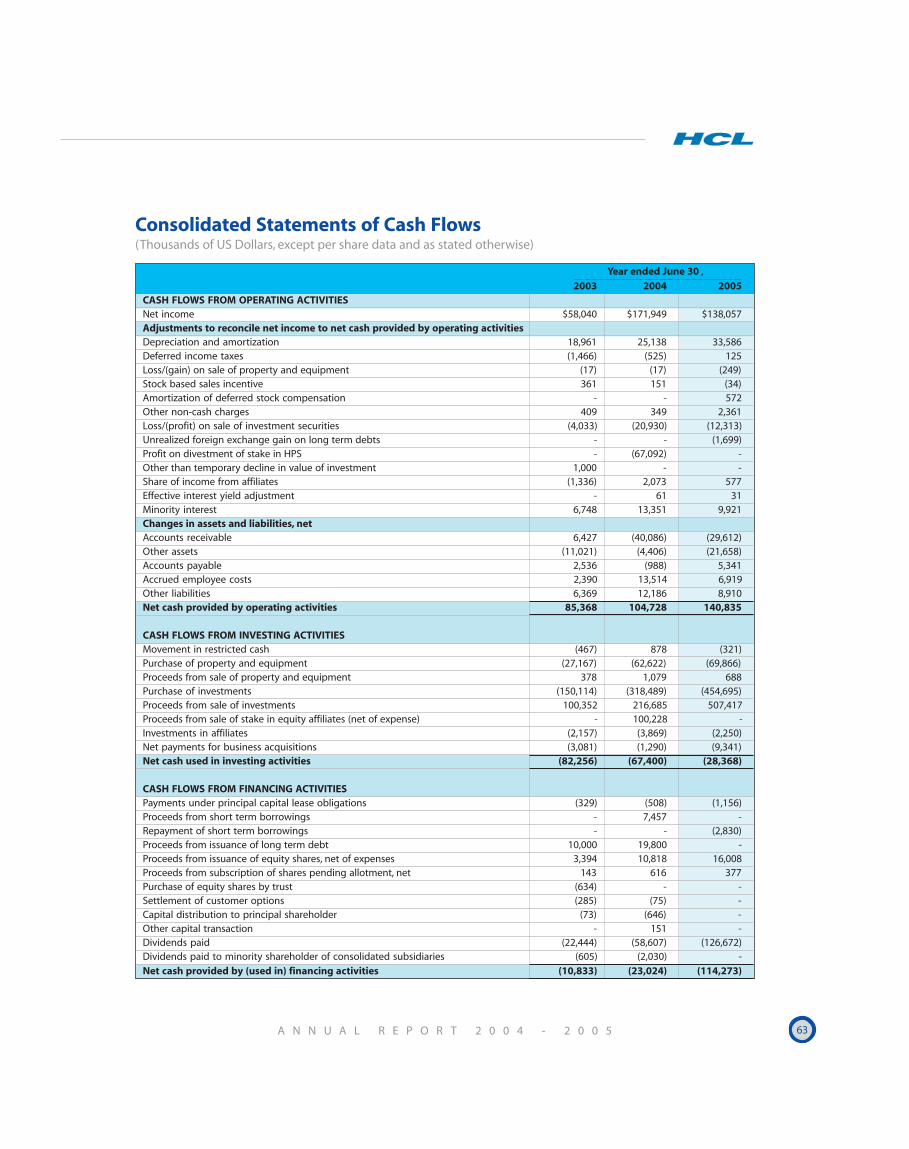
A N N U A L R E P O R T 2 0 0 4 - 2 0 0 5 63
Consolidated Statements of Cash Flows(Thousands of US Dollars, except per share data and as stated otherwise)
Year ended June 30 ,2003 2004 2005
CASH FLOWS FROM OPERATING ACTIVITIESNet income $58,040 $171,949 $138,057Adjustments to reconcile net income to net cash provided by operating activitiesDepreciation and amortization 18,961 25,138 33,586Deferred income taxes (1,466) (525) 125Loss/(gain) on sale of property and equipment (17) (17) (249)Stock based sales incentive 361 151 (34)Amortization of deferred stock compensation - - 572Other non-cash charges 409 349 2,361Loss/(profit) on sale of investment securities (4,033) (20,930) (12,313)Unrealized foreign exchange gain on long term debts - - (1,699)Profit on divestment of stake in HPS - (67,092) -Other than temporary decline in value of investment 1,000 - -Share of income from affiliates (1,336) 2,073 577Effective interest yield adjustment - 61 31Minority interest 6,748 13,351 9,921Changes in assets and liabilities, netAccounts receivable 6,427 (40,086) (29,612)Other assets (11,021) (4,406) (21,658)Accounts payable 2,536 (988) 5,341Accrued employee costs 2,390 13,514 6,919Other liabilities 6,369 12,186 8,910Net cash provided by operating activities 85,368 104,728 140,835
CASH FLOWS FROM INVESTING ACTIVITIESMovement in restricted cash (467) 878 (321)Purchase of property and equipment (27,167) (62,622) (69,866)Proceeds from sale of property and equipment 378 1,079 688Purchase of investments (150,114) (318,489) (454,695)Proceeds from sale of investments 100,352 216,685 507,417Proceeds from sale of stake in equity affiliates (net of expense) - 100,228 -Investments in affiliates (2,157) (3,869) (2,250)Net payments for business acquisitions (3,081) (1,290) (9,341)Net cash used in investing activities (82,256) (67,400) (28,368)
CASH FLOWS FROM FINANCING ACTIVITIESPayments under principal capital lease obligations (329) (508) (1,156)Proceeds from short term borrowings - 7,457 -Repayment of short term borrowings - - (2,830)Proceeds from issuance of long term debt 10,000 19,800 -Proceeds from issuance of equity shares, net of expenses 3,394 10,818 16,008Proceeds from subscription of shares pending allotment, net 143 616 377Purchase of equity shares by trust (634) - -Settlement of customer options (285) (75) -Capital distribution to principal shareholder (73) (646) -Other capital transaction - 151 -Dividends paid (22,444) (58,607) (126,672)Dividends paid to minority shareholder of consolidated subsidiaries (605) (2,030) -
Net cash provided by (used in) financing activities (10,833) (23,024) (114,273)
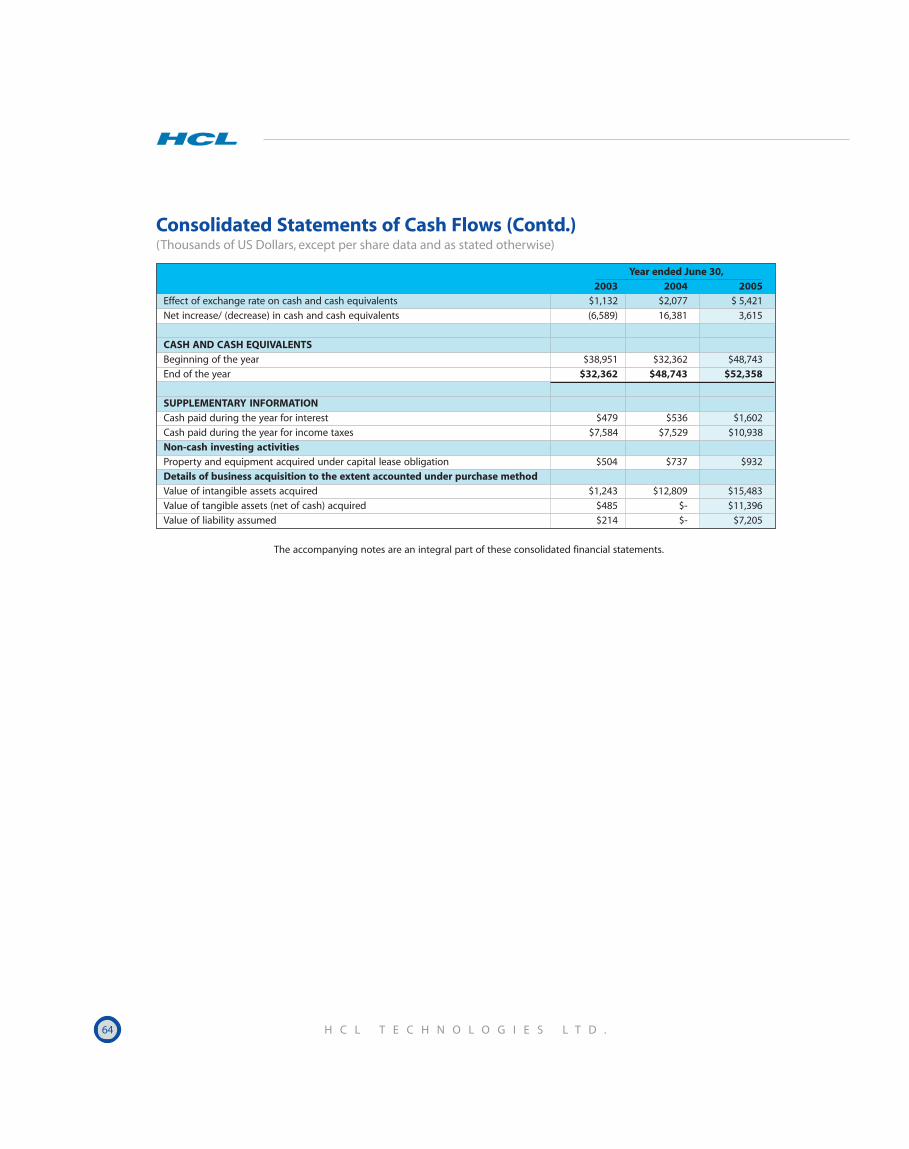
64 H C L T E C H N O L O G I E S L T D .
Effect of exchange rate on cash and cash equivalents $1,132 $2,077 $ 5,421
Net increase/ (decrease) in cash and cash equivalents (6,589) 16,381 3,615
CASH AND CASH EQUIVALENTSBeginning of the year $38,951 $32,362 $48,743
End of the year $32,362 $48,743 $52,358
SUPPLEMENTARY INFORMATIONCash paid during the year for interest $479 $536 $1,602
Cash paid during the year for income taxes $7,584 $7,529 $10,938
Non-cash investing activitiesProperty and equipment acquired under capital lease obligation $504 $737 $932
Details of business acquisition to the extent accounted under purchase methodValue of intangible assets acquired $1,243 $12,809 $15,483
Value of tangible assets (net of cash) acquired $485 $- $11,396
Value of liability assumed $214 $- $7,205
The accompanying notes are an integral part of these consolidated financial statements.
Consolidated Statements of Cash Flows (Contd.)(Thousands of US Dollars, except per share data and as stated otherwise)
Year ended June 30,2003 2004 2005
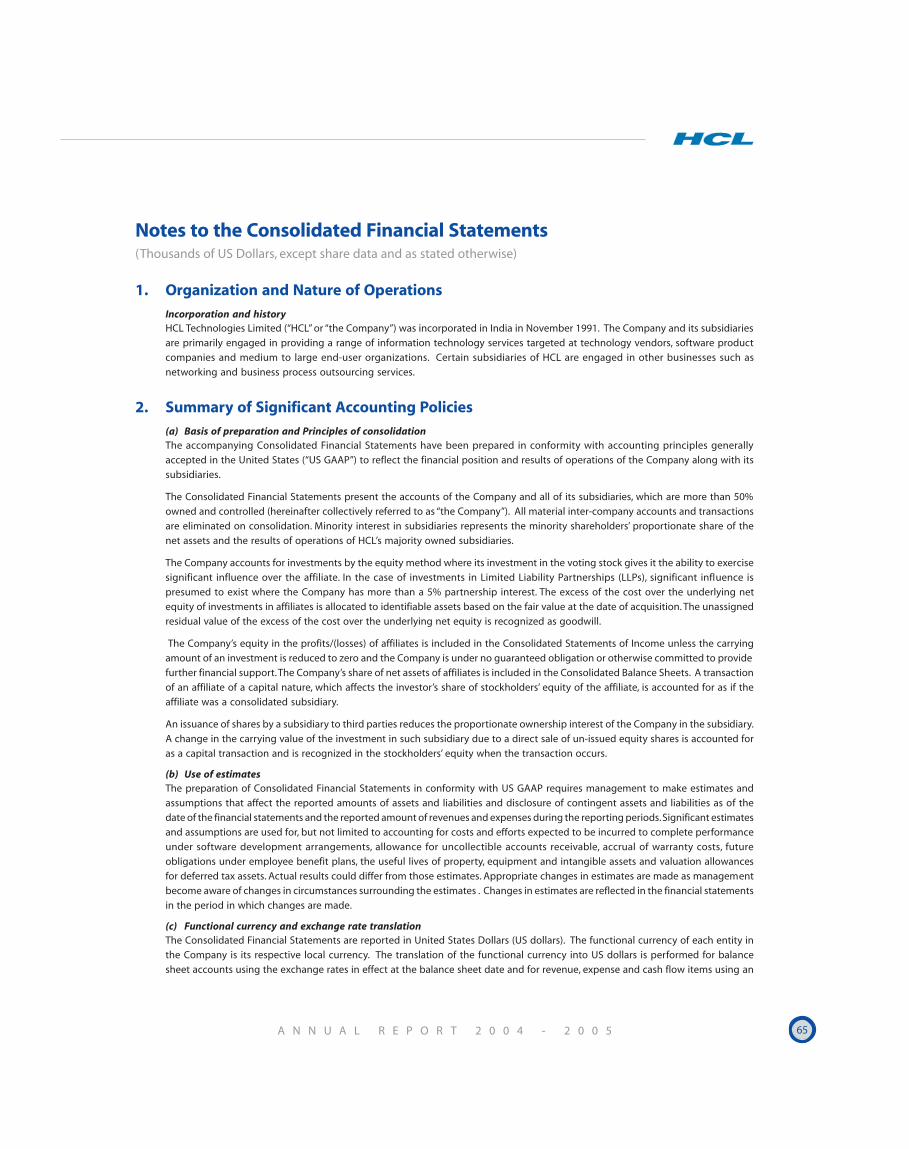
A N N U A L R E P O R T 2 0 0 4 - 2 0 0 5 65
Notes to the Consolidated Financial Statements(Thousands of US Dollars, except share data and as stated otherwise)
1. Organization and Nature of Operations
Incorporation and historyHCL Technologies Limited (“HCL” or “the Company”) was incorporated in India in November 1991. The Company and its subsidiaries
are primarily engaged in providing a range of information technology services targeted at technology vendors, software product
companies and medium to large end-user organizations. Certain subsidiaries of HCL are engaged in other businesses such as
networking and business process outsourcing services.
2. Summary of Significant Accounting Policies
(a) Basis of preparation and Principles of consolidationThe accompanying Consolidated Financial Statements have been prepared in conformity with accounting principles generally
accepted in the United States (“US GAAP”) to reflect the financial position and results of operations of the Company along with its
subsidiaries.
The Consolidated Financial Statements present the accounts of the Company and all of its subsidiaries, which are more than 50%
owned and controlled (hereinafter collectively referred to as “the Company”). All material inter-company accounts and transactions
are eliminated on consolidation. Minority interest in subsidiaries represents the minority shareholders’ proportionate share of the
net assets and the results of operations of HCL’s majority owned subsidiaries.
The Company accounts for investments by the equity method where its investment in the voting stock gives it the ability to exercise
significant influence over the affiliate. In the case of investments in Limited Liability Partnerships (LLPs), significant influence is
presumed to exist where the Company has more than a 5% partnership interest. The excess of the cost over the underlying net
equity of investments in affiliates is allocated to identifiable assets based on the fair value at the date of acquisition. The unassigned
residual value of the excess of the cost over the underlying net equity is recognized as goodwill.
The Company’s equity in the profits/(losses) of affiliates is included in the Consolidated Statements of Income unless the carrying
amount of an investment is reduced to zero and the Company is under no guaranteed obligation or otherwise committed to provide
further financial support. The Company’s share of net assets of affiliates is included in the Consolidated Balance Sheets. A transaction
of an affiliate of a capital nature, which affects the investor’s share of stockholders’ equity of the affiliate, is accounted for as if the
affiliate was a consolidated subsidiary.
An issuance of shares by a subsidiary to third parties reduces the proportionate ownership interest of the Company in the subsidiary.
A change in the carrying value of the investment in such subsidiary due to a direct sale of un-issued equity shares is accounted for
as a capital transaction and is recognized in the stockholders’ equity when the transaction occurs.
(b) Use of estimatesThe preparation of Consolidated Financial Statements in conformity with US GAAP requires management to make estimates and
assumptions that affect the reported amounts of assets and liabilities and disclosure of contingent assets and liabilities as of the
date of the financial statements and the reported amount of revenues and expenses during the reporting periods. Significant estimates
and assumptions are used for, but not limited to accounting for costs and efforts expected to be incurred to complete performance
under software development arrangements, allowance for uncollectible accounts receivable, accrual of warranty costs, future
obligations under employee benefit plans, the useful lives of property, equipment and intangible assets and valuation allowances
for deferred tax assets. Actual results could differ from those estimates. Appropriate changes in estimates are made as management
become aware of changes in circumstances surrounding the estimates . Changes in estimates are reflected in the financial statements
in the period in which changes are made.
(c) Functional currency and exchange rate translationThe Consolidated Financial Statements are reported in United States Dollars (US dollars). The functional currency of each entity in
the Company is its respective local currency. The translation of the functional currency into US dollars is performed for balance
sheet accounts using the exchange rates in effect at the balance sheet date and for revenue, expense and cash flow items using an
66 H C L T E C H N O L O G I E S L T D .
appropriate monthly weighted average exchange rate for the respective periods. The gains or losses resulting from such translationare reported as component of accumulated other comprehensive income/(loss), within stockholders’ equity.
Transactions in foreign currencies are translated into the functional currency at the rates of exchange prevailing at the date of thetransaction. Monetary assets and liabilities in foreign currencies are translated into the functional currency at the rates of exchangeprevailing at the balance sheet date. The resultant exchange gains or losses are included in the Consolidated Statements of Income.
(d) Revenue recognitionRevenues from software development services comprise income from time-and-material, fixed price contracts and fixed time framecontracts. Revenue with respect to time-and-material contracts is recognized as related services are performed. Revenue withrespect to fixed price contracts and fixed time frame contracts is recognized in accordance with the percentage of completionmethod. Guidance has been drawn from the Accounting Standards Executive Committee’s conclusion in paragraph 95 of Statementof Position (SOP) 97-2, Software Revenue Recognition, to account for revenue from fixed price arrangements for software developmentand related services in conformity with SOP 81-1, Accounting for Performance of Construction-Type and Certain Production-TypeContracts. The input (cost expended) method has been used to measure progress towards completion, as there is a direct relationshipbetween input and productivity. Provisions for estimated losses on contracts-in-progress are recorded in the period in which suchlosses become probable based on the current contract estimates. Incremental revenue from existing contracts arising on futuresales of customers’ products will be recognized when it is earned.
Revenue from sale of goods is recognized in accordance with Staff Accounting Bulletin (SAB) No. 104, Revenue Recognition, whensignificant risks and rewards in respect of ownership of the products are transferred to the customer and when the following criteriaare met:
• Persuasive evidence of an arrangement exists;• Delivery has occured and services have been rendered;• The price to the buyer is fixed and determinable; and• Collectibility of the sales price is reasonably assured.
Revenue from providing network access and maintenance services is recognized systematically over the term of the agreement.
Revenues from Business Process Outsourcing Services are derived from both time-based and unit-priced contracts. Revenue is
recognized as the related services are performed, in accordance with the specific terms of the contracts with the customer.
The Company had adopted the guidance in EITF Issue No. 00-21 for all revenue arrangements entered into from the year beginningJuly 1, 2003. Prior to adoption of EITF Issue No. 00-21, the Company had elected an accounting policy to recognize allocated revenuefor product sales on dispatch, though the customer was not obligated to pay a portion of the contract price allocable to the deliveredproducts until installation was completed. EITF Issue No. 00-21 does not permit such an election.
As per EITF 00-21, the arrangement consideration is allocated to the units of accounting based on their fair values. The revenuerecognized for the delivered items is limited to the amount that is not contingent upon the delivery or performance of the undelivereditems.
After the arrangement consideration has been allocated to each separate unit of accounting, the revenue has been recognized foreach unit of accounting based on the nature of services included in each unit of accounting. The revenue allocable to a delivereditem(s) that does not qualify as a separate unit of accounting within the arrangement is combined with the revenue allocable to theother applicable undelivered item(s) within the arrangement. The appropriate recognition of revenue is then determined for thosecombined deliverables as a single unit of accounting.
In certain cases, the application of the contingent revenue provisions of EITF Issue No. 00-21 could result in recognizing a loss on thedelivered element. In such cases, the cost recognized is limited to the amount of non-contingent revenues recognized and thebalance costs are recorded as an asset and are reviewed for impairment based on the estimated net cash flows to be received forfuture deliverables under the contract. These costs are subsequently recognized on recognition of the revenue allocable to thebalance deliverables.
Revenue from sale of goods is shown net of sales tax and applicable discounts and allowances. In accordance with EITF Issue No. 01-14, Income Statement Characterization of Reimbursements Received for “Out-of-Pocket” Expenses Incurred, the Company has accounted
Notes to the Consolidated Financial Statements (Contd.)(Thousands of US Dollars, except share data and as stated otherwise)
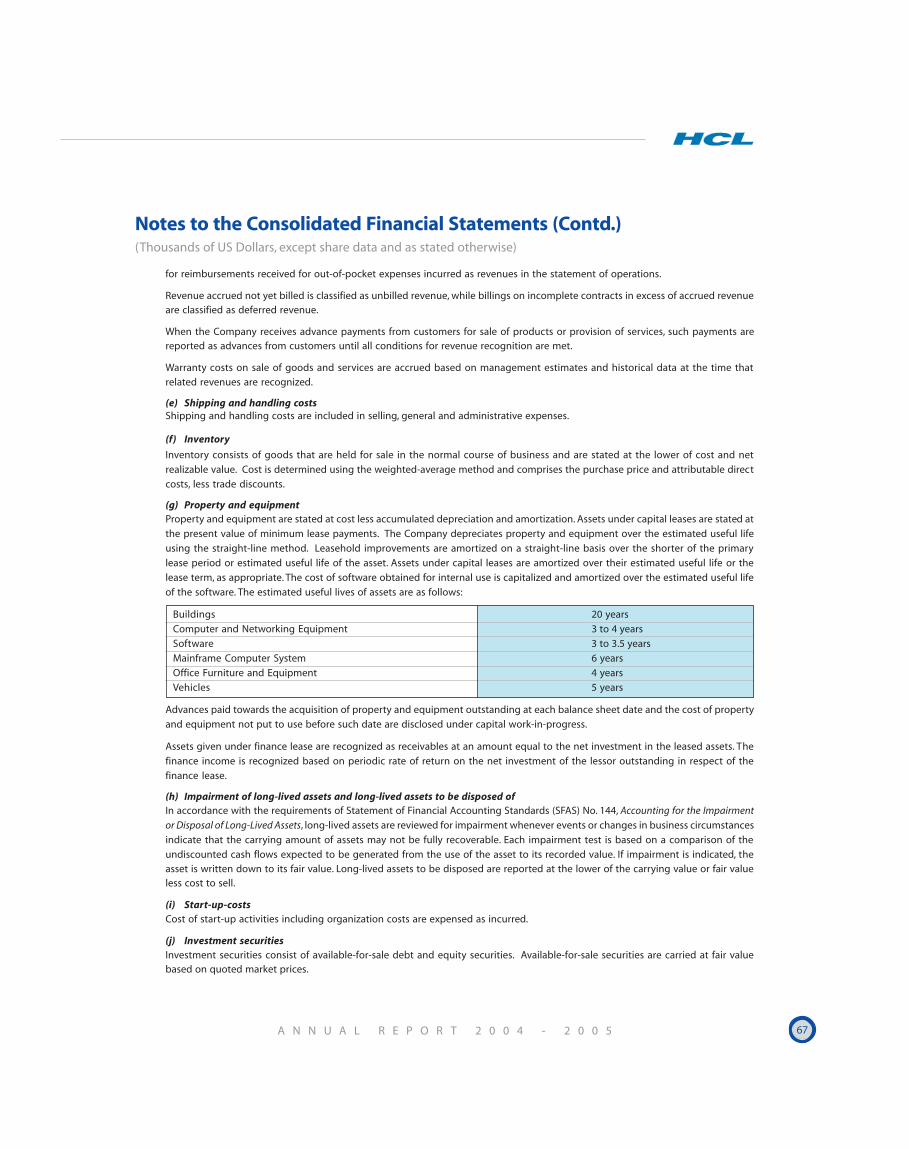
A N N U A L R E P O R T 2 0 0 4 - 2 0 0 5 67
Notes to the Consolidated Financial Statements (Contd.)(Thousands of US Dollars, except share data and as stated otherwise)
for reimbursements received for out-of-pocket expenses incurred as revenues in the statement of operations.
Revenue accrued not yet billed is classified as unbilled revenue, while billings on incomplete contracts in excess of accrued revenueare classified as deferred revenue.
When the Company receives advance payments from customers for sale of products or provision of services, such payments arereported as advances from customers until all conditions for revenue recognition are met.
Warranty costs on sale of goods and services are accrued based on management estimates and historical data at the time that
related revenues are recognized.
(e) Shipping and handling costsShipping and handling costs are included in selling, general and administrative expenses.
(f) Inventory
Inventory consists of goods that are held for sale in the normal course of business and are stated at the lower of cost and net
realizable value. Cost is determined using the weighted-average method and comprises the purchase price and attributable direct
costs, less trade discounts.
(g) Property and equipmentProperty and equipment are stated at cost less accumulated depreciation and amortization. Assets under capital leases are stated at
the present value of minimum lease payments. The Company depreciates property and equipment over the estimated useful life
using the straight-line method. Leasehold improvements are amortized on a straight-line basis over the shorter of the primary
lease period or estimated useful life of the asset. Assets under capital leases are amortized over their estimated useful life or the
lease term, as appropriate. The cost of software obtained for internal use is capitalized and amortized over the estimated useful life
of the software. The estimated useful lives of assets are as follows:
Buildings 20 years
Computer and Networking Equipment 3 to 4 years
Software 3 to 3.5 years
Mainframe Computer System 6 years
Office Furniture and Equipment 4 years
Vehicles 5 years
Advances paid towards the acquisition of property and equipment outstanding at each balance sheet date and the cost of property
and equipment not put to use before such date are disclosed under capital work-in-progress.
Assets given under finance lease are recognized as receivables at an amount equal to the net investment in the leased assets. The
finance income is recognized based on periodic rate of return on the net investment of the lessor outstanding in respect of the
finance lease.
(h) Impairment of long-lived assets and long-lived assets to be disposed ofIn accordance with the requirements of Statement of Financial Accounting Standards (SFAS) No. 144, Accounting for the Impairment
or Disposal of Long-Lived Assets, long-lived assets are reviewed for impairment whenever events or changes in business circumstances
indicate that the carrying amount of assets may not be fully recoverable. Each impairment test is based on a comparison of the
undiscounted cash flows expected to be generated from the use of the asset to its recorded value. If impairment is indicated, theasset is written down to its fair value. Long-lived assets to be disposed are reported at the lower of the carrying value or fair valueless cost to sell.
(i) Start-up-costsCost of start-up activities including organization costs are expensed as incurred.
(j) Investment securitiesInvestment securities consist of available-for-sale debt and equity securities. Available-for-sale securities are carried at fair valuebased on quoted market prices.
68 H C L T E C H N O L O G I E S L T D .
Notes to the Consolidated Financial Statements (Contd.)(Thousands of US Dollars, except share data and as stated otherwise)
Temporary unrealized gains and losses, net of the related tax effect are excluded from income and are reported as a separatecomponent of other comprehensive income, until realized. Realized gains and losses from the sale of available-for-sale securitiesare determined on a first-in-first-out method and are included in earnings. A decline in the fair value below cost that is deemed tobe other than temporary results in a reduction in carrying amount to fair value and the resultant impairment loss is recorded in theConsolidated Statements of Income. Dividend and interest income are recognized when earned.
(k) Other investmentsEquity and preferred securities, which do not have a readily determinable fair value, are reported at cost, subject to an impairmentcharge for any other than temporary decline in value. The impairment is charged to income. In order to determine whether adecline in value is other than temporary, the Company evaluates, among other factors, the duration and extent to which the valuehas been less than the carrying value, the financial condition of and business outlook for the investee, including key operational andcash flow indicators, current market conditions and future trends in the industry and the intent and ability of the Company to retainthe investment for a period of time sufficient to allow for any anticipated recovery in value.
(l) Research and developmentRevenue expenditure on research and development is expensed as incurred. Capital expenditure incurred on equipment and facilitiesacquired or constructed for research and development activities and having alternative future uses, is capitalized as property andequipment.
Research and development expenses for the year ended June 30, 2003, June 30, 2004 and June 30, 2005 were $215, $609 and $1,717respectively.
(m) Software product developmentIn accordance with the requirements of SFAS No. 86, Accounting for the Costs of Computer Software to be Sold, Leased or Otherwise
Marketed, software product development costs are expensed as incurred until technological feasibility is achieved. Software product
development costs incurred subsequent to the achievement of technological feasibility are capitalized and amortized on a product-
by-product basis over the remaining estimated useful lives at the higher of straight-line or the ratio that current gross revenues for
a product bear to the total of current and anticipated future gross revenues for the product.
(n) Cash equivalents and restricted cashThe Company considers all highly liquid investments with remaining maturities, at the date of purchase/investment, of three months
or less to be cash equivalents. Restricted cash represents margin money deposits against guarantees, letters of credit and bank
balance earmarked towards unclaimed dividend. Restrictions on margin money deposits are released on the expiry of the terms of
guarantees and letters of credit.
(o) Income taxesIncome taxes are accounted for using the asset and liability method. The current charge for income taxes is calculated in accordance
with the relevant tax regulations applicable to each entity. Deferred tax assets and liabilities are recognized for the future tax
consequences attributable to temporary differences between the financial statement carrying amounts of existing assets and liabilities
and their respective tax bases and operating loss carry-forwards. Deferred tax assets and liabilities are measured using enacted tax
rates expected to apply to taxable income in the years in which those temporary differences are expected to be recovered or set tled.
The effect on deferred tax assets and liabilities of a change in tax rates is recognized in the period that includes the enactment date.
The measurement of deferred tax assets is reduced, if necessary, by a valuation allowance of any tax benefits of which future realization
is uncertain.
(p) Earnings per share
In accordance with SFAS No. 128, Earnings Per Share (EPS), basic earnings per share is computed using the weighted average number
of equity shares outstanding during the period. Diluted earnings per share is computed using the weighted average number of
equity and dilutive equity equivalent shares outstanding during the period, using the treasury stock method for options and warrants,
except where results would be anti-dilutive.
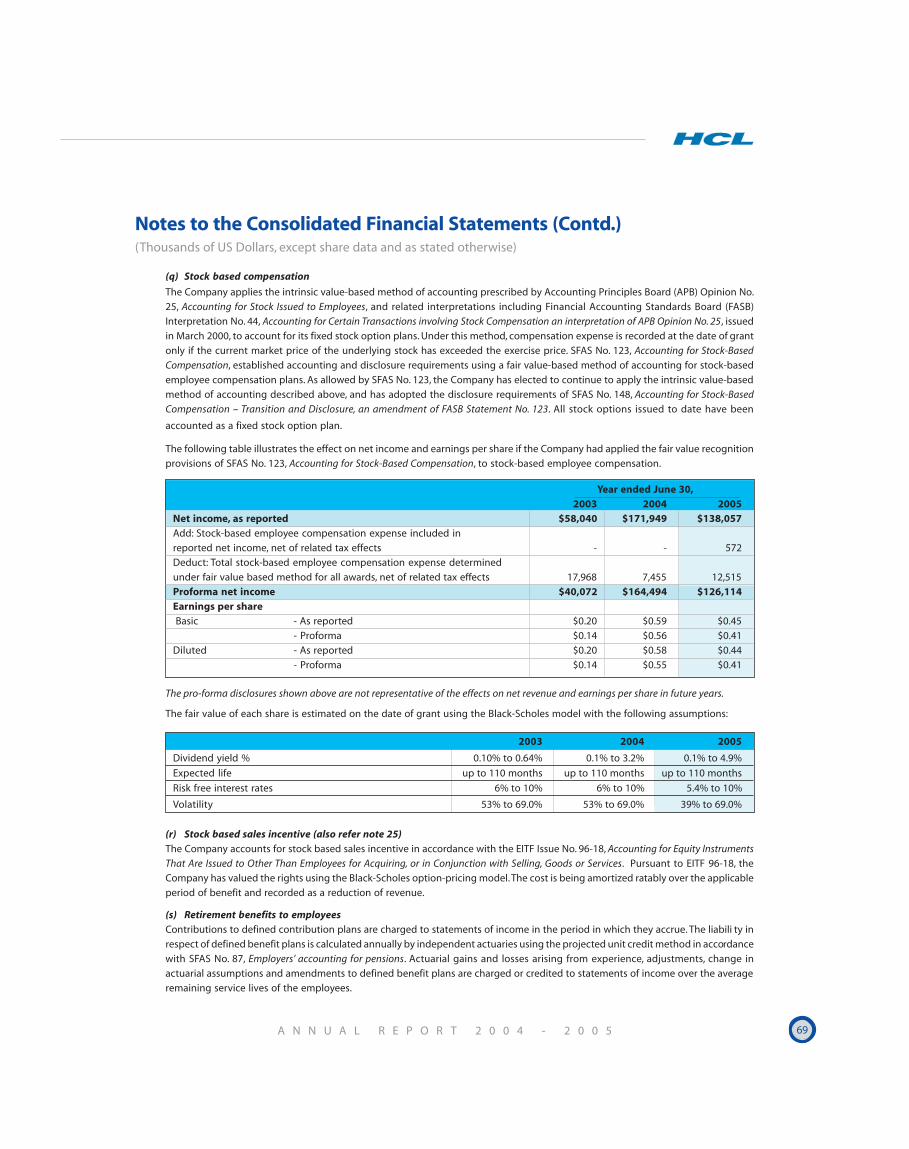
A N N U A L R E P O R T 2 0 0 4 - 2 0 0 5 69
Notes to the Consolidated Financial Statements (Contd.)(Thousands of US Dollars, except share data and as stated otherwise)
(q) Stock based compensation
The Company applies the intrinsic value-based method of accounting prescribed by Accounting Principles Board (APB) Opinion No.
25, Accounting for Stock Issued to Employees, and related interpretations including Financial Accounting Standards Board (FASB)
Interpretation No. 44, Accounting for Certain Transactions involving Stock Compensation an interpretation of APB Opinion No. 25, issued
in March 2000, to account for its fixed stock option plans. Under this method, compensation expense is recorded at the date of grant
only if the current market price of the underlying stock has exceeded the exercise price. SFAS No. 123, Accounting for Stock-Based
Compensation, established accounting and disclosure requirements using a fair value-based method of accounting for stock-based
employee compensation plans. As allowed by SFAS No. 123, the Company has elected to continue to apply the intrinsic value-based
method of accounting described above, and has adopted the disclosure requirements of SFAS No. 148, Accounting for Stock-Based
Compensation – Transition and Disclosure, an amendment of FASB Statement No. 123. All stock options issued to date have been
accounted as a fixed stock option plan.
The following table illustrates the effect on net income and earnings per share if the Company had applied the fair value recognition
provisions of SFAS No. 123, Accounting for Stock-Based Compensation, to stock-based employee compensation.
Year ended June 30,2003 2004 2005
Net income, as reported $58,040 $171,949 $138,057Add: Stock-based employee compensation expense included in
reported net income, net of related tax effects - - 572
Deduct: Total stock-based employee compensation expense determined
under fair value based method for all awards, net of related tax effects 17,968 7,455 12,515
Proforma net income $40,072 $164,494 $126,114Earnings per share Basic - As reported $0.20 $0.59 $0.45
- Proforma $0.14 $0.56 $0.41
Diluted - As reported $0.20 $0.58 $0.44
- Proforma $0.14 $0.55 $0.41
The pro-forma disclosures shown above are not representative of the effects on net revenue and earnings per share in future years.
The fair value of each share is estimated on the date of grant using the Black-Scholes model with the following assumptions:
2003 2004 2005
Dividend yield % 0.10% to 0.64% 0.1% to 3.2% 0.1% to 4.9%
Expected life up to 110 months up to 110 months up to 110 months
Risk free interest rates 6% to 10% 6% to 10% 5.4% to 10%
Volatility 53% to 69.0% 53% to 69.0% 39% to 69.0%
(r) Stock based sales incentive (also refer note 25)The Company accounts for stock based sales incentive in accordance with the EITF Issue No. 96-18, Accounting for Equity Instruments
That Are Issued to Other Than Employees for Acquiring, or in Conjunction with Selling, Goods or Services. Pursuant to EITF 96-18, the
Company has valued the rights using the Black-Scholes option-pricing model. The cost is being amortized ratably over the applicable
period of benefit and recorded as a reduction of revenue.
(s) Retirement benefits to employeesContributions to defined contribution plans are charged to statements of income in the period in which they accrue. The liabili ty in
respect of defined benefit plans is calculated annually by independent actuaries using the projected unit credit method in accordance
with SFAS No. 87, Employers’ accounting for pensions. Actuarial gains and losses arising from experience, adjustments, change in
actuarial assumptions and amendments to defined benefit plans are charged or credited to statements of income over the average
remaining service lives of the employees.
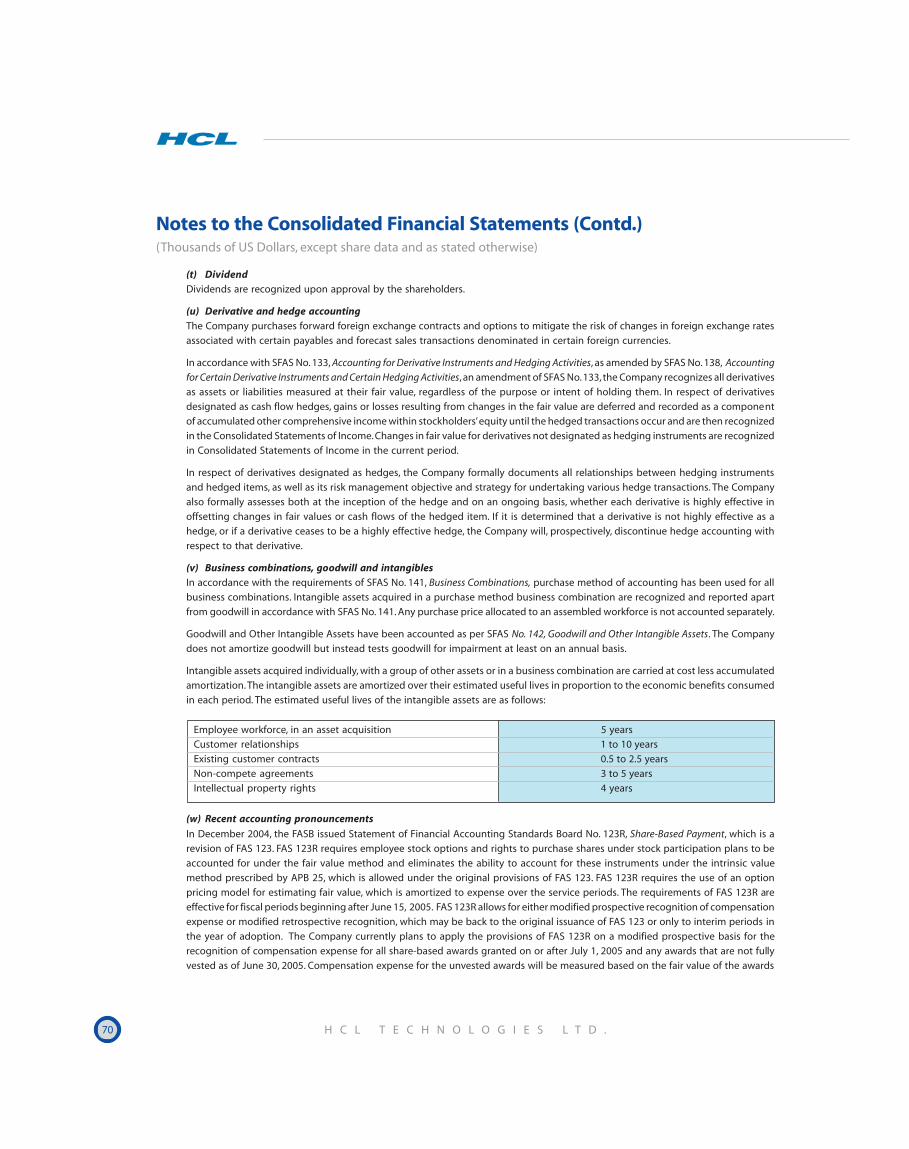
70 H C L T E C H N O L O G I E S L T D .
Notes to the Consolidated Financial Statements (Contd.)(Thousands of US Dollars, except share data and as stated otherwise)
(t) DividendDividends are recognized upon approval by the shareholders.
(u) Derivative and hedge accountingThe Company purchases forward foreign exchange contracts and options to mitigate the risk of changes in foreign exchange rates
associated with certain payables and forecast sales transactions denominated in certain foreign currencies.
In accordance with SFAS No. 133, Accounting for Derivative Instruments and Hedging Activities, as amended by SFAS No. 138, Accounting
for Certain Derivative Instruments and Certain Hedging Activities, an amendment of SFAS No. 133, the Company recognizes all derivatives
as assets or liabilities measured at their fair value, regardless of the purpose or intent of holding them. In respect of derivatives
designated as cash flow hedges, gains or losses resulting from changes in the fair value are deferred and recorded as a component
of accumulated other comprehensive income within stockholders’ equity until the hedged transactions occur and are then recognized
in the Consolidated Statements of Income. Changes in fair value for derivatives not designated as hedging instruments are recognized
in Consolidated Statements of Income in the current period.
In respect of derivatives designated as hedges, the Company formally documents all relationships between hedging instruments
and hedged items, as well as its risk management objective and strategy for undertaking various hedge transactions. The Company
also formally assesses both at the inception of the hedge and on an ongoing basis, whether each derivative is highly effective in
offsetting changes in fair values or cash flows of the hedged item. If it is determined that a derivative is not highly effective as a
hedge, or if a derivative ceases to be a highly effective hedge, the Company will, prospectively, discontinue hedge accounting with
respect to that derivative.
(v) Business combinations, goodwill and intangiblesIn accordance with the requirements of SFAS No. 141, Business Combinations, purchase method of accounting has been used for all
business combinations. Intangible assets acquired in a purchase method business combination are recognized and reported apart
from goodwill in accordance with SFAS No. 141. Any purchase price allocated to an assembled workforce is not accounted separately.
Goodwill and Other Intangible Assets have been accounted as per SFAS No. 142, Goodwill and Other Intangible Assets. The Company
does not amortize goodwill but instead tests goodwill for impairment at least on an annual basis.
Intangible assets acquired individually, with a group of other assets or in a business combination are carried at cost less accumulated
amortization. The intangible assets are amortized over their estimated useful lives in proportion to the economic benefits consumed
in each period. The estimated useful lives of the intangible assets are as follows:
Employee workforce, in an asset acquisition 5 years
Customer relationships 1 to 10 years
Existing customer contracts 0.5 to 2.5 years
Non-compete agreements 3 to 5 years
Intellectual property rights 4 years
(w) Recent accounting pronouncements
In December 2004, the FASB issued Statement of Financial Accounting Standards Board No. 123R, Share-Based Payment, which is a
revision of FAS 123. FAS 123R requires employee stock options and rights to purchase shares under stock participation plans to be
accounted for under the fair value method and eliminates the ability to account for these instruments under the intrinsic value
method prescribed by APB 25, which is allowed under the original provisions of FAS 123. FAS 123R requires the use of an option
pricing model for estimating fair value, which is amortized to expense over the service periods. The requirements of FAS 123R are
effective for fiscal periods beginning after June 15, 2005. FAS 123R allows for either modified prospective recognition of compensation
expense or modified retrospective recognition, which may be back to the original issuance of FAS 123 or only to interim periods in
the year of adoption. The Company currently plans to apply the provisions of FAS 123R on a modified prospective basis for the
recognition of compensation expense for all share-based awards granted on or after July 1, 2005 and any awards that are not fully
vested as of June 30, 2005. Compensation expense for the unvested awards will be measured based on the fair value of the awards
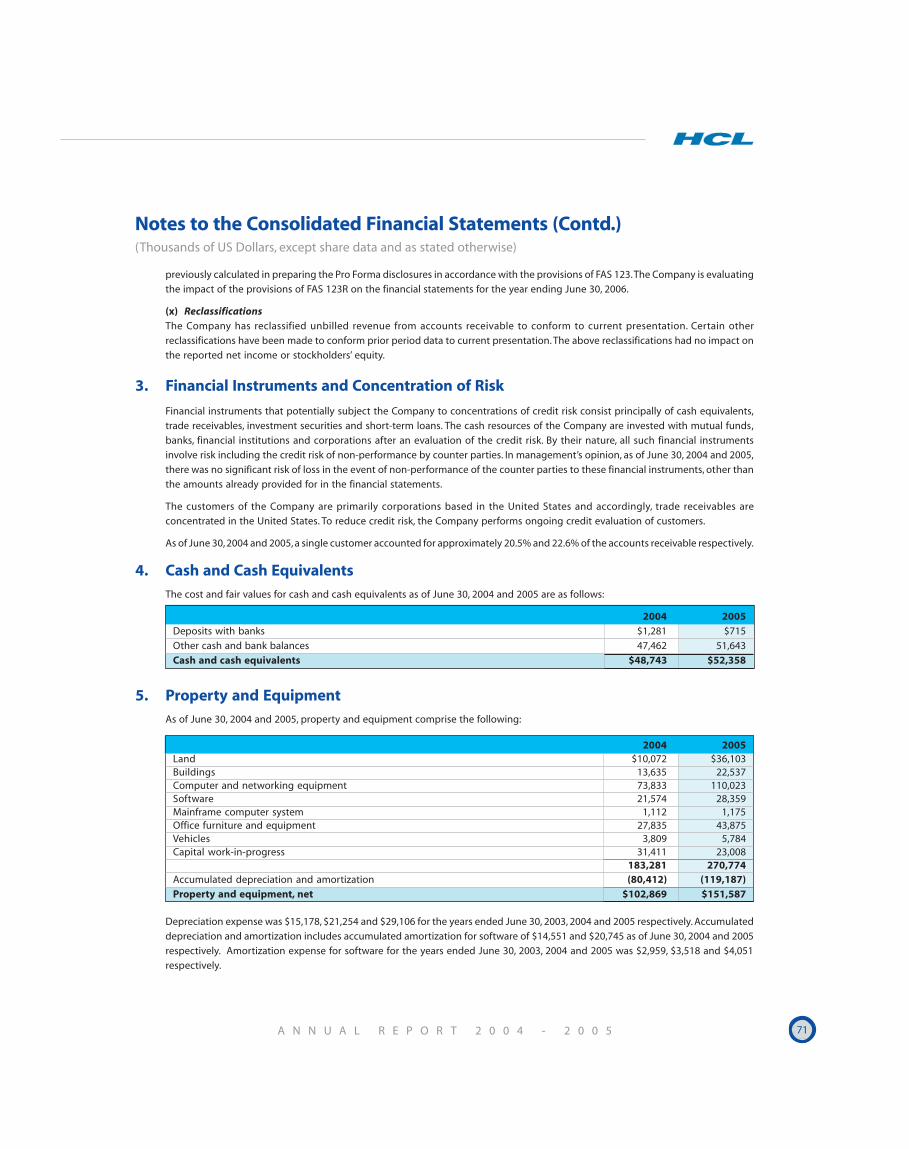
A N N U A L R E P O R T 2 0 0 4 - 2 0 0 5 71
Notes to the Consolidated Financial Statements (Contd.)(Thousands of US Dollars, except share data and as stated otherwise)
previously calculated in preparing the Pro Forma disclosures in accordance with the provisions of FAS 123. The Company is evaluating
the impact of the provisions of FAS 123R on the financial statements for the year ending June 30, 2006.
(x) ReclassificationsThe Company has reclassified unbilled revenue from accounts receivable to conform to current presentation. Certain other
reclassifications have been made to conform prior period data to current presentation. The above reclassifications had no impact on
the reported net income or stockholders’ equity.
3. Financial Instruments and Concentration of Risk
Financial instruments that potentially subject the Company to concentrations of credit risk consist principally of cash equivalents,
trade receivables, investment securities and short-term loans. The cash resources of the Company are invested with mutual funds,
banks, financial institutions and corporations after an evaluation of the credit risk. By their nature, all such financial instruments
involve risk including the credit risk of non-performance by counter parties. In management’s opinion, as of June 30, 2004 and 2005,
there was no significant risk of loss in the event of non-performance of the counter parties to these financial instruments, other than
the amounts already provided for in the financial statements.
The customers of the Company are primarily corporations based in the United States and accordingly, trade receivables are
concentrated in the United States. To reduce credit risk, the Company performs ongoing credit evaluation of customers.
As of June 30, 2004 and 2005, a single customer accounted for approximately 20.5% and 22.6% of the accounts receivable respectively.
4. Cash and Cash Equivalents
The cost and fair values for cash and cash equivalents as of June 30, 2004 and 2005 are as follows:
2004 2005Deposits with banks $1,281 $715
Other cash and bank balances 47,462 51,643
Cash and cash equivalents $48,743 $52,358
5. Property and Equipment
As of June 30, 2004 and 2005, property and equipment comprise the following:
2004 2005Land $10,072 $36,103Buildings 13,635 22,537Computer and networking equipment 73,833 110,023Software 21,574 28,359Mainframe computer system 1,112 1,175Office furniture and equipment 27,835 43,875Vehicles 3,809 5,784Capital work-in-progress 31,411 23,008
183,281 270,774Accumulated depreciation and amortization (80,412) (119,187)Property and equipment, net $102,869 $151,587
Depreciation expense was $15,178, $21,254 and $29,106 for the years ended June 30, 2003, 2004 and 2005 respectively. Accumulated
depreciation and amortization includes accumulated amortization for software of $14,551 and $20,745 as of June 30, 2004 and 2005
respectively. Amortization expense for software for the years ended June 30, 2003, 2004 and 2005 was $2,959, $3,518 and $4,051
respectively.
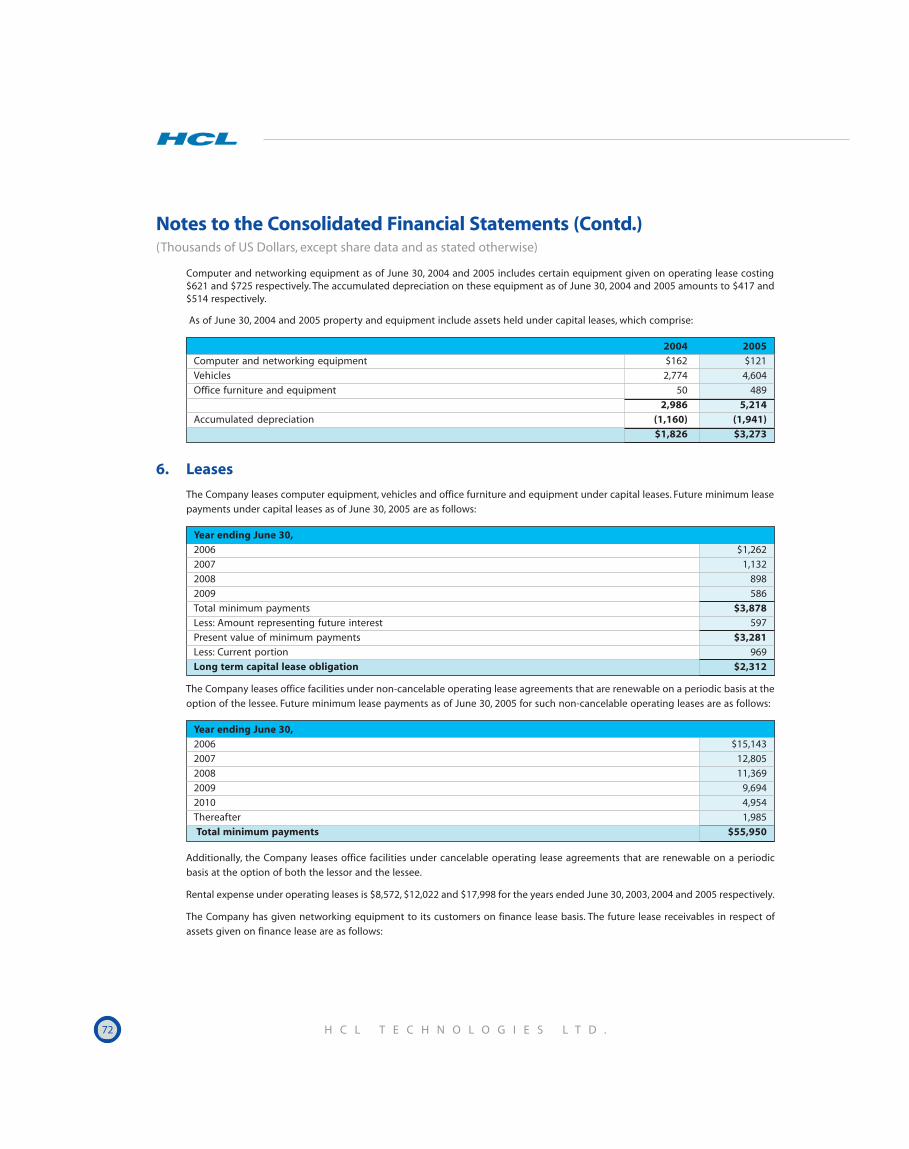
72 H C L T E C H N O L O G I E S L T D .
Notes to the Consolidated Financial Statements (Contd.)(Thousands of US Dollars, except share data and as stated otherwise)
Computer and networking equipment as of June 30, 2004 and 2005 includes certain equipment given on operating lease costing$621 and $725 respectively. The accumulated depreciation on these equipment as of June 30, 2004 and 2005 amounts to $417 and$514 respectively.
As of June 30, 2004 and 2005 property and equipment include assets held under capital leases, which comprise:
2004 2005Computer and networking equipment $162 $121
Vehicles 2,774 4,604
Office furniture and equipment 50 489
2,986 5,214Accumulated depreciation (1,160) (1,941)
$1,826 $3,273
6. Leases
The Company leases computer equipment, vehicles and office furniture and equipment under capital leases. Future minimum lease
payments under capital leases as of June 30, 2005 are as follows:
Year ending June 30,2006 $1,262
2007 1,132
2008 898
2009 586
Total minimum payments $3,878Less: Amount representing future interest 597
Present value of minimum payments $3,281Less: Current portion 969
Long term capital lease obligation $2,312
The Company leases office facilities under non-cancelable operating lease agreements that are renewable on a periodic basis at the
option of the lessee. Future minimum lease payments as of June 30, 2005 for such non-cancelable operating leases are as follows:
Year ending June 30,2006 $15,143
2007 12,805
2008 11,369
2009 9,694
2010 4,954
Thereafter 1,985
Total minimum payments $55,950
Additionally, the Company leases office facilities under cancelable operating lease agreements that are renewable on a periodic
basis at the option of both the lessor and the lessee.
Rental expense under operating leases is $8,572, $12,022 and $17,998 for the years ended June 30, 2003, 2004 and 2005 respectively.
The Company has given networking equipment to its customers on finance lease basis. The future lease receivables in respect of
assets given on finance lease are as follows:
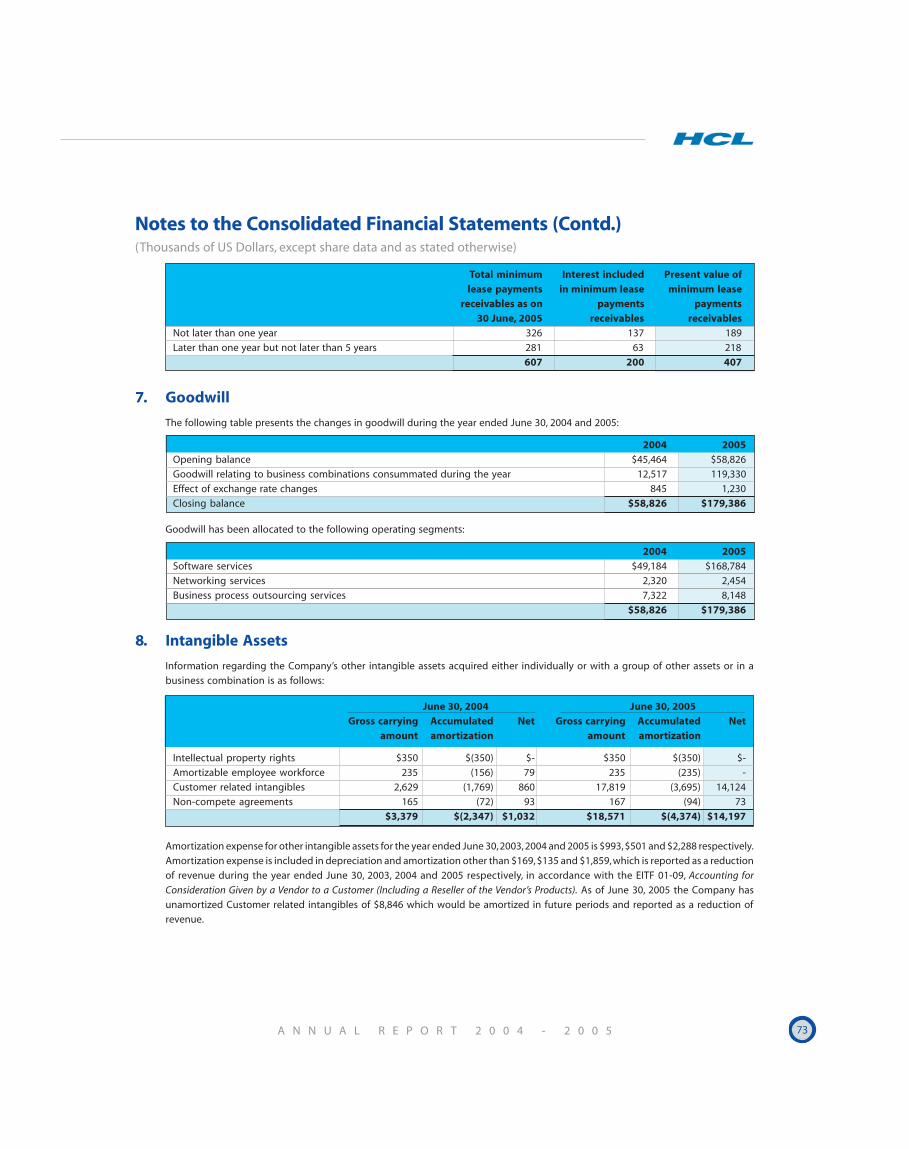
A N N U A L R E P O R T 2 0 0 4 - 2 0 0 5 73
Notes to the Consolidated Financial Statements (Contd.)(Thousands of US Dollars, except share data and as stated otherwise)
Total minimum Interest included Present value oflease payments in minimum lease minimum lease
receivables as on payments payments 30 June, 2005 receivables receivables
Not later than one year 326 137 189
Later than one year but not later than 5 years 281 63 218
607 200 407
7. Goodwill
The following table presents the changes in goodwill during the year ended June 30, 2004 and 2005:
2004 2005Opening balance $45,464 $58,826
Goodwill relating to business combinations consummated during the year 12,517 119,330
Effect of exchange rate changes 845 1,230
Closing balance $58,826 $179,386
Goodwill has been allocated to the following operating segments:
2004 2005Software services $49,184 $168,784
Networking services 2,320 2,454
Business process outsourcing services 7,322 8,148
$58,826 $179,386
8. Intangible Assets
Information regarding the Company’s other intangible assets acquired either individually or with a group of other assets or in a
business combination is as follows:
June 30, 2004 June 30, 2005Gross carrying Accumulated Net Gross carrying Accumulated Net
amount amortization amount amortization
Intellectual property rights $350 $(350) $- $350 $(350) $-
Amortizable employee workforce 235 (156) 79 235 (235) -
Customer related intangibles 2,629 (1,769) 860 17,819 (3,695) 14,124
Non-compete agreements 165 (72) 93 167 (94) 73
$3,379 $(2,347) $1,032 $18,571 $(4,374) $14,197
Amortization expense for other intangible assets for the year ended June 30, 2003, 2004 and 2005 is $993, $501 and $2,288 respectively.
Amortization expense is included in depreciation and amortization other than $169, $135 and $1,859, which is reported as a reduction
of revenue during the year ended June 30, 2003, 2004 and 2005 respectively, in accordance with the EITF 01-09, Accounting for
Consideration Given by a Vendor to a Customer (Including a Reseller of the Vendor’s Products). As of June 30, 2005 the Company has
unamortized Customer related intangibles of $8,846 which would be amortized in future periods and reported as a reduction of
revenue.
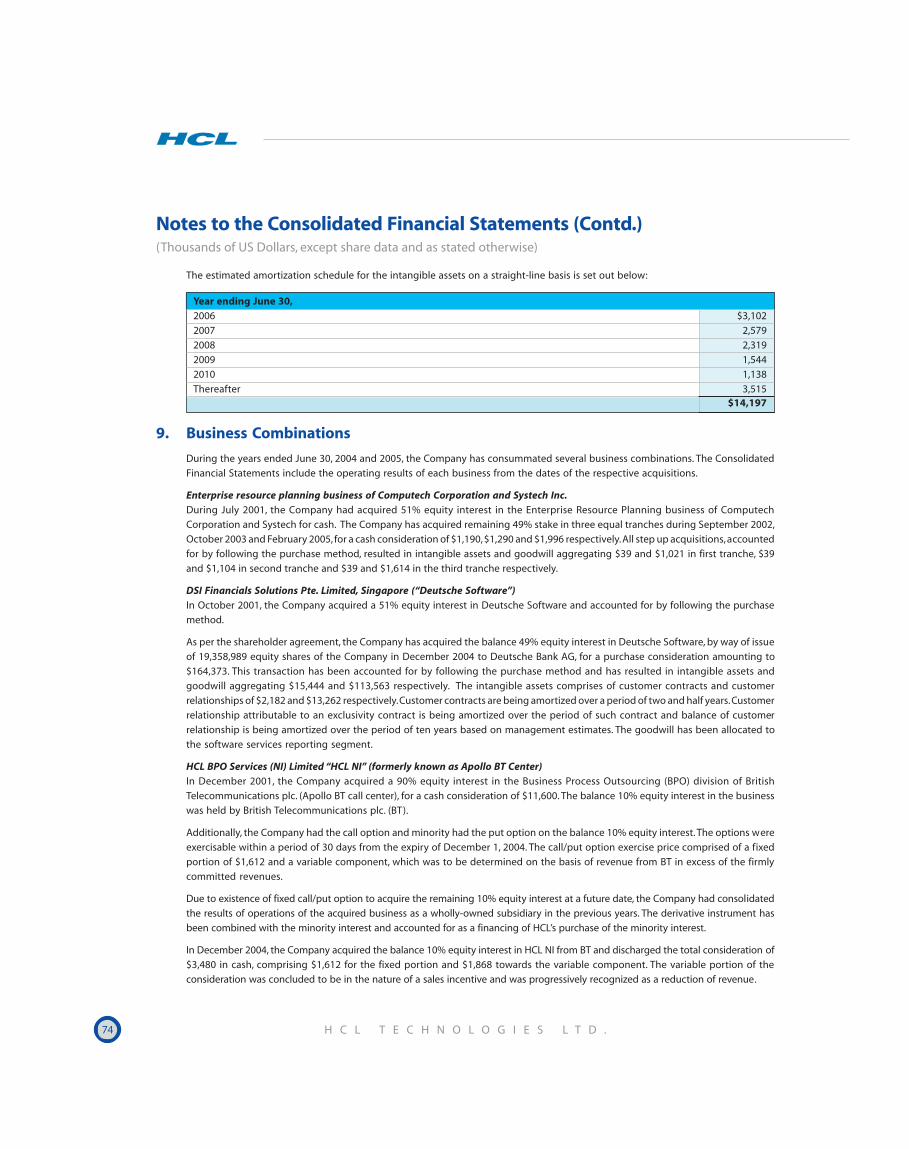
74 H C L T E C H N O L O G I E S L T D .
Notes to the Consolidated Financial Statements (Contd.)(Thousands of US Dollars, except share data and as stated otherwise)
The estimated amortization schedule for the intangible assets on a straight-line basis is set out below:
Year ending June 30,2006 $3,102
2007 2,579
2008 2,319
2009 1,544
2010 1,138
Thereafter 3,515$14,197
9. Business Combinations
During the years ended June 30, 2004 and 2005, the Company has consummated several business combinations. The Consolidated
Financial Statements include the operating results of each business from the dates of the respective acquisitions.
Enterprise resource planning business of Computech Corporation and Systech Inc.During July 2001, the Company had acquired 51% equity interest in the Enterprise Resource Planning business of Computech
Corporation and Systech for cash. The Company has acquired remaining 49% stake in three equal tranches during September 2002,
October 2003 and February 2005, for a cash consideration of $1,190, $1,290 and $1,996 respectively. All step up acquisitions, accounted
for by following the purchase method, resulted in intangible assets and goodwill aggregating $39 and $1,021 in first tranche, $39
and $1,104 in second tranche and $39 and $1,614 in the third tranche respectively.
DSI Financials Solutions Pte. Limited, Singapore (“Deutsche Software”)In October 2001, the Company acquired a 51% equity interest in Deutsche Software and accounted for by following the purchase
method.
As per the shareholder agreement, the Company has acquired the balance 49% equity interest in Deutsche Software, by way of issue
of 19,358,989 equity shares of the Company in December 2004 to Deutsche Bank AG, for a purchase consideration amounting to
$164,373. This transaction has been accounted for by following the purchase method and has resulted in intangible assets and
goodwill aggregating $15,444 and $113,563 respectively. The intangible assets comprises of customer contracts and customer
relationships of $2,182 and $13,262 respectively. Customer contracts are being amortized over a period of two and half years. Customer
relationship attributable to an exclusivity contract is being amortized over the period of such contract and balance of customer
relationship is being amortized over the period of ten years based on management estimates. The goodwill has been allocated to
the software services reporting segment.
HCL BPO Services (NI) Limited “HCL NI” (formerly known as Apollo BT Center)In December 2001, the Company acquired a 90% equity interest in the Business Process Outsourcing (BPO) division of British
Telecommunications plc. (Apollo BT call center), for a cash consideration of $11,600. The balance 10% equity interest in the business
was held by British Telecommunications plc. (BT).
Additionally, the Company had the call option and minority had the put option on the balance 10% equity interest. The options were
exercisable within a period of 30 days from the expiry of December 1, 2004. The call/put option exercise price comprised of a fixed
portion of $1,612 and a variable component, which was to be determined on the basis of revenue from BT in excess of the firmly
committed revenues.
Due to existence of fixed call/put option to acquire the remaining 10% equity interest at a future date, the Company had consolidated
the results of operations of the acquired business as a wholly-owned subsidiary in the previous years. The derivative instrument has
been combined with the minority interest and accounted for as a financing of HCL’s purchase of the minority interest.
In December 2004, the Company acquired the balance 10% equity interest in HCL NI from BT and discharged the total consideration of
$3,480 in cash, comprising $1,612 for the fixed portion and $1,868 towards the variable component. The variable portion of the
consideration was concluded to be in the nature of a sales incentive and was progressively recognized as a reduction of revenue.
A N N U A L R E P O R T 2 0 0 4 - 2 0 0 5 75
Notes to the Consolidated Financial Statements (Contd.)(Thousands of US Dollars, except share data and as stated otherwise)
HCL Technologies Mass Inc. (formerly “Gulf Computers Inc.”)In May 2002, the Company acquired all of the outstanding capital stock of Gulf Computers Inc., US (GCI).
The terms of the purchase also provide for payment of contingent consideration to the existing shareholders of GCI in two tranches,
payable on June 30, 2004 and June 30, 2005, calculated based on the achievement of specified earnings and margin targets. The
contingent consideration was payable either in cash or in common stock of the Company.
The Company had followed the consensus reached in EITF 95-8, Accounting for Contingent Consideration Paid to Shareholders of an
Acquired Enterprise in a Purchase Business Combination, and would have recorded contingent payments as goodwill in the period in
which the contingency was resolved. The contingent consideration is no longer payable as specified earning and margin targets
have not been achieved.
Shipara Technologies Limited (“Shipara”)The Company held 77% stake in Shipara as of June 30, 2004. During October 2004, the Company acquired the remaining 23% stake
from the minority shareholders for a cash consideration of $1,761. This acquisition has been accounted for by the purchase method
and has resulted in goodwill of $1,417. Accordingly, the financial results of Shipara for the year ended June 30,2005 have been
included in the Consolidated Financial Statements of the Company.
As of June 30, 2004 Shipara was not consolidated with the Company, as the minority shareholder, Rao Insulating Company Limited
had certain significant participating rights, which provided for its effective involvement in significant decisions in the ordinary
course of business. The Company’s equity in the loss/ (income) of Shipara for the years ended June 30, 2003 and 2004 was $801 and
$(166) respectively. The carrying value of the investment in Shipara was $2,362 as of June 30, 2004.
Aquila Technologies Limited (“Aquila”)As of June 30, 2004, a joint venture of the Company, Shipara held 37% stake in Aquila. During the current year, Shipara acquired the
remaining 63% stake in two tranches in July 2004 and February 2005 for a cash consideration of $269 and $575 respectively. These
acquisitions have been accounted for by the purchase method which has resulted in total goodwill of $1,012. Accordingly, the
financial results of Aquila for the year ended June 30, 2005 have been included in the Consolidated Financial Statements of the
Company.
Aalayance Inc. USA (“Aalayance”)In January 2003, the Company acquired a 19.03% equity interest in Aalayance Inc. for a cash consideration of $450. During January
2005, the Company has acquired an additional stake by way of subscription of 9,081,268 equity shares of Aalayance for a cash
consideration of $1,976. Consequent to the acquisition, the Company’s stake has increased to 58.09% (51% on fully diluted basis)
making Aalayance, and its subsidiaries, HCL EAI Services Private Limited (formerly “Aalayance E-com Services Private Limited”) and
Aalayance UK Limited, UK, the subsidiaries of the Company. This has resulted in goodwill aggregating $827.
Till the acquisition of additional equity stake, the voting equity interest in Aalayance had given the Company ability to exercise
significant influence over the operating and financial policies of the Aalayance Inc., as such the investment was being accounted for
by the equity method. The Company’s equity in the loss of Aalayance Inc. for the years ended June 30, 2003 and 2004 is $43 and $19
respectively. The carrying value of the investment in Aalayance Inc. is $388 as of June 30, 2004.
As per the shareholders’ agreement, the Company is required to acquire and the minority shareholders are required to sell the
balance equity interest, falling due on January 31, 2008. The consideration for the acquisition is payable in cash, based on earnings
and revenue of the acquired business.
Aalayance had granted options of its shares to its employees and employees of its subsidiaries, prior to it becoming subsidiary of
the Company. Options for 2,616,127 equity shares of Aalayance are outstanding as of June 30, 2005 and are required to be acquired
by the Company in stages by October 1, 2009 as per the terms of the shareholders agreement.
Answer Call Direct Limited (“Answer Call”)During the year, one of the subsidiaries of the Company has acquired business and assets of an existing call center, Answer Call for
a cash consideration of $1,737. This has resulted in goodwill aggregating $897.
76 H C L T E C H N O L O G I E S L T D .
Notes to the Consolidated Financial Statements (Contd.)(Thousands of US Dollars, except share data and as stated otherwise)
Joint Venture with NEC Corporation Japan (“NEC”)In June 2005, the Company entered into a Joint Venture Agreement with NEC and its subsidiary, NEC System Technologies Ltd.
(“NECST”) to form a Joint Venture Company (“JVC”) which would provide offshore led software engineering solutions to NEC, its
subsidiaries and their clients, in Japan and globally. The 49% stake in JVC will be held by the Company for which there is a commitment
to contribute $2,478 to the share capital of the proposed JVC.
Asset acquisition
Jones Apparel Group Inc.In June 2002, the Company entered into an agreement with Jones Apparel Group Inc. (Jones), under which two new companies were
established in Bermuda and Delaware. The Company contributed $1,006 towards a 51% equity interest in the new companies.
Jones contributed cash amounting to $256 and other intangible assets. As a part of this transaction, the Company has obtained
binding commitments for the provision of IT enabled services to Jones, with an aggregate contract value of $21,000 up to June 30,
2005 and $5,250 in each of the two succeeding years.
Additionally, Jones has a put option to sell a portion of its interest in these subsidiaries to the Company within certain specified
periods and subject to the occurrences of certain events as specified in the agreement. Further, the Company has entered into a
forward purchase agreement for acquiring a portion of the interest of Jones in these subsidiaries within certain specified periods
and subject to the occurrences of certain events as specified in the agreement. The put option/forward purchase prices will be
determined based on the earnings of these subsidiaries and the then prevailing earning multiples. The consideration will be paid
through HCL’s stock.
Common control transaction
HCL Infinet Ltd.In January 2003, the Company acquired the BPO division of HCL Infinet Limited (a company under common control as HCL) for a
cash consideration of $422. The results of the operations of the business are included in the Company’s Consolidated Financial
Statements with effect from the date on which both the Company and HCL Infinet Limited became companies under common
control. To the extent this business acquisition is in the nature of exchange of ownership interests between entities under common
control, the acquired assets have been recorded on a historical cost basis and the difference between the consideration paid and
the historical cost aggregating $73 has been reflected as a distribution in the Consolidated Financial Statements. The remaining
portion of the acquisition transaction has been accounted for by the purchase method and has resulted in recognition of goodwill
of $118, non-compete rights of $32 and customer relationship of $32.
Professional Service Organization (PSO) DivisionIn January 2003, the Company entered into a scheme of arrangement with HCL Infosystems Limited (“HCLIS”) (a company under
common control as HCL) to acquire the software business of the latter. The Company filed the scheme of arrangement with
Hon’able Court of Delhi, which accorded its approval on July 8, 2003. The Company intimated the Registrar of Companies regarding
the scheme of arrangement on July 24, 2003.
The scheme of arrangement envisaged a share entitlement ratio of 2 equity shares of the Company for every 9 equity shares of
HCLIS in consideration for the proposed business transfer.
The results of the operations of the acquired business are included in the Company’s Consolidated Financial Statements with effect
from May 1, 2002 on which both the Company and HCLIS became companies under common control. To the extent this business
acquisition is in the nature of exchange of ownership interests between entities under common control, the acquired assets have
been recorded on a historical cost basis and the recording of fair value of shares issued has been restricted to the historical cost of
the acquired asset. The excess of historical cost of net assets acquired over par value of shares aggregating $2,870 has been reflected
in additional paid-in capital.
The remaining portion of the acquisition transaction has been accounted for by the purchase method. The acquisition of minority
interest has resulted in recognition of goodwill of $11,413, customer contract of $102 and customer relationship of $151.
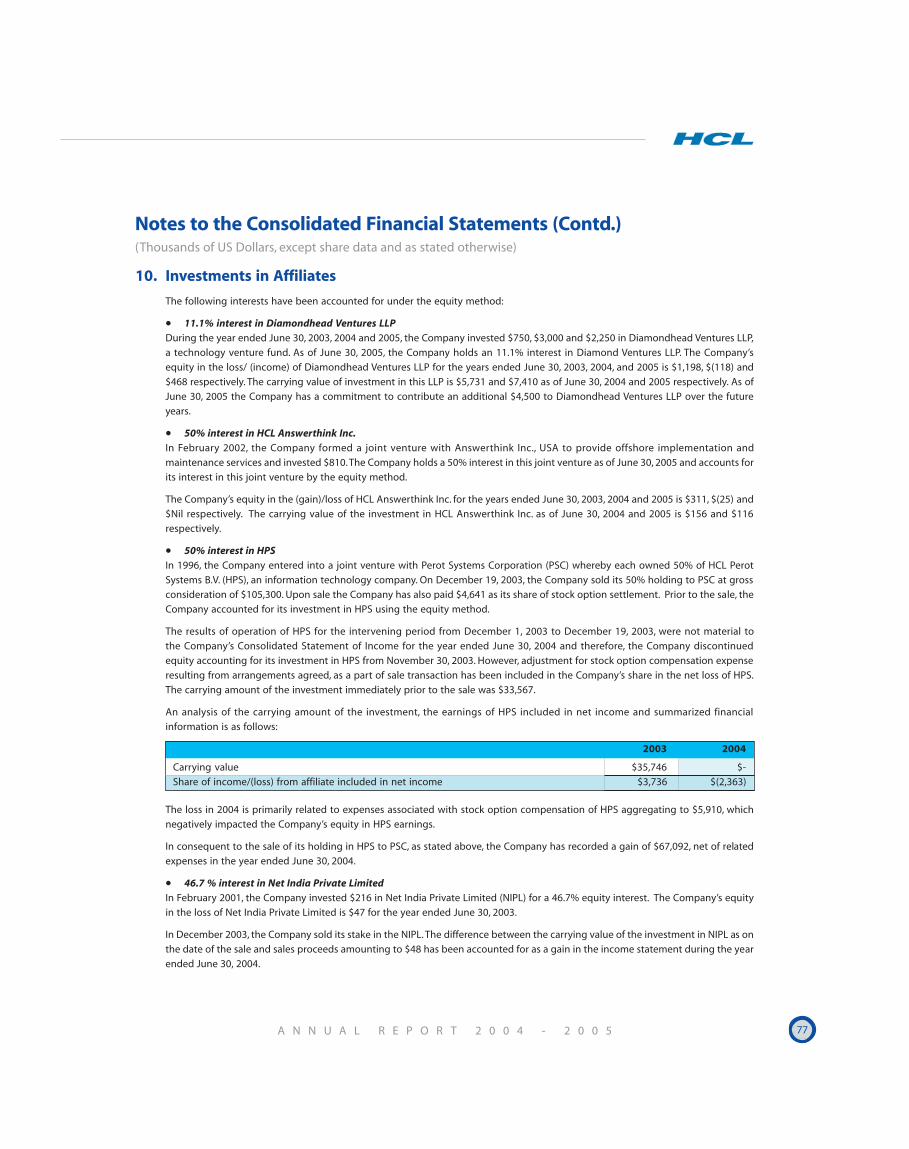
A N N U A L R E P O R T 2 0 0 4 - 2 0 0 5 77
Notes to the Consolidated Financial Statements (Contd.)(Thousands of US Dollars, except share data and as stated otherwise)
10. Investments in Affiliates
The following interests have been accounted for under the equity method:
• 11.1% interest in Diamondhead Ventures LLPDuring the year ended June 30, 2003, 2004 and 2005, the Company invested $750, $3,000 and $2,250 in Diamondhead Ventures LLP,
a technology venture fund. As of June 30, 2005, the Company holds an 11.1% interest in Diamond Ventures LLP. The Company’s
equity in the loss/ (income) of Diamondhead Ventures LLP for the years ended June 30, 2003, 2004, and 2005 is $1,198, $(118) and
$468 respectively. The carrying value of investment in this LLP is $5,731 and $7,410 as of June 30, 2004 and 2005 respectively. As of
June 30, 2005 the Company has a commitment to contribute an additional $4,500 to Diamondhead Ventures LLP over the future
years.
• 50% interest in HCL Answerthink Inc.
In February 2002, the Company formed a joint venture with Answerthink Inc., USA to provide offshore implementation and
maintenance services and invested $810. The Company holds a 50% interest in this joint venture as of June 30, 2005 and accounts for
its interest in this joint venture by the equity method.
The Company’s equity in the (gain)/loss of HCL Answerthink Inc. for the years ended June 30, 2003, 2004 and 2005 is $311, $(25) and
$Nil respectively. The carrying value of the investment in HCL Answerthink Inc. as of June 30, 2004 and 2005 is $156 and $116
respectively.
• 50% interest in HPS
In 1996, the Company entered into a joint venture with Perot Systems Corporation (PSC) whereby each owned 50% of HCL Perot
Systems B.V. (HPS), an information technology company. On December 19, 2003, the Company sold its 50% holding to PSC at gross
consideration of $105,300. Upon sale the Company has also paid $4,641 as its share of stock option settlement. Prior to the sale, the
Company accounted for its investment in HPS using the equity method.
The results of operation of HPS for the intervening period from December 1, 2003 to December 19, 2003, were not material to
the Company’s Consolidated Statement of Income for the year ended June 30, 2004 and therefore, the Company discontinued
equity accounting for its investment in HPS from November 30, 2003. However, adjustment for stock option compensation expense
resulting from arrangements agreed, as a part of sale transaction has been included in the Company’s share in the net loss of HPS.
The carrying amount of the investment immediately prior to the sale was $33,567.
An analysis of the carrying amount of the investment, the earnings of HPS included in net income and summarized financial
information is as follows:
2003 2004
Carrying value $35,746 $-
Share of income/(loss) from affiliate included in net income $3,736 $(2,363)
The loss in 2004 is primarily related to expenses associated with stock option compensation of HPS aggregating to $5,910, which
negatively impacted the Company’s equity in HPS earnings.
In consequent to the sale of its holding in HPS to PSC, as stated above, the Company has recorded a gain of $67,092, net of related
expenses in the year ended June 30, 2004.
• 46.7 % interest in Net India Private LimitedIn February 2001, the Company invested $216 in Net India Private Limited (NIPL) for a 46.7% equity interest. The Company’s equity
in the loss of Net India Private Limited is $47 for the year ended June 30, 2003.
In December 2003, the Company sold its stake in the NIPL. The difference between the carrying value of the investment in NIPL as on
the date of the sale and sales proceeds amounting to $48 has been accounted for as a gain in the income statement during the year
ended June 30, 2004.
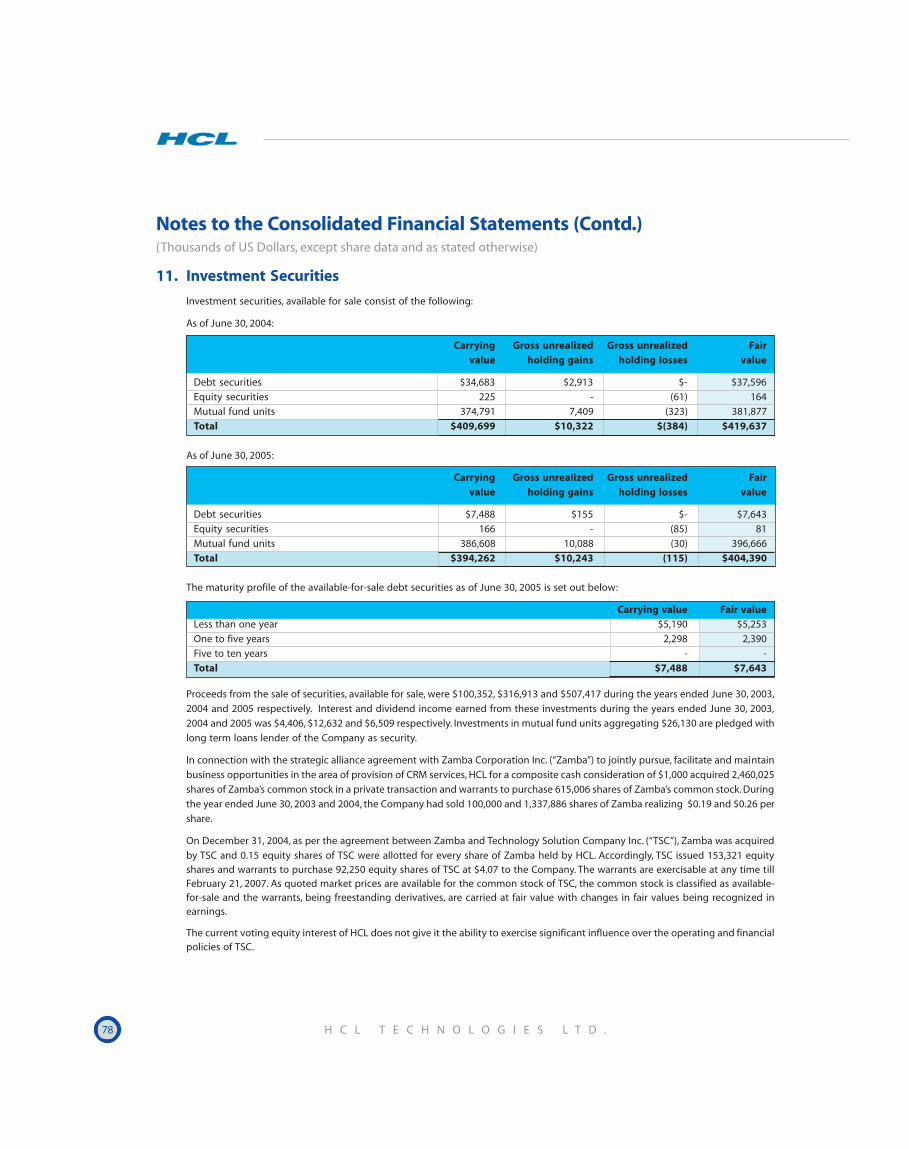
78 H C L T E C H N O L O G I E S L T D .
11. Investment Securities
Investment securities, available for sale consist of the following:
As of June 30, 2004:
Carrying Gross unrealized Gross unrealized Fairvalue holding gains holding losses value
Debt securities $34,683 $2,913 $- $37,596
Equity securities 225 - (61) 164
Mutual fund units 374,791 7,409 (323) 381,877
Total $409,699 $10,322 $(384) $419,637
As of June 30, 2005:
Carrying Gross unrealized Gross unrealized Fairvalue holding gains holding losses value
Debt securities $7,488 $155 $- $7,643
Equity securities 166 - (85) 81
Mutual fund units 386,608 10,088 (30) 396,666
Total $394,262 $10,243 (115) $404,390
The maturity profile of the available-for-sale debt securities as of June 30, 2005 is set out below:
Carrying value Fair valueLess than one year $5,190 $5,253
One to five years 2,298 2,390
Five to ten years - -
Total $7,488 $7,643
Proceeds from the sale of securities, available for sale, were $100,352, $316,913 and $507,417 during the years ended June 30, 2003,
2004 and 2005 respectively. Interest and dividend income earned from these investments during the years ended June 30, 2003,
2004 and 2005 was $4,406, $12,632 and $6,509 respectively. Investments in mutual fund units aggregating $26,130 are pledged with
long term loans lender of the Company as security.
In connection with the strategic alliance agreement with Zamba Corporation Inc. (“Zamba”) to jointly pursue, facilitate and maintain
business opportunities in the area of provision of CRM services, HCL for a composite cash consideration of $1,000 acquired 2,460,025
shares of Zamba’s common stock in a private transaction and warrants to purchase 615,006 shares of Zamba’s common stock. During
the year ended June 30, 2003 and 2004, the Company had sold 100,000 and 1,337,886 shares of Zamba realizing $0.19 and $0.26 per
share.
On December 31, 2004, as per the agreement between Zamba and Technology Solution Company Inc. (“TSC”), Zamba was acquired
by TSC and 0.15 equity shares of TSC were allotted for every share of Zamba held by HCL. Accordingly, TSC issued 153,321 equityshares and warrants to purchase 92,250 equity shares of TSC at $4.07 to the Company. The warrants are exercisable at any time tillFebruary 21, 2007. As quoted market prices are available for the common stock of TSC, the common stock is classified as available-for-sale and the warrants, being freestanding derivatives, are carried at fair value with changes in fair values being recognized inearnings.
The current voting equity interest of HCL does not give it the ability to exercise significant influence over the operating and financialpolicies of TSC.
Notes to the Consolidated Financial Statements (Contd.)(Thousands of US Dollars, except share data and as stated otherwise)
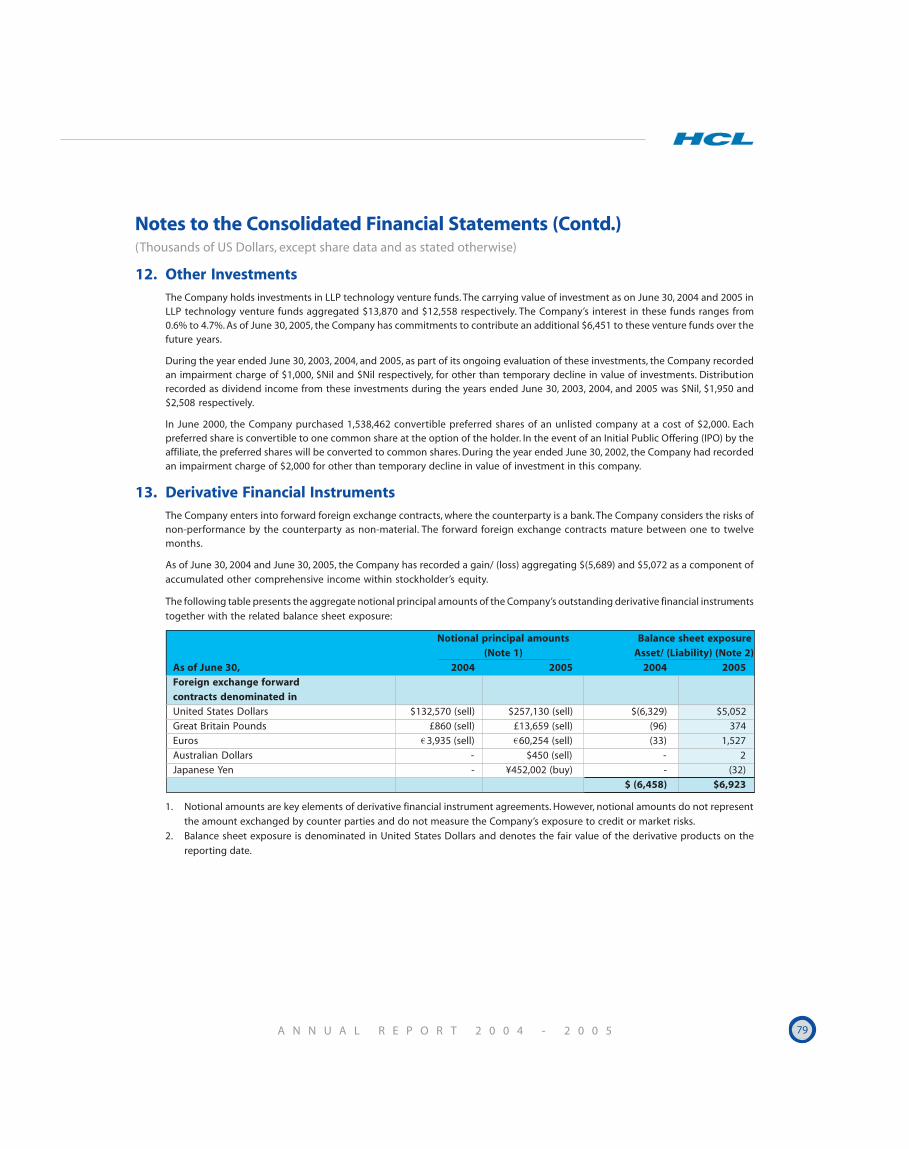
A N N U A L R E P O R T 2 0 0 4 - 2 0 0 5 79
12. Other InvestmentsThe Company holds investments in LLP technology venture funds. The carrying value of investment as on June 30, 2004 and 2005 inLLP technology venture funds aggregated $13,870 and $12,558 respectively. The Company’s interest in these funds ranges from0.6% to 4.7%. As of June 30, 2005, the Company has commitments to contribute an additional $6,451 to these venture funds over thefuture years.
During the year ended June 30, 2003, 2004, and 2005, as part of its ongoing evaluation of these investments, the Company recordedan impairment charge of $1,000, $Nil and $Nil respectively, for other than temporary decline in value of investments. Distributionrecorded as dividend income from these investments during the years ended June 30, 2003, 2004, and 2005 was $Nil, $1,950 and$2,508 respectively.
In June 2000, the Company purchased 1,538,462 convertible preferred shares of an unlisted company at a cost of $2,000. Eachpreferred share is convertible to one common share at the option of the holder. In the event of an Initial Public Offering (IPO) by theaffiliate, the preferred shares will be converted to common shares. During the year ended June 30, 2002, the Company had recordedan impairment charge of $2,000 for other than temporary decline in value of investment in this company.
13. Derivative Financial InstrumentsThe Company enters into forward foreign exchange contracts, where the counterparty is a bank. The Company considers the risks ofnon-performance by the counterparty as non-material. The forward foreign exchange contracts mature between one to twelvemonths.
As of June 30, 2004 and June 30, 2005, the Company has recorded a gain/ (loss) aggregating $(5,689) and $5,072 as a component of
accumulated other comprehensive income within stockholder’s equity.
The following table presents the aggregate notional principal amounts of the Company’s outstanding derivative financial instruments
together with the related balance sheet exposure:
Notional principal amounts Balance sheet exposure(Note 1) Asset/ (Liability) (Note 2)
As of June 30, 2004 2005 2004 2005Foreign exchange forwardcontracts denominated inUnited States Dollars $132,570 (sell) $257,130 (sell) $(6,329) $5,052
Great Britain Pounds £860 (sell) £13,659 (sell) (96) 374
Euros 3,935 (sell) 60,254 (sell) (33) 1,527
Australian Dollars - $450 (sell) - 2
Japanese Yen - ¥452,002 (buy) - (32)
$ (6,458) $6,923
1. Notional amounts are key elements of derivative financial instrument agreements. However, notional amounts do not represent
the amount exchanged by counter parties and do not measure the Company’s exposure to credit or market risks.
2. Balance sheet exposure is denominated in United States Dollars and denotes the fair value of the derivative products on the
reporting date.
Notes to the Consolidated Financial Statements (Contd.)(Thousands of US Dollars, except share data and as stated otherwise)
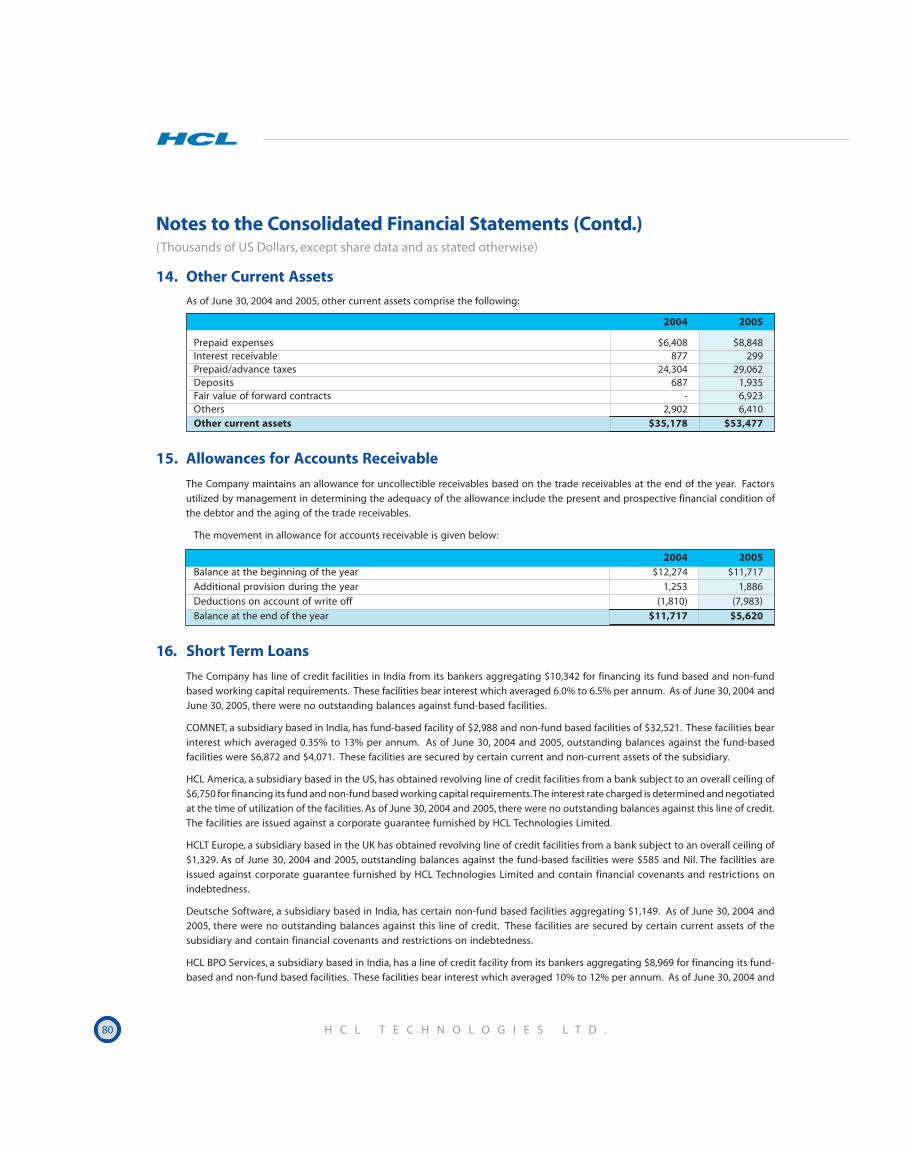
80 H C L T E C H N O L O G I E S L T D .
Notes to the Consolidated Financial Statements (Contd.)(Thousands of US Dollars, except share data and as stated otherwise)
14. Other Current Assets
As of June 30, 2004 and 2005, other current assets comprise the following:
2004 2005
Prepaid expenses $6,408 $8,848Interest receivable 877 299Prepaid/advance taxes 24,304 29,062Deposits 687 1,935Fair value of forward contracts - 6,923Others 2,902 6,410Other current assets $35,178 $53,477
15. Allowances for Accounts Receivable
The Company maintains an allowance for uncollectible receivables based on the trade receivables at the end of the year. Factors
utilized by management in determining the adequacy of the allowance include the present and prospective financial condition of
the debtor and the aging of the trade receivables.
The movement in allowance for accounts receivable is given below:
2004 2005Balance at the beginning of the year $12,274 $11,717
Additional provision during the year 1,253 1,886
Deductions on account of write off (1,810) (7,983)
Balance at the end of the year $11,717 $5,620
16. Short Term Loans
The Company has line of credit facilities in India from its bankers aggregating $10,342 for financing its fund based and non-fund
based working capital requirements. These facilities bear interest which averaged 6.0% to 6.5% per annum. As of June 30, 2004 and
June 30, 2005, there were no outstanding balances against fund-based facilities.
COMNET, a subsidiary based in India, has fund-based facility of $2,988 and non-fund based facilities of $32,521. These facilities bear
interest which averaged 0.35% to 13% per annum. As of June 30, 2004 and 2005, outstanding balances against the fund-based
facilities were $6,872 and $4,071. These facilities are secured by certain current and non-current assets of the subsidiary.
HCL America, a subsidiary based in the US, has obtained revolving line of credit facilities from a bank subject to an overall ceiling of
$6,750 for financing its fund and non-fund based working capital requirements. The interest rate charged is determined and negotiated
at the time of utilization of the facilities. As of June 30, 2004 and 2005, there were no outstanding balances against this line of credit.
The facilities are issued against a corporate guarantee furnished by HCL Technologies Limited.
HCLT Europe, a subsidiary based in the UK has obtained revolving line of credit facilities from a bank subject to an overall ceiling of
$1,329. As of June 30, 2004 and 2005, outstanding balances against the fund-based facilities were $585 and Nil. The facilities are
issued against corporate guarantee furnished by HCL Technologies Limited and contain financial covenants and restrictions on
indebtedness.
Deutsche Software, a subsidiary based in India, has certain non-fund based facilities aggregating $1,149. As of June 30, 2004 and
2005, there were no outstanding balances against this line of credit. These facilities are secured by certain current assets of the
subsidiary and contain financial covenants and restrictions on indebtedness.
HCL BPO Services, a subsidiary based in India, has a line of credit facility from its bankers aggregating $8,969 for financing its fund-
based and non-fund based facilities. These facilities bear interest which averaged 10% to 12% per annum. As of June 30, 2004 and
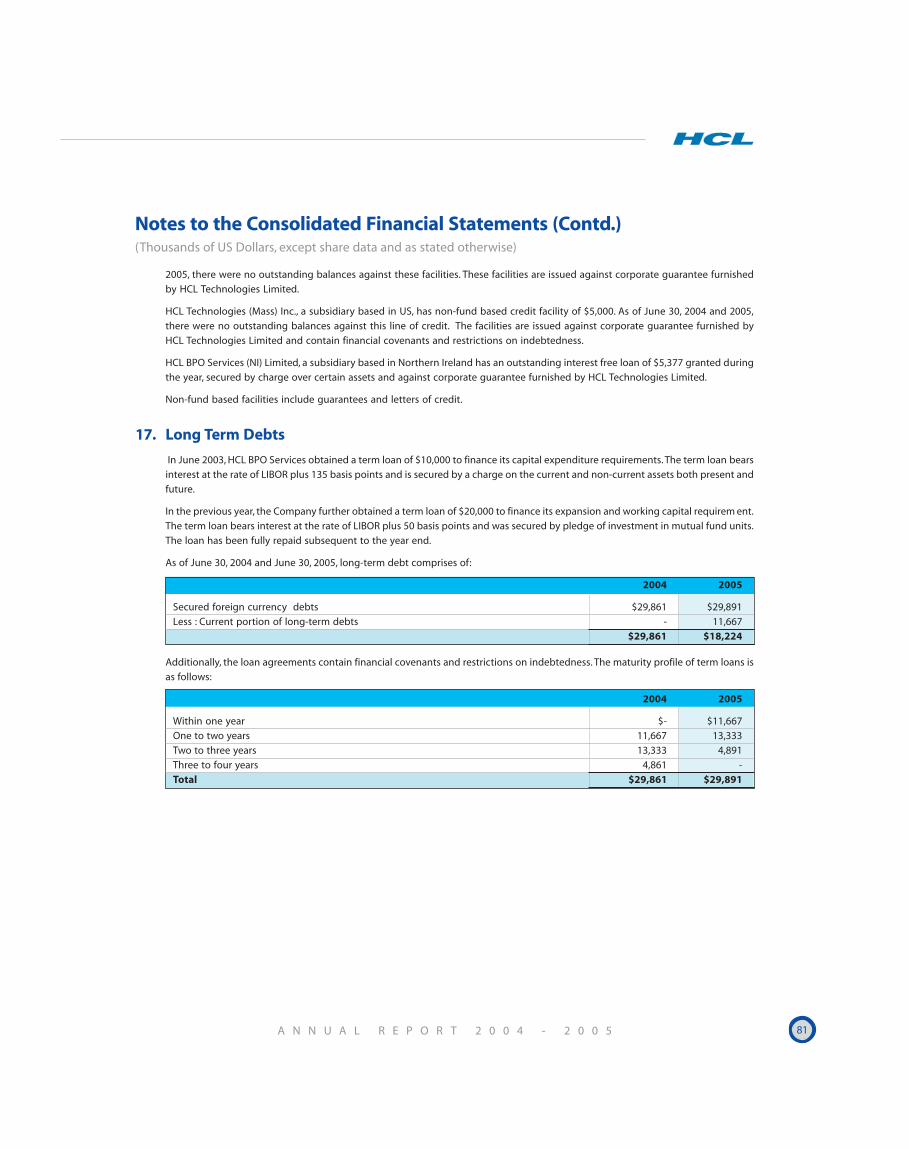
A N N U A L R E P O R T 2 0 0 4 - 2 0 0 5 81
Notes to the Consolidated Financial Statements (Contd.)(Thousands of US Dollars, except share data and as stated otherwise)
2005, there were no outstanding balances against these facilities. These facilities are issued against corporate guarantee furnished
by HCL Technologies Limited.
HCL Technologies (Mass) Inc., a subsidiary based in US, has non-fund based credit facility of $5,000. As of June 30, 2004 and 2005,
there were no outstanding balances against this line of credit. The facilities are issued against corporate guarantee furnished by
HCL Technologies Limited and contain financial covenants and restrictions on indebtedness.
HCL BPO Services (NI) Limited, a subsidiary based in Northern Ireland has an outstanding interest free loan of $5,377 granted during
the year, secured by charge over certain assets and against corporate guarantee furnished by HCL Technologies Limited.
Non-fund based facilities include guarantees and letters of credit.
17. Long Term Debts
In June 2003, HCL BPO Services obtained a term loan of $10,000 to finance its capital expenditure requirements. The term loan bears
interest at the rate of LIBOR plus 135 basis points and is secured by a charge on the current and non-current assets both present and
future.
In the previous year, the Company further obtained a term loan of $20,000 to finance its expansion and working capital requirem ent.
The term loan bears interest at the rate of LIBOR plus 50 basis points and was secured by pledge of investment in mutual fund units.
The loan has been fully repaid subsequent to the year end.
As of June 30, 2004 and June 30, 2005, long-term debt comprises of:
2004 2005
Secured foreign currency debts $29,861 $29,891
Less : Current portion of long-term debts - 11,667
$29,861 $18,224
Additionally, the loan agreements contain financial covenants and restrictions on indebtedness. The maturity profile of term loans is
as follows:
2004 2005
Within one year $- $11,667
One to two years 11,667 13,333
Two to three years 13,333 4,891
Three to four years 4,861 -
Total $29,861 $29,891
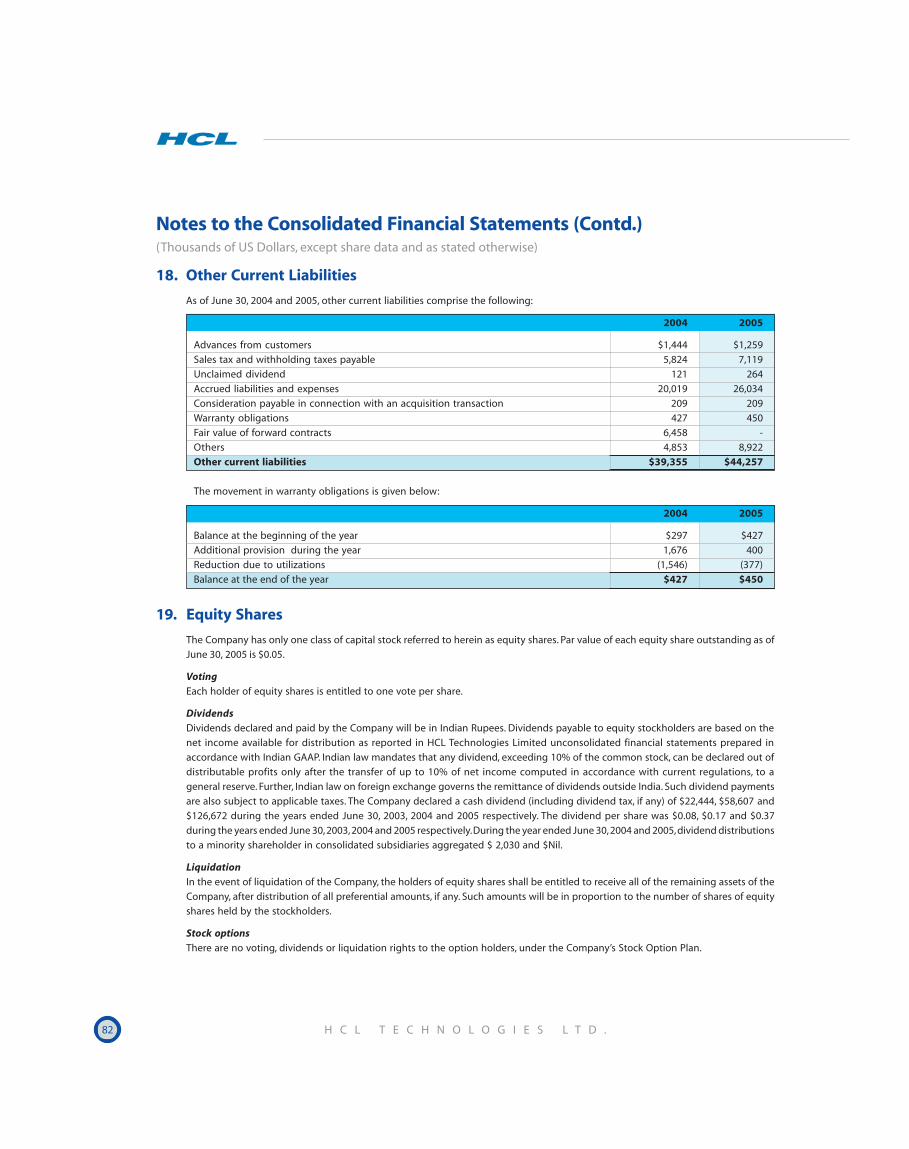
82 H C L T E C H N O L O G I E S L T D .
Notes to the Consolidated Financial Statements (Contd.)(Thousands of US Dollars, except share data and as stated otherwise)
18. Other Current Liabilities
As of June 30, 2004 and 2005, other current liabilities comprise the following:
2004 2005
Advances from customers $1,444 $1,259
Sales tax and withholding taxes payable 5,824 7,119
Unclaimed dividend 121 264
Accrued liabilities and expenses 20,019 26,034
Consideration payable in connection with an acquisition transaction 209 209
Warranty obligations 427 450
Fair value of forward contracts 6,458 -
Others 4,853 8,922
Other current liabilities $39,355 $44,257
The movement in warranty obligations is given below:
2004 2005
Balance at the beginning of the year $297 $427
Additional provision during the year 1,676 400
Reduction due to utilizations (1,546) (377)
Balance at the end of the year $427 $450
19. Equity Shares
The Company has only one class of capital stock referred to herein as equity shares. Par value of each equity share outstanding as of
June 30, 2005 is $0.05.
VotingEach holder of equity shares is entitled to one vote per share.
DividendsDividends declared and paid by the Company will be in Indian Rupees. Dividends payable to equity stockholders are based on the
net income available for distribution as reported in HCL Technologies Limited unconsolidated financial statements prepared in
accordance with Indian GAAP. Indian law mandates that any dividend, exceeding 10% of the common stock, can be declared out of
distributable profits only after the transfer of up to 10% of net income computed in accordance with current regulations, to a
general reserve. Further, Indian law on foreign exchange governs the remittance of dividends outside India. Such dividend payments
are also subject to applicable taxes. The Company declared a cash dividend (including dividend tax, if any) of $22,444, $58,607 and
$126,672 during the years ended June 30, 2003, 2004 and 2005 respectively. The dividend per share was $0.08, $0.17 and $0.37
during the years ended June 30, 2003, 2004 and 2005 respectively. During the year ended June 30, 2004 and 2005, dividend distributions
to a minority shareholder in consolidated subsidiaries aggregated $ 2,030 and $Nil.
LiquidationIn the event of liquidation of the Company, the holders of equity shares shall be entitled to receive all of the remaining assets of the
Company, after distribution of all preferential amounts, if any. Such amounts will be in proportion to the number of shares of equity
shares held by the stockholders.
Stock optionsThere are no voting, dividends or liquidation rights to the option holders, under the Company’s Stock Option Plan.
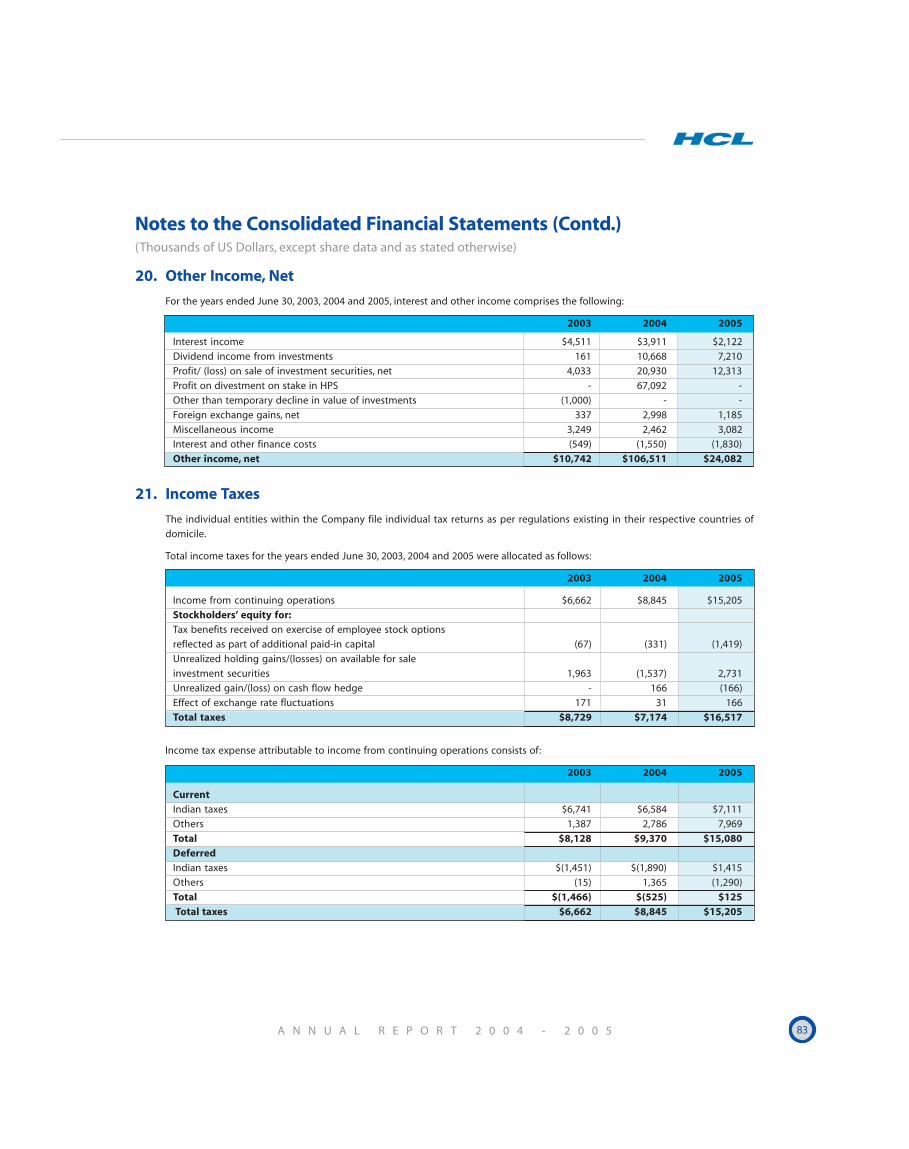
A N N U A L R E P O R T 2 0 0 4 - 2 0 0 5 83
Notes to the Consolidated Financial Statements (Contd.)(Thousands of US Dollars, except share data and as stated otherwise)
20. Other Income, Net
For the years ended June 30, 2003, 2004 and 2005, interest and other income comprises the following:
2003 2004 2005
Interest income $4,511 $3,911 $2,122
Dividend income from investments 161 10,668 7,210
Profit/ (loss) on sale of investment securities, net 4,033 20,930 12,313
Profit on divestment on stake in HPS - 67,092 -
Other than temporary decline in value of investments (1,000) - -
Foreign exchange gains, net 337 2,998 1,185
Miscellaneous income 3,249 2,462 3,082
Interest and other finance costs (549) (1,550) (1,830)
Other income, net $10,742 $106,511 $24,082
21. Income Taxes
The individual entities within the Company file individual tax returns as per regulations existing in their respective countries of
domicile.
Total income taxes for the years ended June 30, 2003, 2004 and 2005 were allocated as follows:
2003 2004 2005
Income from continuing operations $6,662 $8,845 $15,205
Stockholders’ equity for:Tax benefits received on exercise of employee stock options
reflected as part of additional paid-in capital (67) (331) (1,419)
Unrealized holding gains/(losses) on available for sale
investment securities 1,963 (1,537) 2,731
Unrealized gain/(loss) on cash flow hedge - 166 (166)
Effect of exchange rate fluctuations 171 31 166
Total taxes $8,729 $7,174 $16,517
Income tax expense attributable to income from continuing operations consists of:
2003 2004 2005
CurrentIndian taxes $6,741 $6,584 $7,111
Others 1,387 2,786 7,969
Total $8,128 $9,370 $15,080DeferredIndian taxes $(1,451) $(1,890) $1,415
Others (15) 1,365 (1,290)
Total $(1,466) $(525) $125
Total taxes $6,662 $8,845 $15,205
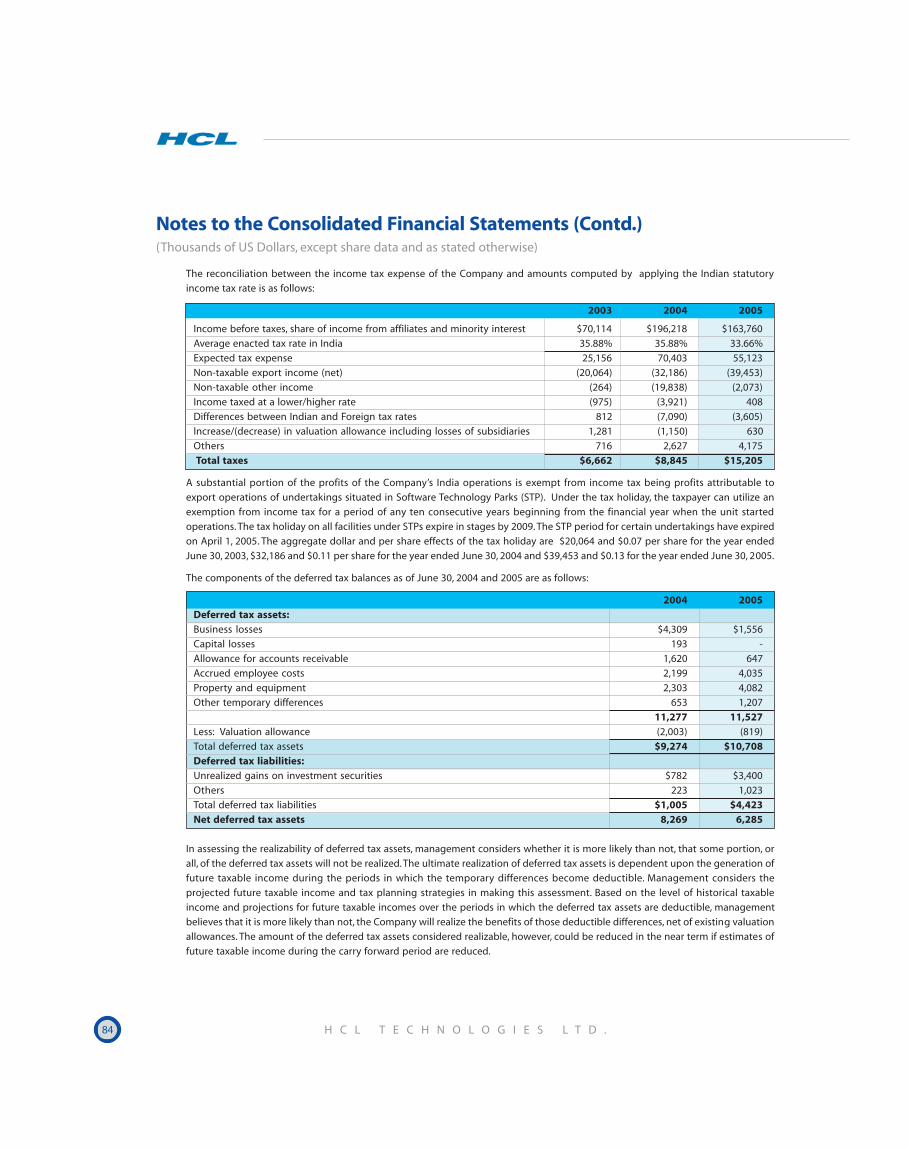
84 H C L T E C H N O L O G I E S L T D .
Notes to the Consolidated Financial Statements (Contd.)(Thousands of US Dollars, except share data and as stated otherwise)
The reconciliation between the income tax expense of the Company and amounts computed by applying the Indian statutory
income tax rate is as follows:
2003 2004 2005
Income before taxes, share of income from affiliates and minority interest $70,114 $196,218 $163,760
Average enacted tax rate in India 35.88% 35.88% 33.66%
Expected tax expense 25,156 70,403 55,123
Non-taxable export income (net) (20,064) (32,186) (39,453)
Non-taxable other income (264) (19,838) (2,073)
Income taxed at a lower/higher rate (975) (3,921) 408
Differences between Indian and Foreign tax rates 812 (7,090) (3,605)
Increase/(decrease) in valuation allowance including losses of subsidiaries 1,281 (1,150) 630
Others 716 2,627 4,175
Total taxes $6,662 $8,845 $15,205
A substantial portion of the profits of the Company’s India operations is exempt from income tax being profits attributable to
export operations of undertakings situated in Software Technology Parks (STP). Under the tax holiday, the taxpayer can utilize an
exemption from income tax for a period of any ten consecutive years beginning from the financial year when the unit started
operations. The tax holiday on all facilities under STPs expire in stages by 2009. The STP period for certain undertakings have expired
on April 1, 2005. The aggregate dollar and per share effects of the tax holiday are $20,064 and $0.07 per share for the year ended
June 30, 2003, $32,186 and $0.11 per share for the year ended June 30, 2004 and $39,453 and $0.13 for the year ended June 30, 2005.
The components of the deferred tax balances as of June 30, 2004 and 2005 are as follows:
2004 2005Deferred tax assets:Business losses $4,309 $1,556
Capital losses 193 -
Allowance for accounts receivable 1,620 647
Accrued employee costs 2,199 4,035
Property and equipment 2,303 4,082
Other temporary differences 653 1,207
11,277 11,527
Less: Valuation allowance (2,003) (819)
Total deferred tax assets $9,274 $10,708Deferred tax liabilities:Unrealized gains on investment securities $782 $3,400
Others 223 1,023
Total deferred tax liabilities $1,005 $4,423Net deferred tax assets 8,269 6,285
In assessing the realizability of deferred tax assets, management considers whether it is more likely than not, that some portion, or
all, of the deferred tax assets will not be realized. The ultimate realization of deferred tax assets is dependent upon the generation of
future taxable income during the periods in which the temporary differences become deductible. Management considers the
projected future taxable income and tax planning strategies in making this assessment. Based on the level of historical taxable
income and projections for future taxable incomes over the periods in which the deferred tax assets are deductible, management
believes that it is more likely than not, the Company will realize the benefits of those deductible differences, net of existing valuation
allowances. The amount of the deferred tax assets considered realizable, however, could be reduced in the near term if estimates of
future taxable income during the carry forward period are reduced.
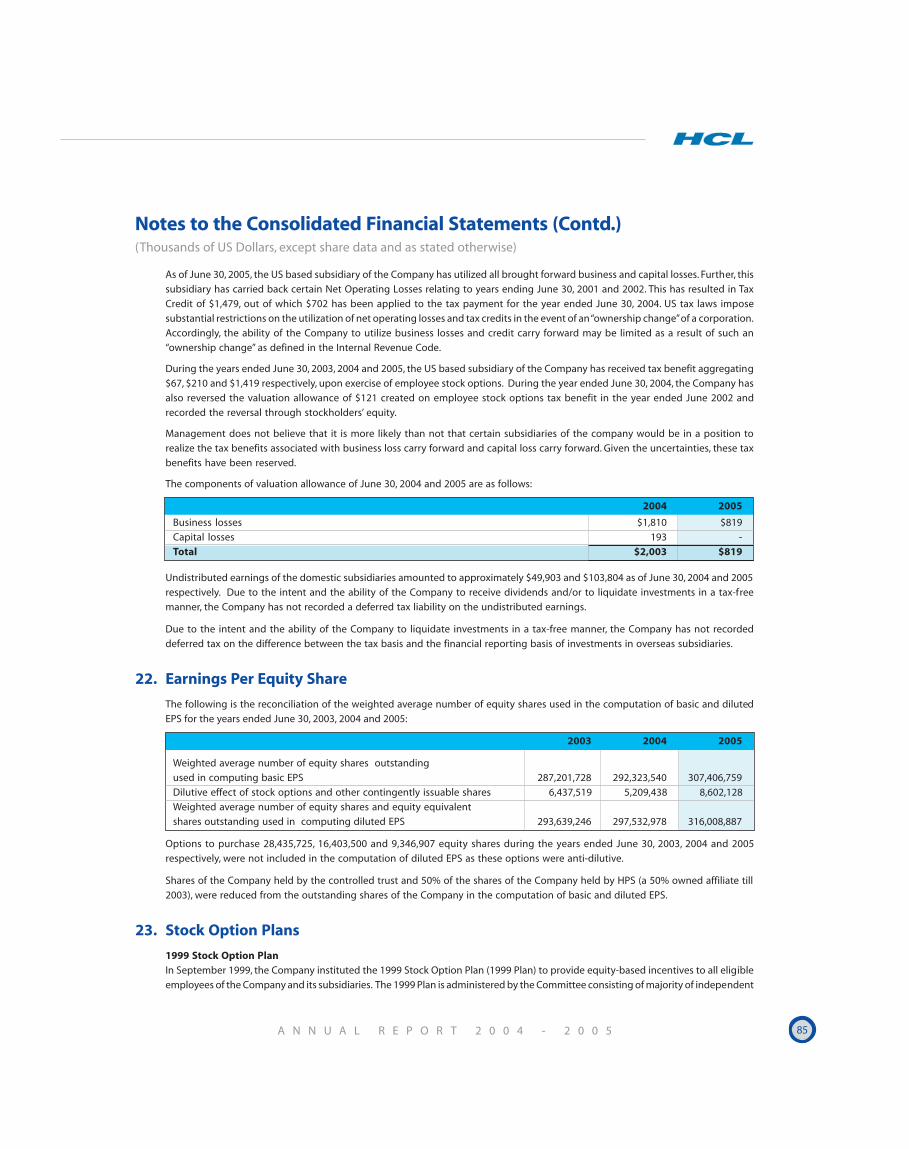
A N N U A L R E P O R T 2 0 0 4 - 2 0 0 5 85
Notes to the Consolidated Financial Statements (Contd.)(Thousands of US Dollars, except share data and as stated otherwise)
As of June 30, 2005, the US based subsidiary of the Company has utilized all brought forward business and capital losses. Further, this
subsidiary has carried back certain Net Operating Losses relating to years ending June 30, 2001 and 2002. This has resulted in Tax
Credit of $1,479, out of which $702 has been applied to the tax payment for the year ended June 30, 2004. US tax laws impose
substantial restrictions on the utilization of net operating losses and tax credits in the event of an “ownership change” of a corporation.
Accordingly, the ability of the Company to utilize business losses and credit carry forward may be limited as a result of such an
“ownership change” as defined in the Internal Revenue Code.
During the years ended June 30, 2003, 2004 and 2005, the US based subsidiary of the Company has received tax benefit aggregating
$67, $210 and $1,419 respectively, upon exercise of employee stock options. During the year ended June 30, 2004, the Company has
also reversed the valuation allowance of $121 created on employee stock options tax benefit in the year ended June 2002 and
recorded the reversal through stockholders’ equity.
Management does not believe that it is more likely than not that certain subsidiaries of the company would be in a position to
realize the tax benefits associated with business loss carry forward and capital loss carry forward. Given the uncertainties, these tax
benefits have been reserved.
The components of valuation allowance of June 30, 2004 and 2005 are as follows:
2004 2005
Business losses $1,810 $819
Capital losses 193 -
Total $2,003 $819
Undistributed earnings of the domestic subsidiaries amounted to approximately $49,903 and $103,804 as of June 30, 2004 and 2005
respectively. Due to the intent and the ability of the Company to receive dividends and/or to liquidate investments in a tax-free
manner, the Company has not recorded a deferred tax liability on the undistributed earnings.
Due to the intent and the ability of the Company to liquidate investments in a tax-free manner, the Company has not recorded
deferred tax on the difference between the tax basis and the financial reporting basis of investments in overseas subsidiaries.
22. Earnings Per Equity Share
The following is the reconciliation of the weighted average number of equity shares used in the computation of basic and diluted
EPS for the years ended June 30, 2003, 2004 and 2005:
2003 2004 2005
Weighted average number of equity shares outstanding
used in computing basic EPS 287,201,728 292,323,540 307,406,759
Dilutive effect of stock options and other contingently issuable shares 6,437,519 5,209,438 8,602,128
Weighted average number of equity shares and equity equivalent
shares outstanding used in computing diluted EPS 293,639,246 297,532,978 316,008,887
Options to purchase 28,435,725, 16,403,500 and 9,346,907 equity shares during the years ended June 30, 2003, 2004 and 2005
respectively, were not included in the computation of diluted EPS as these options were anti-dilutive.
Shares of the Company held by the controlled trust and 50% of the shares of the Company held by HPS (a 50% owned affiliate till
2003), were reduced from the outstanding shares of the Company in the computation of basic and diluted EPS.
23. Stock Option Plans
1999 Stock Option PlanIn September 1999, the Company instituted the 1999 Stock Option Plan (1999 Plan) to provide equity-based incentives to all eligible
employees of the Company and its subsidiaries. The 1999 Plan is administered by the Committee consisting of majority of independent
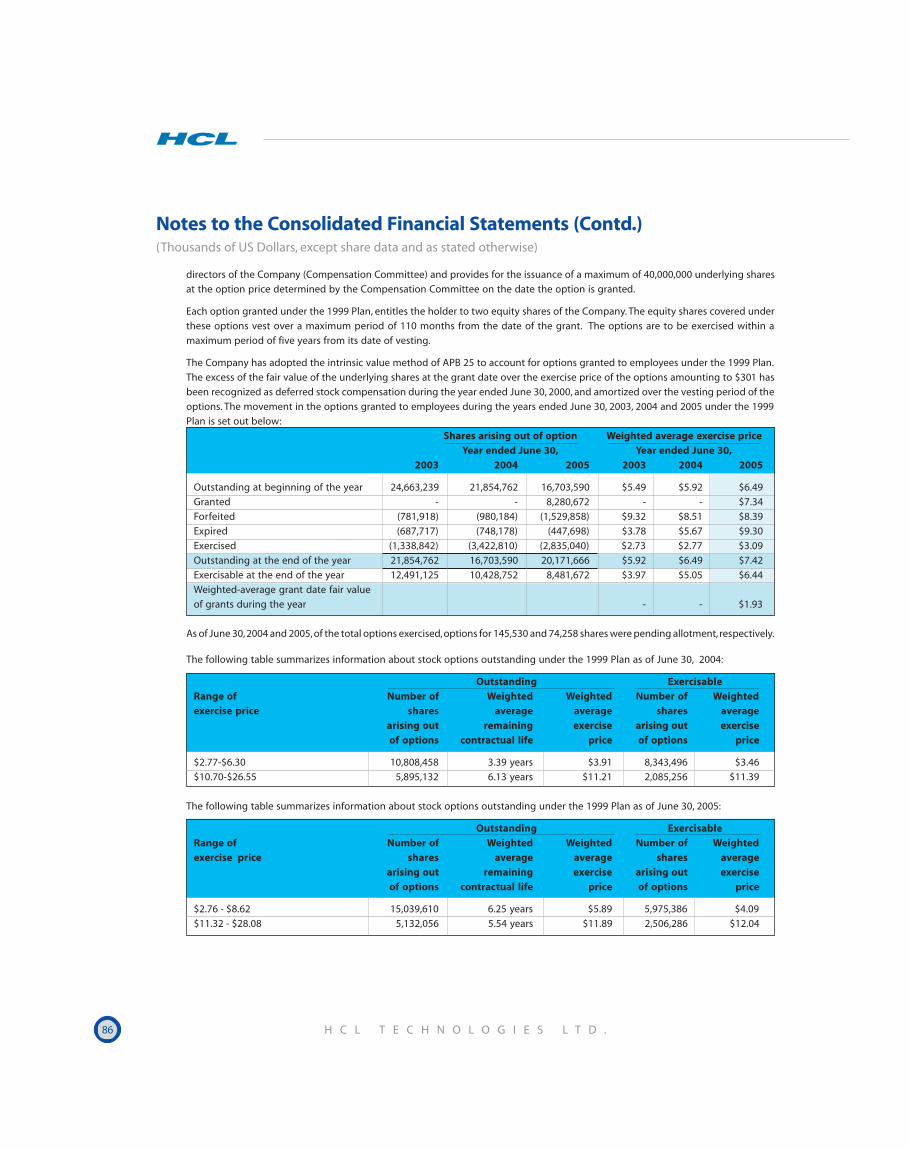
86 H C L T E C H N O L O G I E S L T D .
Notes to the Consolidated Financial Statements (Contd.)(Thousands of US Dollars, except share data and as stated otherwise)
directors of the Company (Compensation Committee) and provides for the issuance of a maximum of 40,000,000 underlying shares
at the option price determined by the Compensation Committee on the date the option is granted.
Each option granted under the 1999 Plan, entitles the holder to two equity shares of the Company. The equity shares covered under
these options vest over a maximum period of 110 months from the date of the grant. The options are to be exercised within a
maximum period of five years from its date of vesting.
The Company has adopted the intrinsic value method of APB 25 to account for options granted to employees under the 1999 Plan.
The excess of the fair value of the underlying shares at the grant date over the exercise price of the options amounting to $301 has
been recognized as deferred stock compensation during the year ended June 30, 2000, and amortized over the vesting period of the
options. The movement in the options granted to employees during the years ended June 30, 2003, 2004 and 2005 under the 1999
Plan is set out below:
Shares arising out of option Weighted average exercise priceYear ended June 30, Year ended June 30,
2003 2004 2005 2003 2004 2005
Outstanding at beginning of the year 24,663,239 21,854,762 16,703,590 $5.49 $5.92 $6.49
Granted - - 8,280,672 - - $7.34
Forfeited (781,918) (980,184) (1,529,858) $9.32 $8.51 $8.39
Expired (687,717) (748,178) (447,698) $3.78 $5.67 $9.30
Exercised (1,338,842) (3,422,810) (2,835,040) $2.73 $2.77 $3.09
Outstanding at the end of the year 21,854,762 16,703,590 20,171,666 $5.92 $6.49 $7.42
Exercisable at the end of the year 12,491,125 10,428,752 8,481,672 $3.97 $5.05 $6.44
Weighted-average grant date fair value
of grants during the year - - $1.93
As of June 30, 2004 and 2005, of the total options exercised, options for 145,530 and 74,258 shares were pending allotment, respectively.
The following table summarizes information about stock options outstanding under the 1999 Plan as of June 30, 2004:
Outstanding ExercisableRange of Number of Weighted Weighted Number of Weightedexercise price shares average average shares average
arising out remaining exercise arising out exerciseof options contractual life price of options price
$2.77-$6.30 10,808,458 3.39 years $3.91 8,343,496 $3.46
$10.70-$26.55 5,895,132 6.13 years $11.21 2,085,256 $11.39
The following table summarizes information about stock options outstanding under the 1999 Plan as of June 30, 2005:
Outstanding ExercisableRange of Number of Weighted Weighted Number of Weightedexercise price shares average average shares average
arising out remaining exercise arising out exerciseof options contractual life price of options price
$2.76 - $8.62 15,039,610 6.25 years $5.89 5,975,386 $4.09
$11.32 - $28.08 5,132,056 5.54 years $11.89 2,506,286 $12.04
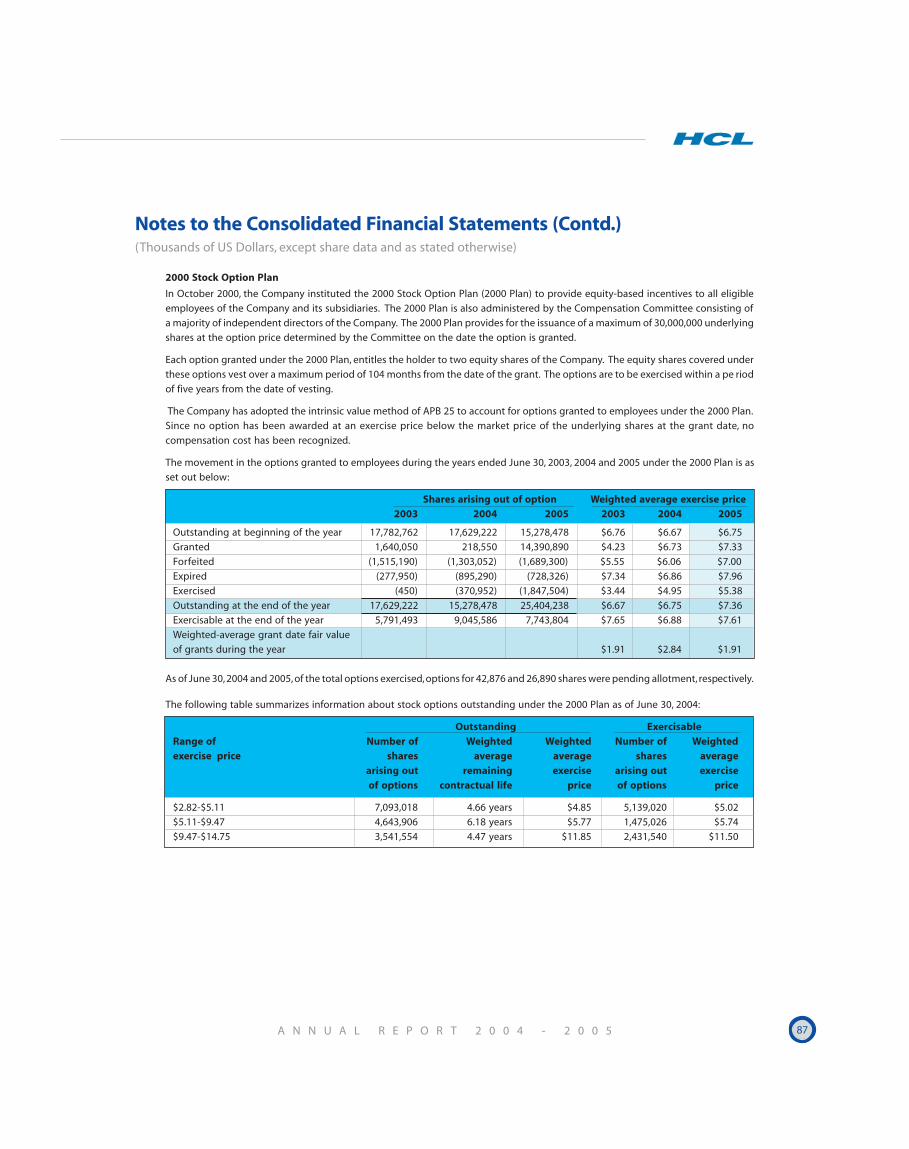
A N N U A L R E P O R T 2 0 0 4 - 2 0 0 5 87
Notes to the Consolidated Financial Statements (Contd.)(Thousands of US Dollars, except share data and as stated otherwise)
2000 Stock Option Plan
In October 2000, the Company instituted the 2000 Stock Option Plan (2000 Plan) to provide equity-based incentives to all eligible
employees of the Company and its subsidiaries. The 2000 Plan is also administered by the Compensation Committee consisting of
a majority of independent directors of the Company. The 2000 Plan provides for the issuance of a maximum of 30,000,000 underlying
shares at the option price determined by the Committee on the date the option is granted.
Each option granted under the 2000 Plan, entitles the holder to two equity shares of the Company. The equity shares covered under
these options vest over a maximum period of 104 months from the date of the grant. The options are to be exercised within a pe riod
of five years from the date of vesting.
The Company has adopted the intrinsic value method of APB 25 to account for options granted to employees under the 2000 Plan.
Since no option has been awarded at an exercise price below the market price of the underlying shares at the grant date, no
compensation cost has been recognized.
The movement in the options granted to employees during the years ended June 30, 2003, 2004 and 2005 under the 2000 Plan is as
set out below:
Shares arising out of option Weighted average exercise price2003 2004 2005 2003 2004 2005
Outstanding at beginning of the year 17,782,762 17,629,222 15,278,478 $6.76 $6.67 $6.75
Granted 1,640,050 218,550 14,390,890 $4.23 $6.73 $7.33
Forfeited (1,515,190) (1,303,052) (1,689,300) $5.55 $6.06 $7.00
Expired (277,950) (895,290) (728,326) $7.34 $6.86 $7.96
Exercised (450) (370,952) (1,847,504) $3.44 $4.95 $5.38
Outstanding at the end of the year 17,629,222 15,278,478 25,404,238 $6.67 $6.75 $7.36
Exercisable at the end of the year 5,791,493 9,045,586 7,743,804 $7.65 $6.88 $7.61
Weighted-average grant date fair value
of grants during the year $1.91 $2.84 $1.91
As of June 30, 2004 and 2005, of the total options exercised, options for 42,876 and 26,890 shares were pending allotment, respectively.
The following table summarizes information about stock options outstanding under the 2000 Plan as of June 30, 2004:
Outstanding Exercisable
Range of Number of Weighted Weighted Number of Weightedexercise price shares average average shares average
arising out remaining exercise arising out exerciseof options contractual life price of options price
$2.82-$5.11 7,093,018 4.66 years $4.85 5,139,020 $5.02
$5.11-$9.47 4,643,906 6.18 years $5.77 1,475,026 $5.74
$9.47-$14.75 3,541,554 4.47 years $11.85 2,431,540 $11.50
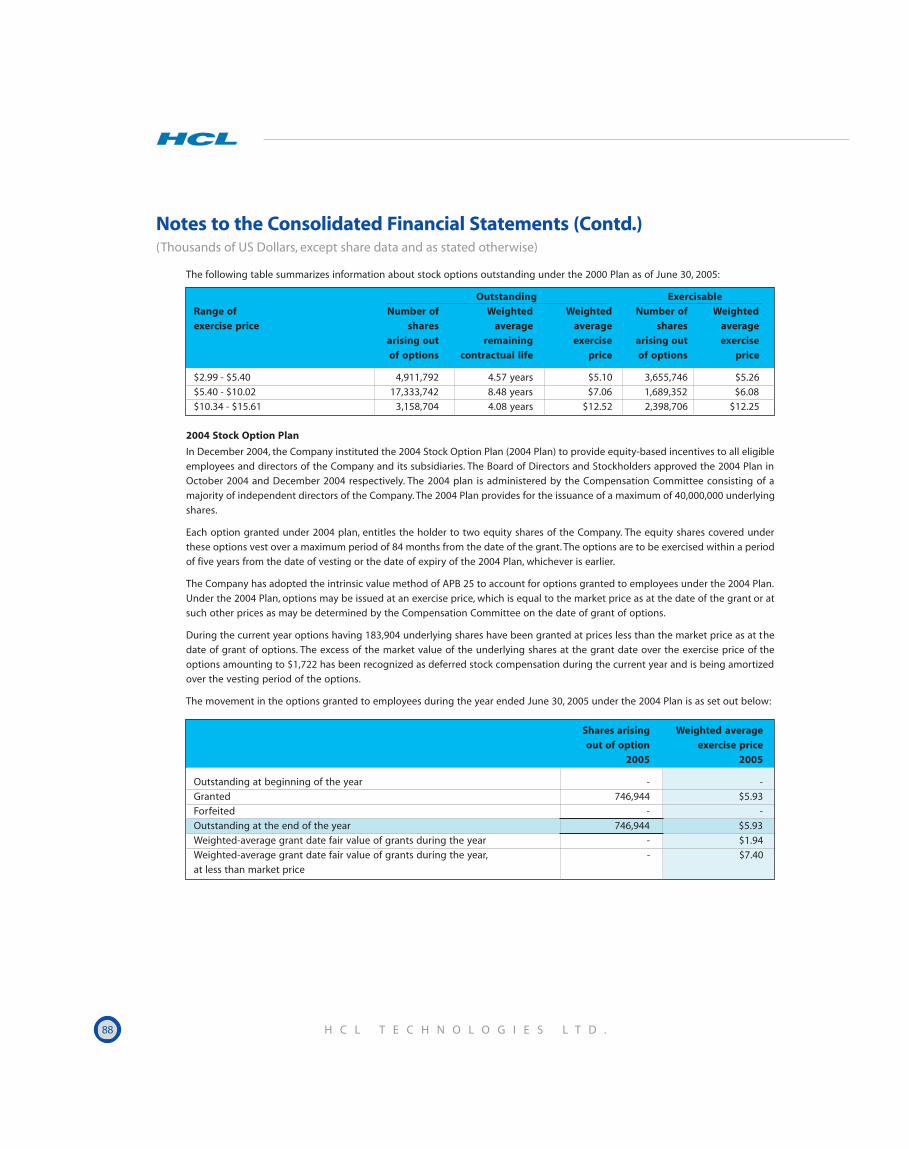
88 H C L T E C H N O L O G I E S L T D .
Notes to the Consolidated Financial Statements (Contd.)(Thousands of US Dollars, except share data and as stated otherwise)
The following table summarizes information about stock options outstanding under the 2000 Plan as of June 30, 2005:
Outstanding ExercisableRange of Number of Weighted Weighted Number of Weightedexercise price shares average average shares average
arising out remaining exercise arising out exerciseof options contractual life price of options price
$2.99 - $5.40 4,911,792 4.57 years $5.10 3,655,746 $5.26
$5.40 - $10.02 17,333,742 8.48 years $7.06 1,689,352 $6.08
$10.34 - $15.61 3,158,704 4.08 years $12.52 2,398,706 $12.25
2004 Stock Option Plan
In December 2004, the Company instituted the 2004 Stock Option Plan (2004 Plan) to provide equity-based incentives to all eligible
employees and directors of the Company and its subsidiaries. The Board of Directors and Stockholders approved the 2004 Plan in
October 2004 and December 2004 respectively. The 2004 plan is administered by the Compensation Committee consisting of a
majority of independent directors of the Company. The 2004 Plan provides for the issuance of a maximum of 40,000,000 underlying
shares.
Each option granted under 2004 plan, entitles the holder to two equity shares of the Company. The equity shares covered under
these options vest over a maximum period of 84 months from the date of the grant. The options are to be exercised within a period
of five years from the date of vesting or the date of expiry of the 2004 Plan, whichever is earlier.
The Company has adopted the intrinsic value method of APB 25 to account for options granted to employees under the 2004 Plan.
Under the 2004 Plan, options may be issued at an exercise price, which is equal to the market price as at the date of the grant or at
such other prices as may be determined by the Compensation Committee on the date of grant of options.
During the current year options having 183,904 underlying shares have been granted at prices less than the market price as at the
date of grant of options. The excess of the market value of the underlying shares at the grant date over the exercise price of the
options amounting to $1,722 has been recognized as deferred stock compensation during the current year and is being amortized
over the vesting period of the options.
The movement in the options granted to employees during the year ended June 30, 2005 under the 2004 Plan is as set out below:
Shares arising Weighted averageout of option exercise price
2005 2005
Outstanding at beginning of the year - -
Granted 746,944 $5.93
Forfeited - -
Outstanding at the end of the year 746,944 $5.93
Weighted-average grant date fair value of grants during the year - $1.94
Weighted-average grant date fair value of grants during the year, - $7.40
at less than market price
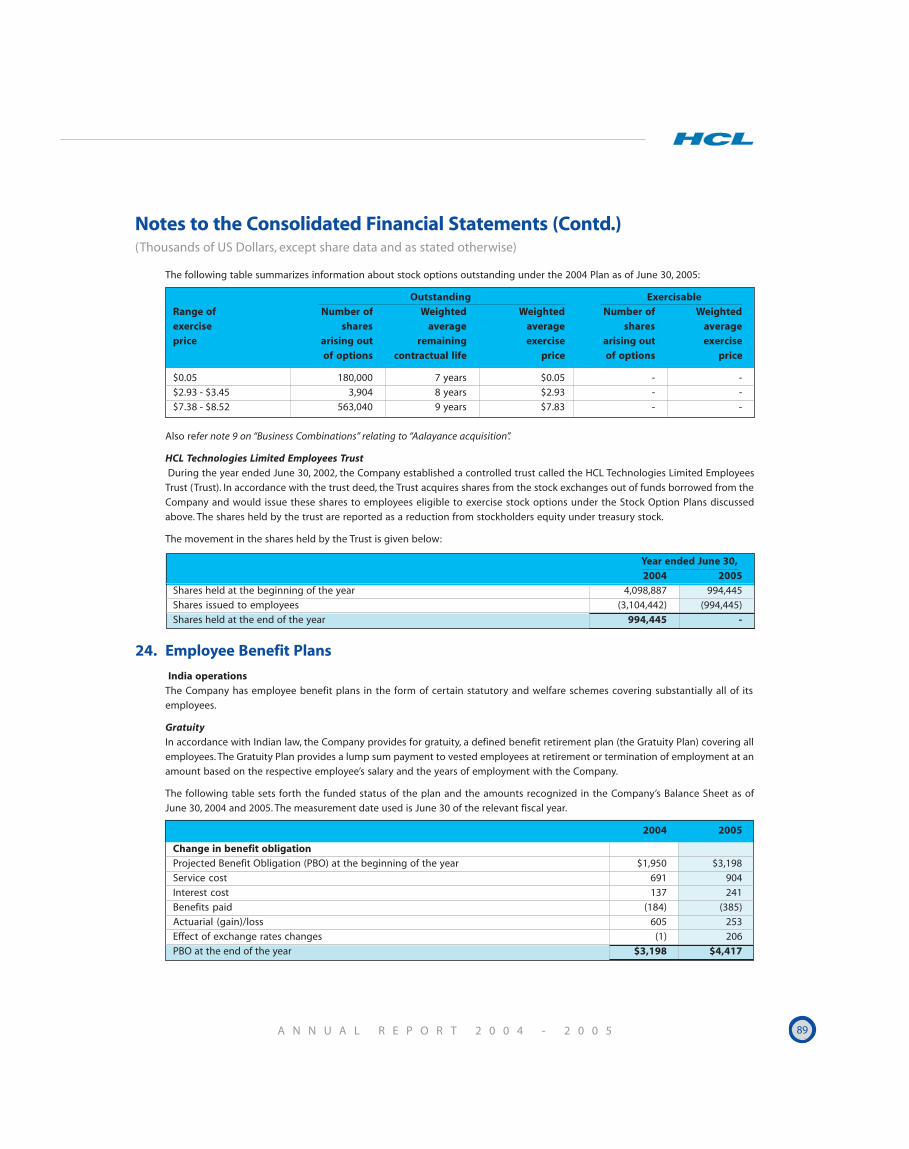
A N N U A L R E P O R T 2 0 0 4 - 2 0 0 5 89
Notes to the Consolidated Financial Statements (Contd.)(Thousands of US Dollars, except share data and as stated otherwise)
The following table summarizes information about stock options outstanding under the 2004 Plan as of June 30, 2005:
Outstanding ExercisableRange of Number of Weighted Weighted Number of Weightedexercise shares average average shares averageprice arising out remaining exercise arising out exercise
of options contractual life price of options price
$0.05 180,000 7 years $0.05 - -
$2.93 - $3.45 3,904 8 years $2.93 - -
$7.38 - $8.52 563,040 9 years $7.83 - -
Also refer note 9 on “Business Combinations” relating to “Aalayance acquisition”.
HCL Technologies Limited Employees Trust
During the year ended June 30, 2002, the Company established a controlled trust called the HCL Technologies Limited Employees
Trust (Trust). In accordance with the trust deed, the Trust acquires shares from the stock exchanges out of funds borrowed from the
Company and would issue these shares to employees eligible to exercise stock options under the Stock Option Plans discussed
above. The shares held by the trust are reported as a reduction from stockholders equity under treasury stock.
The movement in the shares held by the Trust is given below:
Year ended June 30,2004 2005
Shares held at the beginning of the year 4,098,887 994,445
Shares issued to employees (3,104,442) (994,445)
Shares held at the end of the year 994,445 -
24. Employee Benefit Plans
India operationsThe Company has employee benefit plans in the form of certain statutory and welfare schemes covering substantially all of its
employees.
GratuityIn accordance with Indian law, the Company provides for gratuity, a defined benefit retirement plan (the Gratuity Plan) covering all
employees. The Gratuity Plan provides a lump sum payment to vested employees at retirement or termination of employment at an
amount based on the respective employee’s salary and the years of employment with the Company.
The following table sets forth the funded status of the plan and the amounts recognized in the Company’s Balance Sheet as of
June 30, 2004 and 2005. The measurement date used is June 30 of the relevant fiscal year.
2004 2005
Change in benefit obligationProjected Benefit Obligation (PBO) at the beginning of the year $1,950 $3,198
Service cost 691 904
Interest cost 137 241
Benefits paid (184) (385)
Actuarial (gain)/loss 605 253
Effect of exchange rates changes (1) 206
PBO at the end of the year $3,198 $4,417
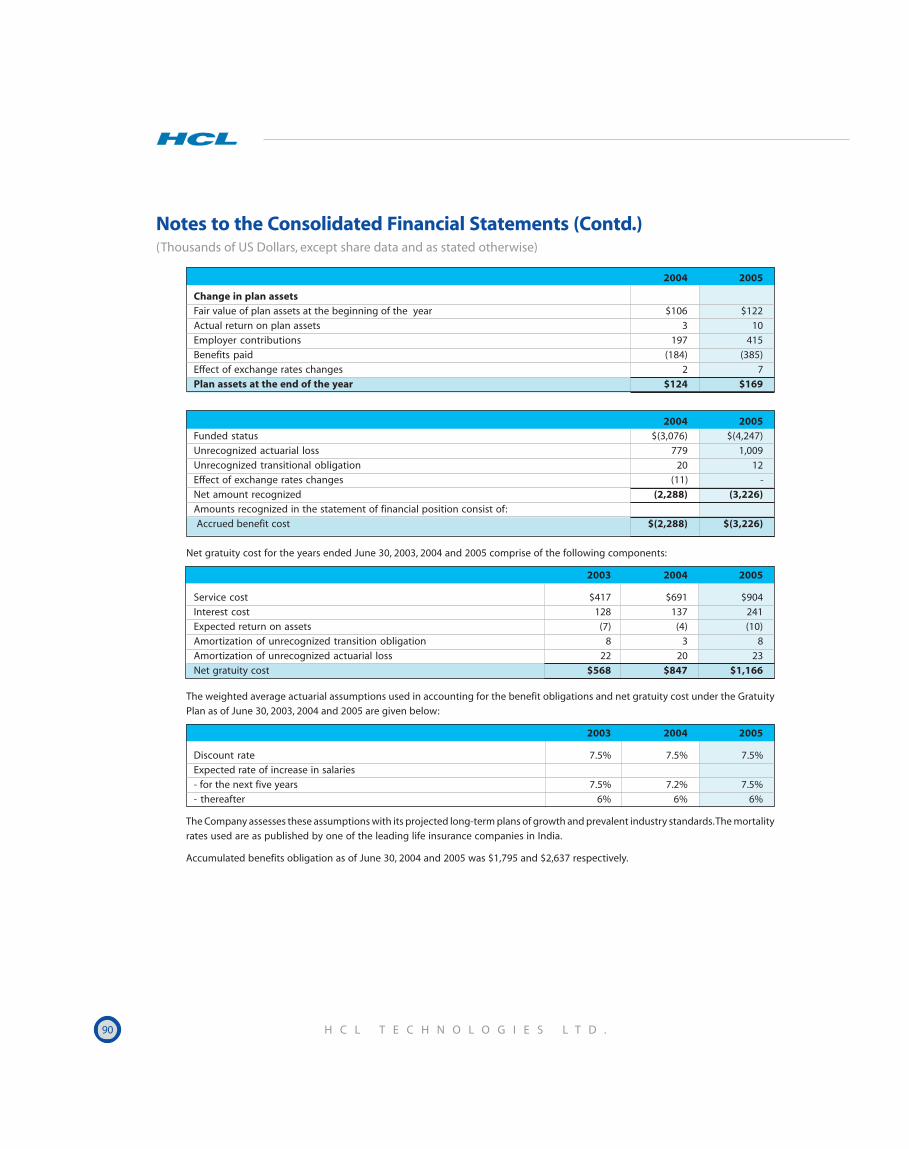
90 H C L T E C H N O L O G I E S L T D .
Notes to the Consolidated Financial Statements (Contd.)(Thousands of US Dollars, except share data and as stated otherwise)
2004 2005
Change in plan assetsFair value of plan assets at the beginning of the year $106 $122
Actual return on plan assets 3 10
Employer contributions 197 415
Benefits paid (184) (385)
Effect of exchange rates changes 2 7
Plan assets at the end of the year $124 $169
2004 2005Funded status $(3,076) $(4,247)
Unrecognized actuarial loss 779 1,009
Unrecognized transitional obligation 20 12
Effect of exchange rates changes (11) -
Net amount recognized (2,288) (3,226)Amounts recognized in the statement of financial position consist of:
Accrued benefit cost $(2,288) $(3,226)
Net gratuity cost for the years ended June 30, 2003, 2004 and 2005 comprise of the following components:
2003 2004 2005
Service cost $417 $691 $904
Interest cost 128 137 241
Expected return on assets (7) (4) (10)
Amortization of unrecognized transition obligation 8 3 8
Amortization of unrecognized actuarial loss 22 20 23
Net gratuity cost $568 $847 $1,166
The weighted average actuarial assumptions used in accounting for the benefit obligations and net gratuity cost under the Gratuity
Plan as of June 30, 2003, 2004 and 2005 are given below:
2003 2004 2005
Discount rate 7.5% 7.5% 7.5%
Expected rate of increase in salaries
- for the next five years 7.5% 7.2% 7.5%
- thereafter 6% 6% 6%
The Company assesses these assumptions with its projected long-term plans of growth and prevalent industry standards. The mortality
rates used are as published by one of the leading life insurance companies in India.
Accumulated benefits obligation as of June 30, 2004 and 2005 was $1,795 and $2,637 respectively.
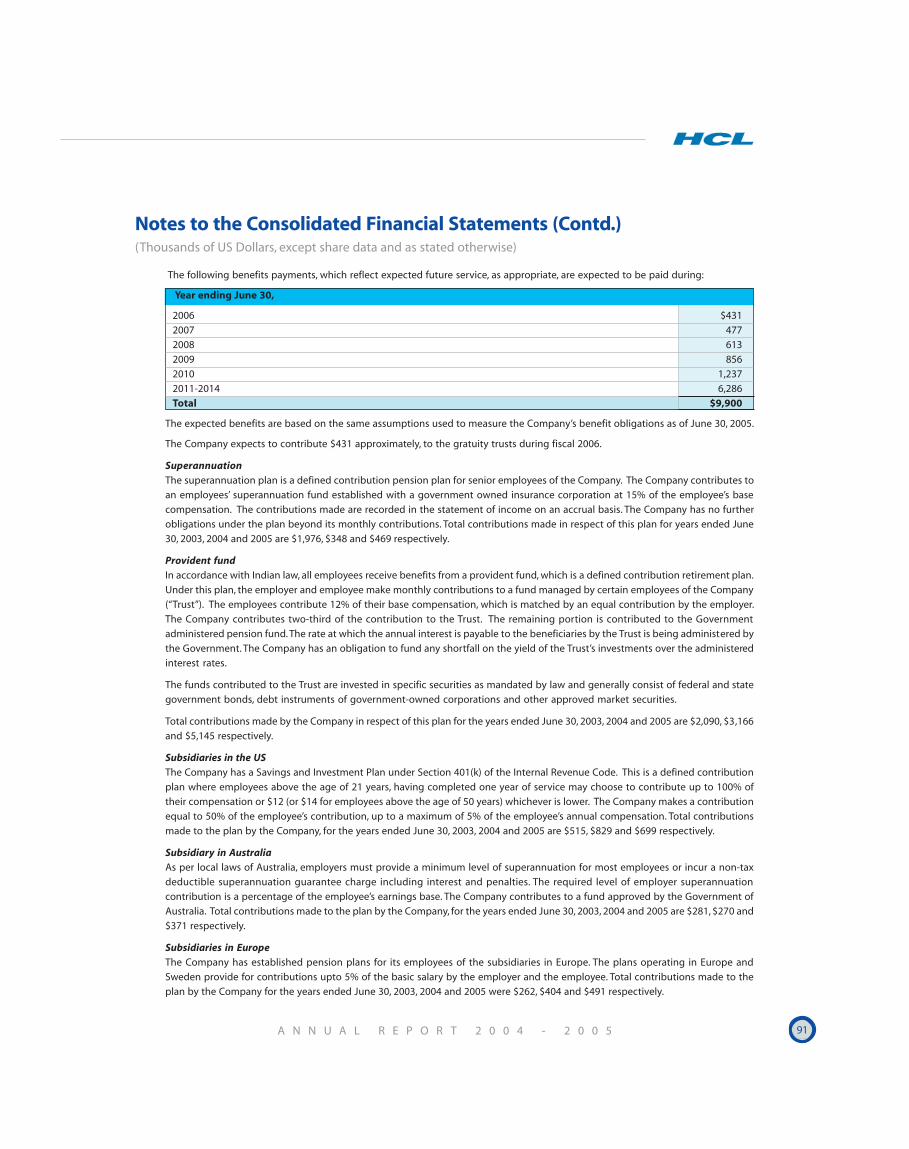
A N N U A L R E P O R T 2 0 0 4 - 2 0 0 5 91
Notes to the Consolidated Financial Statements (Contd.)(Thousands of US Dollars, except share data and as stated otherwise)
The following benefits payments, which reflect expected future service, as appropriate, are expected to be paid during:
Year ending June 30,
2006 $431
2007 477
2008 613
2009 856
2010 1,237
2011-2014 6,286
Total $9,900
The expected benefits are based on the same assumptions used to measure the Company’s benefit obligations as of June 30, 2005.
The Company expects to contribute $431 approximately, to the gratuity trusts during fiscal 2006.
SuperannuationThe superannuation plan is a defined contribution pension plan for senior employees of the Company. The Company contributes to
an employees’ superannuation fund established with a government owned insurance corporation at 15% of the employee’s base
compensation. The contributions made are recorded in the statement of income on an accrual basis. The Company has no further
obligations under the plan beyond its monthly contributions. Total contributions made in respect of this plan for years ended June
30, 2003, 2004 and 2005 are $1,976, $348 and $469 respectively.
Provident fundIn accordance with Indian law, all employees receive benefits from a provident fund, which is a defined contribution retirement plan.
Under this plan, the employer and employee make monthly contributions to a fund managed by certain employees of the Company
(“Trust”). The employees contribute 12% of their base compensation, which is matched by an equal contribution by the employer.
The Company contributes two-third of the contribution to the Trust. The remaining portion is contributed to the Government
administered pension fund. The rate at which the annual interest is payable to the beneficiaries by the Trust is being administered by
the Government. The Company has an obligation to fund any shortfall on the yield of the Trust’s investments over the administered
interest rates.
The funds contributed to the Trust are invested in specific securities as mandated by law and generally consist of federal and state
government bonds, debt instruments of government-owned corporations and other approved market securities.
Total contributions made by the Company in respect of this plan for the years ended June 30, 2003, 2004 and 2005 are $2,090, $3,166
and $5,145 respectively.
Subsidiaries in the USThe Company has a Savings and Investment Plan under Section 401(k) of the Internal Revenue Code. This is a defined contribution
plan where employees above the age of 21 years, having completed one year of service may choose to contribute up to 100% of
their compensation or $12 (or $14 for employees above the age of 50 years) whichever is lower. The Company makes a contribution
equal to 50% of the employee’s contribution, up to a maximum of 5% of the employee’s annual compensation. Total contributions
made to the plan by the Company, for the years ended June 30, 2003, 2004 and 2005 are $515, $829 and $699 respectively.
Subsidiary in AustraliaAs per local laws of Australia, employers must provide a minimum level of superannuation for most employees or incur a non-tax
deductible superannuation guarantee charge including interest and penalties. The required level of employer superannuation
contribution is a percentage of the employee’s earnings base. The Company contributes to a fund approved by the Government of
Australia. Total contributions made to the plan by the Company, for the years ended June 30, 2003, 2004 and 2005 are $281, $270 and
$371 respectively.
Subsidiaries in EuropeThe Company has established pension plans for its employees of the subsidiaries in Europe. The plans operating in Europe and
Sweden provide for contributions upto 5% of the basic salary by the employer and the employee. Total contributions made to the
plan by the Company for the years ended June 30, 2003, 2004 and 2005 were $262, $404 and $491 respectively.
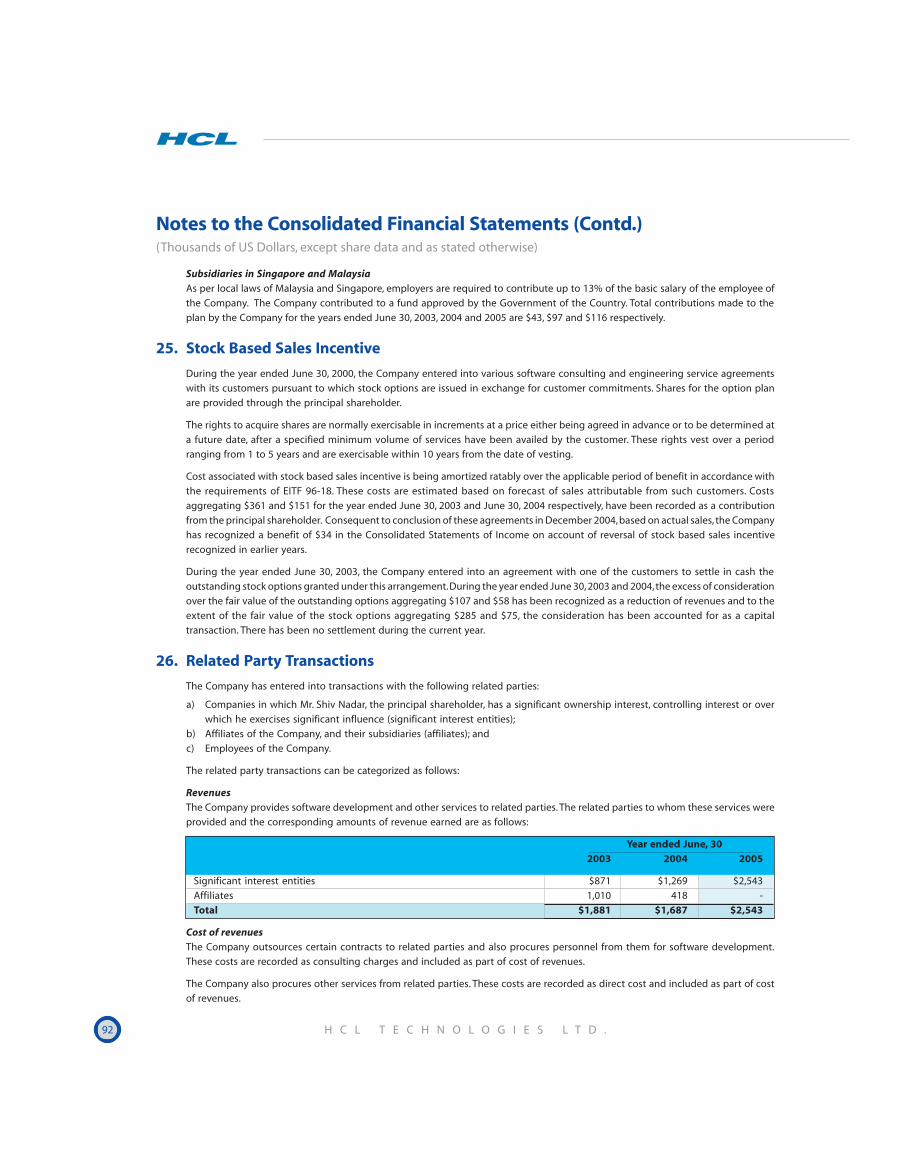
92 H C L T E C H N O L O G I E S L T D .
Notes to the Consolidated Financial Statements (Contd.)(Thousands of US Dollars, except share data and as stated otherwise)
Subsidiaries in Singapore and MalaysiaAs per local laws of Malaysia and Singapore, employers are required to contribute up to 13% of the basic salary of the employee of
the Company. The Company contributed to a fund approved by the Government of the Country. Total contributions made to the
plan by the Company for the years ended June 30, 2003, 2004 and 2005 are $43, $97 and $116 respectively.
25. Stock Based Sales Incentive
During the year ended June 30, 2000, the Company entered into various software consulting and engineering service agreements
with its customers pursuant to which stock options are issued in exchange for customer commitments. Shares for the option plan
are provided through the principal shareholder.
The rights to acquire shares are normally exercisable in increments at a price either being agreed in advance or to be determined at
a future date, after a specified minimum volume of services have been availed by the customer. These rights vest over a period
ranging from 1 to 5 years and are exercisable within 10 years from the date of vesting.
Cost associated with stock based sales incentive is being amortized ratably over the applicable period of benefit in accordance with
the requirements of EITF 96-18. These costs are estimated based on forecast of sales attributable from such customers. Costs
aggregating $361 and $151 for the year ended June 30, 2003 and June 30, 2004 respectively, have been recorded as a contribution
from the principal shareholder. Consequent to conclusion of these agreements in December 2004, based on actual sales, the Company
has recognized a benefit of $34 in the Consolidated Statements of Income on account of reversal of stock based sales incentive
recognized in earlier years.
During the year ended June 30, 2003, the Company entered into an agreement with one of the customers to settle in cash the
outstanding stock options granted under this arrangement. During the year ended June 30, 2003 and 2004, the excess of consideration
over the fair value of the outstanding options aggregating $107 and $58 has been recognized as a reduction of revenues and to the
extent of the fair value of the stock options aggregating $285 and $75, the consideration has been accounted for as a capital
transaction. There has been no settlement during the current year.
26. Related Party Transactions
The Company has entered into transactions with the following related parties:
a) Companies in which Mr. Shiv Nadar, the principal shareholder, has a significant ownership interest, controlling interest or over
which he exercises significant influence (significant interest entities);
b) Affiliates of the Company, and their subsidiaries (affiliates); and
c) Employees of the Company.
The related party transactions can be categorized as follows:
RevenuesThe Company provides software development and other services to related parties. The related parties to whom these services were
provided and the corresponding amounts of revenue earned are as follows:
Year ended June, 30
2003 2004 2005
Significant interest entities $871 $1,269 $2,543
Affiliates 1,010 418 -
Total $1,881 $1,687 $2,543
Cost of revenuesThe Company outsources certain contracts to related parties and also procures personnel from them for software development.
These costs are recorded as consulting charges and included as part of cost of revenues.
The Company also procures other services from related parties. These costs are recorded as direct cost and included as part of cost
of revenues.
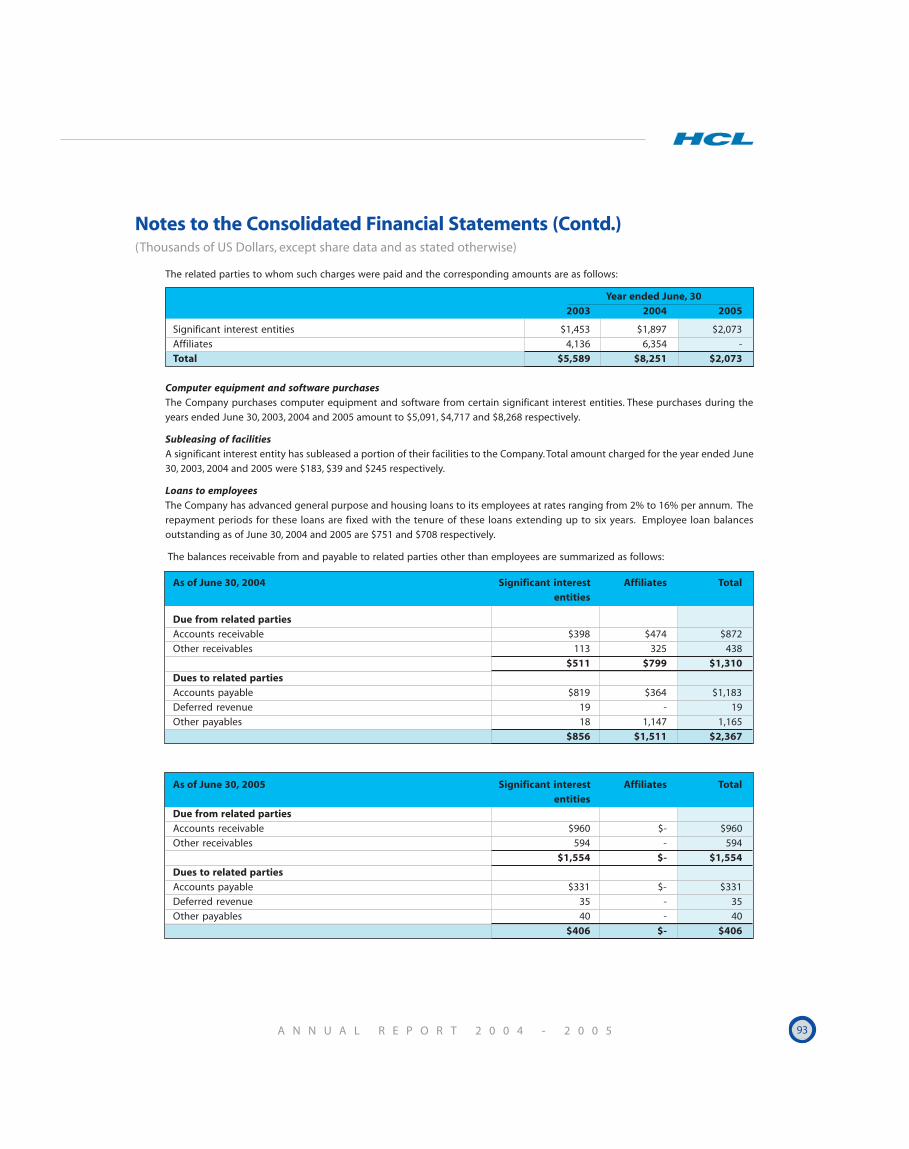
A N N U A L R E P O R T 2 0 0 4 - 2 0 0 5 93
Notes to the Consolidated Financial Statements (Contd.)(Thousands of US Dollars, except share data and as stated otherwise)
The related parties to whom such charges were paid and the corresponding amounts are as follows:
Year ended June, 302003 2004 2005
Significant interest entities $1,453 $1,897 $2,073
Affiliates 4,136 6,354 -
Total $5,589 $8,251 $2,073
Computer equipment and software purchasesThe Company purchases computer equipment and software from certain significant interest entities. These purchases during the
years ended June 30, 2003, 2004 and 2005 amount to $5,091, $4,717 and $8,268 respectively.
Subleasing of facilitiesA significant interest entity has subleased a portion of their facilities to the Company. Total amount charged for the year ended June
30, 2003, 2004 and 2005 were $183, $39 and $245 respectively.
Loans to employees
The Company has advanced general purpose and housing loans to its employees at rates ranging from 2% to 16% per annum. The
repayment periods for these loans are fixed with the tenure of these loans extending up to six years. Employee loan balances
outstanding as of June 30, 2004 and 2005 are $751 and $708 respectively.
The balances receivable from and payable to related parties other than employees are summarized as follows:
As of June 30, 2004 Significant interest Affiliates Totalentities
Due from related partiesAccounts receivable $398 $474 $872
Other receivables 113 325 438
$511 $799 $1,310
Dues to related partiesAccounts payable $819 $364 $1,183
Deferred revenue 19 - 19
Other payables 18 1,147 1,165
$856 $1,511 $2,367
As of June 30, 2005 Significant interest Affiliates Totalentities
Due from related partiesAccounts receivable $960 $- $960
Other receivables 594 - 594
$1,554 $- $1,554Dues to related partiesAccounts payable $331 $- $331
Deferred revenue 35 - 35
Other payables 40 - 40
$406 $- $406
94 H C L T E C H N O L O G I E S L T D .
Notes to the Consolidated Financial Statements (Contd.)(Thousands of US Dollars, except share data and as stated otherwise)
27. Contingencies and Commitments
Capital commitments
As of June 30, 2005, the Company had committed to spend $9,028 under agreements to purchase property and equipment. This
amount is net of capital advances paid in respect of these purchases.
Other commitmentsThe Company’s software development centers in India are 100% Export Oriented (EOU)/STP units under the STP guidelines issued by
the Government of India. These units are exempted from customs and central excise duties and levies on imported and indigenous
capital goods and stores and spares. The Company has executed legal undertakings to pay customs duty, central excise duty, levies
and liquidated damages payable, if any, in respect of imported and indigenous capital goods and stores and spares consumed duty
free, in the event that certain terms and conditions are not fulfilled.
GuaranteesThe Company generally provides guarantees to the Excise and Custom authorities as security for compliance with local regulation
and to various parties on behalf of its subsidiaries. The aggregate amount of these guarantees as of June 30, 2005 is $4,690.
28. Segment Reporting
The Company’s operations predominantly relate to providing a range of information technology services targeted at technology
vendors, software product companies and medium to large end-user organizations. The Company is also engaged in the business of
providing networking services and business process outsourcing services.
Networking services involve the sale of networking equipment and software, installations and provision of access and maintenance
services. Business process outsourcing services involve the provision of customer contact center and technical help desk services.
The Chairman of the Company has been identified as the Chief Operating Decision Maker (CODM) as defined by SFAS No. 131. The
CODM evaluates the Company’s performance by business segment, comprising Software services, Networking services and Business
Process Outsourcing services. Accordingly, the Company provides segment information by the operating performance of each business
segment. Corporate activities such as treasury, legal and accounting, which do not qualify as operating segments under SFAS No. 131
have been considered as reconciling items.
Segment information for prior periods is provided on a comparative basis.
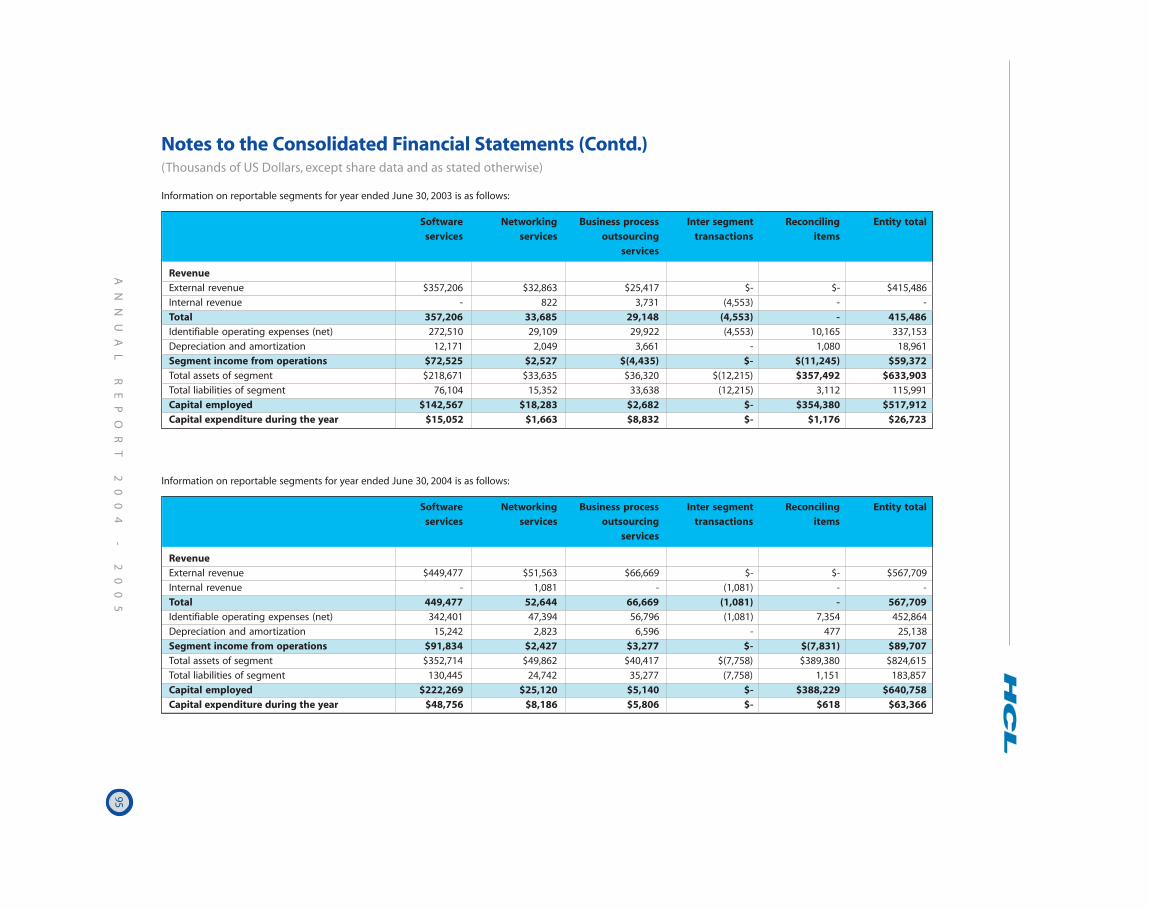
AN
NU
AL
R
EP
OR
T
20
04
-
2
00
595
Notes to the Consolidated Financial Statements (Contd.)(Thousands of US Dollars, except share data and as stated otherwise)
Information on reportable segments for year ended June 30, 2003 is as follows:
Software Networking Business process Inter segment Reconciling Entity totalservices services outsourcing transactions items
services
RevenueExternal revenue $357,206 $32,863 $25,417 $- $- $415,486
Internal revenue - 822 3,731 (4,553) - -
Total 357,206 33,685 29,148 (4,553) - 415,486Identifiable operating expenses (net) 272,510 29,109 29,922 (4,553) 10,165 337,153
Depreciation and amortization 12,171 2,049 3,661 - 1,080 18,961
Segment income from operations $72,525 $2,527 $(4,435) $- $(11,245) $59,372Total assets of segment $218,671 $33,635 $36,320 $(12,215) $357,492 $633,903Total liabilities of segment 76,104 15,352 33,638 (12,215) 3,112 115,991
Capital employed $142,567 $18,283 $2,682 $- $354,380 $517,912Capital expenditure during the year $15,052 $1,663 $8,832 $- $1,176 $26,723
Information on reportable segments for year ended June 30, 2004 is as follows:
Software Networking Business process Inter segment Reconciling Entity totalservices services outsourcing transactions items
services
RevenueExternal revenue $449,477 $51,563 $66,669 $- $- $567,709
Internal revenue - 1,081 - (1,081) - -
Total 449,477 52,644 66,669 (1,081) - 567,709Identifiable operating expenses (net) 342,401 47,394 56,796 (1,081) 7,354 452,864
Depreciation and amortization 15,242 2,823 6,596 - 477 25,138
Segment income from operations $91,834 $2,427 $3,277 $- $(7,831) $89,707Total assets of segment $352,714 $49,862 $40,417 $(7,758) $389,380 $824,615
Total liabilities of segment 130,445 24,742 35,277 (7,758) 1,151 183,857
Capital employed $222,269 $25,120 $5,140 $- $388,229 $640,758Capital expenditure during the year $48,756 $8,186 $5,806 $- $618 $63,366
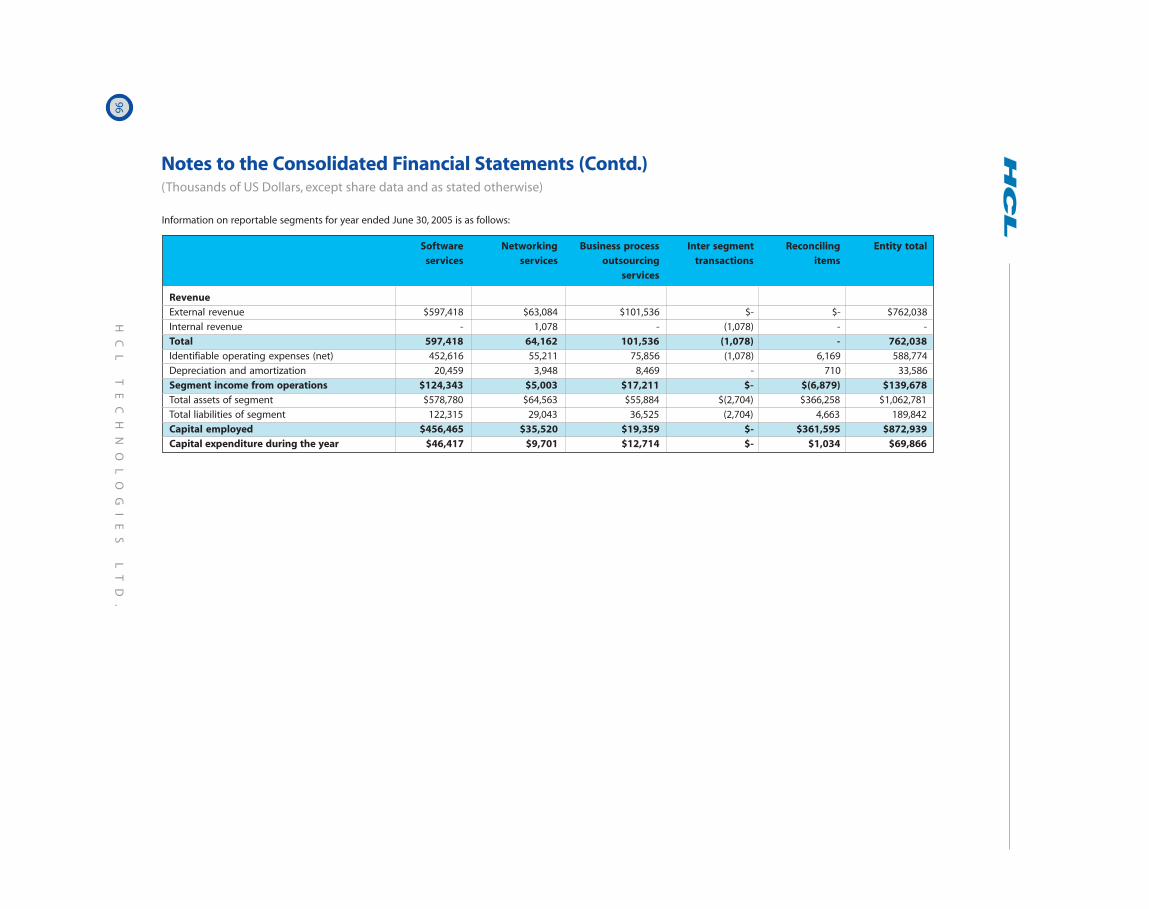
96H
CL
T
EC
HN
OL
OG
IE
S
LT
D.
Notes to the Consolidated Financial Statements (Contd.)(Thousands of US Dollars, except share data and as stated otherwise)
Information on reportable segments for year ended June 30, 2005 is as follows:
Software Networking Business process Inter segment Reconciling Entity totalservices services outsourcing transactions items
services
RevenueExternal revenue $597,418 $63,084 $101,536 $- $- $762,038
Internal revenue - 1,078 - (1,078) - -
Total 597,418 64,162 101,536 (1,078) - 762,038Identifiable operating expenses (net) 452,616 55,211 75,856 (1,078) 6,169 588,774
Depreciation and amortization 20,459 3,948 8,469 - 710 33,586
Segment income from operations $124,343 $5,003 $17,211 $- $(6,879) $139,678Total assets of segment $578,780 $64,563 $55,884 $(2,704) $366,258 $1,062,781
Total liabilities of segment 122,315 29,043 36,525 (2,704) 4,663 189,842
Capital employed $456,465 $35,520 $19,359 $- $361,595 $872,939Capital expenditure during the year $46,417 $9,701 $12,714 $- $1,034 $69,866
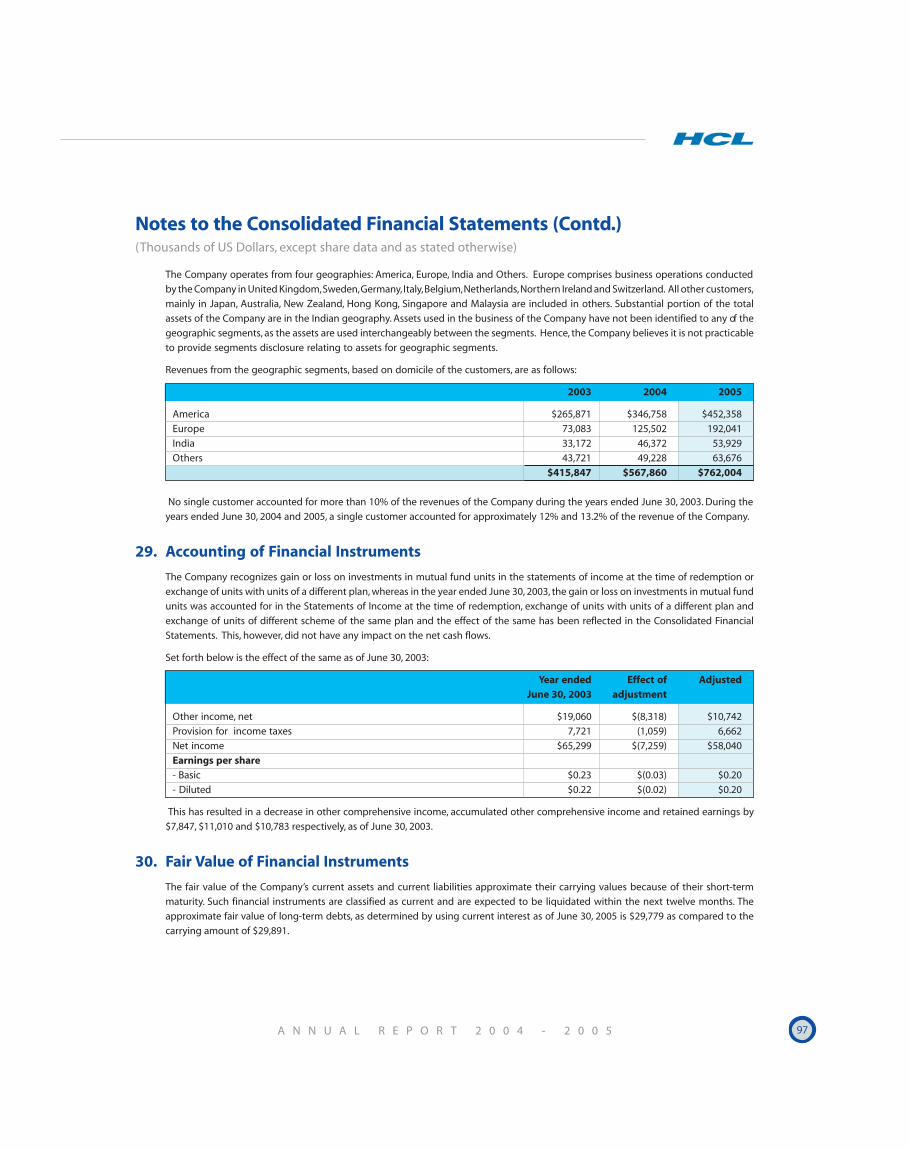
A N N U A L R E P O R T 2 0 0 4 - 2 0 0 5 97
Notes to the Consolidated Financial Statements (Contd.)(Thousands of US Dollars, except share data and as stated otherwise)
The Company operates from four geographies: America, Europe, India and Others. Europe comprises business operations conducted
by the Company in United Kingdom, Sweden, Germany, Italy, Belgium, Netherlands, Northern Ireland and Switzerland. All other customers,
mainly in Japan, Australia, New Zealand, Hong Kong, Singapore and Malaysia are included in others. Substantial portion of the total
assets of the Company are in the Indian geography. Assets used in the business of the Company have not been identified to any of the
geographic segments, as the assets are used interchangeably between the segments. Hence, the Company believes it is not practicable
to provide segments disclosure relating to assets for geographic segments.
Revenues from the geographic segments, based on domicile of the customers, are as follows:
2003 2004 2005
America $265,871 $346,758 $452,358
Europe 73,083 125,502 192,041
India 33,172 46,372 53,929
Others 43,721 49,228 63,676
$415,847 $567,860 $762,004
No single customer accounted for more than 10% of the revenues of the Company during the years ended June 30, 2003. During the
years ended June 30, 2004 and 2005, a single customer accounted for approximately 12% and 13.2% of the revenue of the Company.
29. Accounting of Financial Instruments
The Company recognizes gain or loss on investments in mutual fund units in the statements of income at the time of redemption or
exchange of units with units of a different plan, whereas in the year ended June 30, 2003, the gain or loss on investments in mutual fund
units was accounted for in the Statements of Income at the time of redemption, exchange of units with units of a different plan and
exchange of units of different scheme of the same plan and the effect of the same has been reflected in the Consolidated Financial
Statements. This, however, did not have any impact on the net cash flows.
Set forth below is the effect of the same as of June 30, 2003:
Year ended Effect of AdjustedJune 30, 2003 adjustment
Other income, net $19,060 $(8,318) $10,742
Provision for income taxes 7,721 (1,059) 6,662
Net income $65,299 $(7,259) $58,040
Earnings per share- Basic $0.23 $(0.03) $0.20
- Diluted $0.22 $(0.02) $0.20
This has resulted in a decrease in other comprehensive income, accumulated other comprehensive income and retained earnings by
$7,847, $11,010 and $10,783 respectively, as of June 30, 2003.
30. Fair Value of Financial Instruments
The fair value of the Company’s current assets and current liabilities approximate their carrying values because of their short-term
maturity. Such financial instruments are classified as current and are expected to be liquidated within the next twelve months. The
approximate fair value of long-term debts, as determined by using current interest as of June 30, 2005 is $29,779 as compared to the
carrying amount of $29,891.
98 H C L T E C H N O L O G I E S L T D .
Corporate Headquarters
HCL Technologies Ltd.
A-10/11, Sector 3
Noida 201 301
Uttar Pradesh
India
Tel: +91-120-252-0917/37
Fax: +91-120-253-0591
North America
HCL America, Inc.
330 Potrero Avenue
Sunnyvale, CA 94086
Tel: +1-408-733-0480
Fax: +1-408-733-0482
HCL America, Inc.
1055 Washington Boulevard, 4th Floor,
Suite 430
Stamford, CT 06901
Tel: +1-203-326-3004
Fax: +1-203-462-3368
HCL America, Inc.
25 Vreeland Road, Building B
Suite 101,
Florham Park, NJ 07932
Tel: +1-973-443-9690
Fax: +1-973-443-9692
HCL America, Inc.
1950 Old Gallows Road
Suite 555
Vienna, VA 22182
Tel: +1-703-891-0400
Fax: +1-703-891-0401
Toll Free: +1- 866-266-6393 /
866-647-6926
(Voice mail)
Fax: +1-703-891-0401
HCL America Inc.
1400 Opus Place,
Suite 650
Downers Grove, IL 60515
Ph: +1-630-541-2451
Fax: +1-630-541-2550
Worldwide Offices
HCL America Inc.
106 Allen Road,
Basking Ridge, NJ 07920
Ph: +1-908-604-0073
Fax: +1-908-604-0366
HCL America, Inc.
1920 Main Street,
Suite 225
Irvine, CA 92614
Tel: +1-949-757-8481
Fax: +1-949-863-3156
HCL America, Inc.
2601 Network Boulevard,
Suite 400
Frisco, Texas 75034
Tel: + 1-972-334-9733
Fax: +1 - 972-334-9734
HCL America, Inc.
1821 Walden Office Square
Suite 300
Schaumburg, IL 60173
Tel: +1-847-303-7200
Fax: +1-847-303-7205
HCL America, Inc.
800 Bellevue Way NE
Fourth Floor
Bellevue, WA 98004
Tel: +1-425-646-2390
Fax: +1-425-646-2391
HCL America Inc.
262 Washington Street,
Suite 700
Boston, MA 02108
Ph: +1- 617-723-9502
Fax: +1- 617-723-9509
HCL America, Inc.
406 Farmington Avenue
Suite 1009
Farmington, CT 06032
Tel: +1-860-676-7759
Fax: +1-860-676-7704
HCL America Inc.
11001 W. 120th Avenue
Suite 400
Broomfield, CO - 80021
Tel: +1-303-410-4297
Fax: +1-303-410-4597
HCL America, Inc.
100 West Big Beaver Road,
Suite 200
Troy,MI 48084
Tel: + 1-248 526 0568
Fax: + 1-248 526 0570
HCL Technologies (Illinois) Inc.
Corporate Headquarters
2625, Butterfield Road, Suite 300S
Oak Brook, II 60523
Tel: +1-630 645 1430
Fax: +1-630 645 1399
HCL Jones Technologies, LLC
500 Mamaroneck Ave., Suite 402
Harrison, NY 10528
Tel. +1-914-670-2700
Fax 914-670-2789
HCL Technologies (Mass). Inc.
Corporate Headquarters
400 Crown Colony Drive, Suite 500
Qunicy, MA 02169
Tel: +1 617 328 7131,
Fax: +1 617 770 4086
Europe
HCL Great Britain Ltd.
Network House, Norreys Drive
Maidenhead, Berkshire SL6 4FJ
United Kingdom
Tel: +44-1628-778-555
Fax: +44-1628-777-566
HCL Technologies GmbH
Frankfurter Strasse 63-69
65760 Eschborn
Germany
Tel: +49-6196-779970
Fax: +49-6196-77997-55
A N N U A L R E P O R T 2 0 0 4 - 2 0 0 5 99
HCL Technologies GmbH.
Airport-Office ParkAm Söldnermoos 17D-85399 Munich-HallbergmoosTel: +49-89-607-68670
HCL Technologies Sweden ABRingvägen 100, 9th. floorBox 17 812, S-118 94 StockholmSwedenTel: +46 8 5190 9780Fax: +46 8 5190 9781
HCL Technologies LtdInSitu Centre17, Avenue Didier DauratBP 51, 31702 Blagnac CedexFranceTel +33 (5) 34 60 45 46Fax +33 (5) 34 60 50 40
HCL Technologies Belgium NVBrussels Airways Park,Lozenburg 10 BUS 21930 ZaventemBelgiumTel: +32-2-725-4464Fax: +32-2-725-5341
HCL Technologies Italy SLRStudio VeroneseVia Egadi 5, 20146 MilanoItalyTel +39 (02) 48519867Fax +39 (02) 48110569
HCL (Netherlands) BVOvergoo 152266 JZ LeidschendamThe NetherlandsTel: +31-70-301-2410Fax: +31-70-419-0067
HCL BPO Services (NI) LtdApollo Contact Centre2-6 Boucher Business CentreApollo Road, Belfast BT12 6HPNorthern IrelandTelephone: +44-28 90344142
Fax : +44-28 90344200
Asia Pacific
HCL Australia Services Pty. Ltd.Level 11, 350 Collins StreetMelbourne VIC 3000AustraliaTel: +61-3-9642 5446Fax: +61-3-9642-8399
HCL Australia Services Pty Ltd.Level 23, 111 Pacific HighwayNorth Sydney, NSW 2060AustraliaTel: +61-2-9929 9900Fax: +61-2-9929 9100
HCL (New Zealand) Ltd.Level 7, 154 Featherston StreetP.O. Box 11542, WellingtonNew ZealandTel: +64-4-471-6440Fax: +64-4-496-5209
HCL (New Zealand) Ltd.Level 20, 135 Albert StreetAuckland 1001New ZealandTel : +(649) 358 7124Fax : +(649) 358 7340
HCL Hong Kong SAR Ltd.35th Floor, Central Plaza18 Harbour Road, WanchaiHong KongTel: +85-2-2593-1192Fax: +85-2-2593-1213
HCL Technologies Malaysia SDN. BHD.Level 51, Tower 2Petronas Twin TowersKuala Lumpur 50088MalaysiaTel: +603-2031-8588Fax: +603-2031-8587
HCL Singapore Pte. Ltd.Level 30, Six Battery RoadSingapore 049909Tel: +65 - 6550 - 9671
Fax: +65 – 6550 - 9898
Japan
HCL Technologies Japan Ltd.7F, ISA Building, 3-24-16, Takanawa,Minato- Ku ,Tokyo 108-0074Tel : +81-3-5793-4321Fax: +81-3-5793 -4322
India - Noida and Gurgaon
Internet Application CentreA-1/CD, Sector 16, Noida 201 301Uttar Pradesh, IndiaTel: +91-120-251-6321Fax: +91-120-251-6315
Microprocessor Software GroupA-5, Sector 24, Noida 201 301Uttar Pradesh, IndiaTel: +91-120-253-4265-66Fax: +91-120-244-0155
Netcentric Technologies DivisionA-11, Sector 16, Noida-201 301Uttar Pradesh, IndiaTel: +91-120-251-0701/02, 0813Fax: +91-120-251-0713
HCL Integrated Networking CentreA-10/11, Sector 3, Noida 201 301Uttar PradeshIndiaTel: +91-120-253-5071Fax: +91-120-253-0591
Application Solutions Kendra3, Udyog Vihar Phase IGurgaon 122 016HaryanaIndiaTel: +91-124-643-9900-09Fax: +91-124-643-9910
Advance Technologies CentrePlot No. 244, Udyog Vihar Phase IGurgaon 122 016HaryanaIndiaTel: +91-124-634-6405-09
Fax: +91-124-634-9020
Worldwide Offices
100 H C L T E C H N O L O G I E S L T D .
HCL Technologies Ltd.
Plot No. 5,6,7 Udyog Vihar Phase 4
Gurgaon, 122 016
Haryana, India
Tel. : +(91) 124 501 9000
Fax :+(91) 124 501 9851
HCL Technologies BPO Services Ltd.
A/104, Sector 58
Noida 201 303
India
Tel: +91-120-258-9690
Fax: +91-120-258-9688
HCL Technologies BPO Services Ltd.
C-39, Sector 59, Noida - 201301
Uttar Pradesh, India
HCL Technologies BPO Services Ltd.
C-23, Sector 58, Noida - 201301
Uttar Pradesh, India
India - Chennai and Bangalore
Networking Products Division
Centre 1
49-50 Nelson Manickam Road,
Chennai 600 029
India
Tel: +91-44-237-41939-42
Fax: +91-44-237-41038
Networking Products Division
Centre 2
299 (Old Numer 158) Arcot Road
158 Arcot Road
Vadapalani
Chennai 600 026
India
Tel: +91-44-237-50171
Fax: +91-44-237-50185
Networking Products Division
Centre 3
184, Arcot Road
Vadapalani, Chennai - 600 026
India
Tel: +91-44-2372-8366
Fax: +91-44-2480-6640
Networking Technologies LabPlot 78, South Phase Road,Ambattur Industrial Estate,Chennai - 600 058IndiaTel: +91-44-2623-2318Fax: +91-44-2625-9476
Application Solutions Development CentreJ-16 Anna Nagar EastChennai 600 102IndiaTel: +91-44-262-64206Fax: +91-44-262-81120
Software Engineering Solutions CentreSapna Trade Centre109/110 P H RoadChennai 600 084IndiaTel: +91-44-282-21129Fax: +91-44-282-14278
Integrated Technologies CentreD-12, 12B Ambattur Industrial EstateAmbatturChennai 600 058IndiaTel: +91-44-262-30711Fax: +91-44-262-44213
HCL Technologies BPO Services Ltd.30 Ethiraj Salai, Egmore,Chennai - 600 015IndiaTel: +91-44-2828-9200
HCL Technologies Ltd.No.184-188, 190,192 & 196 Arcot Road,VadapalaniChennai, 600 026IndiaTel. : +91-44-2372 8366Fax :+91-44-2480 6640
Core Technologies Division50-53 Greams RoadChennai 600 006IndiaTel: +91-44-282-93298
Fax: +91-44-282-94969
HCL Technologies Ltd.
64 & 65, Second Main Road
Ambattur Industrial Estate, Ambattur
Chennai, 600 058
India
Tel. : +91 44 2652 1077
Fax :+91 44 5206 0485
Core Technologies Centre
PM Towers, 37 Greams Road
Chennai 600 006
India
Tel: +91-44-282-91735
Fax: +91-44-282-91738
Business Solutions Centre
No. 51 J.N. Road, Guindy
Chennai 600 097
India
Tel: +91-44-223-21960-65
Fax: +91-44-223-44256
Banking Software Development Center
602 Tidel Park
No. 4, Canal Bank Road, Taramani
Chennai - 600113
India
Tel: +91-44-2254 0473
Fax: +91-44-2254 0308
HCL Technologies Ltd.
“Thapar House”, II Floor,
43-44 Montieth Road,
Chennai - 600 008
Tel: +91-44-2851 1293
Fax: +91-44-2851 1986
HCL Technologies Ltd.
Plot no. 95, SP
Ambattur Industrial Estate,
Ambattur, Chennai 600 058
India
HCL Technologies Ltd.
35, South Phase
Guindy Industrial estate
Ekkaduthangal, Guindy
Chennai 600 097
India
Worldwide Offices
A N N U A L R E P O R T 2 0 0 4 - 2 0 0 5 101
HCL Technologies Ltd.
Module 812, 8th Floor, Raheja Towers
Mount Road,
Chennai, 600 002
India
HCL Technologies Ltd.
Old No 17 & 18, 34- 35,
Haddows Road,
Chennai - 600 006
Tel: +91-44-5215 9999
Fax: +91-44- 5213 2749
HCL Capital Market Services
“6th Floor, Leela Galleria,”
“No. 23, Airport Road,”
Bangalore - 560 008
India.
Tel: + 91-80-5054000
HCL Capital Market Services
IV Floor,
DSL Towers, Shivalaya
Plot No.123, EPIP Phase II
Whitefield Industrial Area
Bangalore - 560 066
India
Tel: +91-80- 51385555
Shipara Technologies Ltd.
No. 8 & 9,
G.B. Palya, Off Hosur Road
Bangalore - 560 068
India
Tel: +91-80-573-5171-176
Fax: +91-80-573-5516
Aquila Technolgies
5, 100FT Ring Road, BTM Layout,
1st Stage, 1st Phase,
Bangalore - 560 068, India
Tel: +91-80 - 668 9684
Fax: +91-80 - 678 0957
Kolkata:
HCL Technologies Ltd.
SDF Building, 1st Floor
Module No. 212-214
228-230, Block – GP
Sector – V, Salt Lake City,
Kolkata 700 091
Tel. : +91 – 33 - 2357 3024-5
Fax :+91 – 33 - 2357 3027
Worldwide Offices

www.hcl . inwww.hcltech.com