greater hartford transit district … hartford transit district hartford, connecticut comprehensive...
TRANSCRIPT
GREATER HARTFORD TRANSIT DISTRICT
HARTFORD, CONNECTICUT
COMPREHENSIVE ANNUAL FINANCIAL REPORT
FOR THE YEAR ENDED JUNE 30, 2014
GREATER HARTFORD TRANSIT DISTRICT
HARTFORD, CONNECTICUT
COMPREHENSIVE ANNUAL FINANCIAL REPORT
FOR THE YEAR ENDED JUNE 30, 2014
Prepared by: Accounting Department

INTRODUCTORY SECTION
i
GREATER HARTFORD TRANSIT DISTRICT
COMPREHENSIVE ANNUAL FINANCIAL REPORT
TABLE OF CONTENTS
Introductory Section Page Table of Contents i-iiLetter of Transmittal iii-viGFOA Certificate of Achievement viiOrganizational Chart viiiBoard of Directors ix
Financial Section Page Independent Auditors’ Report 1-3Management’s Discussion and Analysis 4-10
Basic Financial Statements Government-Wide Financial Statements: Statement of Net Position 11 Statement of Activities 12 Fund Financial Statements: Balance Sheet - Governmental Funds 13 Reconciliation of the Balance Sheet - Governmental Funds to the Statement of Net Position 14 Statement of Revenues, Expenditures and Changes in Fund Balances - Governmental Funds 15 Reconciliation of the Statement of Revenues, Expenditures and Changes in Fund Balances - Governmental Funds to the Statement of Activities 16 Statement of Revenues, Expenditures and Changes in Fund Balances - Budget
and Actual (GAAP Basis) - General and Special Revenue Funds 17 Statement of Net Position - Proprietary Funds 18 Statement of Revenues, Expenses and Changes in Net Position - Proprietary Funds 19 Statement of Cash Flows - Proprietary Funds 20Notes to the Financial Statements 21-36
Supplemental Combining Schedule Page Special Revenue Fund: Combining Schedule of Revenues, Expenditures and Changes in Fund Balances by Project - Special Revenue Fund 37-38
ii
Statistical Section Page
Net Position by Component 39Changes in Net Position - Entity Wide 40-41Changes in Net Position - Purchased Transportation Program 42Governmental Activities Revenue by Source 43Fund Balances of Governmental Funds 44Revenues, Expenditures and Changes in Fund Balance - Governmental Funds 45Governmental Funds Revenue by Source 46Principal Revenue Payors 47Pledged-Revenue Coverage - Parking Lot Bonds 48Net General Bonded Debt Per Capita 49Demographic Statistics 50Principal Employers 51Full-Time Equivalent Government Employees by Function/Program 52Operating Indicators by Function/Program 53Capital Asset Statistics by Function/Program 54
iv
Upgrades to Union Station will continue as part of the District’s ongoing effort to improve the facility for its tenants, passengers, and visitors to the area. These enhancements will have a significant impact on making public transportation a more attractive option to commuters and to the general public for trips in and out of the city. It is anticipated that the economic impact of the District’s actions will have a positive effect on the city and on the region. Long‐Term Financial and Capital Planning Approach Management is responsible for establishing and maintaining an internal control structure designed to ensure that the assets of the government are protected from loss, theft or misuse and to ensure that adequate accounting data are compiled to allow for the preparation of financial statements in conformity with generally accepted accounting principles. The internal control structure is designed to provide reasonable assurance that these objectives are met. In addition, the District maintains budgetary controls. Budgetary control is maintained by periodic review of year‐to‐date, actual vs. budgeted expenditures. As demonstrated by the financial statements and schedules included in the financial section of this report, the District continues to meet its responsibility for sound fiscal management. The District’s long term financial and capital planning approach is characterized by a wide range of projections. Short‐term and long‐term planning processes are managed under a unified planning structure. This includes; monitoring contracts and external agreements in a timely fashion, meeting required reporting deadlines to the District’s funding sources, centralizing financial, project, and historical data, tracking projects with multiple funding sources, and establishing and enforcing best practices. Completed Initiatives
Spruce Street Parking Lot Revenue continues to increase. The completed installation of an automated parking revenue system in conjunction with an enhanced number of parkers contributed to the 11% increase in revenue from the previous year. There was also a significant annual savings in the parking management fee based on renegotiation of services needed.
The Spruce Street Parking Lot revenue bond matured and the final payoff was completed.
As the Limited Agent for the TIGER IV funding, the District is responsible for grant oversight of this project. This past fiscal year all design activities were completed for the four components of the project; Union Station’s Transit Center, Bushnell Park North, Asylum and Pearl Streets, and State House Square.
The District was awarded oversight of $853,600 which was transferred from FHWA STP Urban funds to FTA Section 5307 for transportation improvements to the Soldiers and Sailors Memorial Arch.
Interest income has been down significantly over the past several years as the bond rate has remained low. After the Board of Director’s approval the District invested in an FFCB bond that will have an explicit guarantee rate.
During the course of this past year construction activities began on the Mansfield Intermodal Center (Nash‐Zimmer) Transportation Center and the Transit Pathway. Within one year the transit center opened with bus circulation.
A Qualifications Based Selection process was conducted to select a consultant to design the Sigourney Street/CTfastrak Bus Station. The District is overseeing this bus livability project.
The District received two‐years of additional funding for the New Freedom Taxi Ride Program.
Municipal Dial‐A‐Ride grants were reinstated and assistance was provided to all member towns.
The District executed a contract with the City of New Britain to be the grantee for the Bus Livability funds awarded to that city for their multimodal connectivity project.
The District conducted a qualification based selection for a firm to conduct the assessment and provide design services for 148 Roberts Street, East Hartford. This will be the new home for the ADA Paratransit Operations and Maintenance Facility.
v
The District received the 2013 Certificate of Achievement in Financial Reporting by the Government Finance Officers Association.
A Positive Pay Fraud Prevention process was initiated.
Negotiated and finalized lease agreements with two of the District’s major tenants. The new leases will provide the District with approximately $700,000 in additional revenue over the course of the next 5 years.
The release and recording of the Union Station open‐ended mortgage was completed.
The District received a Technical Assistance grant from the Connecticut Trust for Historic Preservation.
Electricity costs per kWh were reduced based on negotiated pricing through the District’s participation in the CRCOG energy savings program.
The District continues to promote bike parking at the facility and added bike lockers to our site.
The District has taken the lead in working with the Capitol Region Council of Governments and other agencies to investigate the feasibility of establishing a bike share system in the metro‐Hartford region.
The District chose a contractor to install electronic signage in the Union Station Transportation Center complex. The contractor began their work in December of 2013 and all installations will be complete by Fall 2014. The signage system will consist of electronic signs at the bus bays, arrival and departure screens, and a touchscreen information kiosk.
The District working in conjunction with the Capitol Region Council of Governments and CTTRANSIT is purchasing and installing passenger waiting shelters for several participating municipalities.
A total of twenty‐two new vehicles were ordered during this past fiscal year to replace those that have met their useful life. (15) were compressed natural gas (CNG) and the remaining (7) were diesel vehicles.
Installed contemporary replacement benches along the bus berthing area and inside of the transportation center vestibule.
An upgrade to the ADA Paratransit Trapeze software system was completed including hardware and software updates and staff training. Improved software functionality, on‐time performance and increased productivity are anticipated with the upgrade.
New features added to the ADA IVR system allow clients to receive information in alternative formats such as phone calls, text, and/or email. This has been an extremely useful resource for both the operation and most importantly for our passengers.
A final Title VI report was submitted to FTA to meet new federal regulations and was approved.
Future Initiatives Continue with the design, demolition, and construction of the new ADA Paratransit facility in
East Hartford.
The Transit Center portion of the TIGER IV – Hartford’s Intermodal Triangle Project will be completed by December 2014. The District continues to coordinate activities with the City of Hartford, CTDOT and CTTRANSIT for the remainder of the three components of the project.
Continue to pursue additional federal funds that are applicable and other sources of funding through state programs.
Continue to seek creative ways to increase the Enterprise Fund revenue.
Continue to seek all appropriate investment opportunities to increase the District’s unrestricted account.
The Federal Transit Administration (FTA) has scheduled a standard triennial review of the District. The review determines whether a grantee is administering its FTA‐funded programs in accordance with 49 U.S.C. Chapter 53, Federal transit law provisions. It assesses grantee management practices and program implementation to ensure that the programs are administered in accordance with FTA requirements and are meeting program objectives.
vii
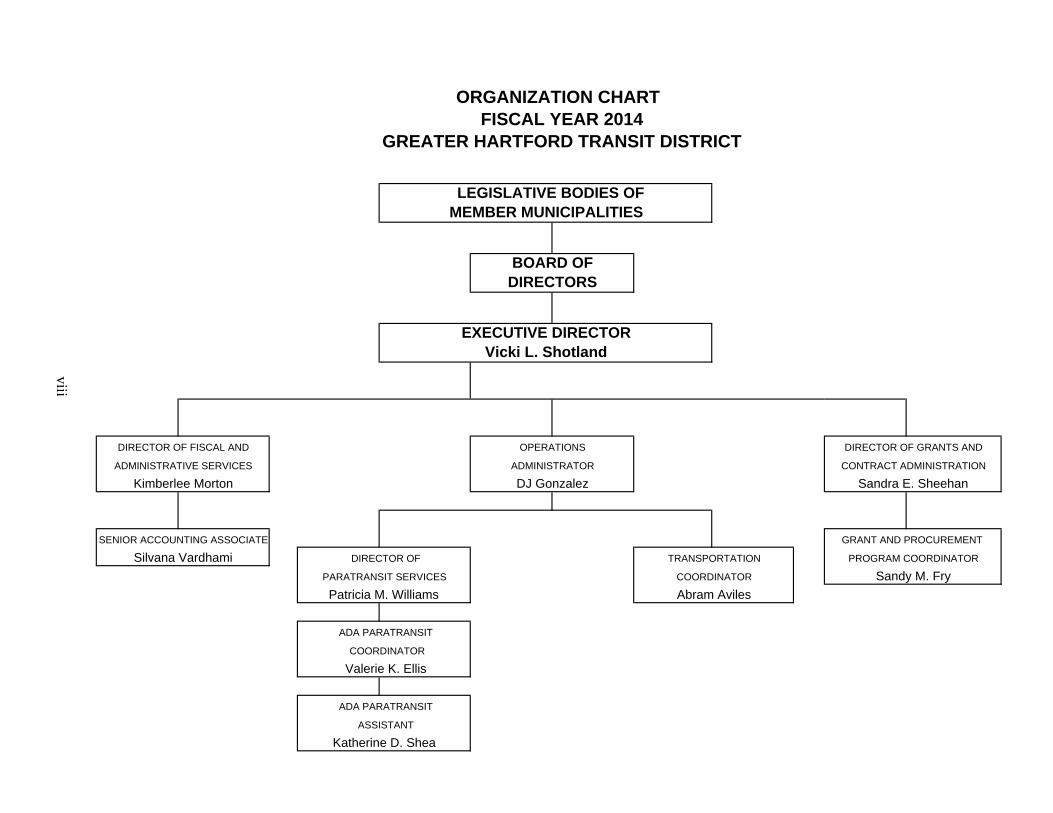
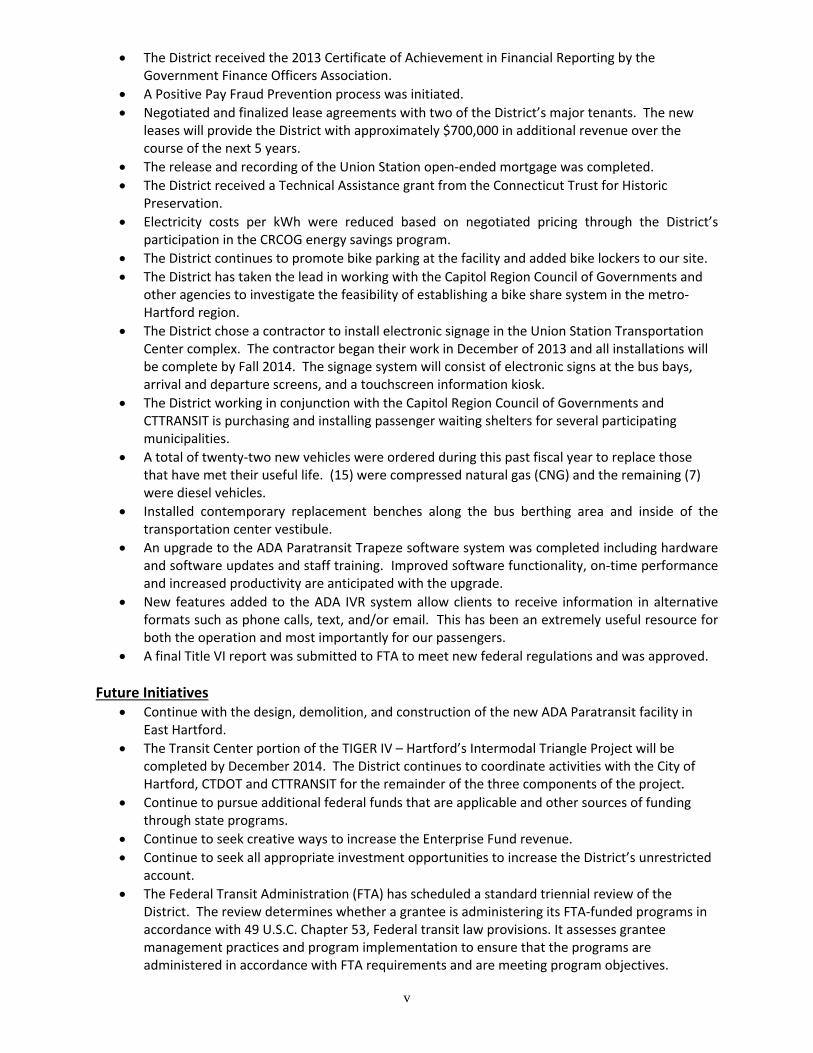
ORGANIZATION CHART FISCAL YEAR 2014GREATER HARTFORD TRANSIT DISTRICT
BOARD OFDIRECTORS
EXECUTIVE DIRECTORVicki L. Shotland
OPERATIONS
LEGISLATIVE BODIES OFMEMBER MUNICIPALITIES
ADMINISTRATOR
DJ Gonzalez
viii
DIRECTOR OF FISCAL AND
Abram Aviles
DIRECTOR OF GRANTS AND
CONTRACT ADMINISTRATION
Sandra E. Sheehan
TRANSPORTATION
COORDINATOR
Kimberlee Morton
ADMINISTRATIVE SERVICES
ASSISTANT
Katherine D. Shea
ADA PARATRANSIT
ADA PARATRANSIT
COORDINATOR
Valerie K. Ellis
PARATRANSIT SERVICES
Patricia M. Williams
DIRECTOR OF
GRANT AND PROCUREMENT
PROGRAM COORDINATOR
SENIOR ACCOUNTING ASSOCIATE
Silvana Vardhami
Sandy M. Fry

ix
GREATER HARTFORD TRANSIT DISTRICT BOARD OF DIRECTORS
2014
Member Town Representation/Director Primary Occupation Committee Assignment Bloomfield 1 Joan Gamble Artist/Community Volunteer Nominating East Hartford 2 Peter J. Bonzani Operating Engineer Marilyn Pet Attorney Parking Lot Panel East Windsor 1 Gilbert Hayes Community Volunteer Transportation Enfield 2 Stephen F. Mitchell Engineer Kevin Mooney Financial Services
Farmington 1 Kathleen Eagen Town Manager Granby 1 Russell G. St. John Railroad Consultant Parking Lot Panel Hartford 2 Frank Lord Community Volunteer Personnel Jennifer Cassidy Community Volunteer Parking Lot Panel Manchester 2 James R. McCavanagh Businessman Nominating Paul McNamara Businessman By Laws Newington 2 William G. Hall Community Volunteer Parking Lot Panel, Personnel,
Nominating John M. Kelly Attorney Rocky Hill 1 Kenneth D. Goldberg Consultant Simsbury 1 Ferguson R. Jansen Business Executive Personnel, By Laws South Windsor 2 Gary S. Pitcock Information Technology Bruce Snow Businessman Vernon 2 Mary A. Oliver Financial Services Audit, By Laws Mark S. Etre Engineer West Hartford 2 Richard F. Messenger Community Volunteer Personnel A. David Giordano Businessman Audit, Personnel Wethersfield 2 Brendan T. Flynn Attorney Audit Peter Gardow Engineer Windsor 2 Ricardo Quintero Community Volunteer By Laws David Raney Health Care Instructor Executive Director Vicki L. Shotland Officers June 30, 2014 Chairman Stephen F. Mitchell Vice Chairman Frank Lord Secretary James R. McCavanagh Assistant Secretary Peter J. Bonzani Treasurer Brendan T. Flynn Assistant Treasurer Mary A. Oliver

FINANCIAL SECTION
Blum, Shapiro & Company, P.C.
29 South Main Street P.O. Box 272000 West Hartford, CT 06127-2000
Tel 860.561.4000 Fax 860.521.9241 blumshapiro.com
An independent member of Baker Tilly International
1
Independent Auditors’ Report To the Board of Directors Greater Hartford Transit District Hartford, Connecticut Report on the Financial Statements We have audited the accompanying financial statements of the governmental activities, the business-type activities and each major fund of the Greater Hartford Transit District (the District) as of and for the year ended June 30, 2014, and the related notes to the financial statements, which collectively comprise the District’s basic financial statements as listed in the table of contents. Management’s Responsibility for the Financial Statements Management is responsible for the preparation and fair presentation of these financial statements in accordance with accounting principles generally accepted in the United States of America; this includes the design, implementation and maintenance of internal control relevant to the preparation and fair presentation of financial statements that are free from material misstatement, whether due to fraud or error. Auditors’ Responsibility Our responsibility is to express opinions on these financial statements based on our audit. We conducted our audit in accordance with auditing standards generally accepted in the United States of America and the standards applicable to financial audits contained in Government Auditing Standards, issued by the Comptroller General of the United States. Those standards require that we plan and perform the audit to obtain reasonable assurance about whether the financial statements are free of material misstatement. An audit involves performing procedures to obtain audit evidence about the amounts and disclosures in the financial statements. The procedures selected depend on the auditors’ judgment, including the assessment of the risks of material misstatement of the financial statements, whether due to fraud or error. In making those risk assessments, the auditors consider internal control relevant to the entity’s preparation and fair presentation of the financial statements in order to design audit procedures that are appropriate in the circumstances, but not for the purpose of expressing an opinion on the effectiveness of the entity’s internal control. Accordingly, we express no such opinion. An audit also includes evaluating the appropriateness of accounting policies used and the reasonableness of significant accounting estimates made by management, as well as evaluating the overall presentation of the financial statements.
2
We believe that the audit evidence we have obtained is sufficient and appropriate to provide a basis for our audit opinions. Opinions In our opinion, the financial statements referred to above present fairly, in all material respects, the respective financial position of the governmental activities, the business-type activities and each major fund of the Greater Hartford Transit District as of June 30, 2014 and the respective changes in financial position and, where applicable, cash flows thereof, and the respective budgetary comparison for the General Fund and Special Revenue Fund for the year then ended in accordance with accounting principles generally accepted in the United States of America. Other Matters Required Supplementary Information Accounting principles generally accepted in the United States of America require that the management’s discussion and analysis on pages 4 through 10 be presented to supplement the basic financial statements. Such information, although not a part of the basic financial statements, is required by the Governmental Accounting Standards Board, which considers it to be an essential part of financial reporting for placing the basic financial statements in an appropriate operational, economic or historical context. We have applied certain limited procedures to the required supplementary information in accordance with auditing standards generally accepted in the United States of America, which consisted of inquiries of management about the methods of preparing the information and comparing the information for consistency with management’s responses to our inquiries, the basic financial statements and other knowledge we obtained during our audit of the basic financial statements. We do not express an opinion or provide any assurance on the information because the limited procedures do not provide us with sufficient evidence to express an opinion or provide any assurance. Other Information Our audit was conducted for the purpose of forming opinions on the financial statements that collectively comprise the Greater Hartford Transit District’s basic financial statements. The introductory section, combining special revenue fund schedule and statistical section are presented for purposes of additional analysis and are not a required part of the basic financial statements. The combining special revenue fund schedule is the responsibility of management and was derived from and relates directly to the underlying accounting and other records used to prepare the basic financial statements. Such information has been subjected to the auditing procedures applied in the audit of the basic financial statements and certain additional procedures, including comparing and reconciling such information directly to the underlying accounting and other records used to prepare the basic financial statements or to the basic financial statements themselves, and other additional procedures in accordance with auditing standards generally accepted in the United States of America. In our opinion, the combining special revenue fund schedule are fairly stated in all material respects in relation to the basic financial statements as a whole.
3
The introductory and statistical sections have not been subjected to the auditing procedures applied in the audit of the basic financial statements, and, accordingly, we do not express an opinion or provide any assurance on them. Other Reporting Required by Government Auditing Standards In accordance with Government Auditing Standards, we have also issued our report dated November 10, 2014 on our consideration of the Greater Hartford Transit District’s internal control over financial reporting and on our tests of its compliance with certain provisions of laws, regulations, contracts, and grant agreements and other matters. The purpose of that report is to describe the scope of our testing of internal control over financial reporting and compliance and the results of that testing, and not to provide an opinion on internal control over financial reporting or on compliance. That report is an integral part of an audit performed in accordance with Government Auditing Standards in considering the District’s internal control over financial reporting and compliance. West Hartford, Connecticut November 10, 2014
4
GREATER HARTFORD TRANSIT DISTRICT MANAGEMENT’S DISCUSSION AND ANALYSIS
JUNE 30, 2014 The management of the Greater Hartford Transit District (the District) offers readers of the District’s financial statements this narrative overview and analysis of the financial activities of the District for the fiscal year ended June 30, 2014. We encourage readers to consider the information presented here in conjunction with additional information that we have furnished in our letter of transmittal. FINANCIAL HIGHLIGHTS On a government-wide basis, the assets of the District exceeded its liabilities at the close of
the most recent fiscal year by $8,611,657 and $8,312,069 for the governmental activities and the business-type activities, respectively.
On a government-wide basis, the government’s total net position increased by $3,903,287; governmental activities increased by $303,153 and business-type activities increased by $3,600,134.
As of the close of the current fiscal year, the District’s governmental funds reported combined ending fund balances of $737,338, an increase of $19,689 in comparison with the prior year.
At the end of the current fiscal year, unassigned fund balance for the General Fund was $737,338.
OVERVIEW OF THE FINANCIAL STATEMENTS This discussion and analysis are intended to serve as an introduction to the District’s basic financial statements. The District’s basic financial statements comprise three components: 1) government-wide financial statements, 2) fund financial statements, and 3) notes to the financial statements. This report also contains other supplementary information in addition to the basic financial statements themselves. Government-Wide Financial Statements The government-wide financial statements are designed to provide readers with a broad overview of the District’s finances, in a manner similar to a private-sector business. The statement of net position presents information on all of the District’s assets and liabilities, with the difference between the two reported as net position. Over time, increases or decreases in net position may serve as a useful indicator of whether the financial position of the District is improving or deteriorating. The statement of activities presents information showing how the District’s net position changed during the most recent fiscal year. All changes in net position are reported as soon as the underlying event giving rise to the change occurs, regardless of the timing of related cash flows. Thus, revenues and expenses are reported in this statement for some items that will only result in cash flows in future fiscal periods.
5
Both of the government-wide financial statements distinguish functions of the District that are principally supported by intergovernmental revenues (governmental activities) from other functions that are intended to recover all or a significant portion of their costs through user fees and charges (business-type activities). The governmental activities of the District include purchased transportation, transportation projects and general administration. The business-type activities of the District include a transportation center and a public parking lot. The government-wide financial statements can be found on pages 11-12 of this report. Fund Financial Statements A fund is a grouping of related accounts that is used to maintain control over resources that have been segregated for specific activities or objectives. The District, like other state and local governments, uses fund accounting to ensure and demonstrate compliance with finance-related legal requirements. All of the funds of the District can be divided into two categories: governmental funds and proprietary funds. Governmental Funds Governmental funds are used to account for essentially the same functions reported as governmental activities in the government-wide financial statements. However, unlike the government-wide financial statements, governmental fund financial statements focus on near-term inflows and outflows of spendable resources, as well as on balances of spendable resources available at the end of the fiscal year. Such information may be useful in evaluating a government’s near-term financing requirements. Because the focus of governmental funds is narrower than that of the government-wide financial statements, it is useful to compare the information presented for governmental funds with similar information presented for governmental activities in the government-wide financial statements. By doing so, readers may better understand the long-term impact of the government’s near-term financing decisions. Both the governmental fund balance sheet and the governmental fund statement of revenues, expenditures and changes in fund balances provide a reconciliation to facilitate this comparison between governmental funds and governmental activities. The District maintains two individual funds. Information is presented separately in the governmental fund balance sheet and in the governmental fund statement of revenues, expenditures and changes in fund balances for the General Fund and the Special Revenue Fund, both of which are considered to be major funds. The District adopts an annual appropriated budget for its General Fund and Special Revenue Fund. A budgetary comparison statement has been provided for the General Fund and Special Revenue Fund to demonstrate compliance with this budget. The basic governmental fund financial statements can be found on pages 13-17 of this report. Proprietary Funds The District maintains three enterprise-type funds. Enterprise funds are used to report the same functions presented as business-type activities in the government-wide financial statements. The District uses enterprise funds to account for its transportation center, public and private, and for its parking lot.
6
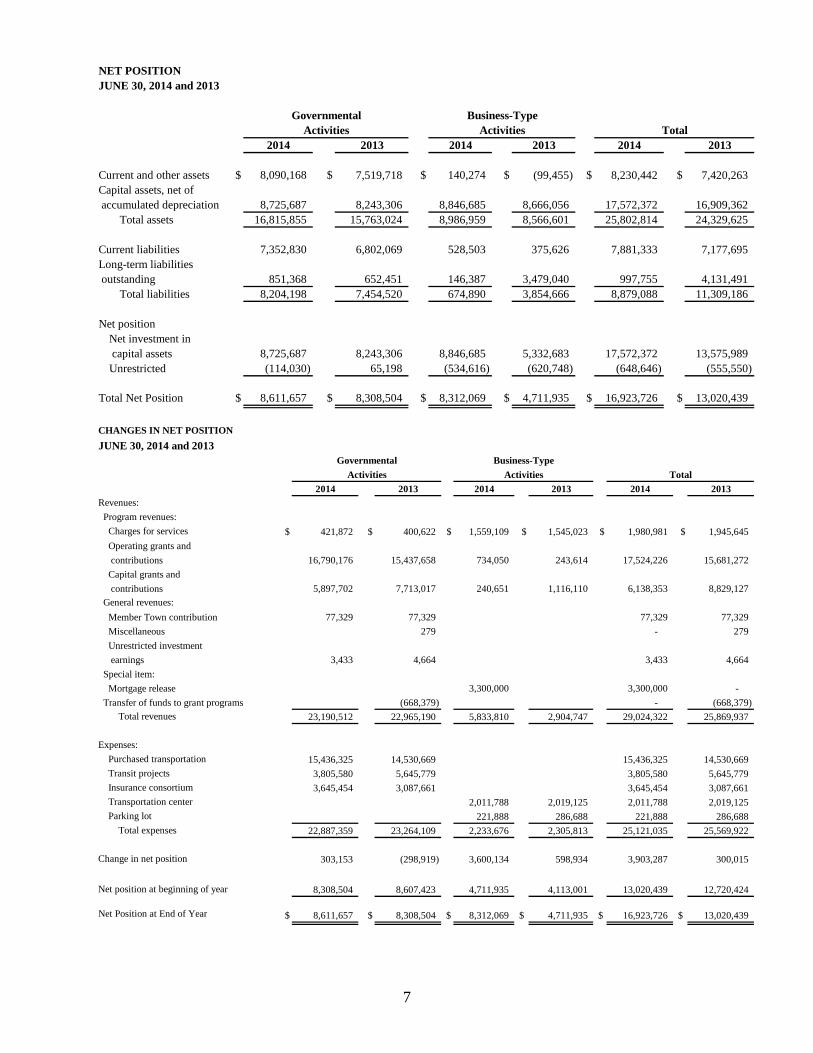
Proprietary funds provide the same type of information as the government-wide financial statements, only in more detail. The proprietary fund financial statements provide separate information for the three enterprise funds which are considered to be major funds of the District. The basic proprietary fund financial statements can be found on pages 18-20 of this report. Notes to the Financial Statements The notes provide additional information that is essential to a full understanding of the data provided in the government-wide and fund financial statements. The notes to the financial statements can be found on pages 21-36 of this report. Other Information Supplemental, combining and individual fund statements and schedules can be found on pages 37-38 of this report. GOVERNMENT-WIDE FINANCIAL ANALYSIS As noted earlier, net position may serve over time as a useful indicator of a government’s financial position and an important determinant of its ability to finance services in the future. In the case of the District, assets exceeded liabilities by $16,923,726 at the close of the most recent fiscal year. By far, the largest portion of the District’s assets is its investment in capital assets (e.g., buildings, transportation vehicles and equipment). It is presented in the statement of net position less any related debt used to acquire those assets to provide services to citizens; consequently, these assets are not available for future spending. Although the District’s investment in its capital assets, net of accumulated depreciation, is reported net of related debt, it should be noted that the resources needed to repay this debt must be provided from other sources, since the capital assets themselves cannot be used to liquidate these liabilities.
7
NET POSITIONJUNE 30, 2014 and 2013
2014 2013 2014 2013 2014 2013
Current and other assets $ 8,090,168 $ 7,519,718 $ 140,274 $ (99,455) $ 8,230,442 $ 7,420,263Capital assets, net of accumulated depreciation 8,725,687 8,243,306 8,846,685 8,666,056 17,572,372 16,909,362
Total assets 16,815,855 15,763,024 8,986,959 8,566,601 25,802,814 24,329,625
Current liabilities 7,352,830 6,802,069 528,503 375,626 7,881,333 7,177,695Long-term liabilities outstanding 851,368 652,451 146,387 3,479,040 997,755 4,131,491
Total liabilities 8,204,198 7,454,520 674,890 3,854,666 8,879,088 11,309,186
Net position Net investment in capital assets 8,725,687 8,243,306 8,846,685 5,332,683 17,572,372 13,575,989Unrestricted (114,030) 65,198 (534,616) (620,748) (648,646) (555,550)
Total Net Position $ 8,611,657 $ 8,308,504 $ 8,312,069 $ 4,711,935 $ 16,923,726 $ 13,020,439
Business-TypeActivities Total
GovernmentalActivities
CHANGES IN NET POSITION
JUNE 30, 2014 and 2013
2014 2013 2014 2013 2014 2013Revenues:
Program revenues:
Charges for services $ 421,872 $ 400,622 $ 1,559,109 $ 1,545,023 $ 1,980,981 $ 1,945,645
Operating grants and
contributions 16,790,176 15,437,658 734,050 243,614 17,524,226 15,681,272
Capital grants and
contributions 5,897,702 7,713,017 240,651 1,116,110 6,138,353 8,829,127
General revenues:
Member Town contribution 77,329 77,329 77,329 77,329
Miscellaneous 279 - 279
Unrestricted investment
earnings 3,433 4,664 3,433 4,664
Special item:
Mortgage release 3,300,000 3,300,000 -
Transfer of funds to grant programs (668,379) - (668,379)
Total revenues 23,190,512 22,965,190 5,833,810 2,904,747 29,024,322 25,869,937
Expenses:
Purchased transportation 15,436,325 14,530,669 15,436,325 14,530,669
Transit projects 3,805,580 5,645,779 3,805,580 5,645,779
Insurance consortium 3,645,454 3,087,661 3,645,454 3,087,661
Transportation center 2,011,788 2,019,125 2,011,788 2,019,125
Parking lot 221,888 286,688 221,888 286,688
Total expenses 22,887,359 23,264,109 2,233,676 2,305,813 25,121,035 25,569,922
Change in net position 303,153 (298,919) 3,600,134 598,934 3,903,287 300,015
Net position at beginning of year 8,308,504 8,607,423 4,711,935 4,113,001 13,020,439 12,720,424
Net Position at End of Year $ 8,611,657 $ 8,308,504 $ 8,312,069 $ 4,711,935 $ 16,923,726 $ 13,020,439
Governmental Business-Type
Activities Activities Total
8
The District’s net position increased by $3,903,287 during the fiscal year with net position of governmental activities increasing by $303,153 and business-type activities increasing by $3,600,134. The increase in the net position of governmental activities is due primarily to grant-funded transit projects. The increase in the net position of business-type activities is mainly attributable to Union Station mortgage release. Governmental Activities Approximately 98% of the revenues were derived from operating and capital grants and contributions, followed by 2% from charges for services. Key elements are as follows: State funded operating grants and contributions increased due to additional activity in the
ADA, Drug and Alcohol and Insurance Consortia programs. Federal and State capital contributions were down as we move toward closure of the Mansfield Intermodal project.
Business-Type Activities Business-type activities increased the District’s net position by $3,600,134. Key elements are as follows:
The public portion of the Transportation Center had a decrease in net position of $118,838. This decrease was due to depreciation expense and minimal funded capital improvement activity in this cost center.
The Brownstone portion of the Transportation Center had an increase in net position of
$3,427,449. This increase was due primarily to the release of the mortgage. The Parking Lot had an increase in net position of $291,523. This increase was due to a decrease in operating expense and federal and an increase in parking lot revenues.
FINANCIAL ANALYSIS OF THE GOVERNMENT’S FUNDS As noted earlier, the District uses fund accounting to ensure and demonstrate compliance with finance-related legal requirements. Governmental Funds The focus of the District’s governmental funds is to provide information on near-term inflows, outflows and balances of spendable resources. Such information is useful in assessing the District’s financing requirements. In particular, unreserved fund balance may serve as a useful measure of a government’s net resources available for spending at the end of the fiscal year. As of the end of the current fiscal year, the District’s governmental funds reported combined ending fund balances of $737,338, an increase of $19,689 in comparison with the prior year. The General Fund is the chief operating fund of the District. At the end of the current fiscal year, the General Fund total fund balance was $737,338, which is entirely unassigned.
The Special Revenue Fund has a fund balance of zero at the end of the year, showing no change from the prior year.
9
Proprietary Funds The District’s proprietary funds provide the same type of information found in the government-wide financial statements, but in more detail.
Overall proprietary fund net position totaled $8,312,069 at the end of the year.
Unrestricted net position of the Public Transportation Center Fund at the end of the year
amounted to $1,832,050, 27% of total net position of the fund. The Private Transportation Center Fund had an unrestricted net position deficiency of
$(3,642,900) in the fund. The Parking Lot Fund had an unrestricted net position of $1,276,234.
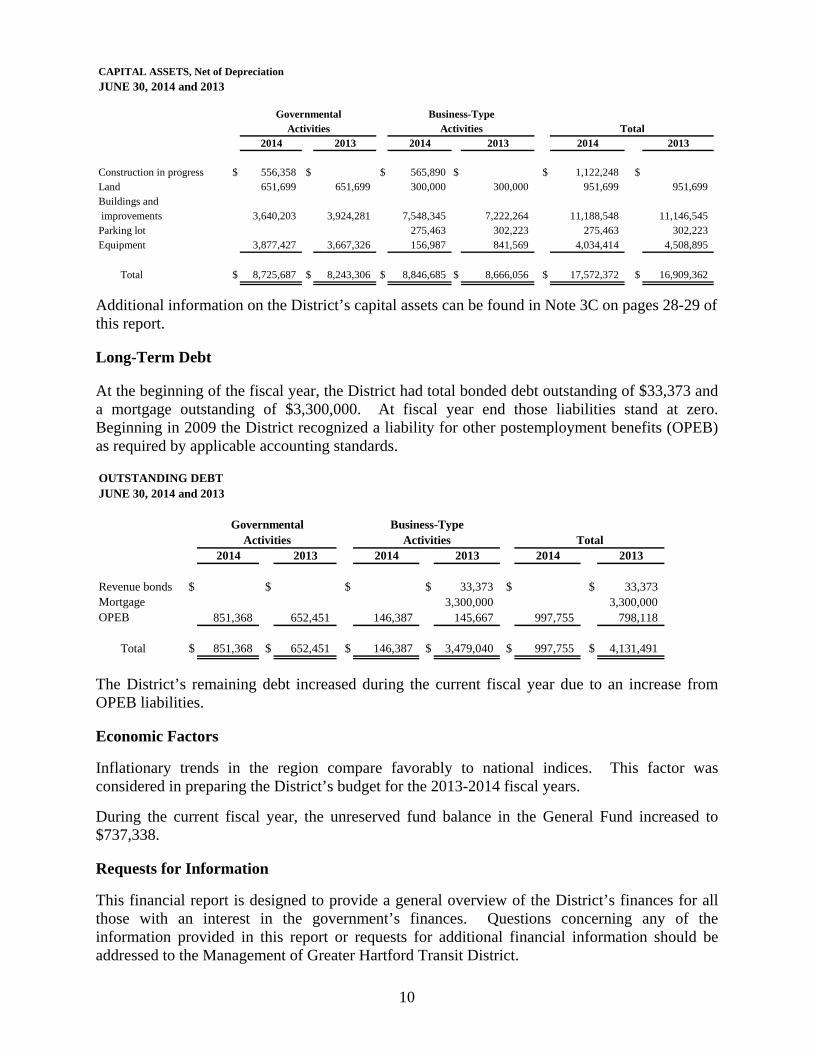
The total increase in net position for all funds was $3,600,134. Other factors concerning the finances of these three funds have already been addressed in the discussion of the District’s business-type activities. General Fund Budgetary Highlights Budget revenues and transfers decreased by $33,363 or 29%, between the original budget and the final amended budget. This decrease was primarily due to two matters. Disposed Vehicle Revenue will be used to purchase transit assets rather than be recorded as General Fund revenue. Additionally, a portion of unfunded agency-wide indirect costs were incurred in the General Fund. During the year, revenues and expenditures equaled the final budgeted amount. CAPITAL ASSET AND DEBT ADMINISTRATION Capital Assets The District’s net investment in capital assets for its governmental and business-type activities as of June 30, 2013 amounted to $8,725,687 and $8,846,685, respectively. This investment in capital assets included buildings, transportation vehicles, equipment and the parking lot. The District’s net investment in capital assets increased by $3,996,383 for the current fiscal year. Major capital asset events during the current fiscal year included the following:
Acquisition of 14 CNG vehicles for the ADA Service
Preliminary A & E Design began for ADA Operations/Maintenance Facility
Upgrade and improvements to District IT equipment
Upgrade to ADA scheduling system Trapeze
Purchase and installation of Bike Lockers for Bike Walk CT
Purchase and initial implementation phase for Passenger Information display system and information kiosk
Installation of Spruce Street Parking Lot attendant booth and systems
A & E and construction in the GHTD Administrative area of the Brownstone
A & E Streetscape
A & E Transit Center
Construction Administration Services Bushnell Park North
Construction Administration Services Asylum & Pearl Streets
10
CAPITAL ASSETS, Net of Depreciation
JUNE 30, 2014 and 2013
2014 2013 2014 2013 2014 2013
Construction in progress $ 556,358 $ $ 565,890 $ $ 1,122,248 $Land 651,699 651,699 300,000 300,000 951,699 951,699Buildings and improvements 3,640,203 3,924,281 7,548,345 7,222,264 11,188,548 11,146,545Parking lot 275,463 302,223 275,463 302,223Equipment 3,877,427 3,667,326 156,987 841,569 4,034,414 4,508,895
Total $ 8,725,687 $ 8,243,306 $ 8,846,685 $ 8,666,056 $ 17,572,372 $ 16,909,362
Governmental Business-TypeActivities Activities Total
Additional information on the District’s capital assets can be found in Note 3C on pages 28-29 of this report. Long-Term Debt At the beginning of the fiscal year, the District had total bonded debt outstanding of $33,373 and a mortgage outstanding of $3,300,000. At fiscal year end those liabilities stand at zero. Beginning in 2009 the District recognized a liability for other postemployment benefits (OPEB) as required by applicable accounting standards. OUTSTANDING DEBTJUNE 30, 2014 and 2013
2014 2013 2014 2013 2014 2013
Revenue bonds $ $ $ $ 33,373 $ $ 33,373Mortgage 3,300,000 3,300,000OPEB 851,368 652,451 146,387 145,667 997,755 798,118
Total $ 851,368 $ 652,451 $ 146,387 $ 3,479,040 $ 997,755 $ 4,131,491
Governmental Business-TypeActivities Activities Total
The District’s remaining debt increased during the current fiscal year due to an increase from OPEB liabilities. Economic Factors
Inflationary trends in the region compare favorably to national indices. This factor was considered in preparing the District’s budget for the 2013-2014 fiscal years.
During the current fiscal year, the unreserved fund balance in the General Fund increased to $737,338. Requests for Information
This financial report is designed to provide a general overview of the District’s finances for all those with an interest in the government’s finances. Questions concerning any of the information provided in this report or requests for additional financial information should be addressed to the Management of Greater Hartford Transit District.
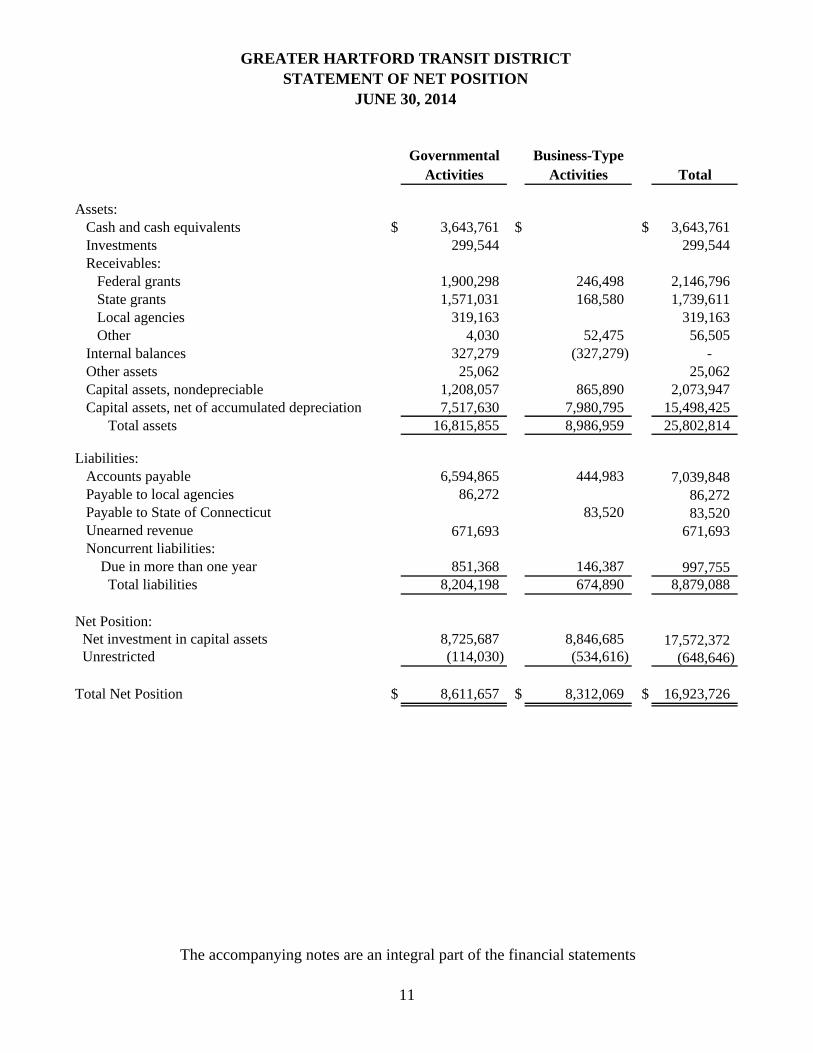
Governmental Business-TypeActivities Activities Total
Assets: Cash and cash equivalents $ 3,643,761 $ $ 3,643,761 Investments 299,544 299,544 Receivables: Federal grants 1,900,298 246,498 2,146,796 State grants 1,571,031 168,580 1,739,611 Local agencies 319,163 319,163 Other 4,030 52,475 56,505 Internal balances 327,279 (327,279) - Other assets 25,062 25,062 Capital assets, nondepreciable 1,208,057 865,890 2,073,947 Capital assets, net of accumulated depreciation 7,517,630 7,980,795 15,498,425 Total assets 16,815,855 8,986,959 25,802,814
Liabilities: Accounts payable 6,594,865 444,983 7,039,848 Payable to local agencies 86,272 86,272 Payable to State of Connecticut 83,520 83,520
Unearned revenue 671,693 671,693 Noncurrent liabilities: Due in more than one year 851,368 146,387 997,755
Total liabilities 8,204,198 674,890 8,879,088
Net Position: Net investment in capital assets 8,725,687 8,846,685 17,572,372 Unrestricted (114,030) (534,616) (648,646)
Total Net Position $ 8,611,657 $ 8,312,069 $ 16,923,726
GREATER HARTFORD TRANSIT DISTRICTSTATEMENT OF NET POSITION
JUNE 30, 2014
The accompanying notes are an integral part of the financial statements
11
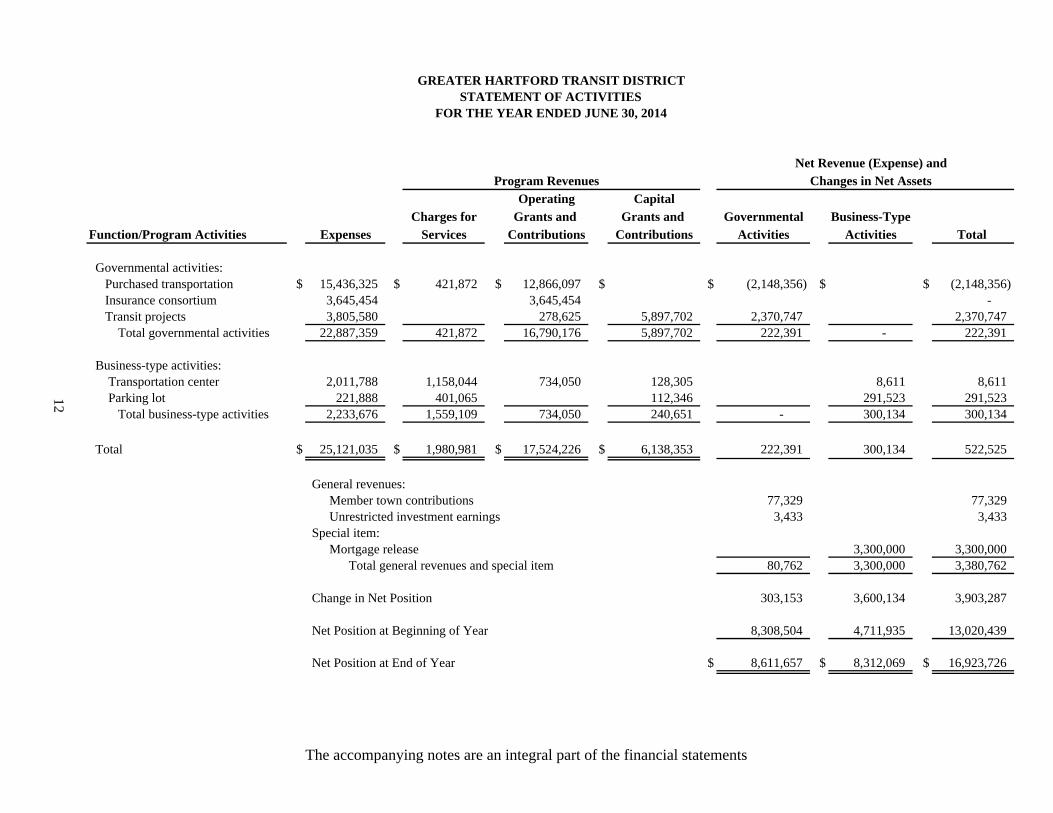
GREATER HARTFORD TRANSIT DISTRICTSTATEMENT OF ACTIVITIES
FOR THE YEAR ENDED JUNE 30, 2014
Net Revenue (Expense) andProgram Revenues Changes in Net Assets
Operating CapitalCharges for Grants and Grants and Governmental Business-Type
Function/Program Activities Expenses Services Contributions Contributions Activities Activities Total
Governmental activities: Purchased transportation $ 15,436,325 $ 421,872 $ 12,866,097 $ $ (2,148,356) $ $ (2,148,356) Insurance consortium 3,645,454 3,645,454 - Transit projects 3,805,580 278,625 5,897,702 2,370,747 2,370,747 Total governmental activities 22,887,359 421,872 16,790,176 5,897,702 222,391 - 222,391
Business-type activities: Transportation center 2,011,788 1,158,044 734,050 128,305 8,611 8,611 Parking lot 221,888 401,065 112,346 291,523 291,523 Total business-type activities 2,233,676 1,559,109 734,050 240,651 - 300,134 300,134
Total $ 25,121,035 $ 1,980,981 $ 17,524,226 $ 6,138,353 222,391 300,134 522,525
General revenues: Member town contributions 77,329 77,329 Unrestricted investment earnings 3,433 3,433
Special item: Mortgage release 3,300,000 3,300,000 Total general revenues and special item 80,762 3,300,000 3,380,762
Change in Net Position 303,153 3,600,134 3,903,287
Net Position at Beginning of Year 8,308,504 4,711,935 13,020,439
Net Position at End of Year $ 8,611,657 $ 8,312,069 $ 16,923,726
12
The accompanying notes are an integral part of the financial statements
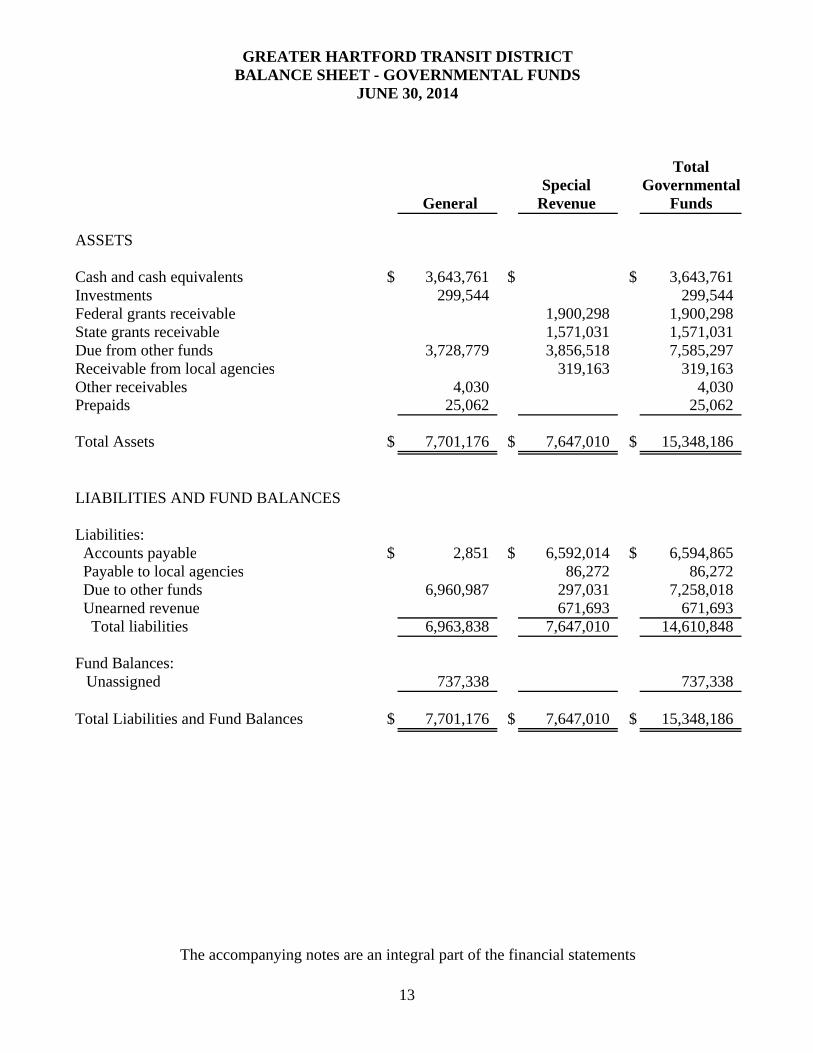
Total
Special Governmental General Revenue Funds
ASSETS
Cash and cash equivalents $ 3,643,761 $ $ 3,643,761 Investments 299,544 299,544 Federal grants receivable 1,900,298 1,900,298 State grants receivable 1,571,031 1,571,031 Due from other funds 3,728,779 3,856,518 7,585,297 Receivable from local agencies 319,163 319,163 Other receivables 4,030 4,030 Prepaids 25,062 25,062
Total Assets $ 7,701,176 $ 7,647,010 $ 15,348,186
LIABILITIES AND FUND BALANCES
Liabilities: Accounts payable $ 2,851 $ 6,592,014 $ 6,594,865 Payable to local agencies 86,272 86,272 Due to other funds 6,960,987 297,031 7,258,018 Unearned revenue 671,693 671,693 Total liabilities 6,963,838 7,647,010 14,610,848
Fund Balances:Unassigned 737,338 737,338
Total Liabilities and Fund Balances $ 7,701,176 $ 7,647,010 $ 15,348,186
GREATER HARTFORD TRANSIT DISTRICTBALANCE SHEET - GOVERNMENTAL FUNDS
JUNE 30, 2014
The accompanying notes are an integral part of the financial statements
13
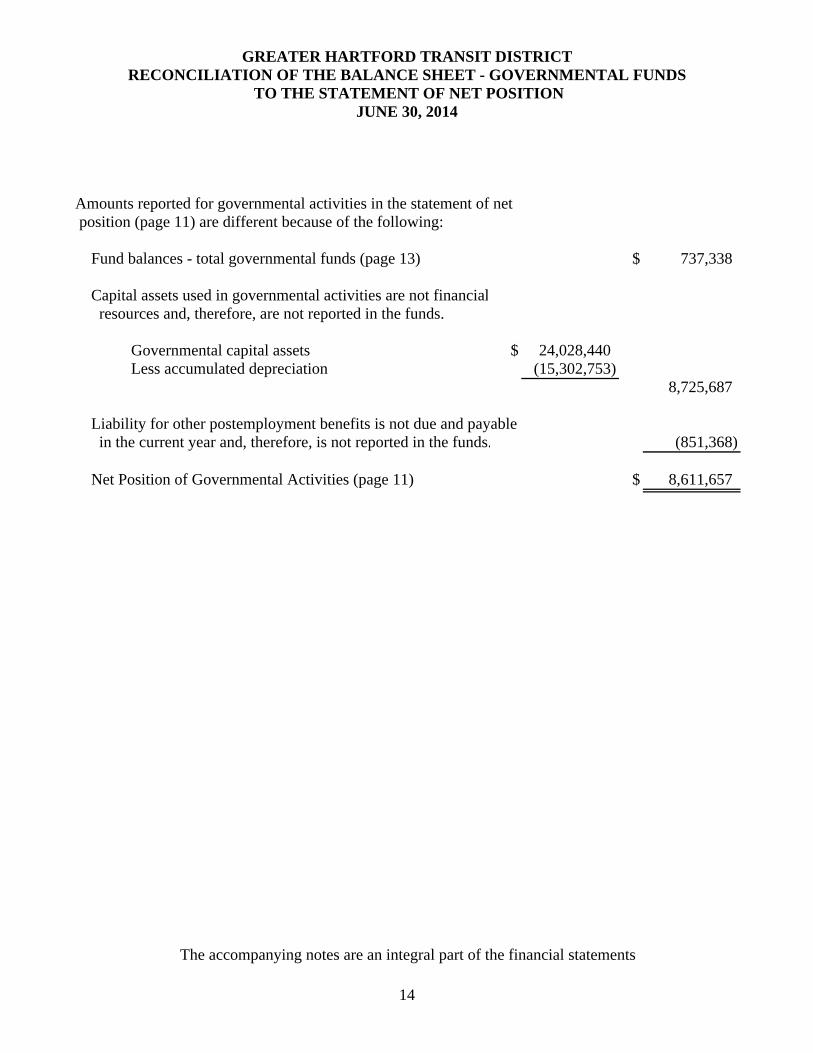
GREATER HARTFORD TRANSIT DISTRICTRECONCILIATION OF THE BALANCE SHEET - GOVERNMENTAL FUNDS
TO THE STATEMENT OF NET POSITIONJUNE 30, 2014
Amounts reported for governmental activities in the statement of net position (page 11) are different because of the following:
Fund balances - total governmental funds (page 13) $ 737,338
Capital assets used in governmental activities are not financial resources and, therefore, are not reported in the funds.
Governmental capital assets $ 24,028,440 Less accumulated depreciation (15,302,753)
8,725,687
Liability for other postemployment benefits is not due and payable in the current year and, therefore, is not reported in the funds. (851,368)
Net Position of Governmental Activities (page 11) $ 8,611,657
The accompanying notes are an integral part of the financial statements
14
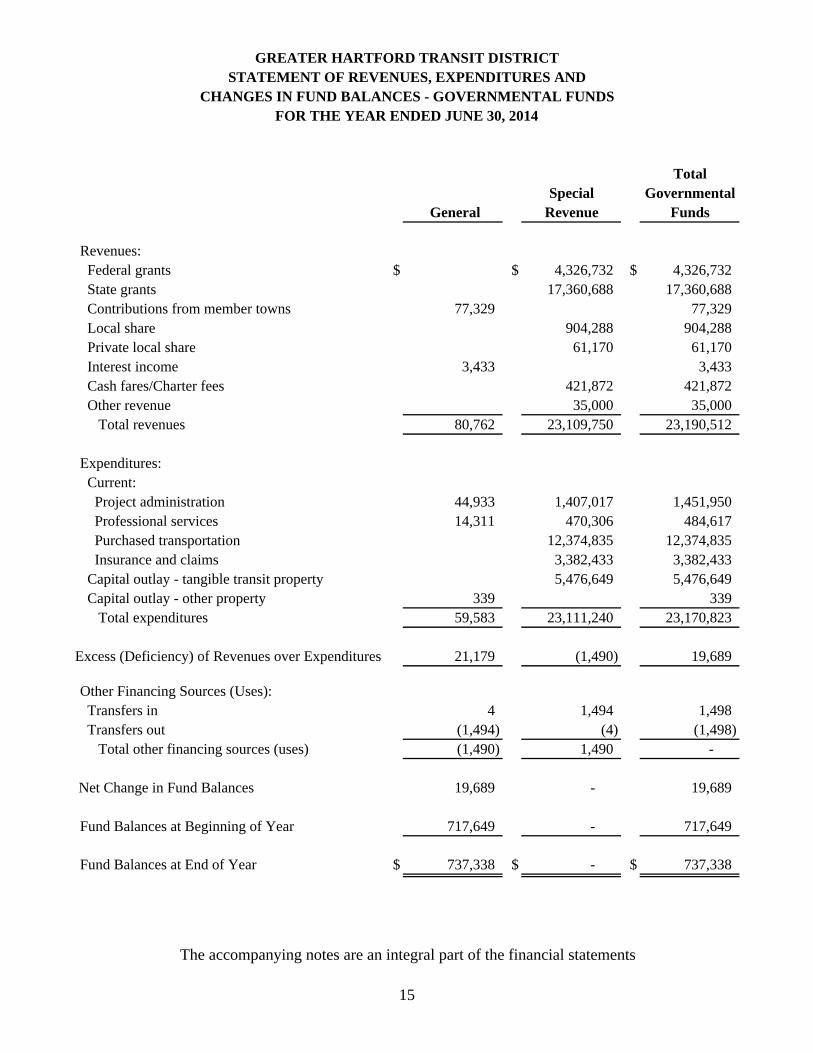
GREATER HARTFORD TRANSIT DISTRICTSTATEMENT OF REVENUES, EXPENDITURES AND
CHANGES IN FUND BALANCES - GOVERNMENTAL FUNDSFOR THE YEAR ENDED JUNE 30, 2014
Total Special Governmental
General Revenue Funds
Revenues: Federal grants $ $ 4,326,732 $ 4,326,732 State grants 17,360,688 17,360,688 Contributions from member towns 77,329 77,329 Local share 904,288 904,288 Private local share 61,170 61,170 Interest income 3,433 3,433 Cash fares/Charter fees 421,872 421,872 Other revenue 35,000 35,000 Total revenues 80,762 23,109,750 23,190,512
Expenditures: Current: Project administration 44,933 1,407,017 1,451,950 Professional services 14,311 470,306 484,617 Purchased transportation 12,374,835 12,374,835 Insurance and claims 3,382,433 3,382,433 Capital outlay - tangible transit property 5,476,649 5,476,649 Capital outlay - other property 339 339 Total expenditures 59,583 23,111,240 23,170,823
Excess (Deficiency) of Revenues over Expenditures 21,179 (1,490) 19,689
Other Financing Sources (Uses): Transfers in 4 1,494 1,498 Transfers out (1,494) (4) (1,498) Total other financing sources (uses) (1,490) 1,490 -
Net Change in Fund Balances 19,689 - 19,689
Fund Balances at Beginning of Year 717,649 - 717,649
Fund Balances at End of Year $ 737,338 $ - $ 737,338
The accompanying notes are an integral part of the financial statements
15
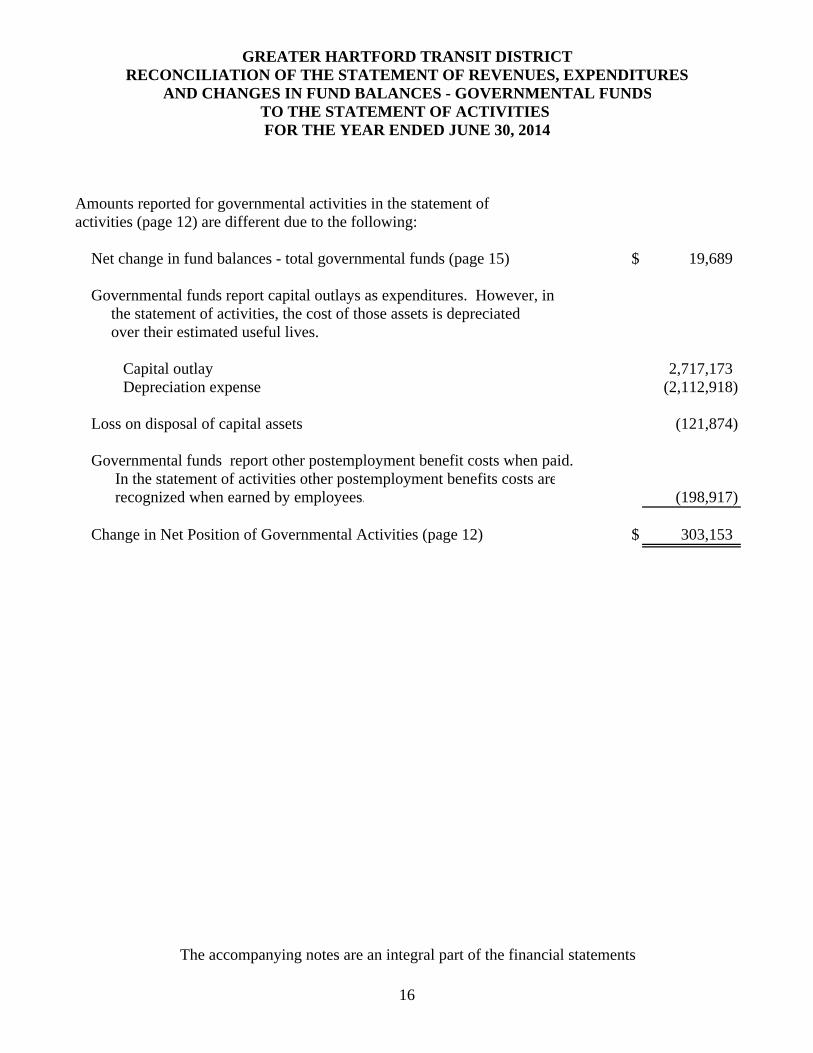
GREATER HARTFORD TRANSIT DISTRICTRECONCILIATION OF THE STATEMENT OF REVENUES, EXPENDITURES
AND CHANGES IN FUND BALANCES - GOVERNMENTAL FUNDSTO THE STATEMENT OF ACTIVITIES FOR THE YEAR ENDED JUNE 30, 2014
Amounts reported for governmental activities in the statement of activities (page 12) are different due to the following: Net change in fund balances - total governmental funds (page 15) $ 19,689
Governmental funds report capital outlays as expenditures. However, in the statement of activities, the cost of those assets is depreciated over their estimated useful lives. Capital outlay 2,717,173 Depreciation expense (2,112,918)
Loss on disposal of capital assets (121,874)
Governmental funds report other postemployment benefit costs when paid. In the statement of activities other postemployment benefits costs are recognized when earned by employees. (198,917)
Change in Net Position of Governmental Activities (page 12) $ 303,153
The accompanying notes are an integral part of the financial statements
16
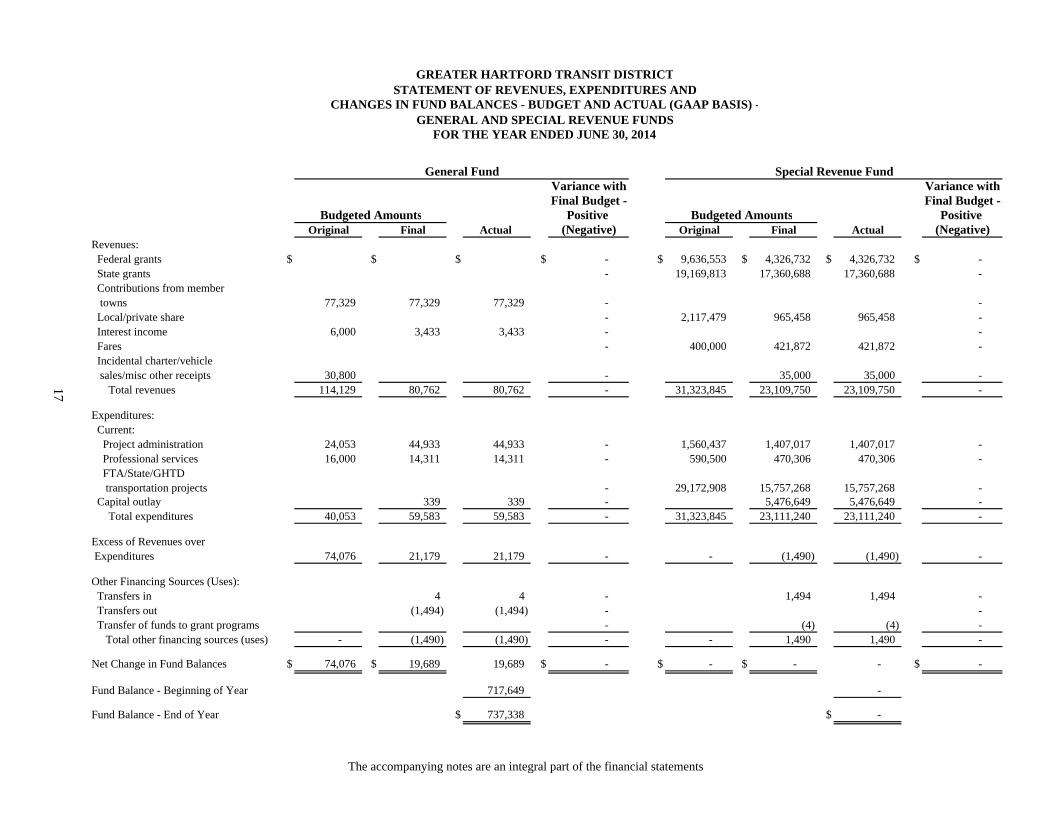
Variance with Variance withFinal Budget - Final Budget -
Positive Positive Original Final Actual (Negative) Original Final Actual (Negative)
Revenues: Federal grants $ $ $ $ - $ 9,636,553 $ 4,326,732 $ 4,326,732 $ - State grants - 19,169,813 17,360,688 17,360,688 - Contributions from member towns 77,329 77,329 77,329 - - Local/private share - 2,117,479 965,458 965,458 - Interest income 6,000 3,433 3,433 - - Fares - 400,000 421,872 421,872 - Incidental charter/vehicle sales/misc other receipts 30,800 - 35,000 35,000 - Total revenues 114,129 80,762 80,762 - 31,323,845 23,109,750 23,109,750 -
Expenditures: Current: Project administration 24,053 44,933 44,933 - 1,560,437 1,407,017 1,407,017 - Professional services 16,000 14,311 14,311 - 590,500 470,306 470,306 - FTA/State/GHTD transportation projects - 29,172,908 15,757,268 15,757,268 - Capital outlay 339 339 - 5,476,649 5,476,649 - Total expenditures 40,053 59,583 59,583 - 31,323,845 23,111,240 23,111,240 -
Excess of Revenues over Expenditures 74,076 21,179 21,179 - - (1,490) (1,490) -
Other Financing Sources (Uses): Transfers in 4 4 - 1,494 1,494 - Transfers out (1,494) (1,494) - - Transfer of funds to grant programs - (4) (4) - Total other financing sources (uses) - (1,490) (1,490) - - 1,490 1,490 -
Net Change in Fund Balances $ 74,076 $ 19,689 19,689 $ - $ - $ - - $ -
Fund Balance - Beginning of Year 717,649 -
Fund Balance - End of Year $ 737,338 $ -
17
CHANGES IN FUND BALANCES - BUDGET AND ACTUAL (GAAP BASIS) -STATEMENT OF REVENUES, EXPENDITURES AND
GREATER HARTFORD TRANSIT DISTRICT
FOR THE YEAR ENDED JUNE 30, 2014GENERAL AND SPECIAL REVENUE FUNDS
Budgeted Amounts Budgeted Amounts
General Fund Special Revenue Fund
The accompanying notes are an integral part of the financial statements
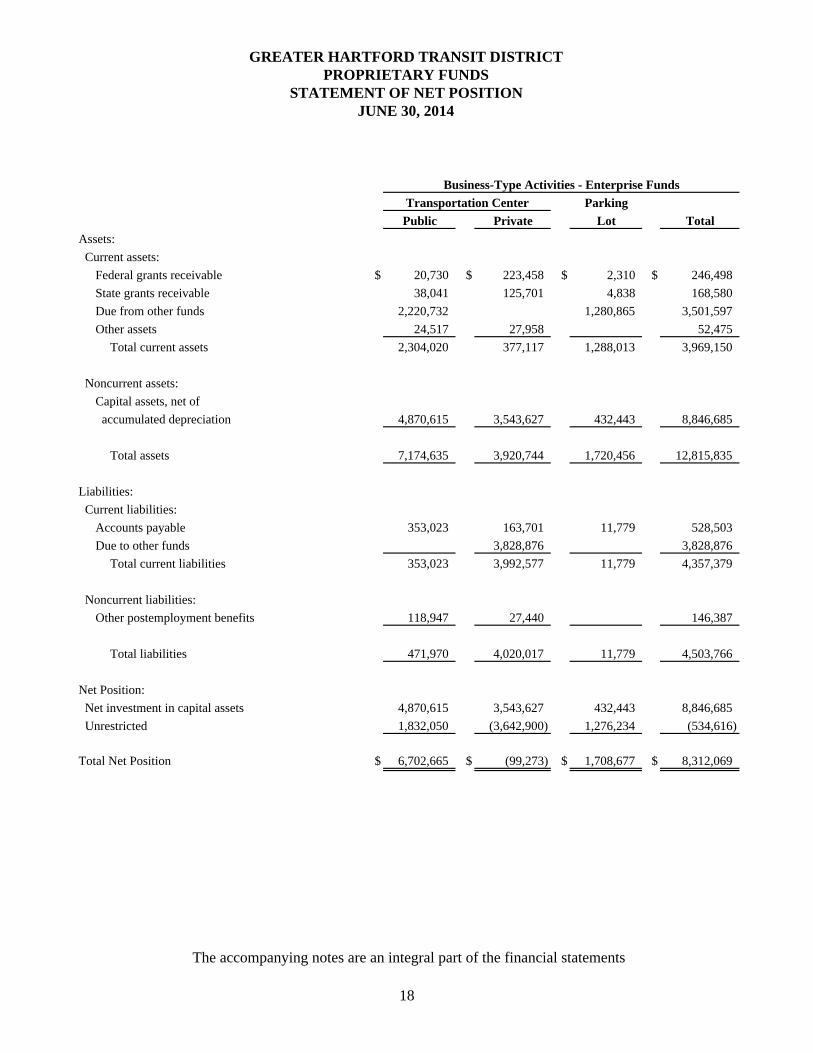
Parking
Public Private Lot Total
Assets:
Current assets:
Federal grants receivable $ 20,730 $ 223,458 $ 2,310 $ 246,498
State grants receivable 38,041 125,701 4,838 168,580
Due from other funds 2,220,732 1,280,865 3,501,597
Other assets 24,517 27,958 52,475
Total current assets 2,304,020 377,117 1,288,013 3,969,150
Noncurrent assets:
Capital assets, net of
accumulated depreciation 4,870,615 3,543,627 432,443 8,846,685
Total assets 7,174,635 3,920,744 1,720,456 12,815,835
Liabilities:
Current liabilities:
Accounts payable 353,023 163,701 11,779 528,503
Due to other funds 3,828,876 3,828,876
Total current liabilities 353,023 3,992,577 11,779 4,357,379
Noncurrent liabilities:
Other postemployment benefits 118,947 27,440 146,387
Total liabilities 471,970 4,020,017 11,779 4,503,766
Net Position:
Net investment in capital assets 4,870,615 3,543,627 432,443 8,846,685
Unrestricted 1,832,050 (3,642,900) 1,276,234 (534,616)
Total Net Position $ 6,702,665 $ (99,273) $ 1,708,677 $ 8,312,069
Transportation Center
GREATER HARTFORD TRANSIT DISTRICTPROPRIETARY FUNDS
STATEMENT OF NET POSITIONJUNE 30, 2014
Business-Type Activities - Enterprise Funds
The accompanying notes are an integral part of the financial statements
18
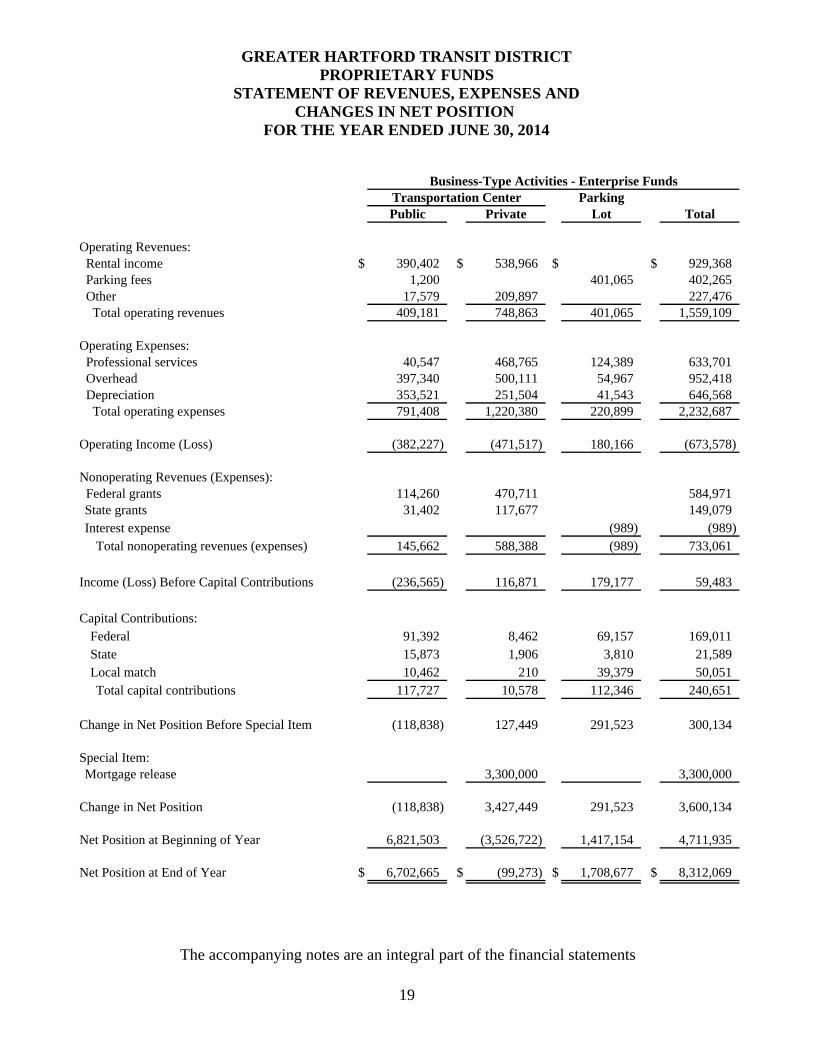
ParkingPublic Private Lot Total
Operating Revenues: Rental income $ 390,402 $ 538,966 $ $ 929,368 Parking fees 1,200 401,065 402,265 Other 17,579 209,897 227,476 Total operating revenues 409,181 748,863 401,065 1,559,109
Operating Expenses: Professional services 40,547 468,765 124,389 633,701 Overhead 397,340 500,111 54,967 952,418 Depreciation 353,521 251,504 41,543 646,568 Total operating expenses 791,408 1,220,380 220,899 2,232,687
Operating Income (Loss) (382,227) (471,517) 180,166 (673,578)
Nonoperating Revenues (Expenses): Federal grants 114,260 470,711 584,971
State grants 31,402 117,677 149,079 Interest expense (989) (989) Total nonoperating revenues (expenses) 145,662 588,388 (989) 733,061
Income (Loss) Before Capital Contributions (236,565) 116,871 179,177 59,483
Capital Contributions: Federal 91,392 8,462 69,157 169,011 State 15,873 1,906 3,810 21,589 Local match 10,462 210 39,379 50,051
Total capital contributions 117,727 10,578 112,346 240,651
Change in Net Position Before Special Item (118,838) 127,449 291,523 300,134
Special Item: Mortgage release 3,300,000 3,300,000
Change in Net Position (118,838) 3,427,449 291,523 3,600,134
Net Position at Beginning of Year 6,821,503 (3,526,722) 1,417,154 4,711,935
Net Position at End of Year $ 6,702,665 $ (99,273) $ 1,708,677 $ 8,312,069
Transportation Center
FOR THE YEAR ENDED JUNE 30, 2014
GREATER HARTFORD TRANSIT DISTRICTPROPRIETARY FUNDS
STATEMENT OF REVENUES, EXPENSES ANDCHANGES IN NET POSITION
Business-Type Activities - Enterprise Funds
The accompanying notes are an integral part of the financial statements
19
GREATER HARTFORD TRANSIT DISTRICTPROPRIETARY FUNDS
STATEMENT OF CASH FLOWSFOR THE YEAR ENDED JUNE 30, 2014
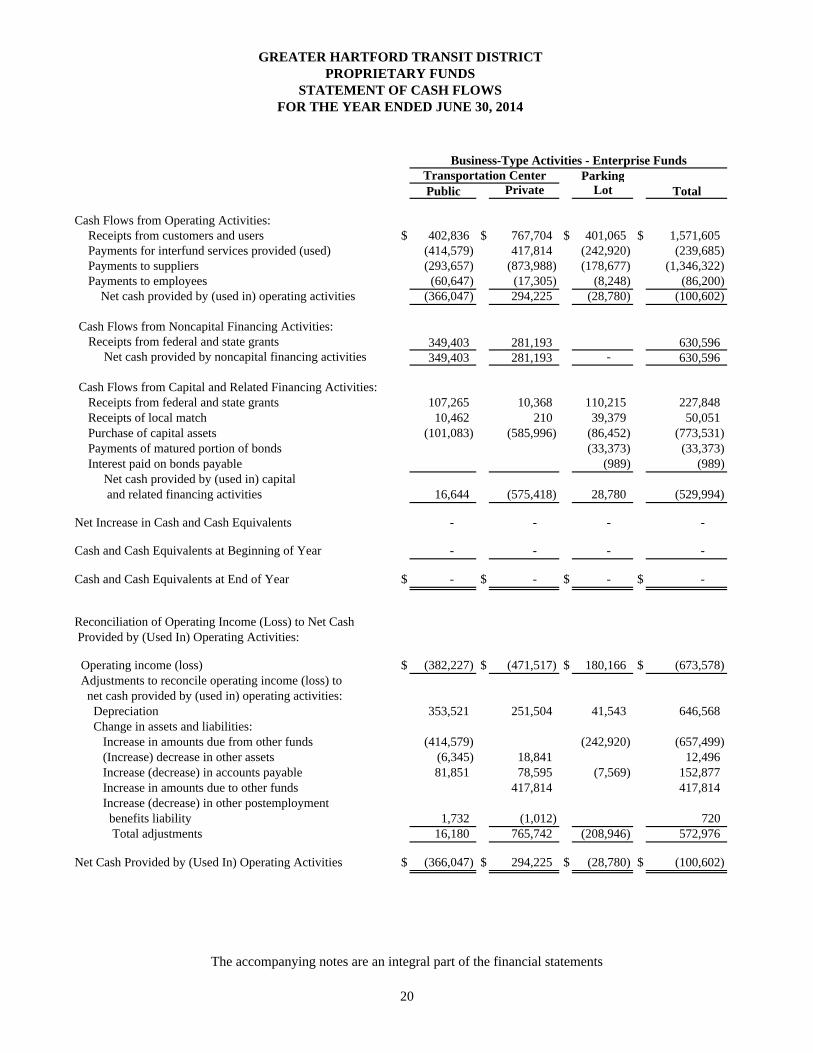
ParkingPublic Private Lot Total
Cash Flows from Operating Activities: Receipts from customers and users $ 402,836 $ 767,704 $ 401,065 $ 1,571,605 Payments for interfund services provided (used) (414,579) 417,814 (242,920) (239,685) Payments to suppliers (293,657) (873,988) (178,677) (1,346,322) Payments to employees (60,647) (17,305) (8,248) (86,200) Net cash provided by (used in) operating activities (366,047) 294,225 (28,780) (100,602)
Cash Flows from Noncapital Financing Activities: Receipts from federal and state grants 349,403 281,193 630,596
Net cash provided by noncapital financing activities 349,403 281,193 - 630,596
Cash Flows from Capital and Related Financing Activities: Receipts from federal and state grants 107,265 10,368 110,215 227,848 Receipts of local match 10,462 210 39,379 50,051 Purchase of capital assets (101,083) (585,996) (86,452) (773,531) Payments of matured portion of bonds (33,373) (33,373) Interest paid on bonds payable (989) (989) Net cash provided by (used in) capital and related financing activities 16,644 (575,418) 28,780 (529,994)
Net Increase in Cash and Cash Equivalents - - - -
Cash and Cash Equivalents at Beginning of Year - - - -
Cash and Cash Equivalents at End of Year $ - $ - $ - $ -
Reconciliation of Operating Income (Loss) to Net Cash Provided by (Used In) Operating Activities:
Operating income (loss) $ (382,227) $ (471,517) $ 180,166 $ (673,578) Adjustments to reconcile operating income (loss) to net cash provided by (used in) operating activities: Depreciation 353,521 251,504 41,543 646,568 Change in assets and liabilities: Increase in amounts due from other funds (414,579) (242,920) (657,499) (Increase) decrease in other assets (6,345) 18,841 12,496 Increase (decrease) in accounts payable 81,851 78,595 (7,569) 152,877 Increase in amounts due to other funds 417,814 417,814 Increase (decrease) in other postemployment benefits liability 1,732 (1,012) 720 Total adjustments 16,180 765,742 (208,946) 572,976
Net Cash Provided by (Used In) Operating Activities $ (366,047) $ 294,225 $ (28,780) $ (100,602)
Transportation CenterBusiness-Type Activities - Enterprise Funds
The accompanying notes are an integral part of the financial statements
20
21
GREATER HARTFORD TRANSIT DISTRICT
NOTES TO FINANCIAL STATEMENTS
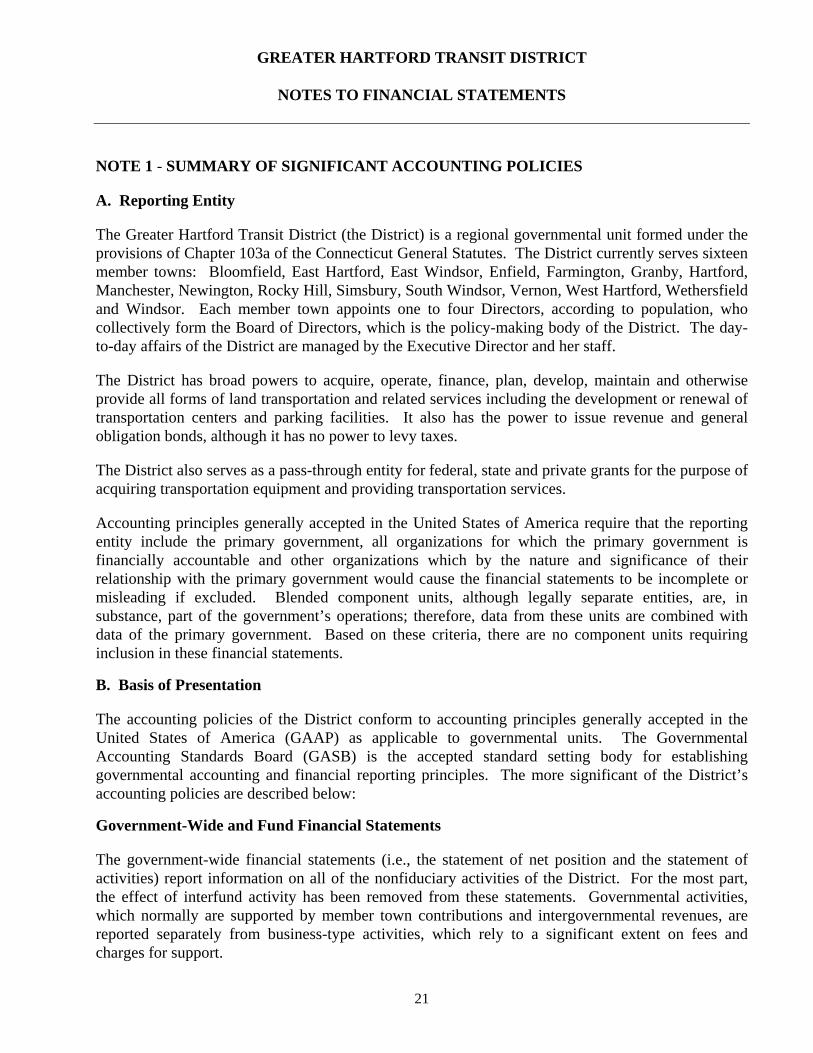
NOTE 1 - SUMMARY OF SIGNIFICANT ACCOUNTING POLICIES A. Reporting Entity The Greater Hartford Transit District (the District) is a regional governmental unit formed under the provisions of Chapter 103a of the Connecticut General Statutes. The District currently serves sixteen member towns: Bloomfield, East Hartford, East Windsor, Enfield, Farmington, Granby, Hartford, Manchester, Newington, Rocky Hill, Simsbury, South Windsor, Vernon, West Hartford, Wethersfield and Windsor. Each member town appoints one to four Directors, according to population, who collectively form the Board of Directors, which is the policy-making body of the District. The day-to-day affairs of the District are managed by the Executive Director and her staff. The District has broad powers to acquire, operate, finance, plan, develop, maintain and otherwise provide all forms of land transportation and related services including the development or renewal of transportation centers and parking facilities. It also has the power to issue revenue and general obligation bonds, although it has no power to levy taxes. The District also serves as a pass-through entity for federal, state and private grants for the purpose of acquiring transportation equipment and providing transportation services. Accounting principles generally accepted in the United States of America require that the reporting entity include the primary government, all organizations for which the primary government is financially accountable and other organizations which by the nature and significance of their relationship with the primary government would cause the financial statements to be incomplete or misleading if excluded. Blended component units, although legally separate entities, are, in substance, part of the government’s operations; therefore, data from these units are combined with data of the primary government. Based on these criteria, there are no component units requiring inclusion in these financial statements. B. Basis of Presentation The accounting policies of the District conform to accounting principles generally accepted in the United States of America (GAAP) as applicable to governmental units. The Governmental Accounting Standards Board (GASB) is the accepted standard setting body for establishing governmental accounting and financial reporting principles. The more significant of the District’s accounting policies are described below: Government-Wide and Fund Financial Statements The government-wide financial statements (i.e., the statement of net position and the statement of activities) report information on all of the nonfiduciary activities of the District. For the most part, the effect of interfund activity has been removed from these statements. Governmental activities, which normally are supported by member town contributions and intergovernmental revenues, are reported separately from business-type activities, which rely to a significant extent on fees and charges for support.
GREATER HARTFORD TRANSIT DISTRICT
NOTES TO FINANCIAL STATEMENTS (CONTINUED)
22
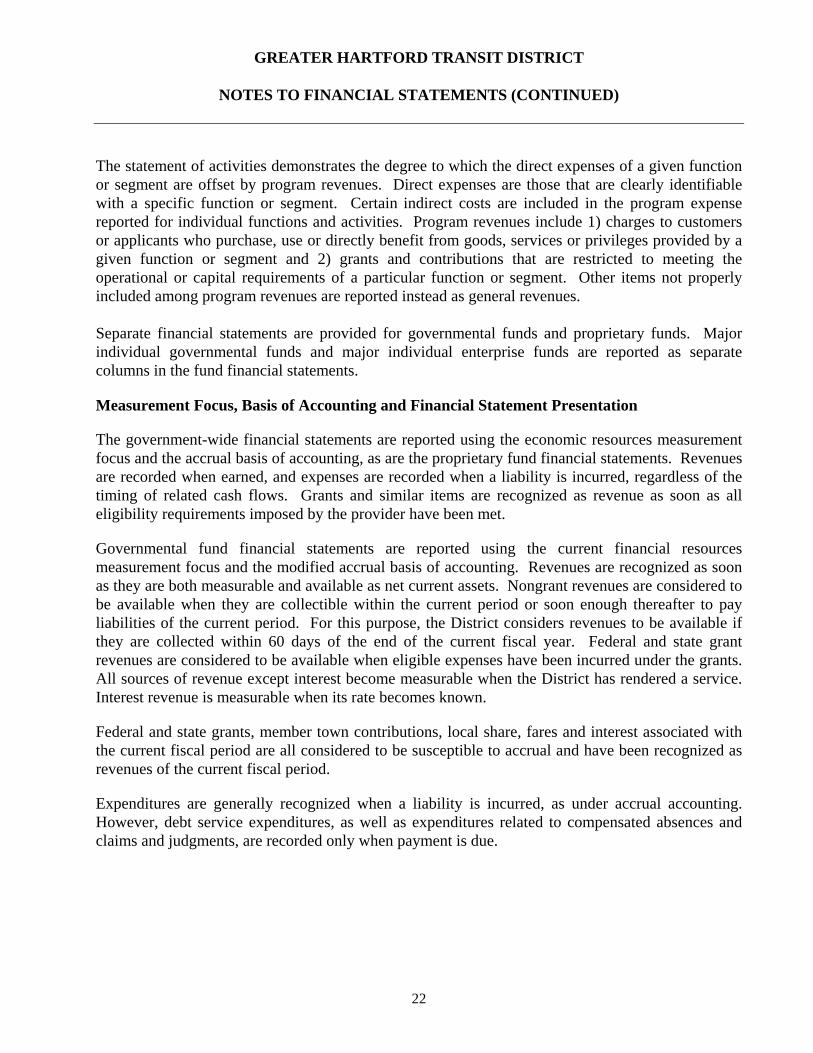
The statement of activities demonstrates the degree to which the direct expenses of a given function or segment are offset by program revenues. Direct expenses are those that are clearly identifiable with a specific function or segment. Certain indirect costs are included in the program expense reported for individual functions and activities. Program revenues include 1) charges to customers or applicants who purchase, use or directly benefit from goods, services or privileges provided by a given function or segment and 2) grants and contributions that are restricted to meeting the operational or capital requirements of a particular function or segment. Other items not properly included among program revenues are reported instead as general revenues. Separate financial statements are provided for governmental funds and proprietary funds. Major individual governmental funds and major individual enterprise funds are reported as separate columns in the fund financial statements. Measurement Focus, Basis of Accounting and Financial Statement Presentation The government-wide financial statements are reported using the economic resources measurement focus and the accrual basis of accounting, as are the proprietary fund financial statements. Revenues are recorded when earned, and expenses are recorded when a liability is incurred, regardless of the timing of related cash flows. Grants and similar items are recognized as revenue as soon as all eligibility requirements imposed by the provider have been met. Governmental fund financial statements are reported using the current financial resources measurement focus and the modified accrual basis of accounting. Revenues are recognized as soon as they are both measurable and available as net current assets. Nongrant revenues are considered to be available when they are collectible within the current period or soon enough thereafter to pay liabilities of the current period. For this purpose, the District considers revenues to be available if they are collected within 60 days of the end of the current fiscal year. Federal and state grant revenues are considered to be available when eligible expenses have been incurred under the grants. All sources of revenue except interest become measurable when the District has rendered a service. Interest revenue is measurable when its rate becomes known. Federal and state grants, member town contributions, local share, fares and interest associated with the current fiscal period are all considered to be susceptible to accrual and have been recognized as revenues of the current fiscal period. Expenditures are generally recognized when a liability is incurred, as under accrual accounting. However, debt service expenditures, as well as expenditures related to compensated absences and claims and judgments, are recorded only when payment is due.
GREATER HARTFORD TRANSIT DISTRICT
NOTES TO FINANCIAL STATEMENTS (CONTINUED)
23
The District reports the following major governmental funds:
The General Fund is the District’s primary operating fund. It accounts for all financial resources of the District, except those required to be accounted for in another fund.
The Special Revenue Fund is used to account for the proceeds of federal and state grants that
are legally restricted to expenditures for specified purposes. The major source of revenue for this fund is governmental grants.
The District reports the following major proprietary funds:
The Transportation Center - Public and Private funds are used to account for operation and maintenance of the public and private portions, respectively, of the Union Station facility.
The Parking Lot is used to account for operation and maintenance of the parking lot adjacent
to Union Station.
As a general rule, the effect of interfund activity has been eliminated from the government-wide financial statements. Exceptions to this general rule are charges between the enterprise funds and various other functions of the government. Elimination of these charges would distort the direct costs and program revenues reported for the various functions concerned. Amounts reported as program revenues include 1) charges to customers or applicants for goods, services or privileges provided, 2) operating grants and contributions, and 3) capital grants and contributions. Internally dedicated resources are reported as general revenues rather than as program revenues. Proprietary funds distinguish operating revenues and expenses from nonoperating items. Operating revenues and expenses generally result from providing services and delivering goods in connection with a proprietary fund’s principal ongoing operations. The principal operating revenues of the proprietary funds are charges to customers for services. Operating expenses for enterprise funds include the cost of sales and services, administrative expenses and depreciation on capital assets. All revenues and expenses not meeting this definition are reported as nonoperating revenues and expenses. When both restricted and unrestricted resources are available for use, it is the District’s policy to use restricted resources first, then unrestricted resources as they are needed. Unrestricted resources are used in the following order: committed, assigned then unassigned. C. Cash Equivalents For purposes of reporting cash flows, all savings, checking and money market accounts with an original maturity of less than 90 days are considered to be cash equivalents. D. Investments Investments are reported at fair value using quoted market prices.
GREATER HARTFORD TRANSIT DISTRICT
NOTES TO FINANCIAL STATEMENTS (CONTINUED)
24
E. Capital Assets Capital assets, which include property, plant and equipment, are reported in the applicable governmental or business-type activities columns in the government-wide financial statements. Capital assets are defined by the District as assets with an initial individual cost of more than $5,000 and an estimated useful life of more than two years. Such assets are recorded at historical cost or estimated historical cost if purchased or constructed. Donated capital assets are recorded at estimated fair market value at the date of donation. The costs of normal maintenance and repairs that do not add to the value of the asset or materially extend its useful life are not capitalized. Property, plant and equipment is depreciated using the straight-line method over the following estimated useful lives:
Equipment 7 years Parking lot 20 years Buildings and improvements 30 years Passenger vans 4 years Buses 12 years Office equipment 5 years Radios 5 years ADA/DAR computer system 5 years Company vehicles 5 years Land and Union Station Transportation Center 40 years Renovations of Union Station Transportation Center 40 years
F. Payable to Local Agencies Amounts shown as payable to local agencies in the Special Revenue Fund are amounts due to towns or agencies that are subrecipients of state and federal grants relating to transportation services and capital equipment purchases. G. Accumulated Unpaid Vacation, Sick Pay and Other Employee Benefit Amounts Accumulated unpaid vacation, sick pay and other employee benefit amounts are accrued when incurred in the government-wide and proprietary fund financial statements (using the accrual basis of accounting). Such amounts are accrued in governmental funds (using the modified accrual basis of accounting) only if they have matured, for example, as a result of employee resignations and retirements. The District has a policy of reimbursing an employee for any accumulated vacation or other employee benefits at the end of each fiscal year. The District is not obligated to pay accumulated sick time until the Board of Directors approves the expenditure. Therefore, no liability for vacation or sick pay has been recognized in the District’s financial statements.
GREATER HARTFORD TRANSIT DISTRICT
NOTES TO FINANCIAL STATEMENTS (CONTINUED)
25
H. Long-Term Obligations In the government-wide financial statements and proprietary fund types in the fund financial statements, long-term debt and other long-term obligations are reported as liabilities in the applicable governmental activities, business-type activities or proprietary fund type statement of net position. Bond premiums and discounts are deferred and amortized over the life of the bonds using the effective interest method. Bonds payable are reported net of the applicable bond premium or discount. Bond issuance costs whether or not withheld from the actual debt proceeds received, are reported as debt service expenditures. In the fund financial statements, governmental fund types recognize bond premiums and discounts, as well as bond issuance costs, during the current period. The face amount of debt issued is reported as other financing sources. Premiums received on debt issuances are reported as other financing sources while discounts on debt issuances are reported as other financing uses. Issuance costs, whether or not withheld from the actual debt proceeds received, are reported as debt service expenditures. I. Fund Equity Equity in the government-wide financial statements and proprietary funds is defined as “net position” and is classified in the following categories:
Net Investment in Capital Assets - This component of net position consists of capital assets, net of accumulated depreciation and reduced by the outstanding balances of any bonds, notes or other borrowings that are attributable to the acquisition, construction or improvement of those assets. Unrestricted - This component consists of net position that does not meet the definition of “Net investment in capital assets.”
Equity in the governmental fund financial statements is defined as “fund balance” and is classified in the following categories:
Nonspendable Fund Balance - This represents amounts that cannot be spent due to form (e.g., inventories and prepaid amounts). There is currently no nonspendable fund balance for the District. Restricted Fund Balance - This represents amounts constrained for a specific purpose by external parties, such as grantors, contributors or laws and regulations of their governments. There is currently no restricted fund balance for the District. Committed Fund Balance - This represents amounts constrained for a specific purpose by a government using its highest level of decision-making authority (the District’s Board of Directors). The Board of Directors may commit resources by resolution prior to the end of the fiscal year. Once adopted, the limitation imposed by the resolution remains in place until a similar action is taken to remove or revise the limitation. There is currently no committed fund balance for the District.
GREATER HARTFORD TRANSIT DISTRICT
NOTES TO FINANCIAL STATEMENTS (CONTINUED)
26
Assigned Fund Balance - For all governmental funds other than the General Fund, this represents any remaining positive amounts not classified as nonspendable, restricted or committed. For the General Fund, this includes amounts constrained for the intent to be used for a specific purpose by the Board of Directors. There is currently no assigned fund balance for the District. Unassigned Fund Balance - This represents fund balance in the General Fund in excess of nonspendable, restricted, committed and assigned fund balance. If another governmental fund has a fund balance deficit, it is reported as a negative amount in unassigned fund balance. There is $737,338 of unassigned fund balance at June 30, 2014.
J. Special Items Special items represent significant transactions within the control of management that are either unusual in nature or infrequent in occurrence. The release of mortgage debt described in Note 3E has been presented as a special item. K. Accounting Estimates The preparation of financial statements in conformity with accounting principles generally accepted in the United States of America requires management to make estimates and assumptions that affect certain reported amounts and disclosures in the financial statements. Actual results could differ from those estimates. NOTE 2 - STEWARDSHIP, COMPLIANCE AND ACCOUNTABILITY Budgetary Information During the last quarter of the fiscal year, the ensuing year’s proposed operating budget, including proposed expenditures and the means of financing them, is compiled and prepared by the Executive Director. A public hearing is held on the budget. The proposed operating budget is then published in line item format in one or more local newspapers servicing the District and is submitted to the Board of Directors for acceptance and adoption. The Executive Director has the authority to transfer budgeted amounts between published line items (object class: project administration, professional services, FTA/State/GHTD transportation projects and contingency); however, any revisions that alter the total expenditures plus transfers of a fund must have the prior approval of the District Board and are subject to public hearing. A budget is adopted for the General and Special Revenue Funds on a basis consistent with accounting principles generally accepted in the United States of America. Appropriations are classified by object classes. Due to the nature and size of the organization, no breakdown by function or activity is made. The budget for the Special Revenue Fund is adopted on a generic basis for the fund as a whole rather than for the individual projects. Encumbrance accounting is not
GREATER HARTFORD TRANSIT DISTRICT
NOTES TO FINANCIAL STATEMENTS (CONTINUED)
27
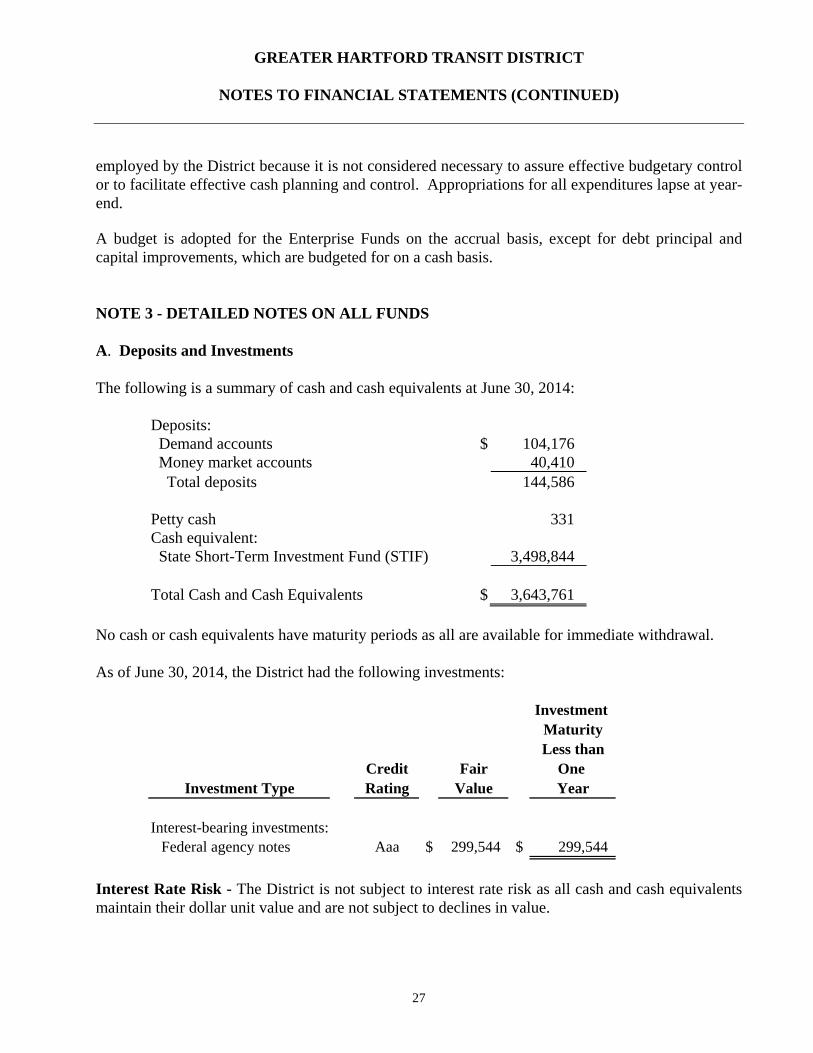
employed by the District because it is not considered necessary to assure effective budgetary control or to facilitate effective cash planning and control. Appropriations for all expenditures lapse at year-end. A budget is adopted for the Enterprise Funds on the accrual basis, except for debt principal and capital improvements, which are budgeted for on a cash basis. NOTE 3 - DETAILED NOTES ON ALL FUNDS A. Deposits and Investments The following is a summary of cash and cash equivalents at June 30, 2014:
Deposits: Demand accounts $ 104,176 Money market accounts 40,410 Total deposits 144,586 Petty cash 331 Cash equivalent: State Short-Term Investment Fund (STIF) 3,498,844 Total Cash and Cash Equivalents $ 3,643,761
No cash or cash equivalents have maturity periods as all are available for immediate withdrawal. As of June 30, 2014, the District had the following investments:
Investment MaturityLess than
Credit Fair One Rating Value Year
Interest-bearing investments: Federal agency notes Aaa $ 299,544 $ 299,544
Investment Type
Interest Rate Risk - The District is not subject to interest rate risk as all cash and cash equivalents maintain their dollar unit value and are not subject to declines in value.
GREATER HARTFORD TRANSIT DISTRICT
NOTES TO FINANCIAL STATEMENTS (CONTINUED)
28
Credit Risk - State statutes authorize the District to invest in obligations of the U.S. Treasury and U.S. agencies, bankers’ acceptances, repurchase agreements, commercial paper rated A-1 by the Standard and Poor’s or P-1 by Moody’s Investor Service, the State Treasurer’s investment pool, and certain other pooled investments, including the MBIA Class Plus Investment. The District does not have a policy relating to the credit risk of investments. As of June 30, 2014, the District’s cash equivalent amounted to $3,498,844 held in STIF, which was rated AAAm by Standard and Poor’s. Concentration of Credit Risk - The District’s investment policy does not limit the investment in any one investment vehicle. Custodial Credit Risk - In the case of deposits, this represents the risk that, in the event of a bank failure, the District’s deposits may not be returned to it. The District does not have a deposit policy for custodial credit risk. As of June 30, 2014, $888,345 of the District’s bank balance was exposed to custodial credit risk as follows: $106,335 was uninsured, with collateral held by the pledging bank’s trust department, not in the District’s name, and $782,010 was uninsured and uncollateralized. Custodial credit risk of an investment is the risk that, in the event of the failure of the counterparty (the institution that pledges collateral or repurchase agreement securities to the District or that sells investments to or buys them for the District), the District will not be able to recover the value of its investments or collateral securities that are in the possession of an outside party. The District does not have a policy for custodial credit risk for investments. At June 30, 2014, the District had no uninsured and unregistered securities held by the counterparty, or by its trust department or agent that were not in the District’s name. B. Receivables Receivables consist of grants receivable from the federal government and State of Connecticut, and amounts due from local agencies for services provided. Based on historical experience, management believes these receivables are fully collectible and, therefore, has not provided for an allowance for uncollectible amounts.
GREATER HARTFORD TRANSIT DISTRICT
NOTES TO FINANCIAL STATEMENTS (CONTINUED)
29
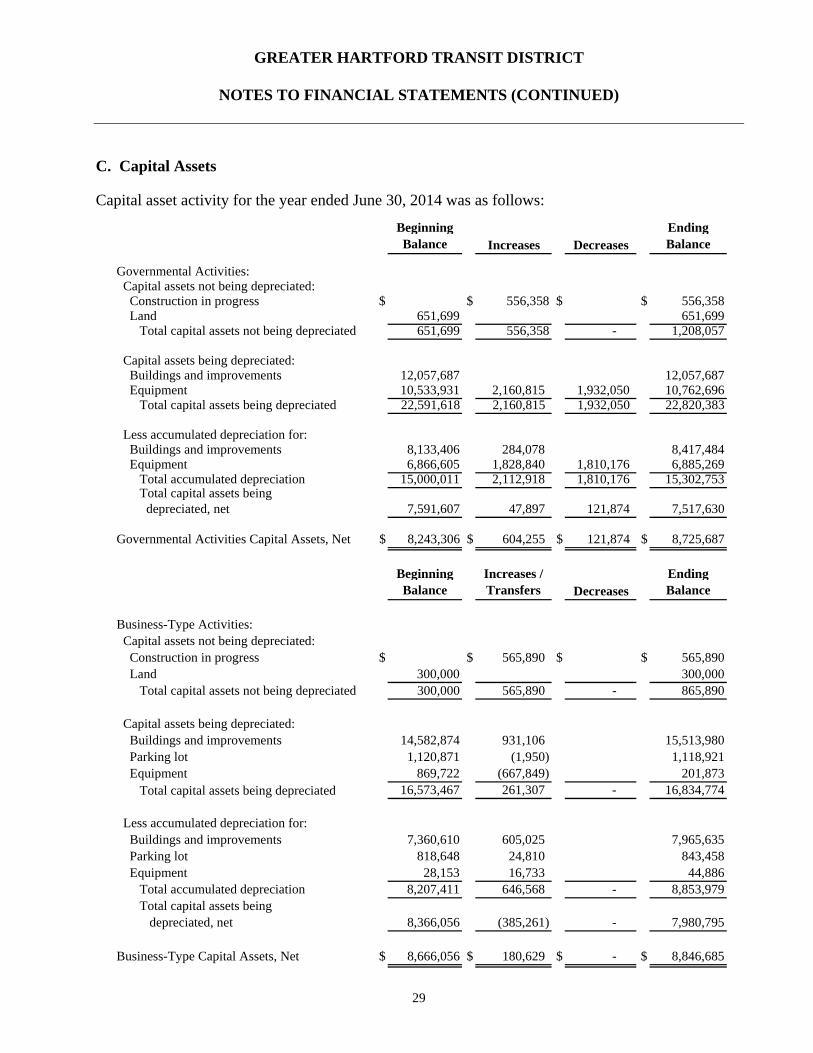
C. Capital Assets Capital asset activity for the year ended June 30, 2014 was as follows:
Beginning Balance Increases Decreases
Ending Balance
Governmental Activities: Capital assets not being depreciated: Construction in progress $ $ 556,358 $ $ 556,358 Land 651,699 651,699 Total capital assets not being depreciated 651,699 556,358 - 1,208,057
Capital assets being depreciated: Buildings and improvements 12,057,687 12,057,687 Equipment 10,533,931 2,160,815 1,932,050 10,762,696 Total capital assets being depreciated 22,591,618 2,160,815 1,932,050 22,820,383
Less accumulated depreciation for: Buildings and improvements 8,133,406 284,078 8,417,484 Equipment 6,866,605 1,828,840 1,810,176 6,885,269 Total accumulated depreciation 15,000,011 2,112,918 1,810,176 15,302,753 Total capital assets being
depreciated, net 7,591,607 47,897 121,874 7,517,630
Governmental Activities Capital Assets, Net $ 8,243,306 $ 604,255 $ 121,874 $ 8,725,687
Beginning Balance
Increases / Transfers Decreases
Ending Balance
Business-Type Activities: Capital assets not being depreciated: Construction in progress $ $ 565,890 $ $ 565,890 Land 300,000 300,000 Total capital assets not being depreciated 300,000 565,890 - 865,890
Capital assets being depreciated: Buildings and improvements 14,582,874 931,106 15,513,980 Parking lot 1,120,871 (1,950) 1,118,921 Equipment 869,722 (667,849) 201,873 Total capital assets being depreciated 16,573,467 261,307 - 16,834,774
Less accumulated depreciation for: Buildings and improvements 7,360,610 605,025 7,965,635 Parking lot 818,648 24,810 843,458 Equipment 28,153 16,733 44,886 Total accumulated depreciation 8,207,411 646,568 - 8,853,979 Total capital assets being
depreciated, net 8,366,056 (385,261) - 7,980,795
Business-Type Capital Assets, Net $ 8,666,056 $ 180,629 $ - $ 8,846,685
GREATER HARTFORD TRANSIT DISTRICT
NOTES TO FINANCIAL STATEMENTS (CONTINUED)
30
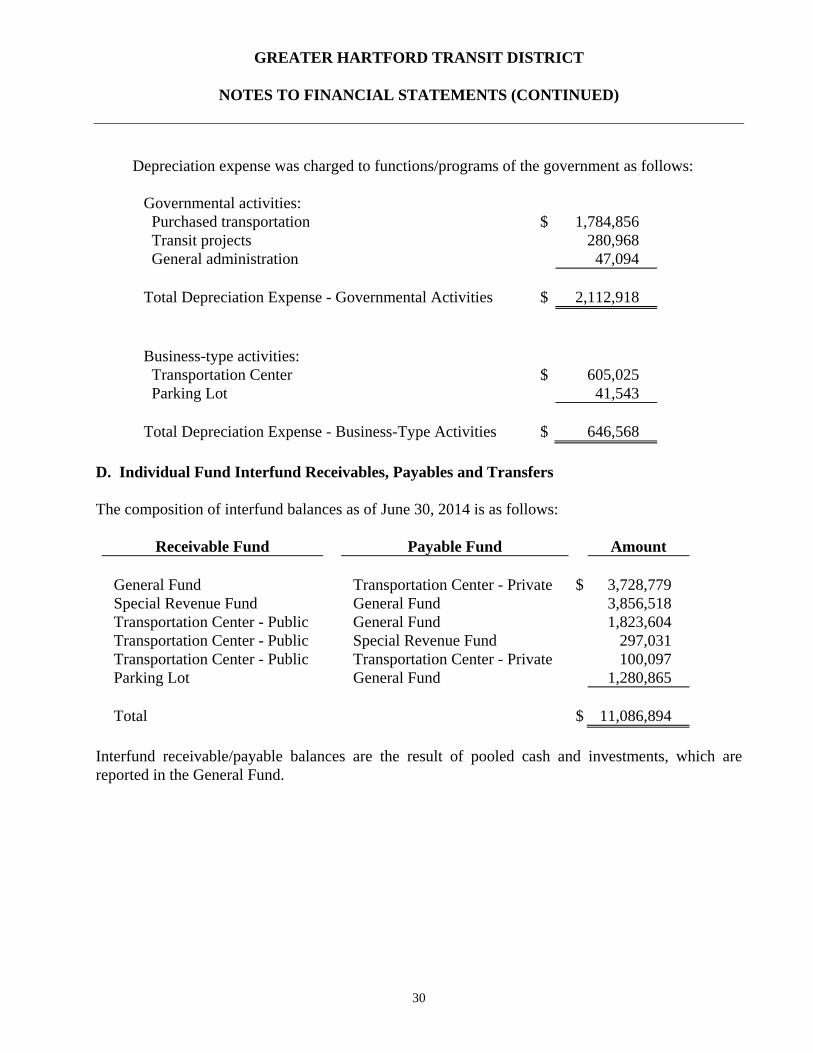
Depreciation expense was charged to functions/programs of the government as follows:
Governmental activities: Purchased transportation $ 1,784,856 Transit projects 280,968 General administration 47,094 Total Depreciation Expense - Governmental Activities $ 2,112,918 Business-type activities: Transportation Center $ 605,025 Parking Lot 41,543 Total Depreciation Expense - Business-Type Activities $ 646,568
D. Individual Fund Interfund Receivables, Payables and Transfers The composition of interfund balances as of June 30, 2014 is as follows:
Receivable Fund Payable Fund Amount General Fund Transportation Center - Private $ 3,728,779 Special Revenue Fund General Fund 3,856,518 Transportation Center - Public General Fund 1,823,604 Transportation Center - Public Special Revenue Fund 297,031 Transportation Center - Public Transportation Center - Private 100,097 Parking Lot General Fund 1,280,865
Total $ 11,086,894
Interfund receivable/payable balances are the result of pooled cash and investments, which are reported in the General Fund.
GREATER HARTFORD TRANSIT DISTRICT
NOTES TO FINANCIAL STATEMENTS (CONTINUED)
31
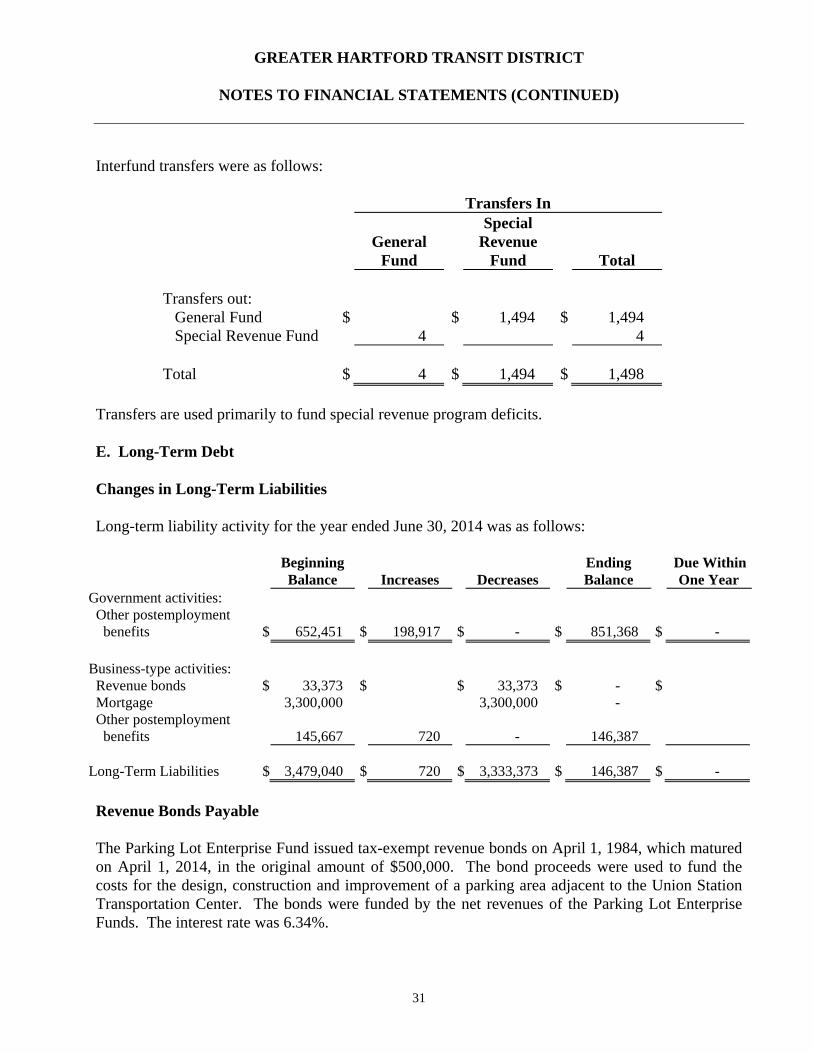
Interfund transfers were as follows:
Transfers In
General
Fund
Special Revenue
Fund Total Transfers out: General Fund $ $ 1,494 $ 1,494 Special Revenue Fund 4 4 Total $ 4 $ 1,494 $ 1,498
Transfers are used primarily to fund special revenue program deficits. E. Long-Term Debt Changes in Long-Term Liabilities Long-term liability activity for the year ended June 30, 2014 was as follows:
Beginning Ending Due Within Balance Increases Decreases Balance One Year
Government activities: Other postemployment benefits $ 652,451 $ 198,917 $ - $ 851,368 $ - Business-type activities: Revenue bonds $ 33,373 $ $ 33,373 $ - $ Mortgage 3,300,000 3,300,000 - Other postemployment benefits 145,667 720 - 146,387 Long-Term Liabilities $ 3,479,040 $ 720 $ 3,333,373 $ 146,387 $ -
Revenue Bonds Payable The Parking Lot Enterprise Fund issued tax-exempt revenue bonds on April 1, 1984, which matured on April 1, 2014, in the original amount of $500,000. The bond proceeds were used to fund the costs for the design, construction and improvement of a parking area adjacent to the Union Station Transportation Center. The bonds were funded by the net revenues of the Parking Lot Enterprise Funds. The interest rate was 6.34%.
GREATER HARTFORD TRANSIT DISTRICT
NOTES TO FINANCIAL STATEMENTS (CONTINUED)
32
Mortgage Payable On February 26, 1994, the District entered into an Assignment Agreement, effective July 1, 1993, with Union Station Associates Limited Partnership (USA) and the Aetna Casualty and Surety Company (Aetna). Under the terms of the agreement, USA assigned the District all of its rights, title and interest in a certain leasehold estate included in the Union Place property subject to a mortgage and assignment of rents. Under a Mortgage Modification Agreement also effective July 1, 1993, repayment was to be made in accordance with a formula based on “reconfigured net cash flow.” Reconfigured net cash flow was defined in the agreement as being an amount equal to certain gross cash receipts less certain gross cash expenditures with respect to the property. No payments of interest or repayments of principal were to be made until such cash flows are positive and a reserve account of $400,000 was established. As net cash flow from the property has been negative since assignment of the mortgage, no interest or principal payments have been made through June 30, 2014. In June 2014, the District was released from mortgage indebtedness by the lender. F. Lease Commitments
On December 21, 1981, the District entered into a lease agreement with the State of Connecticut for approximately 1.4 acres of land adjacent to the Union Station Transportation Center for use as a parking lot. The term of the lease commenced on January 1, 1982 and runs for 40 years. A single payment of $300 was made at the execution of the lease, and no additional payments are due as long as the land remains under the control of the District. NOTE 4 - OTHER INFORMATION A. Risk Management The District is exposed to various risks of loss related to torts; theft of, damage to and destruction of assets; error and omissions; injuries to employees and the public; and natural disasters. These risks are covered by commercial insurance purchased from independent third parties. Settled claims from these risks did not exceed commercial insurance coverage during the years ended June 30, 2014, 2013 and 2012. In addition, as the owner of public transportation vehicles operated in both the public and private sectors, as well as the operator of an intermodal transportation center, the District is exposed to various risks of loss related to these activities. The District requires all public and private agencies operating the vehicles to purchase appropriate commercial insurance coverage through third-party carriers and to include the District as a loss payee. B. Leases The District’s largest tenant is Amtrak, whose annual lease payment is based on actual space costs incurred with respect to the leased property.
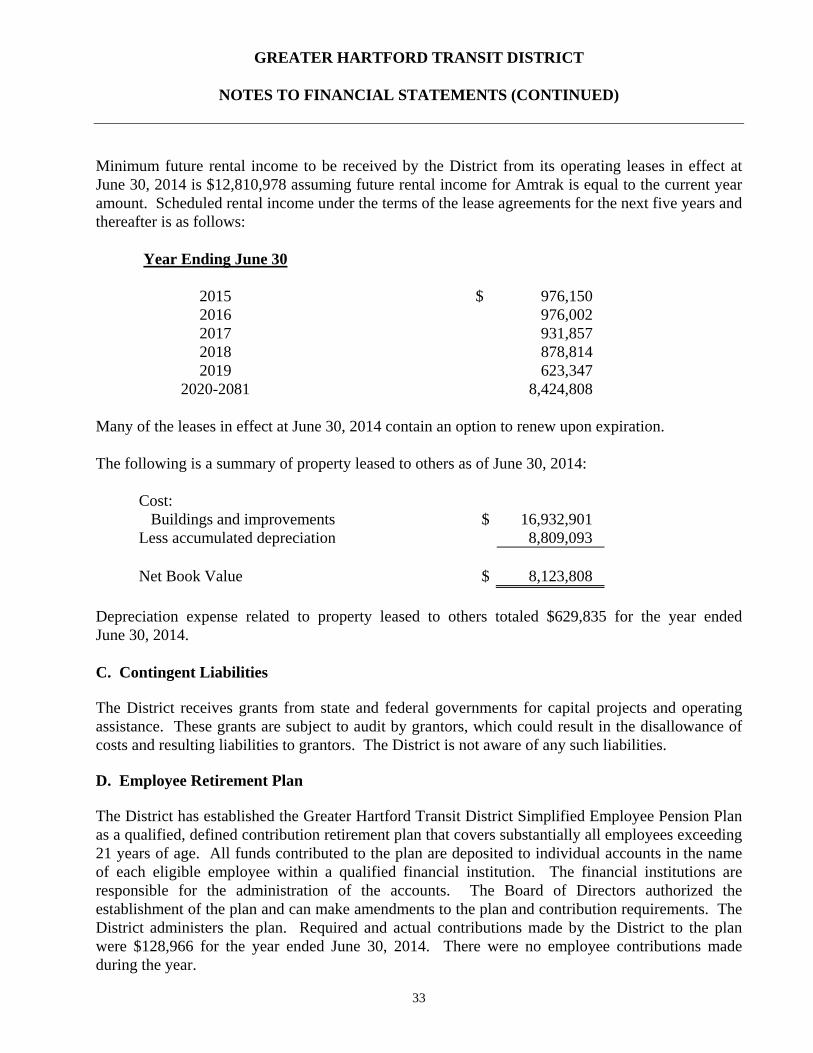
GREATER HARTFORD TRANSIT DISTRICT
NOTES TO FINANCIAL STATEMENTS (CONTINUED)
33
Minimum future rental income to be received by the District from its operating leases in effect at June 30, 2014 is $12,810,978 assuming future rental income for Amtrak is equal to the current year amount. Scheduled rental income under the terms of the lease agreements for the next five years and thereafter is as follows:
Year Ending June 30
2015 $ 976,150 2016 976,002 2017 931,857 2018 2019
878,814 623,347
2020-2081 8,424,808 Many of the leases in effect at June 30, 2014 contain an option to renew upon expiration. The following is a summary of property leased to others as of June 30, 2014:
Cost: Buildings and improvements $ 16,932,901 Less accumulated depreciation 8,809,093 Net Book Value $ 8,123,808
Depreciation expense related to property leased to others totaled $629,835 for the year ended June 30, 2014. C. Contingent Liabilities The District receives grants from state and federal governments for capital projects and operating assistance. These grants are subject to audit by grantors, which could result in the disallowance of costs and resulting liabilities to grantors. The District is not aware of any such liabilities. D. Employee Retirement Plan The District has established the Greater Hartford Transit District Simplified Employee Pension Plan as a qualified, defined contribution retirement plan that covers substantially all employees exceeding 21 years of age. All funds contributed to the plan are deposited to individual accounts in the name of each eligible employee within a qualified financial institution. The financial institutions are responsible for the administration of the accounts. The Board of Directors authorized the establishment of the plan and can make amendments to the plan and contribution requirements. The District administers the plan. Required and actual contributions made by the District to the plan were $128,966 for the year ended June 30, 2014. There were no employee contributions made during the year.
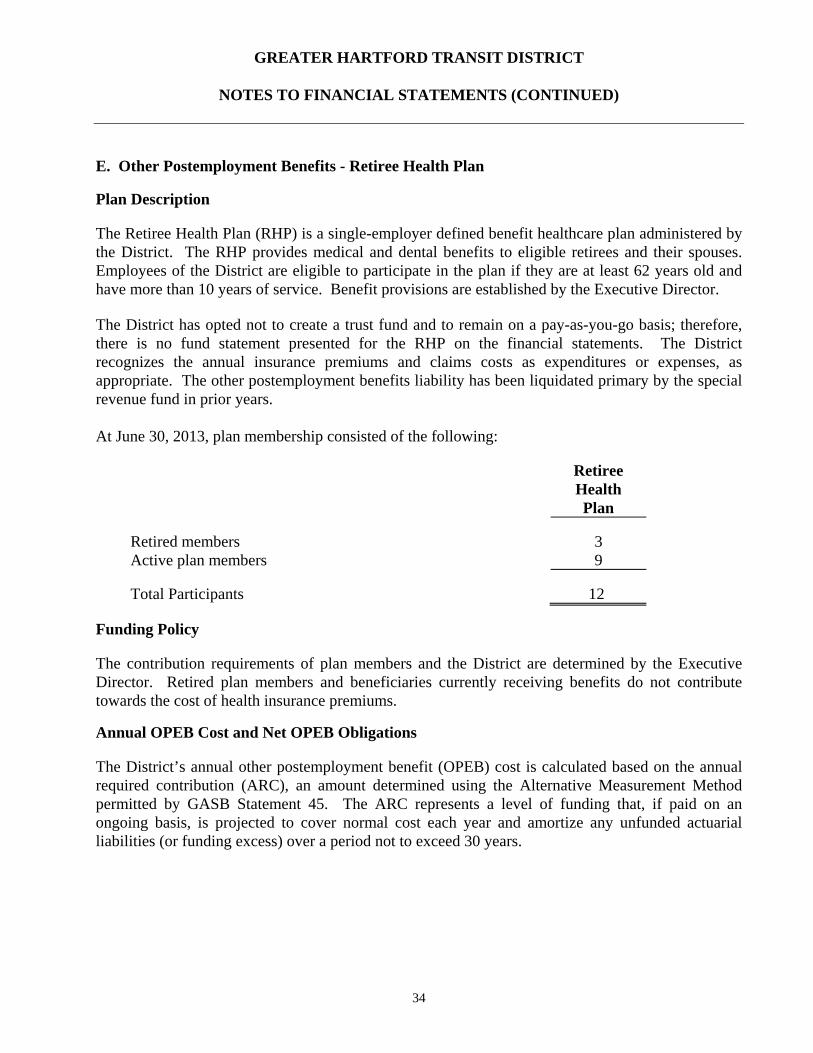
GREATER HARTFORD TRANSIT DISTRICT
NOTES TO FINANCIAL STATEMENTS (CONTINUED)
34
E. Other Postemployment Benefits - Retiree Health Plan Plan Description The Retiree Health Plan (RHP) is a single-employer defined benefit healthcare plan administered by the District. The RHP provides medical and dental benefits to eligible retirees and their spouses. Employees of the District are eligible to participate in the plan if they are at least 62 years old and have more than 10 years of service. Benefit provisions are established by the Executive Director. The District has opted not to create a trust fund and to remain on a pay-as-you-go basis; therefore, there is no fund statement presented for the RHP on the financial statements. The District recognizes the annual insurance premiums and claims costs as expenditures or expenses, as appropriate. The other postemployment benefits liability has been liquidated primary by the special revenue fund in prior years. At June 30, 2013, plan membership consisted of the following:
Retiree Health Plan
Retired members 3 Active plan members 9
Total Participants 12 Funding Policy The contribution requirements of plan members and the District are determined by the Executive Director. Retired plan members and beneficiaries currently receiving benefits do not contribute towards the cost of health insurance premiums. Annual OPEB Cost and Net OPEB Obligations
The District’s annual other postemployment benefit (OPEB) cost is calculated based on the annual required contribution (ARC), an amount determined using the Alternative Measurement Method permitted by GASB Statement 45. The ARC represents a level of funding that, if paid on an ongoing basis, is projected to cover normal cost each year and amortize any unfunded actuarial liabilities (or funding excess) over a period not to exceed 30 years.
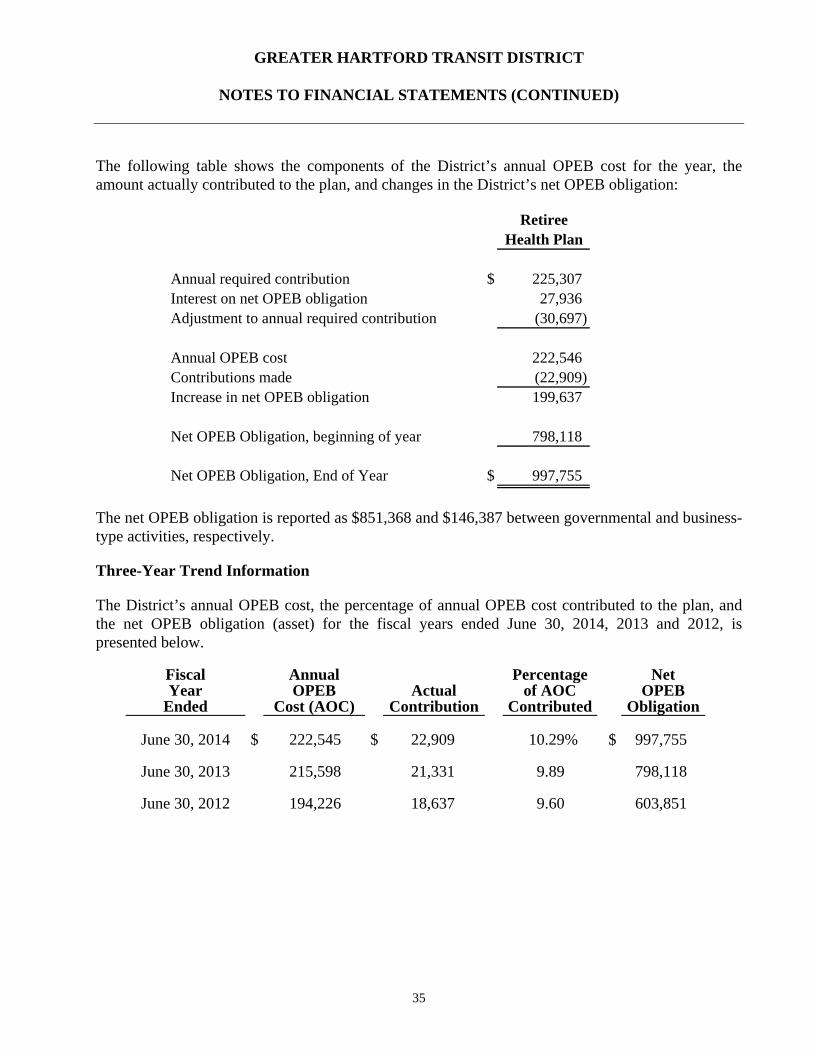
GREATER HARTFORD TRANSIT DISTRICT
NOTES TO FINANCIAL STATEMENTS (CONTINUED)
35
The following table shows the components of the District’s annual OPEB cost for the year, the amount actually contributed to the plan, and changes in the District’s net OPEB obligation:
RetireeHealth Plan
Annual required contribution $ 225,307Interest on net OPEB obligation 27,936 Adjustment to annual required contribution (30,697)
Annual OPEB cost 222,546Contributions made (22,909)Increase in net OPEB obligation 199,637
Net OPEB Obligation, beginning of year 798,118
Net OPEB Obligation, End of Year $ 997,755
The net OPEB obligation is reported as $851,368 and $146,387 between governmental and business-type activities, respectively. Three-Year Trend Information The District’s annual OPEB cost, the percentage of annual OPEB cost contributed to the plan, and the net OPEB obligation (asset) for the fiscal years ended June 30, 2014, 2013 and 2012, is presented below.
Fiscal Annual Percentage NetYear OPEB Actual of AOC OPEB
Ended Cost (AOC) Contribution Contributed Obligation
June 30, 2014 $ 222,545 $ 22,909 10.29% $ 997,755
June 30, 2013 215,598 21,331 9.89 798,118
June 30, 2012 194,226 18,637 9.60 603,851
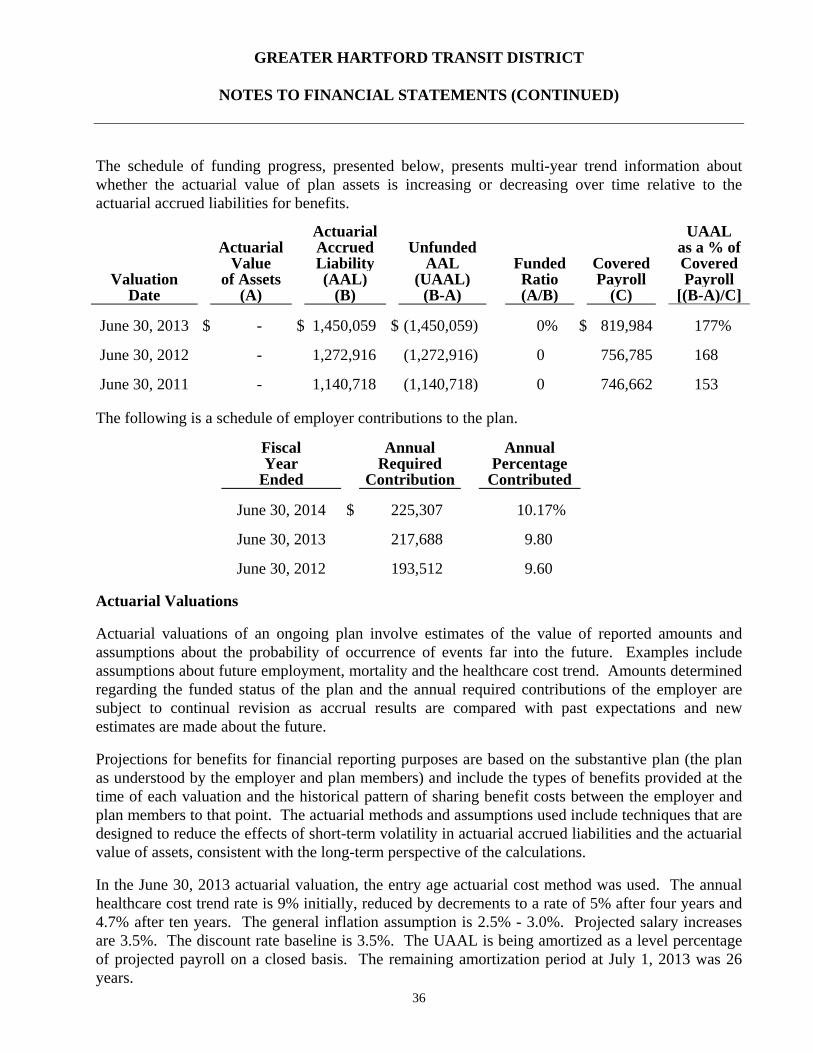
GREATER HARTFORD TRANSIT DISTRICT
NOTES TO FINANCIAL STATEMENTS (CONTINUED)
36
The schedule of funding progress, presented below, presents multi-year trend information about whether the actuarial value of plan assets is increasing or decreasing over time relative to the actuarial accrued liabilities for benefits. Actuarial UAAL
Actuarial Accrued Unfunded as a % of Value Liability AAL Funded Covered Covered
Valuation of Assets (AAL) (UAAL) Ratio Payroll PayrollDate (A) (B) (B-A) (A/B) (C) [(B-A)/C]
June 30, 2013 $ - $ 1,450,059 $ (1,450,059) 0% $ 819,984 177%
June 30, 2012 - 1,272,916 (1,272,916) 0 756,785 168
June 30, 2011 - 1,140,718 (1,140,718) 0 746,662 153
The following is a schedule of employer contributions to the plan.
Fiscal Annual AnnualYear Required Percentage
Ended Contribution Contributed
June 30, 2014 $ 225,307 10.17%
June 30, 2013 217,688 9.80
June 30, 2012 193,512 9.60
Actuarial Valuations
Actuarial valuations of an ongoing plan involve estimates of the value of reported amounts and assumptions about the probability of occurrence of events far into the future. Examples include assumptions about future employment, mortality and the healthcare cost trend. Amounts determined regarding the funded status of the plan and the annual required contributions of the employer are subject to continual revision as accrual results are compared with past expectations and new estimates are made about the future.
Projections for benefits for financial reporting purposes are based on the substantive plan (the plan as understood by the employer and plan members) and include the types of benefits provided at the time of each valuation and the historical pattern of sharing benefit costs between the employer and plan members to that point. The actuarial methods and assumptions used include techniques that are designed to reduce the effects of short-term volatility in actuarial accrued liabilities and the actuarial value of assets, consistent with the long-term perspective of the calculations.
In the June 30, 2013 actuarial valuation, the entry age actuarial cost method was used. The annual healthcare cost trend rate is 9% initially, reduced by decrements to a rate of 5% after four years and 4.7% after ten years. The general inflation assumption is 2.5% - 3.0%. Projected salary increases are 3.5%. The discount rate baseline is 3.5%. The UAAL is being amortized as a level percentage of projected payroll on a closed basis. The remaining amortization period at July 1, 2013 was 26 years.
SUPPLEMENTAL COMBINING SCHEDULE
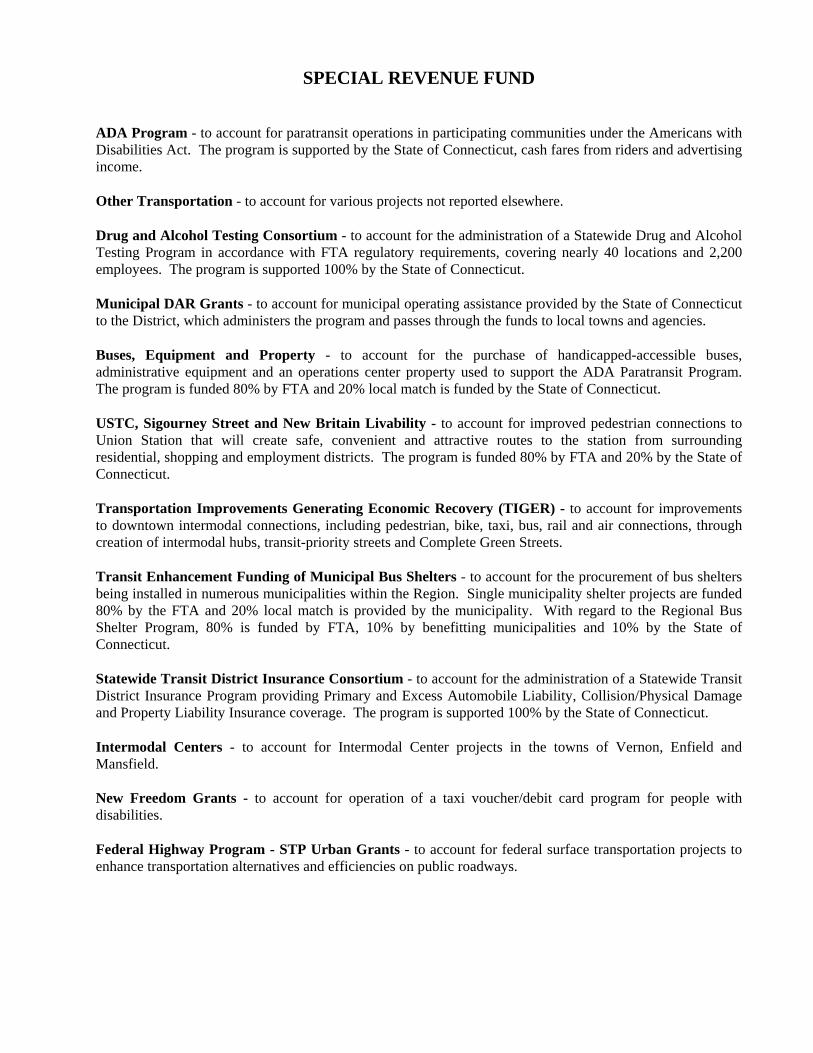
SPECIAL REVENUE FUND ADA Program - to account for paratransit operations in participating communities under the Americans with Disabilities Act. The program is supported by the State of Connecticut, cash fares from riders and advertising income. Other Transportation - to account for various projects not reported elsewhere. Drug and Alcohol Testing Consortium - to account for the administration of a Statewide Drug and Alcohol Testing Program in accordance with FTA regulatory requirements, covering nearly 40 locations and 2,200 employees. The program is supported 100% by the State of Connecticut. Municipal DAR Grants - to account for municipal operating assistance provided by the State of Connecticut to the District, which administers the program and passes through the funds to local towns and agencies. Buses, Equipment and Property - to account for the purchase of handicapped-accessible buses, administrative equipment and an operations center property used to support the ADA Paratransit Program. The program is funded 80% by FTA and 20% local match is funded by the State of Connecticut. USTC, Sigourney Street and New Britain Livability - to account for improved pedestrian connections to Union Station that will create safe, convenient and attractive routes to the station from surrounding residential, shopping and employment districts. The program is funded 80% by FTA and 20% by the State of Connecticut. Transportation Improvements Generating Economic Recovery (TIGER) - to account for improvements to downtown intermodal connections, including pedestrian, bike, taxi, bus, rail and air connections, through creation of intermodal hubs, transit-priority streets and Complete Green Streets. Transit Enhancement Funding of Municipal Bus Shelters - to account for the procurement of bus shelters being installed in numerous municipalities within the Region. Single municipality shelter projects are funded 80% by the FTA and 20% local match is provided by the municipality. With regard to the Regional Bus Shelter Program, 80% is funded by FTA, 10% by benefitting municipalities and 10% by the State of Connecticut. Statewide Transit District Insurance Consortium - to account for the administration of a Statewide Transit District Insurance Program providing Primary and Excess Automobile Liability, Collision/Physical Damage and Property Liability Insurance coverage. The program is supported 100% by the State of Connecticut. Intermodal Centers - to account for Intermodal Center projects in the towns of Vernon, Enfield and Mansfield. New Freedom Grants - to account for operation of a taxi voucher/debit card program for people with disabilities. Federal Highway Program - STP Urban Grants - to account for federal surface transportation projects to enhance transportation alternatives and efficiencies on public roadways.
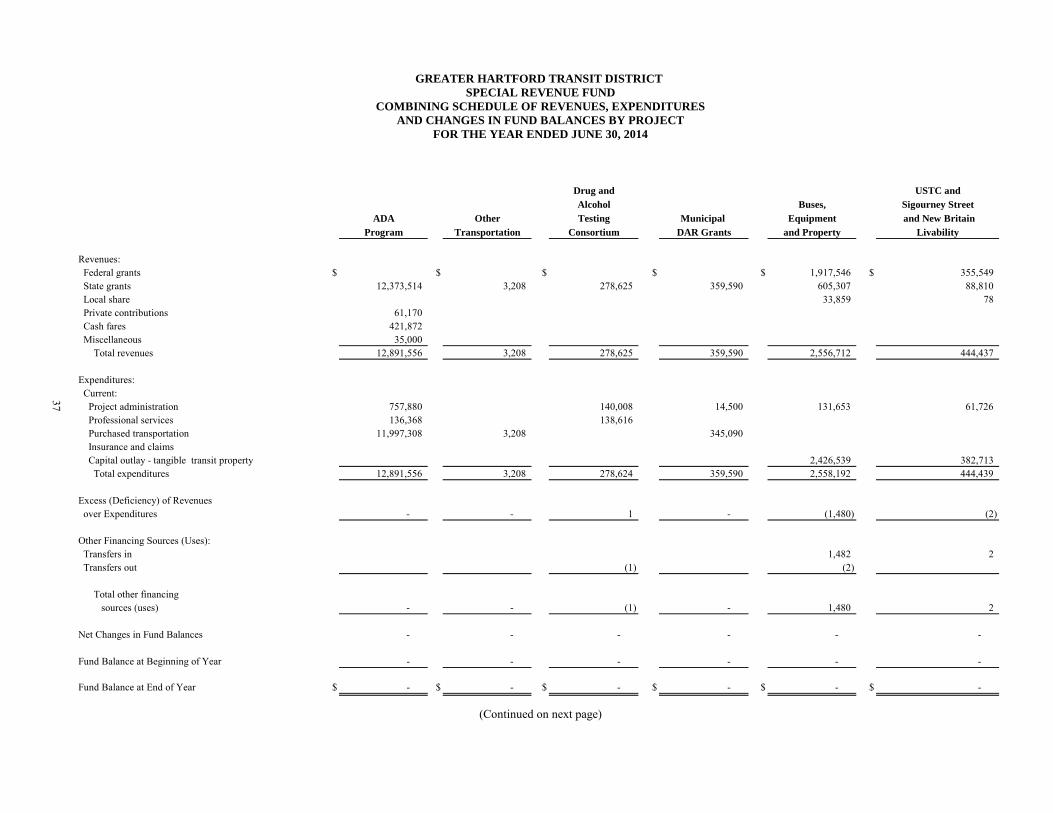
GREATER HARTFORD TRANSIT DISTRICT SPECIAL REVENUE FUND
COMBINING SCHEDULE OF REVENUES, EXPENDITURESAND CHANGES IN FUND BALANCES BY PROJECT
FOR THE YEAR ENDED JUNE 30, 2014
Drug and USTC andAlcohol Buses, Sigourney Street
ADA Other Testing Municipal Equipment and New BritainProgram Transportation Consortium DAR Grants and Property Livability
Revenues: Federal grants $ $ $ $ $ 1,917,546 $ 355,549 State grants 12,373,514 3,208 278,625 359,590 605,307 88,810 Local share 33,859 78 Private contributions 61,170 Cash fares 421,872 Miscellaneous 35,000 Total revenues 12,891,556 3,208 278,625 359,590 2,556,712 444,437
Expenditures: Current: Project administration 757,880 140,008 14,500 131,653 61,726 Professional services 136,368 138,616 Purchased transportation 11,997,308 3,208 345,090 Insurance and claims Capital outlay - tangible transit property 2,426,539 382,713 Total expenditures 12,891,556 3,208 278,624 359,590 2,558,192 444,439
Excess (Deficiency) of Revenues over Expenditures - - 1 - (1,480) (2)
Other Financing Sources (Uses): Transfers in 1,482 2 Transfers out (1) (2)
Total other financing sources (uses) - - (1) - 1,480 2
Net Changes in Fund Balances - - - - - -
Fund Balance at Beginning of Year - - - - - -
Fund Balance at End of Year $ - $ - $ - $ - $ - $ -
(Continued on next page)
37
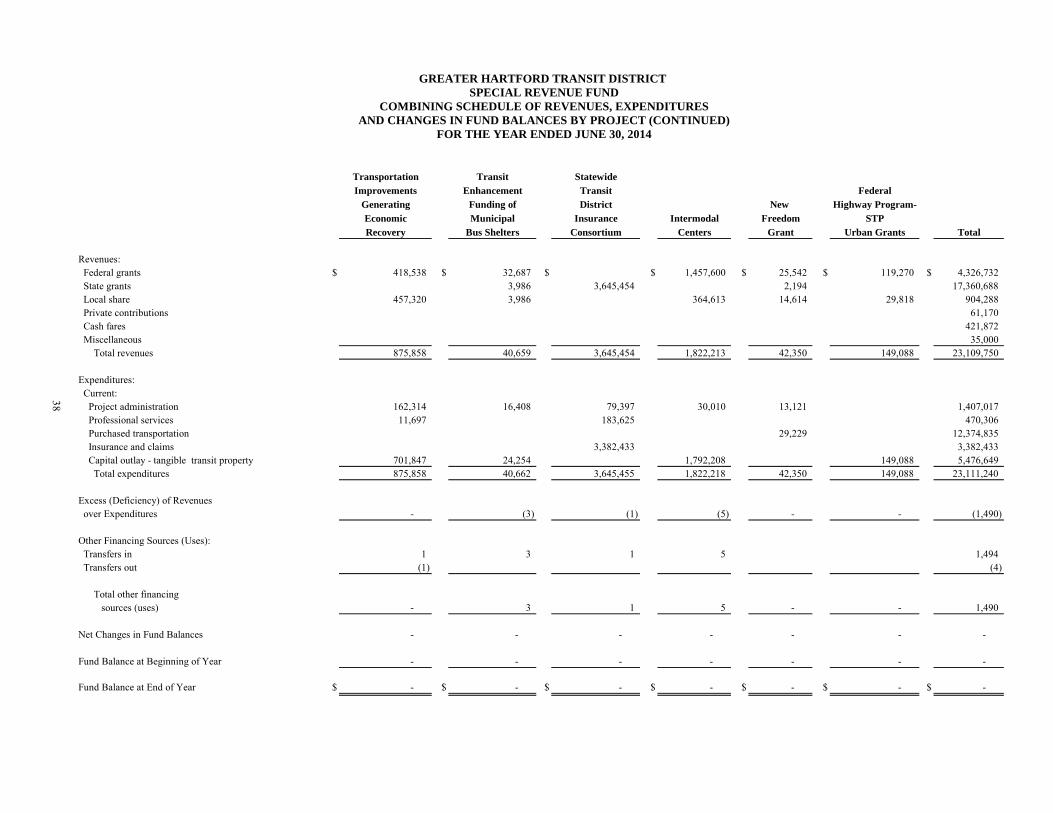
Revenues: Federal grants State grants Local share Private contributions Cash fares Miscellaneous Total revenues
Expenditures: Current: Project administration Professional services Purchased transportation Insurance and claims Capital outlay - tangible transit property Total expenditures
Excess (Deficiency) of Revenues over Expenditures
Other Financing Sources (Uses): Transfers in Transfers out
Total other financing sources (uses)
Net Changes in Fund Balances
Fund Balance at Beginning of Year
Fund Balance at End of Year
38
GREATER HARTFORD TRANSIT DISTRICT SPECIAL REVENUE FUND
COMBINING SCHEDULE OF REVENUES, EXPENDITURESAND CHANGES IN FUND BALANCES BY PROJECT (CONTINUED)
FOR THE YEAR ENDED JUNE 30, 2014
Transportation Transit StatewideImprovements Enhancement Transit Federal
Generating Funding of District New Highway Program-Economic Municipal Insurance Intermodal Freedom STPRecovery Bus Shelters Consortium Centers Grant Urban Grants Total
$ 418,538 $ 32,687 $ $ 1,457,600 $ 25,542 $ 119,270 $ 4,326,7323,986 3,645,454 2,194 17,360,688
457,320 3,986 364,613 14,614 29,818 904,28861,170
421,87235,000
875,858 40,659 3,645,454 1,822,213 42,350 149,088 23,109,750
162,314 16,408 79,397 30,010 13,121 1,407,01711,697 183,625 470,306
29,229 12,374,8353,382,433 3,382,433
701,847 24,254 1,792,208 149,088 5,476,649875,858 40,662 3,645,455 1,822,218 42,350 149,088 23,111,240
- (3) (1) (5) - - (1,490)
1 3 1 5 1,494 (1) (4)
- 3 1 5 - - 1,490
- - - - - - -
- - - - - - -
$ - $ - $ - $ - $ - $ - $ -
STATISTICAL SECTION
This part of the Greater Hartford Transit District’s comprehensive annual report presents detailed information as a context for understanding what the information in the financial statements, note disclosures and required supplementary information says about the District’s overall financial health.
Contents Page Financial Trends 39-45
These schedules contain trend information to help the reader understand how the District’s financial performance and well-being have changed over time.
Revenue Capacity 46-47
These schedules contain information to help the reader assess the District’s most significant revenue source, federal and state grants.
Debt Capacity 48-49
These schedules present information to help the reader assess the afford- ability of the District’s current levels of outstanding debt and the District’s ability to issue additional debt in the future.
Demographic and Economic Information 50-51
These schedules offer demographic and economic indicators to help the reader understand the environment within which the District’s financial activities take place.
Operating Information 52-54
These schedules contain service and infrastructure data to help the reader understand how the information in the District’s financial report relates to the services the District provides and the activities it performs.
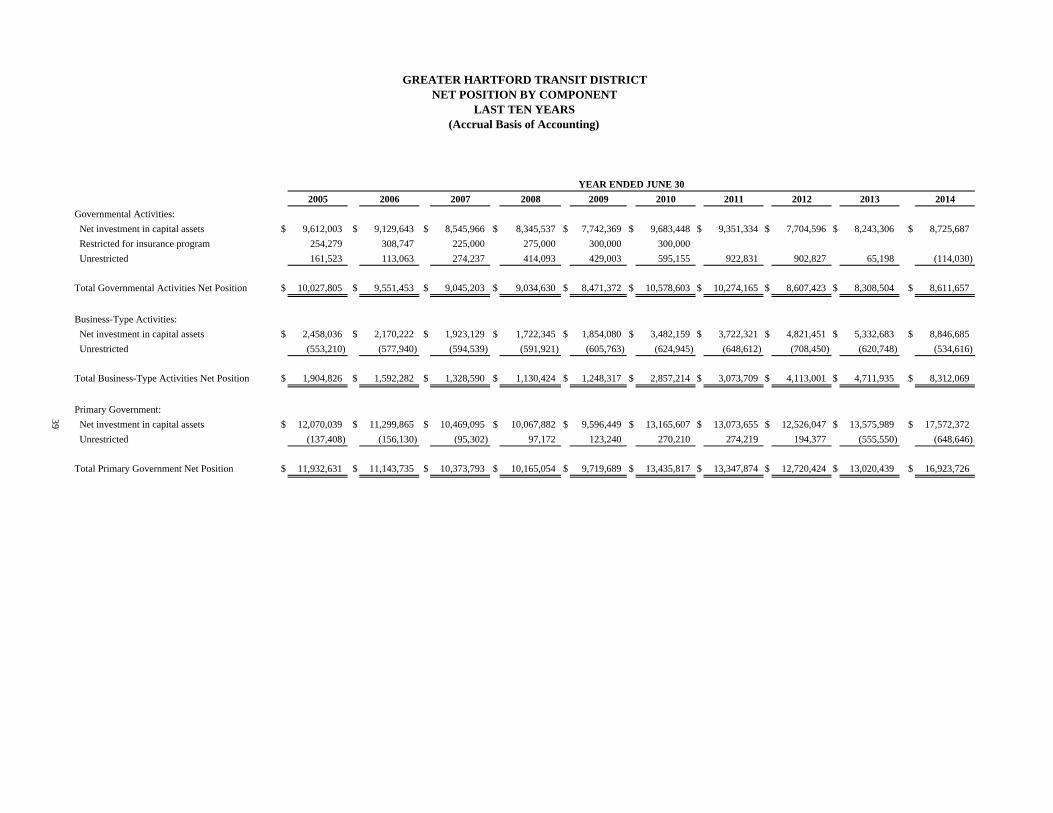
YEAR ENDED JUNE 30
2005 2006 2007 2008 2009 2010 2011 2012 2013 2014
Governmental Activities:
Net investment in capital assets $ 9,612,003 $ 9,129,643 $ 8,545,966 $ 8,345,537 $ 7,742,369 $ 9,683,448 $ 9,351,334 $ 7,704,596 $ 8,243,306 $ 8,725,687
Restricted for insurance program 254,279 308,747 225,000 275,000 300,000 300,000
Unrestricted 161,523 113,063 274,237 414,093 429,003 595,155 922,831 902,827 65,198 (114,030)
Total Governmental Activities Net Position $ 10,027,805 $ 9,551,453 $ 9,045,203 $ 9,034,630 $ 8,471,372 $ 10,578,603 $ 10,274,165 $ 8,607,423 $ 8,308,504 $ 8,611,657
Business-Type Activities:
Net investment in capital assets $ 2,458,036 $ 2,170,222 $ 1,923,129 $ 1,722,345 $ 1,854,080 $ 3,482,159 $ 3,722,321 $ 4,821,451 $ 5,332,683 $ 8,846,685
Unrestricted (553,210) (577,940) (594,539) (591,921) (605,763) (624,945) (648,612) (708,450) (620,748) (534,616)
Total Business-Type Activities Net Position $ 1,904,826 $ 1,592,282 $ 1,328,590 $ 1,130,424 $ 1,248,317 $ 2,857,214 $ 3,073,709 $ 4,113,001 $ 4,711,935 $ 8,312,069
Primary Government:
39 Net investment in capital assets $ 12,070,039 $ 11,299,865 $ 10,469,095 $ 10,067,882 $ 9,596,449 $ 13,165,607 $ 13,073,655 $ 12,526,047 $ 13,575,989 $ 17,572,372
Unrestricted (137,408) (156,130) (95,302) 97,172 123,240 270,210 274,219 194,377 (555,550) (648,646)
Total Primary Government Net Position $ 11,932,631 $ 11,143,735 $ 10,373,793 $ 10,165,054 $ 9,719,689 $ 13,435,817 $ 13,347,874 $ 12,720,424 $ 13,020,439 $ 16,923,726
GREATER HARTFORD TRANSIT DISTRICTNET POSITION BY COMPONENT
LAST TEN YEARS(Accrual Basis of Accounting)
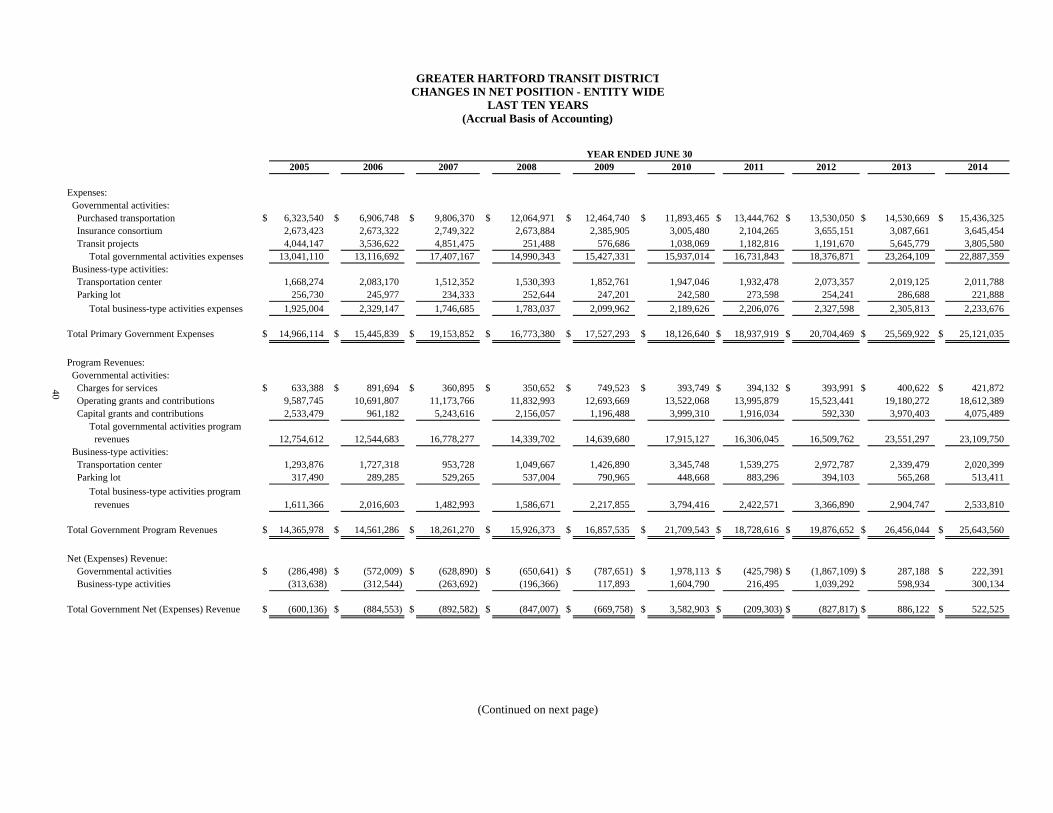
2005 2006 2007 2008 2009 2010 2011 2012 2013 2014
Expenses: Governmental activities: Purchased transportation $ 6,323,540 $ 6,906,748 $ 9,806,370 $ 12,064,971 $ 12,464,740 $ 11,893,465 $ 13,444,762 $ 13,530,050 $ 14,530,669 $ 15,436,325 Insurance consortium 2,673,423 2,673,322 2,749,322 2,673,884 2,385,905 3,005,480 2,104,265 3,655,151 3,087,661 3,645,454 Transit projects 4,044,147 3,536,622 4,851,475 251,488 576,686 1,038,069 1,182,816 1,191,670 5,645,779 3,805,580 Total governmental activities expenses 13,041,110 13,116,692 17,407,167 14,990,343 15,427,331 15,937,014 16,731,843 18,376,871 23,264,109 22,887,359 Business-type activities: Transportation center 1,668,274 2,083,170 1,512,352 1,530,393 1,852,761 1,947,046 1,932,478 2,073,357 2,019,125 2,011,788 Parking lot 256,730 245,977 234,333 252,644 247,201 242,580 273,598 254,241 286,688 221,888
Total business-type activities expenses 1,925,004 2,329,147 1,746,685 1,783,037 2,099,962 2,189,626 2,206,076 2,327,598 2,305,813 2,233,676 Total Primary Government Expenses $ 14,966,114 $ 15,445,839 $ 19,153,852 $ 16,773,380 $ 17,527,293 $ 18,126,640 $ 18,937,919 $ 20,704,469 $ 25,569,922 $ 25,121,035
Program Revenues: Governmental activities: Charges for services $ 633,388 $ 891,694 $ 360,895 $ 350,652 $ 749,523 $ 393,749 $ 394,132 $ 393,991 $ 400,622 $ 421,872 Operating grants and contributions 9,587,745 10,691,807 11,173,766 11,832,993 12,693,669 13,522,068 13,995,879 15,523,441 19,180,272 18,612,389 Capital grants and contributions 2,533,479 961,182 5,243,616 2,156,057 1,196,488 3,999,310 1,916,034 592,330 3,970,403 4,075,489 Total governmental activities program
revenues 12,754,612 12,544,683 16,778,277 14,339,702 14,639,680 17,915,127 16,306,045 16,509,762 23,551,297 23,109,750 Business-type activities: Transportation center 1,293,876 1,727,318 953,728 1,049,667 1,426,890 3,345,748 1,539,275 2,972,787 2,339,479 2,020,399 Parking lot 317,490 289,285 529,265 537,004 790,965 448,668 883,296 394,103 565,268 513,411
Total business-type activities program revenues 1,611,366 2,016,603 1,482,993 1,586,671 2,217,855 3,794,416 2,422,571 3,366,890 2,904,747 2,533,810
Total Government Program Revenues $ 14,365,978 $ 14,561,286 $ 18,261,270 $ 15,926,373 $ 16,857,535 $ 21,709,543 $ 18,728,616 $ 19,876,652 $ 26,456,044 $ 25,643,560
Net (Expenses) Revenue: Governmental activities $ (286,498) $ (572,009) $ (628,890) $ (650,641) $ (787,651) $ 1,978,113 $ (425,798) $ (1,867,109) $ 287,188 $ 222,391 Business-type activities (313,638) (312,544) (263,692) (196,366) 117,893 1,604,790 216,495 1,039,292 598,934 300,134
Total Government Net (Expenses) Revenue $ (600,136) $ (884,553) $ (892,582) $ (847,007) $ (669,758) $ 3,582,903 $ (209,303) $ (827,817) $ 886,122 $ 522,525
(Continued on next page)
GREATER HARTFORD TRANSIT DISTRICTCHANGES IN NET POSITION - ENTITY WIDE
LAST TEN YEARS(Accrual Basis of Accounting)
40
YEAR ENDED JUNE 30
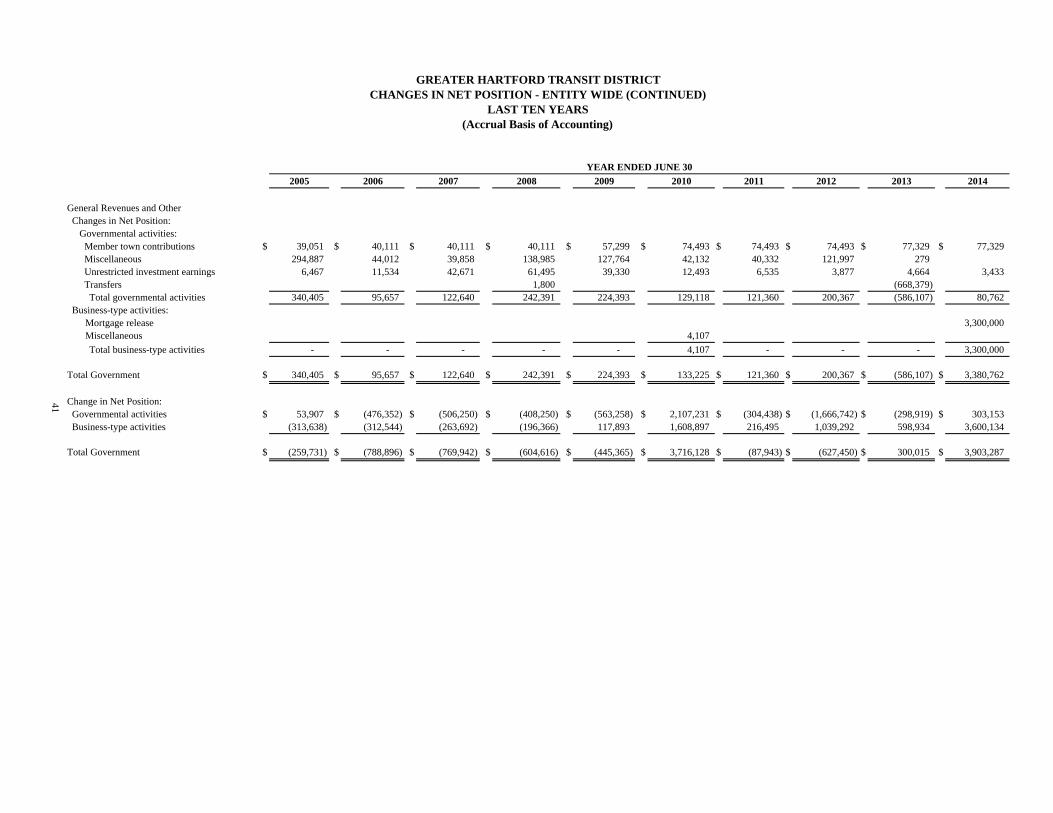
GREATER HARTFORD TRANSIT DISTRICTCHANGES IN NET POSITION - ENTITY WIDE (CONTINUED)
LAST TEN YEARS(Accrual Basis of Accounting)
2005 2006 2007 2008 2009 2010 2011 2012 2013 2014
General Revenues and Other Changes in Net Position: Governmental activities: Member town contributions $ 39,051 $ 40,111 $ 40,111 $ 40,111 $ 57,299 $ 74,493 $ 74,493 $ 74,493 $ 77,329 $ 77,329 Miscellaneous 294,887 44,012 39,858 138,985 127,764 42,132 40,332 121,997 279 Unrestricted investment earnings 6,467 11,534 42,671 61,495 39,330 12,493 6,535 3,877 4,664 3,433 Transfers 1,800 (668,379) Total governmental activities 340,405 95,657 122,640 242,391 224,393 129,118 121,360 200,367 (586,107) 80,762 Business-type activities:
Mortgage release 3,300,000 Miscellaneous 4,107
Total business-type activities - - - - - 4,107 - - - 3,300,000
Total Government $ 340,405 $ 95,657 $ 122,640 $ 242,391 $ 224,393 $ 133,225 $ 121,360 $ 200,367 $ (586,107) $ 3,380,762
Change in Net Position: Governmental activities $ 53,907 $ (476,352) $ (506,250) $ (408,250) $ (563,258) $ 2,107,231 $ (304,438) $ (1,666,742) $ (298,919) $ 303,153 Business-type activities (313,638) (312,544) (263,692) (196,366) 117,893 1,608,897 216,495 1,039,292 598,934 3,600,134
Total Government $ (259,731) $ (788,896) $ (769,942) $ (604,616) $ (445,365) $ 3,716,128 $ (87,943) $ (627,450) $ 300,015 $ 3,903,287
41
YEAR ENDED JUNE 30
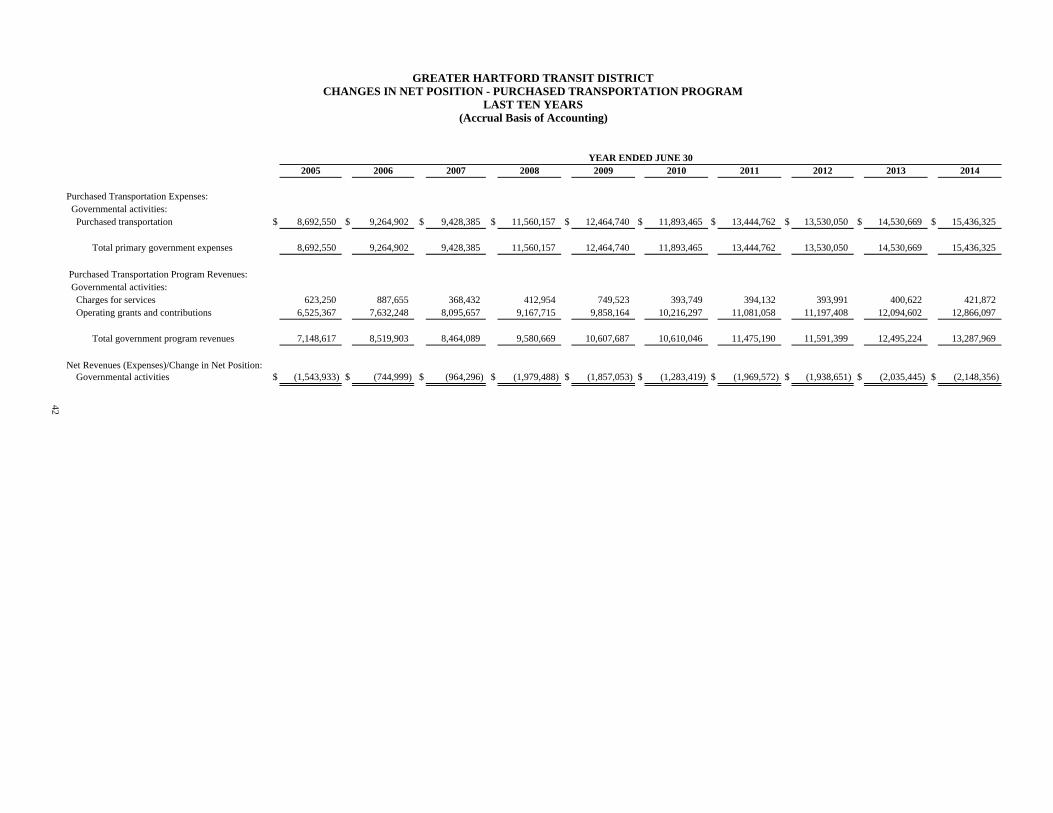
GREATER HARTFORD TRANSIT DISTRICTCHANGES IN NET POSITION - PURCHASED TRANSPORTATION PROGRAM
LAST TEN YEARS(Accrual Basis of Accounting)
2005 2006 2007 2008 2009 2010 2011 2012 2013 2014
Purchased Transportation Expenses: Governmental activities: Purchased transportation $ 8,692,550 $ 9,264,902 $ 9,428,385 $ 11,560,157 $ 12,464,740 $ 11,893,465 $ 13,444,762 $ 13,530,050 $ 14,530,669 $ 15,436,325
Total primary government expenses 8,692,550 9,264,902 9,428,385 11,560,157 12,464,740 11,893,465 13,444,762 13,530,050 14,530,669 15,436,325
Purchased Transportation Program Revenues: Governmental activities: Charges for services 623,250 887,655 368,432 412,954 749,523 393,749 394,132 393,991 400,622 421,872 Operating grants and contributions 6,525,367 7,632,248 8,095,657 9,167,715 9,858,164 10,216,297 11,081,058 11,197,408 12,094,602 12,866,097
Total government program revenues 7,148,617 8,519,903 8,464,089 9,580,669 10,607,687 10,610,046 11,475,190 11,591,399 12,495,224 13,287,969
Net Revenues (Expenses)/Change in Net Position: Governmental activities $ (1,543,933) $ (744,999) $ (964,296) $ (1,979,488) $ (1,857,053) $ (1,283,419) $ (1,969,572) $ (1,938,651) $ (2,035,445) $ (2,148,356)
42
YEAR ENDED JUNE 30
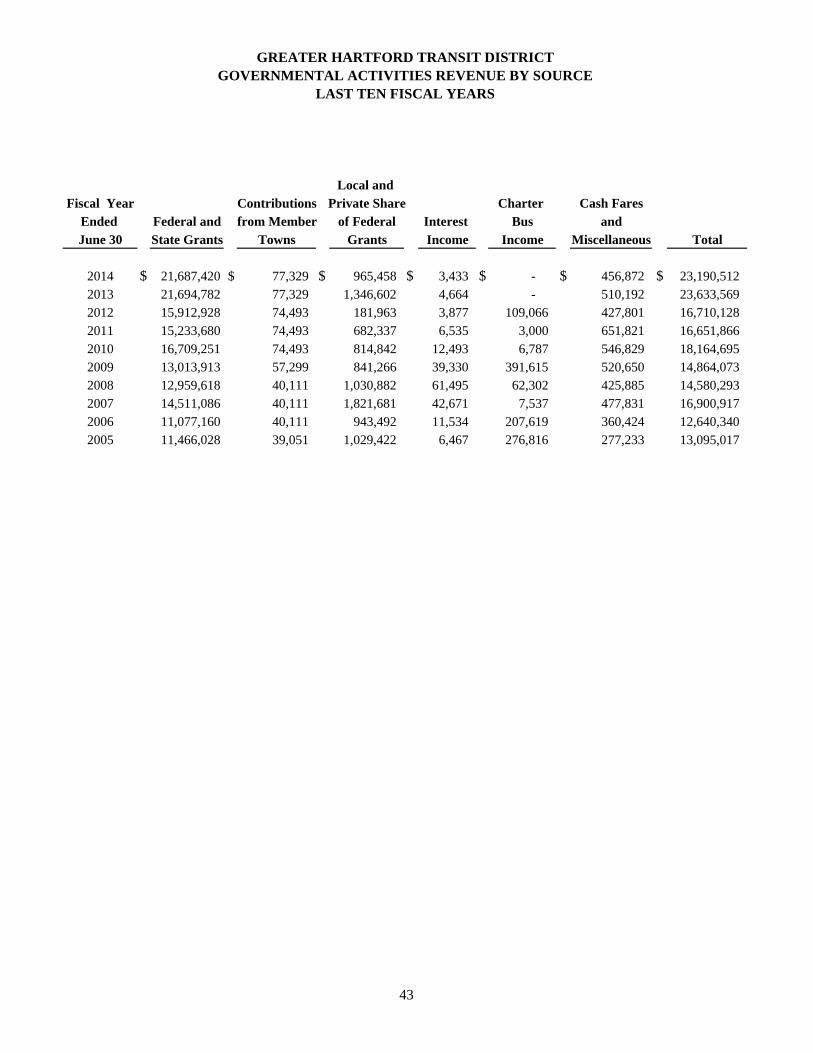
Local and Fiscal Year Contributions Private Share Charter Cash Fares
Ended Federal and from Member of Federal Interest Bus andJune 30 State Grants Towns Grants Income Income Miscellaneous Total
2014 $ 21,687,420 $ 77,329 $ 965,458 $ 3,433 $ - $ 456,872 $ 23,190,512 2013 21,694,782 77,329 1,346,602 4,664 - 510,192 23,633,569 2012 15,912,928 74,493 181,963 3,877 109,066 427,801 16,710,128 2011 15,233,680 74,493 682,337 6,535 3,000 651,821 16,651,866 2010 16,709,251 74,493 814,842 12,493 6,787 546,829 18,164,695 2009 13,013,913 57,299 841,266 39,330 391,615 520,650 14,864,073 2008 12,959,618 40,111 1,030,882 61,495 62,302 425,885 14,580,293 2007 14,511,086 40,111 1,821,681 42,671 7,537 477,831 16,900,917 2006 11,077,160 40,111 943,492 11,534 207,619 360,424 12,640,340 2005 11,466,028 39,051 1,029,422 6,467 276,816 277,233 13,095,017
GREATER HARTFORD TRANSIT DISTRICTGOVERNMENTAL ACTIVITIES REVENUE BY SOURCE
LAST TEN FISCAL YEARS
43
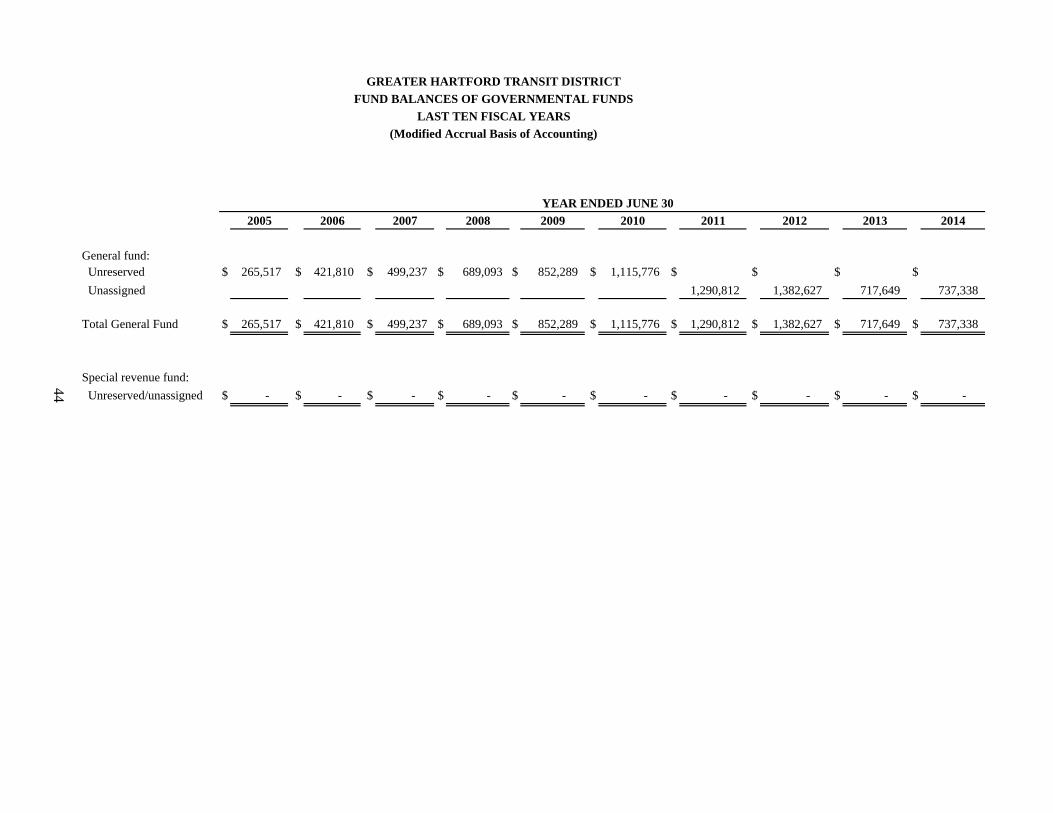
2005 2006 2007 2008 2009 2010 2011 2012 2013 2014
General fund: Unreserved $ 265,517 $ 421,810 $ 499,237 $ 689,093 $ 852,289 $ 1,115,776 $ $ $ $
Unassigned 1,290,812 1,382,627 717,649 737,338
Total General Fund $ 265,517 $ 421,810 $ 499,237 $ 689,093 $ 852,289 $ 1,115,776 $ 1,290,812 $ 1,382,627 $ 717,649 $ 737,338
Special revenue fund:
Unreserved/unassigned $ - $ - $ - $ - $ - $ - $ - $ - $ - $ -
GREATER HARTFORD TRANSIT DISTRICT
FUND BALANCES OF GOVERNMENTAL FUNDS
LAST TEN FISCAL YEARS
(Modified Accrual Basis of Accounting)
YEAR ENDED JUNE 30
44
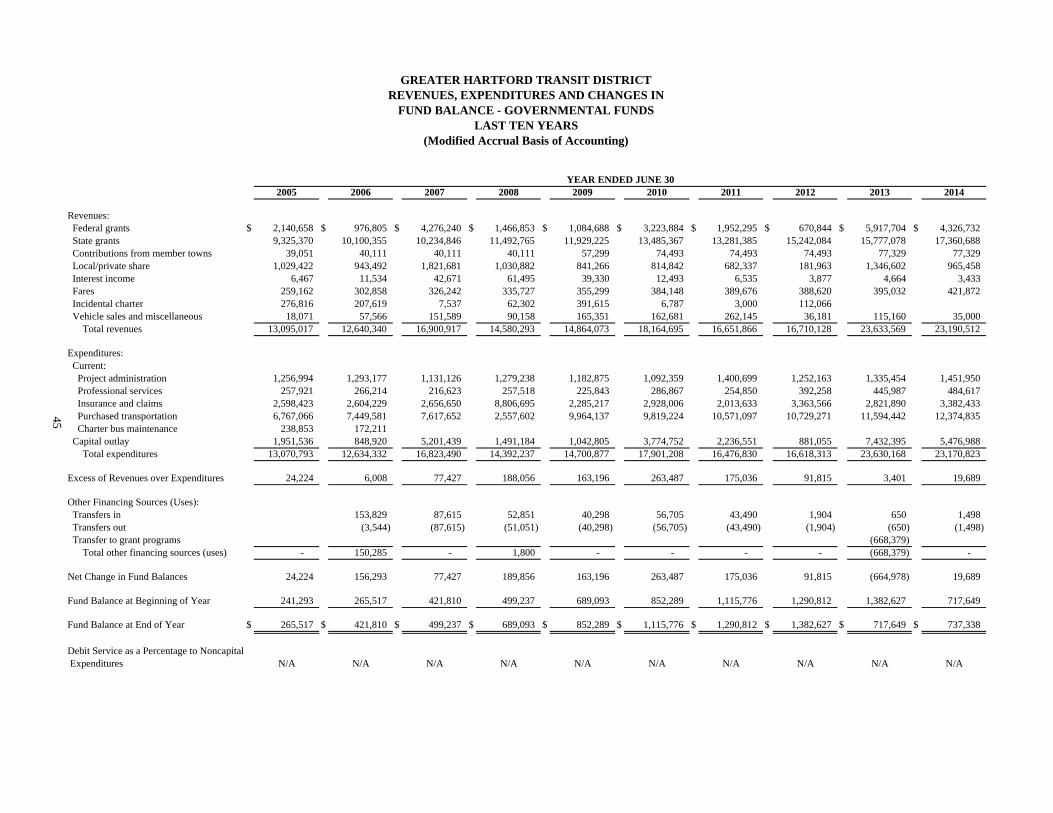
GREATER HARTFORD TRANSIT DISTRICTREVENUES, EXPENDITURES AND CHANGES IN
FUND BALANCE - GOVERNMENTAL FUNDSLAST TEN YEARS
(Modified Accrual Basis of Accounting)
2005 2006 2007 2008 2009 2010 2011 2012 2013 2014
Revenues: Federal grants $ 2,140,658 $ 976,805 $ 4,276,240 $ 1,466,853 $ 1,084,688 $ 3,223,884 $ 1,952,295 $ 670,844 $ 5,917,704 $ 4,326,732 State grants 9,325,370 10,100,355 10,234,846 11,492,765 11,929,225 13,485,367 13,281,385 15,242,084 15,777,078 17,360,688 Contributions from member towns 39,051 40,111 40,111 40,111 57,299 74,493 74,493 74,493 77,329 77,329 Local/private share 1,029,422 943,492 1,821,681 1,030,882 841,266 814,842 682,337 181,963 1,346,602 965,458 Interest income 6,467 11,534 42,671 61,495 39,330 12,493 6,535 3,877 4,664 3,433 Fares 259,162 302,858 326,242 335,727 355,299 384,148 389,676 388,620 395,032 421,872 Incidental charter 276,816 207,619 7,537 62,302 391,615 6,787 3,000 112,066 Vehicle sales and miscellaneous 18,071 57,566 151,589 90,158 165,351 162,681 262,145 36,181 115,160 35,000 Total revenues 13,095,017 12,640,340 16,900,917 14,580,293 14,864,073 18,164,695 16,651,866 16,710,128 23,633,569 23,190,512
Expenditures: Current: Project administration 1,256,994 1,293,177 1,131,126 1,279,238 1,182,875 1,092,359 1,400,699 1,252,163 1,335,454 1,451,950 Professional services 257,921 266,214 216,623 257,518 225,843 286,867 254,850 392,258 445,987 484,617 Insurance and claims 2,598,423 2,604,229 2,656,650 8,806,695 2,285,217 2,928,006 2,013,633 3,363,566 2,821,890 3,382,433 Purchased transportation 6,767,066 7,449,581 7,617,652 2,557,602 9,964,137 9,819,224 10,571,097 10,729,271 11,594,442 12,374,835 Charter bus maintenance 238,853 172,211 Capital outlay 1,951,536 848,920 5,201,439 1,491,184 1,042,805 3,774,752 2,236,551 881,055 7,432,395 5,476,988 Total expenditures 13,070,793 12,634,332 16,823,490 14,392,237 14,700,877 17,901,208 16,476,830 16,618,313 23,630,168 23,170,823
Excess of Revenues over Expenditures 24,224 6,008 77,427 188,056 163,196 263,487 175,036 91,815 3,401 19,689
Other Financing Sources (Uses): Transfers in 153,829 87,615 52,851 40,298 56,705 43,490 1,904 650 1,498 Transfers out (3,544) (87,615) (51,051) (40,298) (56,705) (43,490) (1,904) (650) (1,498) Transfer to grant programs (668,379) Total other financing sources (uses) - 150,285 - 1,800 - - - - (668,379) -
Net Change in Fund Balances 24,224 156,293 77,427 189,856 163,196 263,487 175,036 91,815 (664,978) 19,689
Fund Balance at Beginning of Year 241,293 265,517 421,810 499,237 689,093 852,289 1,115,776 1,290,812 1,382,627 717,649
Fund Balance at End of Year $ 265,517 $ 421,810 $ 499,237 $ 689,093 $ 852,289 $ 1,115,776 $ 1,290,812 $ 1,382,627 $ 717,649 $ 737,338
Debit Service as a Percentage to Noncapital Expenditures N/A N/A N/A N/A N/A N/A N/A N/A N/A N/A
45
YEAR ENDED JUNE 30
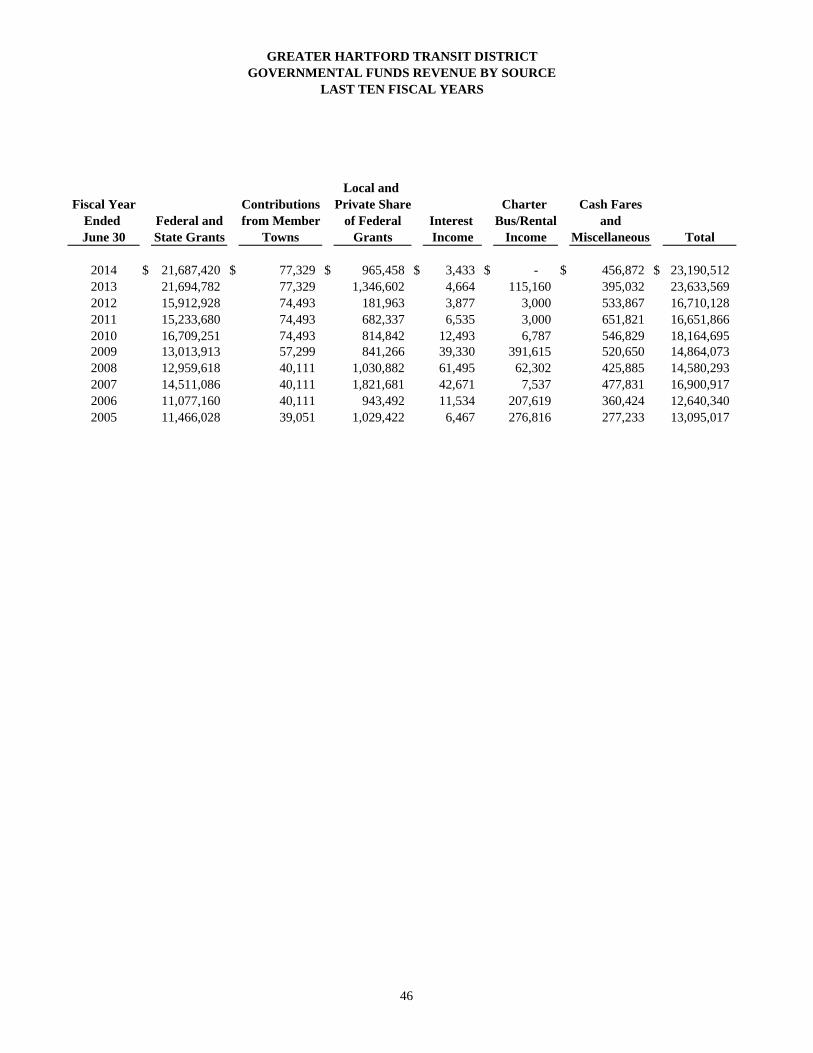
Local and Fiscal Year Contributions Private Share Charter Cash Fares
Ended Federal and from Member of Federal Interest Bus/Rental andJune 30 State Grants Towns Grants Income Income Miscellaneous Total
2014 $ 21,687,420 $ 77,329 $ 965,458 $ 3,433 $ - $ 456,872 $ 23,190,512 2013 21,694,782 77,329 1,346,602 4,664 115,160 395,032 23,633,569 2012 15,912,928 74,493 181,963 3,877 3,000 533,867 16,710,128 2011 15,233,680 74,493 682,337 6,535 3,000 651,821 16,651,866 2010 16,709,251 74,493 814,842 12,493 6,787 546,829 18,164,695 2009 13,013,913 57,299 841,266 39,330 391,615 520,650 14,864,0732008 12,959,618 40,111 1,030,882 61,495 62,302 425,885 14,580,293 2007 14,511,086 40,111 1,821,681 42,671 7,537 477,831 16,900,917 2006 11,077,160 40,111 943,492 11,534 207,619 360,424 12,640,340 2005 11,466,028 39,051 1,029,422 6,467 276,816 277,233 13,095,017
GREATER HARTFORD TRANSIT DISTRICTGOVERNMENTAL FUNDS REVENUE BY SOURCE
LAST TEN FISCAL YEARS
46
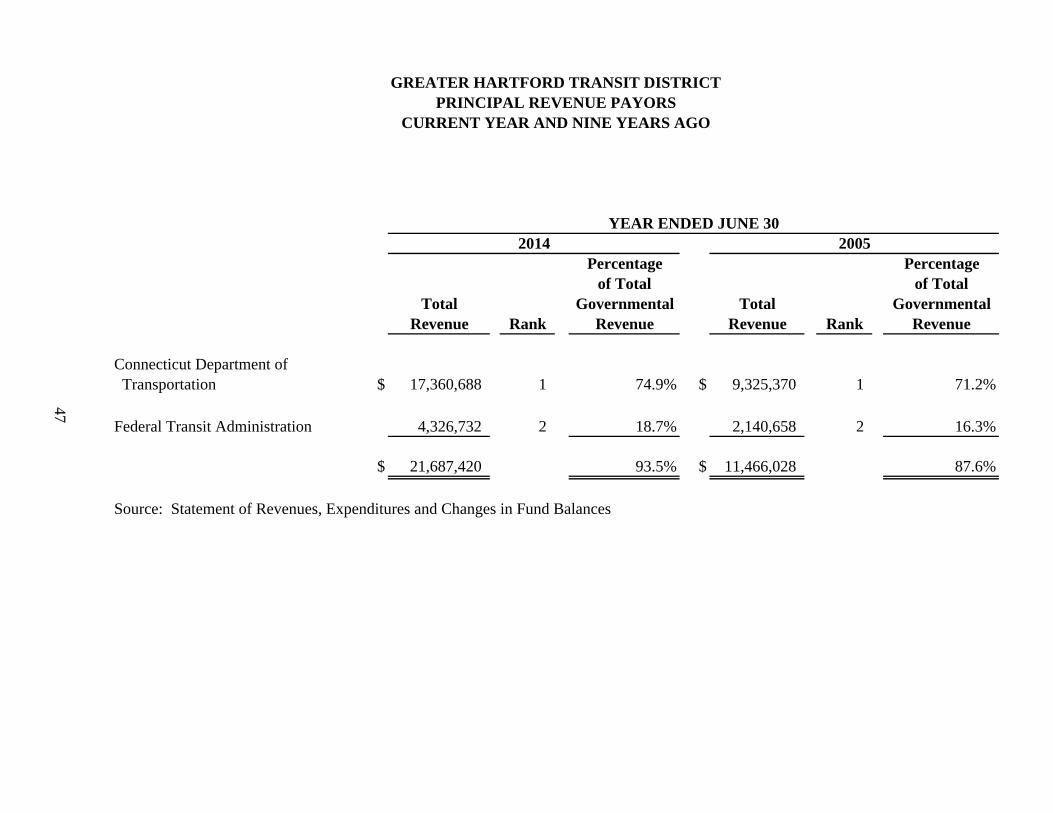
YEAR ENDED JUNE 30
Percentage Percentageof Total of Total
Total Governmental Total GovernmentalRevenue Rank Revenue Revenue Rank Revenue
Connecticut Department of Transportation $ 17,360,688 1 74.9% $ 9,325,370 1 71.2%
Federal Transit Administration 4,326,732 2 18.7% 2,140,658 2 16.3%
$ 21,687,420 93.5% $ 11,466,028 87.6%
Source: Statement of Revenues, Expenditures and Changes in Fund Balances
GREATER HARTFORD TRANSIT DISTRICTPRINCIPAL REVENUE PAYORS
CURRENT YEAR AND NINE YEARS AGO
2014 2005
47
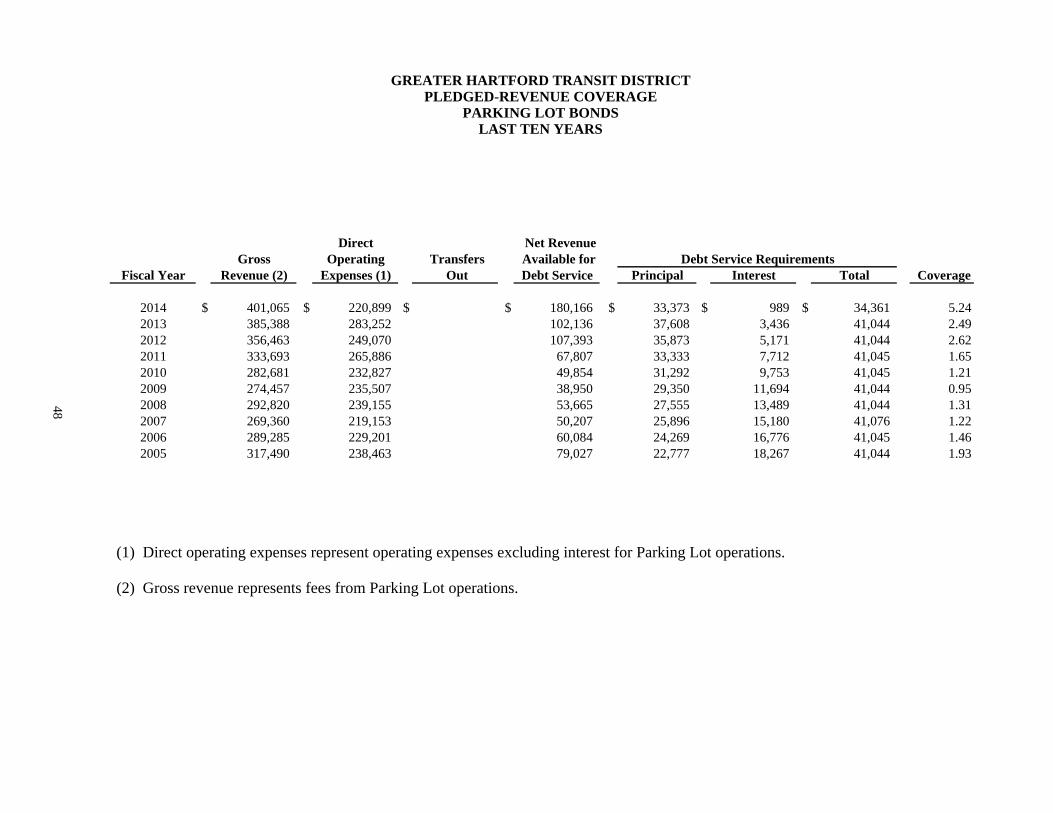
GREATER HARTFORD TRANSIT DISTRICT PLEDGED-REVENUE COVERAGE
PARKING LOT BONDS LAST TEN YEARS
Direct Net RevenueGross Operating Transfers Available for Debt Service Requirements
Fiscal Year Revenue (2) Expenses (1) Out Debt Service Principal Interest Total Coverage
2014 $ 401,065 $ 220,899 $ $ 180,166 $ 33,373 $ 989 $ 34,361 5.242013 385,388 283,252 102,136 37,608 3,436 41,044 2.492012 356,463 249,070 107,393 35,873 5,171 41,044 2.622011 333,693 265,886 67,807 33,333 7,712 41,045 1.652010 282,681 232,827 49,854 31,292 9,753 41,045 1.212009 274,457 235,507 38,950 29,350 11,694 41,044 0.952008 292,820 239,155 53,665 27,555 13,489 41,044 1.312007 269,360 219,153 50,207 25,896 15,180 41,076 1.222006 289,285 229,201 60,084 24,269 16,776 41,045 1.462005 317,490 238,463 79,027 22,777 18,267 41,044 1.93
(1) Direct operating expenses represent operating expenses excluding interest for Parking Lot operations.
(2) Gross revenue represents fees from Parking Lot operations.
48
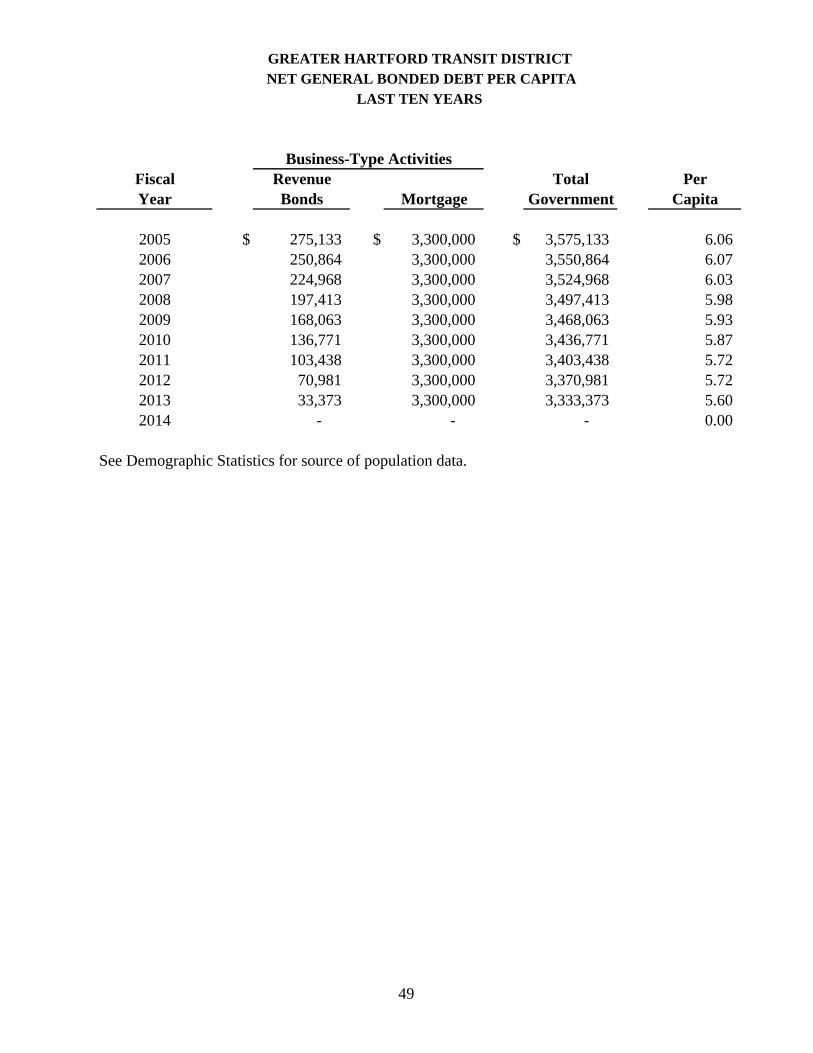
NET GENERAL BONDED DEBT PER CAPITALAST TEN YEARS
Business-Type ActivitiesFiscal Revenue Total PerYear Bonds Mortgage Government Capita
2005 $ 275,133 $ 3,300,000 $ 3,575,133 6.062006 250,864 3,300,000 3,550,864 6.072007 224,968 3,300,000 3,524,968 6.032008 197,413 3,300,000 3,497,413 5.982009 168,063 3,300,000 3,468,063 5.932010 136,771 3,300,000 3,436,771 5.872011 103,438 3,300,000 3,403,438 5.722012 70,981 3,300,000 3,370,981 5.722013 33,373 3,300,000 3,333,373 5.602014 - - - 0.00
See Demographic Statistics for source of population data.
GREATER HARTFORD TRANSIT DISTRICT
49
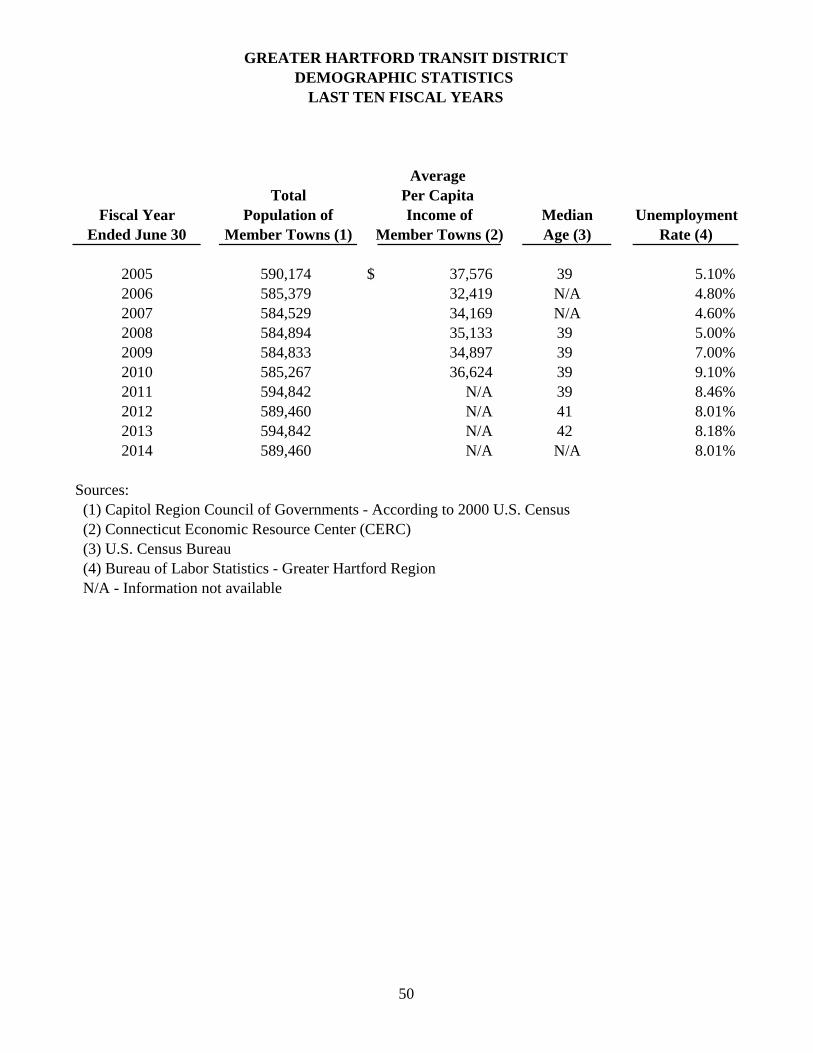
Average Total Per Capita
Fiscal Year Population of Income of Median UnemploymentEnded June 30 Member Towns (1) Member Towns (2) Age (3) Rate (4)
2005 590,174 $ 37,576 39 5.10%2006 585,379 32,419 N/A 4.80%2007 584,529 34,169 N/A 4.60%2008 584,894 35,133 39 5.00%2009 584,833 34,897 39 7.00%2010 585,267 36,624 39 9.10%2011 594,842 N/A 39 8.46%2012 589,460 N/A 41 8.01%2013 594,842 N/A 42 8.18%2014 589,460 N/A N/A 8.01%
Sources: (1) Capitol Region Council of Governments - According to 2000 U.S. Census (2) Connecticut Economic Resource Center (CERC) (3) U.S. Census Bureau (4) Bureau of Labor Statistics - Greater Hartford Region N/A - Information not available
GREATER HARTFORD TRANSIT DISTRICTDEMOGRAPHIC STATISTICS
LAST TEN FISCAL YEARS
50
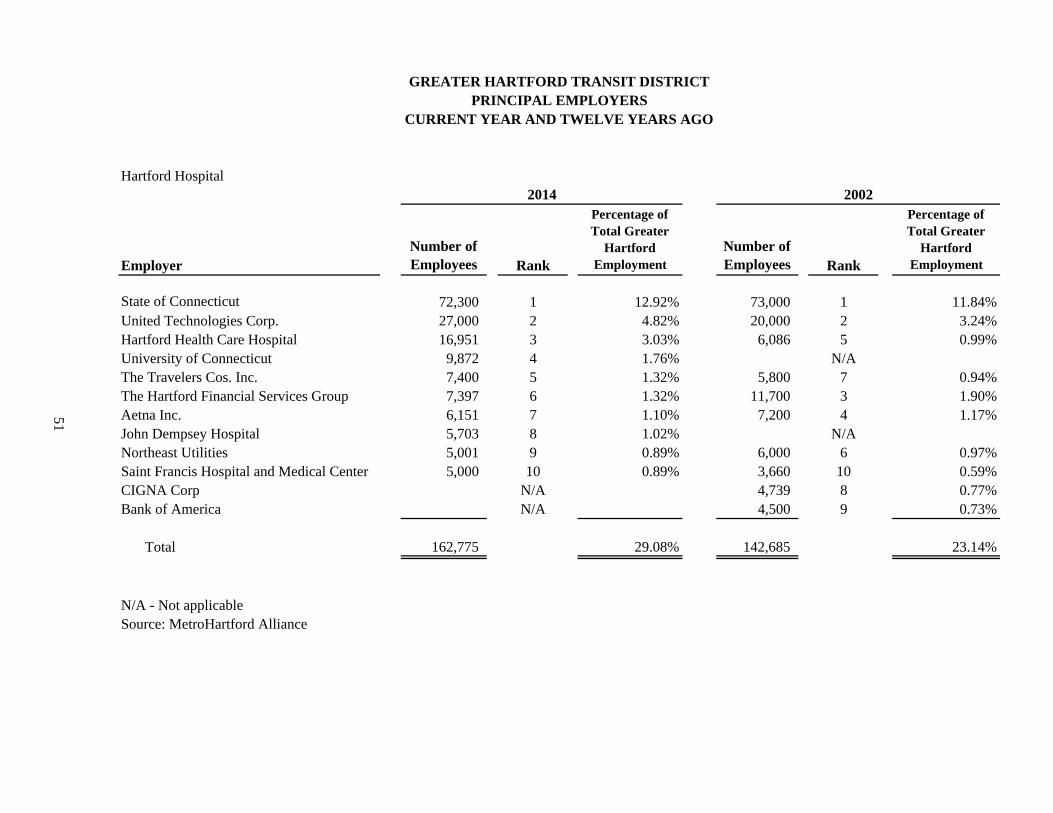
Hartford Hospital
EmployerNumber of Employees Rank
Percentage of Total Greater
Hartford Employment
Number of Employees Rank
Percentage of Total Greater
Hartford Employment
State of Connecticut 72,300 1 12.92% 73,000 1 11.84%United Technologies Corp. 27,000 2 4.82% 20,000 2 3.24%Hartford Health Care Hospital 16,951 3 3.03% 6,086 5 0.99%University of Connecticut 9,872 4 1.76% N/AThe Travelers Cos. Inc. 7,400 5 1.32% 5,800 7 0.94%The Hartford Financial Services Group 7,397 6 1.32% 11,700 3 1.90%Aetna Inc. 6,151 7 1.10% 7,200 4 1.17%John Dempsey Hospital 5,703 8 1.02% N/ANortheast Utilities 5,001 9 0.89% 6,000 6 0.97%Saint Francis Hospital and Medical Center 5,000 10 0.89% 3,660 10 0.59%CIGNA Corp N/A 4,739 8 0.77%Bank of America N/A 4,500 9 0.73%
Total 162,775 29.08% 142,685 23.14%
N/A - Not applicableSource: MetroHartford Alliance
51
GREATER HARTFORD TRANSIT DISTRICTPRINCIPAL EMPLOYERS
CURRENT YEAR AND TWELVE YEARS AGO
2014 2002
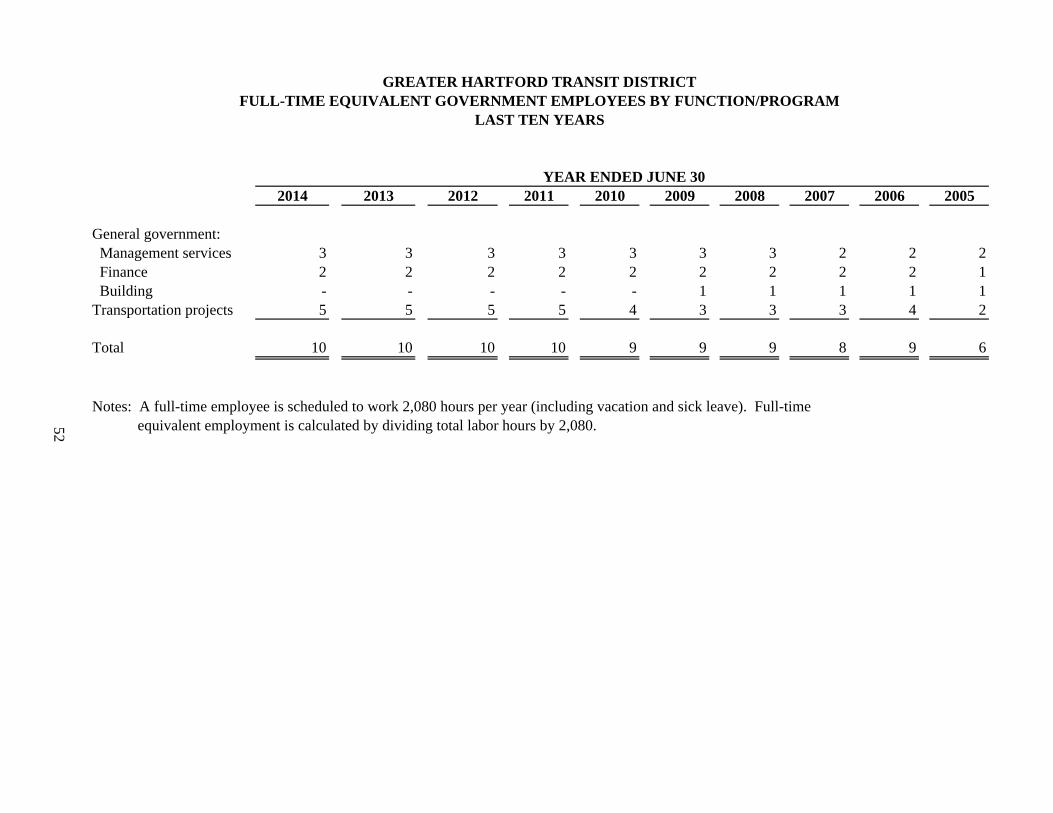
2014 2013 2012 2011 2010 2009 2008 2007 2006 2005
General government: Management services 3 3 3 3 3 3 3 2 2 2 Finance 2 2 2 2 2 2 2 2 2 1 Building - - - - - 1 1 1 1 1Transportation projects 5 5 5 5 4 3 3 3 4 2
Total 10 10 10 10 9 9 9 8 9 6
Notes: A full-time employee is scheduled to work 2,080 hours per year (including vacation and sick leave). Full-time equivalent employment is calculated by dividing total labor hours by 2,080.52
YEAR ENDED JUNE 30
GREATER HARTFORD TRANSIT DISTRICTFULL-TIME EQUIVALENT GOVERNMENT EMPLOYEES BY FUNCTION/PROGRAM
LAST TEN YEARS
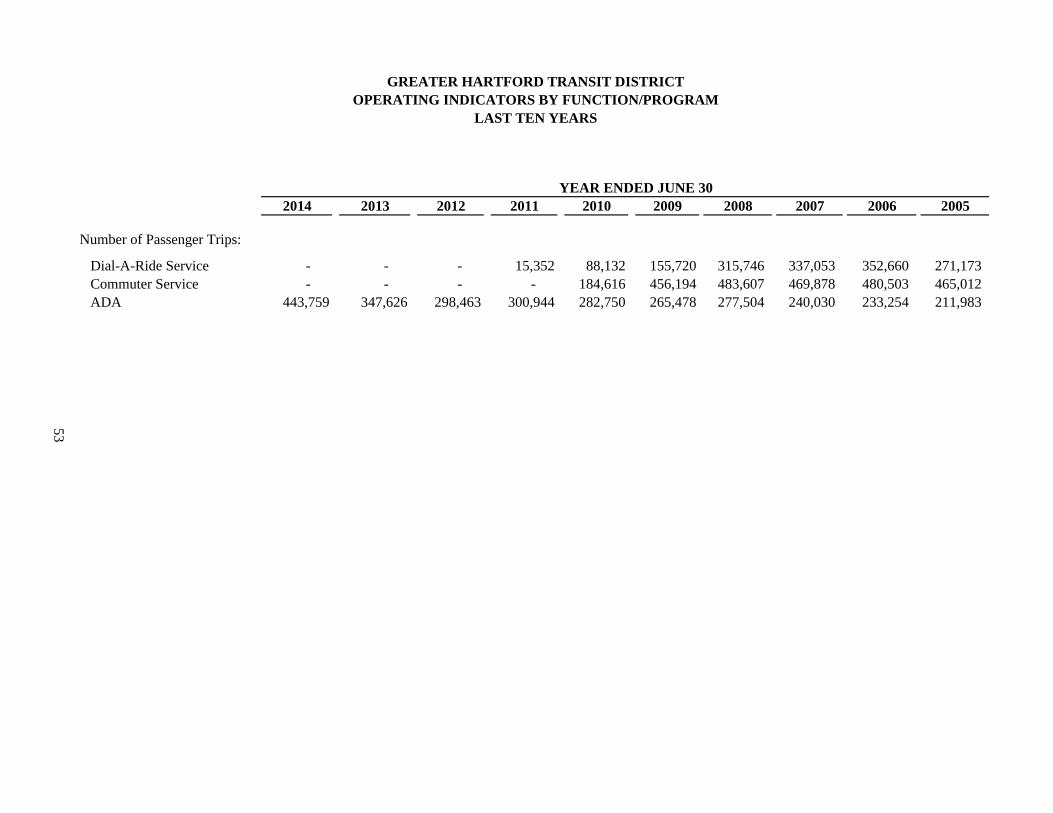
GREATER HARTFORD TRANSIT DISTRICTOPERATING INDICATORS BY FUNCTION/PROGRAM
LAST TEN YEARS
2014 2013 2012 2011 2010 2009 2008 2007 2006 2005
Number of Passenger Trips:
Dial-A-Ride Service - - - 15,352 88,132 155,720 315,746 337,053 352,660 271,173 Commuter Service - - - - 184,616 456,194 483,607 469,878 480,503 465,012 ADA 443,759 347,626 298,463 300,944 282,750 265,478 277,504 240,030 233,254 211,983
53
YEAR ENDED JUNE 30
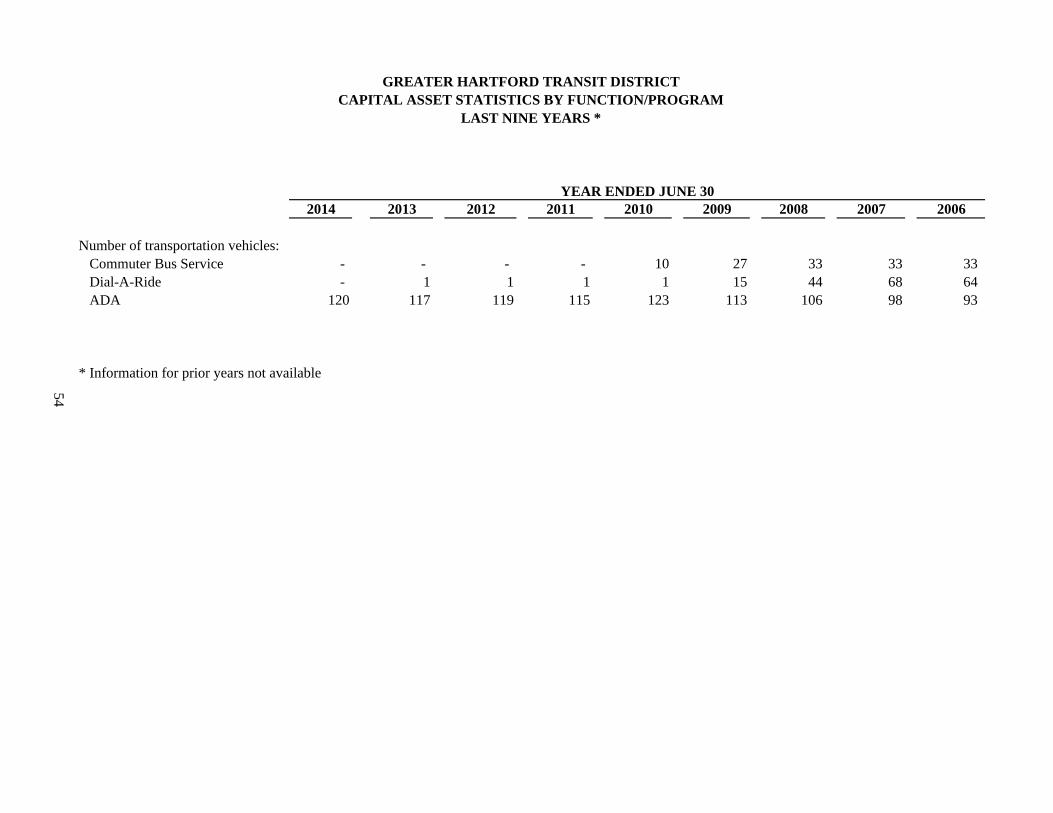
2014 2013 2012 2011 2010 2009 2008 2007 2006
Number of transportation vehicles: Commuter Bus Service - - - - 10 27 33 33 33 Dial-A-Ride - 1 1 1 1 15 44 68 64 ADA 120 117 119 115 123 113 106 98 93
* Information for prior years not available
54
YEAR ENDED JUNE 30
GREATER HARTFORD TRANSIT DISTRICTCAPITAL ASSET STATISTICS BY FUNCTION/PROGRAM
LAST NINE YEARS *

This page is intentionally left blank.