geographical distribution of selected soil fertility …geographical distribution of selected soil...
TRANSCRIPT

Geoderma 75 ( 1997) 99- 116
GEODER&4
Geographical distribution of selected soil fertility parameters of inland valleys in West Africa
Roland Nuhu Issaka, Fusako Ishida, Daisuke Kubota, Toshiyuki Wakatsuki *
Fucult?: of Life and Environmental Science, Shimane Unirersiq, Matsue 690, Japan
Received 20 November 1995; accepted 14 October 1996
Abstract
This study was part of an ongoing characterization of soil properties of inland valleys (IVs) of West Africa. Soil sampling was done during 1982 to 1989. Soil properties of the topsoil (O-15 cm) were used to evaluate the fertility status of the various geographic regions.
Large differences in soil fertility parameters were observed in the various geographic regions. Generally the drier regions [Sudan (SuS) and Sahel savannas (SS>] were relatively higher in ECEC [SuS, 7.7 cmol( +) kg-’ and SS, 8.2 cmol( +) kg-‘, topsoil means] and exchangeable basic cations; but total C @US, 5.5 g kg-’ and SS, 6.2 g kg- ‘, topsoil means) and total N (SuS, 0.68 g kg-’ and SS, 0.66 g kg-‘, topsoil means), available P @US, 2.6 mg kg-’ and SS, 2.7 mg kg-‘, topsoil mean) and exchangeable acidity [SuS, 0.14 cmol(+) kg-’ and SS, 0.46 cmol(+) kg-‘, topsoil means] were relatively low. Soil fertility parameters were generally low in the Guinea savanna zone [ECEC, 2.5 cmol(+) kg- ‘; total C, 7.3 g kg- ‘; total N, 0.7 g kg- ’ and available P, 2.9 mg kg-‘, topsoil means]. In the Forest region, ECEC [5.7 cmol(+) kg-‘], exchangeable Ca [2.3 cmol(+) kg-‘], Mg [1.24 cmol(+) kg-‘], acidity [1.67 cmol(+) kg-‘], and total C (20.4 g kg-‘) and total N (1.66 g kg-‘) were relatively high. Available P (5.3 g kg-‘) and exchangeable K LO.27 cmol( -+> kg-‘] were relatively moderate. However, in the more wetter Equatorial Forest, available P and exchangeable K were low and acidity very high.
Soil properties of these inland valleys were affected by both geology and climate. Geological formation of recent alluvial deposition, rejuvenation and the presence of basic rocks mostly resulted in relatively fertile soils while soils of very old geological origin were relatively less fertile. Climate had a dual effect on these soil properties: within the areas with tropudic and typic udic soil moisture regimes, serious leaching resulted in less exchangeable basic cations but high exchangeable acidity; however, rainfall enhanced high biomass production which resulted in relatively high organic matter content and hence high ECEC and total N. Annual burning,
* Corresponding author. Fax: + 82(852)32 6499.
0016-7061/97/$17.00 Copyright 0 1997 Elsevier Science B.V. All rights reserved PII SO0 16-706 1(96)00083-3

100 R.N. Issaka et ~l./Geoderma 75 (19971 %-l/6
especially of the grass vegetation in savanna area brought about a low addition of plant residue into the soil.
Total elemental oxides were almost the same for all the zones. However, values for the various sites were different due to differences in geological formation. The relative differences in retention
(ECEC) and leaching of basic cations resulting from weathering also accounted for some of the differences in the soil fertility properties observed.
Ke~n~rds: climatic zones; geographical distribution; inland valleys: soil propertie\
1. Introduction
Despite reasonable increase in total agricultural production in West Africa, rapid population growth, the prevalence of traditional farming system, and increasing urban immigration in most countries have caused per capita agriculture production to increase only slightly or even decrease (Windmeijer and Andriesse, 1993). In most cases, demand is far more than domestic production resulting in a chronic annual importation of food items. According to the same authors, even though total rice production in West Africa has increased by 75% over the last fifteen years, rice imports had increased several times since.
Inland valleys, occurring abundantly in the West African land scape, and having a specific hydrological conditions, have been cited as the appropriate ecology for wetland rice cultivation (Moormann and Juo, 1986; Wakatsuki et al., 1989; Okigbo, 1990 and Windmeijer and Andriesse, 1993). Paddy rice systems ’ have also been observed to be economically sustainable and ecological sound (Kyuma and Wakatsuki, 1995). Accord- ing to these authors, the high productivity and sustainability of paddy system originates from its highly efficient nutrient replenishing mechanisms and its intrinsic resistance to soil erosion. Proper management of West Africa inland valleys is therefore expected to achieve this dual advantage of high production and sustainability.
The highly efficient nutrient replenishing mechanism of paddy is particularly impor- tant in West Africa inland valleys due to their relatively low soil fertility parameters (Issaka et al., 1996).
For any meaningful managerial options to be developed, comprehensive studies of these inland valleys is required. In this study, the effect of geological, climatic and anthropogenic factors on the distribution of soil properties and total elemental oxides of West Africa inland valleys are discussed.
’ Paddy rice system or paddy system may be described more appropriately as sawah system. The term sawah refers to bunded and leveled rice fields with irrigation and drainage systems. The term originated from Malayo-Indonesian. The English term paddy also originated from the Malayo-Indonesian term padi, which means rice plant. The term paddy refers to rice in West Africa. Most of the paddy fields in the Asian countries correspond to the definition of the term sawah. However, in West Africa. the term paddy field refers to just a rice field including an upland rice field. To avoid confusion between rice plant, paddy and the improved man made rice growing environment, the authors propose to use the term sawah.

R.N. Issaka et al. /Geoderm 75 (1997) 99-l 16
2. Materials and methods
101
2.1. Inland Valleys
The term Inland Valley is widely used in anglophone West Africa; it refers to valleys, inland in respect to the main rivers and tributaries, where river alluvial sedimentation processes are absent or only imminent (Windmeijer and Andriesse, 1993). They are best known as bas-fends in francophone West Africa. These names generally refer to seasonal or perennial waterlogged valley bottoms and depressions. In this study, the inland valleys mostly include the valley bottom and to some extent the fringes. Total area of inland valleys in West Africa is estimated at 20-50 million hectares (Windmeijer and Andriesse, 1993) of which about 5-17 million hectares are potential area for small scale irrigated rice based farming (Wakatsuki, 1994). According to Andriesse, 1986, inland valleys constitute 7% of the total area of sub-Saharan Africa and 36% of the total wetlands in this sub region. Thus their effective utilization can bring a significant positive change in the food situation.
2.2. Study area
West Africa (Fig. 1) is bounded on the south and west by the Atlantic Ocean and on the east by the Cameroun highlands. The northern boundary is not clearly defined and is
SLll4.V SAVANNA z0.m CiuS) -___---
01 mm SAVANYA
SAHARA DESERT SAHEL %4v*w.
Okm l.%l km
ATLANTIC (y I&u,: <M (Mcm-0 ?SSI>)
,, .Lkderate 3 d-50 (hleanrO.lSSD)
. H@ >SO (>wan+lmSD)
Fig. 1. Map of West Africa showing the distribution of effective cation exchange capacity (ECEC) and selected sampling sites. Climatic zones are demarcated in broken lines. Brief description of a few sites: (1) Abakaliki, traditional inland valley (IV) rice growing area. (2) Ibadan, IITA IV rice field. (3) Birinin Konni, African rice in depression. (4) Dwiyama, IV rice area. (5) Kiribina irrigated IV rice area. (6) Touba small irrigated IV rice area. (7) Gbailalenai, traditional IV rice area. (8) Koumeli, traditional IV rice area. (9) Falaba, traditional IV rice area.
102 R.N. lssa!u~ erul./Geoderma 7.5 (19971 YY-116
generally considered to follow the southern limits of the Sahara desert (Udo, 1985). The study area covered the whole of West Africa.
2.3. Climate und geology
The different climatic zones (EF: Equatorial forest, GS: Guinea savanna, SuS: Sudan savanna, and SS: Sahel savanna) and rainfall distribution are presented in Fig. I (Udo, 1985). With regards to geology, the northern sector (Sudan and Sahel savannas) consist mainly of sediment deposit ranging from < 2 my to 1000 my, both intrusive and extrusive basic rocks are present in parts of Mali and Niger (UNESCO, 1983). The southern zone is dominated by rocks of the Basement complex of Precambrian age. The oldest (2900-3500 my) geological formation is in the south-west with a relatively young (500-600 my> geological formation in the south-eastern part (UNESCO, 19831. Geolog- ical formation in the remaining parts of southern West Africa is between 2400-2700 my. Relatively recent sediment deposition is also present in the south-eastern part. Rejuvenation is relatively abundant in parts of Guinea, Gate d’Ivoire, Ghana and parts of Nigeria (UNESCO, 1983).
2.4. Field sampling
Sampled area and a selected number of sites are presented in Fig. 1. Sampling was done during 1983 to 1989 at 185 different sites from various inland valleys throughout West Africa. Samples were taken using an auger and occasionally from soil pits. Both topsoil (O-15 cm) and subsoil (15-30, 30-45, 45-60, 60-75 and 75-90 cm) samples were collected. Soil sampling was generally edaphologically inclined which is the dominant viewpoint of this paper, however, soil description of some sites were done.
2.5. Laboratory anulysis
Soil samples were air-dried, ground and passed through 2 mm sieve. Soil pH (1 : 2.5 water) was measured with a pH meter (with a glass electrode) according to the method described by IITA, 1979 and Mclean, 1982. Total carbon was determined by wet combustion (Walkley and Black, 1934), total nitrogen by the Macro-Kjeldahl method as described by Bremner, 1965. Total carbon and nitrogen of some samples were simulta- neously determined by dry combustion using Sumigraph NC-80 (Sumitomo Chemical CO. LTD, Osaka, Japan). This was based on the same principle described by Nelson and Sommers, 1982, on dry combustion using Perkin-Elmer 240. Exchangeable cations were first extracted with ammonium acetate and the various cations determined by Atomic absorption spectrophotometry (Thomas, 1982); for some samples, Inductively Coupled Plasma Atomic Emission Spectroscopy, Shimazu (ICPS 2000) was used to determine Ca and Mg. Exchangeable acidity was determined first by extracting it with KC1 and titrating the extract with sodium hydroxide (Mclean, 19651. Available phosphorus was determined by the method of Bray and Kurtz, 1945. Total chemical analyses of the elements was based on the method described by Uchida et al. (1979), followed by calorimetric determination of phosphorus (Olsen and Sommers, 1982). K was deter-

R.N. Issaka et al./Geodema 75 (1997) 99-116 103
mined by Atomic absorption spectrophotometer while Inductively Coupled Plasma Atomic Emission Spectrometer, Shimazu (ICPS 2000), was used to determine Al, Fe, Si, Ca and Mg.
3. Results
Mean values of both soil properties and total elemental oxides of inland valleys (IVs) of West Africa are presented in Tables 1 and 2. Extreme variations in soil properties and total elemental oxides was underlined by the high standard deviation values (except soil pH; due to logarithmic expression) and confirms the presence of both rich, and very poor soils in this region. This strong variations in soil properties was further emphasized by Oyediran (1990) who presented detailed soil descriptions of two site; Bende in the forest and Gadza in the guinea savanna zones as follows: Soils of the Bende transect had textures ranging from sandy loam to clay, relatively low bulk density (0.73-2.0 Mg m -’ l and are generally firm and plastic. ECEC for the bottom two pedons were relatively very high (9.6-12.8 cmol(+) kg-‘), with all the pedons showing high values (2.8-5.0 cmol(+) kg-‘) of exchangeable acidity. Clay mineralogy of the two lower pedons showed the presence of smectite and vermiculite minerals. For the Gadza transect the soils were generally sandy to sandy loam in texture with relatively high bulk densities (1.87-2.02 Mg m - ‘). The soils were non plastic and friable. ECEC values of these soils were low (1.3-4.8 cmol(+) kg-‘) with exchangeable acidity ranging from 0.3-I .I cmol( +> kgg ‘. Clay mineralogy of these soils was dominated by kaolinite. These sharp differences in soil properties may help explain what was observed in this study.
Compared to mean values for lowland soils of tropical Asia, exchangeable bases and available phosphorus of IVs of West Africa were extremely low and low in soil pH (Table I). Total carbon and nitrogen were almost similar. With regard to total elemental oxides, IVs of West Africa were very low in total basic oxides compared to lowland soils of tropical Asia (Table 2). Total elemental oxides of phosphorus, iron and aluminum were lower compared to lowland soils of tropical Asia, silica however, was higher in IVs of West Africa showing that these soils are more siliceous and sandy. Total carbon, nitrogen and acidity for Oxisols-Ultisols areas of tropical America were twice those of IVs of West Africa (Table I), available phosphorus was also higher, reflecting the more wetter environment of tropical America. Both West Africa and tropical America showed extremely low status of total basic cations and phosphorus compared to lowland soils of tropical Asia (Table 2) showing intense weathering and leaching.
3. I. Shl pH
Mean topsoil pH values for the various climatic zones lie within the moderate range; EF and GS (5.3); SuS, 5.9 and SS, 6.0 (Tables 3 and 4). Except for GS soil pH increased with depth.

104 R.N. Issaka et al. / Geodermu 75 C 19971 99- 116

R.N. Issaka etal./Geodetma 75 (1997) 99-116 105
Table 2 Mean values of total elemental oxides (g kg- ’ ) of IVs of West Africa in comparison with lowland soils (topsoil) of Tropical Asia and Tropical America (Oxisol-Ultisol area of the Amazon River System)
Location Depth (cm)
Total elemental oxides (g kg-’ )
K@ CaO MgG Na,O PzO, Fe,% 42% SiO,
W. Africa O-15 15-30 30-45 45-60 60-75 75-90
SD
T. Asia” 18.3 14.2 9.2 nd I .30 59.4 163 722 T. Americab 4.3 2.7 3.7 nd 0.53 52.0 149 170
9.28 4.01 4.30 1.90 0.83 42.6 144 784 8.62 3.52 3.97 2.18 0.64 43.4 137 792 8.55 3.47 3.78 1.93 0.52 41.7 129 801 8.36 3.48 3.95 2.32 0.56 43.0 127 805
10.29 3.90 4.46 2.47 0.52 44.3 128 793 8.93 5.46 4.43 1.90 0.46 41.0 113 818
5.92 4.49 3.33 2.34 0.44 27.0 78.0 106
a Kawaguchi and Kyuma (1977). ’ Tanaka et al. (1986). SD: standard deviation (applicable only to W. Africa). Calculation of total elemental oxides was based on ignited (900°C) soil. nd: not determined.
Table 3 Ranges and mean values of pH, total carbon and nitrogen and available phosphorus of inland valley soils in West Africa
Climatic Depth Soil Total carbon Total nitrogen Bray No. I P zone (cm) pH (I : 2.5 water) (gkg-‘) (g kg-‘) (mgkg- 1)
Mean Range Mean Range Mean Range Mean Range
EF o-15 5.3 (79) 4.2-7.8 20.4 1.3-109 1.66 0.16-7.7 5.3 0.02-22 GS sus ss EF GS sus ss
EF GS sus ss
EF GS
EF GS
5.3 (98) 5.9 (3) 6.0 (5)
15-30 5.4 (79) 5.3 (98) 6.0 (3) 6.1 (5)
45-60 5.6 (42) 5.2 (42) 6.4 (2) 6.4 (2)
60-75 6.2 (25) 5.2 (25)
75-90 7.2 (14) 5.3 (18)
4.2-6.8 7.3 0.4-30 0.70 0.01-3.0 2.9 0.20-20 5.6-6.3 5.5 2.6-7 0.68 0.62-0.7 2.6 1.20-4 5.7-0.7 6.2 5.1-7 0.66 0.53-0.7 2.7 0.6 I-4
4.0-7.2 13.0 1.1-88 1.23 4.0-6.8 5.9 0.2-12 0.59 5.7-6.3 4.5 2.2-6 0.65 5.8-6.3 5.3 4.5-6 0.63
4.5-8.0 6.7 1 .o-38 0.54 4.0-6.7 2. I 0. I-6 0.29 6.2-6.5 3.4 2.3-5 0.55 6. I-6.7 4.6 4.2-5 0.62
4.6-9.0 6.0 I .o-20 0.47 5.0-6.0 2.0 0.1-5 0.21
5.8-8.0 5.3 1.7-8 0.44 5.0-5.9 0.6 0.3- 1 0.18
0.13-5.2 4.0 0.01-2.1 2.8 0.56-0.7 I.8 0.53-0.7 1.5
0.13-1.8 2.6 0.06-I .3 1.9 0.46-0.6 0.5 0.59-0.7 1.0
0.17-1.2 2.6 0.10-0.4 2.0
0.23-0.7 2.5 0.1 o-o.3 1.7
0.20- I2 0.20- 14 0.10-3 0.54-2
0.19-10 o.OO- 12 0.40-0.5 0.70-I .2
0.50- I6 0.70-7
0.80- 1 I 0.60-3
EF: Equatorial Forest, GS: Guinea Savanna, SuS: Sudan Savanna, SS: Sahel Savanna.

Tabl
e 4
Ran
ges
and
mea
n va
lues
of
exc
hang
eabl
e ca
tions
an
d ef
fect
ive
CEC
[c
mol
( +
) kg
- ’ ]
of
inla
nd
valle
y so
ils
in t
he
vario
us
clim
atic
zo
nes
of W
est
Afri
ca
Clim
atic
D
epth
Ex
chan
geab
le
catio
ns
[cm
ol(
+ )k
g-
’ ]
Aci
dity
EC
EC
Lone
(c
m)
K
Ca
Mg
Na
[cm
ol(+
)k
g-‘1
[c
mol
(+)k
g-‘1
Mea
n R
ange
M
ean
Ran
ge
Mea
n R
ange
M
ean
Ran
ge
Mea
n R
ange
M
ean
Ran
ge
EF (
79)
O-I.5
0.27
0.
02-0
.98
2.28
0.
2-l
I G
S (9
8)
sus
(3)
ss
(5)
EF (
79)
GS
(98)
su
s (3
) ss
(5
)
IS-3
0
0.20
0.
00-0
.60
1.33
0.
I-6
0.
52
0.45
-0.6
5 3.
67
3.5-
h 0.
63
0.52
-0.7
3 4.
82
3.8-
6
0.23
0.
02-0
.85
2.76
0.
2-9
0.17
0.
00-0
.2
I I .
26
0. l-
h 0.
46
O.4
1-0.
55
2.31
4.
3-6
0.53
0.
45-0
.64
5.56
4.
5-6
0.19
0.
04&
0.77
I .
89
0. I
-8
0. I
3 0.
0%0.
24
I .27
0.
2-7
0.35
0.
29-0
.41
7.96
6.
2-10
0.
46
0.38
-0.5
5 7.
72
6.5-
9
0.21
O
.OO
- I .
04
2.04
0.
1-s
0.1s
0.
00-0
.43
0.99
0.
3-5
0.25
0.
12~0
.38
6.70
5.
5-9
0.54
0.
4 I -
0.68
9.
20
8.5P
10
0.12
o.
Ot-0
.90
3.3
I 0.
I-9
0.
15
0.00
-0.3
4 I .
34
0.4-
s
0.12
0.
00-0
.3.5
3.
0X
0.7-
s 0.
l.s
0.00
-0.0
3 0.
93
0.3-
3
1.24
0.
02-7
0.
5 I
0.04
-3
I.85
I .2-
3 1.
87
1.3-
3
1.06
0.
02-s
0.
47
0.04
&3
2.1
1.2-
3 2.
09
1.3-
3
I .O
O
0.03
-4
0.56
0.
03-3
2.
74
2. I-
3 3.
05
3.2-
5
I .22
0.
03-5
U
.53
O.O
L3
2.12
1.
8-2
1.7
I 3.
7-6
I .94
0.
04-S
I .
03
0.2-
3
2.18
0.
57-4
0.
57
0.2-
l
0.26
o.
oo-
I .3
0.1
I 0.
00-0
.5
0.48
0.
2 l-O
.6
0.46
0.
32-0
.6
0.30
O
.OO
- I .
2 0.
1 I
0.00
-0.6
0.
4 I
0.17
-0.6
0.
40
0.25
-0.5
0.30
O
.OO
- I .
2 0.
I2
0.00
~0.x
0.
67
0.13
%0.
5 0.
38
0.2
l-0.6
0.46
0.
00-3
.5
0. I
I o.
oo-
I .o
0.55
0.
4.5-
0.7
0.35
0.
30-0
.4
I .33
0.
03-4
.9
0. I
7 O
.OO
& I.
I
2.3x
0.
00-4
.9
0.05
0.
03-O
. I
I .67
0.
5 I
0.14
0.
46
I .55
0.
52
0.20
0.
68
I .60
0.
48
0.10
0.
03
1.80
0.
49
0.01
0.
00
I .oo
0.
73
0.0-
8.7
0.0-
2.9
0.0-
0.2
0.0-
0.6
0.0-
9.0
0.0&
2.0
0.0-
0.4
0.3-
1.0
0s
I I .8
0.
0-2.
0 0.
0-O
. I
0.0-
0.03
0.0-
9.9
0.2-
1.3
0.0-
0.0
I 0.
0-0.
0
0.0-
3.4
0.3-
1.
3
5.7
2.7
7.7
x.2
3.3-
19
0.8~
10
6.8-
9 s.9
- 13
5.9
2.4-
I6
2.
6 0.
7-9
8.5
4s
12
9.3
6.5-
13
EF (
54)
GS
(SE)
su
s (2
) ss
(2
)
30-4
s 5.
0 I .
4-
I6
2.6
0.9-
9 I I
..5
X.2
-15
12.6
9.
2-16
EF (
42)
GS
(42)
su
s (2
) ss
(2
)
45-6
0 s.7
1.
1-14
2.
3 0.
9-10
9.
6 6.
7-12
14
.x
12.3
-16
EF (
25)
GS
(25)
60
-75
7.7
1.6-
I I
3.
5 O
.Y-I
O
EF (
14)
GS
(18)
75
-90
0.16
0.
0-0.
3 8.
5 2.
4-9
0.67
0.
3-0.
9 2.
4 0,
s I I
EF:
Equa
toria
l Fo
rest
. C
S:
Gui
nea
Sava
nna.
Su
S:
Suda
n Su
wnn
a.
SS:
Sahe
l Sa
vann
a.
Num
ber
of s
ampl
es
in p
aren
thes
es.

R.N. Issaka et al./Geodem 75 (1997) 99-116 107
The distribution of soil pH of West Africa (WA) inland valleys shows that most values range between low (5.0) to moderate (5.0-6.0) with only about 5% of the samples showing values above 6. IVs in the Equatorial forest (EF) zone showed similar soil pH distribution as WA (low to moderate); areas with exceptionally high rainfall (Sierra Leone and Liberia) were particularly low in soil pH. Soil pH values for southwestern Nigeria, Mali and Benin were moderately high while those of C8te d’Ivoire and Ghana ranged from low to high ( > 6.0). However, most of the soils showed moderate values, especially in C&e d’Ivoire. In Guinea and central Nigeria, more than 50% of the samples had moderate values while the rest of the samples showed low values, this trend was almost similar in southeastern Nigeria, In Burkina Faso soil pH was generally low but high for Niger and Senegal. Distribution of soil pH for Guinea savanna (GS) zone was similar to that of EF zone. For the drier zones (Sudan and Sahel savanna) soil pH was moderately high.
3.2. Exchangeable Acidity (EA)
Mean EA was relatively very high (1.67 cmol( + ) kg- ‘1 for EF but low { < 0.7 cmol( + > kg- ‘} for the savanna zones (Tables 4 and 5).
Exchangeable acidity was particularly high { > 1.12 cmol( + > kg-‘) in EF zone concentrated mostly in Guinea, Sierra Leone, Liberia and southeastern Nigeria, i.e. within the area with typic udic soil moisture regimes (Van Wambeke, 1982). Burkina Faso, parts of Mali and central Nigeria showed moderate values. The distribution of exchangeable acidity showed an opposite trend to that of soil pH.
3.3. Effective Cation Exchange Capacit?/ (ECEC)
Except for GS zone which had low (2.66 cmol(+) kg-‘} values of ECEC, all the climatic zones {EF, 5.72 cmol(+) kg-‘; SuS, 7.66 cmol( +> kg-‘) and SS, 8.24 cmol( +> kg-‘) had relatively high ECEC values (Tables 4 and 5).
Table 5 Partitioning of selected soil properties into low, moderate and high values
Soil property Low ;’ Moderate a High a
Soil pH f I : 2.5 Hz01 < 5.0 Exchangeable cations [cmoh + lkg- ‘1
Acidity < 0.70 Potassium < 0.20 Calcium < 1.43 ECEC < 3.40
Bray No. 1 P (mg kg-’ 1 < 3.00 Total nitrogen (g kg- ’ ) < 0.88 Total elemental oxides (g kg- ’ )
K,O < 6.66 CaO < 2.44
PZO, < 0.61
5.0-6.0
0.70-1.12 > 1.12 0.20-0.30 > 0.30 1.43-2.35 > 2.35 3.40-5.00 > 5.00 3.00-5.00 > 5.00 0.88-1.34 > 1.34
6.66-12.52 > 12.52 2.44-4.50 > 4.50 0.61-1.05 > 1.05
> 6.0
a Low: < Mean - 0.52SD. Moderate: Mean f 0.25SD. High: > Mean + 0.25SD

R.N. Issuku et cd. / Geodermn 75 ( 19971 9% I I6
Fig. 2. Distribution of total nitrogen (g kg- ’ ) of inland valleys of West Africa
The distribution of ECEC for inland valleys of West Africa is presented in Fig. 1. Effective CEC was lowest for IVs in the GS zone where most sites showed low (< 3.4 cmol(+) kg- ‘) values. In the EF zone, most sites show moderate (3.4-5.0 cmol(+) kg-‘} to high (> 5.0 cmol( +) kg-‘} ECEC values. Generally, C&e d’lvoire, southern Ghana, southern Nigeria, Burkina Faso, Guinea and northern Sierra Leone gave moder- ate to high values. ECEC for southern Liberia was moderate. Comparatively, the GS zone was most depleted of exchangeable cations.
3.4. Total nitrogen
Except for EF (1.66 g kgg’) which showed high values in total N all the savanna zones were low ( < 0.88 mg kg- ’ > in this element (Fig. 2).
Table 6
Correlation coefficient (r) relating various soil parameters of IVs of West Africa
Exch. potassium Exch. calcium
Exch. magnesium
Avail. phosphorus Exch. bases ECEC
Nitrogen
Total
K,O
0.114 0.039
0.143 _ 0.270 ’ 0.102 0.070
0.102
Total Total
CaO MgO
0.056 0.903 _ - ^ 0.708 1 * * 0.322 ’ 0.856 + 0.873 * ^
0.059
0.042 0.059 0.730 0.024 0.643 ~ ’ 0.015
0.410 * 0.018
0.625 0.026 0.727 ’ 0.021 0.119 0.035
Total Exch.
PLO, bases
0.856 .
0.997 0.988
0.325999
0.985 * 0.149 a
ECEC Total carbon
0.161 ’ 0.142 * 0.991 ’ I 0.260 A *
0.926 * ‘ . 0.234 . ’
0.388 *“* 0.177 ^ 0.985 0.204 _ I
_ 0.243 * 1 0.158 * 0.789 ’ I
I _I RAI
. 1 Significant at P < 0.05, 0.01 and 0.001 respectively. Exchangeable bases: (Ca + Mg + K).

R.N. Issaka et al./Geodem 75 (19971 99-116 109
The distribution pattern of total carbon was quite similar to that of total nitrogen, correlation between these two elements was highly significant (Table 61. Total nitrogen was high ( > 1.43 g kg-’ > in most sites in the EF zone. A drastic fall in total N in the savanna zones was noted; apart from Burkina Faso and Mali (DjennC) which showed moderate (0.88-1.43 g kg-‘) values, all other sites were low (< 0.88 g kg-‘) in total nitrogen.
3.5. Acailable phosphorus
Mean topsoil values showed that all the savanna zones were low (GS, 2.9 mg kg-‘; SuS, 2.6 mg kg-’ and SS, mg kg- ’ ) in available P (Tables 4 and 5; Fig. 3). Available P was relatively high (5.3 mg kg- ’ ) in EF.
The drier zones were particularly low ( < 3 mg kg ’ ) in available phosphorus except for northern Senegal and Niger which showed moderate (3-5 mg kg-‘) values. Available phosphorus in IVs of the GS zone ranged from low to high; parts of central Nigeria and northern Ghana showed high values. IVs in the EF zone were relatively richer in available phosphorus. Apart from Liberia which was particularly low in available phosphorus, most countries seem to have moderate amounts of this nutrient. Southwestern Nigeria and Ghana were particularly high in available phosphorus.
3.6. Total P,O,
In Guinea, values of total P205 ranged from low ( < 0.61 g kg-‘) to high (> 1.05 g kg-‘) and about 70% of the sites gave high values. Western C&e d’Ivoire was high in
SAHARA DESERT
0 km
ATLANTIC 0 I.ow cl O&m0 ?SSlJ)
0 Moderdr. 3-s @&%3rwo~SD)
. Hsh >J (>Meleen+O ?.=s”)
Fig. 3. Distribution of available phosphorus (mg kg- ’ ) of inland valleys of West Africa.
110 R.N. lssaku et ul. / Geodemu 75 C 1997) 9% I16
total PzO, while the rest of the country gave low to moderate (0.61-I .05 g kg~-’ ) values. In southern Ghana, total P,O, was moderately high but low for the northern sector. Total P,O, for both central and southeastern Nigeria ranged from low to high. Apart from few areas that gave moderate to high total P,O,. values were generally low in Nigeria. Total P205 was moderate in Mali. EF zones seems to be slightly superior in total P,O,. There was no significant correlation between total P,O, and available P (Table 6).
3.7. Exchangeable potassium
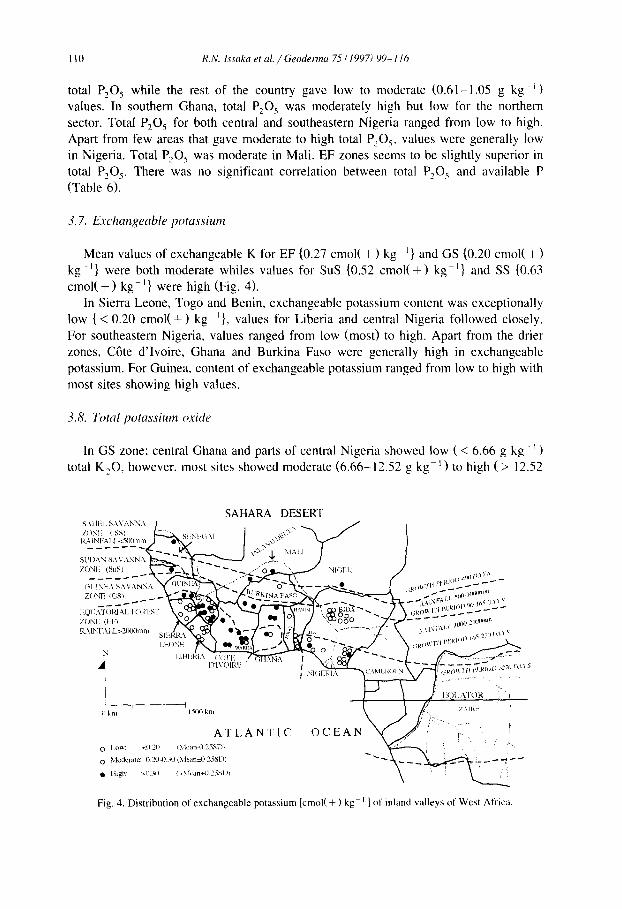
Mean values of exchangeable K for EF (0.27 cmol( + ) kg ‘1 and GS IO.20 cmol( + ) kg-‘} were both moderate whiles values for SuS (0.52 cmol(+) kg-‘} and SS (0.63 cmol( + ) kg-‘} were high (Fig. 4).
In Sierra Leone, Togo and Benin, exchangeable potassium content was exceptionally low { < 0.20 cmol(+) kg-‘), values for Liberia and central Nigeria followed closely. For southeastern Nigeria, values ranged from low (most) to high. Apart from the drier zones, C8te d’Ivoire, Ghana and Burkina Faso were generally high in exchangeable potassium. For Guinea, content of exchangeable potassium ranged from low to high with most sites showing high values.
3.8. Total potassium oxide
In GS zone; central Ghana and parts of central Nigeria showed low ( < 6.66 g kg ’ ) total K,O, however, most sites showed moderate (6.66-12.52 g kgg’) to high (> 12.52

R.N. lssaka et al./Geodema 75 (1997) 99-116 III
kg-’ 1 values which was similar to that of the drier zones (Mali). In Sierra Leone total K,O was moderate but ranged from low to high in Guinea and southern Ghana. Values for most parts of C&e d’Ivoire were moderate but high in the eastern part. Most sites in southeastern Nigeria were relatively low with the central part moderately high in total K,O. The distribution of total K,O showed no particular trend among the four agroclimatic zones. As shown in Table 6, almost no correlation was recognized between total K,O and exchangeable K.
3.9. Exchangeable calcium
Exchangeable Ca was relatively very high for SuS (4.67 cmol( + > kg-‘) and SS (4.82 cmol( + 1 kg- ‘}, moderate for EF I2.28 cmol( + ) kg-‘) and low for GS { 1.33 cmol( + ) kg-‘} Tables 4 and 5.
In the EF zone, about 50% of the sites showed low values while the rest ranged from moderate to high. In C8te d’Ivoire and southwestern Nigeria, exchangeable calcium was generally high, moderate in Ghana, Benin and Togo. More than 50% of the samples from Guinea had low values while the rest had values ranging from moderate to high; this was similar to what was observed in southeastern Nigeria where most samples showed low values except for Bende where 50% of the samples gave high values. For Sierra Leone, Liberia and central Nigeria values were generally low.
3.10. Calcium oxide
Most parts of C&e d’Ivoire were high ( > 4.50 g kg-’ > in total CaO. In Sierra Leone, total CaO was moderate (2.44-4.50 g kg-‘) and ranged from low (< 2.44 g kg-‘) to high in Guinea. Northern and part of southern Ghana were high in total CaO while central Ghana showed low content of total CaO. Southeastern Nigeria was generally low (moderate in Bende) but moderate in the central part. Total CaO ranged from moderate to high in Mali. In contrast to potassium, Table 6, correlation between total CaO and exchangeable Ca was significantly high.
4. Discussion
4. I. Soil characteristics in comparison with tropical Asia and tropical America
Prolonged weathering and leaching of soils of IVs of West Africa may account for the low total elemental basic-oxides of these soils. Comparatively, the geological formations of tropical Asia are more recent, and therefore are richer in these total elemental basic oxides. Higher clay content of lowland soils of tropical Asia also explains why these soils were higher in Fe,O, and Al,O,. Higher CEC and more recent and richer geological formation accounted for the relatively more fertile soils of tropical Asia (Tables 1 and 2). Sawah-based rice farming practices that enhance the deposition of finer materials in lowland soils of tropical Asia might have improved the fertility of these soils or at least maintained them.
II2 R.N. Isvaku et (11. / Geoderma 75 C 1997) 9% II6
Oxisols are extremely weathered soils with ultisols next in severity and accounted for the genera1 lower total CaO, K20, MgO and P,O, for tropical America (Table 2). However, very high colloidal activity (extremely high organic matter: higher precipita- tion resulting in richer primary production) allowed for the retention of most of the cations released through weathering. High ECEC coupled with relative high amounts of cations, phosphorus and nitrogen released during the decomposition of this high organic matter may explain why these soils are relatively more fertile than IVs of West Africa (Table 1).
4.2. Distribution @exchangeable cations and total elemental oxides in equatorial ,fiwest zone
Both geology and climate to a large extent and anthropogenic factors to some extent affected the soil fertility characteristics in the IVs of West Africa. The oldest geological formation of Precambrian granite is found in the southwestern part of Liberia, Sierra Leone and a small part of Guinea (UNESCO, 1983). These areas, together with southeastern Nigeria, lie within the zone of dry tropudic and typic udic soil moisture regimes. Soil pH and exchangeable basic cations for most sites within these areas were low, serious depletion of these nutrients was particularly severe in Sierra Leone and Liberia. This serious depletion was by implication due to both geology and climate, oldest geological formation coupled with heavy rainfall resulted in prolonged weathering and leaching in these areas and accounted for the relatively low exchangeable basic cations, a high exchangeable acidity, and hence low soil pH.
Within this area of very old geological formation some very fertile soils were found. In parts of Guinea, the presence of both intrusive and extrusive basic rocks resulted in base-rich soils. The relatively high values of K20 (15.6 g kg-’ 1, MgO (8.3 g kg-’ ) and CaO (3.5 g kgg ’ > in Koumeli are an indication of the presence of these basic rocks. High exchangeable potassium, and moderate values of exchangeable magnesium and calcium are indicative of the presence of base rich geological materials. The relatively high cation exchange capacity of these soils is related to the relatively high organic matter content. High ECEC of these soils made it possible for them to retain the cations released from weathering.
Total basic oxides for samples from Sierra Leone were moderate but exchangeable bases were generally low except in parts of Falaba where high values of exchangeable calcium and magnesium were observed. Despite relatively high organic matter content of these areas, the very high rainfall was effective in leaching most of these basic cations. Similar low fertile soils in areas with typic udic soil moisture regime were reported by Kyuma et al. (1986). According to them, wetland soils with typic udic soil moisture regime (Sierra Leone and Liberia) were strongly acid.
In the remaining parts of the southern sector (Equatorial forest), the soil moisture regime is udic and the predominant Precambrian granite is less than 2900 million years old (UNESCO, 1983), hence these parts were relatively richer in exchangeable basic cations and soil pH was moderately high. In C&e d’Ivoire, total CaO was mostly high while K20 was moderate, rejuvenation and the presence of basic rocks may also account for these observations. This influence of geology was again observed in the high

R.N. lssaka et al./Geodenna 75 (1997) 99-116 113
content of total K,O (18.4 g kg-‘), CaO (7.4 g kg-‘) and MgO (5.2 g kg-‘) in Touba (western Gate d’Ivoire). Relatively high organic matter content and hence high effective cation exchange capacity of these soils resulted in their relatively high soil fertility properties. Rejuvenation in parts of Ghana coupled with relatively high colloidal activity also explained why some of these soils are fertile. Samples from southwestern Nigeria were not available for total chemical analysis, however, from the general high soil fertility status of these soils and the fact that this area lies within the zone of rejuvenation, it can be inferred that rejuvenation to some extent affected their fertility status.
Base-rich sediments, Tertiary-Quatemary, relating to volcanic activities around the border between southeastern Nigeria and Cameroun may account for the presence of soils rich in basic cations. High ECEC and exchangeable bases particularly for Bende transects 1 and 2 was due to vermiculite and/or smectite clay minerals (Oyediran, 1990).
4.3. Distribution of exchangeable cations and total elemental oxides in Guinea Savanna Zone
In the middle belt (Guinea savanna) geological formation is predominantly Precam- brian granite with some recent alluvial deposition and rejuvenation (UNESCO, 1983). Rainfall is intermediate between that of the northern and the southern sectors. Exchange- able basic cations were comparatively lower than the other two sectors. However, soil pH was comparable to that of the southern sector due to low exchangeable acidity of these soils. Although most part of central Nigeria (Bida) lie within the zone of Mesozoic nupe sandstone, total K,O and CaO of most sites ranged between moderate to high. However, exchangeable bases for these sites in northern Nigeria were generally low due to low activity (kaolinite) clay (Oyediran, 1990). very low organic matter content and the sandy nature of most of these soils resulted in very low cation exchange capacity. Most basic cations released through weathering were therefore easily leached hence the low exchangeable bases of these soils.
The effect of organic matter in increasing the CEC of these soils was reported by Oyediran, 1990, who observed a positive correlation between organic matter and CEC in this area. Kadebe and Benjaminsen (1976) also reported that 56-83% of the variations in the CEC of tropical soils was due to organic matter. This general effect of organic matter in increasing the soils ability to retain cations was further supported by Brady, 1990, who stated that on weight to weight basis, organic matter is most effective in retaining cations as against any form of clay. These reports were further supported by the positive correlation between total carbon and ECEC observed in this study (Table 6), positive correlation between ECEC and exchangeable bases (Ca + Mg + K) was also observed.
The geology of northern Ghana (Tono) on the other hand is recent alluvial deposits, total basic oxides and exchangeable cations were high. Addition of basic cations through irrigation water (area is under sawah-based rice farming) might have improved or partly helped to maintain this high levels of exchangeable bases.
Total basic oxides for central (Nyankpala) Ghana was low even though the area is within the zone of recent sedimentation, this may be due to the sandy nature of these

114 R.N. Issuh et al. / Geodermu 75 t 1997) 99-i 16
soils (> 90% SiO,). However, exchangeable potassium for this site was high and low to moderate in exchangeable calcium. This area is under intensive rice cultivation, high levels of exchangeable potassium might have resulted from annual application of fertilizer (N : P: K). Such cultural practices may account for the non-significance of correlation coefficient (r) between exchangeable potassium and total K20 and between available phosphorus and total P,O, (Table 6). The absence of extensive base rich sediments, rejuvenation and intrusive basic rocks in this zone may explain why most of these soils are poor in exchangeable basic cations. Organic matter content that may enhance the retention of these cations is respectively low, hence leaching is relatively effective.
4.4. Distribution of exchangeable cations and total elemental oxides in Sudan and Sahel Savanna Zone
Exchangeable basic cations and soil pH were relatively high for the drier zones (Northern sector). Geological formation is predominantly recent sedimentation, 600- 1000 million years. The presence of basic rocks (Cambrian calcareous schist), UN- ESCO, 1983, together with the relatively low rainfall of this area, may most likely account for the relatively rich IVs (high exchangeable basic cations). Annual addition of base-rich harmattan dust (Moberg et al., 199 1; Moberg and Esu, 199 1) might also have partly contributed to the formation of fertile soils in this region. Leaching was comparatively low due to the low rainfall of this area, this resulted in the low exchangeable acidity observed. High content of CaO (4.0 g kg- ’ >, MgO (7.4 g kg- ’ ) and very high K,O (24.3 g kg- ’ ) in Dagon (Mali) is an indication of the presence of base-rich alluvial sediments.
4.5. Distribution of available and totul phosphorus
Although the mean value of available P in the topsoil of EF was relatively high (Tables I and 2) due to the effect of vegetation, the distribution of available phosphorus seems to be affected mostly by geology and anthropogenic factors and by climate to a lesser extent. Some areas with high total phosphorus, for example, Guinea, southern Ghana and parts of central Nigeria also show high available phosphorus content. Certain areas with low total phosphorus (e.g. northern and central Ghana, parts of central Nigeria and parts of WARDA: Experimental station of West Africa Rice Development Association, Mbe plain) showed high content of available phosphorus. These areas are under active rice cultivation, the constant use of N : P : K and other phosphorus fertilizers may account for the observed trend. Apart from fixation and uptake by plants, lost of phosphorus through leaching is generally minimal. Serious fixation of phosphorus may also account for low available phosphorus at certain sites despite high total phosphorus at those sites; very high exchangeable acidity at these sites might be the reason. In addition to fixation, cultural practices that enhance the availability of phosphorus may explain the lack of significance (Table 6) between available phosphorus and total P20,.
4.6. Distribution of total nitrogen
The distribution of total nitrogen was largely affected by climate and vegetation. Areas with higher rainfall had high capacity to carry more biomass (Brady, 1990) and
R.N. lssaka et al. / Geoderma 75 (I9971 99-l 16 115
hence had higher total nitrogen. Most sites in EF zone were high in total nitrogen (Fig. 2). Total nitrogen for both GS and the drier zones were low. While it can be argued that rainfall is too low in the drier zones, the same reason can not hold for the GS zone. Rainfall is high enough to bring about a significant increase in organic matter and hence total nitrogen. A perpetual annual burning of vegetation for other reasons other than farming is a common practice (Jones and Wild, 1975; Pieri, 1992), also most farming practices include the gathering and burning of plant residues, these may partly account for the general low total nitrogen in GS. As shown in Tables 1 and 2, soils in GS showed the lowest soil fertility properties: sandy, low ECEC and low exchangeable bases. This might have resulted in poorer vegetation hence amount of biomass returned to the soil is relatively low.
Acknowledgements
Part of this work was supported by the international cooperation program of Japan Society for the Promotion of Sciences and by the Grant-in-Aid for international Scientific research program, field research (Leader, Prof. S. Hirose), Ministry of Education, Science and culture, Japan, to which the authors are very grateful. Our deepest appreciation goes to the International Institute of Tropical Agriculture (IITA), West Africa Rice Development Association (WARDA) and Japan International Cooper- ation Agency (JICA), for providing the necessary support for soil sampling and laboratory analysis.
References
Andriesse, W.. 1986. Area and distribution. In: A.S.R. Juo and J.A. Lowe (Editors), The Wetlands and Rice in Sub-Saharan Africa. IITA, Ibadan, pp. 1.5-30.
Brady, 1990. The Nature and Properties of Soils. Macmillan Publishing Company. New York, pp. 177- I88 and 279-300.
Bray, R.H. and Kurtz, L.T., 1945. Determination of total, organic and available forms of phosphorus in soils. Soil Sci., 59: 39-45.
Bremner, J.M., 1965. Total nitrogen. In: C.A. Black, D.D. Evans, J.L. White. L.E. Ensminger and F.E. Clark (Editors), Methods of Soil Analysis (Number 9 Part 2). Am. Sot. of Agron. Inc., Soil Sci. Sot. Am., Madison, WI, pp. 1149-l 179.
IITA, 1979. Selected Methods for Soil and Plant Analysis. Manual Series No. I. IITA, Ibadan (Nigeria), 3 pp. Issaka, R.N., Masunaga, T. and Wakatsuki, T.. 1996. Soils of Inland Valleys (IVs) of West Africa: General
soil fertility parameters. Soil Sci. Plant Nutr., 42: 7 I-80. Jones, M.J. and Wild, A., 1975. Soils of the West Africa Savanna. Tech. Commun. No. 55, CAB International,
Wallingford, 246 pp. Kadebe. 0. and Benjaminsen, J.N., 1976. Contribution of organic matter and clay to the CEC of soils in the
Savanna zone of Nigeria. Commun. Soil Sci. Plant Anal., 7(2): l29- 144. Kawaguchi, K. and Kyuma, K., 1977. Paddy Soils of Tropical Asia. The University Press, Honolulu, Hawaii,
pp. 72-90. Kyuma, K. and Wakatsuki, T. 1995: Ecological and economic sustainability of paddy rice system in Asia, In:
A.S.R. Juo and R.D. Freed (Editors), Agriculture and Environment: Bridging Food Production and Environmental Protection in Developing Countries. ASA Special Publication No. 60, pp. I39- 159.

116 R.N. lssaka rt al. / Groderma 75 C 19971 YY- 1 I6
Kyuma. K., Kosaki, T. and Juo, A.S.R.. 1986. Evaluation of the fertility of the soils. In: A.S.R. Juo and J.A. Lowe (Editors), The Wetlands and Rice in Sub-Saharan Africa. IITA, Ibadan, pp. 43-58.
Mclean, E.O.. 1965. Aluminum. In: C.A. Black, D.D. Evans, J.L. White. L.E. Ensminger and F.E. Clark (Editors), Methods of Soil Analysis (Number 9 Part 2), Am. Sot. of Agron. Inc., Soil Sci. Sec. Am.. Madison, WI, pp. 97X-998.
Mclean. E.O., 1982. Soil pH and lime requirement, In: A.L. Page, R.H. Miller and D.R. Keeney (Editors), Methods of Soil Analysis (Number 9 Part 2), Am. Sot. of Agron. Inc.. Soil Sci. Sot. Am.. Madison, WI, pp. 199-224.
Moberg, J.P. and Esu. I.E.. 1991. Characteristics and composition of some soils in Northern Nigeria. Geoderma, 48: 113- 129.
Moberg, J.P.. Esu, I.E. and Malgwi, W. B., 1991. Characteristics and constituent composition of Harmattan dust falling in Northern Nigeria. Geoderma, 48: 73-7X.
Moormann. F.R. and Juo, A.S.R., 1986. Present land use and cropping system in Africa. A.S.R. Juo and J.A. Lowe (Editors), The Wetlands and Rice in Sub-Saharan Africa. IITA. Ibadan. pp. 187- 194.
Nelson, D.W. and Sommers, L.E., 1982. Total carbon, organic carbon and organic matter. In: A.L. Page. R.H. Miller and D.R. Keeney (Editors). Methods of Soil Analysis (Number 9 Part 2). Am. Sot. of Agron. Inc.. Soil Sci. Sot. Am., Madison, WI. pp. 552-553.
Okigbo, B.N.. 1990. Sustainable agricultural system in Tropical Africa. In: C.A. Edwards, R. Lal, P. Madden. R.H. Miller and G. House (Editors), Sustainable Agricultural System. Soil and Water Conservation Society, pp. 323-352.
Olsen. S.R. and Sommers. L.E. 1982. Phosphorus. In: A.L. Page, R.H. Miller and D.R. Keeney (Editors). Methods of Soil Analysis (Number Y Part 2), Am. Sot. of Agron. Inc.. Soil Sci. Sot. Am., Madison. WI, pp. 403-427.
Oyediran, G.O., 1990. Genesis, Classification and Potential Productivity of Selected Wetland Soils in the Savanna Ecosystem of Nigeria. Ph.D. Thesis, Obafemi Awolowo University. Faculty of Agriculture. University of ILE-IFE, I 16 pp. and pp. 140-158.
Pieri, C.J.M.G., 1992. Fertility of soils: a future for farming in West Africa. Springer Verlag. Berlin. pp. 348. Tanaka, A., Sakuma, T., Okagdwa, N.. Imai, H., Ito, K., Ogata. S. and Yamaguchi, J., 1986. Agro-Ecological
Condition of The Oxisol-Ultisol Area of The Amazon River System. Faculty of Agriculture, Hokkaido University, pp. 6 l-69.
Thomas, G.W., 1982. Exchangeable cations. In: A.L. Page. R.H. Miller and D.R. Keeney (Editors), Methods of Soil Analysis (Number 9 Part 2). Am. Sot. of Agron. Inc.. Soil Sci. Sot. Am., Madison, WI, pp. 159-164.
Uchidd, H., Uchida, T. and Iida, C.. 1979:, Determination of major and minor elements in silicate by Inductive Coupled Plasma Emission Spectrometry. Anal. Chim. Acta, 108: 87-92.
Udo, R.K., 1985. A Comprehensive Geography of West Africa. Heinemann Educational Books (Nigeria) Ltd., Ibadan, pp. 10-23.
UNESCO, 1983. Geological World Atlas 1 : 10,000,000, map sheet No. 6. UNESCO. Paris. Van Wambeke, A., 1982. Calculated Soil Moisture and Temperature Regimes of Africa. SSMS Technical
Monograph No. 3, 17 pp. Wakatsuki. T., 1994. Global environmental problems and agricultural production in West Africa. In: Rice
culture in West African manual for Technical cooperation. Japan Agricultural Development and Extension Association, Tokyo. pp. l-52 and 81-123 (in Japanese).
Wakatsuki, T., Kosaki, T. and Palada, M., 1989. Sawah for sustainable rice farming in Inland Valley Swamps (IVSs) in West Africa, Paper presented at the second WAFSRN Symposium, Accra.
Walkley, A. and Black, I.A., 1934. An examination of the 1 method for determining soil organic matter and proposed modification of the chronic acid titration method. Soil Sci., 37: 29-38.
Windmeijer, P.N. and Andriesse, W., 1993. Inland Valleys in West Africa: An Agro-Ecological Chardcteriza- tion of Rice-Growing Environment. ILRI, Wageningen, pp. 59-68.