functional and structural flexible pavement...
TRANSCRIPT
292 TRANSPORTA TJON RESEARCH RECORD 1215
Functional and Structural Flexible Pavement Overlay o ·esign for Indiana To Overcome a Deficiency in the 1986 AASHTO Guide
JAY K. LINDLY AND THOMAS D. WHITE
A procedure for designing the thickness of asphaltic concrete overlays of flexible pavements in Indiana was developed. In analyzing the research data collected, a deficiency in the 1986 AASHTO Guide became apparent: the overlay design procedure addresses only structural overlays and ignores functional overlays. Many miles of asphalt pavement in Indiana are overlaid for functional rather than for structural reasons. The research included testing on 30 flexible pavement test sections statistically selected to be representative of flexible pavements in Indiana. Two approaches were taken: an empirical approach that calculates the overlay thickness required to provide functional performance (ride quality) over the life of the pavement and a structural overlay method. Flexible overlay design Method 2 of the 1986 AASHTO Guide for the Design of Pavement Structures was selected for structural capacity design. Method 2 uses nondestructive test (NDT) deflection data to calculate overlay thickness. If found, a negative value for overlay thickness indicates that sufficient structural capacity is present without adding an overlay. The functional performance approach used Indiana flexible pavement historical data to produce a regression equation relating overlay thickness to anticipated future traffic, overlay design life, pavement condition at design life end, and CBR. Simultaneous use of the two design methods was recommended to IDOH.
In 1985, Purdue University was asked by the Indiana Department of Highways (IDOH) to perform a Highway Planning and Research (HPR) Part II study titled "Development of an Overlay Design Procedure for Flexible Pavements in Indiana." Currently, the IDOH is using an overlay thickness design based on the AASHTO Interim Guide for the Design of Flexible Pavement Structures(!). A typical overlay design involves calculating several overlay thicknesses that vary depending on the magnitude of the layer coefficient assigned to the existing pavement layers. One recent design example provided possible overlay thicknesses ranging from 0.5 in. to 4.25 in.; the designer was required to select a design thickness within that range.
The first step of the study was to conduct a survey of the Federal-Aid Primary (FAP) roads in Indiana. As a result of this survey, approximately 3,180 lane-miles of flexible pavement (no Portland cement concrete) were identified. That
J. K. Lindly, Civil Engineering Department, University of Alabama, P.O. Box 870205, Tuscaloosa, Al. 35487-0205. T. D. White, School of Civil Engineering, Purdue University, West Lafayette, Ind. 47907.
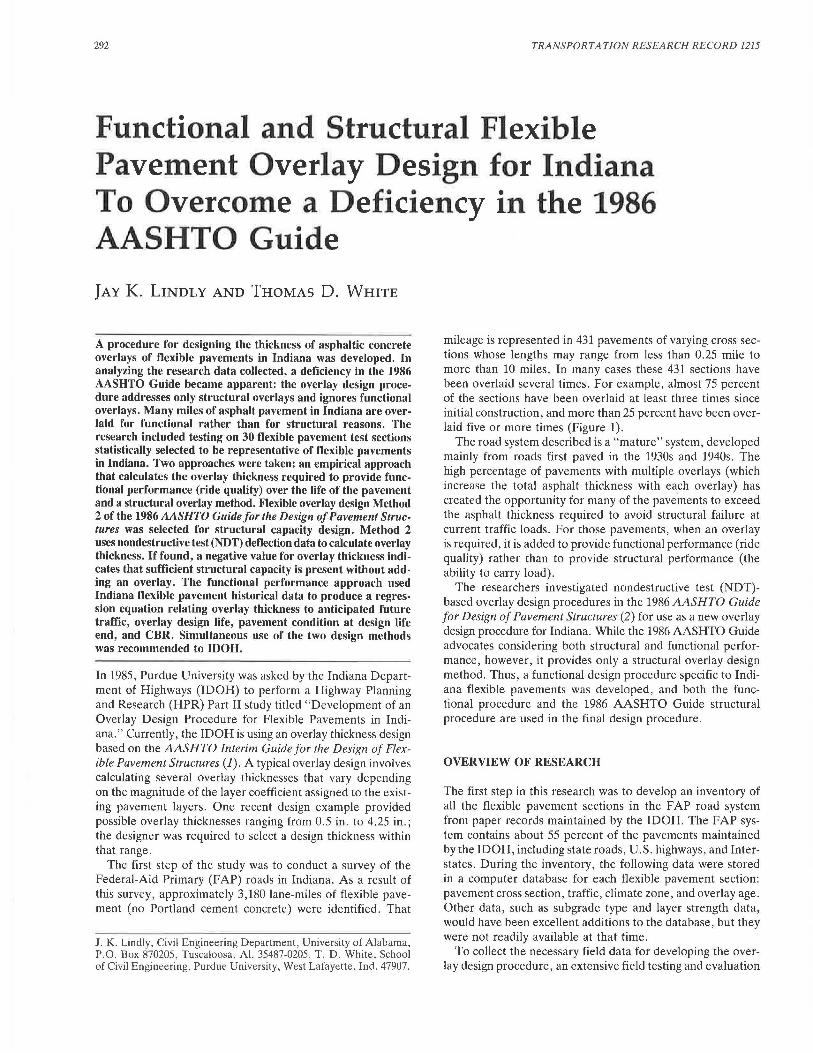
mileage is represented in 431 pavements of varying cross sections whose lengths may range from less than 0.25 mile to more than 10 miles. In many cases these 431 sections have been overlaid several times. For example, almost 75 percent of the sections have been overlaid at least three times since initial construction, and more than 25 percent have been overlaid five or more times (Figure 1).
The road system described is a "mature" system, developed mainly from roads first paved in the 1930s and 1940s. The high percentage of pavements with multiple overlays (which increase the total asphalt thickness with each overlay) has created the opportunity for many of the pavements to exceed the asphalt thickness required to avoid structural failure at current traffic loads. For those pavements, when an overlay is required, it is added to provide functional performance (ride quality) rather than to provide structural performance (the ability to carry load).
The researchers investigated nondestructive test (NDT)based overlay design procedures in the 1986 AASHTO Guide for Design of Pavement Structures (2) for use as a new overlay design procedure for Indiana. While the 1986 AASHTO Guide advocates considering both structural and functional performance, however, it provides only a structural overlay design method. Thus, a functional design procedure specific to Indiana flexible pavements was developed, and both the functional procedure and the 1986 AASHTO Guide structural procedure are used in the final design procedure.
OVERVIEW OF RESEARCH
The first step in this research was to develop an inventory of all the flexible pavement sections in the FAP road system from paper records maintained by the IDOH. The FAP system contains about 55 percent of the pavements maintained by the IDOH, including state roads, U.S. highways, and Interstates. During the inventory, the following data were stored in a computer database for each flexible pavement section: pavement cross section, traffic, climate zone, and overlay age. Other data, such as subgrade type and layer strength data, would have been excellent additions to the database, but they were not readily available at that time.
To collect the necessary field data for developing the overlay design procedure, an extensive field testing and evaluation
Lindley and White
100
(/} 80 !z
w ::? 60 w ~ a_ 40 LL 0 20 ~ 0
0 1 2 3 4 5
NUMBER OF OVERLA VS
FIGURE 1 Overlays on Indiana flexible pavements.
program was planned. A statistically based design of experiment reduces the number of pavements that must be field tested while maintaining the significance of the results. Thus, statistical design of experiment techniques was used to select thirty 1,250-ft-long pavement test sections that were representative of the FAP flexible pavement sections throughout the state.
The first part of test section selection and experiment design was to choose factors that most affect overlay life. Test sections were then chosen that represent the range of variability of these factors. The following four factors were selected from the available computer database:
1. Most recent overlay thickness; 2. Thickness of asphalt beneath most recent overlay; 3. Traffic to which the most recent overlay has been sub
jected; and 4. Climate zone location of the sections: based on previous
research, a north zone and a south zone have been identified in Indiana.
In each climate zone, a three-factor, three-level composite design was developed that contained low, medium, and high levels of the other three factors. The composite design required 15 test sections in both climate zones, for a total of 30 test sections.
Values for pavement serviceability index (PSI) were obtained for each test section from the IDOH, and the researchers calculated values for pavement condition index (PCI) based on a field survey of the types, severities, and extents of surface distresses ( 3).
The IDOH Division of Materials and Tests obtained one sample of subgrade material in each of the 1,250-ft-long test sections. After coring through the asphalt layers and the subbase, 4 ft of 3-in.-diameter Shelby tube was pushed. The resulting subgrade samples were tested by AASHTO standards for liquid limit, plastic limit, density, moisture content, and particle size distribution. From these data, the subgrades were classified by the AASHTO and Unified soil classification systems and assigned estimated CBR values from published tables ( 4). The limited soils investigation was dictated by financial and time considerations.
Nondestructive testing (NDT) was conducted in both the
293
spring and fall of 1986 so that seasonal differences in NDT results could be considered. A dynamic load of approximately 14,000 lb was applied to the pavement with a Dynatest Falling Weight Deflectometer (FWD). Deflections were recorded directly beneath the load and 1, 2, 3, and 4 ft from the load. These deflections were measured at six sites in each test section. The sites were normally 120 to 180 ft apart and were located in the outside wheelpath of the outside lane. During the spring test period, each site was marked with yellow highway paint so that the exact site could be retested in the summer.
During spring testing, deflections were also taken 5 ft and 7 ft from the load at site 5. The reason these deflections were taken only at site 5 is that a manual procedure was necessary to reset two sensors at those distances to obtain deflection readings. In the summer test period, deflections 5 ft and 7 ft from the NDT load were taken at three sites within each test section: at sites 1, 3, and 5.
The spring series of test results was obtained during a 5-week period in the early spring (March 17 to April 25, 1986) when pavement deflections tend to peak because of pavement layer and subgrade thaw. Climatological data (5) from the National Oceanic and Atmospheric Administration (NOAA) indicated that the southern portion of Indiana begins spring thaw approximately 2 weeks before northern Indiana. Therefore, testing began in the south portion of the state and moved north. The summer test period was completed from August 5 to September 5, 1986.
Five-day temperature history and pavement surface temperature during testing were obtained for all NDT testing. These temperature data were utilized to normalize deflections to a common temperature.
The accumulated data were analyzed both by an empirical method (which produced the functional overlay design procedure) and by a structural overlay design method. In the empirical method, regression analysis was applied to the data to determine "what overlay thickness has worked in the past" and under what conditions. In the structural method, the NDT data were analyzed using flexible pavement overlay design Method 2 from the 1986 AASHTO Guide (2).
EMPIRICAL DATA ANALYSI8
As previously noted, both pavement serviceability index (PSI) and pavement condition index (PCI) values were determined for each test section. The condition survey results for the 10 out of 30 sections that were at or near terminal serviceability (PSI :s 2.5) showed very little significant alligator cracking (a prime indicator of structural failure). This finding indicated that functional failure, rather than structural failure, often dictates the addition of an overlay. Thus, a relationship was sought between overlay thickness and the functional life of overlays in Indiana in order to derive an overlay design for functional performance.
In the empirical data analysis (which produced the functional overlay design procedure), statistical analysis techniques were used to obtain regression relationships between the most recent overlay thickness (the dependent variable) and a variety of independent variables for the 30 flexible pavement test sections studied. Such regression relationships (equations) can be used to predict required thicknesses for
294
fu ture overlays for pavements within the factors and their levels represented by the 30 test sections. After a large number of regression analyses were performed, the most appropriate equation was selected for use in the functional overlay design procedure.
A list of the independent variables considered in the regression analyses follows:
• Climate zone of the pavement section (Indiana was divided into north and south climate zones based upon the work of Yoder and Colucci-Rios (6]);
• "Base asphalt" thickness, the asphalt thickness beneath the most recent overlay (in.);
• Truck traffic applied to the most recent overlay (trucks/ day);
• Most recent overlay age (years); • Subbase thickness (in.) (In this research, "subbase"
describes all aggregate between the bituminous layer and the subgrade);
• Equivalent asphalt thickness of base asphalt plus sub base (in.) (For this research, 3 in. of subbase was selected as the "equivalent" of 1 in. of base asphalt);
• Total pavement thickness (from top of pavement to the sub grade) (in.);
• Estimated CBR (percent); • Maximum NDT deflection reading (from "sensor O"
directly under the load) for both spring and summer (mils); • Pavement serviceability index (PSI); and • Pavement condition index (PCI).
The following regression equation was selected for empirical design:
olay = 0.7592 + 0.00145(tottrk)2 + 0.00379(age)2
where
olay tottrk
age pci
cbr =
+ 0.000162(pci)2 - 0.000429(cbr)2 (1)
calculated thickness of required, new overlay (in.); anticipated future traffic: (trucks/day) (365) (age)/ 365,000; design life of new overlay (years); desired PCI value at the end of the design life of the new overlay; and estimated subgrade CBR (percent).
The equation has been verified for the following range of design values:
• Design life of new overlay: 5-20 years; • Anticipated future daily trucks: 50-3,000; • Tottrk: less than 32.2 (Note: tottrk is future traffic defined
as (trucks/day) (365) (overlay age) /365,000. The value 32.2 is the highest value for tottrk observed in the thirty test sections. Thus, if tottrk exceeds 32.2 , the calculated overlay value may exceed the thickest overlay typically found on Indiana pavements: 3.0 in.);
• PCI: PCI is normally specified as 35, which approximates to a PSI value of 2.5 for the test sections studied in Indiana; and
• cbr: 0- 40 percent.
-z 4 -CJ) CJ) UJ z ~ g J: l-o UJ
t;
3
2
TRANSPORTATION RESEARCH RECORD 1215
m
0 UJ a: a..
1 -i-~......----t~-.-~""T"""~...---.~-.-~~
0 2 3 4
ACTUAL THICKNESS (IN.)
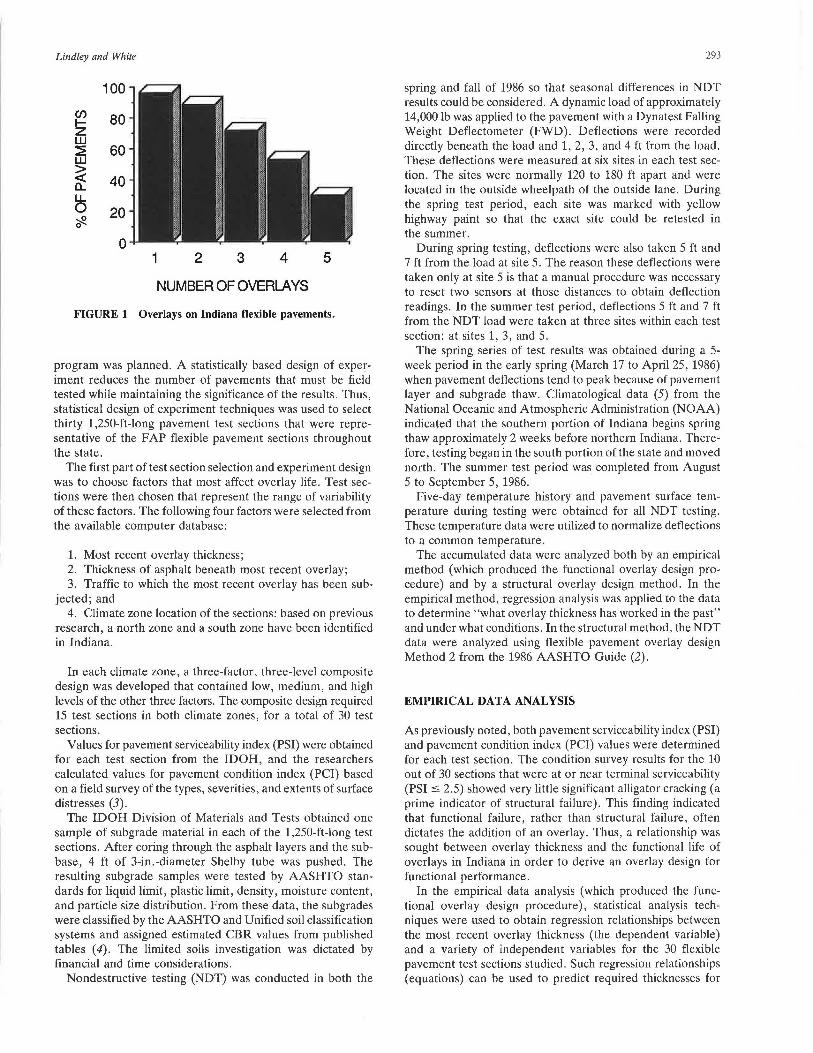
FIGURE 2 Agreement of actual with predicted values.
Figure 2 shows the degree to which Equation 1 predicts the overlay thicknesses measured from core samples taken from the 30 test sections. The coefficient of determination (r 2
) is a measure of how well a regression equation fits the observed data. The possible range of values for r 2 is 0 to 1, with 1 indicating perfect fit. The r 2 value for the regression line in Figure 2 is 0.60, which is not high. However , for field experimental work (as opposed to results from highly controlled laboratory experiments), the value is acceptable.
Regression Equation 1 predicts the mean of the distribution of overlay thickness. Most individual outcomes deviate from the mean , and the "reliability" concept accounts for the deviation . "Reliability" refers to the probability that the predicted overlay will be successful in providing acceptable service through the overlay design life. A 95 percent reliability indicates that , on the average, 95 times in 100 the predicted overlay will be successful. Equation 1 provides a 50 percent reliability.
Through the determination of confidence intervals, the computer output for Equation 1 provided the 95 percent reliability overlay thickness value for each of the test sections. For a 95 percent reliability, each value is approximately 0.9 in. thicker than the mean value calculated by Equation 1, and that value must be added to any predicted thickness from Equation 1 to achieve 95 percent reliability . Similarly, other thickness increments were calculated to reach other reliability levels, and the results are presented in Table 1.
Use of the thickness increments in Table 1 would produce some overlay thicknesses that have not been verified through previous service in Indiana . For example, consider a hightraffic pavement for which Equation 1 calculates an overlay thickness of 2. 9 in. To reach 95 percent reliability, 0. 9 in. of overlay must be added to the 2.9 in . The 3.8-in. total exceeds the typical maximum overlay thickness in Indiana of 3.0 in . Because the reliability-based design concept, as represented by the values in Table 1, is untested in Indiana, its adoption was not recommended at this time. However, the concept is one that deserves further attention.
Equation 1 was used to calculate overlay thicknesses for the 10 out of 30 pavement test sections with a PSI less than 2.7 (sections at or near minimum acceptable serviceability) . The calculations were based on a 10-year design life, a terminal PCI of 35 (the equivalent of a PSI of 2.5), estimated CBR values from soil-boring evaluations, and initial truck traffic data from 1986 with a yearly 2 percent traffic growth
Lindley and White
TABLE 1 THICKNESS INCREMENTS TO REACH RELIABILITY
Reliability (%) Thickness (in,)
95 0.9
90 0.7
85 0.6
75 0.4
factor. The results presented in Table 2 reflect expected overlay thicknesses for the input conditions. Sections F13 and V7 represent the extremes of the thickness calculations. The F13 value is less than 1 in., largely owing to the effect of a high CBR subgrade. The 2.2-in. overlay thickness value of V7 reflects the effect that higher traffic has on Equation 1.
1986 AASHTO GUIDE METHOD 2
Two NDT-based methods for designing structural overlay requirements for flexible pavements are provided in the 1986 AASHTO Guide. Method 1 relies on pavement layer modulus values backcalculated from NDT tests. However, the 1986 AASHTO Guide does not specify a method for determining backcalculated layer moduli.
Much controversy surrounds the selection and use of backcalculation routines. The researchers applied two backcalculation computer programs to the collected NDT data. Results were not encouraging. Consequently, use of Method 1 was discontinued. A reliable backcalculation procedure is needed, however, and this area was marked for continued research.
Subsequently, structural overlay design Method 2 was evaluated. Method 2 requires the use of two NDT deflections: temperature-adjusted deflection directly under load and unadjusted deflection from "an outer geophone." An outer geophone is one located far enough from the load that it detects deflection only in the subgrade, not from the other pavement layers. For this research, data from the sensor 7 ft from the load were used.
The 1986 AASHTO Guide presents detailed instructions for the use of Method 2. Following these instructions, the researchers calculated overlay thickness values within the typical range. Moreover, the calculated overlay values made sense when evaluated with engineering judgment. Thus, Method 2 was selected for calculating structural overlay thicknesses for the research.
Method 2 was used to calculate the required structural overlays for the same 10 pavements whose functional overlay requirements were determined in the previous section. Structural calculations were made on the same basis as the functional calculations so that a comparison of the results could be made: 10-year design life, terminal PSI of 2.5, and initial truck traffic from 1986 with an annual 2 percent traffic growth factor. Other inputs specific to AASHTO Guide Method 2 follow:
295
• Reliability that design life will be met or exceeded: 0.85 (per range provided by 1986 AASHTO Guide);
• Standard deviation: 0.35 (per AASHTO Guide sample calculations);
• Asphalt layer coefficient: 0.34 (per IDOH); • Aggregate layer coefficient: 0.14 (per IDOH); • NDT deflections (and temperature adjustment factors)
from the previously described field investigation; and • Initial PSI: 4.5.
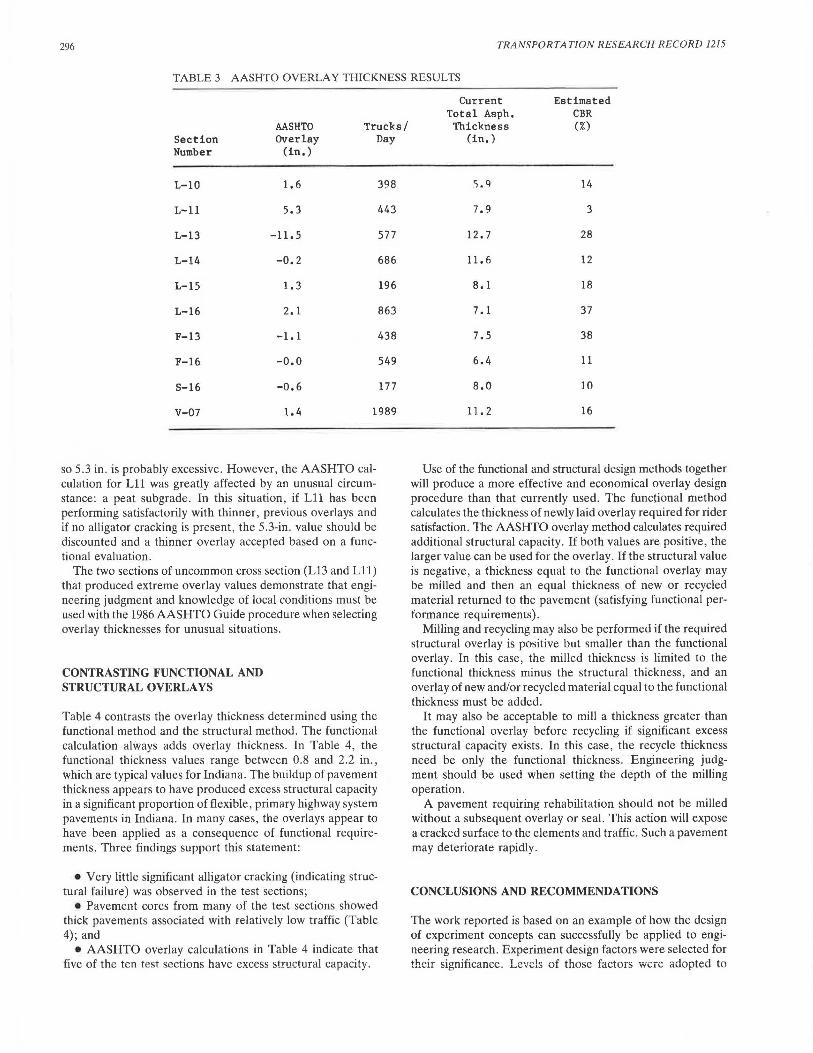
Structural overlay calculation results are presented in Table 3, which shows that five out of the ten test sections (those with negative overlays) do not require additional structural overlay during the next 10 years. These results are quite reasonable for the traffic levels and present asphalt thicknesses considered. Two sections (L13 and L14) already have quite thick asphalt layers but carry only average traffic. The other three sections (F13, F16, S16) have average existing asphalt thicknesses but carry low traffic.
Results for four of the sections (L14, F13, F16, S16) indicate that modest reductions in asphalt thickness (0 in. to 1.2 in.) would be acceptable, suggesting that the increase in pavement asphalt thickness over time has been greater than required for structural capacity. The calculation for Ll3 indicates that 11.5 in. of the existing 12.7 in. of asphalt could be removed. Such action should not be taken. However, the L13 pavement cross section is 12. 7 in. of asphalt above 25 in. of sub base over a sandy subgrade (estimated CBR of 28). The asphalt thickness buildup over time on such a strong foundation does appear excessive for the relatively low traffic volume, but removal of 11.5 in. of the existing asphalt is not indicated.
Four of the other five results in Table 3 indicate that moderate (1.3 in. to 2.1 in.) structural overlays are required for future traffic. The value for the fifth remaining section (Lll) specifies a 5.3-in. structural overlay. Indiana experience has shown that a 3-in. maximum overlay is usually appropriate,
TABLE 2 FUNCTIONAL EQUATION OVERLAY THICKNESS RESULTS
Section Number
L-10
L-11
l.-13
L-14
L-15
L-16
F-13
F-16
S-16
V-07
Functional Equation Overlay
(in,)
1. 3
1.4
1. 0
I. 3
1. 2
1. l
o.a
1. 5
1.3
2.2
Trucks/ Day
398
443
577
686
196
863
438
549
177
1989
Estimated CBR (%)
14
3
28
12
18
37
38
11
10
16
296 TRANSPORTATION RESEARCH RECORD 1215
TABLE 3 AASHTO OVERLAY THICKNESS RESULTS
AASHTO Trucks/ Section Overlay Day Number (in,)
L-10 1, 6 398
L-11 5.3 443
L-13 -11.5 577
L-14 -0.2 686
L-15 1.3 196
L-16 2.1 863
F-13 -1.1 438
F-16 -0.0 549
S-16 -0.6 177
V-07 1.4 1989
so 5.3 in . is probably excessive. However, the AASHTO calculation for Lll was greatly affected by an unusual circumstance: a peat subgrade. In this situation, if Lll has been performing satisfactorily with thinner, previous overlays and if no alligator cracking is present, the 5.3-in. value should be discounted and a thinner overlay accepted based on a functional evaluation.
The two sections of uncommon cross section (L13 and Ll 1) that produced extreme overlay values demonstrate that engineering judgment and knowledge of local conditions must be useu with the 1986 AASHTO Guide procedure when selecting overlay thicknesses for unusual situations.
CONTRASTING FUNCTIONAL AND STRUCTURAL OVERLAYS
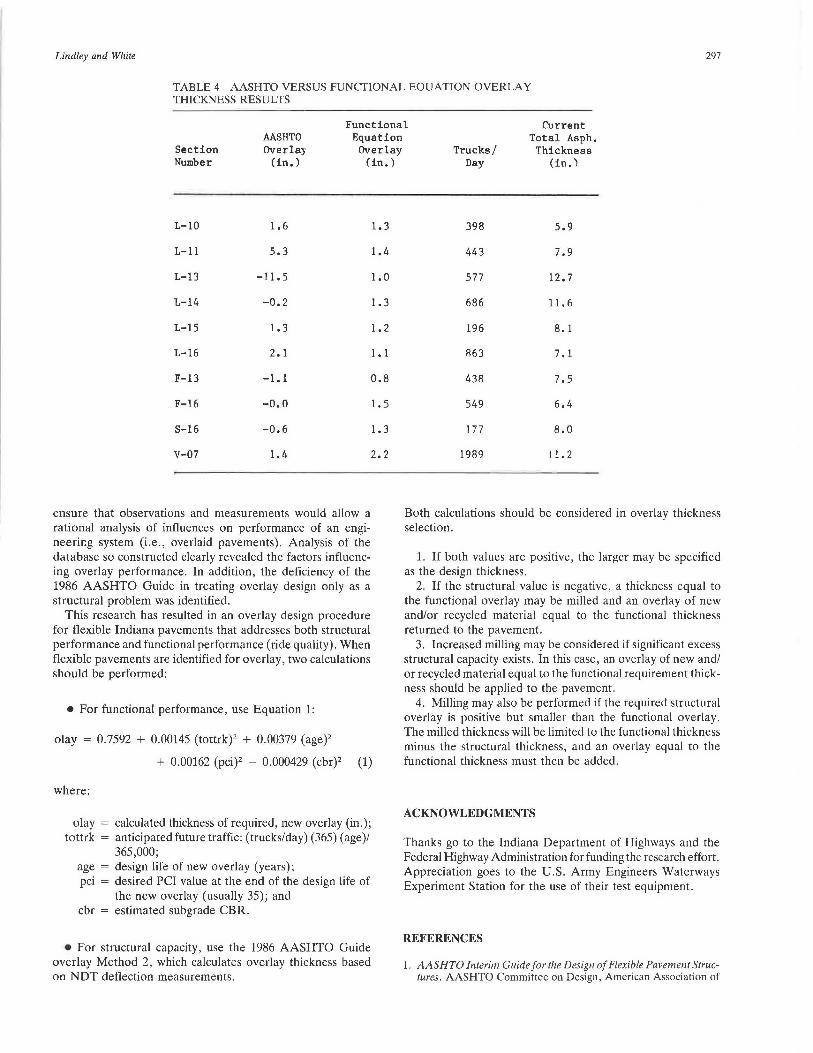
Table 4 contrasts the overlay thickness determined using the functional method and the structural method. The functional calculation always adds overlay thickness. In Table 4, the functional thickness values range between 0.8 and 2.2 in ., which are typical values for Indiana. The buildup of pavement thickness appears to have produced excess structural capacity in a significant proportion offlexible, primary highway system pavements in Indiana. In many cases, the overlays appear to have been applied as a consequence of functional requirements. Three findings support this statement:
• Very little significant alligator cracking (indicating structural failure) was observed in the test sections;
• Pavement cores from many of the test sections showed thick pavements associated with relatively low traffic (Table 4); and
• AASHTO overlay calculations in Table 4 indicate that five of the ten test sections have excess structural capacity.
Current Estimated Total Asph. CBR Thickness (%)
(in.)
'),Q 14
7.9 3
12.7 28
11. 6 12
8.1 18
7.1 37
7.5 38
6.4 11
8.0 10
11.2 16
Use of the functional and structural design methods together will produce a more effective and economical overlay design procedure than that currently used. The functional method calculates the thickness of newly laid overlay required for rider satisfaction. The AASHTO overlay method calculates required additional structural capacity. If both values are positive, the larger value can be used for the overlay. If the structural value is negative , a thickness equal to the functional overlay may be milled and then an equal thickness of new or recycled material returned to the pavement (satisfying functional performance requirements).
Milling and recycling may also be performed if the required structural overlay is positive but smaller than the functional overlay. In this case, the milled thickness is limited to the functional thickness minus the structural thickness, and an overlay of new and/or recycled material equal to the functional thickness must be added.
It may also be acceptable to mill a thickness greater than the functional overlay before recycling if significant excess structural capacity exists. In this case , the recycle thickness need be only the functional thickness. Engineering judgment should be used when setting the depth of the milling operation.
A pavement requiring rehabilitation should not be milled without a subsequent overlay or seal. This action will expose a cracked surface to the elements and traffic. Such a pavement may deteriorate rapidly.
CONCLUSIONS AND RECOMMENDATIONS
The work reported is based on an example of how the design of experiment concepts can successfully be applied to engineering research. Experiment design factors were selected for their significance. Levels of those factors were adopted to
Lindley and White 297
TABLE 4 AASHTO VERSUS FUNCTIONAL EQUATION OVERLAY THICKNESS RESULTS
Section Number
AASHTO Overlay
(in.)
Functional Equation
Overlay (in.)
Trucks/ Day
Current Total Asph.
Thickness (in.)
1-10 1. 6
1-11 5.3
1-13 -11. 5
1-14 -0.2
1-15 1.3
1-16 2.1
F-13 -1.l
F-16 -o.o
S-16 -0.6
V-07 1. 4
ensure that observations and measurements would allow a rational analysis of influences on performance of an engineerir:.g system (i.e., overlaid pavements). Analysis of the database so constructed clearly revealed the factors influencing overlay performance. In addition, the deficiency of the 1986 AASHTO Guide in treating overlay design only as a structural problem was identified.
This research has resulted in an overlay design procedure for flexible Indiana pavements that addresses both structural performance and functional performance (ride quality). When flexible pavements are identified for overlay, two calculations should be performed:
• For functional performance, use Equation 1:
olay = 0.7592 + 0.00145 (tottrk)2 + 0.00379 (age)2
1.3
1.4
1.0
1. 3
1. 2
1.1
0.8
1. 5
1.3
2.2
+ 0.00162 (pci)2 - 0.000429 (cbr)2 (1)
where:
olay =
tottrk
age pci
cbr
calculated thickness of required, new overlay (in.); anticipated future traffic: (trucks/day) (365) (age)/ 365,000; design life of new overlay (years); desired PCI value at the end of the design life of the new overlay (usually 35); and estimated subgrade CBR.
• For structural capacity, use the 1986 AASHTO Guide overlay Method 2, which calculates overlay thickness based on NDT deflection measurements.
398 5.9
443 7.9
577 12.7
686 11. 6
196 8. l
863 7 .1
438 7.5
549 6.4
177 8.0
1989 J 1. 2
Both calculations should be considered in overlay thickness selection.
1. If both values are positive, the larger may be specified as the design thickness.
2. If the structural value is negative, a thickness equal to the functional overlay may be milled and an overlay of new and/or recycled material equal to the functional thickness returned to the pavement.
3. Increased milling may be considered if significant excess structural capacity exists. In this case, an overlay of new and/ or recycled material equal to the functional requirement thickness should be applied to the pavement.
4. Milling may also be performed if the required structural overlay is positive but smaller than the functional overlay. The milled thickness will be limited to the functional thickness minus the structural thickness, and an overlay equal to the functional thickness must then be added.
ACKNOWLEDGMENTS
Thanks go to the Indiana Department of Highways and the Federal Highway Administration for funding the research effort. Appreciation goes to the U.S. Army Engineers Waterways Experiment Station for the use of their test equipment.
REFERENCES
1. AASHTO Interim Guide for the Design of Flexible Pavement Structures. AASHTO Committee on Design, American Association of

298
State Highway and Transportation Officials, Washington, D.C., October 1961.
2. Guide for the Design of Pavement Structures. American Association of ta le Highway and Transportation Officials, Washington, D.C., 1986.
3. M. Y. hahin and . D . Kohn. Pa11e111e111 Maimena11ce M(l11(1ge-111c111 for Roads (1111/ Park/Jig Lots. Technical Report M-294 . U .. Army onstruction Engineering Re cnrch Laboratory. hampaig11 , lll . , October 1981.
4. Thickness Design for Concrete Highway and Street Pavements. Portland Cement Association, Skokie, Ill., 1984.
TRANSPORTATION RESEARCH RECORD 1215
5. limllfological Oaf(/ lndi1111a. Nationnl Oceanic and Atmospheric Adminiscration U .. Department of ommerce, Vol. 90, No. 3, March 1985.
6. E. J. Yoder and .13 . olucci-Rios. Truck Size and Weight Is ues. Proc., 661/i Ptmlue Ro11d . chool. Purdue University, We t Lafaye tte Ind. , March J980.
Publication of this paper sponsored by Committee on Pavement Rehabilitarion.