fmb house builders‘ survey 2018 · the federation of master builders’ (fmb) house builders’...
TRANSCRIPT
FMB House Builders‘ Survey 2018September 2018

4Executive summary
6Introduction and context
8 Respondent profile and industry structure
10Survey findings
10Main constraints on supply 12Buyer demand 13Access to finance
16Small sites and land availability 17Developer contributions
17Planning application process
19Permission in principle
CONTENTS

Main constraints on supply
Respondents were asked to identify what they saw as the major barriers to increasing their output of new homes, both currently and looking ahead over the next three years:
• ‘Lack of available and viable land’ was the most commonly cited barrier (59% of respondents) for the fourth year in a row.
• In second place was ‘the planning system’ (51%) and in third was ‘lack of finance to the company’ (46%).
• The percentage of respondents citing a shortage of skilled workers rose again to 44% and when asked to look ahead over the next three years, this concern overtook access to finance for the first time.
Buyer demand in the market
Respondents were asked to assess the level of buyer demand in the market:
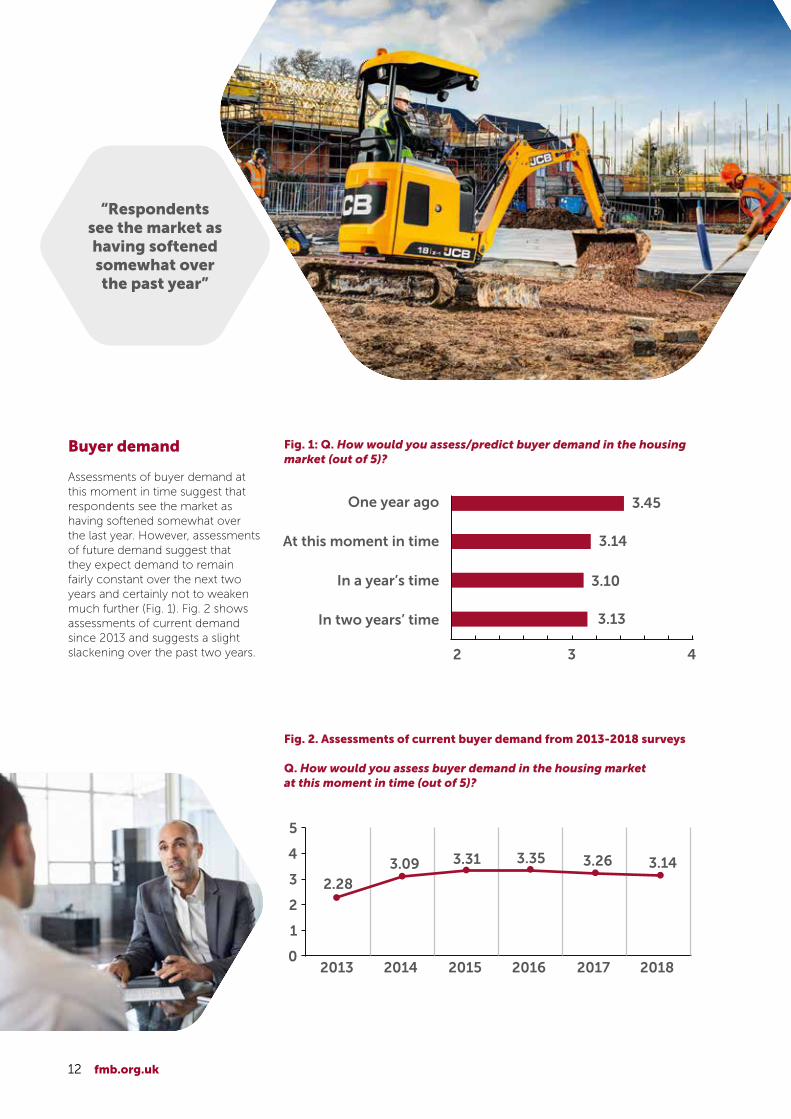
• The average score given for current buyer demand in the housing market (out of 5) was 3.14; this compared to an average score of 3.45 which this year’s respondents gave when asked to assess buyer demand one year ago.
Access to finance
Respondents were asked to assess current lending conditions and the significance of different finance-related issues in restricting their ability to boost output:
• Asked to rate current lending conditions to SMEs for residential property development from zero to five, the average score was 2.03; this is up significantly from 1.63 last year, and is highest score for this measure since the question was first asked in 2013.
• 21% of respondents reported improved lending conditions over the past year, with 11% reporting deteriorating lending conditions; 67% reported no change.
• ‘Poor loan to asset value ratios’ was rated as the most significant finance-related barrier ahead of ‘limitations on business overdraft facilities’.
• The level of concern over loan refusals has fallen for the fourth consecutive year.
• 47% of respondents stated that they were involved in sites that were stalled for financial reasons; this was up very slightly from 45% last year.
4 fmb.org.uk
The Federation of Master Builders’ (FMB) House Builders’ Survey aims to build a clearer picture of the constraints facing small and medium-sized (SME) house builders in England. The findings should be considered in light of the importance of increasing the output of SME house builders, given the ongoing under-supply of new homes. The results of this survey suggest that key structural barriers – access to land, the planning system and access to finance – remain prominent, and concerns over access to skilled labour and continuing to rise. However, access to finance is improving.
EXECUTIVE SUMMARY
“Lack of available and viable land
was the most commonly cited barrier to supply
for the fourth year in a row”
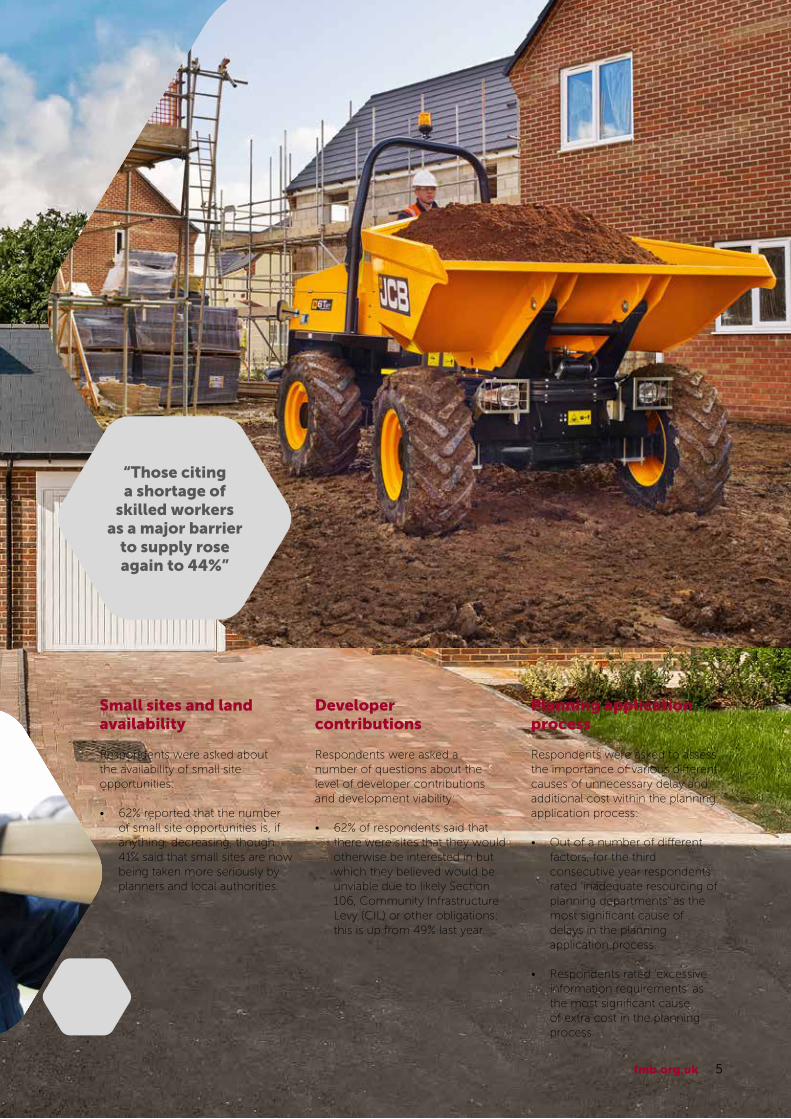
Small sites and land availability
Respondents were asked about the availability of small site opportunities:
• 62% reported that the number of small site opportunities is, if anything, decreasing, though 41% said that small sites are now being taken more seriously by planners and local authorities.
Developer contributions
Respondents were asked a number of questions about the level of developer contributions and development viability:
• 62% of respondents said that there were sites that they would otherwise be interested in but which they believed would be unviable due to likely Section 106, Community Infrastructure Levy (CIL) or other obligations; this is up from 49% last year.
“Those citing a shortage of
skilled workers as a major barrier
to supply rose again to 44%”
5fmb.org.uk
Planning application process
Respondents were asked to assess the importance of various different causes of unnecessary delay and additional cost within the planning application process:
• Out of a number of different factors, for the third consecutive year respondents rated ‘inadequate resourcing of planning departments’ as the most significant cause of delays in the planning application process.
• Respondents rated ‘excessive information requirements’ as the most significant cause of extra cost in the planning process.

The relative decline in the numbers and output of small and medium-sized (SME)
house builders in recent decades is a now a widely acknowledged dimension of the housing market in England and the wider UK. This is a phenomenon that goes to the heart of discussions around housing supply. As such, the results of this survey should be of interest to all those with an interest in expanding, diversifying and speeding up the supply of new homes. Now in its seventh successive year, this survey enables us to build a more detailed understanding of the business environment these firms face, to ascertain how this might be changing over time and to garner their views on key issues.
Although many SME house builders have been able to take advantage of the relatively buoyant housing market of recent years, the most recent figures from NHBC for the calendar year 2017 show no sign of an increase in the share of output from smaller firms, and some signs of continuing weakness. The proportion of new homes being built by firms building fewer than 500 units per year (a standard shorthand for medium-sized house builders and smaller) in 2017 remained unchanged from 2016 at 23%. At the same time, the number of firms registered with NHBC building up to 30 units per year fell again, although it is not possible to be certain whether this reflects an aggregate fall in numbers across the industry or a fall in NHBC registrations among firms of this size1.
The key themes which have emerged from this survey in preceding years – access to finance, access to land and small sites, and the process of obtaining planning permission – continue to feature prominently.
INTRODUCTION AND CONTEXT
6 fmb.org.uk
The Government’s Housing White Paper published in February 2017 noted that “small and medium-sized house builders regularly cite land, planning and finance as the major barriers to expansion”, and indeed, these three remain the most widely cited barriers to supply2. In that sense and others, this year’s results show a high degree of continuity with previous years’ results.
However, some changes over time can be discerned. Concerns over access to finance remain very real for many, but for fewer than in previous years, and assessments of lending conditions are more positive this year than they have been previously. In this light, it is not surprising that concerns over finance are increasingly related to the terms on which finance can be accessed, rather than straightforward refusal of loans (see Fig. 4 on page 14). At the same time, while access to land remains the most widely-cited barrier to supply (cited by 59%), the number of those who feel that local authorities and planners are now taking small sites more seriously has doubled over the past year.
Both the consistency of key concerns and the signs of progress in some areas need to be interpreted in the context of the current policy environment. The recognition of the barriers facing SMEs set out in the White Paper has been accompanied by a range of policies and initiatives designed to tackle these constraints.
The new National Planning Policy Framework (NPPF) includes improved policies on small sites, which should certainly have a positive impact on the sector in the years to come. The new ‘Permission in Principle’ offers a more streamlined planning route for small sites, which is well-received in this survey. This positive approach may well explain some of the greater optimism around the treatment of small sites. In addition, billions of pounds of recoverable loan finance have been targeted at SMEs through the Home Building Fund which can only have helped improve access to finance. However, the results of this survey also suggest that Government policy would do well now to focus on improving loan to value ratios, and that significant increases in supply could follow from doing so.
These constraints to supply are deep-rooted and structural, and defy quick, simple remedies, but there are signs of progress here and the FMB will continue to work with the Government, the Opposition and the rest of the industry to make sure that we continue to roll back the barriers facing SME house builders.
1 These figures are taken from: NHBC, Housing Market Report, January 2018. Figures are based on NHBC registrations in Great Britain. NHBC is the largest warranty provider in the UK, accounting for approximately 80% of the market.2 Department for Communities and Local Government, Fixing our Broken Housing Market, February 2017, p47.

7fmb.org.uk
“The Housing White Paper noted that SMEs cite land, planning and
finance as the major barriers to expansion and these remain the
most widely cited constraints”

The respondent profile is reflective of those parts of the FMB membership and the wider construction industry that are active in smaller-scale house building. The breakdown of firms according to output, between those building one to ten units, those building 11-30 units and those building 31-100 units, is very similar to the proportion of NHBC-registered firms in these categories.
The FMB’s membership includes both specialist house builders and businesses that are diversified across a range of building services. In addition, there are firms that build solely as developers, those that build solely as contractors and a large number working as both developers and contractors.
There is a degree of fluidity between these categories, and there could be much greater fluidity, as previous surveys have shown a strong interest by small contractors in acting as developers if they could access the finance to do so. Indeed, traditionally generalists, contractors and subcontractors have formed a key source of spare capacity and new entrants for the house building industry.
The FMB believes that it is important that this diversity and fluidity in the industry is recognised and understood by those interested in how the output of new homes can be increased. There exist large numbers of small building firms with experience and capability to
deliver new homes and, they will build more where the incentives are right.
The profile of firms in the FMB House Builders’ Survey is relatively constant year-on-year. However, among this year’s respondents, a slightly higher proportion work as both developers and contractors, a higher proportion are only interested in sites of five units or fewer, and there are a higher number whose output fluctuates between below and above ten units per year. One measure, which has changed significantly over time, is the proportion of those saying that they are not building any new homes this year This has fallen relatively consistently down from 39% in 2013 to 19% in 2018.
8 fmb.org.uk
RESPONDENT PROFILE AND INDUSTRY STRUCTURE

Sample
• The survey received 116 responses from SME house building firms.
• All respondents were FMB members in England who list house building as one of their trades.
• A filter question ensured that all those surveyed had been active in building new homes in the past ten years.
House building output
• 74% of respondents said that this year (2018) they will build between one and ten units; 4% will build between 11 and 30 units; 3% will build between 31 and 100 units; 2% will build more than 100 units; and 19% will not build any homes.
• When asked about their projected output for 2019, 70% expect to build between one and ten units; 9% expect to build between 11 and 30 units; 2% expect to build between 31 and 100 units; 3% expect to build more than 100 units; and 16% do not expect to build any homes at all.
Business models
• 13% of respondent firms build homes only as developers; 43% of respondents currently build homes only as contractors; and 44% work as both developers and contractors.
• For 67% of respondents, house building is one of a number of building services they offer; for 26% it is the main or only type of work they undertake; and 7%, though they have built houses in the past ten years, are not currently planning to build new homes.
Site sizes
• The great majority of respondents (83%) typically tend to concentrate on sites of between one and five units; 11% build sites of 11 units or more; and 6% build sites of more than 25 units.
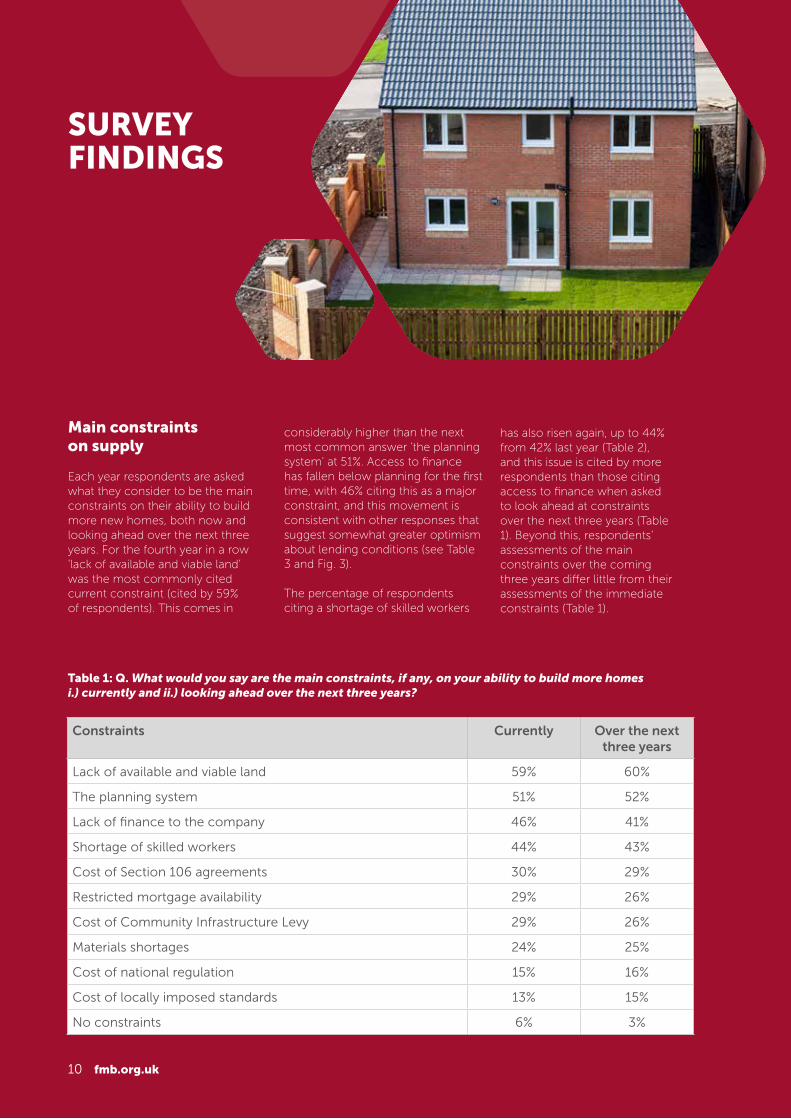
Main constraints on supply
Each year respondents are asked what they consider to be the main constraints on their ability to build more new homes, both now and looking ahead over the next three years. For the fourth year in a row ‘lack of available and viable land’ was the most commonly cited current constraint (cited by 59% of respondents). This comes in
considerably higher than the next most common answer ‘the planning system’ at 51%. Access to finance has fallen below planning for the first time, with 46% citing this as a major constraint, and this movement is consistent with other responses that suggest somewhat greater optimism about lending conditions (see Table 3 and Fig. 3).
The percentage of respondents citing a shortage of skilled workers
has also risen again, up to 44% from 42% last year (Table 2), and this issue is cited by more respondents than those citing access to finance when asked to look ahead at constraints over the next three years (Table 1). Beyond this, respondents’ assessments of the main constraints over the coming three years differ little from their assessments of the immediate constraints (Table 1).
SURVEY FINDINGS
10 fmb.org.uk
Table 1: Q. What would you say are the main constraints, if any, on your ability to build more homes i.) currently and ii.) looking ahead over the next three years?
Constraints Currently Over the next three years
Lack of available and viable land 59% 60%
The planning system 51% 52%
Lack of finance to the company 46% 41%
Shortage of skilled workers 44% 43%
Cost of Section 106 agreements 30% 29%
Restricted mortgage availability 29% 26%
Cost of Community Infrastructure Levy 29% 26%
Materials shortages 24% 25%
Cost of national regulation 15% 16%
Cost of locally imposed standards 13% 15%
No constraints 6% 3%
Concerns over mortgage availability have increased in comparison to last year, but, by and large, responses remain remarkably consistent with that of last year’s (Table 2). Looking back over the last seven years of this survey, concerns over mortgage availability still remain low in comparison to pre-2017. Concerns over access to finance remain high, but have clearly fallen from their height in 2012 to 2015. By contrast, concerns over shortages of skilled workers and materials have been rising since 2015.
Analysis of responses on constraints to supply broken down by firms’ characteristics (i.e. business model and size), show that concern over availability and viability of land is consistently high among all types of firm, but among those building more than ten units per year and those who build solely as developers the planning system becomes the more widely-cited constraint. Perhaps not surprisingly, concerns over the cost of
11fmb.org.uk
Section 106 agreements, and to a lesser extent the Community Infrastructure Levy, are also significantly more prevalent among these groups.
By contrast, concern over access to finance is slightly more widespread among those building up to ten units per year and those acting as both developers and contractors. Shortage of skilled workers is the most widely-cited concern for those acting solely as contractors, and is considerably higher among those building more than ten units per year than it is among those building fewer. It should be noted that when responses are broken down in this way sample sizes for some groups can be quite small, so this analysis should not necessarily be treated as statistically robust. However, these results are broadly broadly consistent with previous years’ findings.
Table 2: Q. What would you say are currently the main constraints, if any, on your ability to build more houses? (responses to this question from 2012-2018 surveys)
“Concerns over shortages of
skilled workers and materials
have been rising since 2015”
Constraints 2018 2017 2016 2015 2014 2013 2012
Lack of available and viable land 59% 62% 67% 68% 51% 55% n/a
The planning system 51% 49% 50% 57% 43% 48% 41%
Lack of finance to the company 46% 54% 50% 62% 62% 60% 72%
Shortage of skilled workers 44% 42% 39% 27% n/a n/a n/a
Cost of Section 106 agreements 30% 29% 31% 34% 31% 29% 46%
Restricted mortgage availability 29% 21% 33% 47% 35% 42% 56%
Cost of Community Infrastructure Levy 29% 29% 22% 22% 24% 24% 25%
Materials shortages 24% 23% 14% 9% 12% n/a n/a
Cost of national regulation 15% 14% 17% 22% 12% 19% 24%
Cost of locally imposed standards 13% 16% 17% 19% 12% 17% 21%
No constraints 6% 3% 4% 0% 14% 8% n/a
12 fmb.org.uk
“Respondents see the market as having softened somewhat over the past year”
Buyer demand
Assessments of buyer demand at this moment in time suggest that respondents see the market as having softened somewhat over the last year. However, assessments of future demand suggest that they expect demand to remain fairly constant over the next two years and certainly not to weaken much further (Fig. 1). Fig. 2 shows assessments of current demand since 2013 and suggests a slight slackening over the past two years.
Fig. 1: Q. How would you assess/predict buyer demand in the housing market (out of 5)?
Fig. 2. Assessments of current buyer demand from 2013-2018 surveys
Q. How would you assess buyer demand in the housing marketat this moment in time (out of 5)?
One year ago
At this moment in time
In a year’s time
In two years’ time
3.10
3.14
3.45
3.13
2 3 4
0
1
2
3
4
5
2013 2014 2015 2016 2017 2018
2.283.09 3.31 3.35 3.26 3.14
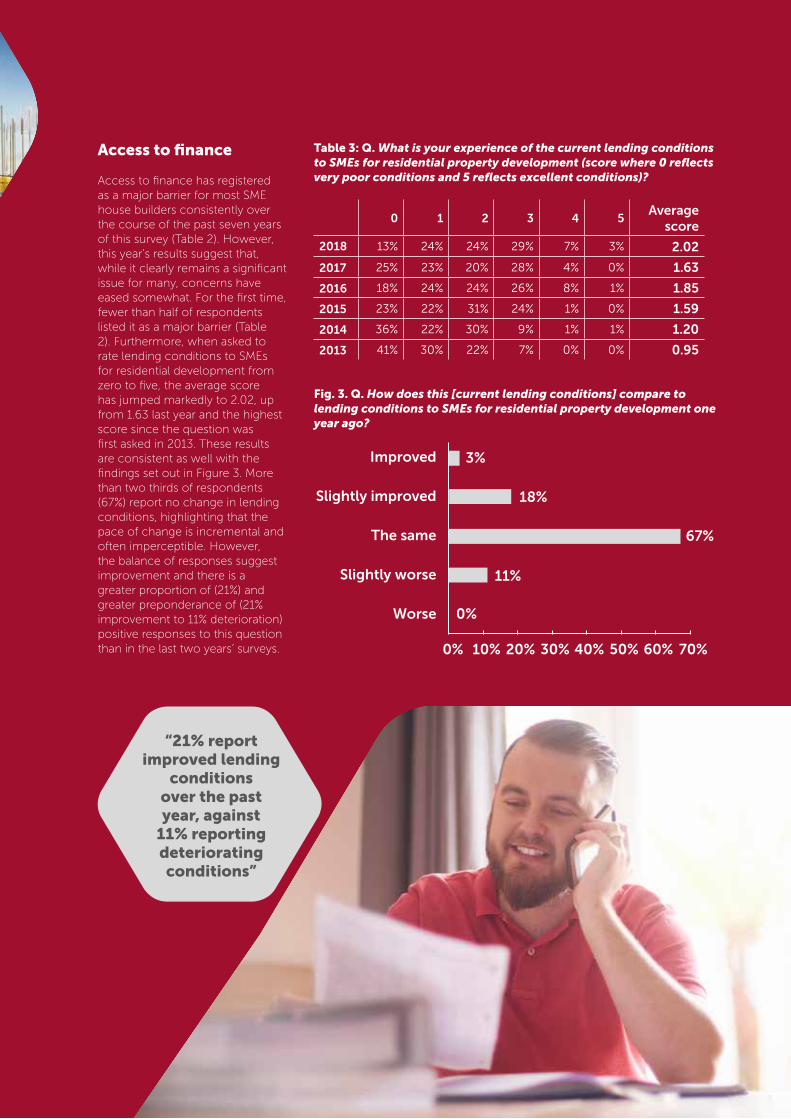
Table 3: Q. What is your experience of the current lending conditions to SMEs for residential property development (score where 0 reflects very poor conditions and 5 reflects excellent conditions)?
Fig. 3. Q. How does this [current lending conditions] compare to lending conditions to SMEs for residential property development one year ago?
“21% report improved lending
conditions over the past year, against
11% reporting deteriorating conditions”
Access to finance
Access to finance has registered as a major barrier for most SME house builders consistently over the course of the past seven years of this survey (Table 2). However, this year’s results suggest that, while it clearly remains a significant issue for many, concerns have eased somewhat. For the first time, fewer than half of respondents listed it as a major barrier (Table 2). Furthermore, when asked to rate lending conditions to SMEs for residential development from zero to five, the average score has jumped markedly to 2.02, up from 1.63 last year and the highest score since the question was first asked in 2013. These results are consistent as well with the findings set out in Figure 3. More than two thirds of respondents (67%) report no change in lending conditions, highlighting that the pace of change is incremental and often imperceptible. However, the balance of responses suggest improvement and there is a greater proportion of (21%) and greater preponderance of (21% improvement to 11% deterioration) positive responses to this question than in the last two years’ surveys.
0 1 2 3 4 5Average
score
2018 13% 24% 24% 29% 7% 3% 2.02
2017 25% 23% 20% 28% 4% 0% 1.63
2016 18% 24% 24% 26% 8% 1% 1.85
2015 23% 22% 31% 24% 1% 0% 1.59
2014 36% 22% 30% 9% 1% 1% 1.20
2013 41% 30% 22% 7% 0% 0% 0.95
Improved
Slightly improved
The same
Slightly worse
Worse
18%
11%
67%
0%
3%
0% 10% 20% 30% 40% 50% 60% 70%
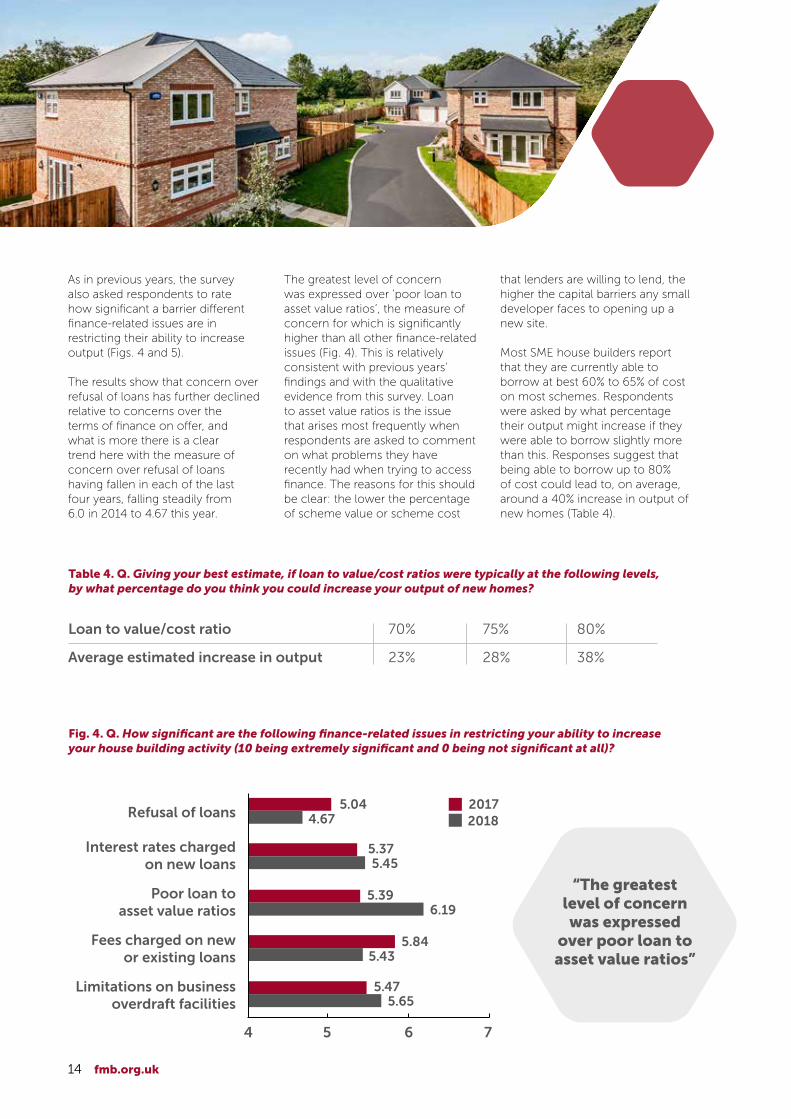
As in previous years, the survey also asked respondents to rate how significant a barrier different finance-related issues are in restricting their ability to increase output (Figs. 4 and 5).
The results show that concern over refusal of loans has further declined relative to concerns over the terms of finance on offer, and what is more there is a clear trend here with the measure of concern over refusal of loans having fallen in each of the last four years, falling steadily from 6.0 in 2014 to 4.67 this year.
The greatest level of concern was expressed over ‘poor loan to asset value ratios’, the measure of concern for which is significantly higher than all other finance-related issues (Fig. 4). This is relatively consistent with previous years’ findings and with the qualitative evidence from this survey. Loan to asset value ratios is the issue that arises most frequently when respondents are asked to comment on what problems they have recently had when trying to access finance. The reasons for this should be clear: the lower the percentage of scheme value or scheme cost
that lenders are willing to lend, the higher the capital barriers any small developer faces to opening up a new site.
Most SME house builders report that they are currently able to borrow at best 60% to 65% of cost on most schemes. Respondents were asked by what percentage their output might increase if they were able to borrow slightly more than this. Responses suggest that being able to borrow up to 80% of cost could lead to, on average, around a 40% increase in output of new homes (Table 4).
14 fmb.org.uk
Fig. 4. Q. How significant are the following finance-related issues in restricting your ability to increase your house building activity (10 being extremely significant and 0 being not significant at all)?
“The greatest level of concern was expressed
over poor loan to asset value ratios”
Table 4. Q. Giving your best estimate, if loan to value/cost ratios were typically at the following levels, by what percentage do you think you could increase your output of new homes?
Loan to value/cost ratio 70% 75% 80%
Average estimated increase in output 23% 28% 38%
Refusal of loans
Interest rates charged on new loans
Poor loan to asset value ratios
Fees charged on new or existing loans
Limitations on business overdraft facilities
4 5 6 7
5.655.47
5.435.84
6.195.39
5.455.37
4.675.04 2017
2018
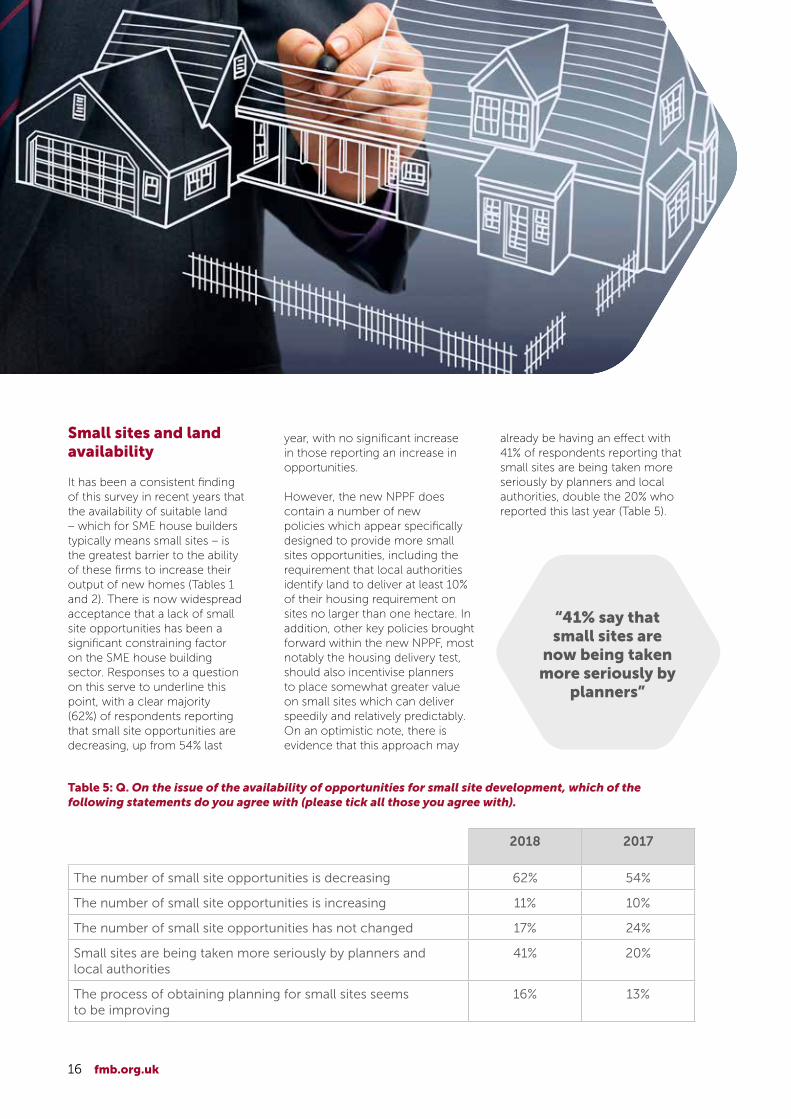
Not surprisingly, loan to value ratio is by far the greatest concern for those acting as developers (Fig. 5). Furthermore, consistent with previous surveys, limitations on overdraft facilities remain the issue of greatest concern to those who work as contractors only (Fig. 5). We know from previous surveys that a large majority of those acting as contractors are actively interested in bringing forward developments and that access to finance is the one of the key factors in their ability to do so.
Overdraft facilities have also tended traditionally to be an important source of finance for many small developers, hence ongoing concern about this among those acting as developers. Respondents’ comments continue to include reports of overdraft facilities being withdrawn from SME house builders. Concerns over the cost of finance which is on offer (both interest rates and fees) also featured strongly in respondents’ comments. So too did complaints over the time and bureaucracy involved in applying for finance. Tellingly,
15fmb.org.uk
one respondent described lenders as having imposed a “ten-year embargo which is only easing now for smaller developers.”
The impact which restricted access to finance is still having on the building of new homes can be gauged by responses about the number of stalled sites. Just under half (47%) of respondents reported that there are sites they are interested in that are stalled for finance reasons (Fig. 6). This figure is up only very slightly on the 45% who reported stalled sites last year.
Fig. 5. Q. How significant are the following finance-related issues in restricting your ability to increase your house building activity (10 being extremely significant and 0 being not significant at all)?
Fig. 6. Q. Are there sites you are interested in that are stalled for finance reasons other than fundamental non-viability?
Refusal of loans
Interest rates charged on new loans
Poor loan to asset value ratios
Fees charged on new or existing loans
Limitations on business overdraft facilities
4 5 6 7
5.795.57
4.605.91
5.316.70
5.645.34
4.604.71 Developers & developer/
contractors
Contractors
53% 47%
YesNo
16 fmb.org.uk
year, with no significant increase in those reporting an increase in opportunities.
However, the new NPPF does contain a number of new policies which appear specifically designed to provide more small sites opportunities, including the requirement that local authorities identify land to deliver at least 10% of their housing requirement on sites no larger than one hectare. In addition, other key policies brought forward within the new NPPF, most notably the housing delivery test, should also incentivise planners to place somewhat greater value on small sites which can deliver speedily and relatively predictably. On an optimistic note, there is evidence that this approach may
already be having an effect with 41% of respondents reporting that small sites are being taken more seriously by planners and local authorities, double the 20% who reported this last year (Table 5).
Small sites and land availability
It has been a consistent finding of this survey in recent years that the availability of suitable land – which for SME house builders typically means small sites – is the greatest barrier to the ability of these firms to increase their output of new homes (Tables 1 and 2). There is now widespread acceptance that a lack of small site opportunities has been a significant constraining factor on the SME house building sector. Responses to a question on this serve to underline this point, with a clear majority (62%) of respondents reporting that small site opportunities are decreasing, up from 54% last
Table 5: Q. On the issue of the availability of opportunities for small site development, which of the following statements do you agree with (please tick all those you agree with).
“41% say that small sites are
now being taken more seriously by
planners”
2018 2017
The number of small site opportunities is decreasing 62% 54%
The number of small site opportunities is increasing 11% 10%
The number of small site opportunities has not changed 17% 24%
Small sites are being taken more seriously by planners and local authorities
41% 20%
The process of obtaining planning for small sites seems to be improving
16% 13%
17fmb.org.uk
interestingly, one respondent commented that “the inclusion of secondary education contributions is killing off the viability on brownfield sites.”
The planning application process
The planning system continues to rank highly on the list of constraints on SME house builders (Tables 1 and 2), and concerns over the disproportionate cost and delay in bringing small scale developments through the planning system are a consistent feature of this survey and the FMB’s conversations with SME house builders. This survey continues to track respondents’ views on this. The survey asked
Developer contributions and viability
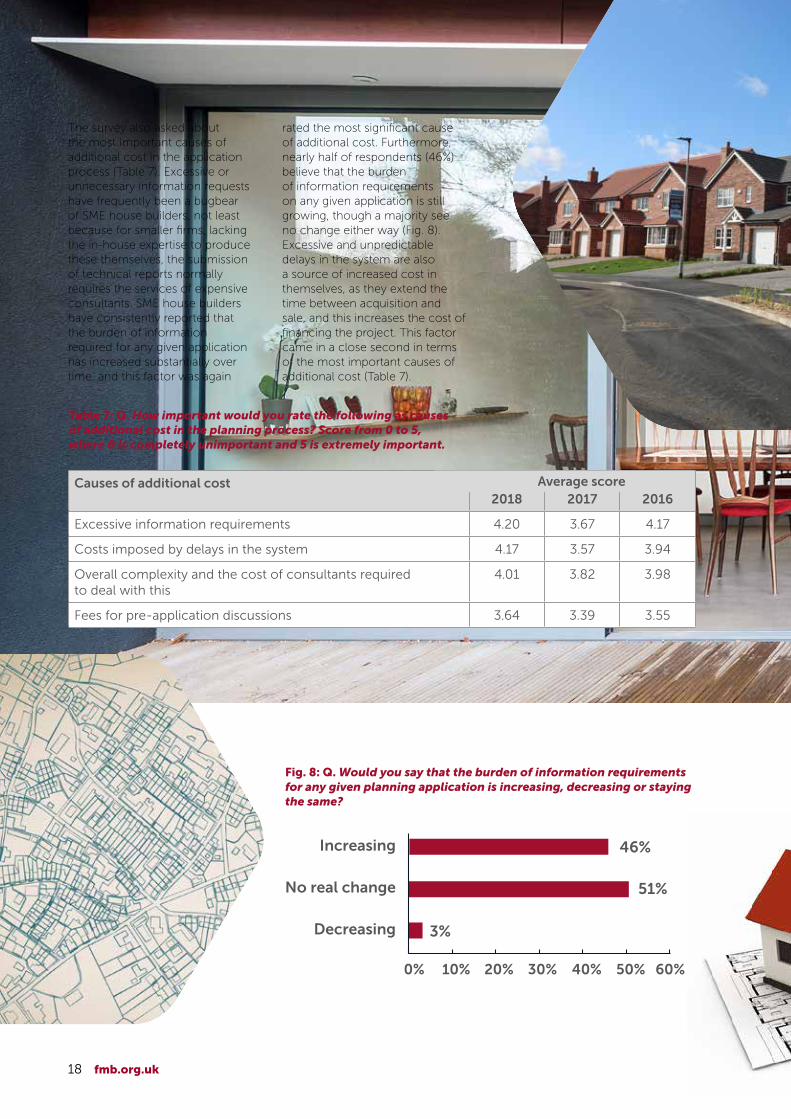
The cost of developer contributions (e.g. Section 106 agreements, CIL charges) continues to be viewed as a significant constraint on supply (Table 1). In a separate question, 62% of respondents said that there were sites that they would otherwise be interested in but which they believe would be unviable due to likely Section 106, CIL or other obligations. This is markedly higher than the 49% in 2017 and the 44% in 2016 answering yes to this question. It is difficult to ascertain reasons why this figure is that much higher this year, and comments didn’t provide sufficient evidence to cast any light on this. However,
Fig. 7. Q. Are there sites which you would otherwise be interested in, but which you believe would be unviable due to likely Section 106, CIL or other obligations?
38%
62%
YesNo
Table 6: Q. How important would you rate the following as causes of delay in the planning process? Score from 0 to 5, where 0 is completely unimportant and 5 is extremely important
them to rate how significant they feel certain factors are in causing delays in the process of gaining implementable planning permissions. ‘Inadequate resourcing of planning departments’ was again rated as the most important cause of delay for the third successive year, with ‘inadequate communication by planning officers’ coming in second (Table 6), although it may well be under-resourcing is itself a major factor in inadequate communication. It is too early to be able to make any assessment of the impact which the ring-fenced 20% increase in planning fees will have on resourcing of planning departments, as the increase only came into effect in January 2018.
Causes of delay2018 2017 2016
Inadequate resourcing of planning departments 3.89 3.69 4.07
Inadequate communication by planning officers 3.58 3.55 3.60
The signing off of planning conditions 3.47 3.57 3.77
Negotiating Section 106 agreements 3.47 3.27 3.24
Signing off of Section 106 agreements 3.37 3.34 3.27
Delays caused by statutory consultees 3.24 3.38 3.19
Average score
18 fmb.org.uk
rated the most significant cause of additional cost. Furthermore, nearly half of respondents (46%) believe that the burden of information requirements on any given application is still growing, though a majority see no change either way (Fig. 8). Excessive and unpredictable delays in the system are also a source of increased cost in themselves, as they extend the time between acquisition and sale, and this increases the cost of financing the project. This factor came in a close second in terms of the most important causes of additional cost (Table 7).
The survey also asked about the most important causes of additional cost in the application process (Table 7). Excessive or unnecessary information requests have frequently been a bugbear of SME house builders, not least because for smaller firms, lacking the in-house expertise to produce these themselves, the submission of technical reports normally requires the services of expensive consultants. SME house builders have consistently reported that the burden of information required for any given application has increased substantially over time, and this factor was again
Fig. 8: Q. Would you say that the burden of information requirements for any given planning application is increasing, decreasing or staying the same?
Table 7: Q. How important would you rate the following as causes of additional cost in the planning process? Score from 0 to 5, where 0 is completely unimportant and 5 is extremely important.
Increasing
No real change
Decreasing
46%
3%
51%
0% 10% 20% 30% 40% 50% 60%
Causes of additional cost2018 2017 2016
Excessive information requirements 4.20 3.67 4.17
Costs imposed by delays in the system 4.17 3.57 3.94
Overall complexity and the cost of consultants required to deal with this
4.01 3.82 3.98
Fees for pre-application discussions 3.64 3.39 3.55
Average score
19fmb.org.uk
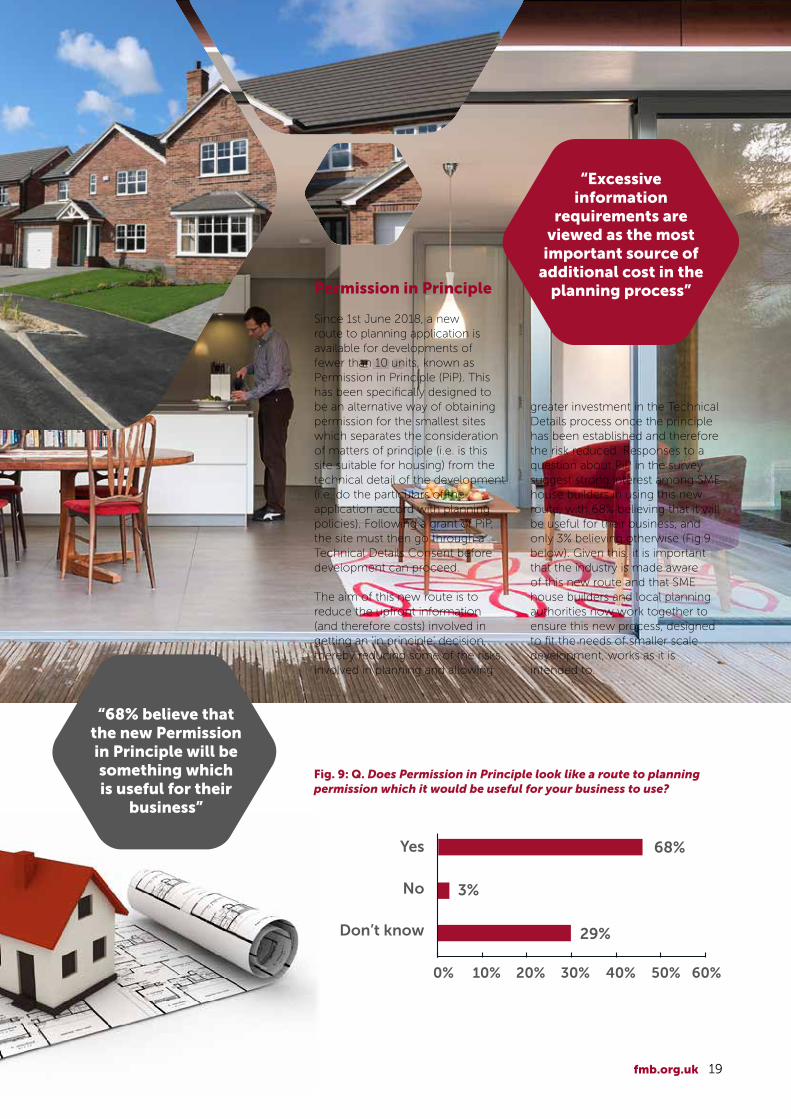
Permission in Principle
Since 1st June 2018, a new route to planning application is available for developments of fewer than 10 units, known as Permission in Principle (PiP). This has been specifically designed to be an alternative way of obtaining permission for the smallest sites which separates the consideration of matters of principle (i.e. is this site suitable for housing) from the technical detail of the development (i.e. do the particulars of the application accord with planning policies). Following a grant of PiP, the site must then go through a Technical Details Consent before development can proceed.
The aim of this new route is to reduce the upfront information (and therefore costs) involved in getting an ‘in principle’ decision, thereby reducing some of the risks involved in planning and allowing
greater investment in the Technical Details process once the principle has been established and therefore the risk reduced. Responses to a question about PiP in the survey suggest strong interest among SME house builders in using this new route, with 68% believing that it will be useful for their business, and only 3% believing otherwise (Fig.9 below). Given this, it is important that the industry is made aware of this new route and that SME house builders and local planning authorities now work together to ensure this new process, designed to fit the needs of smaller scale development, works as it is intended to.
“Excessive information
requirements are viewed as the most
important source of additional cost in the
planning process”
Fig. 9: Q. Does Permission in Principle look like a route to planning permission which it would be useful for your business to use?
Yes
No
Don’t know
68%
29%
3%
0% 10% 20% 30% 40% 50% 60%
“68% believe that the new Permission in Principle will be something which is useful for their
business”

About the Federation of Master Builders
The Federation of Master Builders (FMB) is the largest trade association in the UK construction industry representing thousands of firms in England, Scotland, Wales and Northern Ireland. Established in 1941 to protect the interests of small and medium-sized (SME) construction firms, the FMB is independent and non-profit making, lobbying for members’ interests at both the national and local level. The FMB is a source of knowledge, professional advice and support for its members, providing a range of modern and relevant business building services to help them succeed. The FMB is committed to raising quality in the construction industry and offers a free service to consumers called ‘Find a Builder’.
For further information about the FMB, visit www.fmb.org.uk or follow us on Twitter @fmbuilders.
For further information about the FMB House Builders’ Survey 2018, email [email protected] or call 020 7025 2902.
About the sponsors of the FMB House Builders’ Survey 2018:
JCB is the world’s third largest construction equipment brand with 22 plants on four continents: 12 in the UK, and others in India, Brazil, the USA and China. The company employs around 12,500 people worldwide. JCB is privately-owned by the Bamford family and was founded in 1945. The company is the world’s number one manufacturer of backhoe loaders and telescopic handlers and sells more than 300 different products to the construction and agricultural markets in over 150 countries worldwide. For further information visit www.jcb.com.
JCB Finance Ltd offers UK businesses flexible Hire Purchase and Leasing options across the entire JCB range and other new (non-competitive machinery), vehicles and a wide range of used plant and machinery.
With over 47 years’ experience of lending to construction, JCB Finance understands the need to offer flexible funding options to suit the individual needs of the customer. For further information about JCB Finance Ltd, visit www.jcb-finance.co.uk or follow on Twitter @jcbfinance.
@fmbuilders /fmbuildersFederationofMasterBuilders 12.09.18