feed-in tariffs in america - institute for local self … tariffs...feed-in tariffs in america...
TRANSCRIPT
Feed-in tariffs in AmericaDriving the Economy with Renewable Energy Policy that Works
JOHN [email protected]
April 2009
New Rules Project1313 5th St. SE, Suite 303Minneapolis, MN 55414
612-379-3815www.newrules.org
A publication of in cooperation with
This project has been funded in part by the European Commission and Heinrich Böll Stiftung.
The European Commission is not responsible for the content of this project.
The Heinrich Böll Foundation is a non-profit political foundation affiliated with the German political party of Alliance 90/The Greens. Since 1998, the Heinrich Böll Foundation has an office in Washington, DC. The Heinrich Böll Foundation North America focuses its work on the issues of foreign and security policy and transatlantic relations, global governance, sustainable development, social equity and gender democracy. www.boell.org
The Transatlantic Climate Policy Group is a two year program, launched by the Heinrich Böll Foundation, which aims at fostering transatlantic dialogue and cooperation on climate and energy policies. The Transatlantic Climate Policy Group seeks to engage policymakers, research analysts, experts, and media on both sides of the Atlantic in order to achieve two major goals: to identify common ground and future challenges for transatlantic energy and climate cooperation, and to increase collaboration between U.S. cities and EU cities, U.S. States and the member states of the EU, and finally U.S. federal and EU policy institutions. http://www.boell.de/climate-transatlantic/ The Institute for Local Self-Reliance was formed in 1974 with a mission to provide innovative strategies, working models, and timely information to support environmentally sound and equitable community development. To this end, ILSR works with citizens, activists, policymakers and entrepreneurs to design systems, policies and enterprises that meet local or regional needs; to maximize human, material, natural and financial resources; and to ensure that the benefits of these systems and resources accrue to all local citizens. A program of ILSR, the New Rules Project helps policy makers to design rules as if community matters. http://www.ilsr.org and http://www.newrules.org
New Rules Project www.newrules.org 1
http://www.boell.org/

Acknowledgments
The author would like to thank David Morris, for providing thoughtful comments and insightful editing, and Arne Jungjohann of the Heinrich Böll Foundation, for this opportunity to collaborate.
Other Publications from the New Rules ProjectThe Benefits of North Dakota's Pharmacy Ownership Law, by Justin Dahlheimer and Stacy Mitchell, January 2009
Meeting Minnesota’s Renewable Energy Standard Using The Existing Transmission System, by John Bailey, George Crocker (NAWO), John Farrell, Michael Michaud (Matrix Energy Solutions), and David Morris, November 2008
Energy Self-Reliant States: Homegrown Renewable Power, by John Farrell and David Morris, November 2008
Rural Power: Community-Scaled Renewable Energy and Rural Economic Development, by John Farrell and David Morris, August 2008
Driving Our Way to Energy Independence, by David Morris, April 2008
Broadening Wind Energy Ownership by Changing Federal Incentives, by John Farrell, April 2008
Ethanol and Land Use Changes, by David Morris, February 2008
Carbon Caps With Universal Dividends: Equitable, Ethical & Politically Effective Climate Policy, by John Bailey, January 2008
Municipal Broadband: Demystifying Wireless and Fiber-Optic Options, by Christopher Mitchell, January 2008
Big-Box Swindle: The True Cost of Mega-Retailers and the Fight for America’s Independent Businesses, by Stacy Mitchell, November 2007, Beacon Press
Since 1974, the Institute for Local Self-Reliance (ILSR) has worked with citizen groups, governments and private businesses to extract the maximum value from local resources.
A program of ILSR, the New Rules Project helps policy makers to design rules as if community matters.
2009 by the Institute for Local Self-Reliance and Heinrich Böll Foundation North America. Permission is granted under a Creative Commons license to replicate and distribute this report freely for noncommercial purposes. To view a copy of this license, visit http://creativecommons.org/licenses/by-nc-nd/3.0/.
New Rules Project www.newrules.org 2
Table of Contents
............................................................................................................Executive Summary! 5
...............................................................................................The Power of Feed-in Tariffs! 6
.........................................................................................................The European Experience! 8
............................................................................Denmark: The Rise and Fall of Feed-In Tariffs! 8
1979-1992: Fostering a wind industry
1993-2002: The FIT and the Surge in Production
2003-Present: U.S.-style quotas and stagnant development
Danish Results: Energy and Industry
Denmark: Locally owned wind power
...........................................................................Germany: The Rise and Rise of Feed-In Tariffs! 10
1987-1990: A small start
1991-1999: Feed-In Tariff accelerates wind, some solar
2000-Present: Revised FIT broadens German renewable development
Results: Energy and Industry
Germany: Locally owned renewable energy
...........................................................................................Feed-In Tariffs in the United States! 12
.................................................................................................Why Feed-In Tariffs Work! 14
...............................................................................................................................Simplicity! 14
..................................................................................................................................Stability! 14
.................................................................................................................................Fairness! 14
.................................................................................................Designing a Feed-In Tariff! 16
....................................................................................................................Setting FIT Rates! 16
Offer a reasonable return
Configure by technology
Award innovation
New Rules Project www.newrules.org 3
Accommodate various sizes
.................................................................................................................Adjusting FIT Rates! 16
Adjust for experience
Adjust for inflation
Provide a long-term contract
Share the Cost
......................................................................................The Economics of a Feed-in Tariff! 19
........................................................................................................Cheaper renewable power ! 19
..................................................................................................................Cheaper electricity! 19
.............................................................................................................Substantial job growth! 20
.........................................................................................Total benefits far outweigh the costs! 20
......................................................................................................................Local ownership! 21
...................................................................................................Minnesota: A Case Study! 22
........................................................................Costs and Benefits of a Minnesota Feed-in Tariff! 22
...............................................................................................Cost to ratepayers and taxpayers! 22
.................................................................................................................Benefits to the state! 23
........................................................................................Questions about Feed-In Tariffs! 24
........................................................................................Won’t a Feed-In Tariff be expensive? ! 24
..........................................................................If we have an RPS, do we need a Feed-in Tariff?! 25
.........................................................................................Isn’t an RPS more market-oriented? ! 25
......................................................................................................................Conclusion! 26
..............................................................................................................About the Author! 27
.......................................................................................................................References! 28
.........................................................................................................................Photo Credits! 28
................................................................................................................................Citations! 28
New Rules Project www.newrules.org 4
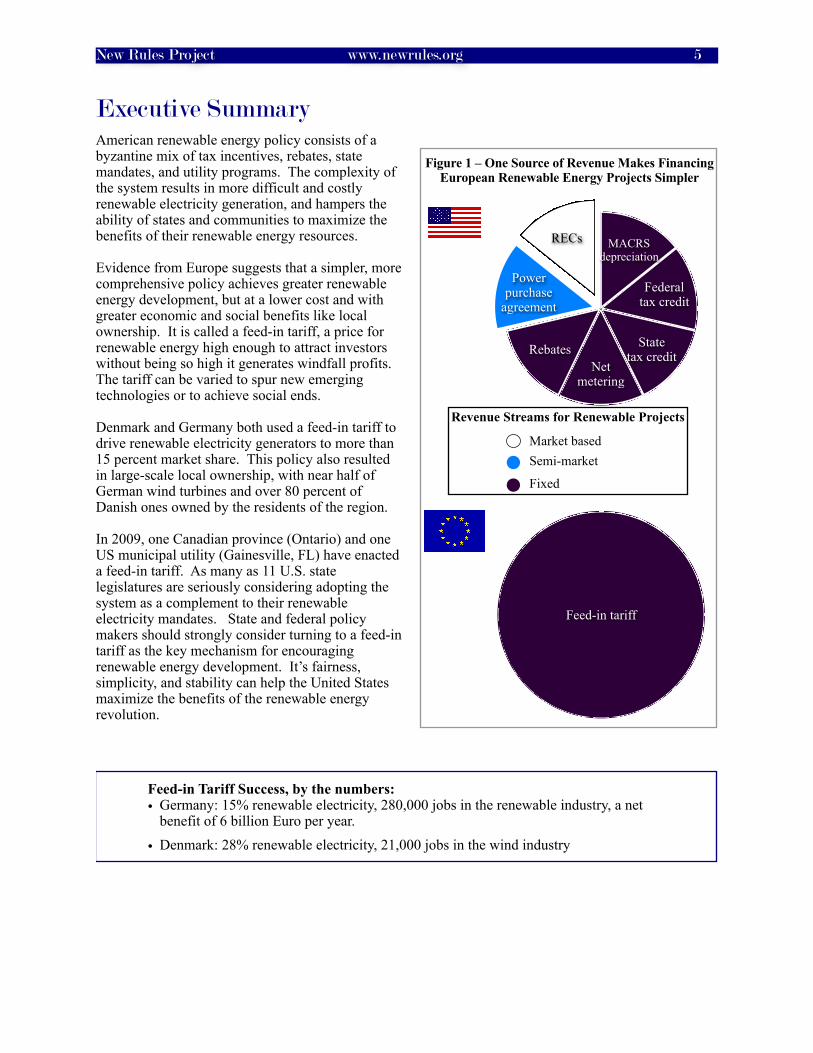
Executive SummaryAmerican renewable energy policy consists of a byzantine mix of tax incentives, rebates, state mandates, and utility programs. The complexity of the system results in more difficult and costly renewable electricity generation, and hampers the ability of states and communities to maximize the benefits of their renewable energy resources.
Evidence from Europe suggests that a simpler, more comprehensive policy achieves greater renewable energy development, but at a lower cost and with greater economic and social benefits like local ownership. It is called a feed-in tariff, a price for renewable energy high enough to attract investors without being so high it generates windfall profits. The tariff can be varied to spur new emerging technologies or to achieve social ends.
Denmark and Germany both used a feed-in tariff to drive renewable electricity generators to more than 15 percent market share. This policy also resulted in large-scale local ownership, with near half of German wind turbines and over 80 percent of Danish ones owned by the residents of the region.
In 2009, one Canadian province (Ontario) and one US municipal utility (Gainesville, FL) have enacted a feed-in tariff. As many as 11 U.S. state legislatures are seriously considering adopting the system as a complement to their renewable electricity mandates. State and federal policy makers should strongly consider turning to a feed-in tariff as the key mechanism for encouraging renewable energy development. It’s fairness, simplicity, and stability can help the United States maximize the benefits of the renewable energy revolution.
Feed-in Tariff Success, by the numbers:• Germany: 15% renewable electricity, 280,000 jobs in the renewable industry, a net
benefit of 6 billion Euro per year.
• Denmark: 28% renewable electricity, 21,000 jobs in the wind industry
Revenue Streams for Renewable Projects
Fixed
Market basedSemi-market
RECs
Power purchase
agreement
RebatesNet
metering
State tax credit
Federal tax credit
MACRS depreciation
Feed-in tariff
Figure 1 – One Source of Revenue Makes Financing European Renewable Energy Projects Simpler
New Rules Project www.newrules.org 5
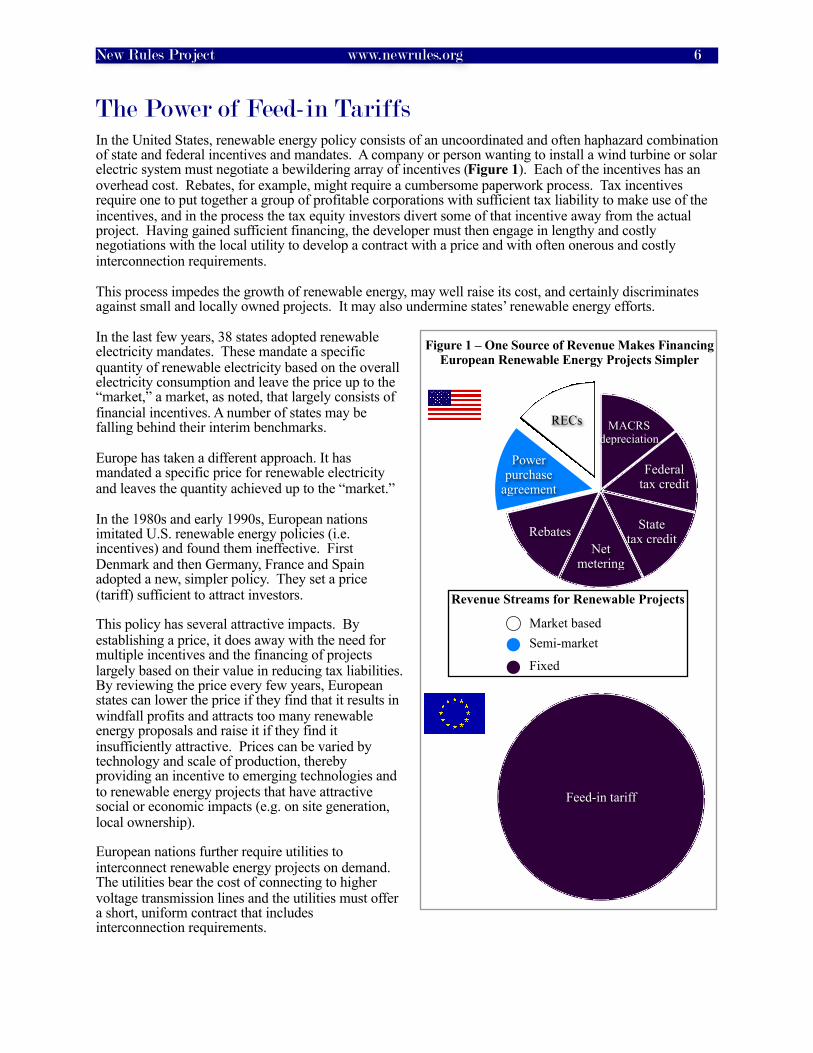
The Power of Feed-in TariffsIn the United States, renewable energy policy consists of an uncoordinated and often haphazard combination of state and federal incentives and mandates. A company or person wanting to install a wind turbine or solar electric system must negotiate a bewildering array of incentives (Figure 1). Each of the incentives has an overhead cost. Rebates, for example, might require a cumbersome paperwork process. Tax incentives require one to put together a group of profitable corporations with sufficient tax liability to make use of the incentives, and in the process the tax equity investors divert some of that incentive away from the actual project. Having gained sufficient financing, the developer must then engage in lengthy and costly negotiations with the local utility to develop a contract with a price and with often onerous and costly interconnection requirements.
This process impedes the growth of renewable energy, may well raise its cost, and certainly discriminates against small and locally owned projects. It may also undermine states’ renewable energy efforts.
In the last few years, 38 states adopted renewable electricity mandates. These mandate a specific quantity of renewable electricity based on the overall electricity consumption and leave the price up to the “market,” a market, as noted, that largely consists of financial incentives. A number of states may be falling behind their interim benchmarks.
Europe has taken a different approach. It has mandated a specific price for renewable electricity and leaves the quantity achieved up to the “market.”
In the 1980s and early 1990s, European nations imitated U.S. renewable energy policies (i.e. incentives) and found them ineffective. First Denmark and then Germany, France and Spain adopted a new, simpler policy. They set a price (tariff) sufficient to attract investors.
This policy has several attractive impacts. By establishing a price, it does away with the need for multiple incentives and the financing of projects largely based on their value in reducing tax liabilities. By reviewing the price every few years, European states can lower the price if they find that it results in windfall profits and attracts too many renewable energy proposals and raise it if they find it insufficiently attractive. Prices can be varied by technology and scale of production, thereby providing an incentive to emerging technologies and to renewable energy projects that have attractive social or economic impacts (e.g. on site generation, local ownership).
European nations further require utilities to interconnect renewable energy projects on demand. The utilities bear the cost of connecting to higher voltage transmission lines and the utilities must offer a short, uniform contract that includes interconnection requirements.
Revenue Streams for Renewable Projects
Fixed
Market basedSemi-market
RECs
Power purchase
agreement
RebatesNet
metering
State tax credit
Federal tax credit
MACRS depreciation
Feed-in tariff
Figure 1 – One Source of Revenue Makes Financing European Renewable Energy Projects Simpler
New Rules Project www.newrules.org 6
Empirical studies of the European system have found that it spurs more renewable energy at a lower price than do incentive programs or stand-alone renewable mandates.
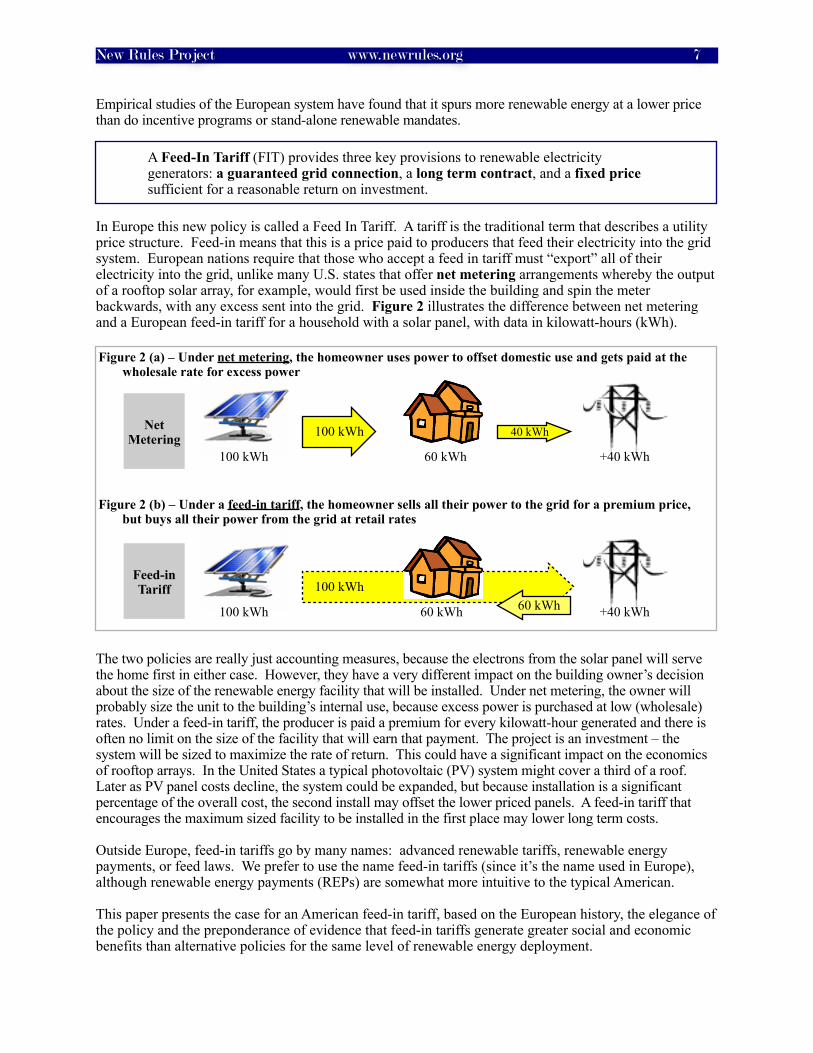
In Europe this new policy is called a Feed In Tariff. A tariff is the traditional term that describes a utility price structure. Feed-in means that this is a price paid to producers that feed their electricity into the grid system. European nations require that those who accept a feed in tariff must “export” all of their electricity into the grid, unlike many U.S. states that offer net metering arrangements whereby the output of a rooftop solar array, for example, would first be used inside the building and spin the meter backwards, with any excess sent into the grid. Figure 2 illustrates the difference between net metering and a European feed-in tariff for a household with a solar panel, with data in kilowatt-hours (kWh).
Figure 2 (a) – Under net metering, the homeowner uses power to offset domestic use and gets paid at the wholesale rate for excess power
60 kWh
Figure 2 (b) – Under a feed-in tariff, the homeowner sells all their power to the grid for a premium price, but buys all their power from the grid at retail rates
100 kWh
100 kWh
60 kWh +40 kWh
100 kWh 60 kWh +40 kWh
40 kWh100 kWhNet Metering
Feed-in Tariff
The two policies are really just accounting measures, because the electrons from the solar panel will serve the home first in either case. However, they have a very different impact on the building owner’s decision about the size of the renewable energy facility that will be installed. Under net metering, the owner will probably size the unit to the building’s internal use, because excess power is purchased at low (wholesale) rates. Under a feed-in tariff, the producer is paid a premium for every kilowatt-hour generated and there is often no limit on the size of the facility that will earn that payment. The project is an investment – the system will be sized to maximize the rate of return. This could have a significant impact on the economics of rooftop arrays. In the United States a typical photovoltaic (PV) system might cover a third of a roof. Later as PV panel costs decline, the system could be expanded, but because installation is a significant percentage of the overall cost, the second install may offset the lower priced panels. A feed-in tariff that encourages the maximum sized facility to be installed in the first place may lower long term costs.
Outside Europe, feed-in tariffs go by many names: advanced renewable tariffs, renewable energy payments, or feed laws. We prefer to use the name feed-in tariffs (since it’s the name used in Europe), although renewable energy payments (REPs) are somewhat more intuitive to the typical American.
This paper presents the case for an American feed-in tariff, based on the European history, the elegance of the policy and the preponderance of evidence that feed-in tariffs generate greater social and economic benefits than alternative policies for the same level of renewable energy deployment.
A Feed-In Tariff (FIT) provides three key provisions to renewable electricity generators: a guaranteed grid connection, a long term contract, and a fixed price sufficient for a reasonable return on investment.
New Rules Project www.newrules.org 7
The European ExperienceTwo countries in particular provide an illustration of the success of the feed-in tariff: Denmark and Germany.
Denmark: The Rise and Fall of Feed-In TariffsDenmark’s history of renewable energy policy is one of early commitment, rapid success under a feed-in tariff, and then stagnation from a changed policy. In the 1980s, the Danes were among the first to encourage renewable energy development, a step ahead of many other national efforts to respond to the Arab oil crisis. Their head-start meant that the California wind farms – representing the early renewable energy efforts of the United States in the post oil crisis era – were largely powered by Danish turbines. However, while the U.S. abandoned many of its initiatives as the price of oil fell during the 1980s, the Danes remained committed to their energy independence goals, including the development of renewable energy. A strong anti-nuclear movement also increased the Danish commitment to wind power.1
The following timeline illustrates the history of Danish renewable energy policy.
1979-1992: Fostering a wind industry
In 1979, the Danish legislature (Folketing) introduced the first incentives for wind power, a subsidy for 30 percent of total project costs that decreased over time.2 Wind power generation first exceeded 100 megawatts (MW) under this proposal, an impressive feat since most were turbines less than 100 kilowatts (kW) in size.
In 1988, the Danes took a step closer to a feed-in tariff, reducing the capital subsidy but requiring utilities to interconnect and purchase power from wind projects. Utilities were also required to provide a “fair price.”3 Wind power capacity increased to near 300 MW.
By 1992, the “fair price” for wind power was set at 85 percent of the retail electricity rate.4 The Danes provided guaranteed interconnection and power purchase. The price was still set relative to retail rates and not relative to the cost of production for wind generators.
1993-2002: The FIT and the Surge in Production
In 1993, the Danes formally established a Feed-In Tariff, decoupling the power purchase price from electricity rates. The price paid for power from wind turbines was set at 85 percent of utility production and distribution costs.5 Wind projects also received a refund of the Danish carbon tax and a partial refund on the energy tax. These refunds effectively doubled the payment to wind projects for the first five years of the project.
In 1998, the price language was changed slightly, though the support level remained largely the same. The new law required utilities to purchase the wind turbine’s output at “85 percent of the consumer price of electricity plus ecotax relief.” These costs were largely borne by the utilities, who received a payment to offset their costs,6 but turbine operators were responsible for the initial grid connection. “The costs of grid connection are paid by the wind mill owners exactly until the nearest 10 or 20 kV line.”7
In 1999 the election of a center-right government ended the feed-in tariff in Denmark. Instead, the renewable energy program was changed to an American-style renewable portfolio standard with tradable credits.8 The new program was phased in, so some producers who came online through 2002 were still able to get the prior tariff rate locked in for 10 years.9
2003-Present: U.S.-style quotas and stagnant development
By 2003, all wind generators connecting to the grid had to do so under the new renewable
1990s
1980s
2000s
New Rules Project www.newrules.org 8
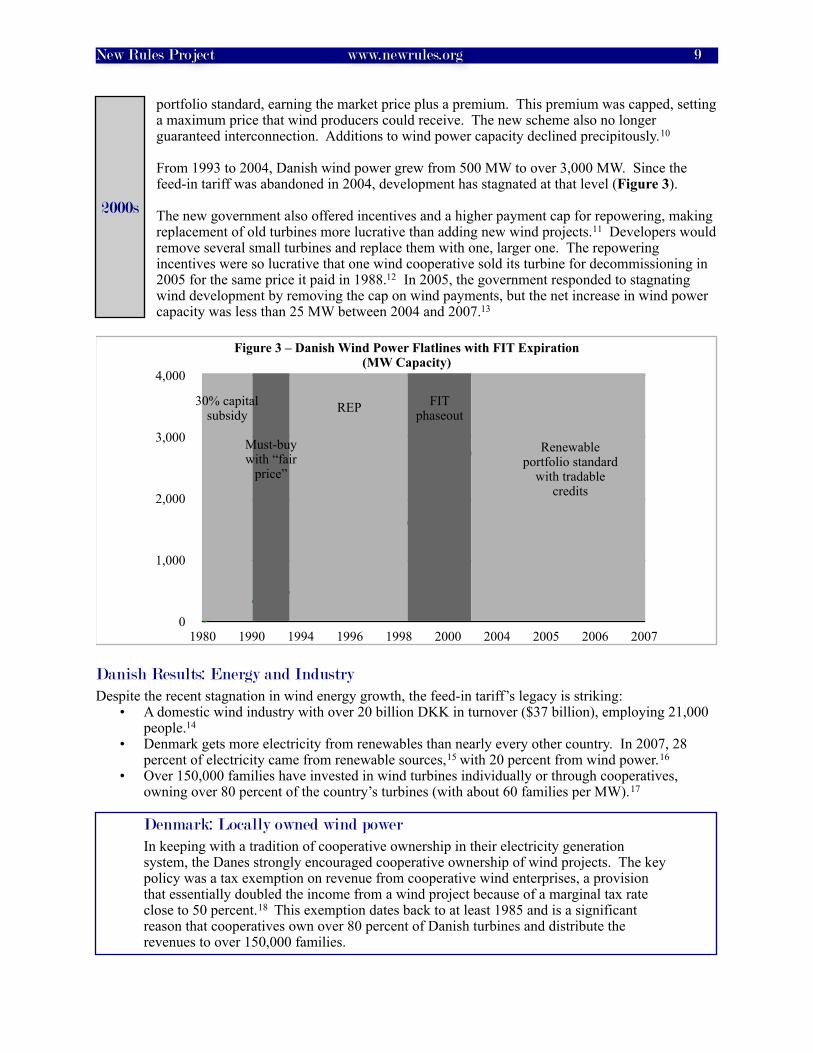
portfolio standard, earning the market price plus a premium. This premium was capped, setting a maximum price that wind producers could receive. The new scheme also no longer guaranteed interconnection. Additions to wind power capacity declined precipitously.10
From 1993 to 2004, Danish wind power grew from 500 MW to over 3,000 MW. Since the feed-in tariff was abandoned in 2004, development has stagnated at that level (Figure 3).
The new government also offered incentives and a higher payment cap for repowering, making replacement of old turbines more lucrative than adding new wind projects.11 Developers would remove several small turbines and replace them with one, larger one. The repowering incentives were so lucrative that one wind cooperative sold its turbine for decommissioning in 2005 for the same price it paid in 1988.12 In 2005, the government responded to stagnating wind development by removing the cap on wind payments, but the net increase in wind power capacity was less than 25 MW between 2004 and 2007.13
0
1,000
2,000
3,000
4,000
1980 1990 1994 1996 1998 2000 2004 2005 2006 2007
Figure 3 – Danish Wind Power Flatlines with FIT Expiration (MW Capacity)
30% capital subsidy
Must-buy with “fair
price”
REP FIT phaseout
Renewable portfolio standard
with tradable credits
Danish Results: Energy and IndustryDespite the recent stagnation in wind energy growth, the feed-in tariff’s legacy is striking:
• A domestic wind industry with over 20 billion DKK in turnover ($37 billion), employing 21,000 people.14
• Denmark gets more electricity from renewables than nearly every other country. In 2007, 28 percent of electricity came from renewable sources,15 with 20 percent from wind power.16
• Over 150,000 families have invested in wind turbines individually or through cooperatives, owning over 80 percent of the country’s turbines (with about 60 families per MW).17
Denmark: Locally owned wind powerIn keeping with a tradition of cooperative ownership in their electricity generation system, the Danes strongly encouraged cooperative ownership of wind projects. The key policy was a tax exemption on revenue from cooperative wind enterprises, a provision that essentially doubled the income from a wind project because of a marginal tax rate close to 50 percent.18 This exemption dates back to at least 1985 and is a significant reason that cooperatives own over 80 percent of Danish turbines and distribute the revenues to over 150,000 families.
2000s
New Rules Project www.newrules.org 9
Germany: The Rise and Rise of Feed-In TariffsIn Germany the motivation for a renewable energy plan was somewhat different than Denmark. Concerns about climate change and environmental degradation motivated the initial commitment to renewable power in the late 1980s, as did an interest in developing a native industry. Later, Green Party participation in the government added an anti-nuclear component to renewable energy policy.
The following timeline illustrates Germany’s road to feed-in tariffs.
1987-1990: A small start
Individual German states offered wind power incentives as early as 1987, when Niedersachsen provided a 50 percent capital subsidy that was phased out by 1995.19 The federal renewable energy program was started in 1989 with a market stimulation program. It provided a fixed price payment for wind power (with a total budget sufficient for up to 250 MW) and investment incentives for private operators (e.g. farmers) to invest in renewable energy. The program did not yet guarantee interconnection for small producers.20
1991-1999: Feed-In Tariff accelerates wind, some solar
In 1991, the Germans adopted feed-in tariffs when they enacted their Electricity Feed-In law. Utilities were required to purchase renewable energy generation and to pay 80 percent of the historical average retail price to producers of qualified renewables.21 The program was capped at 5 percent of a utility’s generation.22
In 1999, Germany introduced a parallel incentive for solar PV, known as the 100,000 Roofs Program. It provided zero interest loans and a grant worth 12.5 percent of the system cost. The program ended in 2003 with 346 MW installed across the country.23
2000-Present: Revised FIT broadens German renewable development
In 2000, major revisions were made in the form of the Renewable Energy Act (EEG). This landmark law decoupled feed-in tariff prices from retail rates and instead based prices on the cost of production. There was a guaranteed payment for 20 years and the cap on renewables was removed. The EEG was scheduled for review every two years starting in 2007.24
The law also introduced more sophisticated elements to feed-in tariffs, including tariff degression to account for improving technology, stepped tariffs based on the size of a energy producer and the quality of the renewable resource, and set rates separately for wind, solar, and other technologies.25 The EEG also created the cost-sharing program where the incremental costs of renewable generation are spread among all high-voltage grid operators and end customers.26
In August 2004, the EEG was revised (with support from conservatives), adding firm targets for renewable energy generation and revising tariff prices. Solar PV received a price increase, as did several other technologies, and onshore wind generators saw their tariff decrease.27 The law also enforced the guaranteed connection and priority access for renewable energy systems.
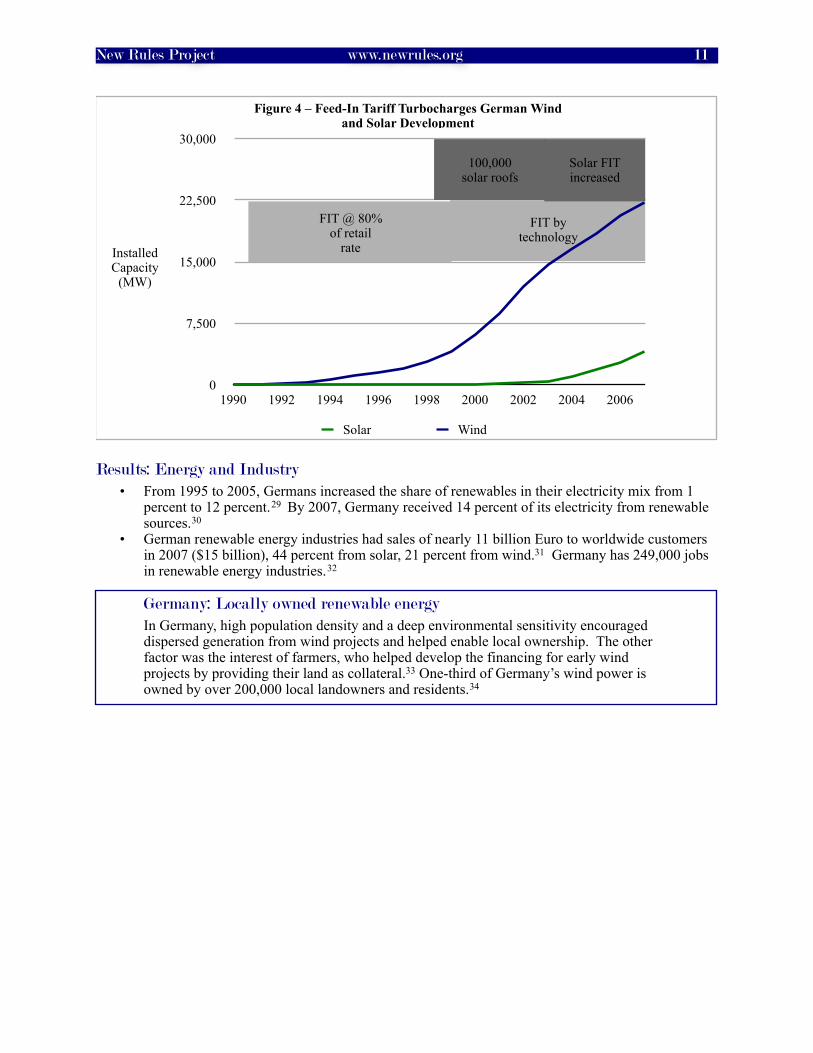
The result of the German commitment to renewable energy has been a staggering increase in renewable energy production as well as jobs and industry. Figure 4 illustrates the fruits of Germany’s commitment to the feed-in tariff – substantial increases in wind and solar power capacity.28
1990s
2000s
Tariff degression – an annual decrease in the new contract price for a feed-in tariff
Example: 5% solar tariff degression• A 2008-installed solar panel gets 60
cents per kWh for 20 years• A 2009-installed solar panel gets 57
cents per kWh for 20 years
New Rules Project www.newrules.org 10
0
7,500
15,000
22,500
30,000
1990 1992 1994 1996 1998 2000 2002 2004 2006
Figure 4 – Feed-In Tariff Turbocharges German Wind and Solar Development
FIT @ 80% of retail
rate
FIT by technology
Solar FIT increased
100,000 solar roofs
Installed Capacity
(MW)
Solar Wind
Results: Energy and Industry• From 1995 to 2005, Germans increased the share of renewables in their electricity mix from 1
percent to 12 percent.29 By 2007, Germany received 14 percent of its electricity from renewable sources.30
• German renewable energy industries had sales of nearly 11 billion Euro to worldwide customers in 2007 ($15 billion), 44 percent from solar, 21 percent from wind.31 Germany has 249,000 jobs in renewable energy industries.32
Germany: Locally owned renewable energyIn Germany, high population density and a deep environmental sensitivity encouraged dispersed generation from wind projects and helped enable local ownership. The other factor was the interest of farmers, who helped develop the financing for early wind projects by providing their land as collateral.33 One-third of Germany’s wind power is owned by over 200,000 local landowners and residents.34
New Rules Project www.newrules.org 11
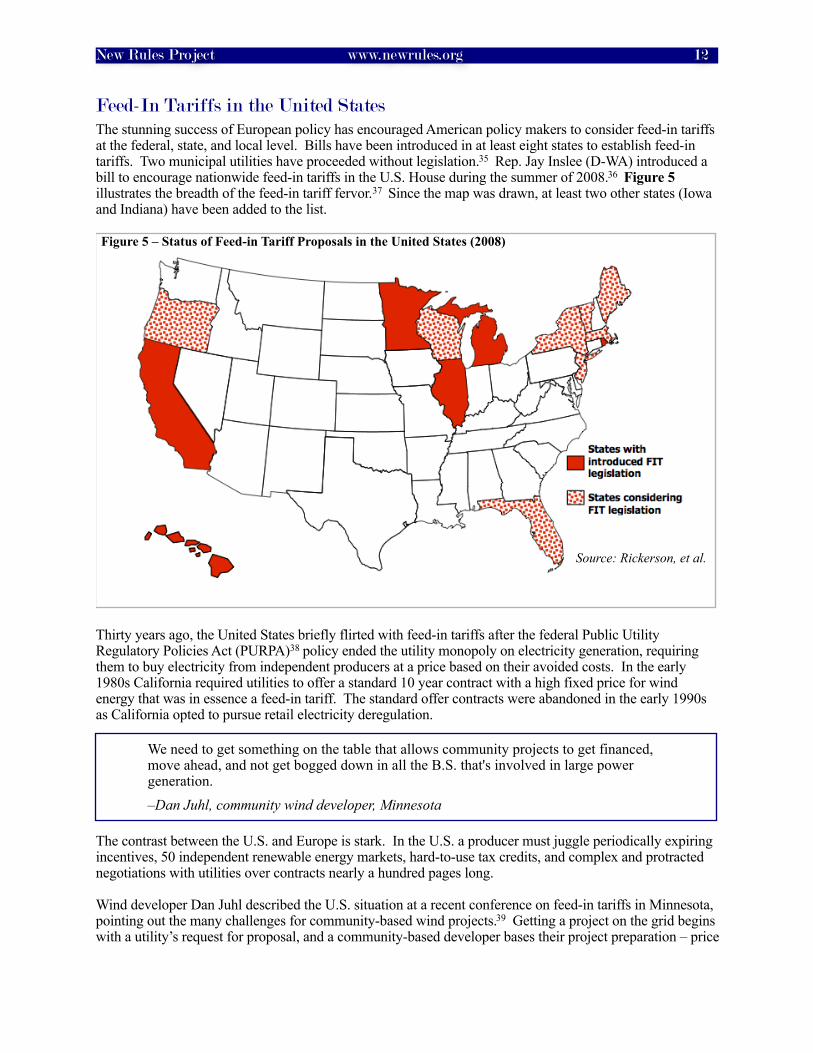
Feed-In Tariffs in the United StatesThe stunning success of European policy has encouraged American policy makers to consider feed-in tariffs at the federal, state, and local level. Bills have been introduced in at least eight states to establish feed-in tariffs. Two municipal utilities have proceeded without legislation.35 Rep. Jay Inslee (D-WA) introduced a bill to encourage nationwide feed-in tariffs in the U.S. House during the summer of 2008.36 Figure 5 illustrates the breadth of the feed-in tariff fervor.37 Since the map was drawn, at least two other states (Iowa and Indiana) have been added to the list.
Figure 5 – Status of Feed-in Tariff Proposals in the United States (2008)
Source: Rickerson, et al.
Thirty years ago, the United States briefly flirted with feed-in tariffs after the federal Public Utility Regulatory Policies Act (PURPA)38 policy ended the utility monopoly on electricity generation, requiring them to buy electricity from independent producers at a price based on their avoided costs. In the early 1980s California required utilities to offer a standard 10 year contract with a high fixed price for wind energy that was in essence a feed-in tariff. The standard offer contracts were abandoned in the early 1990s as California opted to pursue retail electricity deregulation.
The contrast between the U.S. and Europe is stark. In the U.S. a producer must juggle periodically expiring incentives, 50 independent renewable energy markets, hard-to-use tax credits, and complex and protracted negotiations with utilities over contracts nearly a hundred pages long.
Wind developer Dan Juhl described the U.S. situation at a recent conference on feed-in tariffs in Minnesota, pointing out the many challenges for community-based wind projects.39 Getting a project on the grid begins with a utility’s request for proposal, and a community-based developer bases their project preparation – price
We need to get something on the table that allows community projects to get financed, move ahead, and not get bogged down in all the B.S. that's involved in large power generation. –Dan Juhl, community wind developer, Minnesota
New Rules Project www.newrules.org 12

quotes for turbines and installation, and other parts of the wind project – on the utility’s timeline. The utility usually advertises a particular date for the selection of the winning bid. But once the developer wins the bid process, they begin the power purchase agreement negotiation. Dan noted,
“It takes a year...[there are] land mines in the power contract...You have to negotiate them out or you will not get financing.”
By the time the power purchase contract is negotiated, the community-based developer may be required to renegotiate purchase agreements with suppliers since so much time has elapsed. The entire project is jeopardized. Dan sees a need for legislation to simplify the process:
“We need to get something on the table that allows community projects to get financed, move ahead, and not get bogged down in all the BS that's involved in large power generation.”
Power purchase contracts in the U.S. can be very complex and lengthy. In Germany, a producer gets a 20-year, all-in-one contract that ensures a reasonable profit. The contract is five pages long.40
European renewable energy leaders were driven by more than environmentalism – they wanted to capture the economic benefits and green jobs from their renewable energy development. FITs created a vast, competitive market for renewable energy production by creating a truly level playing field for development. With prices set for reasonable cost recovery and profit, a producer need not rely on attracting the relatively few individuals or corporations with large amounts of tax liability (like in the U.S.). The opportunities for ownership were dramatically broadened.
The result of this market democratization was significant. In Germany, 45 percent of wind projects are locally owned. In Denmark, 83 percent of wind projects are owned by individuals or local cooperatives.41 And for each of these locally owned projects, more of the investment dollar stays in the community and country, creating a cycle of more investment and jobs.
New Rules Project www.newrules.org 13

Why Feed-In Tariffs WorkA feed-in tariff incorporates three basic principles for increasing renewable energy generation: fairness, simplicity, and stability (Figure 6). Policies based on these principles tend to achieve three goals: a) much broader and dispersed ownership of renewable energy; b) economic development and c) energy security. Evidence from countries with FITs shows that it often achieves these benefits at a lower cost than alternative renewable energy incentives.42
SimplicityA feed-in tariff makes generating renewable energy simple. If you build a renewable electricity generator, you’ll get paid one specific price for every kilowatt-hour you produce. Prices are set to guarantee a reasonable rate of return, encouraging further development and more potential owners.
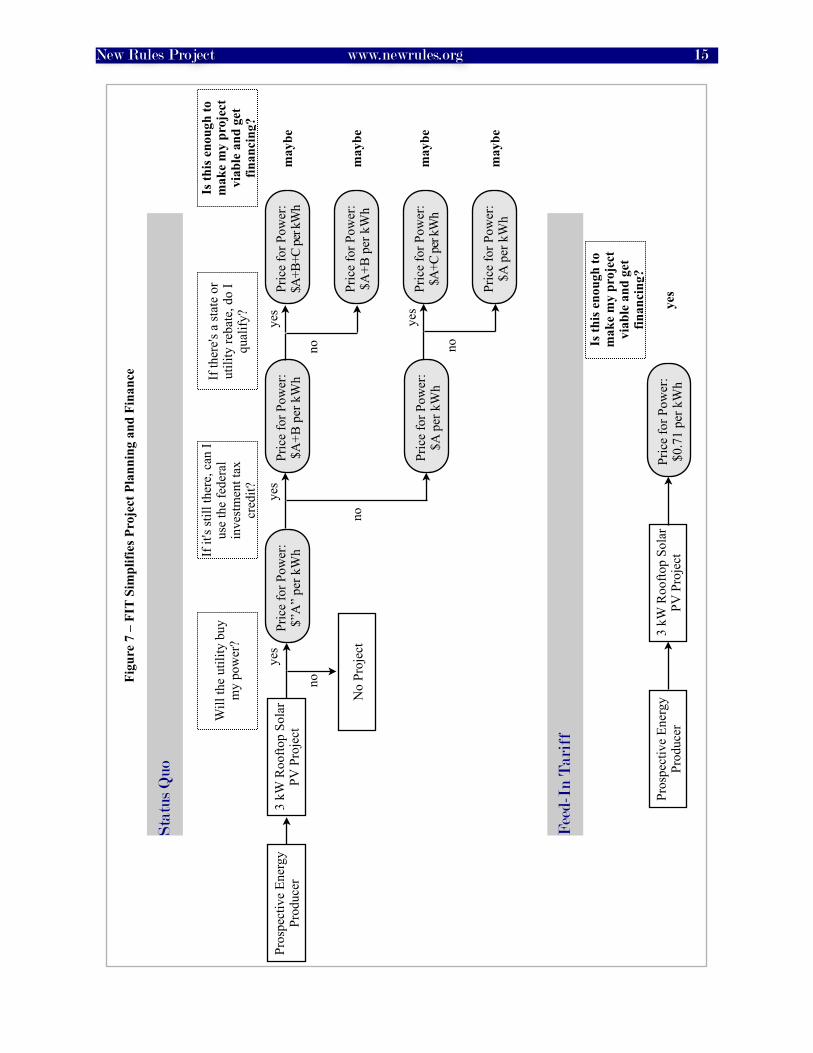
Figure 7 (next page) illustrates how someone interested in renewable energy is compensated under a feed-in tariff, and how this contrasts with the status quo in the United States.
In contrast to existing incentives like the federal production tax credit, with a FIT there’s no negotiating with utilities, partnering with tax-credit-hungry investors, or uncertainties about Congress.
StabilityA feed-in tariff makes the market stable. Utilities must connect renewable generators and buy their electricity at the incentive rates for 20 years.
Contrast the FIT with the existing system, where federal incentives can expire, creating boom-and-bust cycles in the market. This stability is a significant reason that Denmark and Germany generate more than 15 percent of their electricity from renewable energy, while the U.S. achieved only 3 percent in 2007.43
FairnessA feed-in tariff makes the market fairer because it removes the barriers to participation from a number of players. A FIT allows people with little tax liability or non-taxable entities – cities, counties, states, non-profits – to pursue renewable energy projects.
Most current U.S. incentives are in the form of tax credits, which are only valuable to individuals or businesses with a lot of tax liability. This unfair system reduces the pool of potential renewable energy investors and dollars, to everyone’s detriment.
Consider the Paper TrailA typical American power purchase agreement between a producer and the utility is 85 pages. In Germany, the contract is 2-4 pages.
New Rules Project www.newrules.org 14
Energy Security
Lower Costs
Fairness
Simplicity
Stability
Economic Development & Green Jobs
Local Ownership
Figure 6 - Basic principles of a Feed-in Tariff
New Rules Project www.newrules.org 15
Figu
re 7
– F
IT S
impl
ifies
Pro
ject
Pla
nnin
g an
d Fi
nanc
e
Fee
d-In
Tar
iff
Is th
is e
noug
h to
m
ake
my
proj
ect
viab
le a
nd g
et
finan
cing
?
Pros
pect
ive
Ener
gy
Prod
ucer
3 kW
Roo
ftop
Sola
r PV
Pro
ject
Pric
e fo
r Pow
er:
$0.7
1 pe
r kW
hye
s
Sta
tus
Qu
o
Will
the
utili
ty b
uy
my
pow
er?
If it
's st
ill th
ere,
can
I us
e th
e fe
dera
l in
vest
men
t tax
cr
edit?
Pros
pect
ive
Ener
gy
Prod
ucer
3 kW
Roo
ftop
Sola
r PV
Pro
ject
No
Proj
ect
yes
no
Pric
e fo
r Pow
er:
$”A
” pe
r kW
hno
yes
Pric
e fo
r Pow
er:
$A p
er k
Wh
Pric
e fo
r Pow
er:
$A+B
per
kW
h
yes
no
If th
ere's
a st
ate
or
utili
ty re
bate
, do
I qu
alify
?
Pric
e fo
r Pow
er:
$A+B
+C pe
r kW
h
Pric
e fo
r Pow
er:
$A+B
per
kW
h
no
yes
Pric
e fo
r Pow
er:
$A+C
per k
Wh
Pric
e fo
r Pow
er:
$A p
er k
Wh
Is th
is e
noug
h to
m
ake
my
proj
ect
viab
le a
nd g
et
finan
cing
?
may
be
may
be
may
be
may
be
Designing a Feed-In TariffThere is no one-size-fits-all feed-in tariff policy. There are many variations as policymakers adapt the core design to their local context and needs.
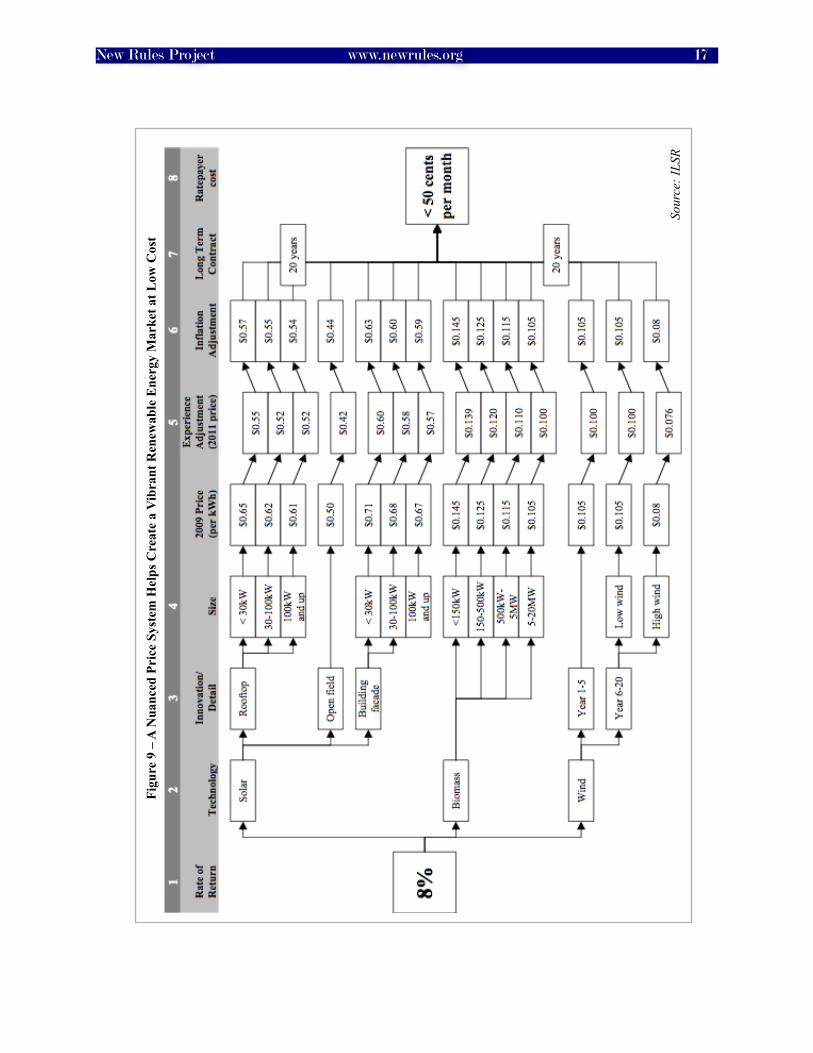
Setting FIT RatesFigure 9 (next page) illustrates the price setting process for a feed-in tariff that supports solar PV, biomass, and wind electricity generation. The following step-by-step process corresponds to the steps on the chart.
1. Offer a reasonable return
Utility investments in regulated states typically receive a guaranteed 10-12 percent return on investment. Feed-In Tariffs are often set to provide a 8-10 percent internal rate of return. This strategy is used in Germany and in a proposed national FIT for the United States (Renewable Energy Jobs and Security Act of 2008).44 Spain and a few other countries also set a FIT as a premium over retail electricity rates.
2. Configure by technology
Feed-In Tariffs encourage multi-technology investment in order to accelerate the technological learning curve and achieve manufacturing economies of scale. Since costs to generate electricity differ for solar, wind and biomass, payments are adjusted accordingly to encourage a diversity of renewable energy technologies and industries.
3. Award innovation
Some feed-in tariff plans are designed to foster innovation and to achieve social goals. For example, solar on rooftops instead of fields preserves open space and turns shelter into power generation. Placing solar panels on building facades helps increase a building’s self-sufficiency. FIT rates can increase for these technologies to encourage their development.
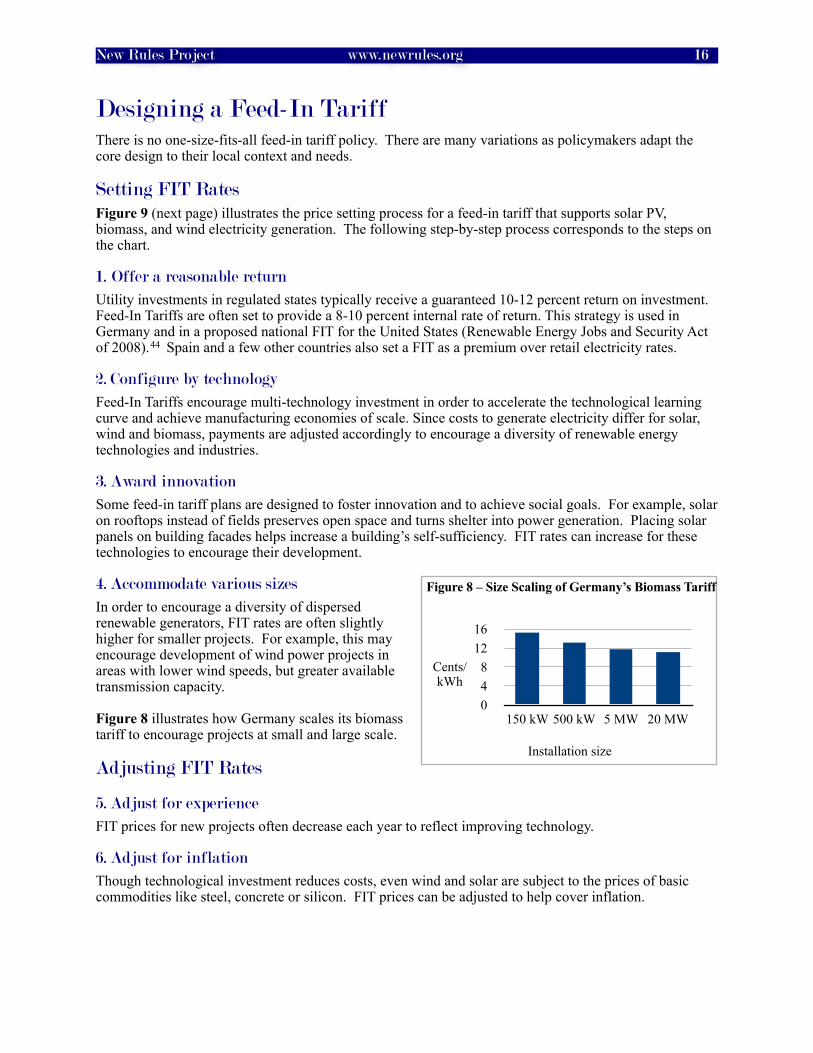
4. Accommodate various sizes
In order to encourage a diversity of dispersed renewable generators, FIT rates are often slightly higher for smaller projects. For example, this may encourage development of wind power projects in areas with lower wind speeds, but greater available transmission capacity.
Figure 8 illustrates how Germany scales its biomass tariff to encourage projects at small and large scale.
Adjusting FIT Rates
5. Adjust for experience
FIT prices for new projects often decrease each year to reflect improving technology.
6. Adjust for inflation
Though technological investment reduces costs, even wind and solar are subject to the prices of basic commodities like steel, concrete or silicon. FIT prices can be adjusted to help cover inflation.
048
1216
150 kW 500 kW 5 MW 20 MW
Cents/kWh
Installation size
Figure 8 – Size Scaling of Germany’s Biomass Tariff
New Rules Project www.newrules.org 16
Sour
ce: I
LSR
Figu
re 9
– A
Nua
nced
Pri
ce S
yste
m H
elps
Cre
ate
a V
ibra
nt R
enew
able
Ene
rgy
Mar
ket a
t Low
Cos
t
New Rules Project www.newrules.org 17

7. Provide a long-term contract
A feed-in tariff guarantees a long-term purchase contract for electricity to help investors recover their investment. Renewable energy projects like wind and solar have no fuel costs, so their entire investment is up front. Long term contracts, generally 20 years, ensure that energy producers recover their costs and help them secure financing.
8. Share the Cost
A feed-in tariff promotes simple cost-sharing of the benefits of renewable energy. Any incremental increase in the cost of electricity from projects using the FIT is spread across the entire set of electricity consumers. In European countries, this cost-sharing is national, with partial exemptions for electricity-intensive industries. In the U.S. it may be on a state or on a utility basis.
New Rules Project www.newrules.org 18
The Economics of a Feed-in TariffThe motivation for simple renewable energy policy like a FIT is the potential to secure more of the economic and social benefits of a transition to renewable energy than using a patchwork policy approach. Evidence from European countries with feed-in tariffs suggests that this is exactly what happens. This section outlines several ways that feed-in tariffs have improved economic development in the countries that use them.
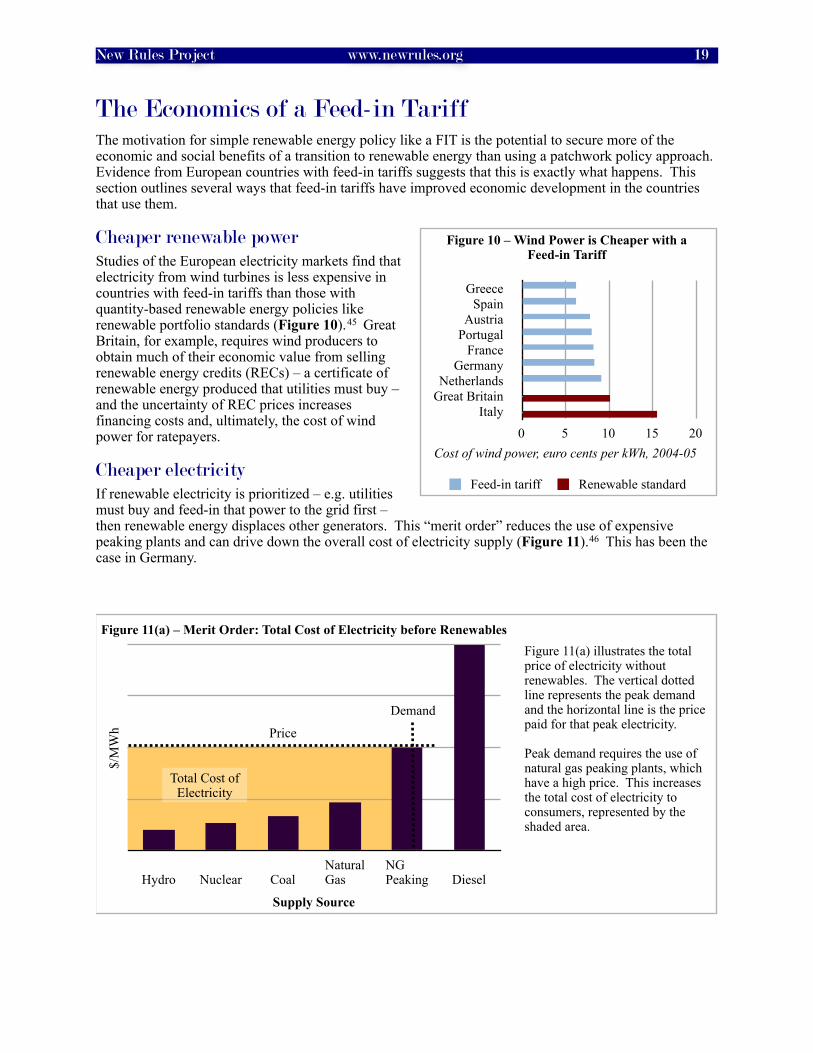
Cheaper renewable powerStudies of the European electricity markets find that electricity from wind turbines is less expensive in countries with feed-in tariffs than those with quantity-based renewable energy policies like renewable portfolio standards (Figure 10).45 Great Britain, for example, requires wind producers to obtain much of their economic value from selling renewable energy credits (RECs) – a certificate of renewable energy produced that utilities must buy – and the uncertainty of REC prices increases financing costs and, ultimately, the cost of wind power for ratepayers.
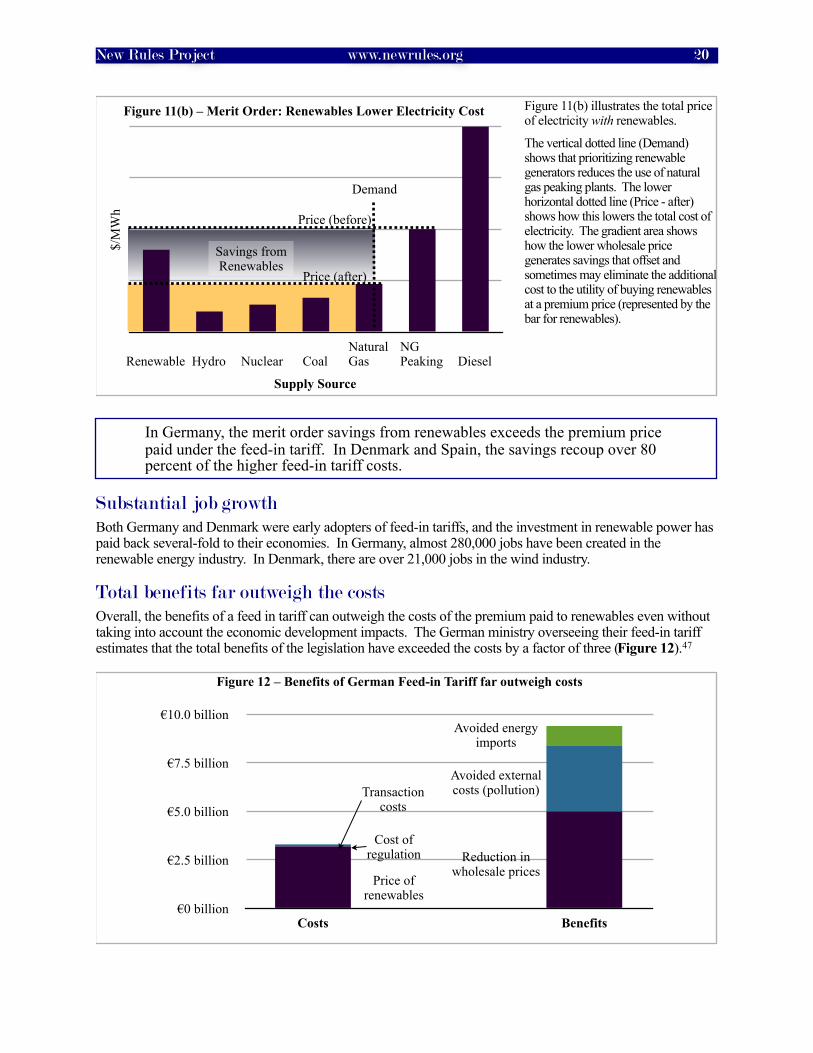
Cheaper electricityIf renewable electricity is prioritized – e.g. utilities must buy and feed-in that power to the grid first – then renewable energy displaces other generators. This “merit order” reduces the use of expensive peaking plants and can drive down the overall cost of electricity supply (Figure 11).46 This has been the case in Germany.
Hydro Nuclear CoalNaturalGas
NG Peaking Diesel
$/M
Wh
Supply Source
Figure 11(a) – Merit Order: Total Cost of Electricity before Renewables
Demand
Price
Total Cost of Electricity
Figure 11(a) illustrates the total price of electricity without renewables. The vertical dotted line represents the peak demand and the horizontal line is the price paid for that peak electricity.
Peak demand requires the use of natural gas peaking plants, which have a high price. This increases the total cost of electricity to consumers, represented by the shaded area.
Cost of wind power, euro cents per kWh, 2004-05
GreeceSpain
AustriaPortugal
FranceGermany
NetherlandsGreat Britain
Italy0 5 10 15 20
Feed-in tariff Renewable standard
Figure 10 – Wind Power is Cheaper with a Feed-in Tariff
New Rules Project www.newrules.org 19
Renewable Hydro Nuclear CoalNaturalGas
NG Peaking Diesel
$/M
Wh
Supply Source
Demand
Savings from Renewables
Figure 11(b) – Merit Order: Renewables Lower Electricity Cost Figure 11(b) illustrates the total price of electricity with renewables.
The vertical dotted line (Demand) shows that prioritizing renewable generators reduces the use of natural gas peaking plants. The lower horizontal dotted line (Price - after) shows how this lowers the total cost of electricity. The gradient area shows how the lower wholesale price generates savings that offset and sometimes may eliminate the additional cost to the utility of buying renewables at a premium price (represented by the bar for renewables).
Price (before)
Price (after)
Substantial job growthBoth Germany and Denmark were early adopters of feed-in tariffs, and the investment in renewable power has paid back several-fold to their economies. In Germany, almost 280,000 jobs have been created in the renewable energy industry. In Denmark, there are over 21,000 jobs in the wind industry.
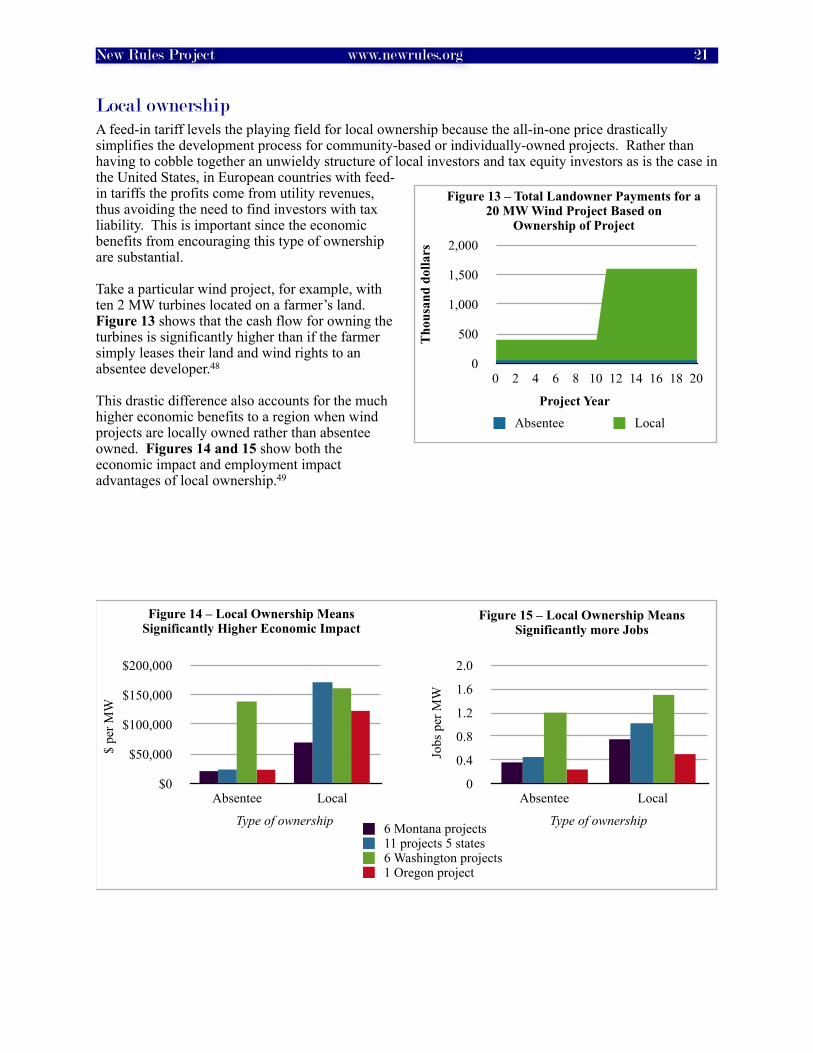
Total benefits far outweigh the costsOverall, the benefits of a feed in tariff can outweigh the costs of the premium paid to renewables even without taking into account the economic development impacts. The German ministry overseeing their feed-in tariff estimates that the total benefits of the legislation have exceeded the costs by a factor of three (Figure 12).47
€0 billion
€2.5 billion
€5.0 billion
€7.5 billion
€10.0 billion
Costs Benefits
Reduction in wholesale prices
Avoided external costs (pollution)
Avoided energy imports
Figure 12 – Benefits of German Feed-in Tariff far outweigh costs
Transaction costs
Cost of regulation
Price of renewables
In Germany, the merit order savings from renewables exceeds the premium price paid under the feed-in tariff. In Denmark and Spain, the savings recoup over 80 percent of the higher feed-in tariff costs.
New Rules Project www.newrules.org 20
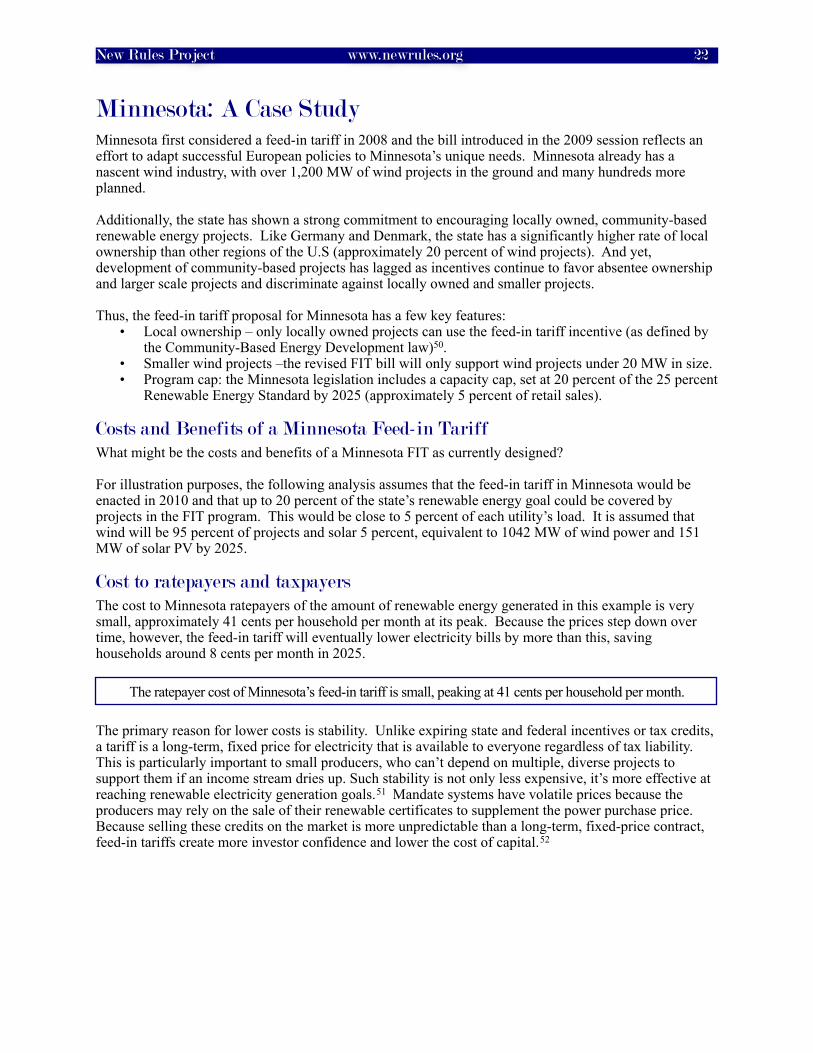
Local ownershipA feed-in tariff levels the playing field for local ownership because the all-in-one price drastically simplifies the development process for community-based or individually-owned projects. Rather than having to cobble together an unwieldy structure of local investors and tax equity investors as is the case in the United States, in European countries with feed-in tariffs the profits come from utility revenues, thus avoiding the need to find investors with tax liability. This is important since the economic benefits from encouraging this type of ownership are substantial.
Take a particular wind project, for example, with ten 2 MW turbines located on a farmer’s land. Figure 13 shows that the cash flow for owning the turbines is significantly higher than if the farmer simply leases their land and wind rights to an absentee developer.48
This drastic difference also accounts for the much higher economic benefits to a region when wind projects are locally owned rather than absentee owned. Figures 14 and 15 show both the economic impact and employment impact advantages of local ownership.49
$0
$50,000
$100,000
$150,000
$200,000
Absentee Local
Type of ownership
Figure 14 – Local Ownership Means Significantly Higher Economic Impact
$ pe
r MW
0
0.4
0.8
1.2
1.6
2.0
Absentee Local
Type of ownership
Figure 15 – Local Ownership Means Significantly more Jobs
Jobs
per
MW
6 Montana projects11 projects 5 states 6 Washington projects 1 Oregon project
0
500
1,000
1,500
2,000
0 2 4 6 8 10 12 14 16 18 20
Absentee Local
Figure 13 – Total Landowner Payments for a 20 MW Wind Project Based on
Ownership of Project
Tho
usan
d do
llars
Project Year
New Rules Project www.newrules.org 21
Minnesota: A Case StudyMinnesota first considered a feed-in tariff in 2008 and the bill introduced in the 2009 session reflects an effort to adapt successful European policies to Minnesota’s unique needs. Minnesota already has a nascent wind industry, with over 1,200 MW of wind projects in the ground and many hundreds more planned.
Additionally, the state has shown a strong commitment to encouraging locally owned, community-based renewable energy projects. Like Germany and Denmark, the state has a significantly higher rate of local ownership than other regions of the U.S (approximately 20 percent of wind projects). And yet, development of community-based projects has lagged as incentives continue to favor absentee ownership and larger scale projects and discriminate against locally owned and smaller projects.
Thus, the feed-in tariff proposal for Minnesota has a few key features:• Local ownership – only locally owned projects can use the feed-in tariff incentive (as defined by
the Community-Based Energy Development law)50. • Smaller wind projects –the revised FIT bill will only support wind projects under 20 MW in size. • Program cap: the Minnesota legislation includes a capacity cap, set at 20 percent of the 25 percent
Renewable Energy Standard by 2025 (approximately 5 percent of retail sales).
Costs and Benefits of a Minnesota Feed-in TariffWhat might be the costs and benefits of a Minnesota FIT as currently designed?
For illustration purposes, the following analysis assumes that the feed-in tariff in Minnesota would be enacted in 2010 and that up to 20 percent of the state’s renewable energy goal could be covered by projects in the FIT program. This would be close to 5 percent of each utility’s load. It is assumed that wind will be 95 percent of projects and solar 5 percent, equivalent to 1042 MW of wind power and 151 MW of solar PV by 2025.
Cost to ratepayers and taxpayersThe cost to Minnesota ratepayers of the amount of renewable energy generated in this example is very small, approximately 41 cents per household per month at its peak. Because the prices step down over time, however, the feed-in tariff will eventually lower electricity bills by more than this, saving households around 8 cents per month in 2025.
The primary reason for lower costs is stability. Unlike expiring state and federal incentives or tax credits, a tariff is a long-term, fixed price for electricity that is available to everyone regardless of tax liability. This is particularly important to small producers, who can’t depend on multiple, diverse projects to support them if an income stream dries up. Such stability is not only less expensive, it’s more effective at reaching renewable electricity generation goals.51 Mandate systems have volatile prices because the producers may rely on the sale of their renewable certificates to supplement the power purchase price. Because selling these credits on the market is more unpredictable than a long-term, fixed-price contract, feed-in tariffs create more investor confidence and lower the cost of capital.52
The ratepayer cost of Minnesota’s feed-in tariff is small, peaking at 41 cents per household per month.
New Rules Project www.newrules.org 22
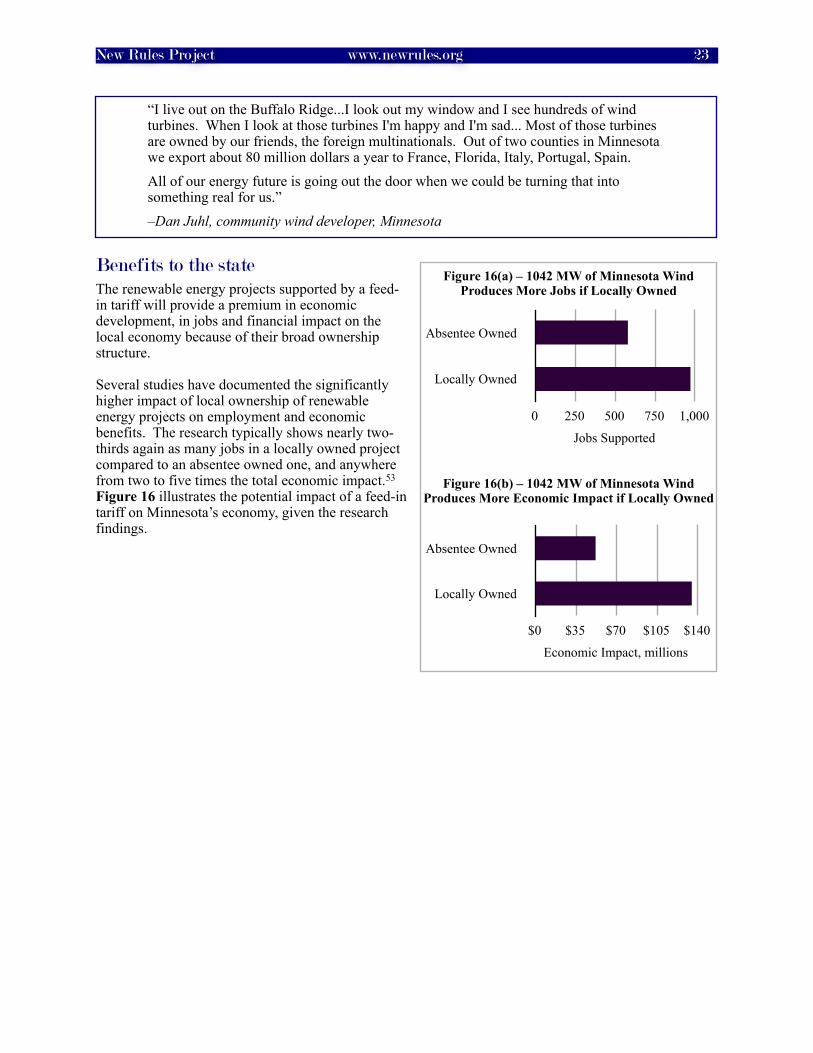
Benefits to the stateThe renewable energy projects supported by a feed-in tariff will provide a premium in economic development, in jobs and financial impact on the local economy because of their broad ownership structure.
Several studies have documented the significantly higher impact of local ownership of renewable energy projects on employment and economic benefits. The research typically shows nearly two-thirds again as many jobs in a locally owned project compared to an absentee owned one, and anywhere from two to five times the total economic impact.53 Figure 16 illustrates the potential impact of a feed-in tariff on Minnesota’s economy, given the research findings.
“I live out on the Buffalo Ridge...I look out my window and I see hundreds of wind turbines. When I look at those turbines I'm happy and I'm sad... Most of those turbines are owned by our friends, the foreign multinationals. Out of two counties in Minnesota we export about 80 million dollars a year to France, Florida, Italy, Portugal, Spain.All of our energy future is going out the door when we could be turning that into something real for us.”–Dan Juhl, community wind developer, Minnesota
Absentee Owned
Locally Owned
$0 $35 $70 $105 $140
Economic Impact, millions
Absentee Owned
Locally Owned
0 250 500 750 1,000
Jobs Supported
Figure 16(a) – 1042 MW of Minnesota Wind Produces More Jobs if Locally Owned
Figure 16(b) – 1042 MW of Minnesota Wind Produces More Economic Impact if Locally Owned
New Rules Project www.newrules.org 23
Questions about Feed-In TariffsWith a history of favoring market interventions based on quantity rather than price, many U.S. utility and regulatory representatives raise concerns about feed-in tariffs. Here are some answers to common questions or criticisms.
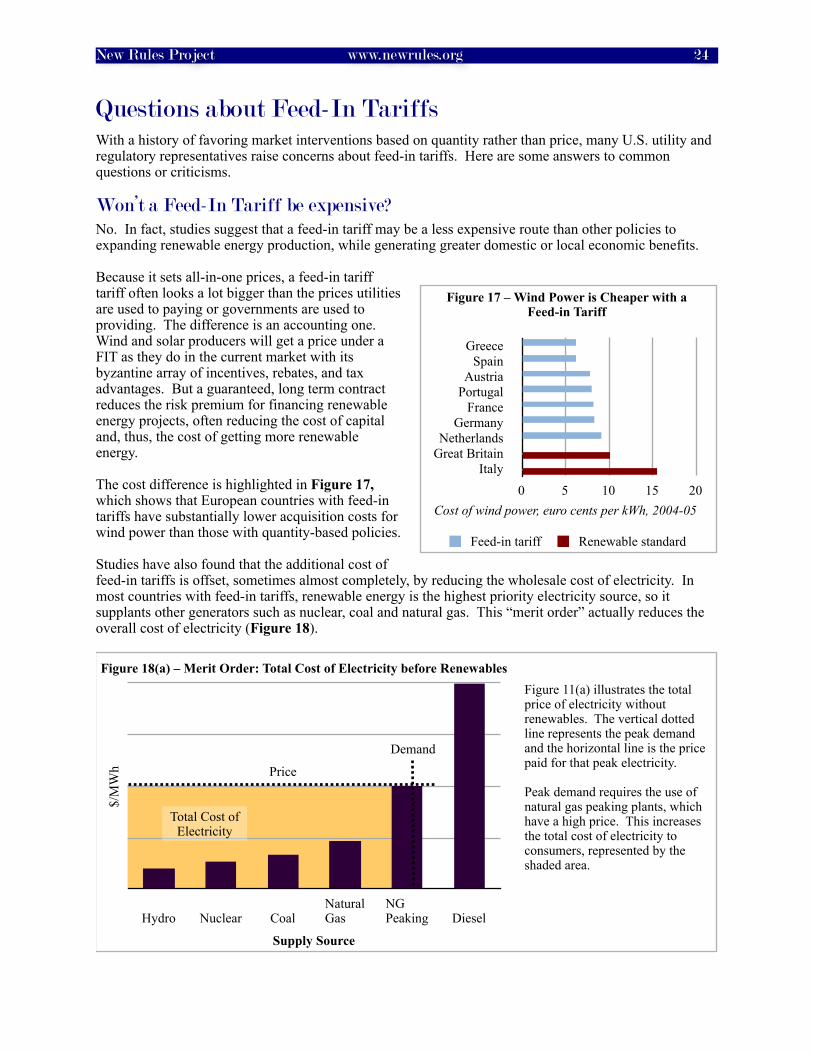
Won’t a Feed-In Tariff be expensive?No. In fact, studies suggest that a feed-in tariff may be a less expensive route than other policies to expanding renewable energy production, while generating greater domestic or local economic benefits.
Because it sets all-in-one prices, a feed-in tariff tariff often looks a lot bigger than the prices utilities are used to paying or governments are used to providing. The difference is an accounting one. Wind and solar producers will get a price under a FIT as they do in the current market with its byzantine array of incentives, rebates, and tax advantages. But a guaranteed, long term contract reduces the risk premium for financing renewable energy projects, often reducing the cost of capital and, thus, the cost of getting more renewable energy.
The cost difference is highlighted in Figure 17, which shows that European countries with feed-in tariffs have substantially lower acquisition costs for wind power than those with quantity-based policies.
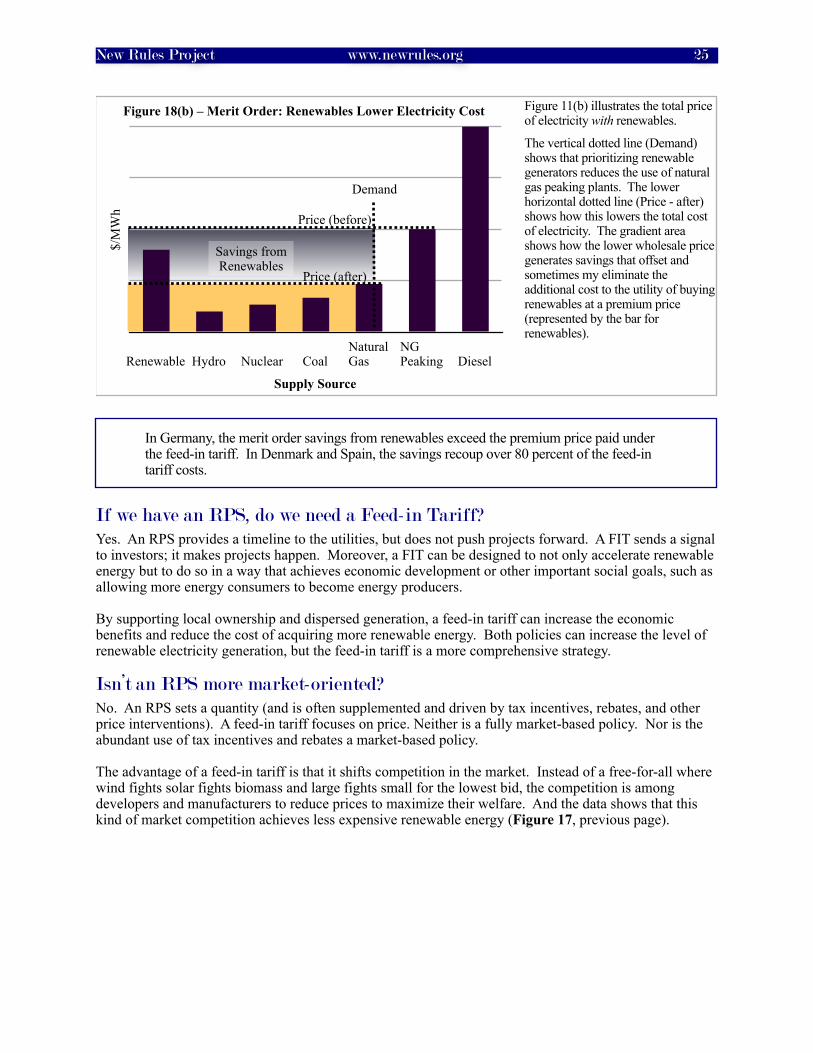
Studies have also found that the additional cost of feed-in tariffs is offset, sometimes almost completely, by reducing the wholesale cost of electricity. In most countries with feed-in tariffs, renewable energy is the highest priority electricity source, so it supplants other generators such as nuclear, coal and natural gas. This “merit order” actually reduces the overall cost of electricity (Figure 18).
Hydro Nuclear CoalNaturalGas
NG Peaking Diesel
$/M
Wh
Supply Source
Figure 18(a) – Merit Order: Total Cost of Electricity before Renewables
Demand
Price
Total Cost of Electricity
Figure 11(a) illustrates the total price of electricity without renewables. The vertical dotted line represents the peak demand and the horizontal line is the price paid for that peak electricity.
Peak demand requires the use of natural gas peaking plants, which have a high price. This increases the total cost of electricity to consumers, represented by the shaded area.
Cost of wind power, euro cents per kWh, 2004-05
GreeceSpain
AustriaPortugal
FranceGermany
NetherlandsGreat Britain
Italy0 5 10 15 20
Feed-in tariff Renewable standard
Figure 17 – Wind Power is Cheaper with a Feed-in Tariff
New Rules Project www.newrules.org 24
Renewable Hydro Nuclear CoalNaturalGas
NG Peaking Diesel
$/M
Wh
Supply Source
Demand
Savings from Renewables
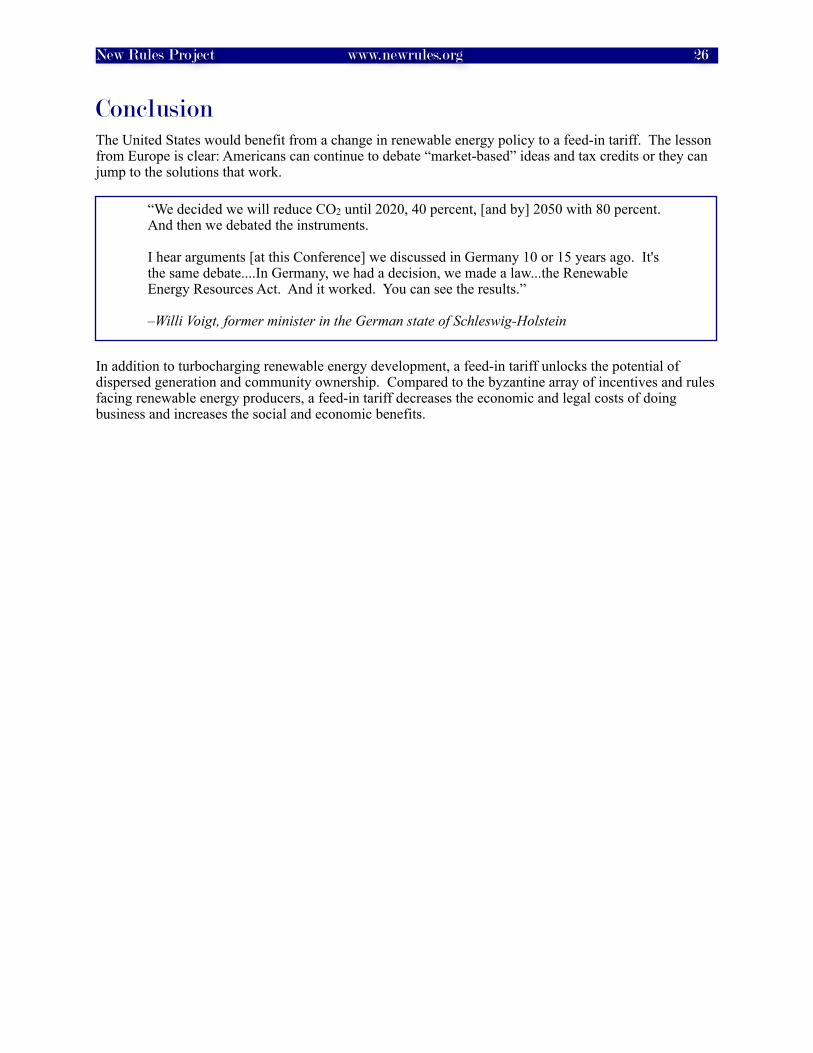
Figure 18(b) – Merit Order: Renewables Lower Electricity Cost Figure 11(b) illustrates the total price of electricity with renewables.
The vertical dotted line (Demand) shows that prioritizing renewable generators reduces the use of natural gas peaking plants. The lower horizontal dotted line (Price - after) shows how this lowers the total cost of electricity. The gradient area shows how the lower wholesale price generates savings that offset and sometimes my eliminate the additional cost to the utility of buying renewables at a premium price (represented by the bar for renewables).
Price (before)
Price (after)
If we have an RPS, do we need a Feed-in Tariff?Yes. An RPS provides a timeline to the utilities, but does not push projects forward. A FIT sends a signal to investors; it makes projects happen. Moreover, a FIT can be designed to not only accelerate renewable energy but to do so in a way that achieves economic development or other important social goals, such as allowing more energy consumers to become energy producers.
By supporting local ownership and dispersed generation, a feed-in tariff can increase the economic benefits and reduce the cost of acquiring more renewable energy. Both policies can increase the level of renewable electricity generation, but the feed-in tariff is a more comprehensive strategy.
Isn’t an RPS more market-oriented?No. An RPS sets a quantity (and is often supplemented and driven by tax incentives, rebates, and other price interventions). A feed-in tariff focuses on price. Neither is a fully market-based policy. Nor is the abundant use of tax incentives and rebates a market-based policy.
The advantage of a feed-in tariff is that it shifts competition in the market. Instead of a free-for-all where wind fights solar fights biomass and large fights small for the lowest bid, the competition is among developers and manufacturers to reduce prices to maximize their welfare. And the data shows that this kind of market competition achieves less expensive renewable energy (Figure 17, previous page).
In Germany, the merit order savings from renewables exceed the premium price paid under the feed-in tariff. In Denmark and Spain, the savings recoup over 80 percent of the feed-in tariff costs.
New Rules Project www.newrules.org 25
ConclusionThe United States would benefit from a change in renewable energy policy to a feed-in tariff. The lesson from Europe is clear: Americans can continue to debate “market-based” ideas and tax credits or they can jump to the solutions that work.
In addition to turbocharging renewable energy development, a feed-in tariff unlocks the potential of dispersed generation and community ownership. Compared to the byzantine array of incentives and rules facing renewable energy producers, a feed-in tariff decreases the economic and legal costs of doing business and increases the social and economic benefits.
“We decided we will reduce CO2 until 2020, 40 percent, [and by] 2050 with 80 percent. And then we debated the instruments.
I hear arguments [at this Conference] we discussed in Germany 10 or 15 years ago. It's the same debate....In Germany, we had a decision, we made a law...the Renewable Energy Resources Act. And it worked. You can see the results.”
–Willi Voigt, former minister in the German state of Schleswig-Holstein
New Rules Project www.newrules.org 26

About the Author
John Farrell is a research associate on the New Rules Project at the Institute for Local Self-Reliance, where he examines the benefits of local ownership and dispersed generation of renewable energy. His latest paper (prior to this one) is Rural Power: Community-Scaled Renewable Energy and Rural Economic Development. You can find more of his work and more information on the New Rules Project at www.newrules.org.
He can be reached at: [email protected] or 612-379-3815 x210.
New Rules Project www.newrules.org 27

ReferencesPhoto CreditsCover, top left - Energy Northwest (NREL PIX)Cover, bottom left - David Parsons (NREL PIX)Cover, right - Warren Gretz (NREL PIX)
Citations
New Rules Project www.newrules.org 28
1 Christianson, Russ. “Danish Wind Co-ops Can Show Us the Way.” Accessed 12/1/08 at http://tinyurl.com/6n86rd.
2 Bolinger, Mark. “Community Wind Power Ownership Schemes in Europe and their Relevance to the United States.” (Environmental Energy Technologies Division, Lawrence Berkeley National Laboratory, May 2001), 11.
3 Christianson.
4 Rickerson, Wilson. “Exploring Feed-in Tariffs for California.” (Presentation to CEC Feed-In Tariff Workshop, 6/30/08).
5 Bolinger.
6 Guey-Lee, Louise. “Wind Energy Developments: Incentives In Selected Countries.” (EIA, Renewable Energy Annual 1998), 7. Accessed 12/2/08 at http://tinyurl.com/5ame2z.
7 Helby, Peter. “Wind Power in Denmark.” (June 1996). Accessed 12/2/08 at http://tinyurl.com/5bqqpa.
8 In this system, each renewable energy generator receives a credit for each kWh of electricity produced. Each utility is required to acquire a certain number of permits each year, commensurate with the renewable quota (e.g. 20% of load).
9 Bolinger.
10 Klein, Arne, et al. “Evaluation of different feed-in tariff design options – Best practice paper for the International Feed-In Cooperation.” 2nd edition. (Ministry for the Environment, Nature Conservation and Nuclear Safety (BMU), October 2008), 48.
11 Klein, 52.
12 Kruse, Jane. “The End of One Danish Windmill Co-operative.” (Politiken, 2/9/06). Accessed 2/12/09 at http://tinyurl.com/chagn6.
13 “Wind Figures.” (Danish Wind Industry Association, 2008). Accessed 12/15/08 at http://tinyurl.com/5jnskx.
14 “Turnover.” (Danish Wind Industry Association, undated). Accessed 12/15/08 at http://tinyurl.com/5ljyf2.
“Wind turbines are creating Danish jobs.” (Danish Wind Industry Association, undated). Accessed 2/16/09 at http://tinyurl.com/bt26n5.
15 “Energy Statistics 2007.” (Danish Energy Agency, October 2008). Accessed 12/1/08 at http://tinyurl.com/62x8z5.
16 Wind power in Denmark. (2008, November 24). In Wikipedia, The Free Encyclopedia. Retrieved 15:51, December 1, 2008, from http://tinyurl.com/58qd6d
17 Sørenson, Hans Christian, et al. Middelgrunden 40 MW Offshore Wind Farm Denmark - Lessons Learned.” (After Johannesburg, Local Energy and Climate Policy: From Experience Gained Towards New Steps Wind Energy and Involvement of Local Partners - Munich September 2002). Accessed 12/15/08 at http://tinyurl.com/5tmauv.
18 Gipe, Paul. “Community-Owned Wind Development in Germany, Denmark, and the Netherlands.” (Wind-Works.org, 1996). Accessed 2/5/09 at http://tinyurl.com/5lzr9f.
19 Gipe.
20 Ragwitz, Dr. Mario and Dr. Claus Huber. “Feed-In Systems in Germany and Spain and a comparison.” (Fraunhofer, Institute, Systems and Innovation Research, undated). Accessed 12/11/08 at http://tinyurl.com/6hgpfw.
21 Klein, 41.
22 Ragwitz.
23 Stryi-Hipp, Gerhard. “Experience with the German Performance-Based Incentive Program.” (Presented to Solarpower 2004, San Francisco, CA, 10/19/04). Accessed 12/3/08 at http://tinyurl.com/5tymwe.
24 Ragwitz.
25 Ragwitz.
26 Ragwitz.
27 Ragwitz.
28 Sawin, Janet L, PhD. "Germany's Experience with Feed-In Tariffs." (Worldwatch Institute, 2008).
29 “IEA Wind 2002 Annual Report.” (International Energy Agency, 2002), 114. Accessed 1/7/08 at http://tinyurl.com/2esk2y.
30 Gipe, Paul. “Advanced Renewable Tariffs New Policy Option for North America.” (Presentation in Godeich, Ontario, undated).
31 “Renewable energy sources in figures - national and international development.” (BMU, June 2008). Accessed 12/15/08 at http://tinyurl.com/5knm8h.
New Rules Project www.newrules.org 29
32 Kratzat, Marlene, et al. “Short-and Long-Term Impacts of the Expansion of Renewable Energy on the German Labour Market.” (3/14/08). Accessed 2/16/09 at http://tinyurl.com/d5ac9r.
33 Gipe, “Community-Owned Wind Development in Germany, Denmark, and the Netherlands.”
34 Pahl, Greg. “Community Supported Wind Power.” (Mother Earth News, June/July 2008). Accessed 12/15/08 at http://tinyurl.com/5zt7tx.
35 Gainesville, FL, and Los Angeles, CA.
36 H.R. 6401. Accessed 12/9/08 at http://tinyurl.com/5v9qpf.
37 Rickerson, et al. “Feed-in Tariffs and Renewable Energy in the USA: a Policy Update.” (World Future Council, Heinrich Boell Foundation, North Carolina Solar Center: May 2008).
38 Wikipedia contributors. "Public Utility Regulatory Policies Act." (Wikipedia, The Free Encyclopedia). Accessed 12/12/08 at http://tinyurl.com/6apsax.
39 Bringing Renewable Energy Home, hosted by ILSR at St. Olaf College in Northfield, MN. January 9, 2009.
40 Voigt, Willi. Response given during a presentation at Bringing Renewable Energy Home (ILSR, hosted at St. Olaf College, 1/9/09).
41 Elliot, Dave. “Community-led Renewables.” (Paper for EERU Conference on 'Locating Renewables in Community Contexts', 2004). Accessed 11/28/07 at http://tinyurl.com/3xp9p7; Poetter, Bernhard. “Falling in Love with Wind.” Onearth. (NRDC, Summer 2007). Accessed 11/28/07 at http://tinyurl.com/3d8eeh.
42 Rickerson, Wilson H., et al. “If the Shoe FITs: Using Feed-in Tariffs to Meet U.S. Renewable Electricity Targets.” Electricity Journal, (v20 n4, May 2007, p. 73), 75;
“Renewable energy act is efficient and cost-effective.” (October, 2006). Accessed 11/28/07 at http://tinyurl.com/2p7drr.
Rickerson, Wilson and Robert C. Grace. “The Debate over Fixed Price Incentives for Renewable Electricity in Europe and the United States: Fallout and Future Directions.” (The Heinrich Böll Foundation, February 2007), 9-10. Accessed 11/28/07 at http://tinyurl.com/2ar86g
“The Support of Electricity from Renewable Energy Sources.” (Commission of the European Communities, 12/7/05), 7-8. Accessed 12/7/07 at http://tinyurl.com/22anrl.
43 Galbraith and Wald.
44 H.R. 6401. Accessed 12/9/08 at http://tinyurl.com/5v9qpf.
45 “Minimum price system compared with the quota model – which system is more efficient?” (German Wind Energy Association, updated June 2005). Accessed 2/16/09 at http://tinyurl.com/aot436.
46 Kildegaard, Arne. “Some economic aspects of feed-in tariffs and green certificate schemes.” (Presentation at Bringing Renewable Energy Home, 1/9/09, St. Olaf College, Northfield, MN).
47 Engineering Agency for New Energy Sources. Cited in “EEG – The Renewable Energy Sources Act: The success story of sustainable policies for Germany.” (Federal Ministry for the Environment, Nature Conservation, and Nuclear Safety, July 2007).
48 “Wind Power’s Contribution to Electric Power Generation and Impact on Farms and Rural Communities.” (Government Accountability Office, September 2004), 43. Accessed 6/30/08 at http://tinyurl.com/6mywcj.
49 Costanti, M. “Quantifying the Economic Development Impacts of Wind Power in Six Rural Montana Counties Using NREL’s JEDI Model.” (National Renewable Energy Laboratory, September 2004); Galluzzo, Teresa Welsh. "Small Packages, Big Benefits: Economic Advantages of Local Wind Projects." (Iowa Policy Project, updated July 2005); Kildegaard, Arne and Josephine Myers-Kuykindall. "Community vs. Corporate Wind: Does It Matter Who Develops the Wind in Big Stone County, MN?" (IREE, September 2006); Torgerson, Melissa, et al. "Umatilla County’s Economic Structure and the Economic Impacts of Wind Energy Development: An Input-Output Analysis." (Oregon State Extension Service, undated).
50 216B.1612, Minnesota Statutes 2007. Accessed 2/13/09 at http://tinyurl.com/br5flt.
51 Butler, Lucy and Karsten Neuhoff. “Comparison of Feed In Tariff, Quota and Auction Mechanisms to Support Wind Power Development.” Cambridge Working Papers in Economics CWPE 0503, (CMI Working Paper 70, 12/21/04), 7. Accessed 12/19/07 at http://tinyurl.com/365qv6.
52 Rickerson, Wilson H., et al. “If the Shoe FITs”;“Renewable energy act is efficient and cost-effective”; Rickerson, Wilson and Robert C. Grace;“The Support of Electricity from Renewable Energy
Sources.” (Commission of the European Communities, 12/7/05), 7-8. Accessed 12/7/07 at http://tinyurl.com/22anrl.
53 Farrell, John. “Homegrown Renewable Energy: the Benefits of Local Ownership.” (Presented to Increasing Energy Diversity and Independence: Growing Wind Power Generation; Presque Isle, Maine; October 21, 2008). Accessed 12/15/08 at http://tinyurl.com/6ycl7g.