feasibility assessment of using geoinformatics technology ... · feasibility assessment of using...
TRANSCRIPT
Seediscussions,stats,andauthorprofilesforthispublicationat:https://www.researchgate.net/publication/281833374
FeasibilityAssessmentofUsingGeoinformaticsTechnologyinDisasterDiseaseSurveillanceinaDevelopingCountry,Iran
ArticleinPLoSCurrents·May2015
DOI:10.1371/currents.dis.cbb7c1d062d4ec0646c2d67319a312f2
CITATIONS
0
READS
29
5authors,including:
Someoftheauthorsofthispublicationarealsoworkingontheserelatedprojects:
StressmanagementindisastersbasedonholyQuranViewproject
Recognitionofmedicalerrors’reportingsystemdimensionsineducationalhospitalsViewproject
KouroshHolakouieNaieni
TehranUniversityofMedicalSciences
142PUBLICATIONS1,288CITATIONS
SEEPROFILE
AliArdalan
TehranUniversityofMedicalSciences
120PUBLICATIONS616CITATIONS
SEEPROFILE
ElhamAhmadnezhad
33PUBLICATIONS73CITATIONS
SEEPROFILE
LeilaMohammadinia
TehranUniversityofMedicalSciences
9PUBLICATIONS4CITATIONS
SEEPROFILE
AllcontentfollowingthispagewasuploadedbyLeilaMohammadiniaon09March2017.
Theuserhasrequestedenhancementofthedownloadedfile.
4/16/2015 Feasibility Assessment of Using Geoinformatics Technology in Disaster Disease Surveillance in a Developing Country, Iran – PLOS Currents Disasters
http://currents.plos.org/disasters/article/feasibilityassessmentofusinggeoinformaticstechnologyindisasterdiseasesurveillanceinadevelopingcountry… 1/13
Feasibility Assessment of Using GeoinformaticsTechnology in Disaster Disease Surveillance ina Developing Country, IranApril 14, 2015 · Research article
This article is either a revised version or has previous revisionsEdition 1 April 14, 2015
Background and purpose: Geoinformatics technology retains an unprecedented trait of performing with asupersonic speed and precision in public health management whereas the existing disease surveillancesystems in developing countries lack using this technology. This article aims to assess the feasibility ofusing geoinformatics technology in disaster disease surveillance in a developing country, Iran.
Methods: A selfadministered questionnaire was developed based on technology acceptance model(TAM), and a semiquantitative survey was conducted in order to collect data. Fifty TUMS & HSpersonnel, currently involve in disease surveillance and information technology, were included. Initially, apilot study was conducted to test the validity and reliability of the questionnaire. Cronbach alpha,confirmatory factor analysis (CFA), and standard error of measurement (SEM) were calculated tovalidate the causal model.
Results: The results from structural equation analysis suggested that TAM provided a constructivepicture of using geoinformatics technology in disaster disease surveillance at TUMS &HS. The studyfound attitude (ATT) had a significant influence on participants intention to use (ITU) a new technology,and perceived ease of use (PEOU) was a strong determinant of perceived of usefulness (PU).Subsequently, PU and PEOU explained ATT substantially; even though the analysis showed insignificantstatistical association among these constructs. The high R2 (Coefficient of determination) of theconstructs described respondents positive instinct towards accepting a new technology.
Conclusion: The study reveals that personnel intent to adopt geoinformatics technology in disasterdisease surveillance; and at the same time, they possess a positive attitude towards the technology. Thisstudy also found PEOU has a strong influence on PU, so information sessions and training ongeoinformatics technology need to focus primarily on the applications and impacts of technology ondisaster disease surveillance.
Revisions
Abstract
Funding Statement
Authors
Md Omar Faruque Kourosh Holakouie Naieni Ali Ardalan Elham AhmadnezhadLeila Mohammadinia
4/16/2015 Feasibility Assessment of Using Geoinformatics Technology in Disaster Disease Surveillance in a Developing Country, Iran – PLOS Currents Disasters
http://currents.plos.org/disasters/article/feasibilityassessmentofusinggeoinformaticstechnologyindisasterdiseasesurveillanceinadevelopingcountry… 2/13
The study was approved by the Research Committee, School of Public Health, Tehran University ofMedical sciences, but the study was funded neither by the Research Committee nor by any other source.
WHO – World Health Organization; CDC – Center for Disease Controls; TAM –Technology AcceptanceModel; PU –Perceived of Usefulness; PEOU –Perceived Ease of Use; ATT –Attitude; ITU –Intention toUse; TUMS –Tehran University of Medical Sciences; HS – health System; SEM –Standard Error ofMeasurement; ICC –Intraclass Correlation Coefficient; GFI –Goodness of Fit; CFI –Comparative FitIndex; NFI –Normed Fit Index; RMS –Root Mean Square
Surveillance concept emerged with the development of public health in the Western world in the 17thcentury. Initially, the surveillance system was confined counting death and diseases. In 19th century,efforts were directed to nationalize health information, collect vital statistics, perform analysis, andreporting mechanism. In twentyfirst world health assembly–1968, the World Health Organization (WHO)integrated surveillance with disaster management along with other public health issues. Before that, arapid surveillance was successfully applied to assess the nutritional status and identify population inneed during Nigerian civil war in 1957.
Most of the developed countries and advanced public health organizations incorporated disastersurveillance, with a view to reduce morbidity and mortality during and after calamities. For instance, TheAmerican Red Cross and Centers for Disease Controls (CDC) established a natural disaster surveillancesystem in 1987. Following hurricane Katrina in 2006, CDC developed Disaster Surveillance Work Groupto coordinate surveillance activities, and evaluates existing tools and methods for assessing humanhealth status. Recently, WHO approved a resolution on, “strengthening national health emergency anddisaster management capacities and resilience of health systems” in order to strengthening the disastersurveillance system worldwide.
Islamic Republic of Iran experiences frequent natural disaster due to its geographical location. Sistanand Baluchestan earthquake, 2013 (magnitude 7.7), Bam earthquake, 2003 (magnitude 6.6), Qayenearthquake, 1997 (magnitude 7.3), and cyclone Gonu (2007) are some devastating disasters in thehistory of the country. In last four decades, disasters caused 109,000 deaths, affected 53 millionpopulations, and displaced tens of thousands of people. Iran scored 8 of 10 in disaster risk level andranked 2nd in the world possessing 1,073,366 long standing refugees in 2011.
Technology acceptance model (TAM) is a wellestablished, widely accepted, and frequently appliedresearch model. TAM analyzes four human intuitions toward technology acceptance: perceivedusefulness (PU), Perceived Ease of Use (PEOU), Attitude (ATT), and Intention to Use (ITU) towards anew technology. Davis (1989) defined PU as, “the degree to which a person believes that using aparticular system would enhance his or her job performance,” and PEOU as, “the degree to which aperson believes that using a particular system would be free of effort”. Davis et al (1989) definedattitude as, “the degree to which an individual evaluates and associates the target system with his or herjob”. In this study, intention to use of geoinformatics technology operationalized as an individual extentof willingness to use geoinformatics technology in disaster disease surveillance.
Abbreviations
Introduction
1
2
3
4,5
6
7
8,9,10,11
12
13,14
13
15
16
4/16/2015 Feasibility Assessment of Using Geoinformatics Technology in Disaster Disease Surveillance in a Developing Country, Iran – PLOS Currents Disasters
http://currents.plos.org/disasters/article/feasibilityassessmentofusinggeoinformaticstechnologyindisasterdiseasesurveillanceinadevelopingcountry… 3/13
The primary objective of this study is to foresee the feasibility of using geoinformatics technology thatincludes: Geographical Information System (GIS), Geographical Positioning System (GPS), and RemoteSensing in disaster disease surveillance in a developing country like Iran. The study conducted at TUMS& HS that provides health care services to 2.5 million population, examining personnel’ four perceptions:PU, PEOU, ATT, and ITU towards adopting geoinformatics technology with existing surveillance system.To accomplish this purpose, a cross sectional study was conducted to understand personnel intentiontowards acceptance of geoinformatics technology in disaster disease surveillance context; TAM hasbeen used as analytic model.
Study design
A survey was conducted in 2014. By keeping other relevant variables constant, four constructs (PU,PEOU, ATT, ITU) containing 11 questions were used to assess the feasibility of integratinggeoinformatics technology with existing disease surveillance system.
Questionnaire development and pretest
The main model and constructs were prepared according to the procedure outlined by Davis (1989).The items under each construct were adapted from existing literatures relevant to this study, and amultiitem scale based on seven Point Likerttype scales (1. Strongly agree 2. Moderately agree 3. Agree4. No opinion 5. Disagree 6. Moderately disagree 7. Strongly disagree) was added to suit the context ofthe study.
After finalizing the model with its constructs and underlying items, the preliminary questionnaire wastranslated into Farsi by a native research expert. Then the questionnaire was reviewed by four experts inFarsi language. To examine the face validity, the questionnaire was sent to 10 disease surveillanceexperts: and they were requested to give their valuable opinion regarding simplicity, relevancy, andclarity about each question. The same experts were also entreated to provide their opinion regardingnecessity of each question in order to evaluate questionnaire content validity. Each question wascategorized into three levels necessary, useful but not necessary, and not necessary. Finally, thequestions were modified according to their suggestions.
Testretest method was applied to evaluate the reliability of the questionnaire. Twelve PhD students fromDisaster Management Academia, TUMS, participated in the pilot study. Two samples were taken in aninterval of one week; Cronbach alpha, intraclass correlation coefficient (ICC), and standard error ofmeasurement (SEM) were calculated. “If item deleted” option was applied to measure the Cronbachalpha and the “cut off” level was 0.70; Cronbach alpha values were well above the acceptable level.Items contained negative ICC value was deleted while remaining positive values varied from 0.20 to0.74. SEM was calculated according to method described by Weir (2005). SEM ranged from 0.98 to1.45 which revealed a small error of measurement.
The final questionnaire possessed two sections. Opening part consisted of participants’ demographicitems such gender, educational level, field of specialization, training related to information technology,and job experience. The second segment contained questions that qualified in the pilot study.
Sample size and sampling method
Materials and methods
15
1719
20
21
22
4/16/2015 Feasibility Assessment of Using Geoinformatics Technology in Disaster Disease Surveillance in a Developing Country, Iran – PLOS Currents Disasters
http://currents.plos.org/disasters/article/feasibilityassessmentofusinggeoinformaticstechnologyindisasterdiseasesurveillanceinadevelopingcountry… 4/13
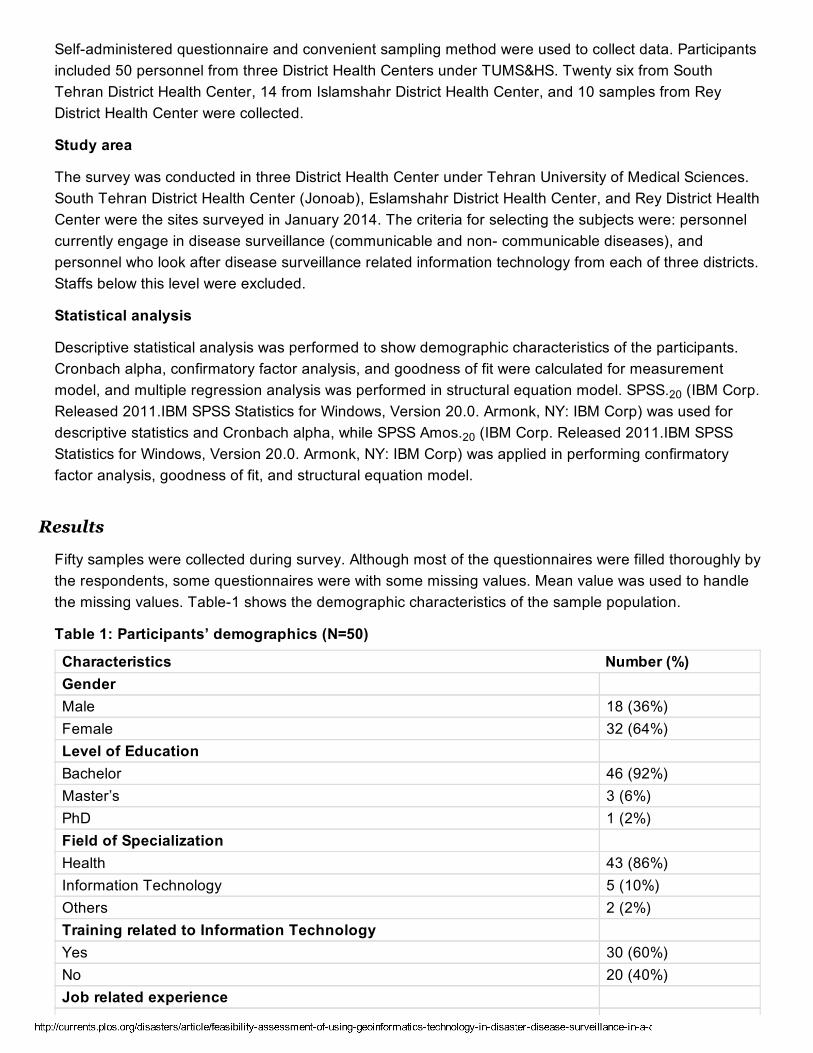
Selfadministered questionnaire and convenient sampling method were used to collect data. Participantsincluded 50 personnel from three District Health Centers under TUMS&HS. Twenty six from SouthTehran District Health Center, 14 from Islamshahr District Health Center, and 10 samples from ReyDistrict Health Center were collected.
Study area
The survey was conducted in three District Health Center under Tehran University of Medical Sciences.South Tehran District Health Center (Jonoab), Eslamshahr District Health Center, and Rey District HealthCenter were the sites surveyed in January 2014. The criteria for selecting the subjects were: personnelcurrently engage in disease surveillance (communicable and non communicable diseases), andpersonnel who look after disease surveillance related information technology from each of three districts.Staffs below this level were excluded.
Statistical analysis
Descriptive statistical analysis was performed to show demographic characteristics of the participants.Cronbach alpha, confirmatory factor analysis, and goodness of fit were calculated for measurementmodel, and multiple regression analysis was performed in structural equation model. SPSS. (IBM Corp.Released 2011.IBM SPSS Statistics for Windows, Version 20.0. Armonk, NY: IBM Corp) was used fordescriptive statistics and Cronbach alpha, while SPSS Amos. (IBM Corp. Released 2011.IBM SPSSStatistics for Windows, Version 20.0. Armonk, NY: IBM Corp) was applied in performing confirmatoryfactor analysis, goodness of fit, and structural equation model.
Fifty samples were collected during survey. Although most of the questionnaires were filled thoroughly bythe respondents, some questionnaires were with some missing values. Mean value was used to handlethe missing values. Table1 shows the demographic characteristics of the sample population.
Table 1: Participants’ demographics (N=50)
Characteristics Number (%)GenderMale 18 (36%)Female 32 (64%)Level of EducationBachelor 46 (92%)Master’s 3 (6%)PhD 1 (2%)Field of SpecializationHealth 43 (86%)Information Technology 5 (10%)Others 2 (2%)Training related to Information TechnologyYes 30 (60%)No 20 (40%)Job related experience
20
20
Results
4/16/2015 Feasibility Assessment of Using Geoinformatics Technology in Disaster Disease Surveillance in a Developing Country, Iran – PLOS Currents Disasters
http://currents.plos.org/disasters/article/feasibilityassessmentofusinggeoinformaticstechnologyindisasterdiseasesurveillanceinadevelopingcountry… 5/13
1 to 5 years 16 (32%)6 to 10 years 5 (10%)
11 to 15 years 9 (18%)16 to 20 years 13 (26%)21 to 25 years 4 (8%)26 years and above 3 (6%)
About two third of the respondents took part in the survey are women. Threefourth of the participants inthe South Tehran and Eslamshahr centers are female, and an equal gender distribution found in the ReyHealth District. A large majority of the respondents completed their bachelor degree while a smidgenparticipant holds master or PhD degree. Data reveals that same educational pattern exist in all threeDistrict Health Center.
A similar distribution prevails in the field of specialization where more than three quarter of the partakerexpert in Public Health whereas less than 15% respondents have specialization in InformationTechnology and other related field. Threefifth of the surveyed officers possesses training related toinformation technology. The DHC share the same IT training distribution except South Tehran districthealth center where the percentage is below than that of general finding. More than one third of theparticipants have longer job experience (16 to 20 years); same portion of the respondent is new starter(1 to 5 years). The most experience personnel occupy the least space in the field.
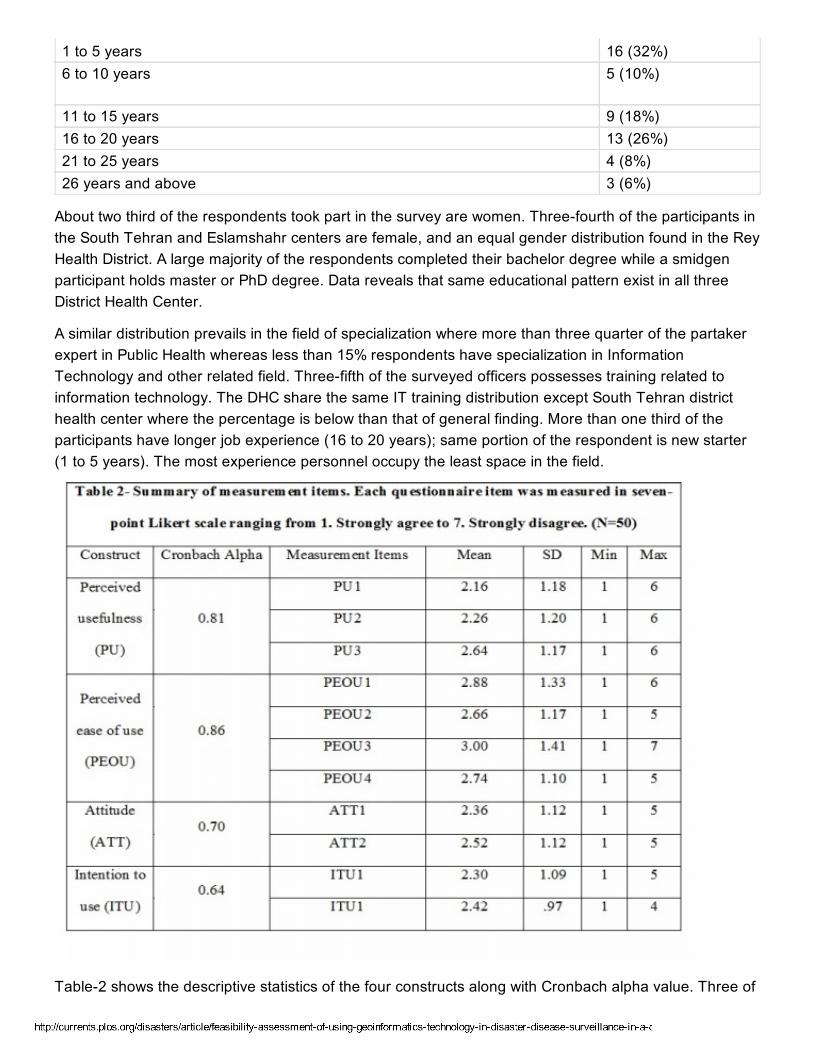
Table2 shows the descriptive statistics of the four constructs along with Cronbach alpha value. Three of
4/16/2015 Feasibility Assessment of Using Geoinformatics Technology in Disaster Disease Surveillance in a Developing Country, Iran – PLOS Currents Disasters
http://currents.plos.org/disasters/article/feasibilityassessmentofusinggeoinformaticstechnologyindisasterdiseasesurveillanceinadevelopingcountry… 6/13
the constructs possess Cronbach alpha value well above 0.70 while one values 0.64 which is withinacceptable level. Mean of each question falls below three (Likert scale) that indicates participants wereconsistent in their responses. Standard deviation ranges from 0.97 to 1.41 which reflects a narrow rangeof variability, and responses vary widely from one to six.
Table 3: Goodness of fit measures
Fit measures ValuesChi squared 87.232RMR (root mean square residual) 0.117RMSEA (root mean square error of approximation) 0.115GFI( goodness of fit index) 0.754CFI (comparative fit index) 0.847NFI (normed fit index) 0.760
The validated model contains 15 items including 11 questions and four constructs. The chisquarestatistic is a strong indicator of goodness of fit for data and proposed model. Table3 shows a relativegood of fitness; chisquare, (N=50) = 87.232, degree of freedom= 40, p<0.001. Other goodness of fitstatistics was also considered to examine fit indices of the model. Goodness of fit (GFI), comparative fitindex (CFI), and normed fit index (NFI) are remarkable if exceed 0.90, but acceptable if close or above0.80. Root mean square (RMS) acceptable value is within 0.50.8. The fit indices show that the studymodel does not contain the values within range due to small study sample but close enough to progressnext stage examining path coefficients.
Table 4: Confirmatory factor analysis. Factor loading
Items Perceived usefulness(PU)
Perceived ease of use(PEOU)
Attitude(ATT)
Intention to use(ITU)
PU1 0.75PU2 0.76PU3 0.79PEOU1 0.78PEOU2 0.77PEOU3 0.77PEOU4 0.82ATT1 0.77ATT2 0.71ITU1 0.64ITU2 0.74
Table4 represents confirmatory factor analysis. Confirmatory factor analysis also indicates thegoodness of fit of the proposed model. Only one item takes the value below 0.70; otherwise, rest of theitems partake value well above acceptable level.
Table 5: Hypothesis Testing
Hypothesis Pathway Path coefficient tvalue pvalue ResultsH1 PEOU → PU 0.897 5.268 *** SupportedH2 PEOU → ATT 0.418 1.376 0.169 Not supported
4/16/2015 Feasibility Assessment of Using Geoinformatics Technology in Disaster Disease Surveillance in a Developing Country, Iran – PLOS Currents Disasters
http://currents.plos.org/disasters/article/feasibilityassessmentofusinggeoinformaticstechnologyindisasterdiseasesurveillanceinadevelopingcountry… 7/13
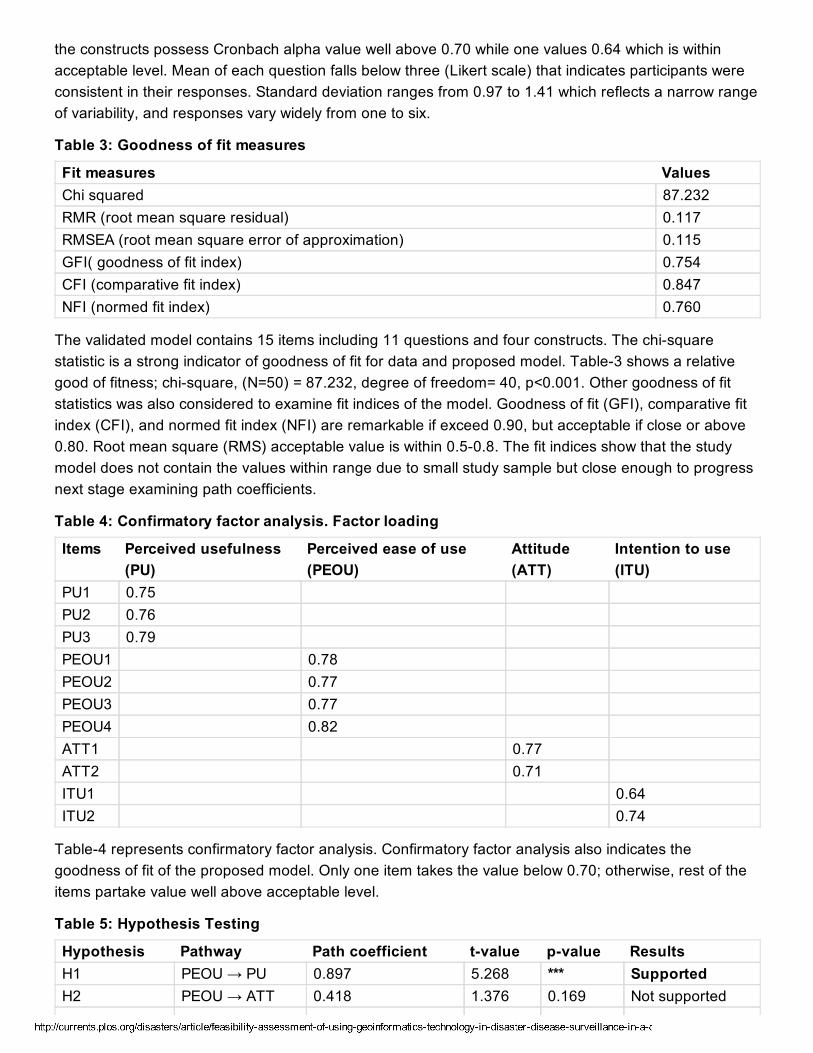
H3 PU → ATT 0.408 1.346 0.178 Not supported
H4 ATT → ITU 0.803 3.751 *** Supported
Table5 shows the final outcome of the TAM. Multiple regression analysis based on structural equationmodel was used to analyze the hypotheses.
Fig.1:ThevalidatedTechnologyAcceptance.R2=Coefficientofdetermination.
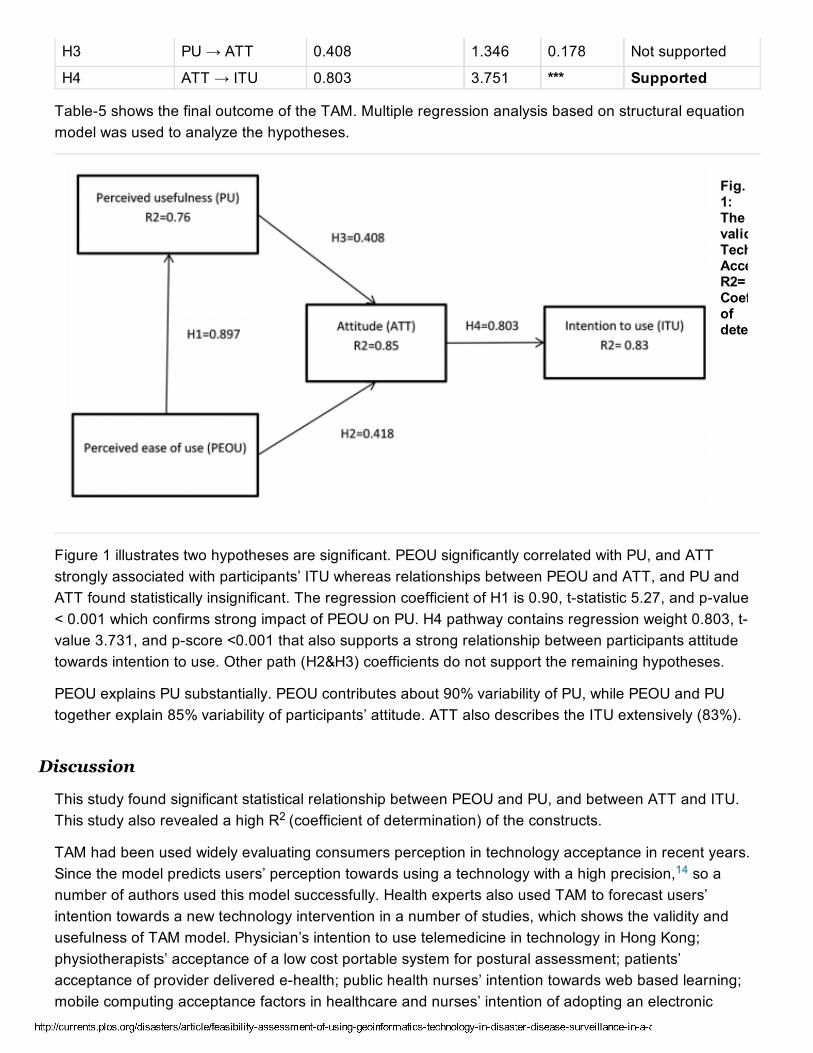
Figure 1 illustrates two hypotheses are significant. PEOU significantly correlated with PU, and ATTstrongly associated with participants’ ITU whereas relationships between PEOU and ATT, and PU andATT found statistically insignificant. The regression coefficient of H1 is 0.90, tstatistic 5.27, and pvalue< 0.001 which confirms strong impact of PEOU on PU. H4 pathway contains regression weight 0.803, tvalue 3.731, and pscore <0.001 that also supports a strong relationship between participants attitudetowards intention to use. Other path (H2&H3) coefficients do not support the remaining hypotheses.
PEOU explains PU substantially. PEOU contributes about 90% variability of PU, while PEOU and PUtogether explain 85% variability of participants’ attitude. ATT also describes the ITU extensively (83%).
This study found significant statistical relationship between PEOU and PU, and between ATT and ITU.This study also revealed a high R (coefficient of determination) of the constructs.
TAM had been used widely evaluating consumers perception in technology acceptance in recent years.Since the model predicts users’ perception towards using a technology with a high precision, so anumber of authors used this model successfully. Health experts also used TAM to forecast users’intention towards a new technology intervention in a number of studies, which shows the validity andusefulness of TAM model. Physician’s intention to use telemedicine in technology in Hong Kong;physiotherapists’ acceptance of a low cost portable system for postural assessment; patients’acceptance of provider delivered ehealth; public health nurses’ intention towards web based learning;mobile computing acceptance factors in healthcare and nurses’ intention of adopting an electronic
Discussion
2
14
4/16/2015 Feasibility Assessment of Using Geoinformatics Technology in Disaster Disease Surveillance in a Developing Country, Iran – PLOS Currents Disasters
http://currents.plos.org/disasters/article/feasibilityassessmentofusinggeoinformaticstechnologyindisasterdiseasesurveillanceinadevelopingcountry… 8/13
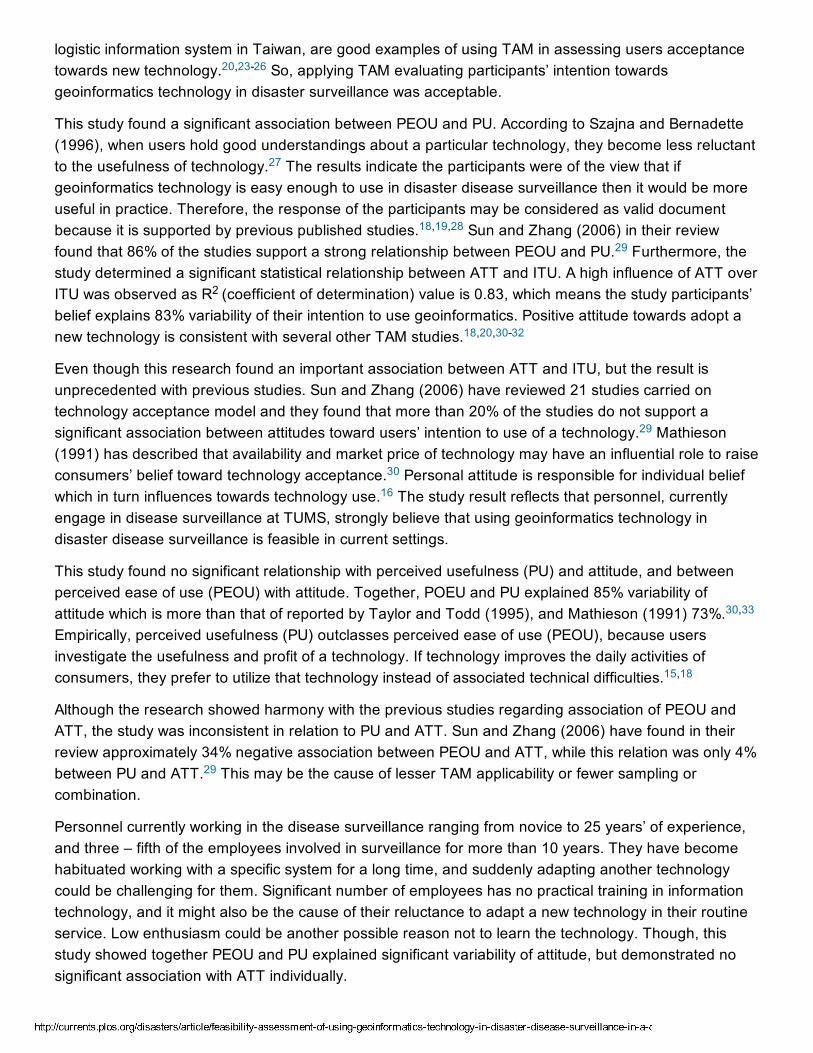
logistic information system in Taiwan, are good examples of using TAM in assessing users acceptancetowards new technology. So, applying TAM evaluating participants’ intention towardsgeoinformatics technology in disaster surveillance was acceptable.
This study found a significant association between PEOU and PU. According to Szajna and Bernadette(1996), when users hold good understandings about a particular technology, they become less reluctantto the usefulness of technology. The results indicate the participants were of the view that ifgeoinformatics technology is easy enough to use in disaster disease surveillance then it would be moreuseful in practice. Therefore, the response of the participants may be considered as valid documentbecause it is supported by previous published studies. Sun and Zhang (2006) in their reviewfound that 86% of the studies support a strong relationship between PEOU and PU. Furthermore, thestudy determined a significant statistical relationship between ATT and ITU. A high influence of ATT overITU was observed as R (coefficient of determination) value is 0.83, which means the study participants’belief explains 83% variability of their intention to use geoinformatics. Positive attitude towards adopt anew technology is consistent with several other TAM studies.
Even though this research found an important association between ATT and ITU, but the result isunprecedented with previous studies. Sun and Zhang (2006) have reviewed 21 studies carried ontechnology acceptance model and they found that more than 20% of the studies do not support asignificant association between attitudes toward users’ intention to use of a technology. Mathieson(1991) has described that availability and market price of technology may have an influential role to raiseconsumers’ belief toward technology acceptance. Personal attitude is responsible for individual beliefwhich in turn influences towards technology use. The study result reflects that personnel, currentlyengage in disease surveillance at TUMS, strongly believe that using geoinformatics technology indisaster disease surveillance is feasible in current settings.
This study found no significant relationship with perceived usefulness (PU) and attitude, and betweenperceived ease of use (PEOU) with attitude. Together, POEU and PU explained 85% variability ofattitude which is more than that of reported by Taylor and Todd (1995), and Mathieson (1991) 73%.Empirically, perceived usefulness (PU) outclasses perceived ease of use (PEOU), because usersinvestigate the usefulness and profit of a technology. If technology improves the daily activities ofconsumers, they prefer to utilize that technology instead of associated technical difficulties.
Although the research showed harmony with the previous studies regarding association of PEOU andATT, the study was inconsistent in relation to PU and ATT. Sun and Zhang (2006) have found in theirreview approximately 34% negative association between PEOU and ATT, while this relation was only 4%between PU and ATT. This may be the cause of lesser TAM applicability or fewer sampling orcombination.
Personnel currently working in the disease surveillance ranging from novice to 25 years’ of experience,and three – fifth of the employees involved in surveillance for more than 10 years. They have becomehabituated working with a specific system for a long time, and suddenly adapting another technologycould be challenging for them. Significant number of employees has no practical training in informationtechnology, and it might also be the cause of their reluctance to adapt a new technology in their routineservice. Low enthusiasm could be another possible reason not to learn the technology. Though, thisstudy showed together PEOU and PU explained significant variability of attitude, but demonstrated nosignificant association with ATT individually.
20,2326
27
18,19,28
29
2
18,20,3032
29
30
16
30,33
15,18
29
4/16/2015 Feasibility Assessment of Using Geoinformatics Technology in Disaster Disease Surveillance in a Developing Country, Iran – PLOS Currents Disasters
http://currents.plos.org/disasters/article/feasibilityassessmentofusinggeoinformaticstechnologyindisasterdiseasesurveillanceinadevelopingcountry… 9/13
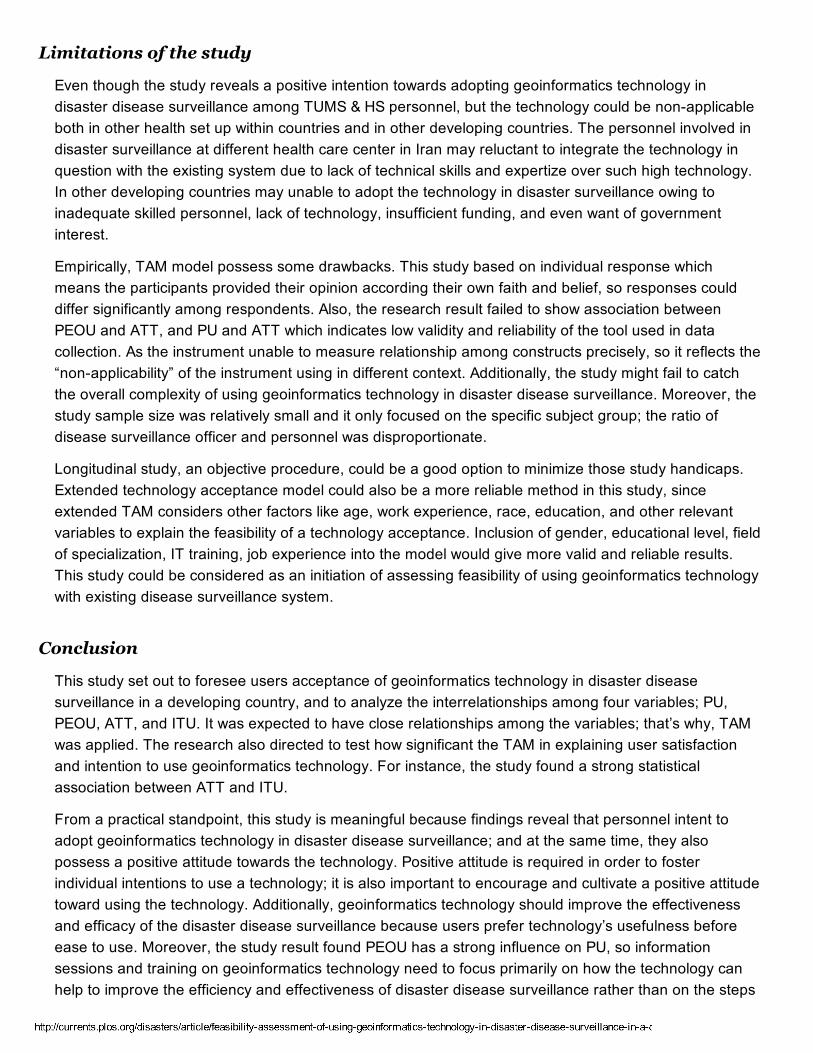
Even though the study reveals a positive intention towards adopting geoinformatics technology indisaster disease surveillance among TUMS & HS personnel, but the technology could be nonapplicableboth in other health set up within countries and in other developing countries. The personnel involved indisaster surveillance at different health care center in Iran may reluctant to integrate the technology inquestion with the existing system due to lack of technical skills and expertize over such high technology.In other developing countries may unable to adopt the technology in disaster surveillance owing toinadequate skilled personnel, lack of technology, insufficient funding, and even want of governmentinterest.
Empirically, TAM model possess some drawbacks. This study based on individual response whichmeans the participants provided their opinion according their own faith and belief, so responses coulddiffer significantly among respondents. Also, the research result failed to show association betweenPEOU and ATT, and PU and ATT which indicates low validity and reliability of the tool used in datacollection. As the instrument unable to measure relationship among constructs precisely, so it reflects the“nonapplicability” of the instrument using in different context. Additionally, the study might fail to catchthe overall complexity of using geoinformatics technology in disaster disease surveillance. Moreover, thestudy sample size was relatively small and it only focused on the specific subject group; the ratio ofdisease surveillance officer and personnel was disproportionate.
Longitudinal study, an objective procedure, could be a good option to minimize those study handicaps.Extended technology acceptance model could also be a more reliable method in this study, sinceextended TAM considers other factors like age, work experience, race, education, and other relevantvariables to explain the feasibility of a technology acceptance. Inclusion of gender, educational level, fieldof specialization, IT training, job experience into the model would give more valid and reliable results.This study could be considered as an initiation of assessing feasibility of using geoinformatics technologywith existing disease surveillance system.
This study set out to foresee users acceptance of geoinformatics technology in disaster diseasesurveillance in a developing country, and to analyze the interrelationships among four variables; PU,PEOU, ATT, and ITU. It was expected to have close relationships among the variables; that’s why, TAMwas applied. The research also directed to test how significant the TAM in explaining user satisfactionand intention to use geoinformatics technology. For instance, the study found a strong statisticalassociation between ATT and ITU.
From a practical standpoint, this study is meaningful because findings reveal that personnel intent toadopt geoinformatics technology in disaster disease surveillance; and at the same time, they alsopossess a positive attitude towards the technology. Positive attitude is required in order to fosterindividual intentions to use a technology; it is also important to encourage and cultivate a positive attitudetoward using the technology. Additionally, geoinformatics technology should improve the effectivenessand efficacy of the disaster disease surveillance because users prefer technology’s usefulness beforeease to use. Moreover, the study result found PEOU has a strong influence on PU, so informationsessions and training on geoinformatics technology need to focus primarily on how the technology canhelp to improve the efficiency and effectiveness of disaster disease surveillance rather than on the steps
Limitations of the study
Conclusion
4/16/2015 Feasibility Assessment of Using Geoinformatics Technology in Disaster Disease Surveillance in a Developing Country, Iran – PLOS Currents Disasters
http://currents.plos.org/disasters/article/feasibilityassessmentofusinggeoinformaticstechnologyindisasterdiseasesurveillanceinadevelopingcountry… 10/13
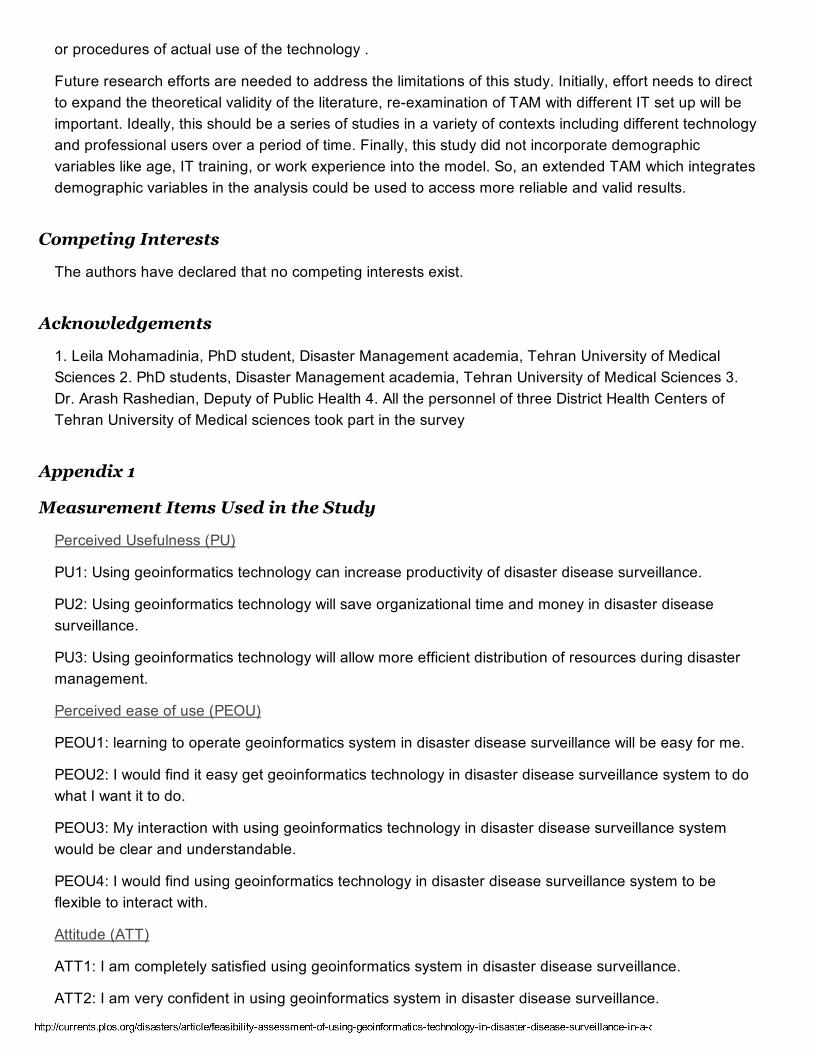
or procedures of actual use of the technology .
Future research efforts are needed to address the limitations of this study. Initially, effort needs to directto expand the theoretical validity of the literature, reexamination of ΤΑΜ with different IT set up will beimportant. Ideally, this should be a series of studies in a variety of contexts including different technologyand professional users over a period of time. Finally, this study did not incorporate demographicvariables like age, IT training, or work experience into the model. So, an extended TAM which integratesdemographic variables in the analysis could be used to access more reliable and valid results.
The authors have declared that no competing interests exist.
1. Leila Mohamadinia, PhD student, Disaster Management academia, Tehran University of MedicalSciences 2. PhD students, Disaster Management academia, Tehran University of Medical Sciences 3.Dr. Arash Rashedian, Deputy of Public Health 4. All the personnel of three District Health Centers ofTehran University of Medical sciences took part in the survey
Perceived Usefulness (PU)
PU1: Using geoinformatics technology can increase productivity of disaster disease surveillance.
PU2: Using geoinformatics technology will save organizational time and money in disaster diseasesurveillance.
PU3: Using geoinformatics technology will allow more efficient distribution of resources during disastermanagement.
Perceived ease of use (PEOU)
PEOU1: learning to operate geoinformatics system in disaster disease surveillance will be easy for me.
PEOU2: I would find it easy get geoinformatics technology in disaster disease surveillance system to dowhat I want it to do.
PEOU3: My interaction with using geoinformatics technology in disaster disease surveillance systemwould be clear and understandable.
PEOU4: I would find using geoinformatics technology in disaster disease surveillance system to beflexible to interact with.
Attitude (ATT)
ATT1: I am completely satisfied using geoinformatics system in disaster disease surveillance.
ATT2: I am very confident in using geoinformatics system in disaster disease surveillance.
Competing Interests
Acknowledgements
Appendix 1
Measurement Items Used in the Study
4/16/2015 Feasibility Assessment of Using Geoinformatics Technology in Disaster Disease Surveillance in a Developing Country, Iran – PLOS Currents Disasters
http://currents.plos.org/disasters/article/feasibilityassessmentofusinggeoinformaticstechnologyindisasterdiseasesurveillanceinadevelopingcountry… 11/13
Intention to use (ITU)
ITU1: I believe that using geoinformatics system in disaster disease surveillance will improve the qualityof the service.
ITU2: To the extent possible, I would use geoinformatics technology in disaster disease surveillancefrequently.
1. Ciottone GR. Disaster medicine. 3rd ed. Philadelphia, PA, USA: Elsevier Health Sciences; 2006 : 34.
2. Noji EK. The public health consequences of disasters. 1st ed: New York, NW, USA: Oxford UniversityPress; 1996: 12.
3. Patrick P, Brenner S, Noji E, Lee J. The Red Cross and CDC's naturaldisaster surveillance system.Am J Public Health. 1992;82(12):16901690.
4. Batts D, Fleischauer A, Noe R, Wolkin A, Rubin C, Wise W. Improving Post Natural DisasterSurveillance for Effective Decision Making. Epidemiology. 2007;18(5):S83S4.
5. Landesman LY. Public health management of disasters. 2nd ed. Washington, DC, USA: AmericanPublic Health Association; 2011: 9797.
6. Bayntun C, Rockenschaub G, Murray V. Developing a health system approach to disastermanagement: A qualitative analysis of the core literature to complement the WHO Toolkit for assessinghealthsystem capacity for crisis management. PLOS Currents Disasters. 2012 Aug 22. doi:10.1371/5028b6037259a. Introduction; 2012.
7. Berberian M, Yeats RS. Patterns of historical earthquake rupture in the Iranian Plateau. B Seismol SocAm. 1999;89(1):12039.
8. Zare M, Shahvar M. An Urgent Report on the Saravan, Iran Earthquake of 16 April 2013 Mw7. 7, AQuick Engineering Seismological Overview. 2013.
9. Talebian M, Fielding EJ, Funning GJ, Ghorashi M, Jackson J, Nazari H, et al. The 2003 Bam (Iran)earthquake: Rupture of a blind strike‐slip fault. Geophys Res Lett. 2004;31(11).
10. Hakuno M, Imaizumi T, Kagami H, Kiyono J, Ikeda Y, Towhata I, Sato H, Hori M, Meguro K,Shabestari A. K, Alaghebandian R, Taniguchi H, Tsujibata H. Reconnaisance report on the damage dueto the qayen earthquake of May 10, 1997, in Northeast Iran. Journal of Natural DisasterScience.1997;19(1):6781.
11. Ardalan A, Masoomi G, Goya M, Ghaffari M, Miadfar J, Sarvar M, et al. Disaster healthmanagement: Iran's progress and challenges. Iranian Journal of Public Health. 2009;38(Suppl. 1).
12. Ardalan A, Mowafi H, Khoshsabeghe YH. Impacts of natural hazards on primary health care facilitiesof Iran: A 10year retrospective survey. PLoS currents. 2013;5.
13. Kim D, Chang H. Key functional characteristics in designing and operating health informationwebsites for user satisfaction: An application of the extended technology acceptance model. Int J MedInform. 2007;76(11):790800.
References
4/16/2015 Feasibility Assessment of Using Geoinformatics Technology in Disaster Disease Surveillance in a Developing Country, Iran – PLOS Currents Disasters
http://currents.plos.org/disasters/article/feasibilityassessmentofusinggeoinformaticstechnologyindisasterdiseasesurveillanceinadevelopingcountry… 12/13
14. Yu P, Li H, Gagnon MP. Health IT acceptance factors in longterm care facilities: a crosssectionalsurvey. Int J Med Inform. 2009;78(4):21929.
15. Davis FD. Perceived usefulness, perceived ease of use, and user acceptance of informationtechnology. Mis Quart. 1989:31940.
16. Davis FD, Bagozzi RP, Warshaw PR. User acceptance of computer technology: a comparison of twotheoretical models. Manage Sci. 1989;35(8):9821003.
17. Holden RJ, Karsh BT. The technology acceptance model: its past and its future in health care.Journal of biomedical informatics. 2010;43(1):15972.
18. Porter CE, Donthu N. Using the technology acceptance model to explain how attitudes determineInternet usage: The role of perceived access barriers and demographics. J Bus Res. 2006;59(9):9991007.
19. Shroff RH, Deneen C, Ng EM. Analysis of the technology acceptance model in examining students'behavioural intention to use an eportfolio system. Aus J Educ Tech. 2011;27(4):60018.
20. Hu PJ, Chau PY, Sheng ORL, Tam KY. Examining the technology acceptance model using physicianacceptance of telemedicine technology. J Manage Inform Syst. 1999;16(2):91112.
21. Lunneborg CE. Book Review: Psychometric Theory: Secon d Edition Jum C. Nunnally New York:McGrawHill, 1978, 701 pages. Appl Psychol Meas. 1979;3(2):27980.
22. Weir JP. Quantifying testretest reliability using the intraclass correlation coefficient and the SEM. JStrength Cond Res. 2005;19(1):23140.
23. Chau PY, Hu PJ. Examining a model of information technology acceptance by individualprofessionals: An exploratory study. J Manage Inform Syst. 2002;18(4):191230.
24. Van Schaik P, BettanySaltikov J, Warren J. Clinical acceptance of a lowcost portable system forpostural assessment. Behav Inf Technol. 2002;21(1):4757.
25. Wilson EV, Lankton NK. Modeling patients' acceptance of providerdelivered ehealth. J Am MedInform Assoc. 2004;11(4):2418.
26. Tung FC, Chang SC, Chou CM. An extension of trust and TAM model with IDT in the adoption ofthe electronic logistics information system in HIS in the medical industry. Int J Med Inform.2008;77(5):32435.
27. Szajna B. Empirical evaluation of the revised technology acceptance model. Manage Sci.1996;42(1):8592.
28. Venkatesh V, Davis FD. A theoretical extension of the technology acceptance model: fourlongitudinal field studies. Manage Sci. 2000;46(2):186204.
29. Sun H, Zhang P. The role of moderating factors in user technology acceptance. Int J HumComputSt. 2006;64(2):5378.
30. Mathieson K. Predicting user intentions: comparing the technology acceptance model with the theoryof planned behavior. Inform Syst Res. 1991;2(3):17391.
31. Bhattacherjee A. Understanding information systems continuance: an expectationconfirmation
4/16/2015 Feasibility Assessment of Using Geoinformatics Technology in Disaster Disease Surveillance in a Developing Country, Iran – PLOS Currents Disasters
http://currents.plos.org/disasters/article/feasibilityassessmentofusinggeoinformaticstechnologyindisasterdiseasesurveillanceinadevelopingcountry… 13/13
model. Mis Quart. 2001;25(3):35170.
32. Chau PY, Hu PJH. Information technology acceptance by individual professionals: A modelcomparison approach. Decision Sci. 2001;32(4):699719.
33. Taylor S, Todd P. Assessing IT usage: The role of prior experience. Mis Quart. 1995:56170.
View publication statsView publication stats