exploring the relationship between vacant and distressed...
TRANSCRIPT

Exploring the Relationship Between Vacant and Distressed Properties and Community Health and Safety
Prepared for: Western Reserve Land Conservancy
Prepared by:
Center on Urban Poverty and Community Development Jack, Joseph and Morton Mandel School of Applied Social Sciences
Case Western Reserve University
June 5, 2017
Exploring the Relationship between Vacant Properties and Community Health and Safety
2
About the Center on Urban Poverty and Community Development The Center on Urban Poverty and Community Development (the Poverty Center) works to inform public policy and program planning through data and analysis to address urban poverty, its causes, and its impact on communities and their residents. Since our founding in 1988, our mission has broadened to understand and address poverty by delving into its human, social, and economic implications as experienced at the levels of the family and community.
About Western Reserve Land Conservancy Western Reserve Land Conservancy is a nonprofit land conservation and restoration organization. In March 2011, the Land Conservancy launched its Thriving Communities program, to help restore and revitalize our urban centers. Today, staff members are working with cities and organizations throughout Ohio to transform vacant, unsafe and unproductive properties into useful ones. In the process, communities are finding new opportunities to attract economic growth, add green space and support safe, beautiful neighborhoods. Western Reserve Land Conservancy sought the Poverty Center as a partner to quantitatively explore the spillover effects of vacant properties on the health and safety of community residents to better understand and strategize potential solutions.

Exploring the Relationship between Vacant Properties and Community Health and Safety
3
Introduction Vacant properties continue to be a persistent problem in Cleveland and in other cities throughout the country. As foreclosures escalated in the late 2000s, many properties stayed vacant longer, particularly when they became bank or investor-owned. With the housing crisis extending to a larger financial crisis, scores more properties became vacant, home values plummeted and homeowners and banks walked away from underwater mortgages. The impact of a vacant home on surrounding property value is well-established; multiple studies find that vacant and/or foreclosed properties decrease the value of surrounding properties, often using foreclosure as a proxy for vacancy.1,2,3,4 The impact of a vacant home on other aspects of community life and well-being are more difficult to understand and quantify. It is often stated (in policy-focused articles and by residents living in communities with vacant properties) that increasing crime is a by-product of increasing vacant properties. The argument is that clusters of vacant homes can sometimes become an unguarded location for illicit activity, or a signal of social disorder and vulnerability to potential criminals.5 But areas of vacancy can also be so concentrated that there are few people living in the area, making it problematic to understand and quantify the relationship. In some contexts, there may be little visual differences between vacant properties and occupied properties. Properties may be vacant for short periods of time, or may be well-secured. In any city of older homes, children’s exposure to lead is a great public health concern. When older properties sit vacant and unmaintained, there is a potential for property deterioration and the creation of lead hazards. At the same time, exposure to a vacant, poorly maintained home may be limited in areas of concentrated vacancy. In this paper, we explore the relationship between vacant properties and these health and safety issues, crime and lead exposure, concerning the surrounding community. In our examination, we will consider both property vacancy and condition. Vacancy and poor condition area often intertwined, but in our examination we are able to isolate each. Our hypothesis is that, if vacancy and crime or exposure to lead are related, we will find vacancy hot spots occur, crime hot spots, and lead exposure hot spots in the same locations. We aim to offer useful insight to policy makers so that strategies to remediate vacant and blighted properties can be considered alongside a community health lens.
1 Mikelbank, B.A. (2008). Spatial analysis of the impact of vacant, abandoned, and foreclosed properties. Federal Reserve Bank of Cleveland. Available online at https://www.clevelandfed.org/newsroom-and-events/publications/special-reports/sr-200811-spatial-analysis-of-impact-of-vacant-abandoned-foreclosed-properties.aspx 2 Whitaker, S. & Fitzpatrick, T.J. (2013). Deconstructing distressed-property spillovers: The effects of vacant, tax-delinquent, and foreclosed properties in housing submarkets. Journal of Housing Economics, 22, 79-91. 3 Harding, J.P., Rosenblatt, E. & Yao, V.W. (2009). The contagion effect of foreclosed properties. Journal of Urban Economics, 66 (3), 164-178. 4 Immergluck, D. & Smith, G. (2010). The external costs of foreclosure: The impact of single-family mortgage foreclosures on property values. Housing Policy Debate, 17(1), 57-79. 5 Kelling, G.L. & Wilson, J.Q. (1982). Broken windows: The police and neighborhood safety. The Atlantic, March 1982. Available online at http://www.theatlantic.com/magazine/archive/1982/03/broken-windows/304465/.

Exploring the Relationship between Vacant Properties and Community Health and Safety
4
Vacant properties and community health and safety issues The following section reviews existing literature examining vacant properties and the relationship to community health and safety issues (crime and lead exposure). Crime There are few studies that explore the relationship between property vacancy and crime. A number of studies include vacancy of as one of many attributes of a neighborhood in examining the relationship between neighborhoods and crime. Many studies seek to quantify the costs of vacant and/or distressed housing borne by municipalities and often include costs related to crime. Three studies focus on the relationship between vacancy and crime. One study, taking place in Austin Texas in the early 1990s during a wave of underwater mortgages and property abandonment, examines the connection between vacant residential structures and crime. The study uses administrative data on crime incidents, finding that blocks with vacant properties overall were twice as likely to experience drug and theft crime as blocks with no vacant properties. Furthermore, blocks with properties that were unsecure had twice as many crimes committed on the block. When property security was taken into account, additional attributes of the blocks—things like the physical condition of the building, the proximity to vacant lots, commercial areas, and neighborhood demographics—were not significant predictors of increased crime. The study found no significant relationship between vacant properties and violent crime.6 Another study examines block groups in Philadelphia County and the connection between vacant properties and aggravated assaults. Using United States Postal Service (USPS) data from 2002 to 2006 as the measure of vacancy, including vacant properties as well as vacant land, the study uses regression modeling and finds that aggravated assault significantly increase with increases in vacant properties. Other demographic factors, like population, median age, number of Hispanic residents, number of unemployed, and others, are also predictors of aggravated assaults, but the number of vacant properties had the largest effect size of all predictors.7 A third study uses the individual property as the unit of analysis, looking at properties in Pittsburgh. This study examines the relationship between foreclosure, vacancy, and crime using the judicial foreclosure process as a way to measure points of vacancy. The study reports that foreclosure, the act of filing a case in court when a homeowner becomes delinquent on their mortgage, has no impact on crime, but that vacancy does. Using the point at which, through the foreclosure process, a property is likely to be vacant as the indicator of vacancy, the study finds a 19 percent increase in violent crime, and that impact increases the longer the property remains vacant.8 Lead exposure There are many resources for policy makers outlining the connection between property deterioration and children’s exposure to lead, as well as studies examining the impact of other neighborhood and housing attributes on lead exposure. Children become exposed to lead when properties deteriorate and old lead paint chips, flakes, and creates lead-ridden dust on accessible household surfaces. Children also
6 Spelman, W. (1993). Abandoned buildings: Magnets for crime? Journal of Criminal Justice, 21, 481-495. 7 Branas, C. C., Rubin, D., & Guo, W. (2012). Vacant properties and violence in neighborhoods. ISRN Public Health, 2012. 8 Cui, L. & Walsh, R. (2014). Foreclosure, vacancy, and crime. National Bureau of Economic Research {working paper 20593}.
Exploring the Relationship between Vacant Properties and Community Health and Safety
5
become exposed to lead through other means, but lead contaminated dust on household surfaces is thought to be the most prevalent source.9 Age of housing is often used as a proxy for a home’s risk of containing lead. The link between property deterioration and lead exposure is clear; the link between vacant properties and lead exposure is less clear. Though vacancy can lead to physical deterioration, since the property is not inhabited, the risk of exposure to lead, since no one is living in the home, seems like it would be lessened. A number of recent studies include vacant properties among other neighborhood attributes in studying lead exposure.10 Two studies finds that the share of vacant homes in a census tract is a predictor of lead exposure, using vacancy as a marker for homes in poor condition.11,12 Another study uses Census data to examine a number of socioeconomic factors at the zip code level, finding that vacancy is not a predictor of lead exposure, but noting that the source of vacancy data did not differentiate between areas of abandoned homes and areas of high vacation rental properties.13
Methods In the summer and fall of 2015, Thriving Communities conducted a complete survey of all structures in the City of Cleveland (referred to as the property survey henceforth). The survey measured multiple attributes of the property, focusing on property occupancy or vacancy and property condition, giving a letter grade from A through F. The survey is used in this study as the measurement of vacancy and the measurement of property condition.14 The property survey only represents the observed housing conditions at one point in time, and while it notes property vacancy and condition at that point in time, we have no way to know when the property became vacant or how long it was vacant before it was observed. We examine crime incidents from the same time period as the survey, from June 1, 2015 through October 31, 2015. We hypothesize that the incidence of crime and vacancies co-occurring in space and time can help to understand how they relate to each other. We examine crime incidents using administrative address-level data from the City of Cleveland’s Police Department. We examine crimes by type (listed in Figure 2) as well as grouped into property crime and violent crime15. Similarly, we examine exposure to lead through positive tests for elevated blood lead level (EBLL) of 5 ug/dL or greater at the
9 Centers for Disease Control and Prevention. (2004). Preventing lead exposure in young children: A housing-based approach to primary prevention of lead poisoning. Atlanta, GA: CDC. 10 Akkus, C. and Ozdenerol, E. (2014). Exploring childhood lead exposure through GIS: A review of the recent literature. International Journal of Environmental Research and Public Health, 11, 6314-6334. 11 Sargent, J.D., Bailey, A., Simon, P., Blake, M., & Dalton, M.A. (1997). Census tract analysis of lead exposure in Rhode Island children. Environmental Research, 74, 159-168. 12 Sampson, R.J. & Winter, A.S. (2016). The racial ecology of lead poisoning: Toxic inequality in Chicago neighborhoods, 1995-2013. Du Bois Review, 1-23. Available online at http://scholar.harvard.edu/files/alixwinter/files/sampson_winter_2016.pdf 13 Haley, V.B., & Talbot, T.O. (2004). Geographic analysis of blood lead levels in New York State children born 1994-1997. Environmental Health Perspectives, 112 (15), 1577-1582. 14 The complete survey findings, including a parcel-by-parcel interactive map, can be found here: http://www.wrlandconservancy.org/articles/2015/11/21/cleveland-property-survey-results-released/ 15 We use the Cui and Walsh (2014) definitions of property and violent crime. Property crime includes burglary, larceny- theft, motor vehicle theft, and arson. Violent crime includes homicide, rape, robbery, and aggravated assault.
Exploring the Relationship between Vacant Properties and Community Health and Safety
6
address level, but for a different period of time, from June 1, 2015 through December 31, 2015.16 We assume that most children may be exposed at their current address of residence, and we include tests that occurred after the completion of the survey because of an assumption of lag time between lead exposure and testing. Spatial analysis Spatial analysis uses methods to create hot spots, or clusters, to visualize spatial patterns for a point-in-time estimate of incident data. While the term “hot spot” is used to describe the result of multiple analysis methods, it generally refers to a concentration of incident data within a geographic area. Often utilized methods such as Kernel Density Estimation (KDE)17,18 aggregate incident points into grid cells and sum the value of a grid cell with the neighboring cells (within the kernel) to determine the concentration, or density, for the grid cell area. Collectively, the grid cells are symbolized to represent a density value of incidents per the geographic unit (e.g. square miles). These visualizations are helpful to understand the regions of a study area with a greater concentration, but the visible clusters are relative to the geographic extent of the data layer and dependent on the selected classification method. The question regarding significance also remains; does the concentration differ significantly from the surrounding area? Furthermore, for one data source, such as vacancy, KDE is useful to understand the overall pattern, but comparing two different types of data, vacancy and crime, proves to be difficult given the varying extents of the point data and differing scales. In order to identify and compare the spatial patterns and relationships between vacant properties, crime incidents and residences of children with elevated blood lead, we used the Optimized Hot Spot Analysis (OHSA) tool found in the ArcMap Spatial Analyst toolset. OHSA, which uses the Getis-Ord Gi*19 statistic, is optimal for several reasons. First, the tool aggregates incident (point) data into weighted features and identifies an appropriate scale of analysis using average and median nearest neighbor calculations. In addition, OHSA will also allow for the input of a polygon layer to use in aggregation, if desired. Hot spots are determined through the comparison of the local pattern surrounding a feature, to measure difference (with statistical significance), from the global pattern displayed from all features in the data layer. So unlike other density estimation methods, OHSA provides a measure of statistical significance of the spatial pattern, either clustered, dispersed or none, for each grid cell through the output of a shapefile symbolized by the level of significance. For example, if the feature displays a statically significant pattern of clustering at either 90%, 95% or 99% confidence, the result is a hot spot. Likewise, if the feature is dispersed at either 90%, 95% or 99% confidence, the result is a cold-spot; otherwise the pattern does not significantly differ from a random arrangement.20
16 Lead data provided by the Ohio Department of Health. This should not be considered an endorsement of this study or these conclusions by the ODH. 17 Chainey, S., Tompson, L., & Uhlig, S. (2008). The utility of hotspot mapping for predicting spatial patterns of crime. Security Journal, 21(1-2), 4-28. 18 Ratcliffe, J. H. (2004). The hotspot matrix: A framework for the spatio-temporal targeting of crime reduction. Police Practice and Research, 5(1), 5-23. 19 Getis, A. & Ord. J.K. (1992). The analysis of spatial association by use of distance statistics. Geographical Analysis, 24(3), 189-206. 20 Chainey, S., Reid, S. & Stuart, N. (2002). When is a hotspot a hotspot? A procedure for creating statistically robust hotspot maps of crime. Taylor & Francis, London, England.

Exploring the Relationship between Vacant Properties and Community Health and Safety
7
As mentioned previously OHSA will allow the use of an input polygon layer to aggregate point data in the density calculation, which allows for the comparison of patterns among different variables when the same layer is used in aggregation. Even though the use of an input polygon layer may potentially reduce optimization of scale of analysis through nearest neighbor calculations, it creates a consistent grid for which each cell has a value. The tool will create an alert if the input polygon layer is not appropriate for the aggregation of the point layer. For comparison of hot and cold spots between property condition of residential vacancy, type of crime, and residence of record at the time of an EBLL, OHSA was performed for each data layer in ArcMap and results were generated using SAS software, Version 9.4, Copyright © 2014, SAS Institute Inc. Cary, NC, USA. The analysis was limited to surveyed residential properties, the extent of which forms the basis of the OHSA grid applied to each data layer.21 Applying the grid to multiple data provides the ability to examine the relationship between surveyed properties, crime and EBLL exclusively within the surveyed areas. Areas omitted from the analysis include industrial, commercial, and undeveloped land regions. As previously stated, our hypothesis is that if vacancy and crime or exposure to lead are related, we will find vacancy hot spots, crime hot spots, and EBLL hot spots occur in the same locations. Given our hypothesis that vacancy is positively correlated with crime and child lead exposure, we expect to find the following:
1) A greater percentage of grid cells which are hot spots for crime and lead exposure also hot spots for vacancies as compared to grid cells which are not hot spots for crime and lead exposure
2) For the grid cells which are concurrent in a greater percentage among crime, lead and vacancy above, we expect to see that pattern holds true for vacant properties with a rating of D or F, as compared to properties with a rating of A, B, or C
Findings There are 113,060 residential properties in the City of Cleveland in the citywide survey, forming the basis of our analysis. Of these, 10,031 (8.87 percent) are found to be vacant. All residential surveyed properties are aggregated to a grid of 3,272 cells through OHSA. Figure 1 shows vacant hot and cold spots in the survey area, represented by a rating of statistical confidence in each grid cell. Red areas are statistically significant hot spots of vacancy on the east side of the city of Cleveland; a total of 906 grid cells. These represent areas where statistically vacancy is occurring at a rate greater than would be expected if it were randomly distributed throughout the space. Yellow cells are neither hot spots nor cold spots, the level of vacancy is such as it would be if it was randomly distributed throughout the space. Blue cells are cold-spots, the level of vacancy is less than would be expected if it were randomly distributed throughout the space.
21 While the survey captured “apparent” property use, properties were determined to be residential using data from the Cuyahoga County Fiscal Office (“property class”). A small rate of properties, less than one percent of properties survey, showed an apparent use in survey data other than residential. Fifteen percent of properties surveyed were missing data on apparent use, but showed residential property class.

Exploring the Relationship between Vacant Properties and Community Health and Safety
8
As can be seen in Figure 1, vacancy is heavily concentrated on the east side of the city of Cleveland, particularly the north-east and south-east quadrants of the city. There are cold spots of vacancy scattered throughout the east side, and concentrated cold spots on the south west sides. We performed an OHSA for crime incidents by primary offence type and for EBLL tests using the grid cell created by the OHSA for vacant hot and cold spots. In Figure 2 we outline the rates of hot spot grid cells of crime and EBLL incidents that coincide with vacancy hot spot cells. Of the variables examined, the most notable findings are that:
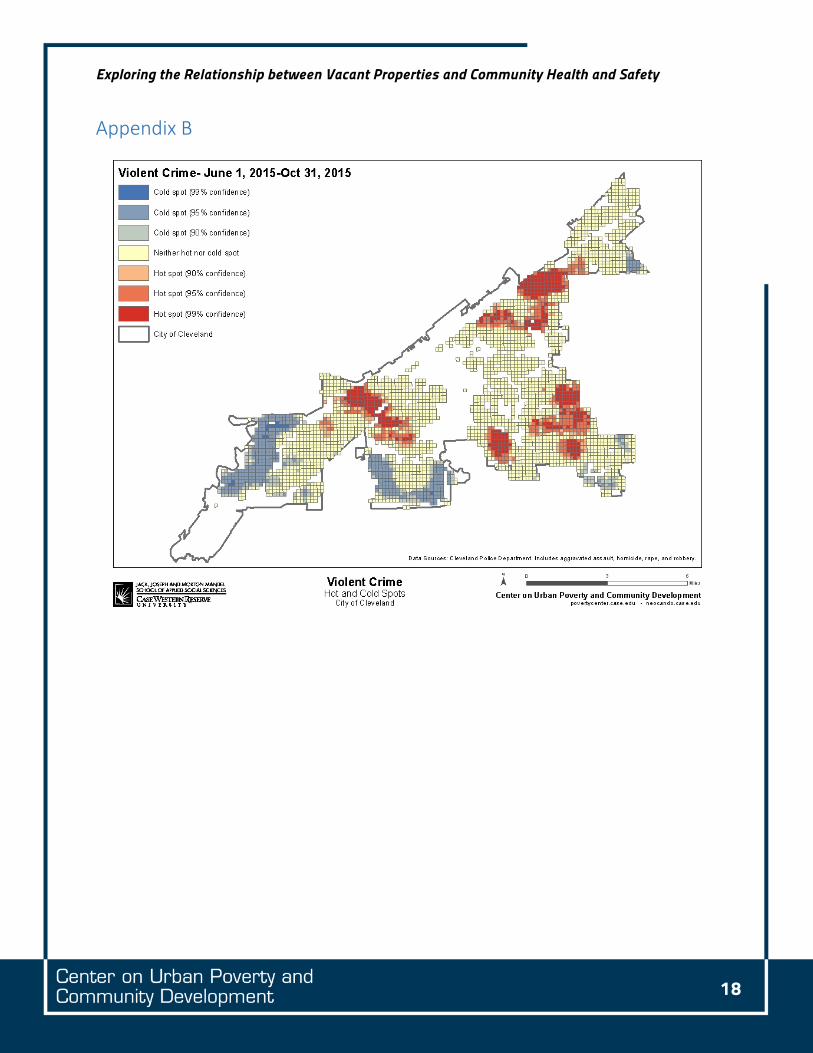
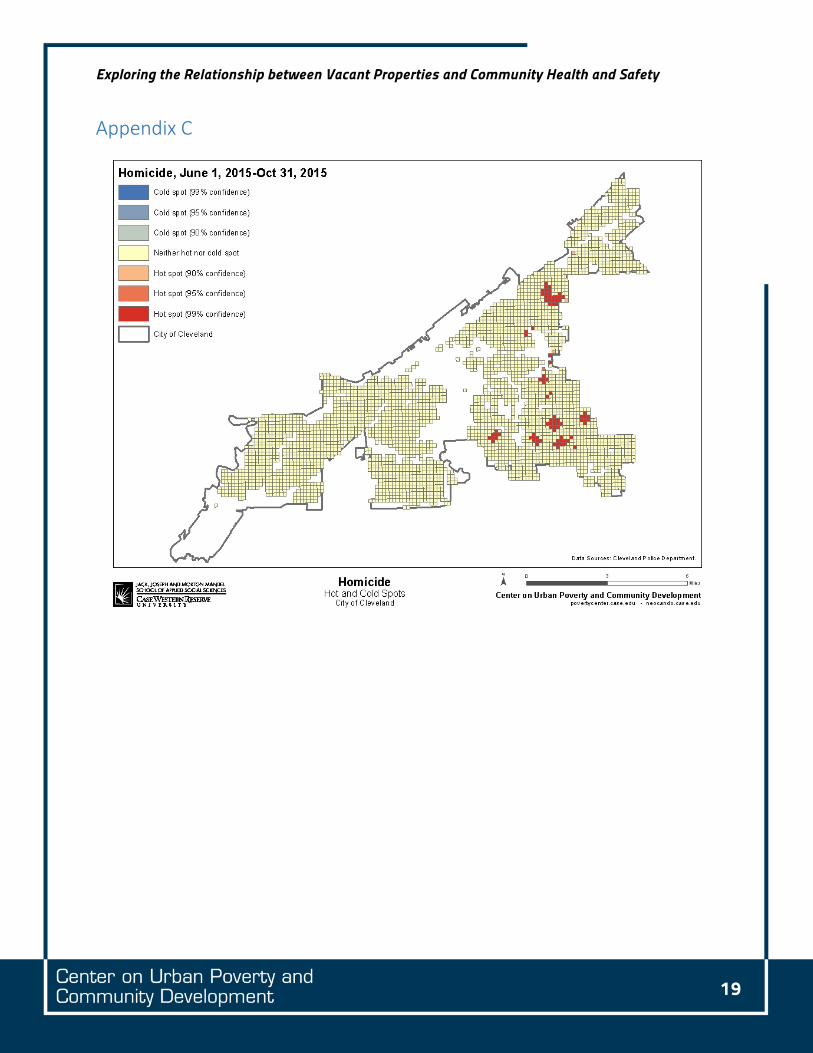
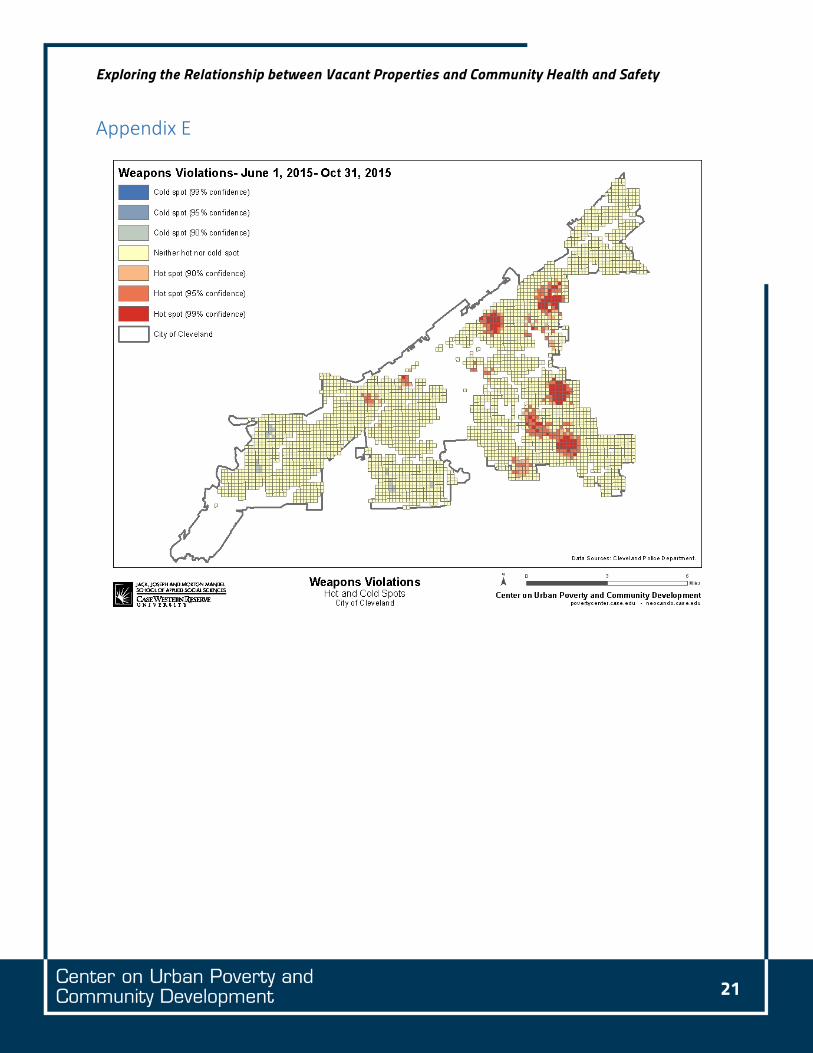
• 61.7% of EBLL hot spot grid cells are also vacancy hot spot grid cells • 65.4% of all violent crime hot spot grid cells are also vacancy hot spot grid cells • 83.2 % of homicide hot spot grid cells are also vacancy hot spot grid cells • 76.2% of aggravated assault hot spot grid cells are also vacancy hot spot grid cells • 75% of weapons violations hot spot grid cells are also vacancy hot spot grid cells
Figure 1

Exploring the Relationship between Vacant Properties and Community Health and Safety
9
We see strong co-occurrence between areas where vacancy is statistically prevalent and areas where positive EBLL test, homicide, aggravated assaults, and weapons violations are statistically prevalent. See Appendix A through E for OHSA maps of EBLL, violent crime, homicides, aggravated assaults, and weapons violations. There is also co-occurrence between vacancy and dead bodies, illicit drug possession, and robbery; just over 50 percent of the hot spots of crime types previously listed are also vacancy hot spots.
Figure 2
Survey Attributes
Number of hot spot grid cells
(total grid cells = 3,272)
Number of common grid cells between
variable and vacant hot spot
% of variable hot spots that are also
vacant hot spot Vacant 906
Community Health Indicators Elevated Blood Lead Level (EBLL) 498 307 61.7
Crime Indicators
Aggravated Assault 559 426 76.2 Arson 121 11 9.1 Burglaries 477 228 47.8 Dead Body 40 21 52.5 Domestic Violence 660 322 48.8 Homicide 89 74 83.2 Illicit Drug Possession 140 71 50.7 Larceny Theft 183 44 24.0 Motor Vehicle Theft 336 125 37.2 Non-Aggravated Assault 692 326 47.1 Property - Lost & Found 36 12 33.3 Prostitution/Commercialized Vice 76 13 17.1 Rape 93 6 6.5 Robbery 350 177 50.6 Runaways 149 28 18.7 Sexual Offenses 18 0 0.0 Vandalism / Criminal Damage 644 267 41.5 Weapons Violations 328 246 75.0 All Property Crimes 580 208 35.9 All Violent Crimes 720 471 65.4

Exploring the Relationship between Vacant Properties and Community Health and Safety
10
These findings are supported by the literature. As previously described, Branas et. al. (2012) found an association between vacancy and aggravated assault, and Cui and Walsh (2014) found an association between vacancy and violent crime. Hot spots of vacancy can also theoretically be hot spots of occupancy, if housing is dense enough in areas to contain high numbers of both relative to the surrounding areas. Because of this, we also compared optimized hot spots of occupancy with those of community health and safety indicators. We find the incident types that co-occur with vacancy (EBLL, violent crime, homicide, aggravated assault, and weapons violations) do not co-occur at the same high rates with occupancy hot spots. Only one crime incident type with over 60 percent co-occurrence rate with occupancy hot spots; runaways. Other types of crime incident hot spots co-occur with occupancy hot spots at rates below 60 percent that may still be significant, like arson, motor vehicle theft, and rape, but are beyond the scope of this analysis. See Appendix F for a table of all results. We hypothesize that the condition of the property also impacts its effect on these community health and safety measures; that properties that are more deteriorated are more likely to be a lead hazard and more likely to be a haven for criminal activity. This is a limitation of a number of the studies of the relationship between vacant properties and these community health and safety issues; other ways of measuring vacancy, like USPS data, don’t provide property condition information. To examine the relationship between property condition and these community health and safety indicators, we first examine hot spots of properties rated D or F, and then hot spots of properties rated A, B, or C. Then, we add the vacancy measure and examine hot spots of vacant properties rated D or F, as well as hot spots of vacant properties rated A, B, or C. We see the same co-occurrences with D and F rated properties (occupied and vacant) that we see with vacant properties. See Figure 3 for details. The following percentages of hot spots are also D and F property hot spots (greater than 60 percent co-occurrence):
• 61.7% of EBLL hot spots • 64.3% of all violent crime hot spots • 84.3% of homicide hot spots • 75.9% of weapons violations hot spots • 74.8% of aggravated assault hot spots
Conversely, examining hot spots of properties rated A, B, or C, we see one type of crime incident, runaways with co-occurrence rate greater than 60 percent. This is the same pattern seen previously with occupied properties. See Appendix G for a table of all results. Finally, we look at the co-occurrence between property vacancy and condition, calculating OHSA for vacant properties that are also rated D or F, and for vacant properties that are rated A, B, or C. The following percentages of hot spots are also vacant D and F property hot spots (greater than 60 percent co-occurrence):

Exploring the Relationship between Vacant Properties and Community Health and Safety
11
• 61.9% of EBLL hot spots • 64.2% of all violent crime hot spots • 82.0% of homicide hot spots • 77.7% of weapons violations hot spots • 74.1% of aggravated assault hot spots
Figure 3
Survey Attributes
Number of hot spot grid cells
Number of common grid cells between
variable and D & F hot spot
% of variable hot spots that are also D & F
hot spots D or F rating 935
Community Health Indicators Elevated blood lead level (EBLL) 498 307 61.7
Crime Indicators Aggravated Assault 559 418 74.8 Arson 121 11 9.1 Burglaries 477 220 46.1 Dead Body 40 21 52.5 Domestic Violence 660 312 47.3 Homicide 89 75 84.3 Illicit Drug Possession 140 71 50.7 Larceny Theft 183 44 24.0 Motor Vehicle Theft 336 117 34.8 Non-Aggravated Assault 692 321 46.4 Property - Lost & Found 36 8 22.2 Prostitution/Commercialized Vice 76 13 17.1 Rape 93 6 6.5 Robbery 350 169 48.3 Runaways 149 28 18.8 Sexual Offenses 18 1 5.6 Vandalism / Criminal Damage 644 267 41.5 Weapons Violations 328 249 75.9 All Property Crimes 580 203 35.0 All Violent Crimes 720 463 64.3

Exploring the Relationship between Vacant Properties and Community Health and Safety
12
The following percentages of hot spots are also vacant A, B, and C property hot spots (greater than 60 percent co-occurrence):
• 62.9% of EBLL hot spots • 60.3% of all violent crime hot spots • 78.7% of homicide hot spots • 63.1% of weapons violations hot spots • 69.2% of aggravated assault hot spots
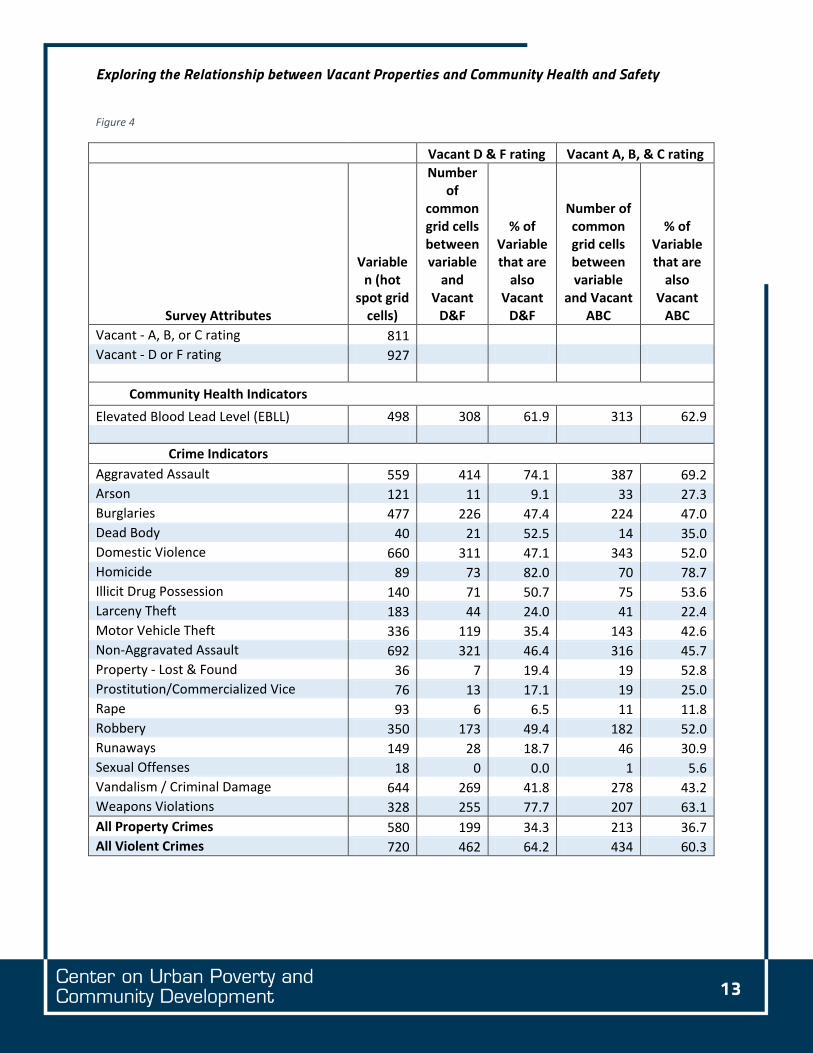
Interestingly, vacant A, B, and C property hot spots co-occur with community health and safety indicators at similar rates to vacant D and F property hot spots. Sixty-four percent of the areas that are hot spots of vacant properties rated A, B, or C or are rated D or F overlap, helping to explain the similarity to some extent. See Figure 4 for all results.
Exploring the Relationship between Vacant Properties and Community Health and Safety
13
Figure 4
Vacant D & F rating Vacant A, B, & C rating
Survey Attributes
Variable n (hot
spot grid cells)
Number of
common grid cells between variable
and Vacant
D&F
% of Variable that are
also Vacant
D&F
Number of common grid cells between variable
and Vacant ABC
% of Variable that are
also Vacant
ABC Vacant - A, B, or C rating 811 Vacant - D or F rating 927
Community Health Indicators Elevated Blood Lead Level (EBLL) 498 308 61.9 313 62.9
Crime Indicators Aggravated Assault 559 414 74.1 387 69.2 Arson 121 11 9.1 33 27.3 Burglaries 477 226 47.4 224 47.0 Dead Body 40 21 52.5 14 35.0 Domestic Violence 660 311 47.1 343 52.0 Homicide 89 73 82.0 70 78.7 Illicit Drug Possession 140 71 50.7 75 53.6 Larceny Theft 183 44 24.0 41 22.4 Motor Vehicle Theft 336 119 35.4 143 42.6 Non-Aggravated Assault 692 321 46.4 316 45.7 Property - Lost & Found 36 7 19.4 19 52.8 Prostitution/Commercialized Vice 76 13 17.1 19 25.0 Rape 93 6 6.5 11 11.8 Robbery 350 173 49.4 182 52.0 Runaways 149 28 18.7 46 30.9 Sexual Offenses 18 0 0.0 1 5.6 Vandalism / Criminal Damage 644 269 41.8 278 43.2 Weapons Violations 328 255 77.7 207 63.1 All Property Crimes 580 199 34.3 213 36.7 All Violent Crimes 720 462 64.2 434 60.3

Exploring the Relationship between Vacant Properties and Community Health and Safety
14
Overall, we see vacancy, crime, and lead exposure share hot spots, and deteriorated properties (with a condition rating of D or F in the survey) share hot spots with crime and lead exposure as well. Property vacancy and deterioration co-occur with lead exposure and violent crime, especially homicide, weapons violations, and aggravated assault. This finding confirms our hypothesis. When we examine hot spots of vacancy and property condition, we see similar rates of co-occurrence with crime and lead exposure among properties in good condition (rated A, B, or C), and deteriorated properties (rated D or F). This finding counters our hypothesis. This is at least partly due to hot spots of vacant A, B, or C rated properties being physically in the same locations as hot spots of vacant hot spot D or F rated properties. One possible interpretation is that in areas of concentrated vacancy, property condition does little to counter the negative co-occurrences of vacant properties. Additional exploration is merited to fully understand this relationship.
Limitations Beyond the hurdle of varying spatial extent, the challenge to exploring the overlap between vacancy, crime and lead exposure data is that results may be confounded due to similar underlying processes which create the spatial patterns. Often the same geographic areas, and populations of people, are affected by one or more of these issues. The underlying processes which create the spatial patterns may interact with one another or be connected in ways that we cannot assess visually. A further complication is the inclusion of various types of crime, which most likely are the result of different factors. Locations of crime events can be affected by many different elements such as opportunity, social disorder, policing policies, among others. Because the focus of this study is to investigate the relationship between vacancy and crime, we have not made assumptions about geographic areas. Moreover, the exploration of these patterns is critical to identify 1) areas of similarity, 2) areas of difference and 3) areas and issues to investigate at a finer-scale. For this reason, this study is not attempting to determine causality, but rather describe with greater detail and confidence the patterns which are present in the property survey area. As mentioned previously, the point-in-time estimates used for analysis present a cross-sectional view of the landscape of vacancy, crime and lead exposure. In reality, these variables are dynamic over space and time. Further investigations of other time periods, or a longitudinal approach, would provide greater understanding of the processes which create the identified patterns. This study furthers understanding of the intersection of vacancy, crime and lead exposure through the incorporation of a method, OHSA, which provides two enhancements to typical hotspot analysis. First is a level of significance to hotspots of each data layer, and second is the ability to compare results of different data through the use of a common grid. However, there are some limitations inherent to spatial analysis which persist in this study. In any form of cluster analysis there is an edge or boundary effect due to the use of a data set which has an area boundary, such as a census tract or city. Vacancy, crime and lead exposure do not simply stop at the City of Cleveland boundary, or on the last street of the property survey, but we have not included data for regions outside the survey area. Crime may actually extend beyond the border of the survey data, and those incidents may influence the location and intensity of a hotspot, but it is not included. Likewise, a caveat to the results of this analysis is the use of a grid based on the property survey. Several crime types may have incidents, and even a hotspot, in areas outside of the survey area and within the City of Cleveland. This study focuses on furthering understanding of crime within the property survey area, and the inclusion of these crime incidents, if in

Exploring the Relationship between Vacant Properties and Community Health and Safety
15
a great enough number, may mask the hotspots found in the study area. Conversely, if hotspot analysis was performed on a smaller geographic area, such as within a hotspot, the result may be fine-scale clusters on street segments or blocks. A potential next step is to explore at a more granular scale the intersection of vacancy, crime and lead. Finally, we chose to highlight relationships with at least 60 percent co-occurrence as areas of importance. This is a practical cut-off point, providing meaningful observations, but other cut-off points could be considered and examined.
Implications for policymakers In this analysis, we find hot spots of vacancy and hot spots of property deterioration co-occur with hot spots of lead exposure, violent crime, homicide, weapons violation, and aggravated assaults. In areas of concentrated vacancy, even properties in good condition coexist with hot spots of criminal activity and lead exposure. Our analysis only tests whether vacant properties and deteriorated properties co-occur with lead exposure and crime, it does not explain the nature of the relationship between the two. We are left with some important questions:
• How can we further understand and characterize the relationship between vacant and deteriorating properties and indicators of community health and safety?
• What other confounding factors might be related to both vacant and deteriorating property and these indicators of community health and safety?
What is clear is that property vacancy and deterioration are related to important public health and safety concerns that greatly diminish the quality of life for people remaining in these areas. Vacant properties and deteriorating properties do not exist in a vacuum, they have a greater impact on a community beyond neighborhood physical character and property tax revenue. Remediating or removing vacant or deteriorated properties may improve other measures of health and wellness in the neighborhood. Given the limitations of this study, we offer the following considerations for institutions working to remedy issues of vacant properties, community safety, and lead exposure. Consider how local housing-based strategies can work to reduce concentrated vacancy. Given our findings that hot spots of crime and lead exposure are located not just in hot spots of vacant and deteriorated properties, but also in hot spots of vacant properties in good or decent condition, housing-based strategies should consider the value of reducing concentrated vacancy to improving the quality of life for residents in a neighborhood. Reducing vacancy could take the form of clearing vacant and dilapidated housing. This study did not examine the relationship between crime, lead exposure, and concentrated vacant land, and that would be an important next step to understanding the impact of this type of activity. Reducing concentrated vacancy could also take the form of targeting occupancy-based programming (property rehabilitation, nonprofit home ownership programs, etc.) in areas of concentrated vacancy.

Exploring the Relationship between Vacant Properties and Community Health and Safety
16
Consider how community policing strategies target areas of concentrated vacancy. We find that areas of concentrated vacancy are also hot spots for violent crime, homicide, aggravated assault, and weapons violations. Given the severity of the types of crimes prevalent in areas of concentrated vacancy, local police should consider strategizing policing specific to these areas. We examined crime only in the summer and early fall, understanding crime can be seasonal, this should be considered as well. Consider how primary prevention efforts of lead exposure can be targeted to areas of concentrated vacancy. We find that areas of concentrated vacancy are also hot spots for children’s exposure to lead. Likewise, property vacancy and deterioration can be considered a concern of institutions dealing with lead exposure and crime. Property vacancy and condition could be considered in target programming like lead testing or community policing.
Conclusion In conclusion, we find that there are areas of significantly concentrated vacancy in Cleveland, and that areas of concentrated vacancy co-occur with hot spots of lead exposure, violent crime, homicide, weapons violation, and aggravated assaults. Similarly, areas of concentrated distressed properties, properties with a condition rating of D or F, and also coincide with hot spots of violent criminal activity and lead exposure. Hot spots of occupancy and hot spots of properties in good condition, rated A, B, or C, do not co-occur with these negative indicators of community health and safety at the same high rates.
When we examine vacant properties by condition, we see hot spots of vacant properties in good condition are nearly as similarly associated with violent criminal activity and lead exposure as vacant properties in distressed condition. This is at least partly caused by the heavy concentration of vacancy; vacant properties in good condition share the same space as vacant properties in distressed condition.
It is clear is that property vacancy and deterioration are related to important public health and safety concerns that greatly diminish the quality of life for people remaining in these areas. We suggest that local housing strategies consider ways to reduce the concentration of vacancy in their demolition and re-development work, and that housing and community development entities work in concert with policing and health agencies to develop strategies around community health and safety issues in areas of concentrated vacancy, given these findings.

Exploring the Relationship between Vacant Properties and Community Health and Safety
17
Appendix A
Exploring the Relationship between Vacant Properties and Community Health and Safety
18
Appendix B
Exploring the Relationship between Vacant Properties and Community Health and Safety
19
Appendix C

Exploring the Relationship between Vacant Properties and Community Health and Safety
20
Appendix D
Exploring the Relationship between Vacant Properties and Community Health and Safety
21
Appendix E

Exploring the Relationship between Vacant Properties and Community Health and Safety
22
Appendix F Optimized Hot-spot Analysis Results: Comparison of Grid Cells Among Occupied Hot-spot
Total number of grid cells N = 3272 Occupied
Survey Attributes
Variable n (hot spot grid
cells)
Number of common grid cells between variable
and Occupied
% of Variable that are
also Occupied
Occupied 908
Community Health Indicators Lead 498 174 34.9
Crime Indicators Aggravated Assault 559 133 23.8 Arson 121 55 45.5 Burglaries 477 167 35.0 Dead Body 40 21 52.5 Domestic Violence 660 305 46.2 Homicide 89 16 18.0 Illicit Drug Possession 140 44 31.4 Larceny Theft 183 56 30.6 Motor Vehicle Theft 336 138 41.1 Non-Aggravated Assault 692 230 33.2 Property - Lost & Found 36 18 50.0 Prostitution/Commercialized Vice 76 12 15.8 Rape 93 43 46.2 Robbery 350 111 31.7 Runaways 149 96 64.4 Sexual Offenses 18 1 5.6 Vandalism / Criminal Damage 644 173 26.9 Weapons Violations 328 83 25.3 All Property Crimes 580 196 33.8 All Violent Crimes 720 214 29.7

Exploring the Relationship between Vacant Properties and Community Health and Safety
23
Appendix G Optimized Hot-spot Analysis Results: Comparison of Statistically Significant Grid Cells - Hot-
Spots of Property Rating Categories Total number of grid cells N = 3272
A, B, & C rating
Survey Attributes
Variable n (hot spot grid
cells)
Number of common grid cells between
variable and A, B, C
% of Variable that are
also A, B, C
A, B, or C rating 905
Community Health Indicators Elevated Blood Lead Level (EBLL) 498 195 39.2
Crime Indicators Aggravated Assault 559 157 28.1 Arson 121 55 45.5 Burglaries 477 183 38.4 Dead Body 40 20 50.0 Domestic Violence 660 319 48.3 Homicide 89 27 30.3 Illicit Drug Possession 140 51 36.4 Larceny Theft 183 55 30.1 Motor Vehicle Theft 336 148 44.1 Non-Aggravated Assault 692 247 35.7 Property - Lost & Found 36 18 50.0 Prostitution/Commercialized Vice 76 15 19.7 Rape 93 43 46.2 Robbery 350 116 33.1 Runaways 149 96 64.4 Sexual Offenses 18 1 5.6 Vandalism / Criminal Damage 644 189 29.4 Weapons Violations 328 102 31.1 All Property Crimes 580 206 35.5 All Violent Crimes 720 241 33.5