demonstration appraisal report ofa single family … demonstration... · demonstration appraisal...
TRANSCRIPT
DEMONSTRATION APPRAISAL REPORT
OFA
SINGLE FAMILY RESIDENCE
LOCATED AT
3507 Elmwood Place Minnetonka, Minnesota 55345
Prepared for
Professional Admission Subcommittee International Association of Assessing Officers
130 East Randolph Street, Suite 850 Chicago, IL 60601
Prepared by
_
Minneapolis, Minnesota 55487
Date of Appraisal
June 1, 1994
_ .. - --••----- __
Minneapolis, MN 55487
June 22, 1998
Professional Admission Subcommittee International Association of Assessing Officers 130 East Randolph Street, Suite 850 Chicago, IL 60601
Dear Subcommittee Members:
Attached is a demonstration appraisal of a single-family dwelling located at 3507 Elmwood Place, Minnetonka, Minnesota 55345 and legally described as:
The North Thirty feet, front & rear, of Lot 33, also Lot 34, Block 3, Staring's Tonka Wood-Croft, Hennepin, Minn., according to the plat on file and of record in the office of the Registrar of Titles in and for said County.
This is a complete and self contained appraisal report. It contains 130 pages and an addenda of 19 exhibits. It is presented as a documentation of my knowledge and ability to apply appraisal procedures to an actual property in fulfillment of one of the requirements of the IAAO Professional Designation Program for the Certified Assessment Examiner (CAE) designation. The purpose of the report is to estimate the market value of fee simple title to the encumbered rights of the subject property, as of
June 1, 1994
Market value as used in the context of this report is defined as:
"...The most probable price expressed in terms of money that a property would bring if exposed for sale in the open market in an arm's-length transaction between a willing seller and a willing buyer, both of whom are knowledgeable concerning qi the uses to which the property is adapted and for which it is capable of being used."
On the basis of my analysis, which is detailed in this report, I estimate the market value of the subject property as of the appraisal date as:
One Hundred Four Thousand Nine Hundred Dollars
($104,900)
Sincerely,
r

TABLE OF CONTENTS
Summary of Salient Facts and Conclusions 1
Identification of Client 3
Identification of Subject Property 4
Ownership/Sales History 5
Property Rights Appraised 6
Purpose of the Appraisal 7
Reasonable Exposure Time 8
Intended Uses and Users of the Appraisal 9
Extent of the Appraisal 10
Assumptions and Limiting Conditions 11
Tax and Assessment Analysis 12
City & Area Analysis 18
Neighborhood Analysis 24
Site Analysis 28
Improvement Analysis 31
Actual Age, Effective Age, Total Economic Life Analysis 36
Support for Total Economic Life & Effective Age Analysis 38
Highest and Best Use Analysis 43
The Appraisal Process 50
Application of the Cost Approach 55
Introduction 55
Description of Comparable Land Sales 58
Adjustments of Comparable Land Sales 63
Reconciliation of Land Value Estimate 67
Estimate of Cost New 68
Depreciation Analysis 71
Summary of the Cost Approach 80
Indicated Value by the Cost Approach 80
Application of the Income Approach 81
Introduction 81
Description of Comparable Rental Sales 83
Estimate of the Gross Rent Multiplier 89
Development of Market Rent 91
Description of Market Rent Data 92
Selection and Development of Units of Comparison 98
Summary of Market Rent Adjustments 100
Estimate of Market Rent 103
Indicated Value by the Income Approach 104
Application of the Sales Comparison Approach 105
Introduction 105
Selection and Development of Units of Comparison 105
Description of Comparable Sales Data 107
Summary of Sales Comparison Adjustments 114
Indicated Value by the Sales Comparable Approach 123
Correlation and Final Estimate of Value 125
Review of Developed Data 125
Analysis of Strength and Weakness of Each Approach 126
Final Value Conclusion 128
Certification 130
ADDENDA
Exhibit A Subject Photographs 131
Exhibit B Property Types and Classes 134
Exhibit C United States Map 135
Exhibit D Regional Map 136
Exhibit E Location Map 137
Exhibit F County of Hennepin Map 138
Exhibit G City of Minnetonka Map 139
Exhibit H Neighborhood Map 140
Exhibit I Area Map 141
Exhibit J Zoning Map 142
Exhibit K Zoning Ordinance 143
Exhibit L Survey 157
Exhibit M Plot Plan 158
Exhibit N Floor Plan 159
Exhibit 0 Comparable Land Sales Map 161
Exhibit P Comparable Rental Sales Map 162
Exhibit Q Comparable Rental Properties Map 163
Exhibit R Comparable Sales Map 164
Qualifications of the Appraiser 165
Appendix 1 — References 167
SUMMARY OF SALIENT FACTS AND CONCLUSIONS
Purpose of the Appraisal:
To estimate the market value of the subject property in fee simple title as of June 1, 1994.
Property Rights Appraised:
Fee Simple title, free and clear of encumbrances.
Property Address:
3507 Elmwood Place, Minnetonka, Minnesota 55345.
Description of Improvements:
One-story, wood frame, single family dwelling, built in 1954, with 1,118 square feet on the main level and a single stall attached garage.
Description of Site:
Mostly level, rectangular shaped lot, approximately 90 feet by 124 feet, total square footage equals 11,255 square feet.
Zoning: R-1, Low Density Residential
Assessed Valuation and Taxes:
Assessor's 1994 Estimated Market Value $88,600.00 Total 1994 Net Taxes Payable (Homestead) $ 1,405.65 Special Assessments $ 258.37
Highest and Best Use:
Site if Vacant - Single Family Residential Site as Improved - Single Family Residential
Chronological Age: 1954
Total Economic Life: 95 years
Effective Age: 40 years
1

Remaining Economic Life: 55 years
Reproduction Cost New (RCN): $140,853
Total Depreciation: $67,126
Depreciated Value of Improvements: $76,400
Site Value: $33,900
Indicated Value by Cost Approach: $110,300
Indicated Value by Income Approach: $102,700
Indicated Value by Sales Comparison Approach: $104,100
Final Value Estimate as of June 1, 1994: $104,900

IDENTIFICATION OF CLIENT
The client for whom this appraisal is made is the International Association of Assessing Officers Professional Admission Subcommittee.
3

IDENTIFICATION OF SUBJECT PROPERTY
Photograph taken June 23, 1995.
The subject property is a single family residential property located at 3507 Elmwood Place, Minnetonka, Minnesota. The site is a mostly level, rectangular shaped lot, approximately 90 feet by 124 feet. The total square footage of the lot equals 11,255. The improvement is a one-story, wood frame, single family dwelling, built in 1954 by Ecklund and Sweatlund, with 1,118 square feet on the main level and a single stall attached garage.
The legal description is: The North Thirty feet, front & rear, of Lot 33, also Lot 34, Block 3, Staring's Tonka Wood-Croft, Hennepin, Minn., according to the plat on file and of record in the office of the Registrar of Titles in and for said County.
The Property Identification Number (PIN) is 17-117-22-42-0027, which is the tax parcel number.
4

OWNERSHIP/SALES HISTORY
Ernest J. and Anna F. Arnold are the fee owners and occupants since May 28, 1954, as recorded by the Registrar of Titles of Hennepin County, Minnesota. The torrens title is recorded under document number D424652.
5

PROPERTY RIGHTS APPRAISED
The rights of the subject property being appraised are known as the bundle of rights. These six basic rights associated with ownership are the right to use, to sell, to rent or lease, to enter or leave, to give away, and to refuse to do any of these.
These legal rights are obtained with fee simple title, which is free and clear of all encumbrances, including easements, right of way, and liens. This title is the greatest possible degree of ownership.
However, these property rights are subject to certain governmental restrictions such as taxation, eminent domain, escheat, and police power.
6
PURPOSE OF THE APPRAISAL
The purpose of the appraisal is to estimate the market value of the fee simple estate for the subject property located at 3507 Elmwood Place, Minnetonka, Minnesota, as of June 1, 1994.
Fee simple estate, as defined in Appraising Residential Properties is:
"an absolute ownership unencumbered by any other interest or estate. The owner of a fee simple title possesses all the rights and benefits of the real estate subject only to the powers of government, which include taxation, eminent domain, escheat, and police power. The owner of a fee simple title possesses a complete bundle of rights."2
As defined in Property Appraisal and Assessment Administration,
"Market value is the most probable price expressed in terms of money that a property would bring if exposed for sale in the open market in an arm's - length transaction between a willing seller and a willing buyer, both of whom are knowledgeable concerning all the uses to which the property is adapted and for which it is capable of being used."3
The basic points in this definition include:
1. It is the most probable price, not the highest, lowest, or average price.
2. It is expressed in terms of money.
3. The property must be exposed on the open market for a reasonable period of time.
4. Both the buyer and seller are informed of the uses to which the property may be put.
5. An arm's-length transaction is required in the open market.
6. Buyer and Seller are both well informed and are acting prudently.
7. It recognizes the present use as well as the potential use of the property.
Numerous definitions of market value exist. They have been created by professional organizations, legislation, and by the courts. As conditions and standards change, the definition of market value may change.
7

REASONABLE EXPOSURE TIME
In my opinion the reasonable exposure time linked to the value opinion is six months or less.
8

INTENDED USES AND USERS OF THE APPRAISAL
The intended use of the appraiser's opinions and conclusions is for demonstration purposes to fulfill the narrative appraisal requirement for the Certified Assessment Examiner (CAE) designation. In addition, it is to demonstrate the appraiser's understanding of the appraisal process by developing a logical, defensible value of the subject property.
The intended user of the appraiser's opinions and conclusions is the International Association of Assessing Officer's Professional Admission Subcommittee.
9

THE EXTENT OF THE APPRAISAL
The extent of the appraisal encompasses the research and analysis necessary to prepare a report in accordance with the Uniform Standards of Professional Appraisal Practice as adopted by the Appraisal Foundation.
In regard to the subject property, the following steps were involved:
1. The property located at 3507 Elmwood Place, Minnetonka was physically inspected on September 19, 1993. The photographs of the subject were taken on June 23, 1995.
2. Regional, City, and Neighborhood data was compiled using several sources. Primary sources consulted were the Metropolitan Council and the Minnesota Department of Trade and Economic Development. Information was also obtained from conversations with the City of Minnetonka Assessing, Planning, Engineering, and Community Development departments.
3. Contacts were made with appropriate buyers and sellers, real estate agents, and County officials to substantiate information stated in this report.
4. All sales information including land sales, rental sales, and market sales, as well as sales used to support adjustments were collected from public records.
5. All three approaches to value were considered and developed.
6. Each approach to value indicated a different market value and was reconciled to a final estimate of value.
10

ASSUMPTIONS AND LIMITING CONDITIONS
This report is subject to the assumptions and limiting conditions noted below:
1. The final estimate of market value developed in this report is as of June 1, 1994. The use of the property at that time determined the distribution of the valuation between land and improvements. Any change in the present use of the property or the date of valuation may or may not affect the final conclusion of value that is stated in this report.
2. The legal description, status of title, and other matters legal in nature are assumed to be correct. No responsibility is assumed by the appraiser for such legal matters and this appraisal should not be construed as an opinion on such legal matters.
3. In the process of completing this appraisal, information was obtained from individual opinions, public records, and other sources deemed to be reliable and accurate. Such information is presumed to be correct and reliable. No responsibility is assumed for any errors or omissions on such data.
4. The description and analysis of the improvements are based upon visual inspection of the subject property. No liability is assumed for any hidden or unapparent defects in any structure, improvement, or soil that would render the property more or less valuable.
5. Building sketches, plot plans, photographs, and other such exhibits are included in this report only to aid in visualizing the property. No survey of the property was completed and drawings may not be correct scale. No liability is assumed through any errors or omissions in such exhibits.
6. The existence of hazardous material, which may or may not be present on the property, was not observed by the appraiser. The appraiser has no knowledge of the existence of such materials on or in the property and is not qualified to detect such substances. The value estimate is predicated on the assumption there is no such material on or in the property that would cause a loss in value. No responsibility is assumed for any such conditions, or for any expertise or engineering knowledge required to discover them.
7. Possession of this report or a copy thereof does not provide the right of publication, nor may it be used for any other purpose by anyone other than the applicant without prior written consent of the appraiser.
8. The appraiser does not consent to appear or give testimony in any court, hearing, or conference unless proper prior arrangements have been made.
11

TAX AND ASSESSMENT ANALYSIS
Minnesota's property tax system is "ad valorem" which means that taxes are based upon "value". All taxable property in Minnesota is classified and valued each year as of January 2, for taxes payable the following year. Minnesota is a 100 percent market value state. Therefore, the estimated market value represents a theoretical selling price for the property as of the assessment date.
The formula for property tax is established by the state legislature and is implemented state-wide. There have been numerous attempts to simplify the Minnesota property tax system. In 1988, the Minnesota legislature passed the Omnibus Tax Bill and changed the tax system from one based on mill rates and assessed values to a system based on tax capacities and tax extension rates.
The Omnibus Tax Bill was designed to simplify the tax system, however the basic principal of calculating taxes remained the same. Under the old tax system, the market value was multiplied by a different assessment percentage based upon the classification of the property. This determined the assessed value which, in turn, was multiplied by a mill rate to arrive at a gross tax. To determine the net tax payable, any state credits that were applicable (i.e. homestead credit) were subtracted from the gross tax.
The new tax system created five general classifications for real property. The five classifications encompass fifty-two different property types. The classifications are based upon use, and assigned to the property by the assessor's office. Depending upon the classification, various tax capacity percentages are applied to the estimated market value (EMV) to determine the total tax capacity of the parcel. The tax capacity is then multiplied by a tax extension rate to arrive at a gross tax. The tax extension rate is composed of the levies imposed by the various jurisdictions affecting the property such as the school district, county, city, and other miscellaneous taxing jurisdictions. To arrive at the net tax payable any credits available to the property are subtracted from the gross tax.
In 1993, the legislature passed a law limiting how much an assessor's estimated market value (EMV) can increase from year to year. The limited market value was retroactive to the EMV established as of January 2, 1993 and remains in effect through the EMV established as of January 2, 1998. The amount of the increase can not exceed the greater of:
1. ten percent of the value, in the preceding assessment or
2. one-third of the difference between the current assessment and the preceding assessment.
The limitation does not include increases in value due to improvements.
12

On January 2, 1994, the subject property was classified as 1A, residential homestead (refer to Exhibit B for an example of the classification chart). A homestead property is one that is owned and occupied by the fee holder and used as their principal residence as of the assessment date. An affidavit must be signed to attest to these facts and retain the classification. Any property that was not used for the purpose of a homestead or was partially homesteaded on the assessment date, but is used for the purpose of a homestead on December 1, will qualify as Class 1.
A homestead tax capacity is determined by taking portions of the estimated market value of the property and multiplying those values by two tax capacity percentages. The total tax capacity is then multiplied by the tax extension rate. This equals the net payable real estate tax. Historically, homestead (owner-occupied) property has received favorable tax treatment in Minnesota versus non-homestead property.
If the property was not the principal residence of the owner, for example rental property, the property would be classified as non-homestead. The calculation of non-homestead tax is similar to the homestead calculation. The difference is the market value of the property is multiplied by one tax capacity percentage instead of two percentages. The difference between homestead versus non-homestead tax can be as much as 130 percent for a property assessed at $50,000 or as little as 19 percent for a property assessed at $1,000,000. This additional tax burden helps to explain the limited number of rental properties due to the extra expense related to real estate taxes.
The flow chart on the following page shows how the 1994 homestead real estate taxes were calculated for the subject property. A sample calculation of the non-homestead classification can also be found on the same page. The assessor's 1993 estimated market value for the subject property for taxes payable in 1994 was $85,500. The subject property and all other properties in the neighborhood were reappraised for the 1994 assessment. Based on the reappraisal and current sales data, the assessor's 1994 estimated market value was increased to $88,600.
Property taxes are a perpetual lien on the property and are due each year. The first half is due May 15, and the second half is due October 15.
13

TAX CALCULATION FOR RESIDENTIAL
TAX CALCULATION FOR RESIDENTIAL HOMESTEAD PROPERTY
NON-HOMESTEAD PROPERTY
1st $72,000 of EMV X 1.0% + remainder of EMV X 2.0%
equals
TOTAL TAX CAPACITY
Tax Capacity Multiplied By Tax Extension Rate
equals
GROSS TAX
1993 EMV = $85,500.00 1994 Tax Extension Rate = 141.985
$72,000 X 1.0% = $720.00 $13,500 X 2.0% = $270.00
Tax Capacity = $990.00
$990.00 X 141.985 = $1,405.65 Gross Tax = $1,405.65
Estimated Market Value (EMV) X 2.3%
equals
TOTAL TAX CAPACITY
Tax Capacity Multiplied By Tax Extension Rate
equals
GROSS TAX
1993 EMV = $85,500.00 1994 Tax Extension Rate = 141.985
$85,500 X 2.3% = $1,966.50 Tax Capacity = $1,966.50
$1,966.50 X 141.985 = $2,792.14 Gross Tax = $2,792.14
14

Special assessments are any liens against a property for public improvements such as city water, storm and sanitary sewer, street improvements, and street lighting. If there are any special assessments they must be added to the total payable tax. There are special assessments levied against the subject property. The special assessment is for a 1975 sewer and water line assessment that was levied in January, 1976 for 20 years. The last payment for the special assessment is due on November 15, 1994.
Revenue generated from property taxes is used to pay for the services provided by local government. The $1,405.65 of taxes payable for the subject property are distributed as follows:
Dollars Percent Minnetonka School District $ 757.50 53.89 Hennepin County $ 370.67 26.37 City of Minnetonka $ 200.73 14.28 Vocational Schools $ 8.01 .57 *Special Taxing District $ 68.74 4.89
$1,405.65 (100%)
*Special Taxing Districts include: Metro Transit, Watershed District, Mosquito Control, Metropolitan Council, Metro Council Waste Bond & Interest, Park Museum, Hennepin Parks.
Historically, the valuation and real estate taxes for the subject property have been steadily increasing. The following chart compares the market values, extension rates, and taxes of the subject property for the last five years.
Assessment/Tax Market Value Extension Rate Taxes 89/90 $77,300 103.407 $ 895.49 90/91 $79,000 111.803 $1,006.21 91/92 $82,500 124.108 $1,154.19 92/93 $82,500 138.126 $1,284.57 93/94 $85,500 141.985 $1,405.65
Over the past five year period, the market value increased 10.6 percent while the tax extension rate increased 37.3 percent, and the overall tax increased 57.0 percent. As a result of the four year reappraisal cycle, the subject neighborhood was reappraised for the 1994 assessment year. The 1994 valuation of the subject property increased from $85,500 to $88,600. Thus an increase in taxes payable in 1995 can be expected. If the trend were to continue in the future, one could expect an increase from year to year.
In Minnesota, the assessor is required by state law to view and appraise 25 percent of the parcels annually so that each property in the jurisdiction is reappraised once every
15

four years. The fairness of the tax burden can depend on how well local levels of government administer uniform assessment practices and procedures. The Minnesota Department of Revenue administers the tax laws and assessment procedures for the state.
Assessment levels are measured by annual sales ratio studies conducted by the Department of Revenue. The sales ratio is the relationship between the assessor's estimated market value and the actual sale price of the sold property. The minimum median sales ratio allowed for any class of property is 90 percent and the maximum median sales ratio allowed is 105 percent. In addition to the state standards, the Hennepin County Assessor's Office also imposes their own standards. The minimum median sales ratio allowed for any class of property, is 93 percent. The following statistical data was reported for the Minnetonka residential sales ratio study conducted on properties sold between October 1, 1992, to September 30,1993:
Median 93.4% Mean 93.2% COD 7.2 Number of Sales 554
The coefficient of dispersion (COD) is the measure of uniformity in the sample. The lower the COD is the higher the degree of uniformity. The International Association of Assessing Officers (IAAO) recommends for a fairly homogeneous area, a COD standard of 10.0 or less.
The assessment level for the subject neighborhood appears consistent with other neighborhoods and with the overall city sales ratio. The following data represents the subject neighborhood during the same time frame.
Median 94.8% Mean 97.0% COD 4.4 Number of Sales 24
The assessment level for the neighborhood not only has been found equitable with the overall sales ratio for the city, but it also shows equability with suburban Hennepin County. Listed below is the sales ratio study conducted on properties in suburban Hennepin County sold between October 1, 1992 to September 30,1993:
*Suburban Hennepin Median 93.5% Mean 93.6% COD 6.2 Number of Sales 9,050
*Total figures (except sales) are weighted Municipal Averages
16

A sales ratio study of the five properties located within the subject neighborhood which were utilized in the sales comparison approach are listed below. The sales have finance and time adjustments to make them equivalent to the appraisal date of June 1, 1994. The time adjustment has been well documented in the sales comparison approach.
Sales Sale Date Address 1994 EMV Sale Price Ratio May, 1994 3429 Fairlawn Dr. $108,100 $121,500 88.97% February, 1992 3511 Elmwood Pl. $ 91,300 $108,881 83.85% May, 1991 3648 Hazelmoor Pl. $102,100 $116,419 87.70% March, 1994 3516 The Mall $ 99,200 $113,881 87.11% April, 1993 16204 Tonkaway Rd. $101,900 $114,197 89.23%
Median 87.70% Mean 87.37% Range 83.85% - 89.23%
Subject 3507 Elmwood Pl. $88,600 $104,900 84.46%
These sales ratios indicate that amongst themselves the comparables are found to be equitable. When the subject property is compared to the sales comparables it is found that the estimated market value is equitable with the comparables themselves. However, to make the subject property and the sales comparables estimated market values consistent with the minimum requirements of assessment levels set forth by the Department of Revenue and Hennepin County, an adjustment will be necessary for the 1995 assessment. The sales ratio study conducted above on the subject property and sales comparables indicate that the market has been very active and appreciating at a high rate since the subject neighborhood was last assessed for the 1994 assessment.
The subject property's tax burden has increased 57.0 percent from payable 1990 to 1994. This has not occurred because of an unfair assessment level. It has been shown that the assessment level for the subject property and neighborhood is fair and equitable. The primary reason for the increase in real estate tax, is the action of the State Legislature. With changes to the property tax system each legislative session, it is hard to predict the effect on the taxes for the subject property.
The trend of increasing values and real estate taxes are expected to continue as the demand for residential properties in the area increase and as further demands for services from the local governments continues to increase.
Recent studies of properties sold in the subject neighborhood do not indicate any measurable effect on market values as a result of the tax increase or any of the new property tax legislation.
17

CITY AND AREA ANALYSIS
The subject property is located in the City of Minnetonka, County of Hennepin, State of Minnesota. Minnesota is located in the north central United States, on the U.S. - Canada border. Hennepin County is located in the east-central portion of the state.
The City of Minnetonka, the twelfth largest community in Minnesota and the fifth largest city in Hennepin, is located ten miles directly west of Minneapolis. Minnetonka is located in the middle ring suburbs of the Twin Cities Metropolitan Area (TCMA).
Minnetonka comprises an area of 28 square miles or 17,983 acres. Minnetonka's neighboring cities include Plymouth to the North, St. Louis Park, Hopkins, and Edina to the East, Eden Prairie to the South, and Shorewood, Deephaven, Greenwood, Woodland, and Wayzata to the West.
After the Native Americans gave up their rights to territory west of the Mississippi River, the first two settlers to "rediscover" and explore Lake Minnetonka were Simon Stevens and Calvin Tuttle. The two men went in search of the best location for water power on Minnehaha Creek. They chose a site below the outlet of the lake at Gray's Bay (then Outlet Lake). In April of 1852, Stevens built the first claim shanty in the Lake area and in May of 1852, the lake was christened "Minnetonka," by Governor Alexander Ramsey. In August 1852, the first saw mill in Hennepin County was started. The mill also was the first privately operated mill in Minnesota west of the Mississippi River. The settlement that developed around this area was referred to as Minnetonka Mills and it became the first permanent European-American settlement west of Minneapolis in Hennepin County.
Minnetonka's history as a settled community extends back only 142 years. In that time, the Community has evolved from heavily wooded wilderness through extensive farming and thriving industrialization to its present, primarily residential suburban character. In 1956, Minnetonka was incorporated as a village and in 1969, Minnetonka became a city by charter.
The form of government established by the City Charter is the Council-Manager Plan. The Plan gives council-member's responsibility of basic decisions for the community; including appointment of the City Manager. The City Council, elected on a non-partisan basis, is composed of a Mayor and six Council-members, four of whom are elected by ward and two elected at large. Each serves a term of four years. The City Manager is responsible for putting Council policies in effect and administers affairs of the city government. The City employs approximately 200 full-time employees.
The State Demographer has estimated the 1993 population of Minnetonka at 49,266, an increase of 27 percent over the 1980 census count of 38,683. The 1993 estimate compares to a population of 35,776 in 1970. The increase in population is the tenth
18

largest gain in Hennepin County. Projected population estimates indicate the growth will continue until the year 2010 and reach a peak of 56,500. The Twin Cities Metro Area (TCMA) is divided into the central cities, inner-ring suburbs, middle-ring suburbs, and the outer-ring suburbs. Minnetonka is a middle-ring suburb. Between the years 1980 and 1990, 82 percent of the TCMA growth occurred within the middle-ring of suburbs. The central cities and inner-ring suburbs combined lost 5,219 between the years 1980 and 1990.
The office of the State Demographer has estimated the 1990 median family income among residents of Minnetonka, as $50,659. The largest part of the population is employed in managerial and professional occupations. Sales, technical, and administrative support positions are also common amongst the Minnetonka population. In April 1994, the unemployment rate in the Twin Cities was estimated at 3.3 percent, down from 4.2 percent a year ago. In 1990, Minnetonka had 35,536 jobs in the city and ranked eighth in the TCMA. The Metropolitan Council forecasts that Minnetonka will continue to attract business and industry in the future, and add approximately 13,464 jobs by the year 2000. Total employment by the year 2000 should reach 49,000 jobs.
The population, employment trends and shifts of a city are important to the principle of supply and demand, which will have a direct effect on the market value of the subject property.
Currently, Minnetonka is approximately 95 percent developed, and the last three large residential developments that the city can accommodate are under construction. Vacant land that is suitable for residential development is becoming scarce. The decreasing number of residences constructed is evidenced by 120 new homes in 1992, 98 in 1993, and 95 in 1994. Soon, Minnetonka will have to rely on scattered sites and lots from tear down housing. This is in contrast to some of the neighboring communities, such as, Eden Prairie and Plymouth, which are relatively undeveloped in comparison to Minnetonka.
Over the past decade, Minnetonka has been able to attract increasing numbers of non-residential developments, which has been appealing for corporate headquarters and mixed use office parks. Cargill ranked first on Forbes' list of the 400 largest privately owned companies, is located in Minnetonka; as well as several major corporate complexes, such as, Opus Corporation, the Minnetonka Corporate Center, and the Carlson Towers. The largest industries in Minnetonka include:
19
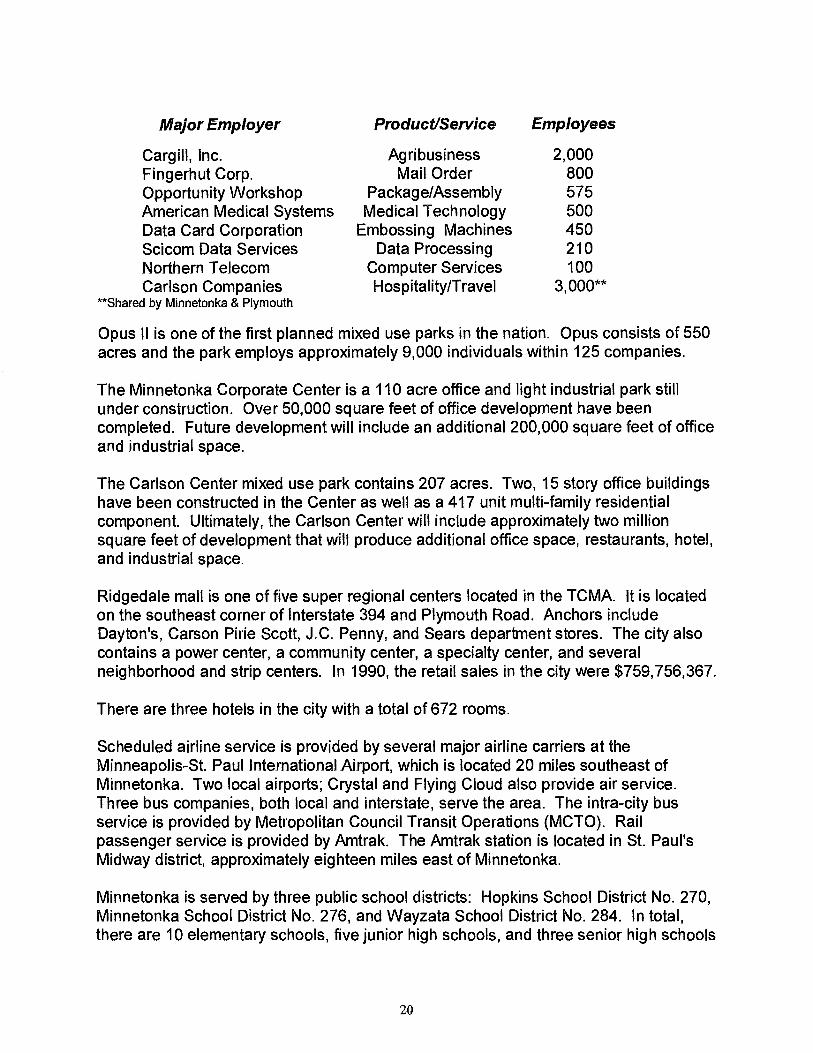
Major Employer
Cargill, Inc. Fingerhut Corp. Opportunity Workshop American Medical Systems Data Card Corporation Scicom Data Services Northern Telecom Carlson Companies
**Shared by Minnetonka & Plymouth
Product/Service
Agribusiness Mail Order
Package/Assembly Medical Technology
Embossing Machines Data Processing
Computer Services Hospitality/Travel
Employees
2,000 800 575 500 450 210 100
3,000**
Opus II is one of the first planned mixed use parks in the nation. Opus consists of 550 acres and the park employs approximately 9,000 individuals within 125 companies.
The Minnetonka Corporate Center is a 110 acre office and light industrial park still under construction. Over 50,000 square feet of office development have been completed. Future development will include an additional 200,000 square feet of office and industrial space.
The Carlson Center mixed use park contains 207 acres. Two, 15 story office buildings have been constructed in the Center as well as a 417 unit multi-family residential component. Ultimately, the Carlson Center will include approximately two million square feet of development that will produce additional office space, restaurants, hotel, and industrial space.
Ridgedale mall is one of five super regional centers located in the TCMA. It is located on the southeast corner of Interstate 394 and Plymouth Road. Anchors include Dayton's, Carson Pirie Scott, J.C. Penny, and Sears department stores. The city also contains a power center, a community center, a specialty center, and several neighborhood and strip centers. In 1990, the retail sales in the city were $759,756,367.
There are three hotels in the city with a total of 672 rooms.
Scheduled airline service is provided by several major airline carriers at the Minneapolis-St. Paul International Airport, which is located 20 miles southeast of Minnetonka. Two local airports; Crystal and Flying Cloud also provide air service. Three bus companies, both local and interstate, serve the area. The intra-city bus service is provided by Metropolitan Council Transit Operations (MCTO). Rail passenger service is provided by Amtrak. The Amtrak station is located in St. Paul's Midway district, approximately eighteen miles east of Minnetonka.
Minnetonka is served by three public school districts: Hopkins School District No. 270, Minnetonka School District No. 276, and Wayzata School District No. 284. In total, there are 10 elementary schools, five junior high schools, and three senior high schools
20
that serve the city. In addition, there are two parochial and three private schools that serve the area.
In Minnetonka, there are twenty-four churches, representing many denominations. In the summer of 1995 the Adath Jeshurun Synagogue will open.
The climate for the area is varied and four distinct seasons exist. January, the coldest month, has an average daily temperature range from 6 to 24 degrees Fahrenheit. July, the hottest month, has an average daily temperature range from 60 to 86 degrees Fahrenheit. The annual average snowfall is 44 inches and average precipitation is 26 inches. The diverse climate encourages many different types of festivals and recreational activities.
Many cultural and recreational opportunities are offered in Minnetonka and in the TCMA. Community activities include: Minnetonka Summer Festival, Ice Cream Social, Burwell House, Winter Carnival, Aquatennial, State Fair, major professional sports, Minnesota Zoo, Guthrie, Walker Art Center, and Ordway Theater.
Minnetonka has 39 parks consisting of five large community parks, 24 neighborhood and sub-neighborhood parks with play fields, picnic areas, tennis courts, etc. The parks comprise 1,100 acres of which almost 75 percent have been left in a natural state. In addition, many diverse recreational opportunities are available from the Minnehaha Creek and its headwaters that meanders through the north half of Minnetonka and then flows through several communities before eventually reaching Minnehaha Falls and the Mississippi River.
Minnetonka prides itself on its extensive recreational trail network, which runs more than 30 miles through the city. This award winning system provides the major link to neighborhood and community parks and the trail furnishes an opportunity to access the regional trail system of the metropolitan area.
The City administration is headed by the City Manager. City services are provided by approximately 200 full-time employees and organized into nine departments that include Administration, Finance, Legal, Operations and Maintenance, Public Safety, Engineering, Planning, Community Development, and Recreation. The police department has 44 sworn officers. Minnetonka has 82 volunteer fire department members and a No. 4 fire class rating.
The city budget for 1994 was $11,801,000. The city maintains an AM bond rating as established by Moodys. The January 2, 1994, total estimated market value of the city was $3,079,151,600.
In 1994, the City of Minnetonka had approximately 20,422 total housing units of which 16,030 are single family residences and 4,392 are apartments or other multi-family dwellings. The most typical residence is a three bedroom rambler, 1,000-1,300 square
21

feet, built in the 1950's and 1960's. A 96.5 percent owner-occupancy rate, combined with the excellent conditions of the housing stock is evidence that there is a high level of "pride of ownership" throughout the city.
Minnetonka is a move-up market where a variety of housing types, styles, ages and prices coexists. Nearly 73 percent of the city's 16,030 residences are valued from $90,000 to $175,000. The general value range is from $100,000 to $150,000. Minnetonka has seen a steady increase in the price of existing homes. The prices of newer residences have increased dramatically also, due to the supply and demand of developable land remaining. This is evidenced by the average new home construction value.
Average New Home Year Construction Value
1992 $210,400 1993 $236,600 1994 $232,100
The majority of the new custom design residences constructed in the late 1980's to the mid 1990's sell from $300,000 to $800,000_
According to the Multiple Listing Service, Minnetonka's median sale price of single family residences from January 1994 to June 1994, was $148,000. The mean sale price was $174,700. The mean sale price, in the same time period, for the entire Division III Multiple Listing Service Area, was $127,619. The percent of listing price received was 97.26% and the average sold time was 51.75 days. This would indicate Minnetonka has a strong real estate market and this would have a positive effect on the subject property value.
All areas of Minnetonka are serviced by private natural gas, electricity, telephone, and garbage service. Costs of these utilities are relatively uniform throughout the TCMA. The majority of the city is adequately serviced by city water, storm, and sanitary sewer. There are some exceptions; a few properties still are maintained by private well and septic system.
As described in the Tax and Assessment Analysis, market values in Minnetonka have been assessed at the proper level and are typical among other suburbs in the area.
Several commercial banks and savings and loan associations in the area are active in residential loans. In June 1994, interest rates range between 8.40% to 8.65% for a 30 year conventional mortgage. There are no restrictions in the area on making loans.
In conclusion, in spite of the fact that Minnetonka is a maturing community, it is still a highly desirable place to live and work. Property derives its desirability from the natural amenities of the city itself, its close proximity to both Lake Minnetonka and the
22

Minneapolis/St. Paul downtown area, and its economy. Because of the diversity of the economy it provides a stable employment base for residents and local businesses. Although there is a limited supply of available land for future development, the city has a comprehensive plan that will allow a strong corporate commitment, as well as, sensitivity in preserving neighborhood quality. Additionally, the continued availability of a variety of employment opportunities, outstanding school and park systems, and a strong retail base will have a positive effect on the market value of the subject property.
23

NEIGHBORHOOD ANALYSIS
A neighborhood is defined as "the environment of a subject property that has a direct and immediate effect on value." Environmental, social, economic, and governmental forces affect value. Many neighborhoods are identified by landmarks and defined boundaries; properties may have similar architectural styles or a particular blend of styles. Often neighborhood residents have common social characteristics such as age, income and lifestyle. The mix of amenities and services that appeal to the people who choose to live there can also characterize a neighborhood. All or any one of the amenities can have a direct effect on the market value.
The neighborhood boundaries can be natural, such as rivers, lakes, hills, ravines, or undeveloped land; political, such as city limits, school or zoning districts; or man-made boundaries such as streets, highways, freeways, or railroad tracks.
The subject neighborhood is located in the northwest quadrant of the city. It is bounded on the north by a man-made boundary, Minnetonka Boulevard (Hennepin County Road #5). Minnetonka Boulevard is an arterial road moving traffic east and west through the city.
The eastern border is Tonkawood Road, which is a north-south collector street moving traffic between Minnetonka Boulevard and Minnesota State Highway #7. This man-made boundary separates the subject neighborhood from a residential neighborhood to the east that is comparable in style and age and is in direct competition with the subject neighborhood.
The subject neighborhood is bound to the south by a physical boundary of wetlands. The physical boundary is in combination with an abandoned railroad track that was converted to a part of the 30 mile Minnetonka trail system loop. The combination of the two types of boundaries separates the subject neighborhood from a residential neighborhood to the south that is in direct competition with the subject neighborhood. However, the homes are newer, built between 1960 and 1970 and on lots that are larger, averaging around 21,000 square feet.
The western border is Minnesota State Highway No. 101. This man-made boundary is an arterial street moving the traffic north and south through the city. The four boundaries provide a distinct division from other neighborhoods in the immediate area.
The amenities and services described in the City and Area Analysis sections hold true for the subject neighborhood. Schools, churches, parks, shopping, entertainment, employment, and public transportation are all in close proximity to the subject property. The neighborhood is served with all utilities and city sewer and water. The costs of the services are comparable to other areas in the city and the Twin City Metropolitan Area (TCMA),
24
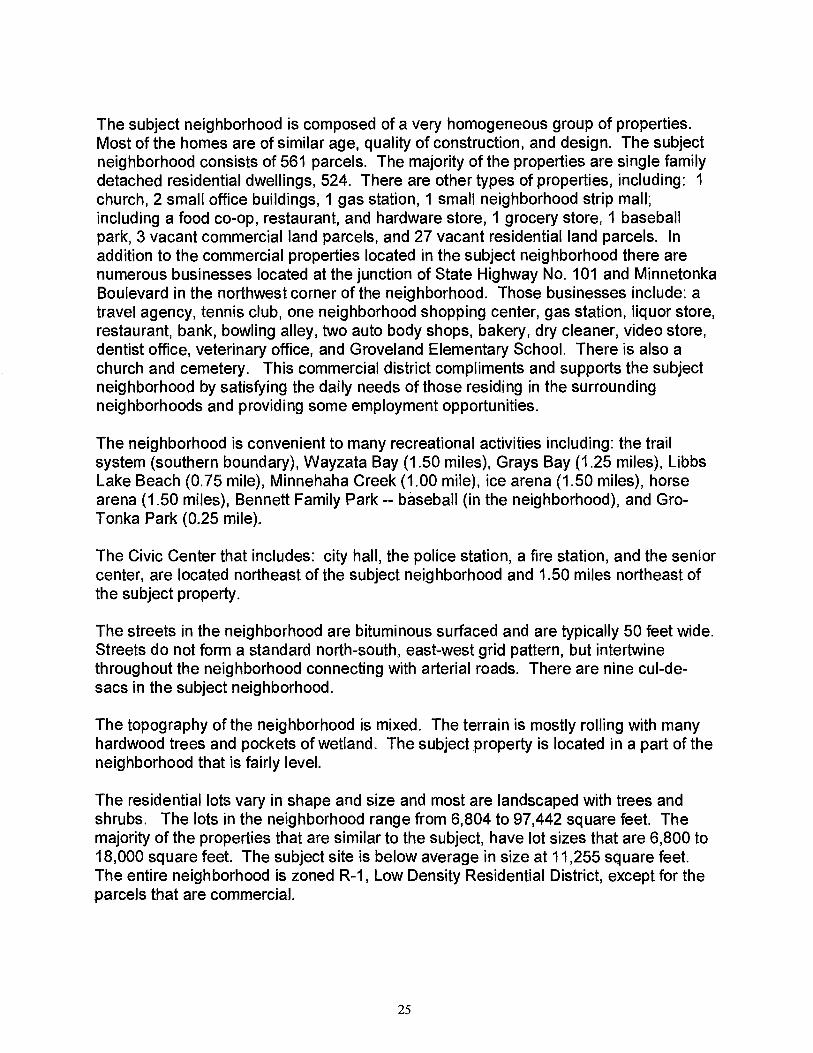
The subject neighborhood is composed of a very homogeneous group of properties. Most of the homes are of similar age, quality of construction, and design. The subject neighborhood consists of 561 parcels. The majority of the properties are single family detached residential dwellings, 524. There are other types of properties, including: 1 church, 2 small office buildings, 1 gas station, 1 small neighborhood strip mall; including a food co-op, restaurant, and hardware store, 1 grocery store, 1 baseball park, 3 vacant commercial land parcels, and 27 vacant residential land parcels. In addition to the commercial properties located in the subject neighborhood there are numerous businesses located at the junction of State Highway No. 101 and Minnetonka Boulevard in the northwest corner of the neighborhood. Those businesses include: a travel agency, tennis club, one neighborhood shopping center, gas station, liquor store, restaurant, bank, bowling alley, two auto body shops, bakery, dry cleaner, video store, dentist office, veterinary office, and Groveland Elementary School. There is also a church and cemetery. This commercial district compliments and supports the subject neighborhood by satisfying the daily needs of those residing in the surrounding neighborhoods and providing some employment opportunities.
The neighborhood is convenient to many recreational activities including: the trail system (southern boundary), Wayzata Bay (1.50 miles), Grays Bay (1.25 miles), Libbs Lake Beach (0.75 mile), Minnehaha Creek (1.00 mile), ice arena (1.50 miles), horse arena (1.50 miles), Bennett Family Park -- baseball (in the neighborhood), and Gro-Tonka Park (0.25 mile).
The Civic Center that includes: city hall, the police station, a fire station, and the senior center, are located northeast of the subject neighborhood and 1.50 miles northeast of the subject property.
The streets in the neighborhood are bituminous surfaced and are typically 50 feet wide. Streets do not form a standard north-south, east-west grid pattern, but intertwine throughout the neighborhood connecting with arterial roads. There are nine cul-de-sacs in the subject neighborhood.
The topography of the neighborhood is mixed. The terrain is mostly rolling with many hardwood trees and pockets of wetland. The subject property is located in a part of the neighborhood that is fairly level.
The residential lots vary in shape and size and most are landscaped with trees and shrubs. The lots in the neighborhood range from 6,804 to 97,442 square feet. The majority of the properties that are similar to the subject, have lot sizes that are 6,800 to 18,000 square feet. The subject site is below average in size at 11,255 square feet. The entire neighborhood is zoned R-1, Low Density Residential District, except for the parcels that are commercial.
25

The zoning ordinance and building codes that are enforced by the City Building Inspection Division encourages continued harmonious use of the properties in the neighborhood.
The neighborhood was primarily developed between 1947 to 1960. However, the neighborhood does have some outliers that add character and desirability to the neighborhood. The subject neighborhood includes; a log house that was originally built in the 1840's and used as a stage coach stop, an estate that was built in 1914 by the Dayton family, lake cabins moved to their current sites, farm houses, and a contemporary home featured in Life magazine for its architectural uniqueness in 1958. The majority of the homes in the subject neighborhood are rambler style dwellings, approximately 1,000 to 1,300 square feet in size. The estimated market values for the neighborhood range from $58,100 to $567,000 with a mean market value of $123,800 and median market value of $115,300.
The life stage of the neighborhood would currently be considered growth or revitalization. The neighborhood is nearly completely developed with the exceptions of a few lots that the current owners are holding for personal reasons. When revitalization occurs, it is usually the result of changing preferences and community patterns. Renovation occurs from the predominance of single people and small families in metropolitan areas, who want to live in proximity of urban activities.
As a consequence, older and poorer residents are displaced due to high rents and rising prices. Increased change and greater disparity between values in different parts of the neighborhood often follow a period of revitalization. Once the effort gathers momentum, residents who foresee a substantial rise in property values under take more remodeling. The subject neighborhood is in the beginning of the growth stage. However, this does not mean the neighborhood is not well maintained. The residents show "pride of ownership" with the maintenance of their properties, which is typical throughout Minnetonka.
The age range of the residents in the subject neighborhood is quite varied. The style and price range of the typical home represent attractive housing opportunities for first-time homeowners in their late twenties or early thirties. Approximately 25 percent of the population would fall into this category. Approximately 35 percent of the population are elderly or retired, and the balance 40 percent, would be middle age families with children still in school or recent "empty nesters". The resident's household incomes typically range from $35,000 to $80,000.
The subject neighborhood, as well as the entire city is considered typical for the TCMA for making residential loans by most lending institutions. Financing is available through VA, FHA, and conventional mortgages. Interest rates range from 8.40% to 8.65% percent for 30 year conventional mortgages.
26

In the time period of October, 1992 to June, 1994 there were 55 sales of single family homes. The price range was $65,000 to $209,000, with a median sale price of $122,500 and a mean sale price of $124,305.
There is a 98% owner-occupancy rate. Of the 524 residences in the subject neighborhood, only 10 residences are rented. Rental rates range from $550 to $950 per month. The vacancy rates for rental properties are virtually non-existent because available homes rent quickly. All verified rental agreements required thirty to sixty day notices. Rents will be discussed in greater detail in the income approach section in this appraisal.
In conclusion, this is a revitalizing, homogeneous neighborhood, with well-maintained homes available at affordable prices. Future changes seem to be just beginning. Combine this with easy access to Minnetonka Boulevard, commercial districts, and recreational activities; the subject neighborhood is a desirable place to live and therefore it is a competitive neighborhood in the real estate market.
27

SITE ANALYSIS
LOCATION:
The subject site is located in the northeast corner of the subject neighborhood at 3507 Elmwood Place, Minnetonka, Minnesota. The subject site is legally described as: The North Thirty feet, front & rear, of Lot 33, also Lot 34, Block 3, Staring's Tonka Wood-Croft, Hennepin, Minn.
The site is an interior lot located on the east side of Elmwood Place. There are 36 residential homes located on the street. Their estimated market values range from $75,400 to $139,800. Elmwood Place is a north-south public street that is .50 miles in length. Minnetonka Boulevard, located on the north end of Elmwood Place is the only entrance or exit for the street. Elmwood Place forks at a small park. On the west side of the park, the street is Hazelmoor Place; on the east side of the park, Elmwood Place. The two streets both run south to Hillside Terrace, which runs east-west along the wetlands. The site is located approximately .10 mile from the fork in the road. Exhibit I of the Addenda depicts the immediate area surrounding the subject property.
SIZE:
The rectangular site has 90.19 feet of frontage on Elmwood Place. The north measurement is 124.35 feet, the east or rear measurement is 90 feet, and the south measurement of the lot is 125.50 feet. The total lot area is 11,255 square feet. The lot is similar in size to other lots directly surrounding the subject lot, but on average the lot is smaller than the typical lots in the subject neighborhood.
TOPOGRAPHY AND SOIL CONDITIONS:
The lot is almost level, sloping approximately one and one half feet from the rear to the front, which ensures adequate drainage. There was no soil or subsoil tests conducted as part of this appraisal. In conversation with the City of Minnetonka Engineering staff, the top soil appears to be a sandy clay. Visual observation indicates there are no evident signs of settling or cracking in the foundation of the subject property improvements. Sub-soil conditions do not indicate that correction would be necessary prior to building.
Landscaping of the subject site appears typical for the neighborhood and includes trees and shrubs in both the front and rear yards. The yard is sodded and in good condition.
UTILITIES:
All public utilities, including sanitary sewer, storm sewer, water, natural gas, electricity, telephone, and cable television is available in the neighborhood and at the subject site.
28
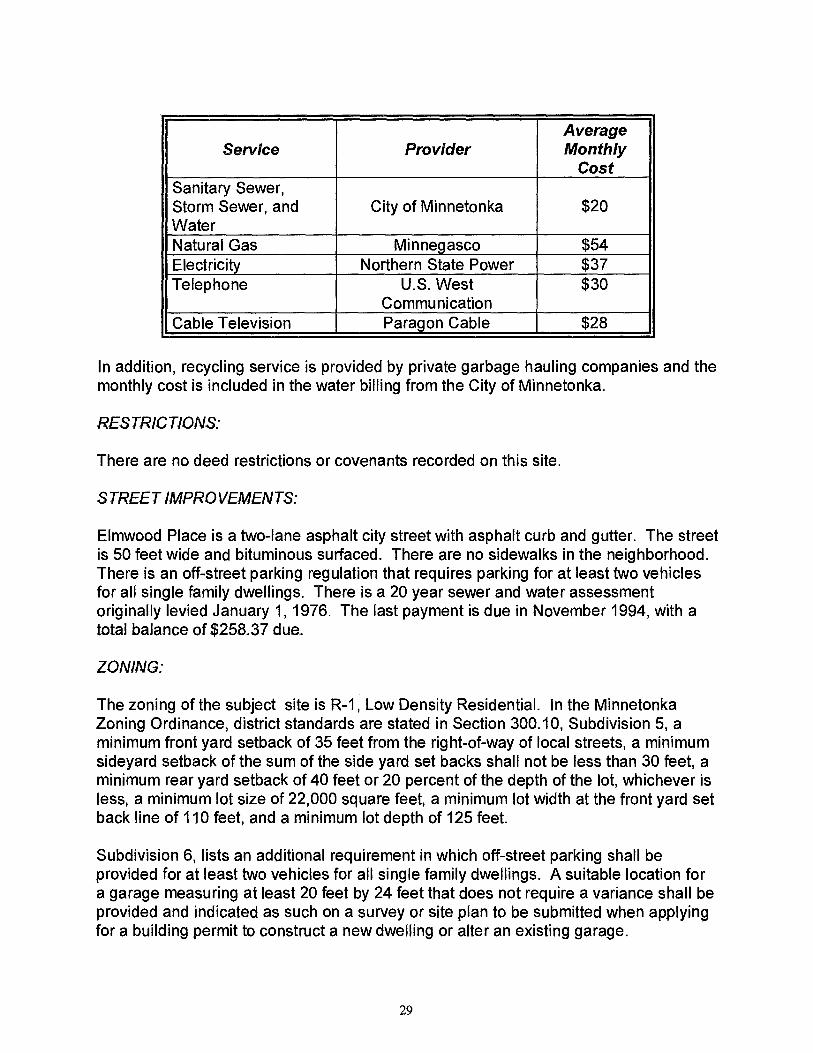
Service Provider Average Monthly
Cost Sanitary Sewer, Storm Sewer, and Water
City of Minnetonka $20
Natural Gas Minnegasco $54 Electricity Northern State Power $37 Telephone U.S. West
Communication $30
_ Cable Television Paragon Cable $28
In addition, recycling service is provided by private garbage hauling companies and the monthly cost is included in the water billing from the City of Minnetonka.
RESTRICTIONS:
There are no deed restrictions or covenants recorded on this site.
STREET IMPROVEMENTS:
Elmwood Place is a two-lane asphalt city street with asphalt curb and gutter. The street is 50 feet wide and bituminous surfaced. There are no sidewalks in the neighborhood. There is an off-street parking regulation that requires parking for at least two vehicles for all single family dwellings. There is a 20 year sewer and water assessment originally levied January 1, 1976. The last payment is due in November 1994, with a total balance of $258.37 due.
ZONING:
The zoning of the subject site is R-1, Low Density Residential. In the Minnetonka Zoning Ordinance, district standards are stated in Section 300.10, Subdivision 5, a minimum front yard setback of 35 feet from the right-of-way of local streets, a minimum sideyard setback of the sum of the side yard set backs shall not be less than 30 feet, a minimum rear yard setback of 40 feet or 20 percent of the depth of the lot, whichever is less, a minimum lot size of 22,000 square feet, a minimum lot width at the front yard set back line of 110 feet, and a minimum lot depth of 125 feet.
Subdivision 6, lists an additional requirement in which off-street parking shall be provided for at least two vehicles for all single family dwellings. A suitable location for a garage measuring at least 20 feet by 24 feet that does not require a variance shall be provided and indicated as such on a survey or site plan to be submitted when applying for a building permit to construct a new dwelling or alter an existing garage.
29

The ordinance does allow variances from the standard for parcels that were platted prior to February 16,1966, as found in Section 300.07, Subdivision 1,b.. Staring's Tonka Wood-Croft was recorded as a plat on November 17, 1927, which is prior to February 16, 1966. The subject site would need to meet the following minimum standards:
Zoning Standard Subject Site Front Yard Setback-- from the right-of-way
No < 20 Feet 35 Feet
Side Yard Setback--at 10% of lot width on each side of 15 Feet North Side building setback line the structure, No < 7 Feet 20 Feet South Side
Rear Yard Setback 20% of lot depth, No < 7 Feet 64 Feet
Lot Size 15,000 Sq. Ft 11,255 Sq. Ft.
Lot Width at building setback line 90 Feet 90.19 Feet
Lot Depth 110 Feet 124.35 Feet
According to Kim Lindquist, Senior Planner for the City of Minnetonka Planning Department, the subject site is a legal non-conforming use. The uses of the site were lawful when established but no longer meet all current ordinance requirements. Section 300.10 and Section 300.07 of the Zoning Ordinance are located in the Addenda, Exhibit K.
FUNCTIONAL ADEQUACY:
The lot is similar in size to other lots directly surrounding the subject lot, but on average the lot is smaller than the typical lots in the neighborhood. The subject site is functional for the improvements contained upon it. The improvements conform to the size of the typical residence in the neighborhood.
CONCLUSION:
The subject site is an interior lot located on a quiet residential street. All utilities are available and support and improve the subject site. The property is a legal non-conforming site and is functional for its intended use as a single family residential property. No locational influences exist that would adversely affect the site.
30
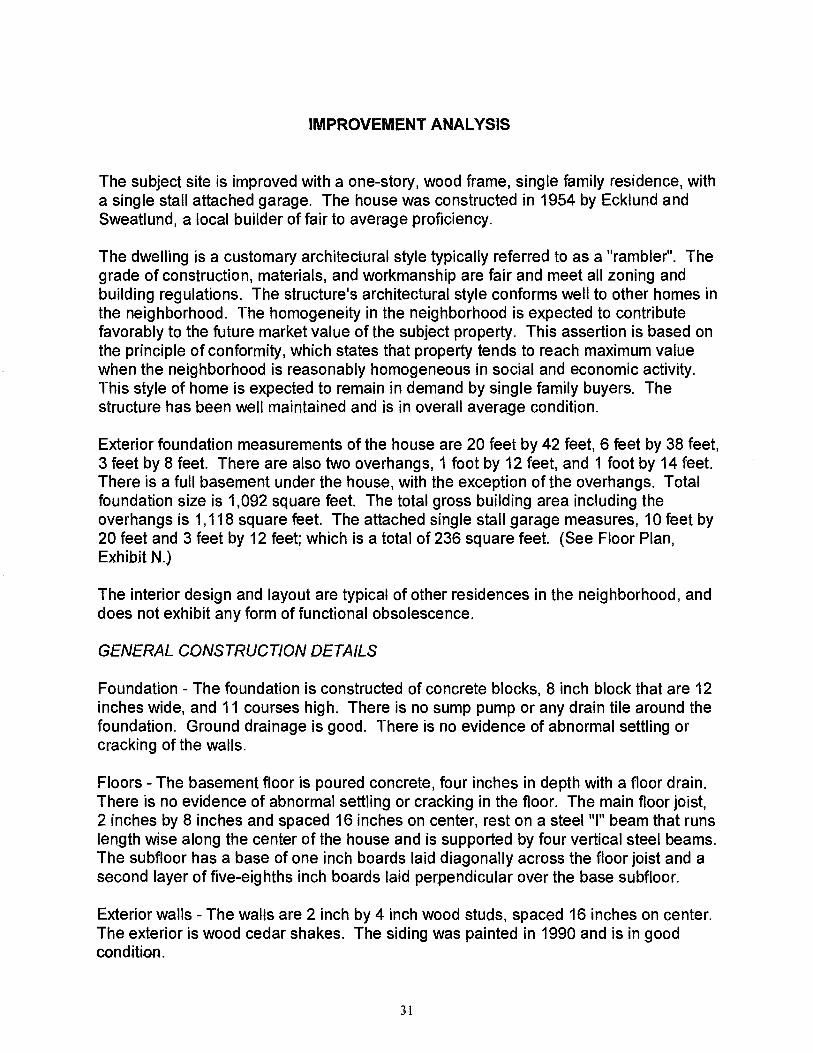
IMPROVEMENT ANALYSIS
The subject site is improved with a one-story, wood frame, single family residence, with a single stall attached garage. The house was constructed in 1954 by Ecklund and Sweatlund, a local builder of fair to average proficiency.
The dwelling is a customary architectural style typically referred to as a "rambler". The grade of construction, materials, and workmanship are fair and meet all zoning and building regulations. The structure's architectural style conforms well to other homes in the neighborhood. The homogeneity in the neighborhood is expected to contribute favorably to the future market value of the subject property. This assertion is based on the principle of conformity, which states that property tends to reach maximum value when the neighborhood is reasonably homogeneous in social and economic activity. This style of home is expected to remain in demand by single family buyers. The structure has been well maintained and is in overall average condition.
Exterior foundation measurements of the house are 20 feet by 42 feet, 6 feet by 38 feet, 3 feet by 8 feet. There are also two overhangs, 1 foot by 12 feet, and 1 foot by 14 feet. There is a full basement under the house, with the exception of the overhangs. Total foundation size is 1,092 square feet. The total gross building area including the overhangs is 1,118 square feet. The attached single stall garage measures, 10 feet by 20 feet and 3 feet by 12 feet; which is a total of 236 square feet. (See Floor Plan, Exhibit N.)
The interior design and layout are typical of other residences in the neighborhood, and does not exhibit any form of functional obsolescence.
GENERAL CONSTRUCTION DETAILS
Foundation - The foundation is constructed of concrete blocks, 8 inch block that are 12 inches wide, and 11 courses high. There is no sump pump or any drain tile around the foundation. Ground drainage is good. There is no evidence of abnormal settling or cracking of the walls.
Floors - The basement floor is poured concrete, four inches in depth with a floor drain. There is no evidence of abnormal settling or cracking in the floor. The main floor joist, 2 inches by 8 inches and spaced 16 inches on center, rest on a steel "I" beam that runs length wise along the center of the house and is supported by four vertical steel beams. The subfloor has a base of one inch boards laid diagonally across the floor joist and a second layer of five-eighths inch boards laid perpendicular over the base subfloor.
Exterior walls - The walls are 2 inch by 4 inch wood studs, spaced 16 inches on center. The exterior is wood cedar shakes. The siding was painted in 1990 and is in good condition.
31

Roof - The gable style roof is constructed with 2 inch by 6 inch ceiling joists and 2 inch by 4 inch rafters; both spaced 16 inches on center. The joists and braces are adequately braced and the roof shows no sign of settling. The roof boards are 3/4 inch thick and covered by 15 pound roofing paper and 235 pound asphalt shingles. The roof was re-shingled in 1986 and there was no leakage noted. The condition of the roof appeared to be in average condition.
Insulation - The attic has 4 inches of fiberglass and blown insulation. The energy rating for the ceiling would be approximately R-12, which is considered to be normal by today's energy standards. The wall insulation is balsam wool, which was common for homes constructed during this era.
Windows and Doors - All windows are the original double-hung, single glazed combination storm and screen. There are three entrance doors to the structure; one in front that opens to a small foyer, one from the garage to the small foyer, and one from the garage to the backyard. The doors for the front entrance and the rear entrance also have wood storm doors with interchangeable screens and glass windows. Interior doors are hollow core oak veneer, stained blonde. All interior trim is fir, which also is blonde. All doors and windows are operational and in average condition.
Interior walls - The interior walls are framed with 2 inch by 4 inch studs and 16 inches on center. The framing is covered with one-half inch plaster and a smooth thin coat plaster. The ceilings are also covered by one-half inch plaster. The ceiling height on the main level is eight feet throughout the house.
MECHANICAL SYSTEM
Electrical - The electrical system is equipped with 100 amperes service and circuit breakers. In 1989, air-conditioning was added with an additional circuit. The total number of circuits is 15. The electrical service; including outlets and fixtures appear to be adequate throughout the house, except in the kitchen and are in good working condition.
Heating and Cooling - The heating and air-conditioning system is located in the basement; the condenser coil is located adjacent to the foundation on the south side of the dwelling. The furnace is a gas-fired, force air unit, manufactured by Lennox. The air conditioning system is also a Lennox unit of two ton capacity. The furnace was replaced in 1989, when the air-conditioning system was added. The duct work is galvanized steel providing warm air ducts and cold air returns to the main level and basement. In addition to the gas furnace, additional gas lines have been installed for the gas clothes dryer and the gas range. The system is effectively and efficiently operating as of the date of appraisal.
Plumbing - Water supply lines for hot and cold water is copper tubing. The waste and vent lines are cast iron. There is a double compartment cast concrete laundry tub
32

located in the basement utility area and there is a basement floor drain. Hot water is provided by a Bryant 157, 40 gallon gas-fired water heater, which was replaced in 1983. The kitchen has a double compartment, cast iron sink covered with white enamel. The main bath fixtures include a cast iron white enameled bath tub with a shower over the tub, a white porcelain water closet, and a cast iron, white enameled pedestal sink. All the fixtures except the hot water heater and the bathroom sink, is original equipment and in good condition. There is one outside water faucet located in the rear of the house. The subject property is connected to city water and sewer with good water pressure available.
FLOOR PLAN
Basement level - The basement level contains a family room. Access to the basement is by an interior enclosed staircase, located between the front entry and the informal dining area in the kitchen. There is no other legal outside entrances or exits available in the basement through a door or window.
The family room (11.5' x 26'), (3' x 16'), and (7' x 8') has a brick, wood burning, fireplace with a brick hearth. The original floor tiles remain. They were installed over the poured concrete floor. The walls are plaster over concrete blocks. The ceiling is tile.
The balance of the basement, is unfinished with concrete floors, bare concrete block walls, and exposed floor joists. This area is used for mechanical, laundry, and storage.
Main level - The main floor contains an entry, living room, kitchen with eating area, full bath, and three bedrooms.
The front door opens into a small foyer (7' x 8'), with a coat closet and planter. The foyer offers access to the garage, stairs to the basement level, and the living room. A planter separates the foyer from the living room. The floor covering is ceramic tile.
The living room (11.5' x 26') and (1' x 14') has red oak hardwood floors that are in average condition. The walls are painted. There is a floor to ceiling brick, wood burning fireplace, located near the southwest corner.
The kitchen includes an informal eating area. The kitchen is (11.5' x 14') and the eating area is (6' x 9'). The floor covering is vinyl linoleum; the counter tops and backsplash are Formica. All appear to be in good condition. The cabinets and trim are fir, and are in good condition. There are approximately 17 lineal feet of counter top and base cabinets and 10 lineal feet of upper cupboards. There are no built-in appliances. The kitchen has only three outlets. Four additional outlets would help to make the kitchen more functional. The informal eating area also serves as a traffic movement center for moving to and from the kitchen to the garage, the foyer, and the stairway to the basement
33
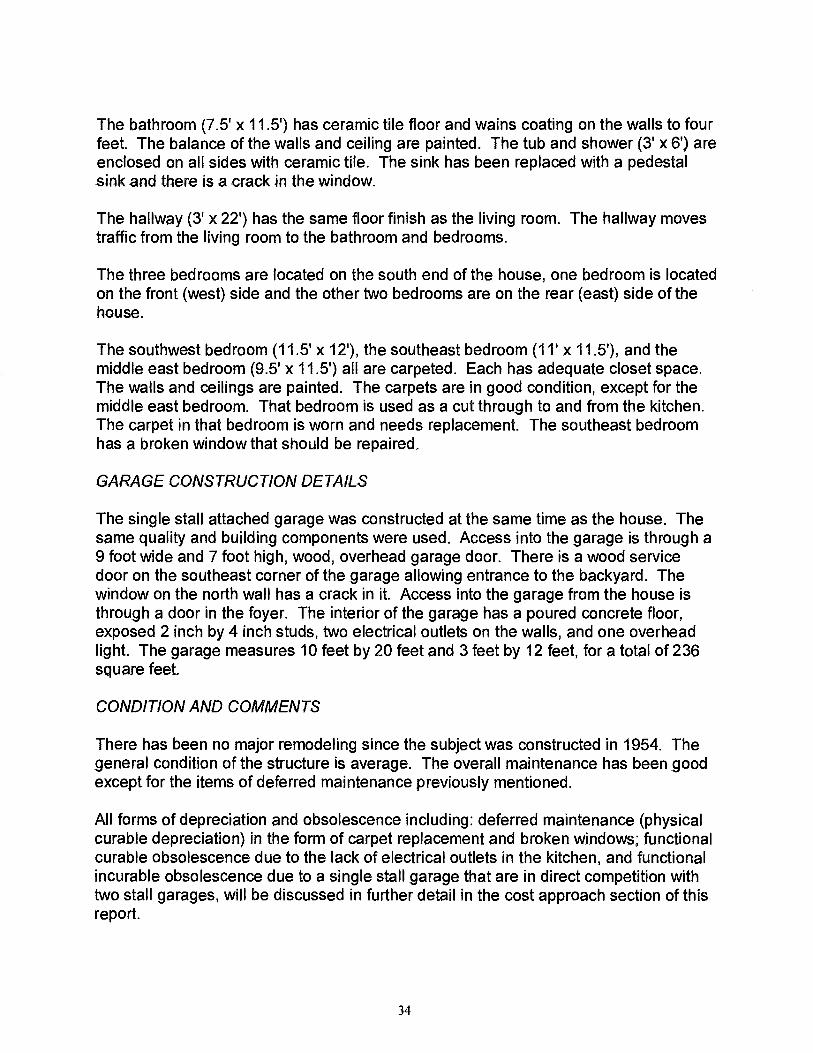
The bathroom (7.5' x 11.5') has ceramic tile floor and wains coating on the walls to four feet. The balance of the walls and ceiling are painted. The tub and shower (3' x 6') are enclosed on all sides with ceramic tile. The sink has been replaced with a pedestal sink and there is a crack in the window.
The hallway (3' x 22') has the same floor finish as the living room. The hallway moves traffic from the living room to the bathroom and bedrooms.
The three bedrooms are located on the south end of the house, one bedroom is located on the front (west) side and the other two bedrooms are on the rear (east) side of the house.
The southwest bedroom (11.5' x 12'), the southeast bedroom (11' x 11.5'), and the middle east bedroom (9.5' x 11.5') all are carpeted. Each has adequate closet space. The walls and ceilings are painted. The carpets are in good condition, except for the middle east bedroom. That bedroom is used as a cut through to and from the kitchen. The carpet in that bedroom is worn and needs replacement. The southeast bedroom has a broken window that should be repaired.
GARAGE CONSTRUCTION DETAILS
The single stall attached garage was constructed at the same time as the house. The same quality and building components were used. Access into the garage is through a 9 foot wide and 7 foot high, wood, overhead garage door. There is a wood service door on the southeast corner of the garage allowing entrance to the backyard. The window on the north wall has a crack in it. Access into the garage from the house is through a door in the foyer. The interior of the garage has a poured concrete floor, exposed 2 inch by 4 inch studs, two electrical outlets on the walls, and one overhead light. The garage measures 10 feet by 20 feet and 3 feet by 12 feet, for a total of 236 square feet.
CONDITION AND COMMENTS
There has been no major remodeling since the subject was constructed in 1954. The general condition of the structure is average. The overall maintenance has been good except for the items of deferred maintenance previously mentioned.
All forms of depreciation and obsolescence including: deferred maintenance (physical curable depreciation) in the form of carpet replacement and broken windows; functional curable obsolescence due to the lack of electrical outlets in the kitchen, and functional incurable obsolescence due to a single stall garage that are in direct competition with two stall garages, will be discussed in further detail in the cost approach section of this report.
34

A floor plan of the subject improvements, both main level and basement, along with exterior photographs of the subject property is included in the Addenda as Exhibit N and A, respectively.
35
ACTUAL AGE, EFFECTIVE AGE, TOTAL ECONOMIC LIFE AND REMAINING ECONOMIC LIFE ANALYSIS
The actual or chronological age of the subject is 40 years. The effective age and economic life are more difficult to define. Since it is almost impossible to forecast the estimated physical life of a house, further analysis is necessary.
EFFECTIVE AGE
Effective age may or may not represent the actual or chronological age, depending on the maintenance, remodeling, renovation, competition, and market conditions. If a building is better maintained than others in the market area, its effective age will be less than its actual age. If a building is poorly maintained, its effective age may be greater. If a building has received typical maintenance, its effective age and actual age may be the same. Effective age is related to remaining economic life. The total economic life of similar structures, minus the effective age of the subject building, equals the remaining economic life of the subject property.
Houses in the subject neighborhood were generally constructed from 1947 to 1960. Their actual or chronological ages therefore range from 34 to 47 years. These homes generally are comparable to the subject and have been maintained in average or better condition regardless of actual age. The subject property, as well as, other homes of the same chronological age, is observed to be in the same overall condition.
The effective age is used to calculate the physical deterioration of long lived items which is applied to the basic structure of the building. Generally the repairs or replacements of components that have reached their economic life are due to superior maintenance, or "pride of ownership," which the homeowners have displayed over the past years. For the most part the repairs or replacements that have occurred too comparable homes in the neighborhood have been short-lived items. This is true for the subject property, also. Therefore, the effective age of the subject and the comparables in the neighborhood is estimated to be average or equivalent to their actual ages.
TOTAL ECONOMIC LIFE
The total economic life is the period over which improvements to real estate contribute to property value. The buildings economic life begins when it is built and ends when the building no longer contributes any value to the property above land value.
A study of several older homes constructed in the late 1800's and early 1900's in the subject neighborhood and throughout the City of Minnetonka, indicates homes of comparable utility and conditions have maintained their utility for in excess of 90 years, when there has been average or better maintenance and at least some updating.
36
The subject property has had limited updating. If the current level of maintenance continues, with some updating occurring at a later time, one would expect the improvements to contribute to a total economic life of approximately 95 years. Support for this estimate of years can be found on the next page.
REMAINING ECONOMIC LIFE
Remaining economic life is the estimated period over which existing improvements continue to contribute to the property value. It begins on the date of the appraisal and extends until the end of the buildings economic life.
As previously stated, the total economic life of similar structures, minus the effective age of the subject building, equals the remaining economic life of the subject property.
Total Economic Life
95 Years - Effective Age
40 Years Remaining Economic Life
55 Years
37

SUPPORT FOR TOTAL ECONOMIC LIFE AND EFFECTIVE AGE ANALYSIS
To use this method, there should be little or no economic or functional obsolescence in the comparable properties and the proportions between short-lived and long-lived components should be roughly equal.
The estimate of economic life and effective age is critical to the cost approach because they are the estimates of physical depreciation. Support of the analysis comes from the market and can be derived from comparable properties through a series of calculations. The analysis for such support is as follows:
1. Begin with the sale price of comparable properties.
2. Estimate the land value of each comparable property by a proper procedure. Subtract the land value from the sale price. To equal the estimated present value of the improvements.
3. Calculate the Reproduction Cost New (RCN) of the comparable improvement.
4. Subtracting the present value of the improvements from the RCN will equal the amount of accrued depreciation indicated by the market.
5. Dividing the amount of accrued depreciation by the RCN will equal the percentage of total depreciation.
6. Dividing the percentage of total depreciation by the effective age of the property will equal the annual rate of depreciation.
7. Dividing 100% by the annual percentage rate of depreciation will equal the indicated economic life of the property under the straight-line, age-to-life depreciation premise.
The mathematical calculations used to support the estimates of total economic life and effective age can be found on the next page of this report.
38-

SUPPORT FOR ESTIMATES OF ECONOMIC LIFE AND EFFECTIVE AGE
Sales Comparable Comp #1 Comp #2 Comp #3 Comp #4 Comp #5 Comp #6 Newer Property
Address 3429 Fairlawn Drive
3511 Elmwood Place
3648 Hazelmoor Place
3516 The Mall 16423 Devon Drive
16204 Tonkaway Road
17416 Manor Road
Time Adjusted Cash Sale Price
$121,500 $108,881 $116,419 $113,881 $121,409 $114,197 $116,653
Site Value $ 33,900 $ 33,900 $ 33,900 $ 33,900 $ 33,900 $ 33,900 $ 33,900
Estimated Value of Improvements
$ 87,600 $ 74,981 $ 82,519 $ 79,481 $ 87,509 $ 80,297 $ 82,753
RCN $158,568 $135,877 $141,724 $148,307 $138,587 $142,347 $132,458
Estimated Value of Improvements
$ 87,600 $ 74,981 $ 82,519 $ 79,481 $ 87,509 $ 80,297 $ 82,753
Accrued Depreciation
$ 70,968 $ 60,896 $ 59,205 $ 68,326 $ 51,078 $ 62,050 $ 49,705
Depreciation Percentage
44.76% 44.82% 41.77% 46.07% 36.86% 43.59% 37.53%
Effective Age in Years
46 40 40 45 38 42 32
Annual Depreciation Rate (Straight-line)
0.973% 1.121% 1.044% 1.024% 0.970% 1.038% 1.173%
Estimated Economic Life
102.8 Years 89.2 Years 95.8 Years 97.7 Years 103.1 Years 96.3 Years 85.3 years
Annual Depreciation Rate (Straight-line)
Range Mean Median 0.970%-1.121% 1.028% 1.031%
Estimated Economic Life
89.2-103.1 97.5 97.0
.
39
Total Economic Life
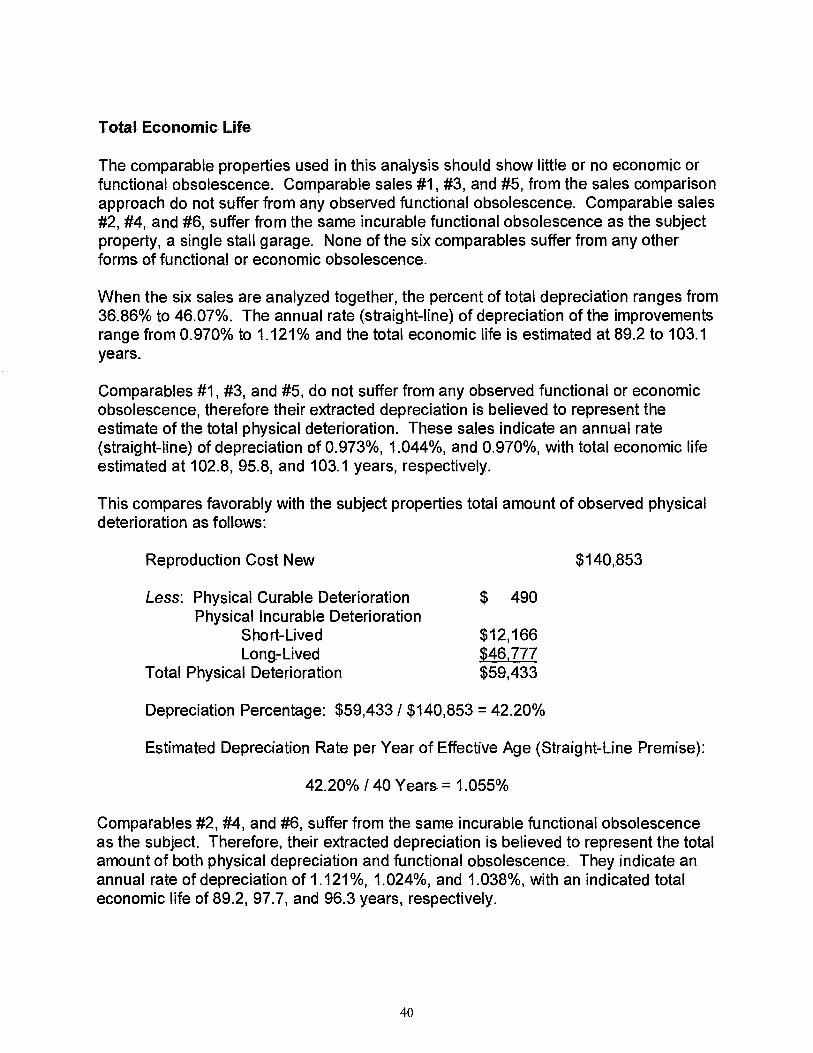
The comparable properties used in this analysis should show little or no economic or functional obsolescence. Comparable sales #1, #3, and #5, from the sales comparison approach do not suffer from any observed functional obsolescence. Comparable sales #2, #4, and #6, suffer from the same incurable functional obsolescence as the subject property, a single stall garage. None of the six comparables suffer from any other forms of functional or economic obsolescence.
When the six sales are analyzed together, the percent of total depreciation ranges from 36.86% to 46.07%. The annual rate (straight-line) of depreciation of the improvements range from 0.970% to 1.121% and the total economic life is estimated at 89.2 to 103.1 years.
Comparables #1, #3, and #5, do not suffer from any observed functional or economic obsolescence, therefore their extracted depreciation is believed to represent the estimate of the total physical deterioration. These sales indicate an annual rate (straight-line) of depreciation of 0.973%, 1.044%, and 0.970%, with total economic life estimated at 102.8, 95.8, and 103.1 years, respectively.
This compares favorably with the subject properties total amount of observed physical deterioration as follows:
Reproduction Cost New $140,853
Less: Physical Curable Deterioration $ 490 Physical Incurable Deterioration
Short-Lived $12,166 Long-Lived $46,777
Total Physical Deterioration $59,433
Depreciation Percentage: $59,433 / $140,853 = 42.20%
Estimated Depreciation Rate per Year of Effective Age (Straight-Line Premise):
42.20% /40 Years = 1.055%
Comparables #2, #4, and #6, suffer from the same incurable functional obsolescence as the subject. Therefore, their extracted depreciation is believed to represent the total amount of both physical depreciation and functional obsolescence. They indicate an annual rate of depreciation of 1.121%, 1.024%, and 1.038%, with an indicated total economic life of 89.2, 97.7, and 96.3 years, respectively.
40

These annual rates of depreciation and total economic life also compare favorably to the subject properties total amount of physical depreciation and functional obsolescence.
Reproduction Cost New $140,853
Less: Physical Curable Deterioration $ 490 Physical Incurable Deterioration
Short-Lived $12,166 Long-Lived $46,777
Functional Curable Obsolescence $ 120 Functional Incurable Obsolescence $ 7,573
Total Accrued Depreciation $67,126
Depreciation Percentage: $67,126 / $140,853 = 47.66%
Estimated Depreciation Rate per Year of Effective Age (Straight-Line Premise):
47.66% /40 Years = 1 192%
Most weight was placed on the comparable sales #1, #3, and #5, with no apparent functional or economic obsolescence. Comparable sale #3 is the most comparable to the subject in terms of size and age and had an estimated economic life of 95.8 years or 1.044% annual (straight-line) depreciation rate. An estimated economic life of 95.0 years was chosen. This appears to compare favorably with estimated economic lives of comparable sales #2, #4, and #6, also; which are less reliable estimations of economic life due to their functional obsolescence.
Effective Age
The reliability of the estimated effective age of the subject property can be tested through the same extraction analysis. The seventh property in the analysis is of similar construction quality, floor plan, and condition to the subject property. It does not suffer from the incurable functional obsolescence of the subject property and it has no economic obsolescence.
The indicated effective age of the subject property is measured by the accrued depreciation for the subject property divided by the estimated depreciation rate per year for a similar, but newer property. The market-extracted figures indicate a total accrued depreciation of 37.53% or 1.173% annually on a straight-line premise.
Total Accrued Depreciation / Estimated Depreciation Rate for the Subject Property per Year for a Newer Property
47.66%! 1.173% = 40.6 Years
41

The indicated effective age for the subject property is 40.6 years. This analysis supports the previously estimated effective age of the subject property of 40.0 years.
4-2

HIGHEST AND BEST USE ANALYSIS
The concept of highest and best use is defined as "the reasonably probable and legal use of vacant land of an improved property, which is physically possible, appropriately supported, financially feasible, and that results in the highest value. The four criteria the highest and best use must meet are physical possibility, legal permissibility, financial feasibility and maximum productivity."5 Embodied in this definition are the economic principles of supply and demand, substitution, balance, and conformity. The principle of supply and demand states that " the price of real property varies directly, but not necessarily proportionately with demand, and inversely, but not necessarily proportionally with supply."6 Substitution is a principle that states "when similar or commensurate commodities, goods, or services are available, the one with the lowest price will attract the greatest demand and widest distribution."' Balance states that "real property value is created and sustained when contrasting, opposing, or interacting elements are in a state of equilibrium."8 The principle of conformity is critical to the concept of highest and best use. It states that "real property value is created and sustained when a property's characteristics conform to the demands of its market."5
In summary, highest and best use is the real property site use that is available and in market demand; that is reasonably priced in relation to competitive properties, and that is in balance and conformity with economic perceptions of the site and surrounding land uses with the subject neighborhood and marketplace. The extent to which highest and best use exists is determined by examining both the subject site as if vacant and the property as improved against the four criteria of highest and best use; physical possibility, legal permissibility, financial feasibility, and maximum productivity.
Physical Possibility - Physical possibility examines the physical inventory and capability of the subject site. It considers the size, shape, area, and terrain of a parcel of land and how those characteristics affect the degree to which it can be utilized. The availability of public utilities, topographic conditions, subsoil conditions, and general cost of creating a developable site can affect subject sites. Improved sites also must be examined for physical capability. The existing use is examined for the economic feasibility of continuing that use in terms of size, design, and condition.
Legal Permissibility - Legal permissibility is measured by determining the effect of existing restrictions, zoning, building code, special district or environmental constraints. It also considers the duration of existing restrictions and the likelihood of future changes. Restrictions are a reflection of the existing sentiments of surrounding neighborhood residents. An adverse relationship between the subject site and surrounding properties or permanent restrictions can negate otherwise physically possible land uses.
Financial Feasibility - Land uses that are physically possible and legally permissible must be economically sound to pursue. The third test of highest and best use
43

examines and determines all potential uses that can produce a positive return to the site. A positive return is one that meets the costs of property ownership: operating expenses, financial obligation and capital amortization. For residential uses the expenses considered are generally accepted to be the cost of property maintenance, property tax, and mortgage expenses.
Maximum Productivity - The final test is to determine which of the potential uses that are physically possible, legally permissible, and financially sound will produce the greatest return. The most productive land uses are usually those, which are long-term and capable of existing for a normal economic useful life.
The use, which meets all four of the above listed criteria, is the highest and best use. Both the vacant site and the site as improved are examined for the highest and best use. The vacant site is examined first to estimate a value for the site and to determine suitable land sales that are comparable. The improved site is examined second for the highest and best use to determine if the existing use is the most productive, or if the property could produce a higher return if it were converted to an alternative use.
The remainder of this section of the appraisal will examine the highest and best use of the subject site, as vacant, and as improved.
Highest and Best Use as Though Vacant
The site is always valued as if vacant and available to be put to it's highest and best use. The highest and best use of the site as though vacant must be considered in relation to its existing use and all potential uses.
Physical possibility
The subject site is an inside, rectangular shaped lot with 90.19 feet of road frontage on a north and south public street. The north measurement of the lot is 124.35 feet, the east measurement is 90.00 feet, and the south measurement of the lot is 125.50 feet. The total lot area is 11,255 square feet.
The topography of the site is fairly level, sloping approximately one and one half feet from the rear to the front. This ensures adequate drainage. In conversation with the City of Minnetonka Engineering staff, the sandy clay subsoils are a good base for improvements, which makes it consistent with other neighboring lots. The subject site, like other neighboring lots would support footings, foundation walls, and utility connections. The subject site is capable of physically supporting development.
Legal permissibility
The legally permissible uses are limited by the existing Minnetonka zoning ordinance in effect on June 1, 1994, which were made from zoning upgrades that were adopted on
44
February 12, 1966. The effects of the upgrade increased the minimum lot size from 15,000 square feet to 22,000 square feet. The lot width was increased at the building setback line from 90 feet to 110 feet and the lot depth was increased from 110 feet to 125 feet. However, under the variance provision of the ordinance, section 300.07, subdivision 1.b, "no variance shall be needed to declare buildable any lot which was a lot of record zoned for single family residential use on February 12,1966 and which meets all of the following minimum standards":
a. 15,000 square feet; b. 90 feet in width at the building set back line; and c. 110 feet in depth
There is an additional requirement in which off-street parking shall be provided for at least two vehicles for all single family dwellings. A suitable location for a garage, measuring at least 20 feet by 24 feet, that does not require a variance shall be provided and indicated as such on a survey or site plan to be submitted when applying for a building permit to construct a new dwelling or alter an existing garage.
The site meets the standard of 90 feet in width at the building set back line and 110 feet in depth. It also meets the standard of being capable of providing off-street parking for at least two vehicles. The site would be approved as buildable if the structure would not exceed the length of what it currently is. There would be no additional variance required to provide a two stall garage. When building a new dwelling, a two stall garage could be located at the front or the rear of the house and no variances would be required to meet that criteria.
The existing zoning ordinances, as found in Exhibit K, will allow one or more of the following permitted uses if the site were vacant.
a) single family detached dwelling units, but not more than one dwelling unit per lot;
b) manufactured homes built in conformance with Minn. Stat. Section 327.31, et seq.;
c) public park and recreational areas owned and operated by a governmental unit, including recreational facilities and structures consistent with the area, except as provided for in subdivision 4;
d) licensed residential care facilities or community based residential care facilities for six or fewer persons, provided they are not located within % mite of another similar facility and except as provided for in subdivision 4;
45
e) licensed day care facilities for 12 or fewer persons, provided there is not more than one outside employee and except as provided for in subdivision 4;
f) public or private schools having a course of instruction approved by the Minnesota board of education for students enrolled in grades K-12, or any portion thereof, provided they do not include boarding or residential facilities and except as provided for in subdivision 4; or
agriculture, farming and truck gardening.
The subject site, although not complying with the zoning ordinance in effect as of the date of the appraisal, does comply with Section 300.07, Subdivision 1.b., which allows the site to become a legal non-conforming single family residential parcel.
The size of the site, topography, and close proximity of other parks, would limit the use to either a single family detached dwelling or a vacant residential lot. Possible applications of the single family dwelling use are a manufactured home, licensed residential care facility and licensed day care facility.
Financial feasibility
The use must be complimentary with the area rather than competitive and the use must be a probable use and not a highly unlikely or speculative use.
Since there are no manufactured homes in the city of Minnetonka, that is not a probable use. The licensed residential care facility and licensed day care facility, although physically possible and legally permissible would be more competitive than complementary with the neighborhood and they would also be more of a speculative or unlikely use than the more probable use as a single family residential dwelling.
The legally permissible and physically possible uses of the subject site would both produce financially productive returns. A vacant site could potentially be sold to an adjacent property owner as a buffer lot or for expansion of the existing homes on the adjoining properties. This use would provide a return to the land equivalent to the value of the vacant site.
Although this is a financially feasible use, it would not be a probable use, as the majority of the sites in the neighborhood are smaller than the combined size of two lots and alterations to existing adjoining properties could damage their character and/or desirability.
A developed site would also produce a positive return to the land. The surrounding residences are generally 34 to 47 years old, two to three bedroom homes between 1,000 and 1,300 square feet. The predominant style of residence is ramblers. It is
46
likely that if the subject site were vacant it would be developed with a rambler of approximately 1,100 square feet.
Recent sales of vacant lots in the subject neighborhood and other comparable neighborhoods have been for residential purposes and the demand for residential lots has been very good. This is in part due to the lack of supply of residential lots.
Maximum profitability
The final test is to determine which of the potential uses that are physically possible, legally permissible, and financially sound will produce the greatest return. The most productive land uses are usually those, which are long-term and capable of existing for a normal economic useful life. The use that meets all four criteria is the highest and best use.
The principles of supply and demand in conjunction with the principles of substitution, balance, and conformity will influence the highest and best use of a property. Minnetonka is a community that is almost fully developed. There is a scarcity of vacant residential lots and the demand for this commodity is very high. Due to this demand, it appears that a new single family home could be constructed that would sell for more than the cost of the site plus the improvements. This makes a single family residence use economically feasible. The residence would be similar in size, style, and quality to the current improvement, but all elements of accrued physical depreciation and functional obsolescence would be eliminated.
In conclusion, after considering all four stages of highest and best use analysis, it is the opinion of the appraiser that the highest and best use of the subject site, as if vacant and available for development on June 1, 1994, would be the construction of a single family residence containing between 1 000 and 1,200 square feet of living area.
Highest and Best Use as Though Improved
The analysis of the highest and best use of the subject site as improved is to determine if the existing use is the most productive or would the property produce higher returns if it were used for alternative purposes.
Physical possibility
The subject site is improved with a single family residence. This improvement consists of a one-story, single family dwelling constructed in 1954 with 1,118 square feet of living area on the main level. In addition, there is an attached single stall garage, two fireplaces, and a partially finished basement. The improvements have been well maintained and are in average condition. There is no evidence of abnormal settling or cracking of the walls or floors. The use of the subject property is limited by its size.
47
Therefore, its current use as single family residential meets the test of being a physically possible use.
Legal permissibility
As stated in the legal permissibility as though vacant analysis, the existing improvements on the subject site meet all legal and zoning requirements after variances are granted. The structure fits well into the neighborhood, which is zoned for tow density residential use, and the improvements conform to current zoning and building regulations. Additional legally permissible applications of the single family dwelling use include licensed residential care facility, licensed day care facility, or as a manufactured home.
Financial feasibility
Because of the size of the site, landscaping, proximity to other parks, and cost to demolish the existing structure, the legal uses of manufactured homes, public parks, and recreational areas, public and private schools, and agriculture farming and truck gardening, would not be physically possible or financially feasible.
The City of Minnetonka has long maintained a reputation as a desirable place to live. The steady population growth and increasing property values are evidence to this. Market sales of residential properties in the neighborhood and city continue to be numerous. The strong market demand is an indication that current residential use in the neighborhood will continue in the future (Principle of Anticipation).
The attractive interest rates, minimum market time, high percentage of sold listings and construction of new housing suggests that the market for residential housing will remain strong. These economic factors indicate the current single family residential use of the subject site as improved will support the highest net return to the owner (Principle of Supply and Demand).
Land uses in the area of the subject neighborhood and surrounding neighborhoods are well balanced. This is evidenced by the number of residences, stores, schools, places of worship, parks, and other services, in and near the neighborhood. Property values will be maintained so long as businesses remain moderately successful, economic growth continues, and buildings through out the area are kept up (Principle of Balance).
The subject improvements conform well with the surrounding properties in the neighborhood. The majority of the housing stock is similar to the subject property in terms of style, age, size, condition, and value. The homogeneity of the subject neighborhood is expected to continue in the near future (Principle of Conformity).
Houses in the subject neighborhood generally range in age from 34 to 47 years. These homes are comparable to the subject and have been maintained in average or better
48-

condition regardless of actual age. The subject property has had limited updating, if the current level of maintenance continues, with some updating occurring, one would expect the improvements to contribute value. For instance, the value added by a second garage stall could equal, and in some cases exceed, the production costs. There is a limit to how desirable an extra garage stall may increase the property price. In all probability some of the extra production cost would have to be absorbed (Principle of Contribution).
Maximum profitability
Although the use as a licensed residential care facility or licensed day care facility are physically possible, legally permissible, and financially feasible, they would not be maximally profitable. This would be true because the costs associated with bringing the property into compliance with local building codes for safe and legal operation would not allow the existing improvement to produce a maximum financial return.
The Principles of Anticipation, Supply and Demand, Balance, Conformity, and Contribution will influence the highest and best use of a property. The strong market demand in the city and neighborhood indicates that the current residential use of the subject site as improved supports the highest net return to the owner. The conformity in the neighborhood creates market values that are relatively consistent therefore the subject property is not affected by dissimilar properties having significantly higher or lower market values. These principles indicate that the current improvements meet the highest and best use test of being financially feasible and maximally profitable.
The present use of the property is physically possible, legally permissible, financially feasible, and maximally profitable. After careful consideration of the site, improvements on the site, current zoning, conformity, location and the demand for single family residential properties in the area, it is the opinion of the appraiser that the highest and best use of the subject property, as improved on June 1,1994, is the current use as a single family residential containing between 1,000 and 1,200 square feet of living area.
The conclusion that the highest and best use of the subject site as vacant and improved, is single family residential, will be reflected throughout the valuation and reconciliation sections of this appraisal. Single family residential use will be the underlying basis for the market value estimates of the three approaches to value and the reconciliation of a single family estimate. The principle of substitution will be used as the basis for the cost and sales comparison approach sections of this report. The principle of anticipation will be used as the basis for the income approach. All comparable adjustments have been made in relation to the principle of contribution. The comparables analyzed have the same highest and best use as the subject property; that is single family residential.
49

The Appraisal Process
The appraisal process is a step by step logical method of processing data into value estimates.
1. Define the problem
1. Identify the property to be appraised 2. Specify the property rights involved 3. State the purpose and function of the appraisal 4. State the date of the appraisal 5. Define the value involved
2. Preliminary survey and planning
1. Estimate the highest and best use of the property 2. Make a list of data to be collected 3. Select the dominant approach to be used 4. Allocate time and resources needed
3. Collect and analyze data
1. General data includes neighborhood characteristics, trends, and factors
2. Specific data includes site and improvement characteristics 3. Comparative data include cost, income and expense, and sales
information
4. Application of data
1. Apply the cost approach 2. Apply the income approach 3. Apply the sales comparison approach
5. Correlate the three approaches
1. Discuss the amount and reliability of data used in each approach 2. Discuss the strengths and weaknesses of each approach 3. Discuss the relevancy of each approach to the subject property
6. Final value estimate
1. Consider the purpose of the appraisal 2. Consider the kind of value sought
50

All three approaches to value will be used in this report. These are the cost, income, and sales comparison approaches. Each of these approaches has merit and limitations. Each approach will be defined as they are addressed in this report.
Cost Approach
The cost approach to value provides a value indication that is the summation of the estimated land value and the depreciated cost of the building and other improvements. The valuation principles which most directly affect the cost approach are the principle of substitution, which states that an informed buyer will pay no more than the cost of producing a property with the same utility as the subject property and the principle of contribution which states that the value of a property component depends on its contribution to the whole.
The following are steps used in the cost approach:
1. Estimate the site value as if vacant
2. Estimate all reproduction or replacement costs new
3. Estimate the amount of accrued depreciation and justify loss in value due to:
a) Physical deterioration b) Functional obsolescence c) Economic obsolescence
4. Deduct depreciation from the reproduction or replacement cost estimate
5. Add the estimated depreciated reproduction or replacement cost of improvements to the estimated land value to arrive at a value indication
The cost approach method of valuation is more reliable when improvements are new and are the highest and best use to which the land may be used. Because the subject property is not a new structure, problems may exist in estimating accrued depreciation. The estimates of the depreciation and the reproduction costs must be checked in the market to obtain a reliable estimate of value. Market imperfection limits the reliability of this approach.
Income Approach
The income approach restates market value by converting the future benefits of property ownership into an expression of present worth. The valuation principles that most directly affect the income approach are the principle of substitution and the principle of anticipation. A property does not have a market value greater than the income stream it is capable of producing. This income stream should be consistent with
51

what is anticipated from investments, either another property or another type of investment, with similar risks.
Normally in the income approach, the future benefits of ownership are discounted to a present worth through the capitalization process. The following are steps used in the income approach:
1. Estimate potential gross income
2. Deduct for vacancy and gross income
3. Add miscellaneous income
4. Determine operating expenses
5. Deduct operating expenses to determine net income before discount, recapture, and taxes
6. Select the proper capitalization
7. Determine the appropriate capitalization procedure to be used
8. Capitalize the net income into an estimated property value
Residential properties such as the subject property are not usually purchased for profitable investment income, but rather for the amenities they will provide for their owners. A lack of adequate rental sales data may reduce the reliability of this approach in estimating the value of the subject property.
Cost Approach
The sales comparison approach involves the process of analyzing sales of similar properties that have recently sold to arrive at an indication of value for the subject property. The reliability of the approach is dependent upon the availability of comparative sales data, the verification of the sales data, the degree of comparability, and the extent of necessary adjustments for time differences, and the absence of non-typical conditions affecting the sale prices. The valuation principle that this approach is based on is the principle of substitution.
The five basic steps used in the sales comparison approach are:
1. Discover and analyze the data.
2. Determine appropriate units of comparison.
52
3. Develop reasonable adjustments.
4. Apply adjustments based on dissimilarities.
5. Analyze sales to the subject property.
The sales comparison approach is particularly useful for most single family residential property appraisals. The subject property is a typical single family home for this neighborhood. By analyzing sales of similar properties and making derived adjustments from the comparable to the subject, a logical and reliable estimate of market value can be determined for the subject property.
When the purpose of an appraisal is to establish market value, all approaches to value are in essence market data approaches, since all data input and adjustments are extracted from the market.
53

THE APPRAISAL PROCESS
Definition of the Problem
Preliminary Survey and Appraisal Plan
Data Program
General Data Specific Data • Region o Title o City • Site • Neighborhood • Improvements
Data Classifications and Analysis
in
1-Cost Approach 4
[Indicated Value
Income Approach
Indicated Value
Sales Comparison Approach
Indicated Value
Correlation of Value Indications
Final Estimate of Value
54

APPLICATION OF THE COST APPROACH
"Cost Approach -- a method of appraising property based on the depreciated reproduction or replacement cost (new) of improvements, plus the market value of the site.00
In the cost approach, the present cost of constructing all of the improvements on a site, less their loss in value due to depreciation, is added to the value of the site as if vacant, to determine property value. The basic principle involved is that of substitution, which states that an informed buyer would pay no more than the cost of producing a property with the same utility as the subject property. Buyers and sellers are most likely to consider building costs when a building is relatively new and offers maximum physical and functional utility. When structures are older or possess less-than-optimal utility, buyers adjust their opinions of value accordingly.
A couple of other principles apply to the cost approach. The principle of supply and demand can play a role in the cost approach. The trend in construction costs has a significant influence on property value and should be identified. The value of existing properties may increase or decrease depending on the cost of creating competitive properties. The principle of contribution is also important because any improvement to a property, whether vacant land or a building, is worth only what it adds to the property's market value.
The cost approach method of valuation is more reliable when improvements are new and represent a use that approximates the highest and best use of the land as though vacant. When improvements are older or do not represent the highest and best use of the land as though vacant, accrued depreciation is more difficult to estimate. The cost approach can be used to test the indication produced by sales comparisons. The estimates of the depreciation and the reproduction or replacement costs must be checked in the market to obtain a reliable estimate of value. Comparable properties may not provide sufficient data or the data from comparables may be too diverse to suggest an estimate of value. Because of market imperfection the reliability of this approach is limited.
When developing an indication of the value by the cost approach, two distinct and separate entities are considered in the process. The first step is to develop a site value, which is the non-wasting entity. The second step is to develop an improvement value, which is the wasting entity, which is affected by different types of depreciation. The valuation of the land as if vacant will be determined first.
There are six accepted methods for valuing the site as if vacant. In each method, the site is valued as if vacant and available to be put to it's highest and best use. The six methods are:
55

1. Sales Comparison method -- Sales of similar vacant sites are analyzed and compared. After adjustments are made, the appraiser arrives at an estimate of value for the subject site.
2. Abstraction (land residual) method -- The net income earned by the building is deducted from the total net income of the property; the land earns the balance. The left over income is then capitalized to indicate the land value.
3. Allocation (land ratio) method -- The ratio of land value to building value typical of similar improved properties in the area is applied to the total value of the subject property to arrive at the land value of the subject.
4. Capitalization of Ground Rent method -- Used when land is rented or leased independently of improvements. Applicable to farmland and commercial land leased on a net basis.
5. Cost of Development method -- To determine the value of the undivided raw land, the costs of developing and sub-dividing a parcel of land are subtracted from the total expected sales prices of the separate sites, adjusting for the time required to sell all of the individual sites.
6. Extraction method — The estimation of the depreciated cost of the improvement is deducted from the total sale price of the property to arrive at the land value_
The most common method to value land is the direct sales comparison. This method was selected because it is the most reliable when there is sufficient sales data. It is also the most appropriate because the highest and best use is residential. In the absence of comparable land sales a less direct valuation method can be used. The other methods have limited credibility as an indicator of value due to the reliance placed on the assumptions and judgments of the appraiser.
The Sales Comparison method involves the following four steps:
1. Discovery and verification -- find, list, and verify pertinent information on the sales used for comparison.
2. Selection of unit of comparison -- determine which of the physical and economic units of comparison are most appropriate to use in valuing the site.
3. Adjustments to sales data -- determine what adjustments are most appropriate to equalize the comparable sales with the subject property.
4. Application of adjustments -- apply quantifiable dollar amounts or percentages to the sale price of the comparables_
56
As stated earlier in this report, most of the lots in the subject neighborhood and nearby comparable neighborhoods are improved with single family homes. The majority of the lots in the city of Minnetonka are also currently developed and there are few lots available for residential development. Because of this scarcity, the number of comparable vacant lot sales was limited. However, there was sufficient market data to analyze several vacant lot sales. Four comparable lot sales were selected. Two were in the subject neighborhood. One sale was located in a comparable neighborhood and one sale was located in a superior neighborhood. Since the date of sale, all lots except one have been developed with a single family residence dwelling.
The following pages contain photographs and descriptive information of the comparable land properties. Exhibit 0 of the Addenda is a map showing the location of the subject property and comparable land sales.
(Note: The recording data is not verified by a book and page number. Book and page numbers have not been used by the Hennepin County Recorder's Office since 1968. All deeds are filed by a document number.)
57
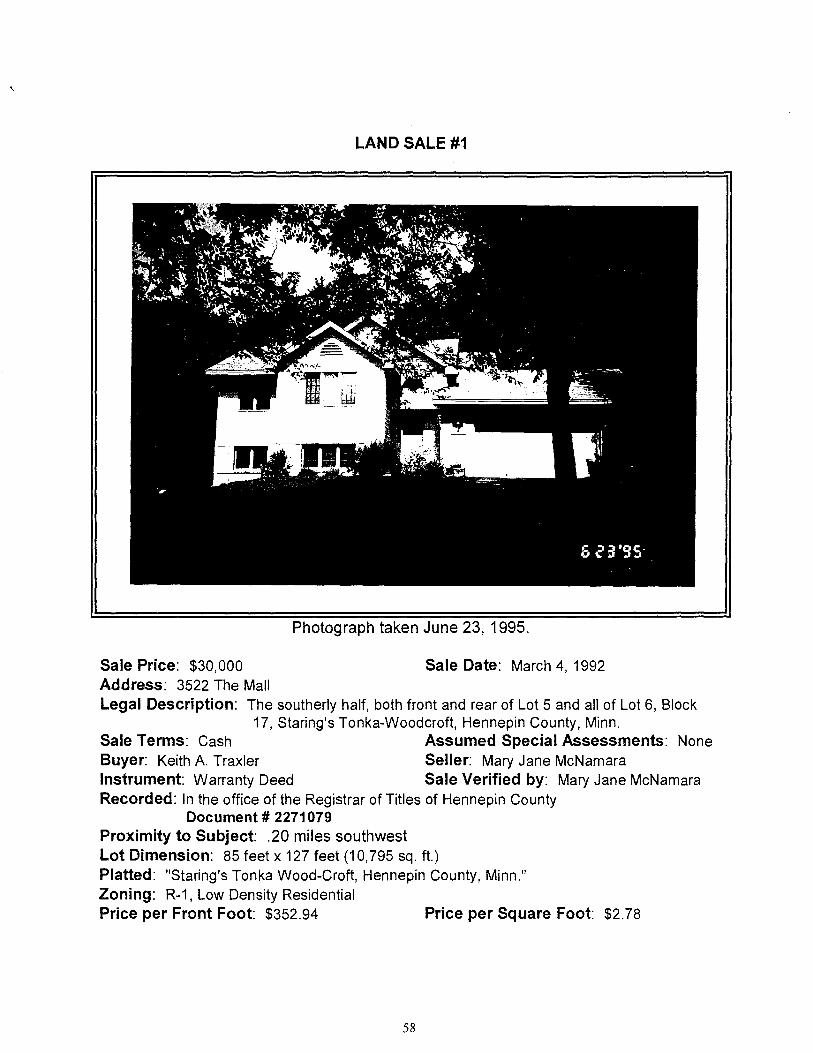
LAND SALE #1
Photograph taken June 23, 1995.
Sale Price: $30,000
Sale Date: March 4, 1992 Address: 3522 The Mall Legal Description: The southerly half, both front and rear of Lot 5 and all of Lot 6, Block
17, Staring's Tonka-Woodcroft, Hennepin County, Minn. Sale Terms: Cash Assumed Special Assessments: None Buyer: Keith A. Traxler Seller: Mary Jane McNamara Instrument: Warranty Deed Sale Verified by: Mary Jane McNamara Recorded: In the office of the Registrar of Titles of Hennepin County
Document # 2271079 Proximity to Subject: .20 miles southwest Lot Dimension: 85 feet x 127 feet (10,795 sq. ft.) Platted: "Staring's Tonka Wood-Croft, Hennepin County, Minn." Zoning: R-1, Low Density Residential Price per Front Foot: $352.94 Price per Square Foot: $2.78
58

LAND SALE #2
Photograph taken June 23, 1995.
Sale Price: $25,000
Sale Date: December 14, 1990 Address: 3537 Elmwood Place Legal Description: Lot 28 except that part lying north of the south 16.24 feet there of,
Block 3, Staring's Tonka Wood-Croft, Hennepin County, Minn. Sale Terms: Cash
Assumed Special Assessments: None Buyer: Joanne L. Sicard
Seller: Robert M. Mclnerny
Instrument: Warranty Deed
Sale Verified by: Joanne L. Sicard Recorded: In the office of the Registrar of Titles of Hennepin County.
Document # 2151164 Proximity to Subject: .06 miles south Lot Dimension: 80ft. x 167ft. x 80ft. x 173ft. (13,840 sq. ft.) Platted: "Staring's Tonka Wood-Croft, Minn." Zoning: R-1, Low Density Residential Price per Front Foot: $312.50 Price per Square Foot: $1.81
59

LAND SALE #3
Photograph taken June 23, 1995.
Sale Price: $32,000
Sale Date: September 16, 1993 Address: XXXX Cottage Grove Avenue Legal Description: Lot 14 and Lot 15, Block 7, "Thorpe Bros. Groveland Shores," Hennepin
County, Minn. Sale Terms: Cash
Assumed Special Assessments: None Buyer: Jerry Wendling & Patricia A. Alt
Seller: Helen C. Kane
Instruments: Warranty Deed Sale Verified by: Jerry Wendling Recorded: In the office of the Registrar of Titles of Hennepin County
Document # 6247219 Proximity to Subject: .65 miles northwest Lot Dimensions: Irregular (13,674 sq. ft.) Platted: "Thorpe Bros. Groveland Shores", Hennepin County, Minn. Zoning: R-1, Low Density Residential Price per Front Foot: $301.89 Price per Square Foot: $2.34
60
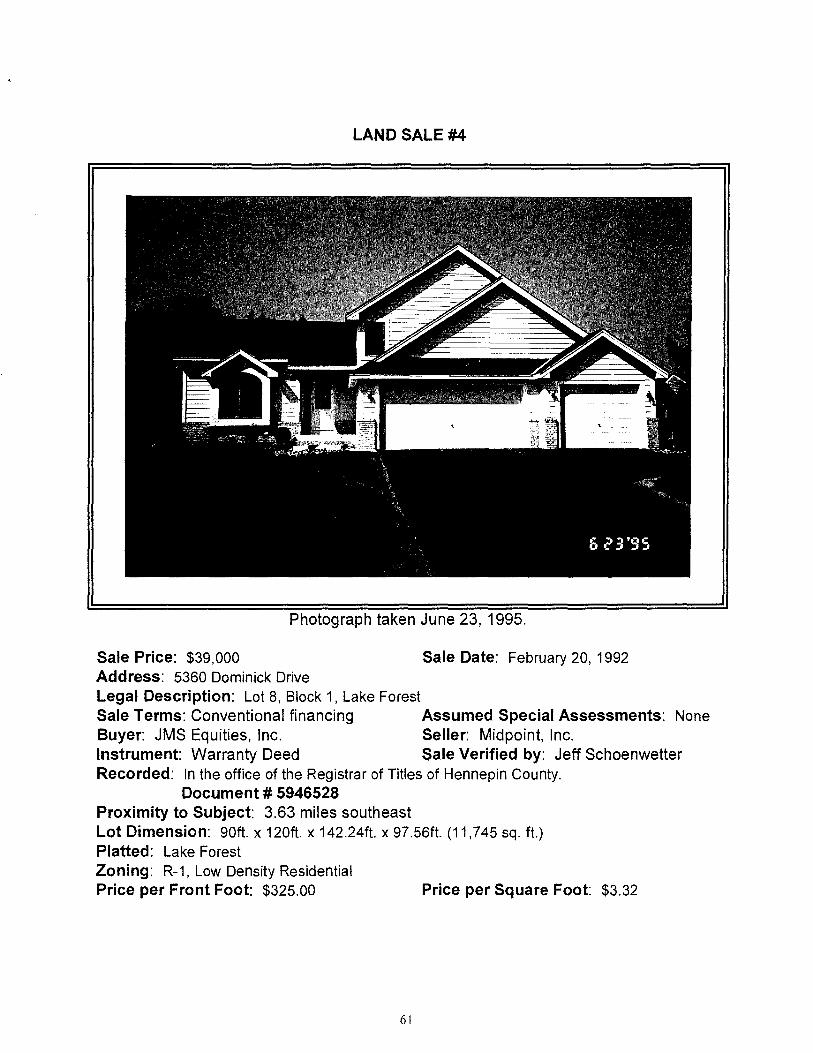
LAND SALE #4
Photograph taken June 23, 1995.
Sale Price: $39,000
Sale Date: February 20, 1992 Address: 5360 Dominick Drive Legal Description: Lot 8, Block 1, Lake Forest Sale Terms: Conventional financing Assumed Special Assessments: None Buyer: JMS Equities, Inc. Seller: Midpoint, Inc. Instrument: Warranty Deed Sale Verified by: Jeff Schoenwetter Recorded: In the office of the Registrar of Titles of Hennepin County.
Document # 5946528 Proximity to Subject: 3.63 miles southeast Lot Dimension: 90ft. x 120ft. x 142.24ft. x 97.56ft. (11,745 sq. ft.) Platted: Lake Forest Zoning: R-1, Low Density Residential Price per Front Foot: $325.00 Price per Square Foot: $3.32
61

LAND SALE COMPARISON GRID
SUBJECT COMP #1 COMP #2 COMP #3 COMP #4
Address 3507 Elmwood Place
3522 The Mall 3537 Elmwood Place
)000( Cottage Grove Avenue
5360 Dominick Drive
Sale Price N/A $30,000 $25,000 $32,200 $39,000
Sale Date N/A 3/92 12/90 9/93 2/92
Lot Dimensions 90' X 125' 85' X 127' 80' X 170' Irregular Irregular
Lot Size in Sq. Ft. 11,255 10,795 13,840 13,674 11,745
Price Per Front Foot N/A $352.94 $312.50 $301.89 $325.00
Price Per Square Foot
N/A $2.78 $1.81 $2.34 $3.32
Location Quiet Street Quiet Street Quiet Street Quiet Street Quiet Street
62

Site Value Analysis
There are variations between the comparable lot sales. Therefore, a standard unit of comparison must be used to analyze the differences in the sales comparables. The most common units of comparison in residential site valuation are:
1. Front Foot-- This method is frequently used where frontage significantly contributes to value, such as lakeshore property.
2. Square Foot -- This method is generally used for irregularly shaped parcels and where frontage is not a dominant factor in the valuation process.
3. Site Value -- This method is used when the market does not indicate a significant difference in site value despite variations in lot sizes.
The site value comparison has been used in this appraisal. Because of the limited supply of vacant lots in Minnetonka, it is determined that residential sites are primarily bought and sold on a site value basis. Potential buyers do not have options to discern whether a site is any more or less valuable based on variations in size and front footage. This determination is based on the analysis of sales data, and confirmed with local Realtors, builders, developers, and buyers. Since the appropriate unit of comparison is by the site, all comparable lot sales have been analyzed on this basis.
The subject site and comparable lot sales are zoned R-1 (Low Density Residential District). Highest and best use for the subject and all the comparables are single family residential. All front on bituminous surfaced streets and none have sidewalks. The topography of the lots varies slightly. All land sales have good drainage with no detrimental soil conditions. All, but the undeveloped lot are served by water, gas, electricity, sanitary, and storm sewer, telephone, cable, and refuse collection.
All sales were arm's length transactions that were verified with a participant in the transaction.
After analyzing the vacant land sales selected for comparison, the following adjustments were deemed appropriate:
Time adjustment
In comparing the four vacant lot sales, a time adjustment was made to update the sales to the appraisal date of June 1, 1994. The supply and demand of residential sites in Minnetonka limited the number of repeat sales available for analysis. Generally, a site is purchased and built on immediately.
Two repeat sales in comparable neighborhoods were located for analysis. Each site had the same zoning as the subject site, and housing located near the sites was similar
63
to that of the subject neighborhood. The vacant lot at 14870 Highland Lane sold for $45,000 in May of 1991, and resold in December of 1993, for $52,000. The resale indicated an increase in value of $7,000 and that equates to 6.22 percent annually. The vacant lot at 12721 Lake Street Extension sold in June of 1992, for $30,000 then resold in January of 1994, for $32,500. This resale indicated an increase in value of $2,500 and that equates to 5.26 percent annually. A time adjustment of 5.75 percent was selected, and equates favorably with the 5.80 percent time adjustment established by market abstraction of repeat sales of improved properties (refer to page 115 of this report). All comparable sales were adjusted by 5.75 percent annually or .48 percent per month.
Topography adjustments
All of the comparable sales are very similar to the subjects' topography; thus no adjustments were required.
Locational adjustments
Adjustments for location are necessary when a difference in value is supported between properties that have negative locations. Comparable #4 is a corner lot that has access to normal residential streets, but borders a street with additional traffic. Based on an examination of corner lot land sales in neighborhoods similar to the subjects, there is limited market evidence to justify adjusting for any minor variations in location. Therefore, no adjustments for location were made. However, a location adjustment was made to show a difference in value when comparing a lot located in a neighborhood with superior homes surrounding it. After analyzing the lot sales and comparing lot sale #4, which is located in a superior neighborhood, with lot sale #1, which is comparable to lot sale #4 in size, but located in the subject neighborhood, a difference of $9,000 in value was determined using the paired sale. Therefore, a downward adjustment of $9,000 was made to land sale #4.
Site adjustment
The sizes of the comparable land sales range from 10,975 to 13,840, a difference of 3,045 square feet. Comparable #2 is the largest site in square feet and when compared with comparable #1, the smallest site in square feet, their adjusted sale prices show a difference of $3,900. However, the smaller site, comparable #1, adjusted to a higher sale price than comparable #2. The next largest site, comparable #3, adjusted to a sale price of $33,600, that is very similar to the sale price of comparable #1, $33,900, thus supporting the earlier claim of buyers purchasing vacant buildable lots on a site basis.
All comparable land sale parcels do not meet current requirements for total size. According to Kim Lindquist, Senior Planner, Minnetonka Planning Department, each parcel is considered on its own merits. Based on the date of the original plat, size of
64

surrounding sites, number and type of variances, etc., each of these parcels were granted the necessary variances to allow them to become buildable sites.
65

LAND SALE ADJUSTMENT GRID
LAND SALE #1 LAND SALE #2 LAND SALE #3 LAND SALE #4
Address 3522 The Mall 3537 Elmwood Place XXXX Cottage Grove Avenue
5360 Dominick Drive
Lot Size in Sq. Ft. 10,795 13,840 13,674 11,745
Sale Price $30,000 $25,000 $32,200 $39,000
Sale Date 3/92 12/90 9/93 2/92
Time Adjustment $ 3,900 $ 5,000 $ 1,400 $ 5,200
Time Adjusted Sale Price $33,900 $30,000 $33,600 $44,200
Location Adjustment 0 0 0 -$ 9,000
Location Adjusted Sale Price
$33,900 $30,000 $33,600 $35,200
Adjusted Sale Price Per Site
$33,900 $30,000 $33,600 $35,200
Adjusted Sale Price Per Sq. Ft.
$3.14 $2.17 $2.45 $3.00
Adjusted Sale Price Per Front Foot
$398.82 $375.00 $316.98 $293.33
Range Mean Median
Adjusted Sale Price Per Site: $30,000 -$35,200 $33,200 $33,800 Adjusted Sale Price Per Square Foot: $2.17 - $3.14 $2.69 $2.73
Adjusted Sale Price Per Front Foot: $293.33 - $398.82 $346.03 $345.99
66
Reconciliation of Land Value
The four vacant land sales have an adjusted sale price range of $30,000 to $35,200. The mean sale price is $33,200 and the median sale price is $33,800.
Most emphasis was placed on comparable #1. This sale required a time adjustment and is located in the subject neighborhood. It is the most similar in size to the subject property. Comparable #2 and #3 required adjustments for time, also. Comparable #4 required adjustments for time and location. All vacant lot sales are considered supportive of the final value conclusion for the subject site
Therefore, it is the appraiser's opinion that the site value of the subject property, as of June 1, 1994, is:
Thirty Three Thousand Nine Hundred Dollars
($33,900)
67
Estimate of Cost New
The next step in the cost approach is to determine the contribution of the improvements to the total value of the property. This is accomplished by estimating reproduction or replacement cost new of the improvement
"Reproduction cost is the cost of constructing a replica, or identical structure, using the same materials, construction standards, design, and quality of workmanship."'"
"Replacement cost is the cost of constructing a substitute structure of equal utility using current materials, design, and standards."I2
In this appraisal, the reproduction cost new will be utilized to estimate the value of the improvements of the subject property. The subject property improvements exhibit incurable functional obsolescence, due to having a single stall garage. The reproduction cost is the most appropriate method to use since the deficiency must be duplicated and then it can properly be the subject of the depreciation.
The four methods for estimating the reproduction cost new of the subject property include:
1. Quantity Survey Method -- the itemized cost of erecting or installing all of the component parts of a new building are added. Indirect costs (building permit, land survey, overhead expenses; such as insurance and payroll taxes, and builder's profits) are totaled, as well as direct costs (site preparation and all phases of building construction including fixtures).
2. Unit-in-Place Method -- The construction cost per unit of measure of each component part of the subject building (including: material, labor, overhead, and builder's profit) is multiplied by the number of units of that component part in the subject building. Most components will be measured in square feet, although certain items, such as plumbing fixtures, will be estimated as complete units. This method is often used by contractors and appraisers due to the high degree of accuracy and because it is less costly and time consuming than the quantity survey method.
3. Comparative Unit (Square Foot) Method -- This method combines all construction costs into a single unit according to the quality and type of construction and on the basis of comparison with known costs. These methods are widely used because they are quickly computed and easily understood, but are deemed less accurate than the two previously described methods.
68
4. Trended Original Cost (Factored Historical Cost) Method -- This method uses costs scheduled from previous years and applies trending factors to bring original costs to current cost. This method is used primarily for special use or unusual building and must be used with care. It is generally used only when the other methods cannot be applied, or to verify another method.
The unit-in-place method has been utilized in estimating the reproduction cost new of the subject improvements. The component estimates that are derived in this method allow a detailed analysis of the effects of depreciation. This method develops a reliable cost estimate for use in a demonstration appraisal report
The unit-in-place method was developed through the use of the Residential Cost Handbook. This cost service manual is published and updated by Marshall and Swift Company of Los Angeles, California. The costs indicated from this service are actually for replacement, rather than reproduction cost_ Therefore, the rates were modified and checked with a local contractor, L.D.K. Builders, in order to verify their reasonableness. After this verification, the cost figures were used for further analysis of depreciation_
It should be stated that the cost approach to value is most applicable when a structure is relatively new, because of the difficulty in estimating the accrued depreciation that exists in older buildings.
69

Reproduction Cost New Estimate Unit-in-Place Method 3507 Elmwood Place
COMPONENT QUANTITY UNIT COST TOTAL COST
Foundation 1,092 Sq. Ft. $ 10.05 $10,975
Basement (includes excavation)
1,092 Sq. Ft. $ 16.13 $17,614
Stairway 1 flight $ 707.00 $ 707
Floor Structure 1,118 Sq. Ft. $ 4.43 $ 4,953
Floor Covering 1,118 Sq. Ft. $ 4.74 $ 5,299
Exterior Walls 145 Lin. Ft. $ 111.97 $16,236
Ceilings 1,118 Sq. Ft. $ 4.28 $ 4,785
Interior Construction 1,118 Sq. Ft. $ 12.64 $14,132
Fireplace 2 openings $15,866.00 $15,866
Heating/Cooling System
1,118 Sq. Ft. $ 4.69 $ 5,243
Electrical (excludes fixtures)
1,118 Sq. Ft. $ 2.80 $ 3,130
Electrical Fixtures 16 $ 89.79 $ 1,437
Plumbing (excludes fixtures)
1,118 Sq. Ft. $ 3.55 $ 3,969
Plumbing Fixtures 8 fixtures $ 658.00 $ 5,264
Paint 1,118 Sq. Ft. $ 3.28 $ 3,667
Roof Structures 1,354 Sq. Ft. $ 3.43 $ 4,644
Roof Covering 1,354 Sq. Ft. $ 2.46 $ 3,331
Garage (excludes roof)
236 Sq. Ft. $ 14.22 $ 3,356
Driveway (concrete) 410 Sq. Ft. $ 2.80 $ 1,148
Miscellaneous * See Below $ 15,097.00 $ 15,097
* Includes blueprints, permit fees, utility hookups, Sac fees, landscaping, survey, etc.
70-
Depreciation Analysis
Depreciation is the "loss in value of an object, relative to its replacement cost, reproduction cost, or original cost, whatever the cause of the loss in value."13
"Accrued depreciation is the loss in value from reproduction or replacement cost new due to all causes except depletion, as of the date of appraisaL"/4
Since the improvements of the subject property were not new as of the appraisal date, the property suffers from some form of accrued depreciation. Accrued depreciation has an effect on the desirability and marketability of the property and must be identified, classified, and measured._
There are three types of accrued depreciation: physical deterioration, functional obsolescence, and economic obsolescence. Both physical deterioration and functional obsolescence exhibit a loss in value due to factors inherent with the property itself. Economic obsolescence is a loss in value based on factors external to the property.
Several methods exist that estimate accrued depreciation, the observed condition breakdown method has been utilized in this appraisal. This is the only method that separately measures each category of depreciation. The appraiser estimates the loss in value for curable and incurable items of depreciation. A curable item is one that can be easily and economically restored or replaced, resulting in an immediate increase in appraised value. An item that would be impossible, too expensive or not cost-effective to replace is incurable. The five elements of accrued depreciation measured in this method include:
1. Physical curable deterioration 2. Physical incurable deterioration 3. Functional curable obsolescence 4. Functional incurable obsolescence 5-. Economic-obsolescence
Physical Deterioration
Physical deterioration is the loss in value of the improvements due to wear and tear caused by use, abuse, and weathering. This deterioration is usually the most obvious form of depreciation.
Physical Curable
Physical Curable depreciation is sometimes referred to as deferred maintenance. This includes repairs that are economically feasible and would result in an increase in appraised value equal to or exceeding their cost. Items of routine maintenance fall into this category, as do simple improvements that can add far more than their cost to the
71

value of the property. The loss in value due to physical curable deterioration is the cost to cure the items of depreciation.
The subject property is generally in good repair for its age. There is some deferred maintenance that would be wise to cure at this time to attain maximum market appeal. The carpet in the bedroom next to the kitchen needs to be replaced at a cost of $400, as estimated by Home Value. Three broken windows need to be repaired at a cost of $30 per window. Each item would inhibit the marketability of the property, and have a negative impact on the value of the subject in excess of the cost to cure.
Curable Physical Items
Item Reproduction Cost Cost to Cure
Carpeting $400.00 $400.00 Windows $ 90.00 $ 90.00
Total Cost: $490.00 Total Physical Curable Deterioration: $490.00
Physical Incurable
Physical Incurable deterioration includes repairs or replacements that are not economical or the cost of repair exceeds the gain in value. This includes the separate physical components of a building, which do not deteriorate at the same rate. Generally, the individual building components can be divided into short-lived items and long-lived items of physical incurable deterioration.
Short-Lived components are those that may be replaced or repaired once or more over the economic life of the building. Loss in value due to depreciation of these items can be estimated on an individual basis or by assigning an average percentage of depreciation to the total value of all items. The depreciation of items that are considered economically practical to replace is measured by the ratio of the observed effective age and the normal life expectancy to the cost new of the items.
The following items within the subject property were identified as requiring replacement at some future time. The cost new for each of the items listed below was derived in the cost approach analysis section of this report. The effective and the total economic life of these components have been determined through observation and estimates of typical component lives as reported in Marshall and Swift. The allocation of depreciation for each item is based on the straight-line method.
72

Physical Incurable Deterioration Short-Lived
ITEM REPRODUCTION
COST NEW TOTAL
ECONOMIC LIFE EFFECTIVE AGE PERCENT
DEPRECIATED INCURABLE
DEPRECIATED
Roof Cover $ 3,331 20 8 40% $ 1,332
Heating/Cooling System
$ 5,243 25 5 20% $ 1,049
Water Heater $ 568 15 11 73% $ 415
Plumbing Fixtures $ 5,264 40 20 50% $ 2,632
Electrical Fixtures $ 1,437 40 20 50% $ 719
*Floor Cover $ 4,899 20 6 30% $ 1,470
*Windows $ 3,724 20 10 50% $ 1,862
Paint $ 3,667 7 4 57% $ 2,090
Driveway $ 1,148 25 13 52% $ 597
Total $29,281 $12,166
73
The roof cover was replaced in 1986 and the effective age is estimated at 8 years, the same as the actual age.
The furnace was changed out with a new unit in 1989. The air conditioner was also installed new at this time. The effective age is estimated to be the same as the actual age.
The water heater is still operational, but it is nearing the end of its life expectancy.
Based on their observed condition and because of good maintenance the plumbing and electrical fixtures appear to have an effective age equal to about one half of the life expectancy.
*The amount of the reproduction cost new for the floor coverings has been reduced by $400, since this amount was included as an item of curable physical deterioration.
*The amount of the reproduction cost new of the windows has been reduced by $90, since this amount was included as an item of curable physical deterioration.
The interior plaster walls are painted, as well as, the plaster ceilings. Both appear to be in good condition with no maintenance or repainting needed for a few years.
The exterior wood shakes were painted in 1990, resulting in an effective age of 4 years.
The driveway is concrete and is showing some signs of wear and cracking. The effective age was based on direct observation and estimated at one half of the life expectancy.
Long-Lived items are those that should last as long as the building's remaining economic life. The long-lived components are those structural components remaining after deducting short-lived components from the total reproduction cost new. Loss in value for items of physical incurable deterioration can be based on a percentage reflecting the ratio of effective age to the number of years of total physical life when new.
The actual or chronological age of the structure is 40 years. The effective age is estimated to be 40 years, because of the good maintenance and desirability of homes in this neighborhood. The normal economic life is estimated to be 95 years. Further explanation and support of these estimates of age are located on pages 36 through 42 of this report.
74

Total Reproduction Cost New of the Improvement
Total $140,853
Less: Reproduction Cost of Short-Lived Components:
Physical Curable items
$ 490 Physical Incurable items
$29,281
Total Physical Deterioration - $ 29,771
Total Reproduction Cost of Long-Lived $111,082
Actual Age: 40 Effective Age: 40 Total Economic Life: 95
40 / 95 = 42.11%
(42.11 / 40 years = 1.053%)
Total Physical Incurable Deterioration
X .4211
$ 46,777
75
Functional Obsolescence
Functional Obsolescence is the loss in value due to inability of the structure to perform adequately the function for which it is used, as of the appraisal date. Buyers perceive a loss in utility; therefore, the price offered is lower due to reduced demand. Functional Obsolescence may be caused by deficiency, modernization, or super adequacy and can be categorized as either curable or incurable.
Each of the above obsolescences are measured as follows:
Deficiency-- Excess of cost to cure over the cost if installed new during construction. This type of obsolescence recognizes that an item is absent and that an extra expenditure is necessary as a penalty to value.
Lack of Modernization -- Cost of the modern feature or item installed, less the depreciated value of the existing feature or item. This type of obsolescence recognizes that an item should be replaced, yet it still has value, therefore, the difference is a penalty to value.
Super-adequacy -- Reproduction cost new of the item minus the physical deterioration already charged, plus the installation costs of a usually sufficient or normal item. This type of obsolescence recognizes that an item is more than sufficient, thus the sum of the equation is the penalty for having an item that is deemed super-adequate.
Curable Functional Obsolescence
Curable Functional Obsolescence is items or conditions that are economically and physically practical to correct and may be caused by a deficiency, lack of modernization, or super-adequacies. In each case in order for the item to be curable, the increased market value of the property after curing the obsolescence must be at least equal to the cost of the item if it were originally installed during construction.
After analyzing the subject property in relation to market demands there was evidence of one item of curable functional obsolescence. In the kitchen, a lack of electrical outlets was observed. This deficiency causes the subject to be less desirable than comparable properties, with more electrical outlets. This type of functional obsolescence is classified as a deficiency requiring an addition. It is measured by the excess of the cost of the addition over the cost if installed new during construction.
76
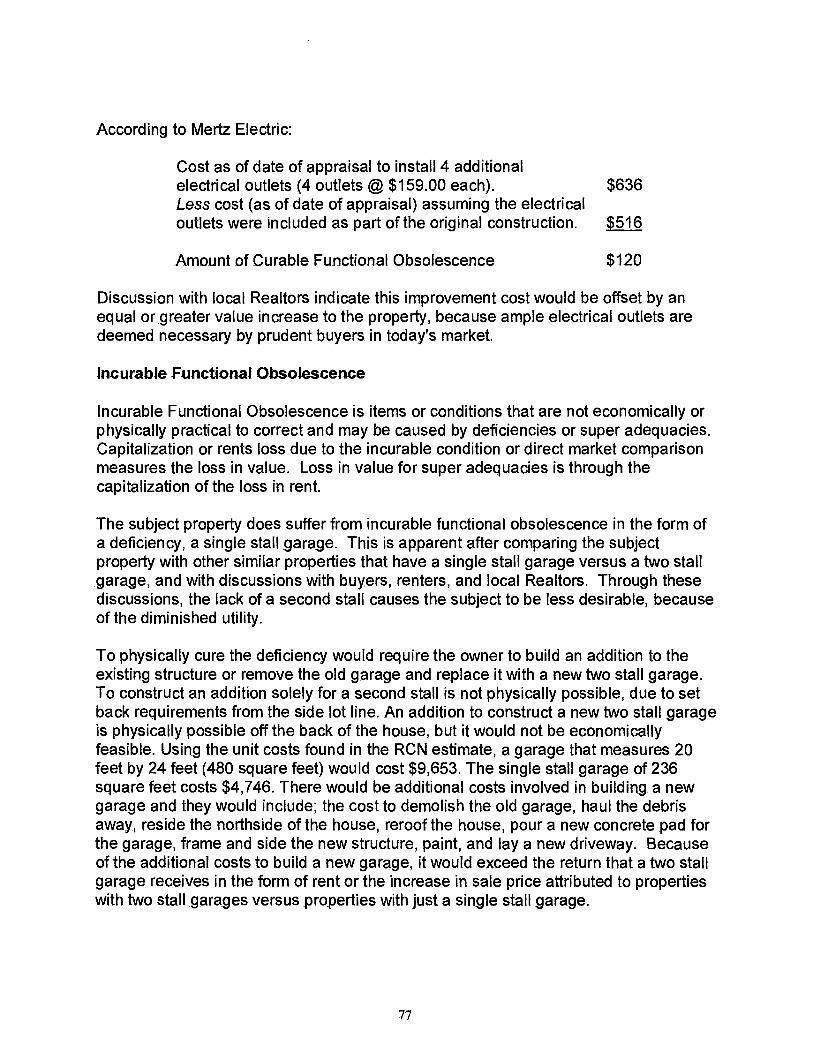
According to Mertz Electric:
Cost as of date of appraisal to install 4 additional electrical outlets (4 outlets @ $159.00 each). $636 Less cost (as of date of appraisal) assuming the electrical outlets were included as part of the original construction. $516
Amount of Curable Functional Obsolescence $120
Discussion with local Realtors indicate this improvement cost would be offset by an equal or greater value increase to the property, because ample electrical outlets are deemed necessary by prudent buyers in today's market.
Incurable Functional Obsolescence
Incurable Functional Obsolescence is items or conditions that are not economically or physically practical to correct and may be caused by deficiencies or super adequacies. Capitalization or rents loss due to the incurable condition or direct market comparison measures the loss in value. Loss in value for super adequacies is through the capitalization of the loss in rent.
The subject property does suffer from incurable functional obsolescence in the form of a deficiency, a single stall garage. This is apparent after comparing the subject property with other similar properties that have a single stall garage versus a two stall garage, and with discussions with buyers, renters, and local Realtors. Through these discussions, the lack of a second stall causes the subject to be less desirable, because of the diminished utility.
To physically cure the deficiency would require the owner to build an addition to the existing structure or remove the old garage and replace it with a new two stall garage. To construct an addition solely for a second stall is not physically possible, due to set back requirements from the side lot line. An addition to construct a new two stall garage is physically possible off the back of the house, but it would not be economically feasible. Using the unit costs found in the RCN estimate, a garage that measures 20 feet by 24 feet (480 square feet) would cost $9,653. The single stall garage of 236 square feet costs $4,746. There would be additional costs involved in building a new garage and they would include; the cost to demolish the old garage, haul the debris away, reside the northside of the house, reroof the house, pour a new concrete pad for the garage, frame and side the new structure, paint, and lay a new driveway. Because of the additional costs to build a new garage, it would exceed the return that a two stall garage receives in the form of rent or the increase in sale price attributed to properties with two stall garages versus properties with just a single stall garage.
77

This incurable functional obsolescence will be supported, first by capitalizing the rent loss as described in the income approach and secondly, through the paired sales analysis located in the sales comparison approach.
From the income approach section of this report, the market indicates that renters are willing to pay an additional $25 per month for the increased utility of having a two stall garage. This rent loss is evidenced by comparing rental #4, which only has a single stall garage and similar to the subject, with rental #5 which has a two stall garage. This market rent adjustment was verified with local rental agencies.
Capitalization of the rent loss would be done by multiplying the loss of income by the gross rent multiplier (GRM) as determined in the income approach section of this report. The indicated GRM is 126 for the subject property.
Estimated rent loss due to lack of a two stall garage
$ 25 Gross Rent Multiplier x 126
Loss in Value from Incurable Functional Obsolescence
$3,150
From the sales comparison approach section of this report, the market indicates that buyers of properties comparable to the subject are willing to pay an additional $7,573 more for the increased utility of having a two stall garage. This adjustment is evidenced by comparing sales comparable #2 and sales comparable #3, after adjustments for financing and time.
Comp #3
Comp #2 Two Garage Stalls One Garage Stall
(440 sq. ft.)
(240 sq. ft.) Sale Price minus: Financing Adjustment plus: Time Adjustment Adjusted Sale Price
$101,180 $ 96,000 $ 1,890 0 $ 17,275 $ 12,992 $116,565 $108,992
Property with two garage stalls
$116,565 Property with one garage stall
$108,992
Difference attributed to one garage stall $ 7,573
This deficiency is considered incurable because it is not physically or economically practical to correct. The cost to correct the deficiency exceeds the amount of value loss demonstrated in the market. This condition is best measured by the direct market comparison due to the greater number of sales comparables available versus rental comparables. Further support is found in the capitalization of rent loss. Buyers who can live with the deficiency will accept it if compensated by a lower purchase price or rent. Therefore the economic loss in value is $7,573.
78

Economic Obsolescence
Economic or locational obsolescence is loss in value due to influences outside the property itself. It is usually considered incurable, but it is not always permanent. Economic or locational obsolescence results in a loss in the value contribution of the improvement; it does not lessen the value of the land. It can be measured by the capitalization of income loss or by paired sales analysis.
The subject property does not suffer from any observed economic or locational obsolescence. For purposes of demonstration, the following hypothetical example is presented.
Imagine the subject property was located on State Highway No. 101 and rental information indicated that the loss in rental income was $45 per month. This loss was due to traffic noise, air pollution, and problems with site access due to traffic flow.
The loss in value by the capitalization of rent loss method is determined by multiplying the monthly rent loss of $45 by the monthly GRM of 126, found in the income approach section of this report. This loss in value due to location is attributable to both the land and buildings.
$45 rental loss X 126 GRM = $5,670
Because the land value determined in the site valuation section of the cost approach would already include any loss in value due to its location, only the loss in value attributed to the improvements needs to be calculated. Considering a land to building ratio of 1:2, or the building being 67 percent and land being 33 percent of the total property value, the loss in value due to buildings is:
$5,670 Total Value Loss X 67%(of improvement value) = $3,799
Site Improvements
Finally, the value of the landscaping was estimated to be 50 percent depreciated and the driveway 52 percent depreciated to arrive at the current value of landscaping and driveway.
Driveway 410 sq. ft. $ 597 Shrubs 17 $ 119 Trees 4 $ 250 Lawn 9,491 sq. ft. $1,582 Stoop $ 100 Total $2,648
79

SUMMARY OF THE COST APPROACH
Reproduction Cost New
$140,853
Less Accrued Depreciation
Physical Deterioration
Curable $ 490 Incurable (Short-Lived) $12,166 Incurable (Long-Lived) $46,777
Total Physical Deterioration $59,433
Functional Obsolescence
Curable $ 120 Incurable $ 7,573
Total Functional Obsolescence $ 7,693
Total Economic Obsolescence 0
Less Total Accrued Depreciation $ 67,126
Plus Current Value of Landscaping and Driveway $ 2,648
Depreciated Value of Improvements $ 76,375
Plus Total Site Value $ 33,900
Indicated Value by the Cost Approach $110,275
Rounded to nearest $100 $110,300
The indicated market value of the subject property, utilizing the cost approach, as of June 1, 1994, is
One Hundred Ten Thousand Three Hundred Dollars
($110,300)
80

APPLICATION OF THE INCOME APPROACH
"The income approach uses capitalization to convert the anticipated benefits of the ownership of property into an estimate of present value."" The principle of anticipation is the valuation principle that most directly affects the income approach. The principle of anticipation states that value is the present value of all rights to the future benefits accrued from ownership. It assumes that an informed purchaser would pay no more for a property than the cost of obtaining an income stream of the same size and involving the same risk as that embodied in the subject property.
Single family residences normally are not purchased for income purposes. This approach to value is considered the least reliable of the three value approaches for this type of property. The income approach is primarily used as a check on the value indications exhibited by the sales comparison and cost approaches to value.
Most buyers of single family homes purchase them in order to enjoy the benefits the property will bring them in the future. The benefits are amenities it will produce to its owner rather than its potential income. Non-homestead taxes and high maintenance costs discourage the ownership of single family homes for income purposes.
Townhouse and apartment rentals in the city are very competitive and offer more amenities than single family homes. Apartment rates range from $900 to $1,700 per month and townhouse rentals range from $975 to $1,350 per month, for three bedrooms. The rates generally include heat, water, and garbage services. Single family home rental rates usually do not include utilities, and they do not include amenities such as swimming pools, party rooms or recreation rooms.
Since residential property generally is not purchased by investors for potential income, the capitalization of net operating income is not appropriate. The proper analysis of the income approach for a single family residence is through the analysis and application of a gross rent multiplier (GRM), for single family residential properties, a monthly gross rent multiplier is developed rather than an annual gross rent multiplier, which would be more applicable to typical income producing properties.
The gross rent multiplier for residential property demonstrates the relationship between the sale price and monthly rental. The formula for the deduction of the gross rent multiplier is expressed below:
Sale Price = Gross Rent Multiplier Monthly Rental
To estimate the value of the subject property through the gross rent multiplier analysis, the procedure is to identify similar properties that have sold and were rented at the time of sale. A gross rent multiplier is derived from each sale of a comparable property.
81

Next, it is necessary to estimate the market rent of the subject property through comparison with similar properties that were rented as of the date of appraisal. The last step is to multiply the monthly rent by the estimated gross rent multiplier to indicate the value of the subject property.
The majority of the homes in the subject neighborhood are owner occupied, limiting the rental data. Of the five sales used to determine the gross rent multiplier, only one of the sales is from the subject neighborhood, while the other four are from similar neighborhoods. Four rental comparables are from the subject neighborhood and one rental comparable is from a neighborhood similar to the subject neighborhood.
The following pages contain photographs and descriptive information of the comparable rental sales properties. Exhibit P of the Addenda is a map showing the location of the subject and the comparable rental sales.
82

Rental Sale Comparable #1
Photograph taken June 23, 1995.
Address: 16422 Devon Drive Legal Description: Lot 31, Block 1, Somerset Knolls Sale Price: $121,000 Sale Date: May 14, 1994 Sale Terms: Conventional Financing Buyer: Joseph T. & Rebecca A. Tarvin Seller: Walter F. & Vaughn D. Krake Instrument: Warranty Deed Sale Verified by: Walter Krake Recorded: In the office of the Registrar of Titles of Hennepin County
Document # 2530881 Monthly Rent as of Sale Date: $945 GRM: 128.04 Proximity to Subject: 1.38 miles southwest Zoning: R-1, Low Density Residential Lot Size: 15,000 Sq. Ft. Year Built: 1957 Building Style: Rambler Building Size: 1,271 Sq. Ft. Basement: Full/366 Sq. Ft., finished Central Air: Yes Construction Quality: Fair Condition: Average Garage: 437 Sq. Ft., Attached Features: 3 Bedrooms, 1 Full bath Functional Obsolescence: None Economic Obsolescence: None
83

Rental Sale Comparable #2
Photograph taken June 23, 1995.
Address: 5038 Holiday Road Legal Description: Lot 7, Block 1, Woodland Hills 2nd Addition Sale Price: $113,900 Sale Date: April 24, 1994 Sale Terms: Conventional Financing Buyer: Fred Schech & Terry Schultz Schech Seller: John Peter Thielen Instrument: Warranty Deed Sale Verified by: Fred Schech Recorded: In the office of the Registrar of Titles of Hennepin County
Document # 2533732 Monthly Rent as of Sale Date: $900 GRM: 126.56 Proximity to Subject: 1.88 miles southeast Zoning: R-1, Low Density Residential Lot Size: 24,525 Sq. Ft. Year Built: 1957 Building Style: Rambler Building Size: 1,326 Sq. Ft. Basement: Full/322 Sq. Ft., finished Central Air: Yes Construction Quality: Fair Condition: Average Garage: 300 Sq. Ft., Tuckunder Features: 3 Bedrooms, 1 Full bath Functional Obsolescence: One Stall Garage Economic Obsolescence: None
84

Rental Sale Comparable #3
Photograph taken June 23, 1995.
Address: 13004 Shady Dale Road Legal Description: Lot 4, Auditor's Subdivision Number 366 Hennepin County, Minnesota Sale Price: $104,500 Sale Date: October 4, 1993 Sale Terms: Conventional Financing Buyer: Barbara H. Fletcher Seller: Ronald L. Olson Instrument: Warranty Deed Recorded: In the office of the Registrar of Titles of Hennepin County
Document # 2496705 Monthly Rent as of Sale Date: $840 GRM: 124.40 Proximity to Subject: 2.55 miles southeast Zoning: R-1, Low Density Residential Lot Size: 20,160 Sq. Ft. Year Built: 1952 Building Style: Rambler Building Size: 1,236 Sq. Ft. Basement: Full/433 Sq. Ft., finished Central Air: Yes Construction Quality: Fair Condition: Average Garage: 216 Sq. Ft., Tuckunder Features: 3 Bedrooms, 1 Full bath Functional Obsolescence: One Stall Garage Economic Obsolescence: None
85

Rental Sale Comparable #4
Photograph taken June 23, 1995.
Address: 10417 Crestridge Drive Legal Description: Lot 2, Block 2, Green Acres, Hennepin County, Minnesota Sale Price: $100,000 Sale Date: April 24, 1993 Sale Terms: Conventional Financing Buyer: Frederick S. Mulvany & Virginia A. Fohrenkamm Seller: Louis C. Wendling Instrument: Warranty Deed Recorded: In the office of the Registrar of Titles of Hennepin County
Document # 2422589 Monthly Rent as of Sale Date: $785 GRM: 127.39 Proximity to Subject 4.39 miles northeast Zoning: R-1, Low Density Residential Lot Size: 38,500 Sq. Ft. Year Built 1948 Building Style: Rambler Building Size: 1,152 Sq. Ft. Basement Full/306 Sq. Ft, finished Central Air: No Construction Quality: Fair Condition: Average Garage: 330 Sq. Ft., Detached Features: 3 Bedrooms, 1 Full bath Functional Obsolescence: One Stall Garage Economic Obsolescence: None
86

Rental Sale Comparable #5
Photograph taken June 23, 1995.
Address: 3935 Brown Lane Legal Description: Lot 2, Block 3, Charlottewood 2nd Addition Sale Price: $114,600 Sale Date: May 28, 1993 Sale Terms: FHA Financing Buyer: Augustinus Van Maaren & Karen J. McConomy Seller: Joey R. Ketzner & Thuot Nguyen Sale Verified By: Joey Ketzner Recorded: In the office of the Registrar of Titles of Hennepin County
Document # 2421016 Monthly Rent as of Sale Date: $890 GRM: 128.76 Proximity to Subject .50 miles southwest Zoning: R-1, Low Density Residential Lot Size: 39,525 Sq. Ft Year Built 1959 Building Style: Rambler Building Size: 1,048 Sq. Ft. Basement Full/ 524 Sq. Ft, finished Central Air: No Construction Quality: Fair Condition: Average Garage: 400 Sq. Ft., Attached Features: 3 Bedrooms, 1 Full bath Functional Obsolescence: None Economic Obsolescence: None
87

RENTAL SALES COMPARABLE DATA GRID
Subject Comparable #1 Comparable #2 Comparable #3 Comparable #4 Comparable #5
ADDRESS 3507 Elmwood Place
16422 Devon Drive
5038 Holiday Road
13004 Shady Dale Road
10417 Crestridge Drive
3935 Brown Lane
MONTHLY RENT AS OF SALE DATE
N/A $945 $900 $840 $785 $890
SALE PRICE N/A $121,000 $113,900 $104,500 $100,000 $114,600
SALE DATE N/A 5/1994 4/1994 10/1993 4/1993 5/1993
GRM N/A 128.04 126.56 124.40 127.39 128.76
LOT SIZE 11,255 Sq. Ft. 15,000 Sq. Ft. 24,525 Sq. Ft. 20,160 Sq. Ft. 38,500 Sq. Ft. 39,525 Sq. Ft.
BUILDING STYLE Rambler Rambler Rambler Rambler Rambler Rambler
YEAR BUILT 1954 1957 1957 1952 1948 1959
BUILDING SIZE 1,118 Sq. Ft. 1,271 Sq. Ft. 1,326 Sq. Ft. 1,236 Sq. Ft. 1,152 Sq. Ft. 1,248 Sq. Ft.
GARAGE One Stall Attached
Two Stall Attached
One Stall Tuckunder
One Stall Tuckunder
One Stall Detached
Two Stall Attached
FEATURES 3 Bedrooms 1 Full Bath
3 Bedrooms 1 Full Bath
3 Bedrooms 1 Full Bath
3 Bedrooms 1 Full Bath
3 Bedrooms 1 Full Bath
3 Bedrooms 1 Full Bath
LOCATION Quiet Street Quiet Street Quiet Street Quiet Street Quiet Street Quiet Street
RANGE
MEAN MEDIAN
GROSS RENT MULTIPLIER 124.40 - 128.76 127.03 127.39
88
DETERMINATION OF THE GROSS RENT MULTIPLIER
The gross rent multiplier, when properly applied, assumes the following:
1. The highest and best use of the property will not change over the remaining economic life of the property.
2. Any differences between the subject property and comparable sales are reflected in the rents of each property.
3. The subject property and comparable rental sales are similar, exposed to the same market influence, and are in competition with each other. They have similar operating expenses, utility, and amenities.
4. The property will be rented at a constant rate, with no unusual vacancy factors.
These assumptions are applicable to the subject property and the comparable rental sales. Five sales of properties that were rented at the time of sale were analyzed to determine the appropriate gross rent multiplier for the subject property.
One of the sales was located in the subject neighborhood. The other four are located in different, but comparable neighborhoods that would be in direct competition with the subject property. The rental sales are all the same building style, constructed between 1948 to 1959, and the operating expenses, utility, and amenities are similar. The highest and best use for all the rental sales is their present use, single family residential.
The sales produced gross rent multipliers with a range of 124.40 to 128.76, and a mean of 127.03 and a median of 127.39.
Rental sales #1, #3, and #5 are the most comparable to the subject property considering physical characteristics. Comparable rental sale #1 was the most similar to the subject property, because of the proximity to the subject, the age of the house, the size of the lot, and the date of sale. Comparable rental sale #3 was very comparable, however it is located about three miles from the subject property. Comparable rental sale #5 is located in the subject neighborhood, but its' lot is considerably larger and the age of the house is younger. Rental sale #4 is also comparable, but the distance from the subject neighborhood is five miles. Comparable rental sale #2 required the most adjustments.
After considering all comparable rental sales and placing equal weight on comparable rental sale #1 and #3, it is concluded that a gross rent multiplier of 126 is appropriate for the subject property. Comparable rental sale #3, has only a single stall garage, but
89

because of its distance from the subject property; equal weight was placed on comparable rental sale #t
90

Development of Market Rent
To use the established gross rent multiplier, an economic or market rent must be determined for the subject property. Economic or market rent is rent that a property would most probably receive in the open market as indicated by an analysis of comparable rental properties at the time of the appraisal.
The market rent was estimated utilizing four rental comparables that are located in the subject neighborhood and one rental comparable located in a neighborhood similar to the subject neighborhood. All of the rental comparables are similar to the subject in style, age, size, amenities, and location. All rents are per month, for unfurnished homes with the tenant paying utilities, and are as of June 1, 1994, the date of the appraisal.
The following pages contain the photograph and description of the five comparable rental properties. Exhibit Q of the Addenda is a location map for the subject and the five comparable rentals.
91
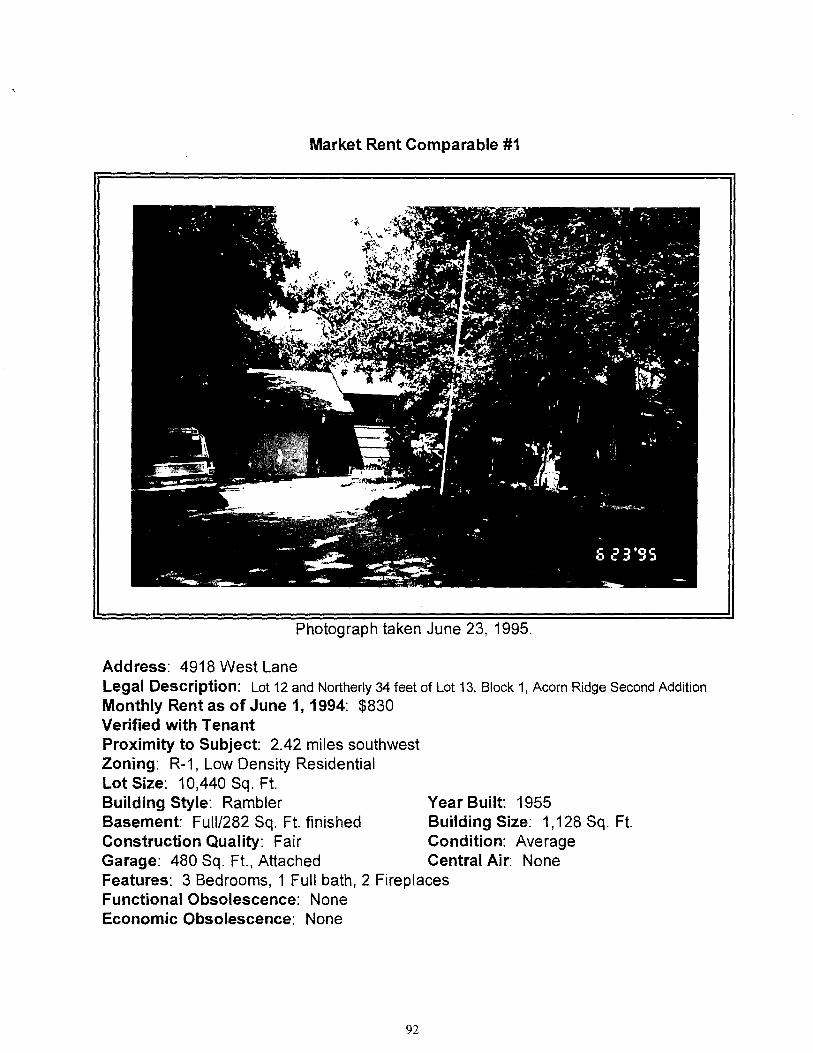
Market Rent Comparable #1
Photograph taken June 23, 1995.
Address: 4918 West Lane Legal Description: Lot 12 and Northerly 34 feet of Lot 13, Block 1, Acorn Ridge Second Addition Monthly Rent as of June 1, 1994: $830 Verified with Tenant Proximity to Subject: 2.42 miles southwest Zoning: R-1, Low Density Residential Lot Size: 10,440 Sq. Ft. Building Style: Rambler Year Built: 1955 Basement: Full/282 Sq. Ft. finished Building Size: 1,128 Sq. Ft. Construction Quality: Fair Condition: Average Garage: 480 Sq. Ft., Attached Central Air: None Features: 3 Bedrooms, 1 Full bath, 2 Fireplaces Functional Obsolescence: None Economic Obsolescence: None
92

Market Rent Comparable #2
Photograph taken June 23, 1995.
Address: 3410 Meadow Lane Legal Description: LOT 4 AND THAT PART OF LOTS COM AT NE COR OF LOT 5TH S 32025/1000 FT TH W TO A
PT IN NW LINE OF SAID LOT DIS 3084/100 FT N OF SW COR THEREOF THE Ni TO NW COR THEREOF TH E TO BEG, BLOCK 19, STARING'S TONKA WOOD-CROFT, HENNEPIN.
Monthly Rent as of June 1,1994: $810 Verified with Tenant Proximity to Subject: .25 miles northwest Zoning: R-1, Low Density Residential Lot Size: 10,070 Sq. Ft. Building Style: Rambler Year Built: 1950 Basement: Full/None Building Size: 1,176 Sq. Ft. Construction Quality: Fair Condition: Average Garage: 348 Sq. Ft., Attached Central Air: None Features: 3 Bedroom, 1 Full bath, 1 Fireplace Functional Obsolescence: One Stall Garage Economic Obsolescence: None
93
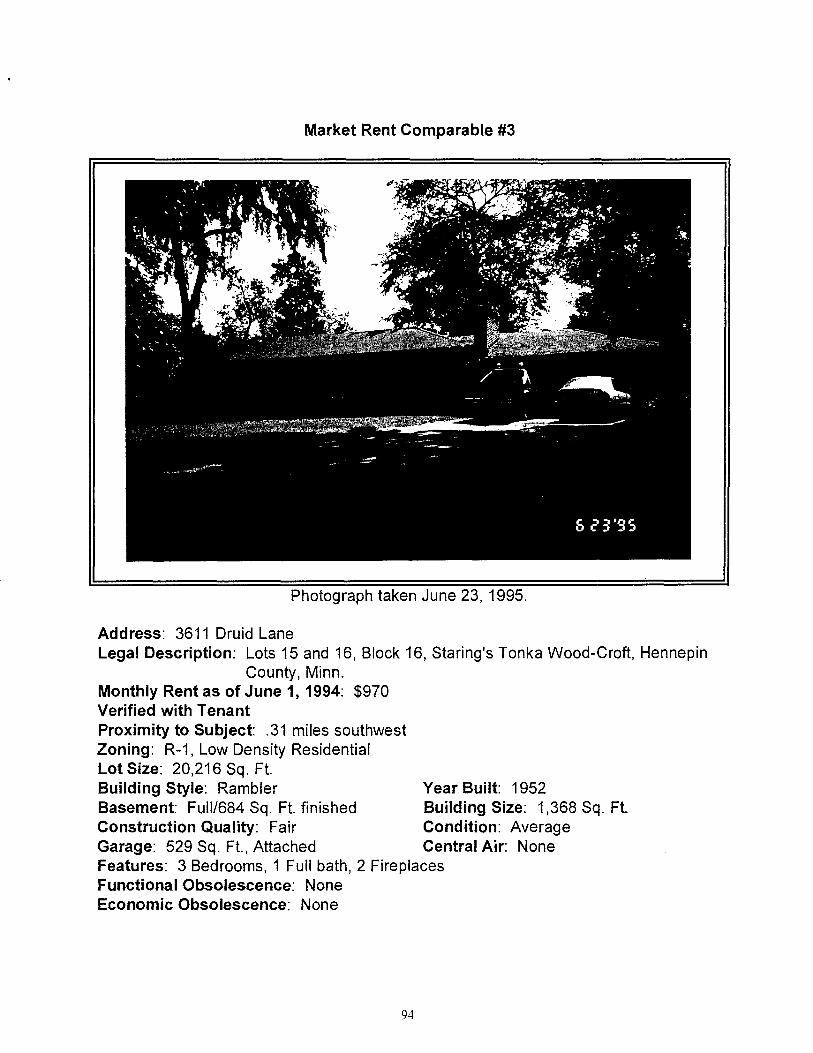
Market Rent Comparable #3
Photograph taken June 23, 1995.
Address: 3611 Druid Lane Legal Description: Lots 15 and 16, Block 16, Staring's Tonka Wood-Croft, Hennepin
County, Minn. Monthly Rent as of June 1, 1994: $970 Verified with Tenant Proximity to Subject: .31 miles southwest Zoning: R-1, Low Density Residential Lot Size: 20,216 Sq. Ft. Building Style: Rambler Year Built: 1952 Basement: Full/684 Sq. Ft. finished Building Size: 1,368 Sq. Ft. Construction Quality: Fair Condition: Average Garage: 529 Sq. Ft., Attached Central Air: None Features: 3 Bedrooms, 1 Full bath, 2 Fireplaces Functional Obsolescence: None Economic Obsolescence: None
94

Market Rent Comparable #4
Photograph taken June 23, 1995.
Address: 3434 Moorland Road Legal Description: South half of Lot 6, Block 2, Staring's Tonka Wood-Croft,
Hennepin County, Minn. Monthly Rent as of June 1, 1994: $890 Verified with Tenant Proximity to Subject: .06 miles northeast Zoning: R-1, Low Density Residential Lot Size: 12,960 Sq. Ft_ Building Style: Rambler Year Built: 1950 Basement: Ful1/261 Sq. Ft., finished Building Size: 1,391 Sq. Ft. Construction Quality: Fair Condition: Average Garage: 280 Sq. Ft., Attached Central Air: Yes Features: 3 Bedrooms, 1 Full Bath, 1 Fireplace Functional Obsolescence: One Stall Garage Economic Obsolescence: None
95
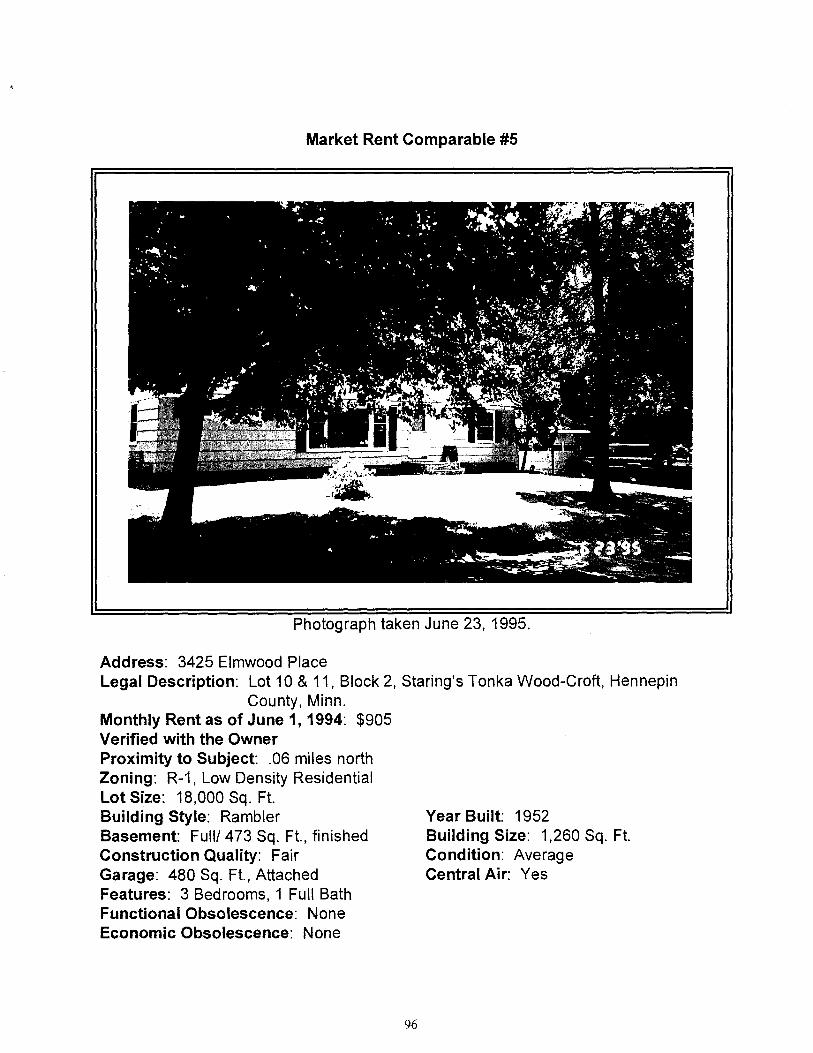
Market Rent Comparable #5
Photograph taken June 23, 1995.
Address: 3425 Elmwood Place Legal Description: Lot 10 & 11, Block 2, Staring's Tonka Wood-Croft, Hennepin
County, Minn. Monthly Rent as of June 1,1994: $905 Verified with the Owner Proximity to Subject: .06 miles north Zoning: R-1, Low Density Residential Lot Size: 18,000 Sq. Ft. Building Style: Rambler
Year Built: 1952
Basement: Full/ 473 Sq. Ft., finished
Building Size: 1,260 Sq. Ft. Construction Quality: Fair
Condition: Average
Garage: 480 Sq. Ft., Attached
Central Air: Yes Features: 3 Bedrooms, 1 Full Bath Functional Obsolescence: None Economic Obsolescence: None
96

MARKET RENT DATA GRID
Subject Comparable #1
Comparable #2
Comparable #3
Comparable #4
Comparable #5
ADDRESS 3507 Elmwood Place
4918 West Lane
3410 Meadow Lane
3611 Druid Lane
3434 Moorland Road
3425 Elmwood Place
MONTHLY UNFURNISHED RENT
N/A $830 $810 $970 $890 $905
LOT SIZE 11,255 Sq. Ft. 10,440 Sq. Ft. 10,070 Sq. Ft. 20,216 Sq. Ft. 12,960 Sq. Ft. 12,960 Sq. Ft.
BUILDING STYLE Rambler Rambler Rambler Rambler Rambler Rambler
YEAR BUILT 1954 1955 1950 1952 1950 1952
BUILDING SIZE 1,118 Sq. Ft. 1,128 Sq. Ft. 1,176 Sq. Ft. 1,368 Sq. Ft. 1,291 Sq. Ft. 1,260 Sq. Ft.
WALK-OUT No NO NO NO NO NO
AIR CONDITIONING YES NO NO NO YES YES
BASEMENT AREA 100% 100% 100% 100% 100% 100%
BASEMENT FINISH 403 Sq. Ft. 282 Sq. Ft. NONE 684 Sq. Ft. 261 Sq. Ft. 473 Sq. Ft.
GARAGE One Stall Attached
Two Stall Attached
One Stall Attached
Two Stall Attached
One Stall Attached
Two Stall Attached
FEATURES 3 Bedrooms 1 Full Bath
2 Fireplaces
3 Bedrooms 1 Full Bath
2 Fireplaces
3 Bedrooms 1 Full Bath 1 Fireplace
3 Bedrooms 1 Full Bath
2 Fireplaces
3 Bedrooms 1 Full Bath 1 Fireplace
3 Bedrooms 1 Full Bath
REMARKS Obsolescence
Functional No Functional Obsolescence
Functional Obsolescence
No Functional Obsolescence
Functional Obsolescence
No Functional Obsolescence
97

SELECTION AND DEVELOPMENT OF UNITS OF COMPARISON
To estimate the monthly rent for the subject property, a standard unit of comparison must be determined. Common units of comparison for residential property include:
1_ Rent per square foot
2. Rent per dwelling
3_ Rent per room
4. Rent per bedroom
Various rental agencies that specialize in single family home leasing, such as Find-A-Home and Home Rental Systems were surveyed to determine the main priorities of prospective tenants. It was determined that the tenants' main priorities were the location, the number of bedrooms, and the amount of rent.
Most renters in need of rental housing are looking for similar amenities as single family home buyers; safe neighborhood, proximity to schools, sound shelter, shopping centers, entertainment, and employment. Single family residences are rented primarily by the unit or dwelling. A contributing factor to this is the scarcity of single family rentals; therefore, the number of choices available to prospective tenants is limited.
Therefore, the most appropriate unit of comparison is deemed to be by the dwelling per month, and all comparable rentals have been analyzed on this basis.
98

MARKET RENT ADJUSTMENT GRID
Comparable #1 Comparable #2 Comparable #3 Comparable #4 Comparable #5
ADDRESS 4918 West Lane 3410 Meadow Lane
3611 Druid Lane 3434 Moorland Road
3425 Elmwood Place
MONTHLY RENT $830 $810 $970 $890 $905
BUILDING SIZE 1,128 Sq. Ft. 1,176 Sq. Ft. 1,368 Sq. Ft. 1,291 Sq. Ft. 1,260 Sq. Ft.
SIZE ADJUSTMENT -$ 5 -$ 29 -$125 -$ 87 -$ 71
BASEMENT FINISH ADJUSTMENT
+ $ 6 + $ 20 - $ 14 + $ 7 - $ 4
CENTRAL AIR CONDITIONING ADJUSTMENT
+$ 9 +$ 9 +$ 9 $ 0 $ 0
FIREPLACE ADJUSTMENT
$ 0 +$ 5 $ 0 +$ 5 +$ 10
GARAGE STALL ADJUSTMENT
- $ 25 $ 0 - $ 25 $ 0 - $ 25
ADJUSTED RENT PER DWELLING
$815 $815 $815 $815 $815
ADJUSTED RENT PER SQ. FT.
$ .72 $ .69 $ .60 $ .63 $ .65
ADJUSTED RENT PER ROOM
$136 $116 $136 $116 $136
# OF ROOMS 6 7 6 7 6
99

SUMMARY OF MARKET RENT ADJUSTMENTS
After analyzing the five rental comparables, the following characteristics were found to be different from the subject properties. The differences include:
• Size • Basement Finish • Central Air Conditioning • Fireplace • Functional Obsolescence (Single Stall Garage)
After consulting with local rental agencies, Realtors, and renters, the following adjustments were deemed appropriate.
Size Adjustment
Differences in square footage can affect the rates for rental housing. The five rental properties used in this analysis ranged in size from 1,128 square feet to 1,368 square feet. A land to building percentage of 30% to 70% (or the land as being 30% of the total property value) was used. The adjustment for square footage per month was based on the following calculations:
Comp # Rent Less 30% for Land
and Features Adjusted
Rent/Sq. Ft. Cents per Sq. Ft.
per month
1 $830 $249.00 $581.00/1128 .5151 2 $810 $243.00 $567.00/1176 .4821 3 $970 $291.00 $679.00/1368 .4963 4 $890 $267.00 $623.00/1291 .4826 5 $905 $271.50 $633.50/1260 .5028
The median is 49.63 cents and the mean is 49.58 cents. When rounded to the nearest cent the adjustment per square foot per month equals 50 cents. All five rental comparables were adjusted downward by 50 cents per square foot.
Basement Finish Adjustment
The adjustment for basement finish was determined by comparing rental comparable #1 and rental comparable #3, which are similar except that #1 has 282 square feet of basement finish and #3 has 684 square feet of basement finish. An adjustment for building size was performed first.
100

Rental #1 Rental #3 w/282 sq. ft. finish w1684 sq. ft. finish
Monthly Unadjusted Rent $830 $970 minus: Building Size Adjustment $125 Monthly Adjusted Rent $825 $845
Property with 684 sq. ft. basement $845 finish Property with 282 sq. ft. basement $825 finish Difference attributed to basement finish $ 20
Difference in basement square footage = 402 Sq. Ft.
Monthly Rent Difference
Difference in Basement Finish = Adjustment per square foot for Basement Finish Square Footage per month
$20 / 402 Sq. Ft. = $.05
Therefore, an adjustment of 5 cents per square foot per month for basement finish will be made to rental #1, #2, #3, #4, and #5.
Central Air Conditioning Adjustment
The subject property has central air conditioning. Rental comparables #4 and #5 also have central air conditioning, the other three rental comparables lack air conditioning. Rental comparables #2 and #4 are similar except for central air conditioning being present in #4 and a lack of central air conditioning in #2. Comparable #4 does have basement finish, so an adjustment for basement finish must be performed first, as well as an adjustment for building size.
Rental #4 Rental #2 Central No Central
Air Conditioning Air Conditioning
Monthly Unadjusted Rent minus: Building Size Adjustment plus: Basement Finish Adjustment Monthly Adjusted Rent
$890 $810 $ 87 $ 29 $ 7 $ 20 $810 $801
Property with Central Air Conditioning $810 Property without Central Air Conditioning $801 Difference Attributed to Central Air Conditioning $ 9
Therefore, rentals #1, #2, and #3, will be adjusted upward $9 per month. Fireplace Adjustment
101
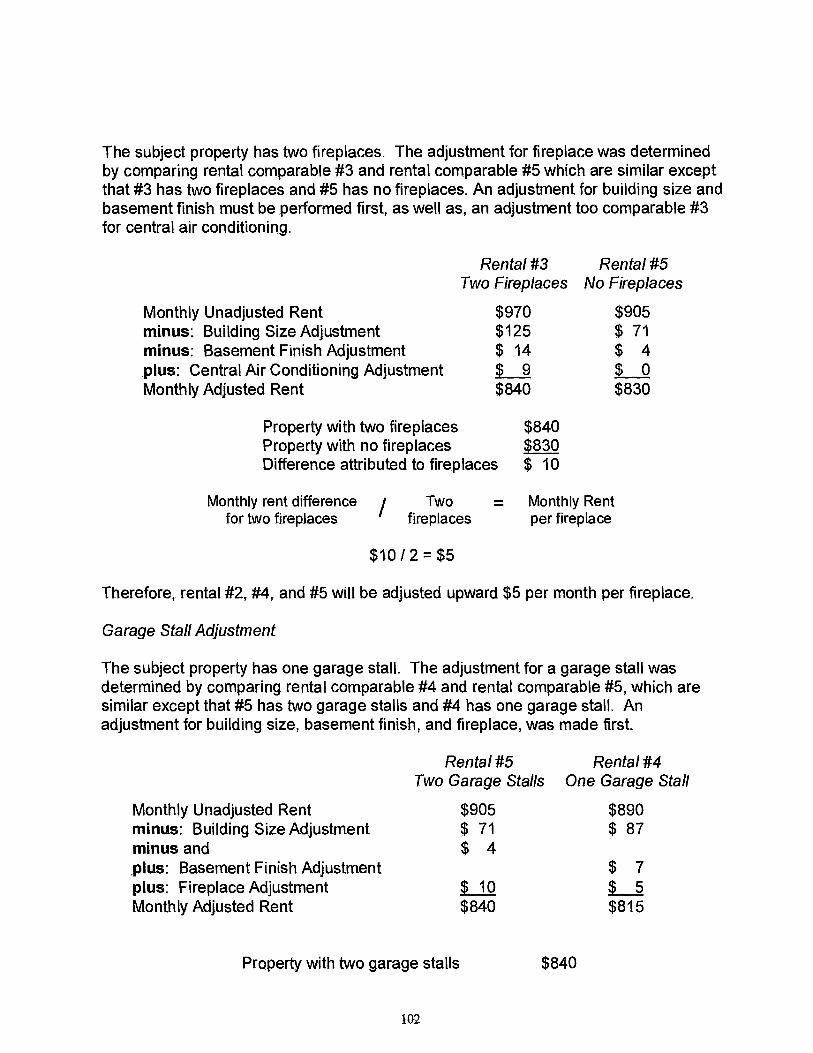
The subject property has two fireplaces. The adjustment for fireplace was determined by comparing rental comparable #3 and rental comparable #5 which are similar except that #3 has two fireplaces and #5 has no fireplaces. An adjustment for building size and basement finish must be performed first, as well as, an adjustment too comparable #3 for central air conditioning.
Monthly Unadjusted Rent minus: Building Size Adjustment minus: Basement Finish Adjustment plus: Central Air Conditioning Adjustment Monthly Adjusted Rent
Rental #3 Two Fireplaces
Rental #5 No Fireplaces
$970 $905 $125 $ 71 $ 14 $ 4
$ 0 $840 $830
Property with two fireplaces $840 Property with no fireplaces $830 Difference attributed to fireplaces $ 10
Monthly rent difference / Two = Monthly Rent for two fireplaces fireplaces per fireplace
$10 / 2 = $5
Therefore, rental #2, #4, and #5 will be adjusted upward $5 per month per fireplace.
Garage Stall Adjustment
The subject property has one garage stall. The adjustment for a garage stall was determined by comparing rental comparable #4 and rental comparable #5, which are similar except that #5 has two garage stalls and #4 has one garage stall. An adjustment for building size, basement finish, and fireplace, was made first.
Monthly Unadjusted Rent minus: Building Size Adjustment minus and plus: Basement Finish Adjustment plus: Fireplace Adjustment Monthly Adjusted Rent
Rental #5 Two Garage Stalls
Rental #4 One Garage Stall
$905 $890 $ 71 $ 87 $ 4
$ 7 $ 10 $ 5 $840 $815
Property with two garage stalls $840
102

Property with one garage stall $815 Difference attributed to one garage stall $ 25
Therefore, rental #1, #3, and #5 will be adjusted downward $25 per month for lack of a second garage stall.
Based on this information most emphasis was placed on rental comparable #4. Rental comparable #4 was chosen as the most comparable rental because of its proximity to the subject property, the number of adjustments, and a single stall garage. Therefore, the monthly unfurnished market rent for the subject property as of June 1, 1994, is estimated to be:
Eight Hundred Fifteen Dollars
($815)
1Q3

INDICATED VALUE BY THE INCOME APPROACH
Two separate analyses were completed; first, the development of a gross rent multiplier, and second, the determination of the monthly market rent of the subject property.
Five comparable rental sales indicated a gross rent multiplier of 126. Five separate properties that had been rented on June 1, 1994, were analyzed to determine the monthly market rent. It was determined that the monthly unfurnished market rent for the subject property as of the date of the appraisal is $815.
The final procedure of the income approach is to multiply the estimated market rent for the subject property by the estimated gross rent multiplier, to arrive at the estimated market value.
$815 Monthly Rent X
126 Gross Rent Multiplier
Equals
$102,690 say $102,700
Therefore, based on the analysis of five comparable rental properties, it is the appraisers' opinion that the value of the subject property, as indicated by the income approach as of June 1, 1994, is:
One Hundred Two Thousand Seven Hundred Dollars
($102,700)
104

APPLICATION OF THE SALES COMPARISON APPROACH
In the sales comparison approach, "value is estimated by analyzing sale prices of similar properties recently sold."16 This approach to value is based on the principle of substitution, which states that a property's value tends to be set by the cost of acquiring an equally desirable substitute. This approach also relies on the concept of value in exchange, which measures under market conditions what informed purchasers would offer for a property given the comparisons they make and the alternatives available for consideration. This approach gives a direct indication of the actions of buyers and sellers in the real estate market.
The sales comparison approach is the most reliable of the three approaches to value in estimating values of single family properties. The key to reliability of the sales comparison approach is directly related to the adequacy of the market sales information and the degree of similarity of those sales to the subject property. When comparable sale properties have been located, adjustments must be made to those properties for differences between the factors that were considered in examining the comparable sales. Typical adjustments include the following:
1. Time of Sale 2. Location 3. Terms and /or conditions of sale 4. Physical characteristics 5. Age and condition of improvements
Adjustments are always made to the comparable sale, never to the subject property. The total adjustment for each comparable is the sum of several individual items adjusted for in each sale. When properly adjusted, the sales comparison approach offers a direct indication of the actions of buyers and sellers in the real estate market.
In the sales comparison approach, appraisers estimate a price per unit. The unit of comparison may be the property as a whole or some smaller measurement of size, considering that the subject property and the comparable properties are single family residences. The units of comparison that are most commonly used and analyzed will include:
1. per dwelling 2. per square foot of building 3. per room
In determining an appropriate unit of comparison for the subject property, the rate per room was deemed the least reliable. The market does not value or rate all rooms of a home equally. It is also doubtful that a potential buyer would actually calculate a rate per square foot without taking other items, such as location, overall condition of the
105

property, kitchen and bath quality, etc., into consideration. Most buyers and sellers of single family residential properties purchase a home based on the property as a whole therefore, the most appropriate unit of comparison is per dwelling unit.
A search of the subject and surrounding neighborhoods revealed six sales of residential properties that would be considered similar to the subject property. The subject property is typical of many of the homes in the neighborhood, and the supply and demand appear to be in balance. Highest and best use for all the comparable properties is their present use -- single family dwellings.
The following pages contain photographs and descriptive information of the comparable properties. Exhibit R of the Addenda is a map showing the location of the sales.
106
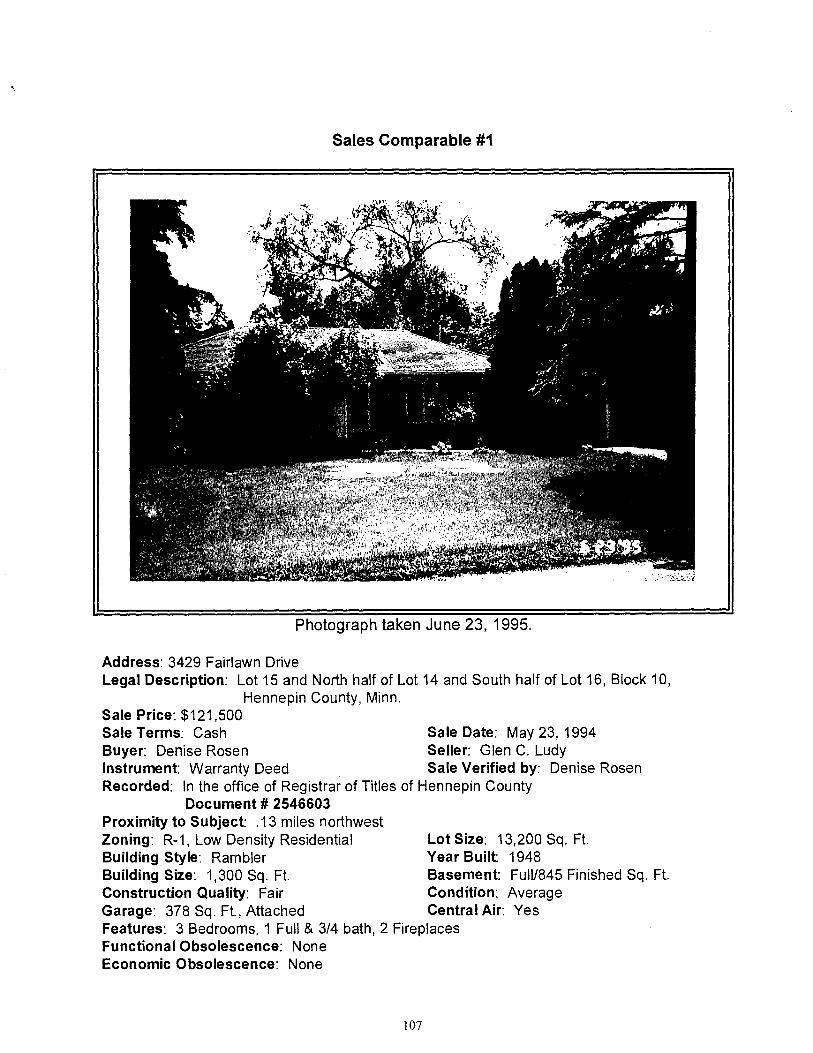
Sales Comparable #1
Photograph taken June 23, 1995.
Address: 3429 Fairlawn Drive Legal Description: Lot 15 and North half of Lot 14 and South half of Lot 16, Block 10,
Hennepin County, Minn. Sale Price: $121,500 Sale Terms: Cash Sale Date: May 23, 1994 Buyer: Denise Rosen Seller: Glen C. Ludy Instrument: Warranty Deed Sale Verified by: Denise Rosen Recorded: In the office of Registrar of Titles of Hennepin County
Document # 2546603 Proximity to Subject: .13 miles northwest Zoning: R-1, Low Density Residential Lot Size: 13,200 Sq. Ft. Building Style: Rambler Year Built: 1948 Building Size: 1,300 Sq. Ft. Basement: Full/845 Finished Sq. Ft Construction Quality: Fair Condition: Average Garage: 378 Sq. Ft, Attached Central Air: Yes Features: 3 Bedrooms, 1 Full & 3/4 bath, 2 Fireplaces Functional Obsolescence: None Economic Obsolescence: None
1 07

Sales Comparable #2
Photograph taken June 23, 1995.
Address: 3511 Elmwood Place Legal Description: Lot 33 except the North 30 feet front and rear thereof, Block 3,
Staring's Tonka Wood-Croft, Hennepin County, Minn. Sale Price: $96,000 Sale Date: February 2, 1992 Sale Terms: FHA Financing; seller paid zero points Buyer: David J. Hermes & Sandra J. Ypparila Seller: James R. & Marjorie Briese Instrument: Warranty Deed Sale Verified by: David Hermes Recorded: In the office of Registrar of Titles of Hennepin County
Document # 2249719 Proximity to Subject: .01 miles south (next door) Zoning: R-1, Low Density Residential Lot Size: 11,610 Sq. Ft. Building Style: Rambler Year Built: 1954 Building Size: 1,132 Sq. Ft Basement Full/587 Finished Sq. Ft. Construction Quality: Fair Condition: Average Garage: 240 Sq. Ft., Attached Central Air: No Features: 3 Bedrooms, 1 Full & 3/4 bath, 2 Fireplaces, Glazed porch Functional Obsolescence: One Stall Garage Economic Obsolescence: None
108

Sales Comparable #3
Photograph taken June 23, 1995.
Address: 3648 HazeImoor Place Legal Description: Lot 8 and South Westerly half front and rear of Lot 7, Block 7, Staring's
Tonka Wood-Croft, Hennepin County, Minn. Sale Price: $101,180 Sale Date: May 23, 1991 Sale Terms: Conventional Financing, Seller paid $1,890 in points Buyer: Rachel H. Mackay Seller: Robert K. Elsiew & Shari S. Zschocher Instrument: Warranty Deed Sale Verified by: Rachel Mackay Recorded: In the office of Registrar of Titles of Hennepin County
Document # 2190859 Proximity to Subject: .25 miles southwest Zoning: R-1, Low Density Residential Lot Size: 11,700 Sq. Ft. Building Style: Rambler Year Built: 1954 Building Size: 1,138 Sq. Ft. Basement Fu11/569 Finished Sq. Ft Construction Quality: Fair Condition: Average Garage: 440 Sq. Ft., Attached Central Air: No Features: 3 Bedrooms, 1 Full & 3/4 bath, 2 Fireplaces, Glazed porch Functional Obsolescence: None Economic Obsolescence: None
109

Sales Comparable #4
Photograph taken June 23, 1995.
Address: 3516 The Mall Legal Description: Lot 4 and Northerly half both front and rear of Lot 5, Block 17,
Staring's Tonka Wood-Croft, Hennepin County, Minn. Sale Price: $112,800 Sale Date: March 27, 1994 Sale Terms: Conventional Financing; Seller paid zero points Buyer: David G. Mischio & Amy E. Lovdahl Seller: Paul M. & Sharon C. Spiler Instrument: Warranty Deed Sale Verified by: David Mischio Recorded: In the office of the Registrar of Titles of Hennepin County
Document # 2550848 Proximity to Subject: .19 miles west Zoning: R-1, Low Density Residential Lot Size: 11,610 Sq. Ft. Building Style: Rambler Year Built: 1949 Building Size: 1,268 Sq. Ft. Basement Fu11/285 Finished Sq. Ft Construction Quality: Fair Condition: Average Garage: 240 Sq. Ft, Attached Central Air: Yes Features: 3 Bedrooms, 1 Full & 3/4 bath, 2 Fireplaces Functional Obsolescence: One Stall Garage Economic Obsolescence: None
110
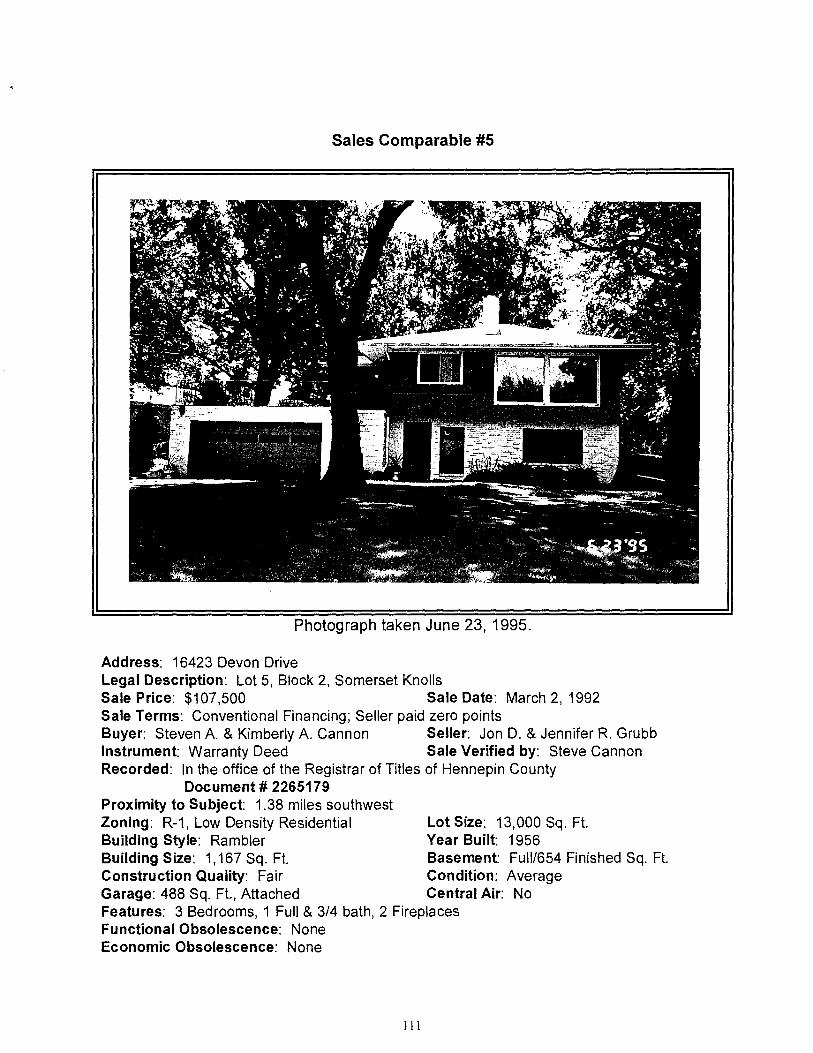
Sales Comparable #5
Photograph taken June 23, 1995.
Address: 16423 Devon Drive Legal Description: Lot 5, Block 2, Somerset Knolls Sale Price: $107,500 Sale Date: March 2, 1992 Sale Terms: Conventional Financing; Seller paid zero points Buyer: Steven A. & Kimberly A. Cannon Seller: Jon D. & Jennifer R. Grubb Instrument: Warranty Deed Sale Verified by: Steve Cannon Recorded: In the office of the Registrar of Titles of Hennepin County
Document # 2265179 Proximity to Subject: 1.38 miles southwest Zoning: R-1, Low Density Residential Lot Size: 13,000 Sq. Ft. Building Style: Rambler Year Built: 1956 Building Size: 1,167 Sq. Ft. Basement Fu11/654 Finished Sq. Ft Construction Quality: Fair Condition: Average Garage: 488 Sq. Ft, Attached Central Air: No Features: 3 Bedrooms, 1 Full & 3/4 bath, 2 Fireplaces Functional Obsolescence: None Economic Obsolescence: None
Ill

Sales Comparable #6
Photograph taken June 23, 1995.
Address: 16204 Tonkaway Road Legal Description: Lot 3, Block 3, Rearrangement of Lots 29,30,31,32, and 33, Tonkawood Sale Price: $107,500 Sale Date: April 30, 1993 Sale Terms: Conventional Financing; Seller paid zero points Buyer: Jennifer L. Robb Seller: Barry J. & Deborah A. Todd Instrument: Warranty Deed Sale Verified by: Jennifer Robb Recorded: In the office of the Registrar of Titles of Hennepin County
Document # 6129199 Proximity to Subject: .13 miles northeast Zoning: R-1, Low Density Residential Lot Size: 12,240 Sq. Ft. Building Style: Rambler Year Built: 1952 Building Size: 1,198 Sq. Ft. Basement Ful1/432 Finished Sq. Ft Construction Quality: Fair Condition: Average Garage: 300 Sq. Ft, Tuckunder Central Air: Yes Features: 3 Bedrooms, 1 Full & 3/4 bath, 2 Fireplaces Functional Obsolescence: One Stall Garage Economic Obsolescence: None
112

SALES COMPARISON APPROACH DATA GRID
Subject Comparable #1 Comparable #2 Comparable #3 Comparable #4 Comparable #6 Comparable #6
ADDRESS 3507 Elmwood Place
3429 Fairlawn Drive
3511 Elmwood Place
3648 Haze!moor Place
3516 The Mall 16423 Devon Drive
16204 Tonkaway Road
SALE PRICE N/A $121,500 $ 96,000 $101,180 $112,800 $107,500 $107,500
SALE DATE N/A 5/1994 2/1992 5/1991 3/1994 3/1992 4/1993
LOT SIZE 11,160 Sq. Ft. 13,200 Sq. Ft. 11,610 Sq. Ft. 11,700 Sq. Ft. 11,610 Sq. Ft. 13,000 Sq. Ft. 12,240 Sq. Ft.
BUILDING STYLE Rambler Rambler Rambler Rambler Rambler Rambler Rambler
YEAR BUILT 1954 1948 1954 1954 1949 1956 1952
BUILDING SIZE 1,118 Sq. Ft. 1,300 Sq. Ft. 1,132 Sq. Ft. 1,138 Sq. Ft. 1,268 Sq. Ft. 1,167 Sq. Ft. 1,198 Sq. Ft.
BASEMENT AREA 100% 100% 100% 100% 100% 100% 100%
BASEMENT FINISH 403 Sq. Ft. 845 Sq. Ft. 587 Sq. Ft. 569 Sq. Ft. 285 Sq. Ft. 654 Sq. Ft. 432 Sq. Ft.
CENTRAL AIR CONDITIONING
Yes Yes No No Yes No Yes
CONDITION Average Average Average Average Average Average Average
GARAGE 236 Sq. Ft. One Stall
378 Sq. Ft. Two Stall
240 Sq. Ft. One Stall
440 Sq. Ft. Two Stall
240 Sq. Ft. One Stall
488 Sq. Ft. Two Stall
300 Sq. Ft. One Stall
FEATURES 3 Bedrooms 1 Full Bath
2 Fireplaces
3 Bedrooms 1 Full & 3/4 Bath
2 Fireplaces
3 Bedrooms 1 Full & 3/4 Bath
2 Fireplaces Glazed Porch
3 Bedrooms 1 Full & 3/4 Bath
2 Fireplaces Glazed Porch
3 Bedrooms 1 Full & 3/4 Bath
2 Fireplaces
3 Bedrooms 1 Full & 3/4 Bath
2 Fireplaces
3 Bedrooms 1 Full & 3/4 Bath
2 Fireplaces
REMARKS Functional Obsolescence
No Functional Obsolescence
Functional Obsolescence
No Functional Obsolescence
Functional Obsolescence
No Functional Obsolescence
Functional Obsolescence
113

SUMMARY OF SALES COMPARISON ADJUSTMENTS
In analyzing the six comparable sales, the following characteristics were found to be the same or similar for the subject and for all comparables.
No adjustments were necessary:
• All comparables are in the subject neighborhood, except one. Most of the comparables are within a couple of blocks of one another. One sale is in a comparable neighborhood to the subject neighborhood.
• Current zoning is R-1, Low Density Residential District. • Highest and best use is single family residential. • Dwelling style and construction are similar. • The condition and effective ages are similar. • The floor plans are similar. • Number of bedrooms is the same.
The differences include:
• Financing terms • Date of sale • Building size • Actual age • Lot size • Garage size • Finished lower level • Air Conditioning • Glazed Porch • Basement Bath
After analyzing the comparable sales and consulting with area Realtors, buyers, and sellers, the following adjustments were deemed appropriate.
Financing Adjustment
In comparing the six sales, an adjustment was made to one of the six sales based on the points that the seller paid for the buyer to obtain financing. This compensation paid by the seller was included in the sales price. This financing adjustment is made first to derive the cash equivalent (or cash to the seller) sale price as of the date of the appraisal. Comparable #3 was purchased with conventional financing with the seller paying points, thus the adjustment of $1,890.
114

DETERMINATION OF TIME ADJUSTMENT
The time adjustment is determined through the analysis of repeat sales. These are properties that were sold and then re-sold at a later date. The change in market price provides an indication of inflation or deflation in the residential market over a specific period of time. The six properties selected in this analysis were unchanged between the first and second sales. It is important to only include sales that have not been changed by remodeling, redecorating, additions, or extensive repair or deferred maintenance.
Twenty-nine sales were examined that occurred between January, 1990 to June, 1994. All of the properties were not located within the subject neighborhood. Care was taken to select the paired sales that most closely matched the subject in comparability of style, neighborhood, and features.
The time adjustment grid reveals a relatively close range of 4.61 percent to 6.21 percent increase in value annually. Most weight was given to comparable #2, which is closest in proximity and features to the subject property. From these repeat sales and through conversations with local real estate brokers and appraisers, a time adjustment of 5.80 percent annually is selected.
Hs

TIME ADJUSTMENT GRID
ADDRESS 12103 Sunrise Lane
3516 Lowell Street
16422 Devon Drive
5420 Kimberly Road
3626 Woodcroft Drive
15315 Skyview Drive
BUILDING STYLE Rambler Rambler Rambler Rambler Rambler Rambler
BUILDING SIZE 1,092 Sq. Ft. 928 Sq. Ft. 1,271 Sq. Ft. 1,248 Sq. Ft. 1,585 Sq. Ft. 1,092 Sq. Ft.
YEAR BUILT 1953 1948 1957 1957 1951 1958
LOT SIZE 11,300 Sq. Ft. 14,764 Sq. Ft. 15,000 Sq. Ft. 18,425 Sq. Ft. 15,594 Sq. Ft. 14,976 Sq. Ft.
GARAGE 1 Stall Detached
2 Stall Detached
2 Stall Attached
1 Stall Tuckunder
2 Stall Attached
2 Stall Attached
FIRST SALE DATE
September, 1993 January, 1994 May, 1994 April, 1994 July, 1993 March, 1993
FIRST SALE PRICE
$ 93,000 $102,500 $121,000 $115,900 $113,000 $ 93,750
SECOND SALE DATE
October, 1990 May, 1991 January, 1993 July, 1990 November, 1991 December, 1991
SECOND SALE PRICE
$ 81,900 $ 88,750 $114,000 $ 95,600 $103,000 $ 87,000
PERCENT CHANGE 13.55% 15.49% 6.14% 21.23% 9.71% 7.76%
TIME DIFFERENCE (in months)
35 32 16 45 20 15
APPRECIATION (per month)
.39% .48% .38% .47% .49% .52%
ANNUAL APPRECIATION
4.65% 5.81% 4.61% 5.66% 5.83% 6.21%
Range Mean Median
Annual Appreciation 4.61% - 6.21% 5.46% 5.74%
116
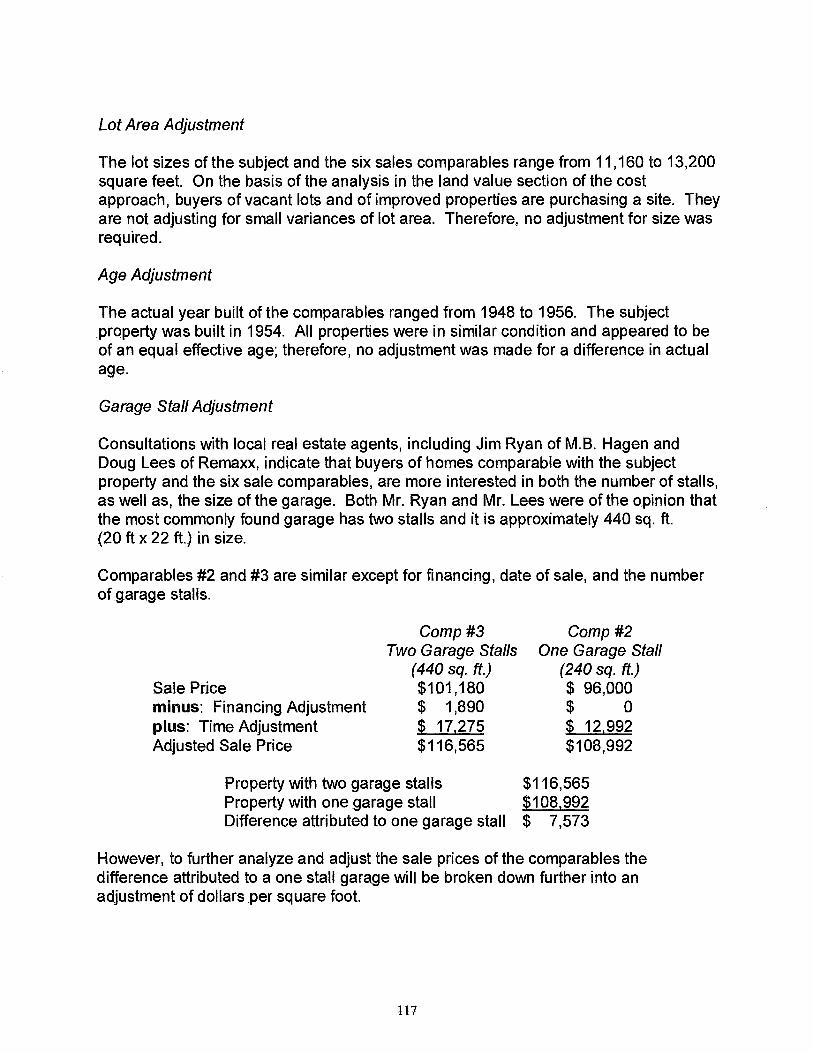
Lot Area Adjustment
The lot sizes of the subject and the six sales comparables range from 11,160 to 13,200 square feet. On the basis of the analysis in the land value section of the cost approach, buyers of vacant lots and of improved properties are purchasing a site. They are not adjusting for small variances of lot area. Therefore, no adjustment for size was required.
Age Adjustment
The actual year built of the comparables ranged from 1948 to 1956. The subject property was built in 1954. All properties were in similar condition and appeared to be of an equal effective age; therefore, no adjustment was made for a difference in actual age.
Garage Stall Adjustment
Consultations with local real estate agents, including Jim Ryan of M.B. Hagen and Doug Lees of Remam, indicate that buyers of homes comparable with the subject property and the six sale comparables, are more interested in both the number of stalls, as well as, the size of the garage. Both Mr. Ryan and Mr. Lees were of the opinion that the most commonly found garage has two stalls and it is approximately 440 sq. ft. (20 ft x 22 ft.) in size.
Comparables #2 and #3 are similar except for financing, date of sale, and the number of garage stalls.
Comp #3
Comp #2 Two Garage Stalls One Garage Stall
(440 sq. ft.)
(240 sq. ft.) Sale Price minus: Financing Adjustment plus: Time Adjustment Adjusted Sale Price
$101,180 $ 96,000 $ 1,890 0 $ 17,275 $ 12,992 $116,565 $108,992
Property with two garage stalls $116,565 Property with one garage stall $108,992 Difference attributed to one garage stall $ 7,573
However, to further analyze and adjust the sale prices of the comparables the difference attributed to a one stall garage will be broken down further into an adjustment of dollars per square foot.
117

Property with two garage stalls 440 Sq. Ft. Property with one garage stall 240 Sq. Ft. Difference of garage stall square footage 200 Sq. Ft.
Sale Price Difference of / Difference of Garage = Adjustment per One Garage Stall Stall Square Footage Square Foot
$7,573 / 200 Sq. Ft. = $37.87
Therefore, Comparables #1, #3, #5, and #6 were adjusted downward $37.87 per square foot of additional garage area. Adjustments to Comparables #2 and #4 for $151 are so small that it is doubtful that the market would react to such small differences.
Basement Finish Adjustment
Comparables #1 and #4 are similar except for the date of sale, garage stall, and the amount of basement finish.
Sale Price plus: Time Adjustment minus: Garage Stall Adjustment Adjusted Sale Price
Comp #1 w1845 sq. ft. finish
Comp #4 w/285 sq. ft. finish
$121,500 $112,800 0 $ 1,090
$ 5,377 0 $116,123 $113,890
Property with 845 sq. ft. basement finish $116,123 Property with 285 sq. ft. basement finish $113,890
Difference attributed to basement finish $ 2,233
Difference in basement square footage = 560 Sq. Ft.
Sale Price Difference / Difference in Basement = Adjustment per for Basement Finish Finish Square Footage Square Foot
$2,233 / 560 Sq. Ft. = $3.99 Sq. Ft.
The adjustment for amount of basement finish is calculated by taking the difference in square foot of finish times the dollars per square foot found in the paired sales analysis described above.
All the sales comparables, except Comparable #6, were adjusted $3.99 per square foot of basement finish. Comparables #1, #2, #3, and #5, were adjusted downward and comparable #4 was adjusted upward. An adjustment to Comparable #6 of $116 for 29 sq. ft. of additional finishing is so minimal that the market would not perceive it.
118

Air Conditioning Adjustment
The subject property has central air conditioning. Comparable sales #5 and #6 were used to determine the adjustment amount. The comparables are similar except for, date of sale, garage stalls, and basement finish.
Sale Price plus: Time Adjustment minus: Garage Stall Adjustment minus: Basement Finish Adjustment Adjusted Sale Price
Comp #6 central air conditioning
Comp #5 no central air conditioning
$107,500 $107,500 $ 6,754 $ 14,028 $ 2,424 $ 9,543 $ 0 $ 1,001 $111,830 $110,984
Property with central air conditioning $111,830 Property with no central air conditioning $110,984 Difference attributed to central air conditioning $ 846
Comparable sales #2, #3, and #5 were each adjusted upward by $846.
Glazed Porch Adjustment
Sales Comparables #2 and #3 have glazed porches, the subject property does not. Comparables #1, #4, #5, and #6 do not have glazed porches.
In determining the appropriate amount for the adjustment, paired sales with the glazed porch being the sole dissimilar item were searched out in order to arrive at a market determined adjustment.
Glazed Building Building Sale Sale Porch Address Style Size Garage Date Price
Yes 1014 Sunset Dr. S. Rambler 1,132 Sq. ft. 2 Car 8/1993 $105,000 No 4932 Clear Spring Rd. Rambler 1,140 Sq. ft 2 Car 10/1993 $104,000
Since the glazed porch is the only difference in sale price, the $1,000 difference in sale price is attributed to that difference. This difference is further enhanced to approximately $1,015, when the 5.80% annual time adjustment is applied to the sale at 1014 Sunset Drive South.
The glazed porch in the paired sales analysis is 140 sq. ft. Sale Price Difference / Glazed Porch = Adjustment per
for Glazed Porch Square Footage Square Foot
$1,015 /140 Sq. Ft = $7.25 Sq. Ft.
119

Comparables #2 and #3 were adjusted downward by $7.25 per square foot.
Main Level Building Size (GBA) Adjustment
The subject property has 1,118 square feet of living area on the main level (GBA). The sale comparables range from 1,132 to 1,300 square feet, a 168 square foot range in which the subject property is smaller than the comparables by as little as 14 square feet.
Comparables #2 and #4 are similar except for the date of sale, basement finish, air conditioning, glazed porch, and main level building size (GBA).
Sale Price plus: Time Adjustment plus & minus: Basement Finish Adjustment plus: Air Conditioning Adjustment minus: Glazed Porch Adjustment Adjusted Sale Price
Comp #4 GBA--1,268 sq. ft.
Comp #2 GBA--1,132 sq. ft.
$112,800 $ 96,000 $ 1,090 $ 12,992 $ 471
$ 734 0 $ 846 0 $ 1,305
$114,361 $107,799
Property with 1,268 sq. ft. GBA $114,361 Property with 1,132 sq. ft. GBA $107,799 Difference attributed to GBA $ 6,562
Difference in GBA square footage = 136 Sq. Ft.
Sale Price / Difference in GBA = Adjustment per Difference for GBA Square Footage Square Foot
$6,562 / 136 Sq. Ft. = $48.25 Sq. Ft.
The amount of adjustment for main level building size (GBA) is calculated by taking the difference in square foot multiplied by the dollars per square foot found in the paired sales analysis described above.
All sales comparables were adjusted. Comparables #1, #2, #3, #4, #5, and #6, were adjusted downward.
3/4 Basement Bath Adjustment
All the sales comparables have a 3/4 bath in the basement. The subject property does not.
120
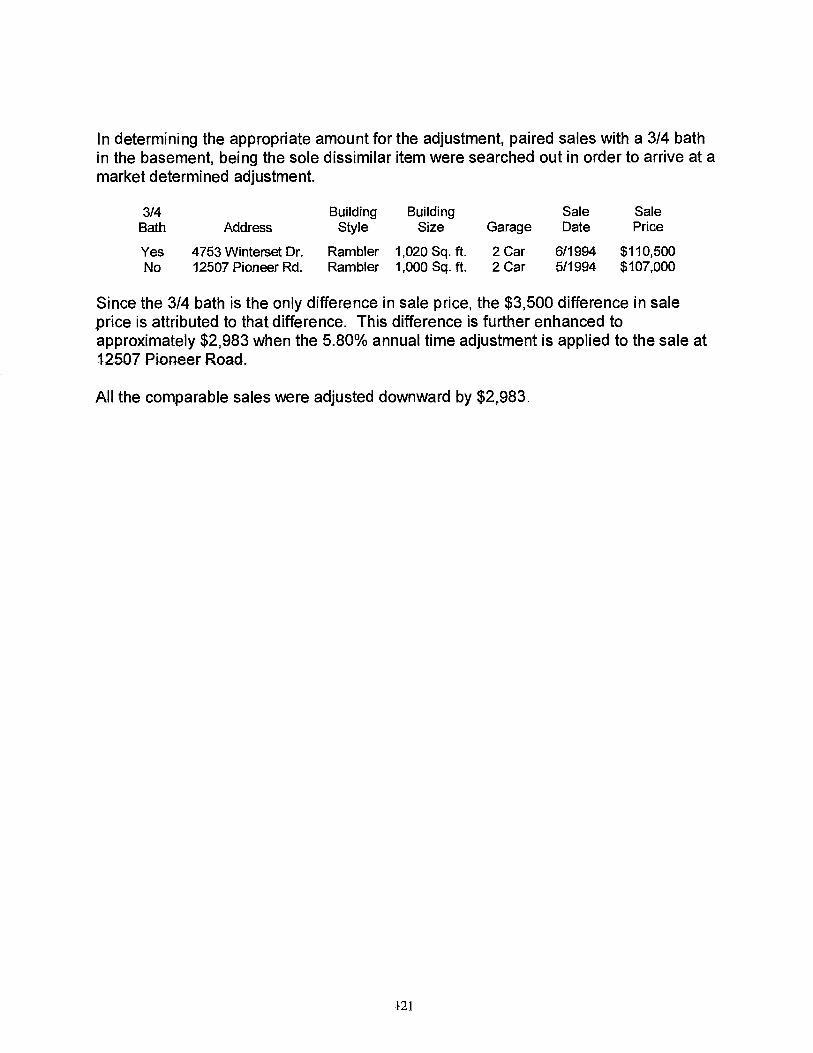
In determining the appropriate amount for the adjustment, paired sales with a 3/4 bath in the basement, being the sole dissimilar item were searched out in order to arrive at a market determined adjustment.
3/4 Building Building Sale Sale Bath Address Style Size Garage Date Price
Yes 4753 Winterset Dr. Rambler 1,020 Sq. ft. 2 Car 6/1994 $110,500 No 12507 Pioneer Rd. Rambler 1,000 Sq. ft_ 2 Car 5/1994 $107,000
Since the 3/4 bath is the only difference in sale price, the $3,500 difference in sale price is attributed to that difference. This difference is further enhanced to approximately $2,983 when the 5.80% annual time adjustment is applied to the sale at 12507 Pioneer Road.
All the comparable sales were adjusted downward by $2,983.
121
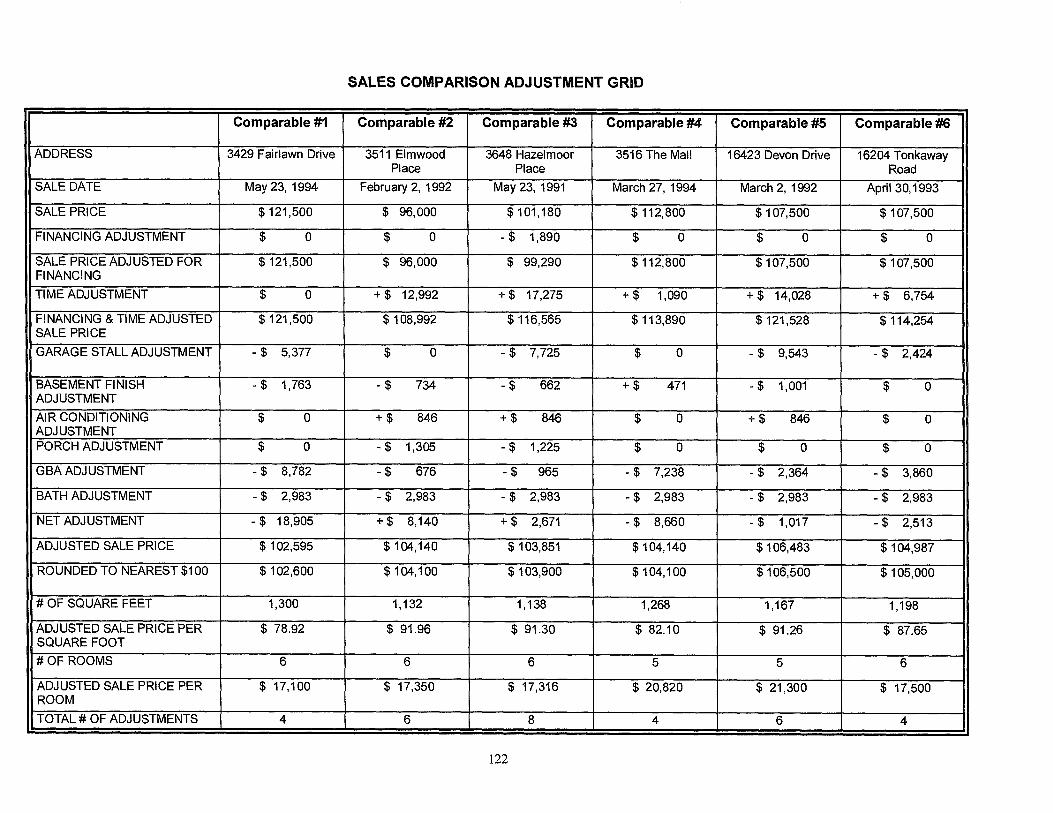
SALES COMPARISON ADJUSTMENT GRID
Comparable #1 Comparable #2 Comparable #3 Comparable #4 Comparable #5 Comparable #6
ADDRESS 3429 Fairlawn Drive 3511 Elmwood Place
3648 Hazelmoor Place
3516 The Mall 16423 Devon Drive 16204 Tonkaway Road
SALE DATE May 23, 1994 February 2, 1992 May 23, 1991 March 27, 1994 March 2, 1992 April 30,1993
SALE PRICE $ 121,500 $ 96,000 $ 101,180 $ 112,800 $ 107,500 $ 107,500
FINANCING ADJUSTMENT $ 0 $ 0 - $ 1,890 $ 0 $ 0 $ 0
SALE PRICE ADJUSTED FOR FINANCING
$ 121,500 $ 96,000 $ 99,290 $ 112,800 $ 107,500 $ 107,500
TIME ADJUSTMENT $ 0 4 $ 12,992 4 $ 17,275 4 $ 1,090 +$ 14,028 +$ 6,754
FINANCING & TIME ADJUSTED SALE PRICE
$ 121,500 $ 108,992 $ 116,565 $ 113,890 $ 121,528 $ 114,254
GARAGE STALL ADJUSTMENT - $ 5,377 $ 0 - $ 7,725 $ 0 - $ 9,543 - $ 2,424
BASEMENT FINISH ADJUSTMENT
-$ 1,763 -$ 734 -$ 662 4 $ 471 -$ 1,001 $ 0
AIR CONDITIONING ADJUSTMENT
$ 0 + $ 846 + $ 846 $ 0 + $ 846 $ 0
PORCH ADJUSTMENT $ 0 - $ 1,305 - $ 1,225 $ 0 $ 0 $ 0
GBA ADJUSTMENT - $ 8,782 - $ 676 - $ 965 - $ 7,238 - $ 2,364 - $ 3,860
BATH ADJUSTMENT - $ 2,983 - $ 2,983 - $ 2,983 - $ 2,983 - $ 2,983 - $ 2,983
NET ADJUSTMENT -$ 18,905 +$ 8,140 4 $ 2,671 -$ 8,660 -$ 1,017 -$ 2,513
ADJUSTED SALE PRICE $ 102,595 $ 104,140 $ 103,851 $ 104,140 $ 106,483 $ 104,987
ROUNDED TO NEAREST $100 $ 102,600 $ 104,100 $ 103,900 $ 104,100 $ 106,500 $ 105,000
# OF SQUARE FEET 1,300 1,132 1,138 1,268 1,167 1,198
ADJUSTED SALE PRICE PER SQUARE FOOT
$ 78.92 $ 91.96 $ 91.30 $ 82.10 $ 91.26 $ 87.65
# OF ROOMS 6 6 6 5 5 6
ADJUSTED SALE PRICE PER ROOM
$ 17,100 $ 17,350 $ 17,316 $ 20,820 $ 21,300 $ 17,500
TOTAL # OF ADJUSTMENTS 4 6 8 4 6 4
122

Indicated Value From The Sales Comparison Approach
The comparable sales were first adjusted for financing terms and then time, thus reaching a sale price adjusted for terms and time. All other adjustments were applied to the adjusted sale price resulting in a net sale amount for each of the six sold comparables. Further analysis was given to yield a net sale price per square foot and net sate price per room for each comparable. A review of these results indicated:
4. Net sale price per dwelling ranged from $102,600 to $106,500 with a median of $104,100.
• Net sale price per square foot ranged from $78.92 to $91.96 with a median of $89.46. $89.46 X 1,118 Sq. Ft. = $100,016.
• Net sale price per room ranged from $17,100 to $21,300 with a median of $17,425. $17,425 X 5 = $87,125.
As stated earlier in this section, the most appropriate unit of comparison is as a property as a whole or per dwelling unit.
Comparable sale #1 was used as a paired sale for the basement finish adjustment. Adjusting this sale to the subject property required four adjustments, including downward adjustments for a garage stall, basement finish, main level building size, and the sale price had a net adjustment of -$18,905. This comparable sale had the least number of adjustments.
Comparable sale #2 was used as a paired sale for the garage stall and main level building size adjustments. Adjusting this sale to the subject property required six adjustments, including an upward time adjustment and a downward garage stall, basement finish, air conditioning, glazed porch, main level building size, and 3/4 basement bath adjustments. The sale price had a net adjustment of +$8,140.
Comparable sale #3 was used as a paired sale for the garage stall adjustment. Adjusting this sale to the subject property required eight adjustments, including downward financing, garage stall, basement finish, glazed porch, main level building size, and 3/4 basement bath adjustments and upward time and air conditioning adjustments. This comparable sale required the most adjustments. The sale price had a net adjustment of +$2,671.
Comparable sale #4 was used as a paired sale for the basement finish and main level building size. Adjusting this sale to the subject property required four adjustments, including upward time and basement finish adjustments and downward garage stall, main level building size, and 3/4 basement bath adjustments. The sale price had a net adjustment of -$8,660.
Comparable sale #5 was used as a paired sale for the air conditioning adjustment. Adjusting this sale to the subject property required six adjustments, including upward time and air conditioning adjustments and downward garage stall, basement finish,
123
main level building size, and 3/4 basement bath adjustments. The sale price had a net adjustment of -$1,017.
Comparable sale #6 was used as a paired sale for the air conditioning adjustment. Adjusting this sale to the subject property required four adjustments, including an upward time adjustment and downward garage stall, basement finish, main level building size, and 3/4 basement bath adjustments. The sale price had a net adjustment of -$2,513_
Comparable sales #2, #4, and #6 appear to be the most comparable to the subject property. Comparable #6 has only four adjustments and is very similar to the subject in age, garage stall, and basement finish. However the least amount of weight was placed on this comparables' adjusted sale price. Comparable #4 also has only four adjustments. Comparable sale #4 has a very small time and basement finish adjustment. However, the building size adjustment is quite sizable. The lot size and garage stall contribute to a higher weight placed on this comparables' adjusted sale price. Comparable sale #2, even with six adjustments, is considered to be the most comparable to the subject property, because of the close proximity, lot size, age, house layout, main level building size, number of garage stalls, and basement finish. The time adjustment, although a significant sum, is very well documented and supported by paired sales, and believed to be reliable. Taking all these factors into consideration, the greatest amount of weight was placed on the adjusted sale price of comparable #2.
Therefore, after taking all of the comparables into account and putting the greatest emphasis on comparable sale #2, the estimated market value by the sales comparison approach for the subject property as of June 1, 1994, is $104,140. Rounded to the nearest $100 the estimated market value equals:
One Hundred Four Thousand One Hundred Dollars
($104,100)
124

CORRELATION AND FINAL ESTIMATE OF VALUE
The purpose of this appraisal is to estimate the market value of the fee simple interest for the subject property as of June 1, 1994. Market value has been defined and the source has been identified. All relevant forces that influence the final estimate of value have been examined throughout this report. A summary of the significant forces is as follows:
• The demand for real estate throughout Minnetonka and in the subject neighborhood has remained strong. The growing population and diverse economic base contribute positively to the market value of the subject property.
• An analysis of the subject neighborhood revealed a stable homogeneous neighborhood with well-maintained homes increasing in market value.
• The subject property is in average condition, and suffers from a loss of value due to reduced utility or desirability attributable to a single stall garage.
• The subject property is equitably assessed and the corresponding real estate tax burden appears to be consistent with comparable properties.
4. An analysis of highest and best use resulted in the appraisers' opinion that the highest and best use of the subject property, as vacant and as improved, is its present use as single family residential.
The cost approach, income approach, and sales comparison approach were used in estimating an indicated value for the subject property. The market value indicated by each of these approaches is as follows:
Cost Approach $110,300 Income Approach $102,700 Sales Comparison Approach $104,100
Each approach is independent of the others, and each is based on a different set of data. Each approach lends credibility to the others in supporting the final estimate of value. In analyzing the values indicated by the three approaches the quantity and quality of data available, the strengths and weaknesses, and relevancy of each approach to the subject property has been considered.
These three methods of valuation rely upon market information available in the local area. The value estimates produced by these methods are independent of each other,
125

some information is shared by one or more of the approaches, lending credibility to each approach in supporting the final estimate of value. A review of each of the valuation methods follows:
Cost Approach
The cost approach to value is based upon the principle of substitution which states that an informed buyer would pay no more than the cost of producing a property with the same utility as the subject property.
The first step in the cost approach, is to estimate the value of the subject site, as if vacant and available to be put to it's highest and best use. This was accomplished through direct sales comparison analysis. The majority of the lots in the subject and adjacent neighborhoods are improved. Four land sales were selected, analyzed, and adjusted with respect to the subject site. Market adjustments were made for time of sale and location, as they related to the property, to arrive at an indicated value for the subject site. The indicated land value of the subject property is believed to be adequately supported and representative of land values in the area.
The second step is to estimate a value for the improvements. Building costs were obtained from Marshall Valuation Services and verified with a local contractor to arrive at an estimated reproduction cost new (RCN).
The third step is to deduct several causes of depreciation from the estimated reproduction cost. The subject property suffers from curable and incurable physical depreciation and curable and incurable functional obsolescence. The estimates for loss in value were determined from market extraction and the observation and judgment of this appraiser.
The cost approach is considered a reliable indicator of value when applied to new improvements that are developed to their highest and best use. When considerable amounts of depreciation have occurred, as in the case of the subject property, the cost approach is not considered completely reliable. This is due to the fact that the estimates of depreciation are the result of observation and judgment, which may not accurately reflect market reactions. The estimates of depreciation, both physical and functional, are measured from the market and cannot accurately measure the buyer-seller reaction and thus are based partly on observation and judgment. Therefore, less importance has been placed on the cost approach. The cost approach does support the other approaches in the final estimate of value.
Income Approach
The income approach is based on the principle of anticipation, Which states that value is the present value of all rights to the future benefits accrued from ownership. It assumes that the informed purchaser would pay no more for a property than the cost of
126

obtaining an income stream of the same size and involving the same risk as that embodied in the subject property.
The income approach, when applied to single family residences, relies on the gross rent multiplier methodology. It compares market rentals and sale prices to arrive at an indication of value. This approach is applicable when there are a sufficient number of comparable properties rented on the current market, and when an adequate volume of reliable verified data exists for comparable rental sales in the local market. As previously stated, there are few single family rental properties located in the subject neighborhood or the City of Minnetonka. Therefore, rental data is scarce and may not reflect the amenities of the property.
The gross rent multiplier (GRM) was calculated for five comparable rental sales by dividing the sales price by the amount of monthly rent (unfurnished). Due to the limited number of rental sales, only one of the rental sales is from the subject neighborhood and the other four rental sales were from comparable neighborhoods. The five comparable rental sales were analyzed and reconciled into an indicated gross rent multiplier for the subject property.
There are only ten known rental properties located within the subject neighborhood. Because of the homogenous neighborhood, most of the homes are comparable to the subject property. Four of the comparable rentals were located in the subject neighborhood and one was located in a comparable neighborhood. Market extraction was used to adjust the five comparable rentals to arrive at an indicated monthly rental (unfurnished) of the subject property. Adjustments were made for building size, basement finish, central air conditioning, fireplaces, and garage stall.
The gross rent multiplier was multiplied by the monthly (unfurnished) rent to obtain an indicated value for the subject property.
Since both sales data and rental data must be analyzed and adjusted for differences, a large margin of error exists. Even the smallest oversight or error in estimating the gross rent multiplier or market rent can have a devastating effect on the estimate of value when they are multiplied.
The income approach is not completely reliable because of the limited amount of rental data for single family homes. Therefore, the least amount of emphasis is placed on the income approach, and it has been primarily used to verify and support the other approaches in the final estimate of value.
Sales Comparison Approach
The sales comparison approach is based on the principle of substitution, which states that a prudent buyer would pay no more for real property than the cost of acquiring an equally desirable substitute on the open market. This approach to value provides an estimate of value for the subject property by comparing it with similar properties that
127

have recently sold. When there is an active market with sufficient quantities of reliable data, this approach is reliable after the data has been verified by authoritative sources. This approach gives a direct indication of the actions of the buyers and sellers in the market.
The first step is to identify and compare similar properties that have recently sold. Six comparable sales were selected. Five of the comparable sales were located in the subject neighborhood and one in a comparable neighborhood. Each of the property sale prices, terms, and conditions of sale were verified.
Adjustments for financing and the date of sale were performed on each sale comparable. The time adjustment was derived from the market and believed to be reliable. The comparable sales and the subject property were analyzed in terms of relevant property characteristics. Adjustments were made to the comparables for differences in physical characteristics to the subject property. These adjustments were market based on the wants and desires of the buyers and sellers. Adjustments were made for garage stall, basement finish, central air conditioning, glazed porch, gross building area, and a 3/4 basement bath.
The adjusted sale price for each comparable was then estimated. This is the price at which the comparable property would have sold, had it possessed the identical characteristics of the subject property at the time of the sale.
The strength of this approach is that it actually draws data from the actions of market buyers and sellers, and places less reliance on subjective opinions and judgments of the appraiser. However, whenever an adjustment is made to a comparable or an appraiser misinterprets market data, this approach is weakened.
The sales comparison approach is the best understood and deemed most reliable by the average informed buyer in the marketplace. If used correctly, this approach provides the strongest indication of value. Therefore, the most emphasis was placed on the sales comparison approach.
Final Value Conclusion
A valuation estimate was derived for the subject property through the three approaches to value. The final values indicated by each of the three approaches have been considered, as well as the strengths and weaknesses inherent in each approach. An average of the three approaches was not used.
A weight was applied to each approach to value based on the appraiser's knowledge of the local market and the property. It is the opinion of this appraiser that a 15 percent weight should be applied to the cost approach, 10 percent weight applied to the income approach, and 75 percent weight applied to the sales comparison approach to determine the final estimated market value.
128

The least amount of weight was placed on the income approach due to the limitations of the gross rent multiplier, as well as the limited availability of rental data. The cost approach was considered less reliable due to the difficulty in estimating accrued depreciation. The most emphasis and reliance has been placed on the sales comparison approach. There was an acceptable level of reliable market data, and the market supported all adjustments made. This estimate is considered to be the best indication of market value.
Cost Approach $110,300 x .15 $ 16,500 Income Approach $102,700 x .10 $ 10,300 Sales Comparison Approach $104,100 x .75 $ 78,100 Weighted Final Estimate of Value $104,900
Therefore, after careful analysis of all the data contained in this report, the inspection of the property, and the judgment of the appraiser, it is my opinion that the estimated market value of the subject property, 3507 Elmwood Place, Minnetonka, Minnesota, as of June 1, 1994, is:
ONE HUNDRED FOUR THOUSAND NINE HUNDRED DOLLARS
($104,900)
129

CERTIFICATION
certify that, to the best of my knowledge and belief:
I have made a personal inspection of the property that is the subject of this report_
I have no present of prospective interest in the property that is the subject of this report, and no personal interest with respect to the parties involved.
The statements of fact contained in this report are true and correct
The reported analysis, opinions, and conclusions are limited only by the reported assumptions and limiting conditions, and is my personal, impartial, and unbiased professional analyses, opinions, and conclusions.
My analysis, opinions, and conclusions were developed, and this report has been prepared, in conformity with the Code of Ethics and Standards of Professional Conduct of the International Association of Assessing Officers, and the Uniform Standards of Professional Appraisal Practice (U.S.PAP.) of the Appraisal Foundation.
My compensation for completing this assignment is not contingent upon the development or reporting of a predetermined value or direction in value that favors the cause of the client, the amount of the value opinion, the attainment of a stipulated result, or the occurrence of a subsequent event directly related to the intended use of this appraisal.
I have no bias with respect to the property that is the subject of this report or to the parties involved with this assignment.
My engagement in this assignment was not contingent upon developing or reporting predetermined results.
No one provided significant professional assistance to the person signing this report.
Date , SAMA
130

EXHIBIT A
SUBJECT PROPERTY PHOTOS (ALL SUBJECT PHOTOS TAKEN ON JUNE 23, 1995)
Looking Easterly (FRONT)
Looking Westerly (REAR)
131

Looking Northerly (SIDE)
Looking Southerly (SIDE)
132
SUBJECT PROPERTY PHOTOS (ALL SUBJECT PHOTOS TAKEN ON JUNE 23, 1995)

Looking Southerly down Elmwood Place at Neighboring Properties
133
Looking Northerly up Elmwood Place at Neighboring Properties
SUBJECT PROPERTY PHOTOS (ALL SUBJECT PHOTOS TAKEN ON JUNE 23, 1995)

NON 11ONEs1EAD dab ilea ti .11
Gro: 'lava
011111111011bil Limb 2001111110
MVP Base Basil Bldg Mach
0.
.4;45
0.87 Ii, 217 . I 11? ii
0.87 2.17
$,4.410 460 .00 30
5.40
:230
2.00 2.40
.4
4,000 1
II'
Otxl:
I I I
..40000
720 512,001r:
4111461/11011*/1“ NomEr.s....30116611140111101110
B/DP Base Base 1 Over Net Dross Net Dross Not Gross
100 2.17 100 2.1 ';
045 0.57 *1.00 2.17 2.1 . 0.45 0.07 2.11 2.11 0.45 0.87 1'' 217
0. 2.17 '..
1.75 2.17
1.78 k.25
1.75 :1 2.3$
2.17 2. 2.17 '2. 2.17 „ .
••4-.481 0.87 'III 2.1/ 0.45' 6.17 1 2.17 I*
:77 2.17
1
•
2.17 2,ti 2:
Net
3. 2. .2. 2.
. 2.
2.2$ ^".
2.
2.30 4.60 AM
:24:
2. 1.50 2.2 2.30 2.30 2.30 2.30(
Hous - Low income st
keiustrk.: Common Area
Vacant Land - A .relment Viiint Commerc „: C
Manual Vacant Lend - Residential • 1....-.. Mobile 11 -um Park Nursing Horne
Non trot Commun Assoc. rust .:.. NV
is to ••• PE
Season -Res./Com. Hmstd. •:. Q • F.esIdential
Residential Fm-Hour/ Act FIF V Fiesidendol LA. Shore • Y Re skientid-Zero Lot Line-DB Y Seasonal-Residential No.
Pars& urn-Homestead
Prop Type
1-Wimple County Property types, Classes & Class Rates 1994 Assessment - Texts Payable 1995
32.000- 40,000 . 20,00ti 50,000 .1111,000
72 000 :
Railroad CorrmcaI Te phone Dia d
Y Double Bungalow Y DissblealFerm-Homestead Y Disabled Joint Tenancy
Entrap-6.8 tone ✓ Farm
Lasport No. T S.S011
20016 Class •••111111 Qualify lot Limited Value Desoulptkal
-.Apartment &isstment Condominium
Y Blind V Blind/Fann-Hornesterd Y Bind Joint :money
Commercial Commack.
2A
4C Sorotity/Ftele Housing 40
3A
-71A 3A 48 -71.11
4A 4C
r 4C
Final: MIN 31.1
Substandard B - >3 Units Substandard: - < 4 Unite This I >3 I >9 Po Triplex Title II <4 Units >9 Pop. ... Utl
Pop. 1.:.:.•V:..i.:. V FHA <4 UnIte <18,000 Pop. :;:•:::: VR:. Y Tree Fenn V Condominium V Cooperative Y Townhouse
It on Perms Lease Lana
>31ir s <10,
:20
•
.30
.60
•
74-7,-.174.•r••••-:
Hms1:1 Nitimokl IA 4A
--TA- 4A 10
3A
IA 18
& 1 Acre Y No neon uous PCrSPQS • Agilcufturat Preserve
4C
4C 3A
40 40 20
1 iA IA
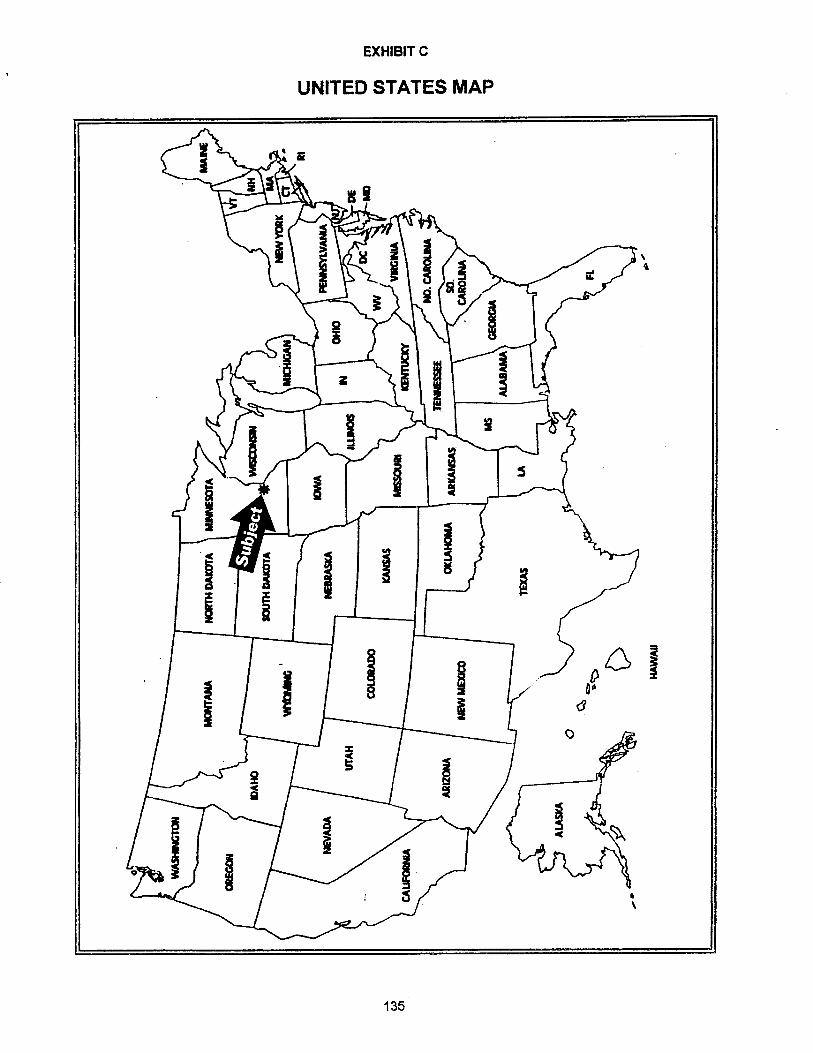
EXHIBIT C
UNITED STATES MAP
135
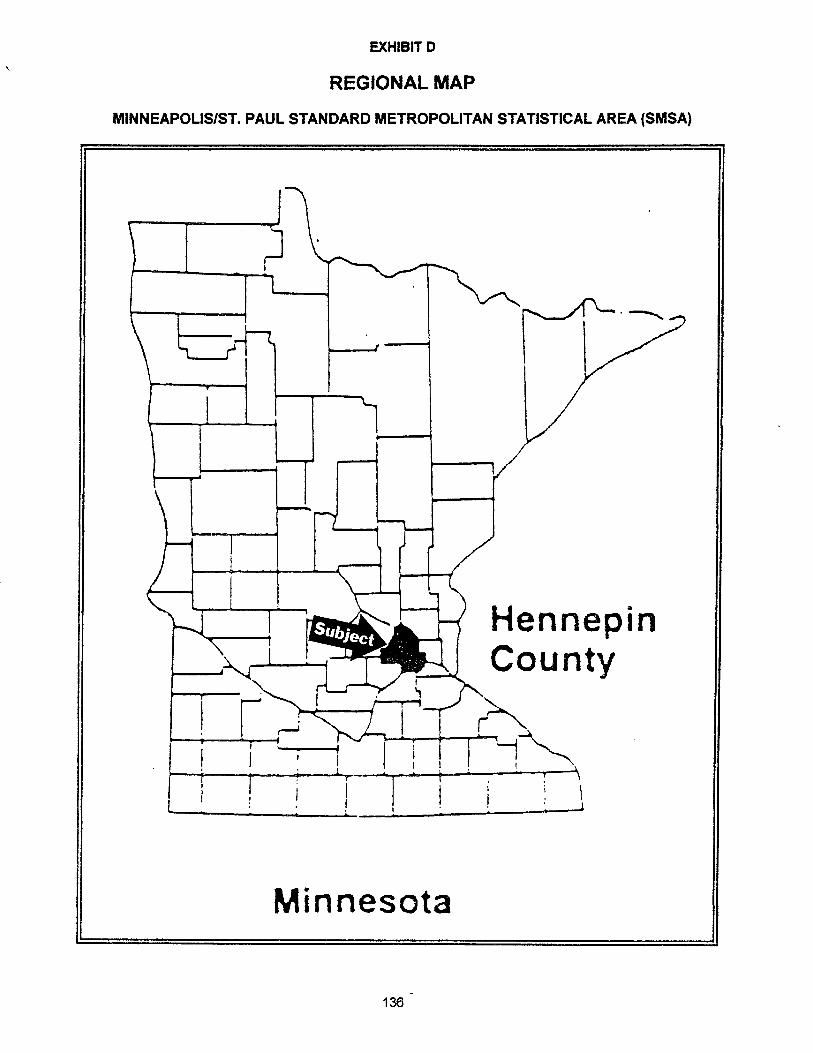
Hennepin County
Subject
4.
EXHIBIT D
REGIONAL MAP
MINNEAPOLIS/ST. PAUL STANDARD METROPOLITAN STATISTICAL AREA (SMSA)
Minnesota •
136
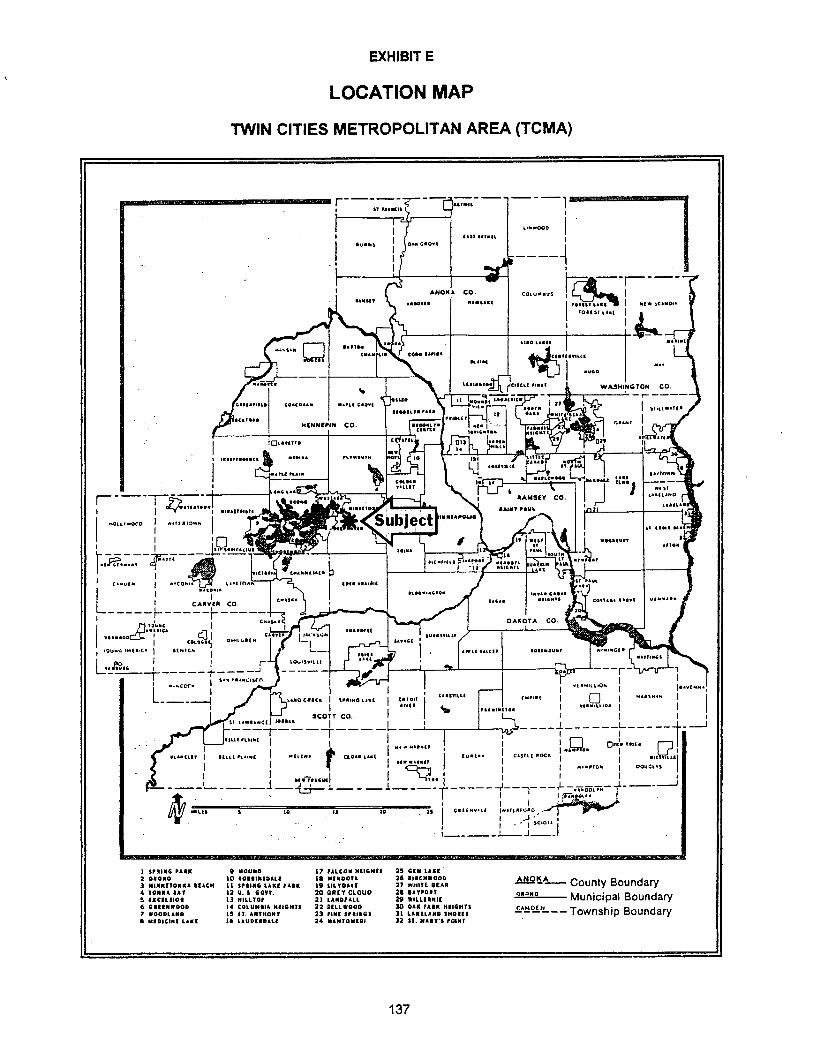
21.4.0THTI
111•1111
EXHIBIT E
LOCATION MAP
TWIN CITIES METROPOLITAN AREA (TCMA)
ST ITSIKIS
loll 1111.111
-1
•
1
ohyT000
1
1
GuTINS OTA G•Ovt
ANOKA CO.
Rums wows.
Itttttt tAat NEW SCAND.
TOTTSI ISA( 4.4_
COIITI•uS
11120
Cieft avast
anssie
•••11.1 111■ 1111*
CUSS I. C. TATISIS
COSCOST• •Tnil Gloat 111111411,111 teal
' "' Cr
..... ST06 rITIIICLI PITTS
000.1•11• •••fin <Mall
PUNT,'
It
WASHINGTON CO.
4IIT/TT
..•TmvTor HILT
fir
Subject itimIAWSLia .01,,,TCIT0 I *MAIO..
I I
I
1:1-Te • T T T 4" " .
I I C41.1■ Ch i .I.Coks• dif MAk
L ,
, CAPIVRK CO.
.100,1
I
I F.
- -.. --. --.... i Ch■Ss•
211114 = t■ I
1111111110013C_I■ I (II 0...1.1/11.
1000ti I.l.,C. I SEPTICh , I
TaiaTG I I r
- - I , S•N /11aNCISCI1
tAltisittI
412.
1 SPRING PARK 9 HOUND 17 PALC011 HEIGHTS 25 GIN LAKE 2 010110 10 11011111110Alf 18 NINOOTA 26 111104111000 3 NINNITONKA REACH 11 SPRING SAKS PARK 19 LI 27 WHITE REAR 4 TONKA MIT 12 5. 1 GOVT. 20 GREY CLOUD 21I SAYPOST 5 11C11.1101 13 HILLTOP 21 LANDFALL 29 "num( 6 G ..... 000 14 COLUNSIA HEIGHTS 22 OIL L 9000 30 OAK PARK HEIGHTS 7 9000LAND 15 IT. ANTHONY 23 Hilt SPRINGS 31 LAMAR!) SHOALS IS AISOIGIKI LARS 16 LAUDIRDALS 24 NANTassioi 32 ST. MARTS tow
SI 11•HtTaITS
, . 3 S0 Cilia SITTING lost I CPI Oil [1 i
SCOTT CO. I 01.6111
IT 110111
ATIOT
ST 'SAL
DAKOTA CO.
nil G•••I TITICTITS
TOSTICHIM o5.17011
T•111.1•STOT
vi•mrsaL,ON I la.1160.•;
ra•■02A010 I I I Cil I msTipTiri
I I I L
WIligalT I I Oat', I TITS
I 000011S al
I me
I I _-/
Aw1.06
.1.1301/.1 I mosoL•4
Ars/ riA County Boundary ORONO Municipal Boundary -c-A-ttut--- Township Boundary
1.111 VA tit
ST ,......cd -- _______F L I 1
TM( /SAW 1 I ■
I I
CIO*. "-TT I . I
NSA-Till, I MAL II,ToTT I stlITTA Callus CIISItt .001
I I I Iii• . I
....
---1 --1 i
t 1
I I si.:ascuTI _ L__1___ __+ I 1
i I I I IS 20 A•stmaill 10./TI atuop, 10
I ' I I---- - - .1----. -/ - _1
137

EXHIBIT F
COUNTY OF HENNEPIN MAP
CITY OF MINNETONKA
138
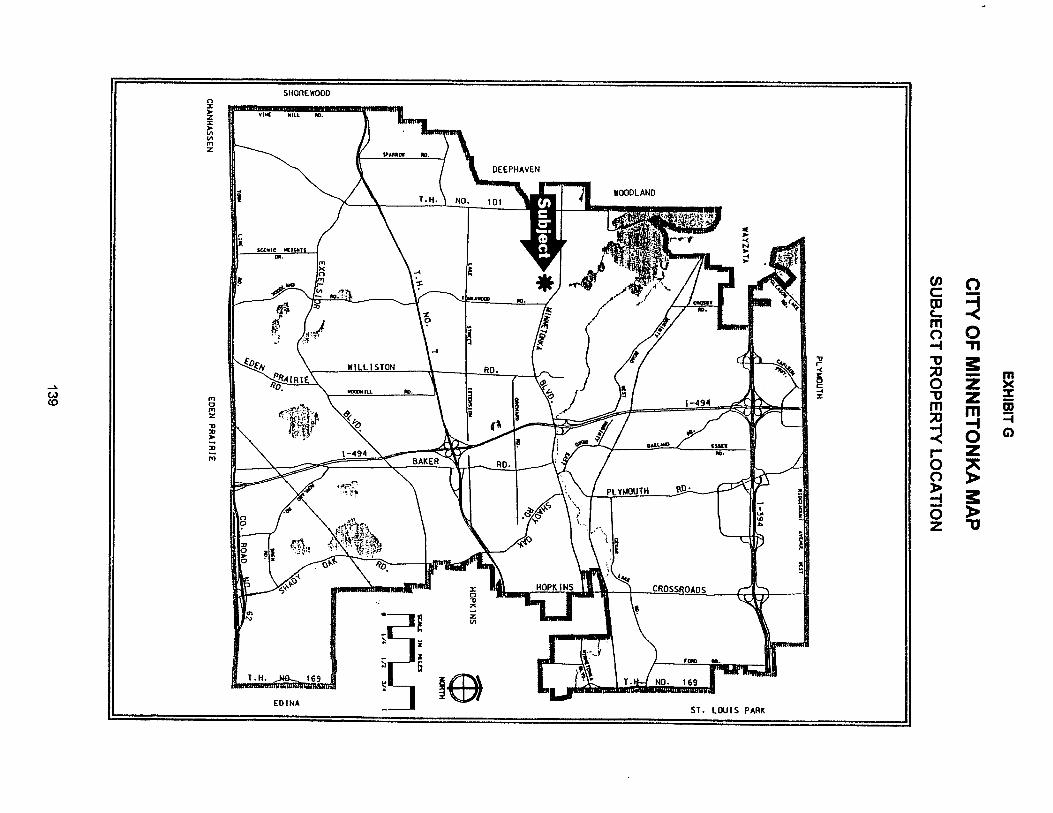
NO
I1V
001
A
IN3
dO
tld
103
r8f1
S
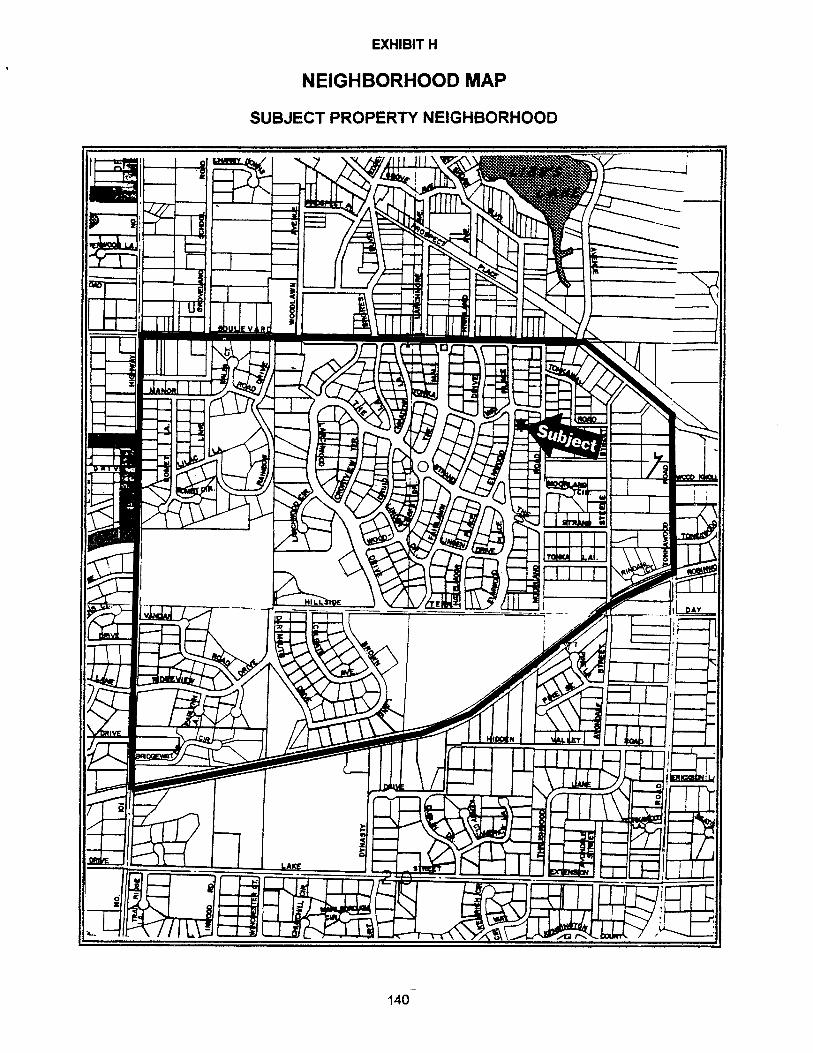
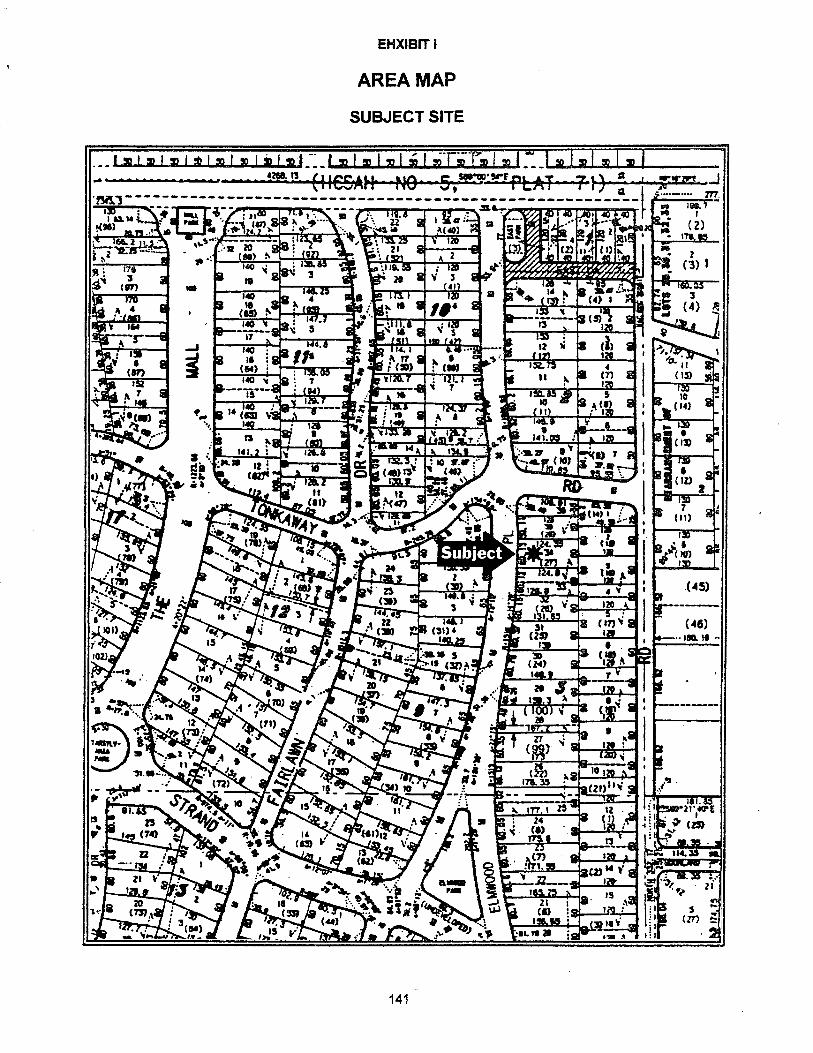
141
1-7(4:**3111"1,117.0: • .1 41... .04•414
EHXIBrT I
AREA MAP
SUBJECT SITE
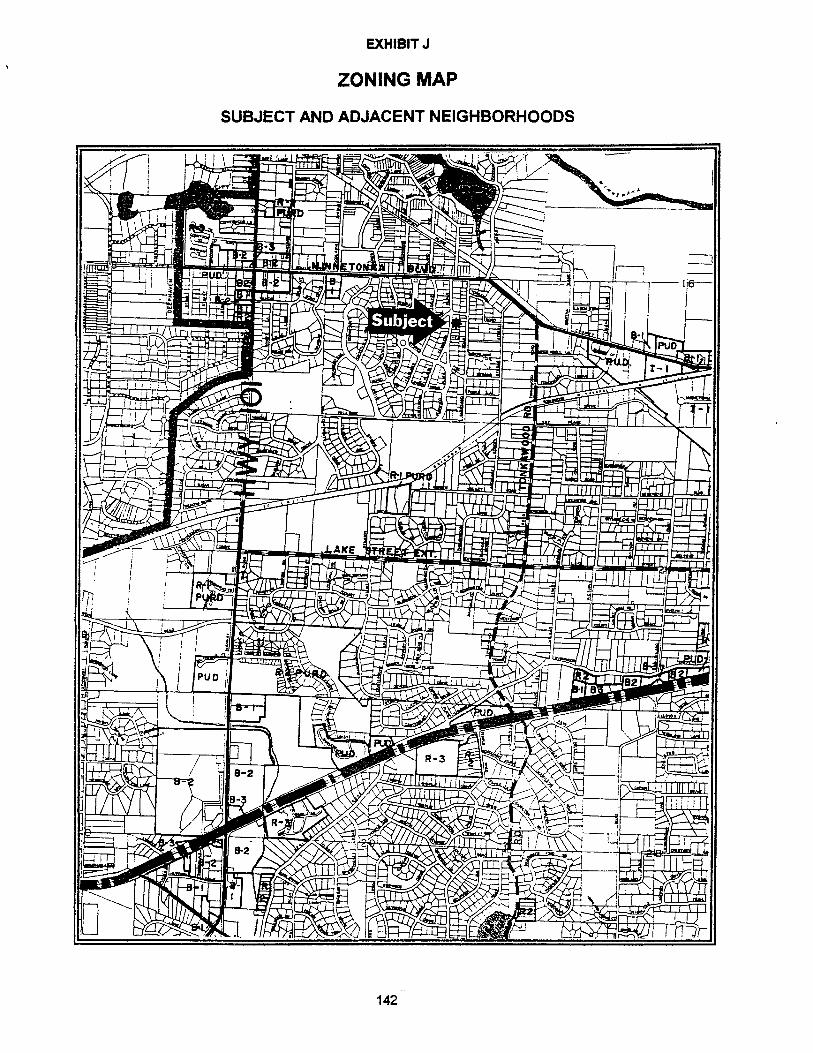
OP 6 akf,.41. p.
Ii
1■41/ift- ■••
• AMEN
1111111W/Wow, PoeFira, .44fard 4/1, :oaffiroL42a alma*. . a . iliARMAA. NAMI
EXHIBIT J
ZONING MAP
SUBJECT AND ADJACENT NEIGHBORHOODS
•
mom ...1.11mi _ i.L.I
UJLII 11111 .2 UZI
[4.1 ipq.uar NI, ism am 13-- Se% sea •
—.7-1=11111in 'Mara 111
ampandlaa swim sia,1111.11111111111i.0 liaLIAMMINIUMIP4744°01)./
11,
. , Mak :
MEW ' • ..tlie '
- ■ 11111 . nip Ilk_ 4 , _
lo.0
Cow= 441 go,. imaLl? • - To ffiv. us
2„ • w ...--. a ■Alial rrit as: Ji :JEN lido .
1 dr. - in al 4 ri, , . .... 4‘,... a: ...="/", '91 . . ..
AP ' !Ir to Subject 4 ..ir lam .. 4 .r-
a
1 iv zunrir •
1111r,
111 U latial,Ps- 6. - kw si
II( sio•
..s.mer,011-• imemorP. tr. IP -
t:ka or41-€"154° 21111,11Q3 II-
1111114411711M1- I
prrari Wit
1117115%1 -01fawa As ftwil
4.? MAI
fra
not 4110
1111010111111111MM,4 Nufilirm-vg
AZIIIIMPVINtr, ;ilk V im4.7 mg= ;rift* gulearottrabilL SE :Aim mar :La1.1 Mem Virkt. Asi Num _VI - Lisa nevidlE
svms maillIRMU armory
f* IBM Mir Stitallirs•-161., mittrAt N
Md,S;N■lra
Wan •NREM
IMP =
• ,41,1 „Pa lanatai....111111, tovp\r_ik Nenumpip
Est wgfp. Ir. 144114E r - Alms
"L-"4 alsoti:111111&114iiIII WINN ing mum ___ =
fep Lie inns." =In
im1111111 Whim
MI IL-
1511
010,r. AIM
sip
Az,
4i4. t *tis Wk.'
...... .. in ...- 1 1110441 i ''.0, _ ..„....
If lig
øv. gpHni AwerM1111
so....42,er 111:16,
1•011112 a ff. ea INV& vow
A1:13
\ eiv1111111HIlli iriu••••■
111102".
Bell • •
:Po ■ Miteb!lf M . - • 4airia
• NT• 1,4611112:1171 40/
r•promgrg ri-- i--
• Ira if] Allumnami„ A. •
. vuarros, -..oressmoom ._ . -
•a, _J. • - -1... *re .- • • NB
im 41 - 10 ■**
*i
s
1,74alikee, P GAO e.f.s1 a illa ft= um
Ea
142
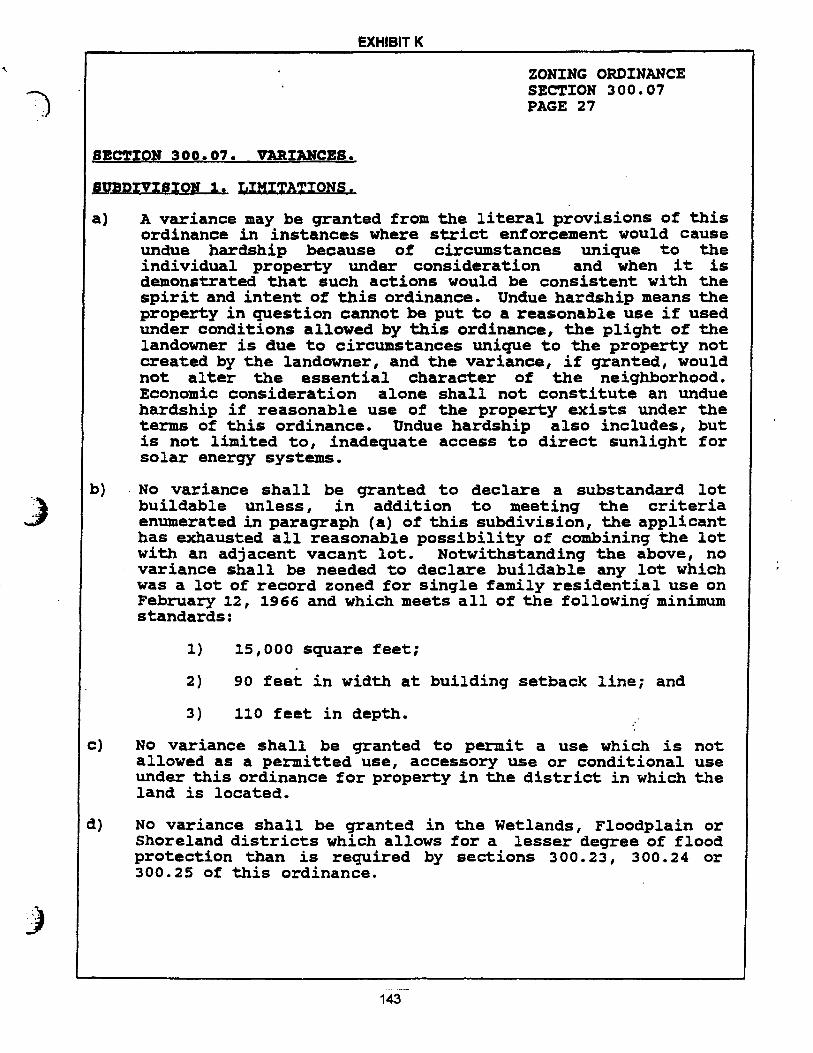
EXHIBIT K
ZONING ORDINANCE SECTION 300.07 PAGE 27
SECT/ON 300.07. VARIANCES.
SUBDIVISION 1. LIMITATIONS.
a) A variance may be granted from the literal provisions of this ordinance in instances where strict enforcement would cause undue hardship because of circumstances unique to the individual property under consideration and when it is demonstrated that such actions would be consistent with the spirit and intent of this ordinance. Undue hardship means the property in question cannot be put to a reasonable use if used under conditions allowed by this ordinance, the plight of the landowner is due to circumstances unique to the property not created by the landowner, and the variance, if granted, would not alter the essential character of the neighborhood. Economic consideration alone shall not constitute an undue hardship if reasonable use of the property exists under the terms of this ordinance. Undue hardship also includes, but is not limited to, inadequate access to direct sunlight for solar energy systems.
b) No variance shall be granted to declare a substandard lot buildable unless, in addition to meeting the criteria enumerated in paragraph (a) of this subdivision, the applicant has exhausted all reasonable possibility of combining the lot with an adjacent vacant lot. Notwithstanding the above, no variance shall be needed to declare buildable any lot which was a lot of record zoned for single family residential use on February 12, 1966 and which meets all of the following minimum standards:
1) 15,000 square feet;
2) 90 feet in width at building setback line; and
3) 110 feet in depth.
No variance shall be granted to permit a use which is not allowed as a permitted use, accessory use or conditional use under this ordinance for property in the district in which the land is located.
No variance shall be granted in the Wetlands, Floodplain or Shoreland districts which allows for a lesser degree of flood protection than is required by sections 300.23, 300.24 or 300.25 of this ordinance.
143
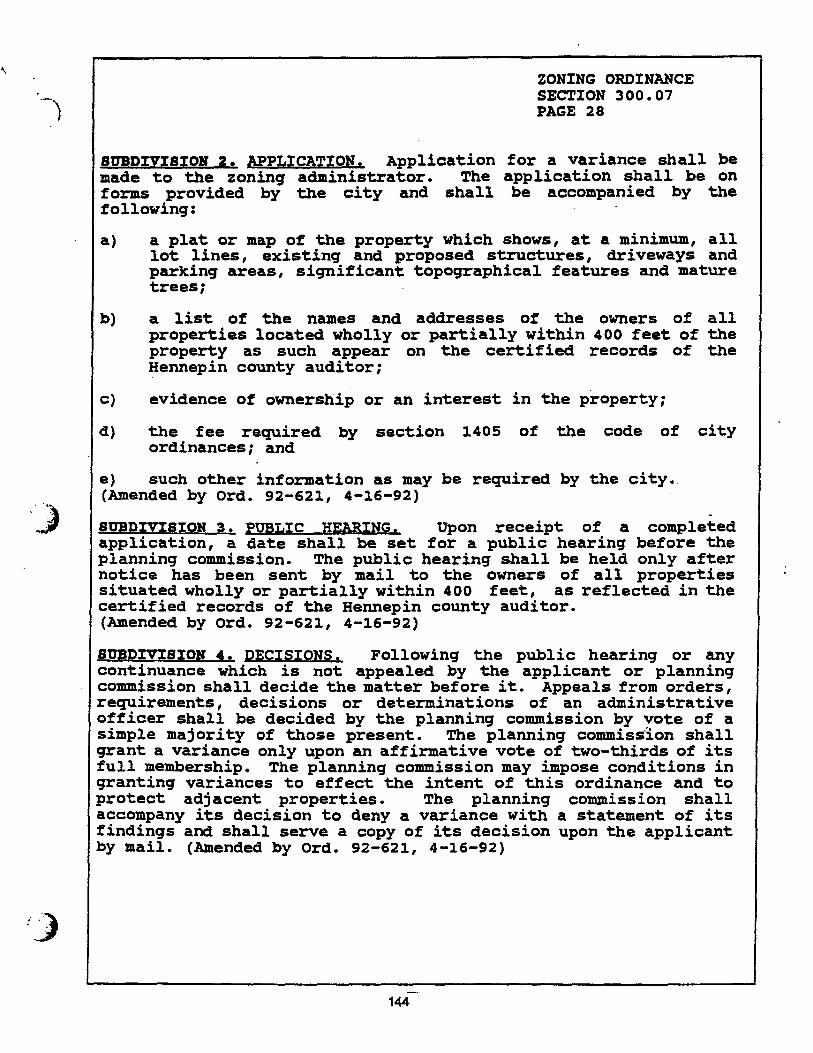
ZONING ORDINANCE SECTION 300.07 PAGE 28
SUBDIVISION Z. APPLICATION. Application for a variance shall be made to the zoning administrator. The application shall be on forms provided by the city and shall be accompanied by the following:
a) a plat or map of the property which shows, at a minimum, all lot lines, existing and proposed structures, driveways and parking areas, significant topographical features and mature trees;
b) a list of the names and addresses of the owners of all properties located wholly or partially within 400 feet of the property as such appear on the certified records of the Hennepin county auditor;
C) evidence of ownership or an interest in the property;
d) the fee required by section 1405 of the code of city ordinances; and
e) such other information as may be required by the city. (Amended by Ord. 92-621, 4-16-92)
SUBDIVISION 3. PUBLIC HEARING. Upon receipt of a completed application, a date shall be set for a public hearing before the planning commission. The public hearing shall be held only after notice has been sent by mail to the owners of all properties situated wholly or partially within 400 feet, as reflected in the certified records of the Hennepin county auditor. (Amended by Ord. 92-621, 4-16-92)
SUBDIVISION 4. DECISIONS. Following the public hearing or any continuance which is not appealed by the applicant or planning commission shall decide the matter before it. Appeals from orders, requirements, decisions or determinations of an administrative officer shall be decided by the planning commission by vote of a simple majority of those present. The planning commission shall grant a variance only upon an affirmative vote of two-thirds of its full membership. The planning commission may impose conditions in granting variances to effect the intent of this ordinance and to protect adjacent properties. The planning commission shall accompany its decision to deny a variance with a statement of its findings and shall serve a copy of its decision upon the applicant by mail. (Amended by Ord. 92-621, 4-16-92)
144
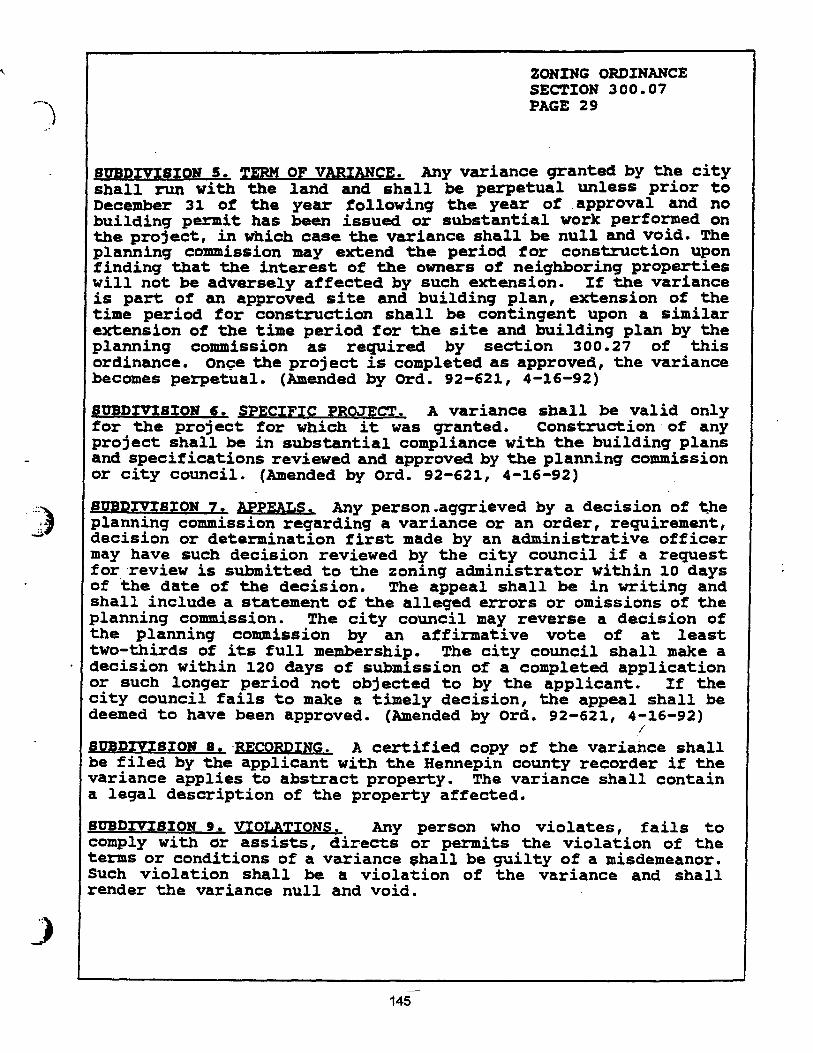
ZONING ORDINANCE SECTION 300.07 PAGE 29
SUBDIVISION S. TERM OF VARIANCE. Any variance granted by the city shall run with the land and shall be perpetual unless prior to December 31 of the year following the year of approval and no building permit has been issued or substantial work performed on the project, in which case the variance shall be null and void. The planning commission may extend the period for construction upon finding that the interest of the owners of neighboring properties will not be adversely affected by such extension. If the variance is part of an approved site and building plan, extension of the time period for construction shall be contingent upon a similar extension of the time period for the site and building plan by the planning commission as required by section 300.27 of this ordinance. Once the project is completed as approved, the variance becomes perpetual. (Amended by Ord. 92-621, 4-16-92)
SUBDIVISION 6. SPECIFIC PROJECT. A variance shall be valid only for the project for which it was granted. Construction of any project shall be in substantial compliance with the building plans and specifications reviewed and approved by the planning commission or city council. (Amended by Ord. 92-621, 4-16-92)
SUBDIVISION 7. APPEALS._ Any person aggrieved by a decision of the planning commission regarding a variance or an order, requirement, decision or determination first made by an administrative officer may have such decision reviewed by the city council if a request for review is submitted to the zoning administrator within 10 days of the date of the decision. The appeal shall be in writing and shall include a statement of the alleged errors or omissions of the planning commission. The city council may reverse a decision of the planning commission by an affirmative vote of at least two-thirds of its full membership. The city council shall make a decision within 120 days of submission of a completed application or such longer period not objected to by the applicant. If the city council fails to make a timely decision, the appeal shall be deemed to have been approved. (Amended by Ord. 92-621, 4-16-92)
SUBDIVISION S. RECORDING. A certified copy of the variance shall be filed by the applicant with the Hennepin county recorder if the variance applies to abstract property. The variance shall contain a legal description of the property affected.
SUBDIVISION 9. VIOLATIONS. Any person who violates, fails to comply with or assists, directs or permits the violation of the terms or conditions of a variance shall be guilty of a misdemeanor. Such violation shall be a violation of the variance and shall render the variance null and void.
145
ZONING ORDINANCE SECTION 300.10 PAGE 33
SECT/ON 300.10. R-1 LOW DENSITY RESIDENTIAL DISTRICT.
SUBDIVISION 1. pURPOSE. The purpose of the R-1 district is to provide a district for single family detached dwellings in those areas where such development is consistent with the low density residential designation of the comprehensive plan and compatible with surrounding land use characteristics. Development within this district shall occur at densities not exceeding four dwelling units per acre.
SUBDIVIS ON 2. PERMITTED USES. Within the R-1 district no structure or land shall be used except for one or more of the following uses:
a) single family detached dwelling units, but not more than one dwelling unit per lot;
b) manufactured homes built in conformance with Minn. Stat. Section 327.31, et seq.;
C) public park and recreational areas owned and operated by a governmental unit, including recreational facilities and structures consistent with the area, except as provided for-in subdivision 4;
d) licensed residential care facilities or community based residential care facilities for six or fewer persons, provided they are not located within 1/4 mile of another similar facility and except as provided for in subdivision 4;
e) licensed day care facilities for 12 or fewer persons, provided there is not more than one outside employee and except as provided for in subdivision 4;
f) public or private schools having a course of instruction approved by the Minnesota board of education for, students enrolled in grades K-12, or any portion thereof, provided they do not include boarding or residential facilities and except as provided for in subdivision 4; or
g) agriculture, farming and truck gardening.
SUBDIVISION 3. ACCESSORY USES. Within the R-1 district the following uses shall be permitted provided they are subordinate to, associated with and located on the same lot as a permitted use:
a) private swimming pools, except as provided for in subdivision 4;
146
ZONING ORDINANCE SECTION 300.10 PAGE 34
b) detached garages, one storage shed of any size or other accessory structures, except swimming pools, unless covered with an accessory structure, not exceeding 12 feet in height or an aggregate of 1,000 square feet of gross floor area or occupying more than 30 percent of the area of the side or rear yard in which they are located and except as provided for in subdivision 4; (Amended by Ordinance 87-450, 1-20-87.)
c) overhead utility poles and lines for a distribution line, receive only satellite dish antennas and other antenna devices up to a maximum height of 60' as measured from the ground upon which it is located subject to the requirements provided in section 300.15, subdivision 12; except that utility poles and lines for a distribution line may be taller than 60 feet, but not taller than 80 feet, when needed to cross a major roadway such as a freeway. (Amended by Ordinance 87-450, 1-20-87, Ordinance 88-517 9-19-88 and Ordinance 92-637, 2-3-93)
d) solar equipment;
e) greenhouses not exceeding 12 feet in height or 1,000 square feet in gross floor area or occupying more than 30 percent-of the side or rear yard in which they are located and provided they are not used for commercial purposes;
f) private tennis courts, except as provided for in subdivision 4;
g) living facilities for no more than two boarders or roomers within a single family dwelling unit, provided that such facilities do not constitute an accessory apartment and that adequate off-street parking is provided;
h) home occupations which are clearly secondary to the principal use and do not change the nature of the principal use, provided there is only limited retail sales activity, no exterior evidence of the occupation, no significant increase in traffic or demand for parking, no significant increase in levels of noise, air or other pollution, no exterior signs, no persons employed in the business who do not reside in the dwelling and except as provided for in subdivision 4;
i) minor mass transit facilities including benches, which benches may include advertising signs consistent with the provisions of section 300.30, et seq. of the code of city ordinances, except as provided for in subdivision 4;
147
ZONING ORDINANCE SECTION 300.10 PAGE 35
j) recreational facilities and structures, provided they contain less than 1,000 square feet of gross floor area, and except as provided for in subdivision 4;
k) evergreen material sales if in compliance with the standards specified in section 300.15, subdivision 13, and the director of planning has given approval; and (Added by Ordinance 90-589, 11/21/90.)
1) other uses customarily associated with but subordinate to a permitted use, as determined by the city.
SUBDIVISION 4. CONDITIONAL USES. Within the R-1 district no structure or land shall be used for the following except by conditional use permit and in conformance with the standards specified in section 300.16 of this ordinance:
a) educational institutions and facilities, except as provided for in subdivision 2;
b) religious institutions and facilities;
c) the creation of up to two single family residential lots, each containing a minimum area of 15,000 square feet in areas in which smaller lots will serve as a transition between low density residential areas and more intense uses or in areas where the prevailing lot size is less than 22,000 square feet, and provided the parcel to be subdivided shall be a maximum of 40,000 square feet in area. Parcels in excess of 40,000 square feet which are proposed for 15,000 square foot lot size subdivisions shall be reviewed as a planned unit development under section 300.22 of this ordinance.
d) mass transit facilities, except as provided for in subdivision 3;
e) accessory apartments;
f) licensed day care facilities for more than 12 persons, provided they are located within suitably designed structures which are not also used for residential purposes or within religious or educational buildings, and except as provided for in subdivision 2;
g) detached garages, storage sheds or other accessory structures, except as provided for in subdivision 3;
148

ZONING ORDINANCE SECTION 300.10 PAGE 36
h) home occupations which are clearly secondary to the principal use and do not change the nature of the principal use, provided there is only limited retail sales activity, there are no exterior signs, there is a maximum of one outside employee, there is adequate off-street parking for the number of employees or customers per day, the parking area is screened on all sides, there is no outside storage and business hours do not exceed 8:00 a.m. to 9:00 p.m. This includes any home occupation with an exterior indication of the business use, including the exterior parking of a commercial vehicle or vehicle identified as being used as part of a business.; (Amended by Ordinance 87-450, 1-20-87.)
i) licensed residential care facilities or community based residential care facilities for six or fewer persons located within 1/4 mile of another similar facility or for more than six persons, or other charitable, religious, counseling or therapeutic service entity involving regularly scheduled meetings; (Amended by Ordinance 87-450, 1-20-87.)
j) private, non-profit recreational facilities as a principal use;
k) wind energy conservation systems or windmills;
1) cemeteries;
m) marinas;
n) public buildings or facilities;
o) public or private nursing or convalescent homes;
P) leasing, sales or management offices for the development exceeding 1,000 square feet of floor area;
q) transmission towers and other antenna devices and related facilities over 60' in height above the ground which are, not freestanding and located on existing or proposed structures allowed as a principal or conditional use in this district and/or upon public structures; (Amended by Ordinance 88-517, 9-19-88.)
r) golf courses; (Amended by Ordinance 90-589, 11/21/90 and Ordinance 90-582, 6-13-90)
149
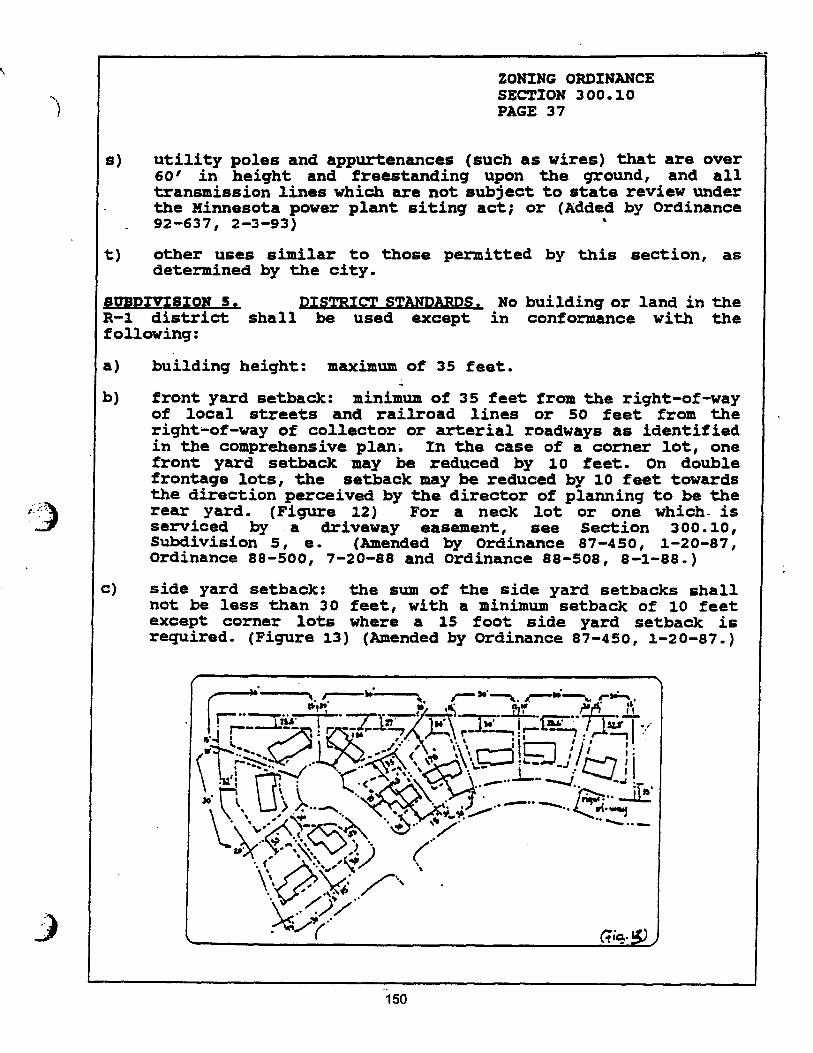
ZONING ORDINANCE SECTION 300.10 PAGE 37
s) utility poles and appurtenances (such as wires) that are over 60' in height and freestanding upon the ground, and all transmission lines which are not subject to state review under the Minnesota power plant siting act; or (Added by Ordinance 92-637, 2-3-93)
t) other uses similar to those permitted by this section, as determined by the city.
SUBDIVISION 5. DISTRICT STANDARDS. No building or land in the R-1 district shall be used except in conformance with the following:
a) building height: maximum of 35 feet.
b) front yard setback: minimum of 35 feet from the right-of-way of local streets and railroad lines or 50 feet from the right-of-way of collector or arterial roadways as identified in the comprehensive plan. In the case of a corner lot, one front yard setback may be reduced by 10 feet. On double frontage lots, the setback may be reduced by 10 feet towards the direction perceived by the director of planning to be the rear yard. (Figure 12) For a neck lot or one which- is serviced by a driveway easement, see Section 300.10, Subdivision 5, e. (Amended by Ordinance 87-450, 1-20-87, Ordinance 88-500, 7-20-88 and Ordinance 88-508, 8-1-88.)
C) side yard setback: the sum of the side yard setbacks shall not be less than 30 feet, with a minimum setback of 10 feet except corner lots where a 15 foot side yard setback is required. (Figure 13) (Amended by Ordinance 87-450, 1-20-87.)
150
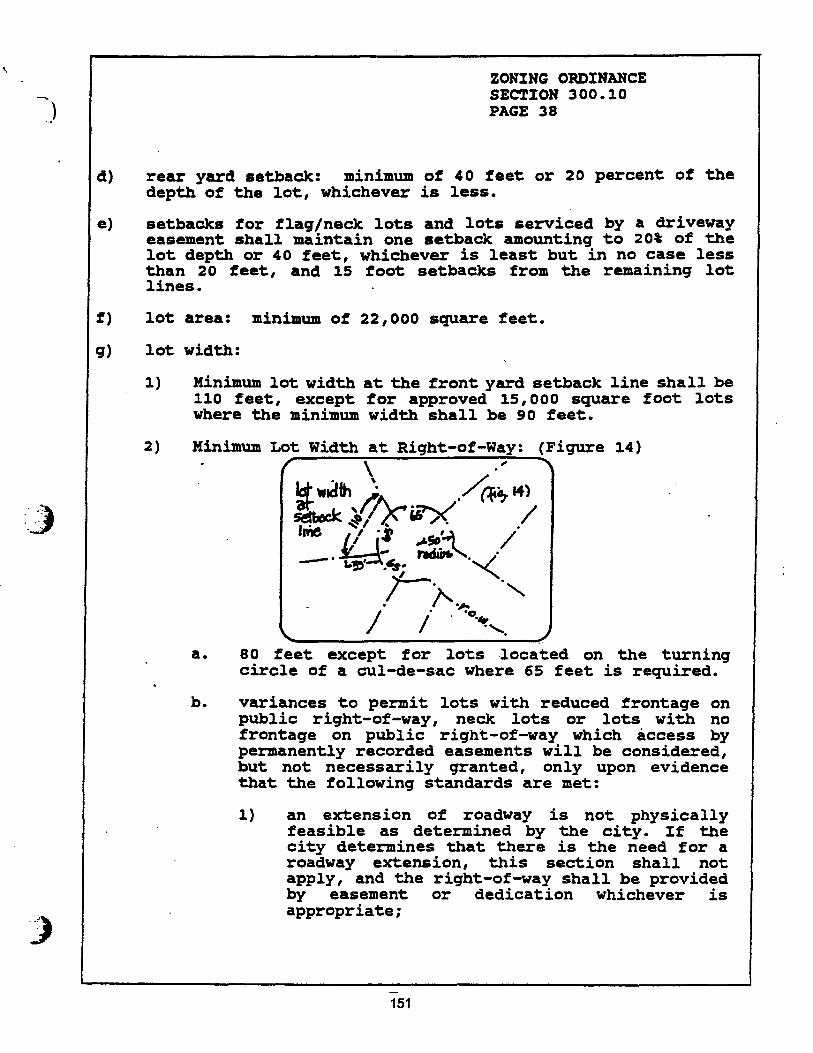
ZONING ORDINANCE SECTION 300.10 PAGE 38
d) rear yard setback: minimum of 40 feet or 20 percent of the depth of the lot, whichever is less.
e) setbacks for flag/neck lots and lots serviced by a driveway easement shall maintain one setback amounting to 20% of the lot depth or 40 feet, whichever is least but in no case less than 20 feet, and 15 foot setbacks from the remaining lot lines.
f) lot area: minimum of 22,000 square feet.
g) lot width:
1) Minimum lot width at the front yard setback line shall be 110 feet, except for approved 15,000 square foot lots where the minimum width shall be 90 feet.
2
Minimum Lot Width at Right-of-Way: (Figure 14)
esibillh‘ r) . 4114 14/)
Ithe • p; /
a. 80 feet except for lots located on the turning circle of a cul-de-sac where 65 feet is required.
b. variances to permit lots with reduced frontage on public right-of-way, neck lots or lots with no frontage on public right-of-way which access by permanently recorded easements will be considered, but not necessarily granted, only upon evidence that the following standards are met:
1) an extension of roadway is not physically feasible as determined by the city. If the city determines that there is the need for a roadway extension, this section shall not apply, and the right-of-way shall be provided by easement or dedication whichever is appropriate;
151

ZONING ORDINANCE SECTION 300.10 PAGE 39
2) severe grades make it infeasible according to the city to construct a public street to minimum city standards;
3) the city determines that a right-of-way extension would adversely impact natural amenities including wetlands or stands of mature trees containing deciduous trees greater than 12" diameter or coniferous trees greater than 15' in height;
4) there is no feasible present or future means of extending right-of-way from other directions;
5) the number of lots to share a common private access drive does not exceed three; and
6) covenants which assign driveway installation and future maintenance responsibility are submitted and recorded with the titles of the parcels which are benefitted;
(Amended by Ordinance 89-559, 7/13/89)
h) lot depth: minimum of 125 feet. (Figure 15)
rDati.
A • • ■■••■ • • •■■■ • • ..••••••
t.ce: Ggi4.13)
011., 0.400.■■
SUBDIVISION 6. ADDITIONAL REQUIREMENTS.
a) All dwellings, including manufactured homes, shall have a depth of at least 20 feet for at least 50 percent of their width. All dwellings, including manufactured homes, shall have a width of at least 20 feet for at least 50 percent of their depth.
b) All dwellings shall have a permanent foundation in conformance with the Minnesota state building code.
152

ZONING ORDINANCE SECTION 300.10 * PAGE 40
C) Accessory structures shall conform to the setbacks established for principal structures, except for the following:
1) all accessory structures located more than 10 feet from a principal structure may be located a minimum of 10 feet from a rear or side lot line; and
2) all accessory structures except detached garages which are located between the principal structure and the front lot line shall maintain a minimum setback of 50 feet. (Amended by Ordinance 87-450, 1-20-87 and Ordinance 90-589, 11/21/90)
Sheds or storage buildings less than 120 square feet in size shall be located behind the rear building line of the house. (Amended by Ordinance 87-450, 1-20-87.)
4) swimming pools shall be located behind the front building line of the house, and 151 side and rear setbacks as
- measured to the water line are required. On corner lots, swimming pools shall be subject to front yard setbacks established for principal structures. (Added by Ordinance 90-589, 11/21/90)
d) off-street parking shall be provided for at least two vehicles for all single family dwellings. A suitable location for a garage measuring at least 20 feet by 24 feet which does not require a variance shall be provided and indicated as such on a survey or site plan to be submitted when applying for a building permit to construct a new dwelling or alter an existing garage.
SUBDIVISION 7. EXCEPTIONS FOR OUALIFYING SMALL LOTS.
a) The buildable status of R-1 lots is determined in accordance with Section 300.07, Subdivision 1, b. If a substandard lot has been declared buildable, the provisions ' of this subdivision (Section 300.10, Subdivision 7) may be applied. (Added by Ordinance 88-500, 7-20-88.)
b) In recognition of the exceptional circumstances of nonconforming small lots located in neighborhoods of similarly sized lots, the R-1 district setback standards shall be reduced for lots meeting the following criteria: (Amended by Ordinance 88-500, 7-20-88)
1) less than 15,000 square feet;
153

OW* II■•• Vag atilCirsiiverum
(.P446) eAgmbluiy * woomoupp...
I. 1 ; , ill =PII:
.1";aspa.irle. °mail ,Irrocc*:f, •
i rtgeo I fl i2—zas°6 • ;
flrops4 tz,m• -*
– •• 1.2.6.4cosf,
11225"4-1 10=41 mm:004..
a
I inZure. r'25
=et Irani •
Vill1=001 I 1
;SA
1.
ZONING ORDINANCE SECTION 300.10 PAGE 41
2) lot of record as of February 12, 1966 or lots approved by the city subsequent to this date; and (Amended by Ordinance 87-450, 1-20-87.)
located in an area in which the average size of all residential lots within 400 feet is less than 15,000 square feet. (Amended by Ordinance 88-500, 7-20-88.)
c) The following standards shall apply to principal structures located on qualifying small lots:
1) Front yard setback: average front setback of principal structures located on adjoining parcels; but in no case less than 20 feet from the right-of-way. (Figure 16)
2) Side yard setback: 10 percent of lot width measured at the building setback line on each side of the structure, but in no case less than seven feet. (Figure 16)
3) Rear yard setback: 20 percent of lot depth, but in no case less than seven feet. (Figure 16)
d) The following standards shall apply to accessory structures located on qualifying small lots: (Figure 16)
1) Front yard setback: same as for principal structure.
2) Side yard setback: seven feet.
3) Rear yard setback: seven feet.
154

II !I.
II 2
hill I'L'i I 4ICSIkb P LII
•••-
:(4
.........„.... ..........,..
LII
•
.i>
2141R! HI <lima 0
MI . thlh III
lig 1
ill

R-1 RESIDENTIAL SETBACKS ., .
1 REAR YARD
1 HEILINT
■ oWITUINDS eR.000PLAIN *MORELAND
SINGLE FAMILY DWEUJNO 35150' 10' MINIMUM F 20' ON OTHER SIDE 30' TOTAL
40' OR 217% LOT DEPTH WHICHEVER LESS
35' PER USC DEFINITION
35' 'LORDING 25' DECIC
35' WILDING 25' DECK 100' CREEK
50175' OR LINE BETWEEN • ADJACENT STRUCTURES SUBJECT 70 36' MINIMUM AND DECKS 20' MINIMUM
30% HARDSURFACE COVERAGE
CORNER LOTS
•
35125' OR 25'/50' OR 35140'
15' •
40' OR 20% LOT DEPTH WHICHEVER BLESS ,
' SAME AS ABOVE
SAME AS ABOVE
SAME Al ABOVE
SAME AS ABOVE
NECK/FLAG LOTS 15' 15' .
SAME Al . ABOVE
SAME AS - ABOVE
SAME Al ABOVE
BAAS AS — ABOVE
SAME AS ABOVE
DECXS, FIREPLACES AND OTHER ARCHITECTURAL FEATURES MAY MEND 5' INTO ANY Of 1HE ABOVE SETBACKS EXCEPT A 10' SCE YARD SETBACK OR A 25' , FRONT YARD SETBACK ON A CORNER LOT. Voss mot appiy to stomod Nom.
DETACHED GARAGES LOCATED MORE THAN 10' FROM PRINCIPAL BUILDING F LESS MAN 10'. THE PRINCIPAL BUILDING SETBACKS APPLY.
36150' 10'
,
10'
. .
12' PER WIC
.
36' 36' 100' CREEK
SAME AS PRINCIPAL BUILDING
ACCESSORY STRUCTURES AND SHEDS (TREATER THAN 120 SQ. FT. lot pmjsottati Ivoef aresIBUT LESS THAN 1000 SQ. FT. F LOCATED LESS THAN 10' FROM THE PRINCIPAL WILDING THE PRINCIPAL BUILDING SETBACKS APPLY.
50° F BETWEEN FRONT OF HOUSE AND STREET
10' 10' 12'
,
35' 36' 100' CREEK
SAME AS PRINCIPAL BUILDING
-
ACCESSORY STRUCTURES AND SHEDS LESS 'THAN 120 SQ. FT.(of Po014K4Ad roof area)
MUST BE LOCATED* BEHIND HOUSE
0' Ce 12'
•
35' 35' 100' CREEK NO SETBACK FOR BOATHOUSES
SAME AS PRINCIPAL BUILDING EXCEPT . NO SETBACK FOR ' BOATHOUSES
, ,
ALL ACCESSORY BUILDINGS EXCEEDING 1000 SQUARE FEET 00 12' HEIGHT REQUIRE A CONDITIONAL USE PERMIT. —
SWIMMING POOLS POOL MUST BE LOCATED BEHIND FRONT BUILDING UNE OF HOUSE 15' TO WATER LINE- SIDE AND REAR. CORNER LOTS, PRINCIPAL STRUCTURE ' SETBACKS APPLY.
N/A 35' 35' 100' CREEK
SAME AS PRINCIPAL BUILDING
R-1 SETBACKS FOR SMALL LOT NEIGHBORHOODS ILOT LESS THAN 15,000 SQUARE FEET AND AVERAGE NEIGHBORHOOD LOT SIZE LESS THAN 15.000 SQUARE FEET)
— -. FRONT YARD SIDE YARD REAR YARD HEIGHT WETLANDS FLOODPLAIN MORELAND
PRINCIPAL BUILDING AVERAGE OF ADJACENT STRUCTURES SUBJECT TO 20' MINIMUM ,
10% LOT WCTII
7' MINIMUM
20% LOT DEPTH
7' MINIMUM
35' 35' 36' 100' CREEK
SAME AS STANDARD LOT SIZE PRINCIPAL BUILDING
ACCESSORY STRUCTURES - SAME AS PRINCIPAL BUILDING
7' 7' 12' 38' 35' 100° CREEK NO SETBACK FOR BOATHOUSES
I SAME AS PRINCIPAL BUILDING EXCEPT NO SETBACK FOR BOATHOUSES
R-1 LOT DIMENSIONAL STANDARDS T .- -7
ge .-,. •
xI.
i,
—
LOT AREA LOT WIDTH AT SETBACK
LOT DEPTH . ..
...
• •'.•.:•: ..
NEW R-1 LOTS 22.000 110' 125'
BUILDABLE
-- -- _
-- 15000 156 so. 110'
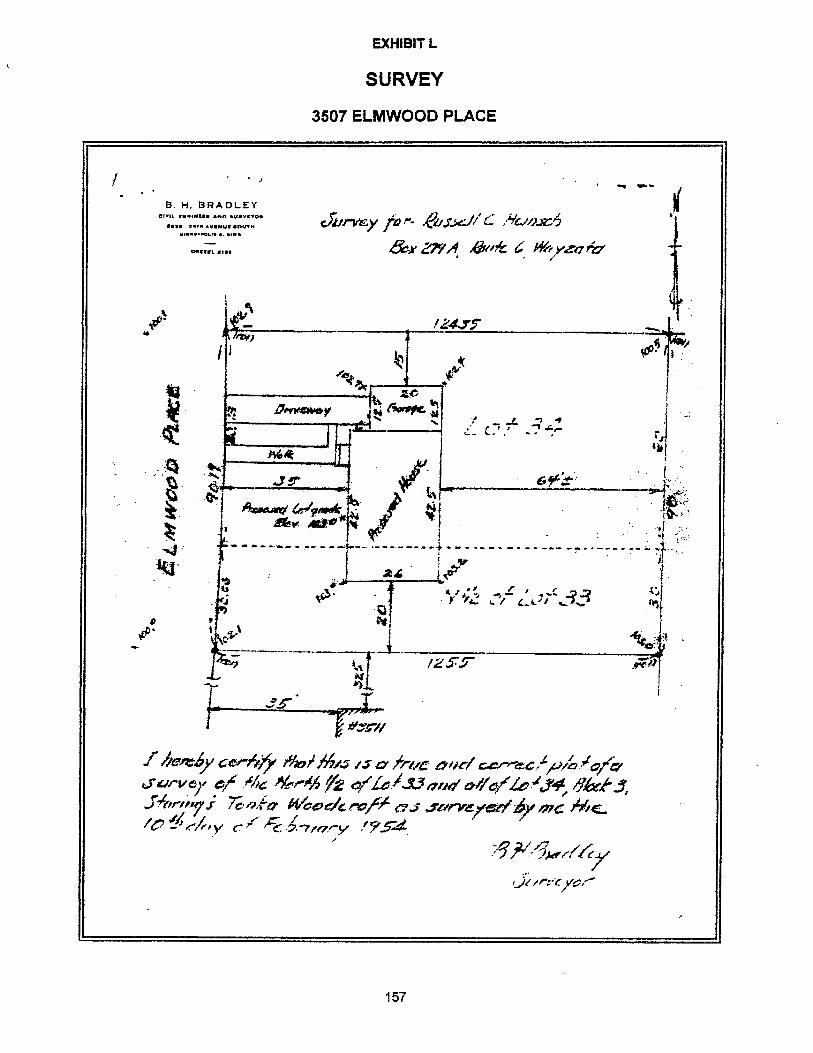
f he,e4/ Ao1.65.45 /..3- b:evc ewe,/ c.-c4 /,4 jedrvey et 144Z i44 r2 ZeI-13 aria' es-4/0/2el,4, /Yea 5,
7;/-41:-.7 Weedc ma/454 .rtirveyeref oirc /0 y CAsz: .954
jvrvEy fo E,LkJ C lk,v)-z6 ZNA, 4bint G: 'yea fi9'
B. H. BRADLEY CIVIL V•14.0■11.■ AND 14.1•11/e•Vo
11871. 741• •VINIJI SOUTH
10.••••01..• • am.
0.1r•Ir
- L
- flit
am r
157
EXHIBIT L
SURVEY
3507 ELM WOOD PLACE

EXHIBIT rim
PLOT PLAN
3507 ELMWOOD PLACE
158

141011
9' 0" 1' x 14' OH
55' CY' 1' X 121 0H
13'O •
12'O'
GARAGE
3 Oa
INFORMAL DINING
11' trX 14' BEDROOM
KITCHEN 94:rx 11'r ••••
BEDROOM 11'0'x 11' r
28' 0"
to. os 11111111111 LIVING ROOM
17' 0" t 11'rx WO'
6' 0'
....mwszt===..■ 15' 0"
2001'
29' 0"
BEDROOM 11"6"x120*
rj r".
EXHIBIT N
FLOOR PLAN (MAIN LEVEL)
3507 ELMWOOD PLACE
159

B.
imilleisliln;
FAMILY ROOM trirx2rr
STORAGE AREA
FLOOR PLAN (BASEMENT LEVEL)
3507 ELMWOOD PLACE
42' 0' 1' x121 OH
12'O"
MECHANICAL LAUNDRY AREA AREA
31011
6; 0"
III i. I 1111111 II II MIA
1' x 14' OH
15'01'
160
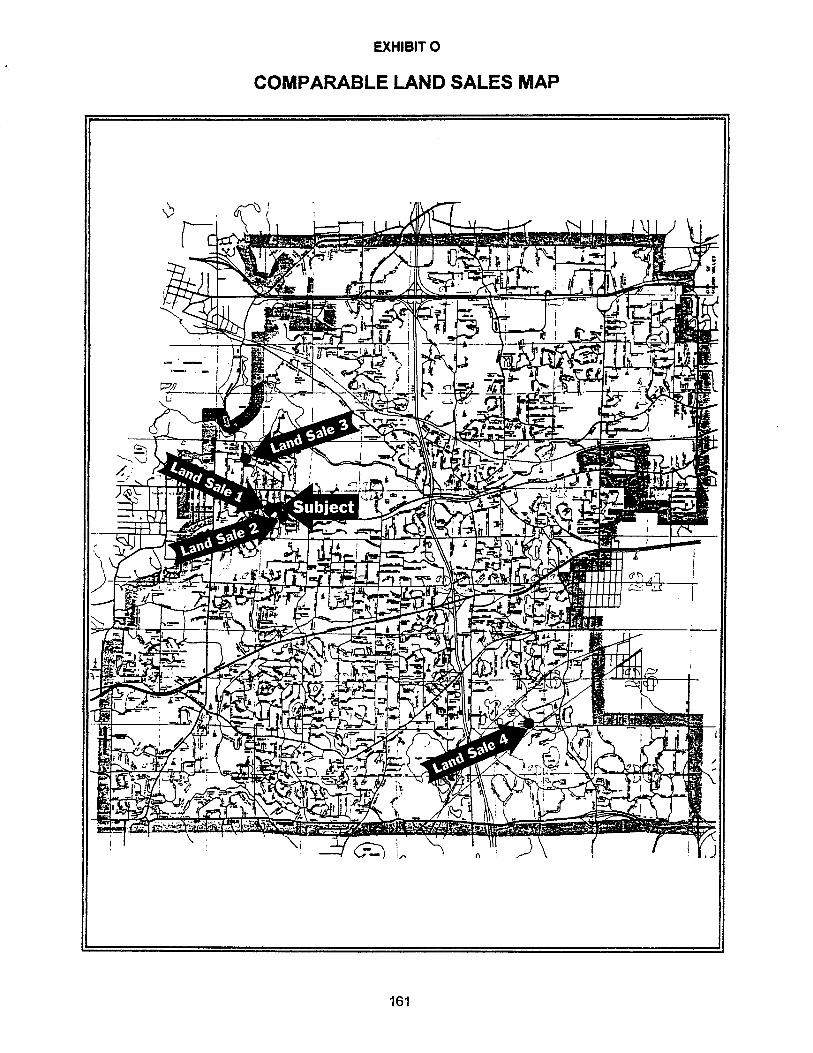
ma.
ET I; Ig:St";%S-*Oring=47' • -
I
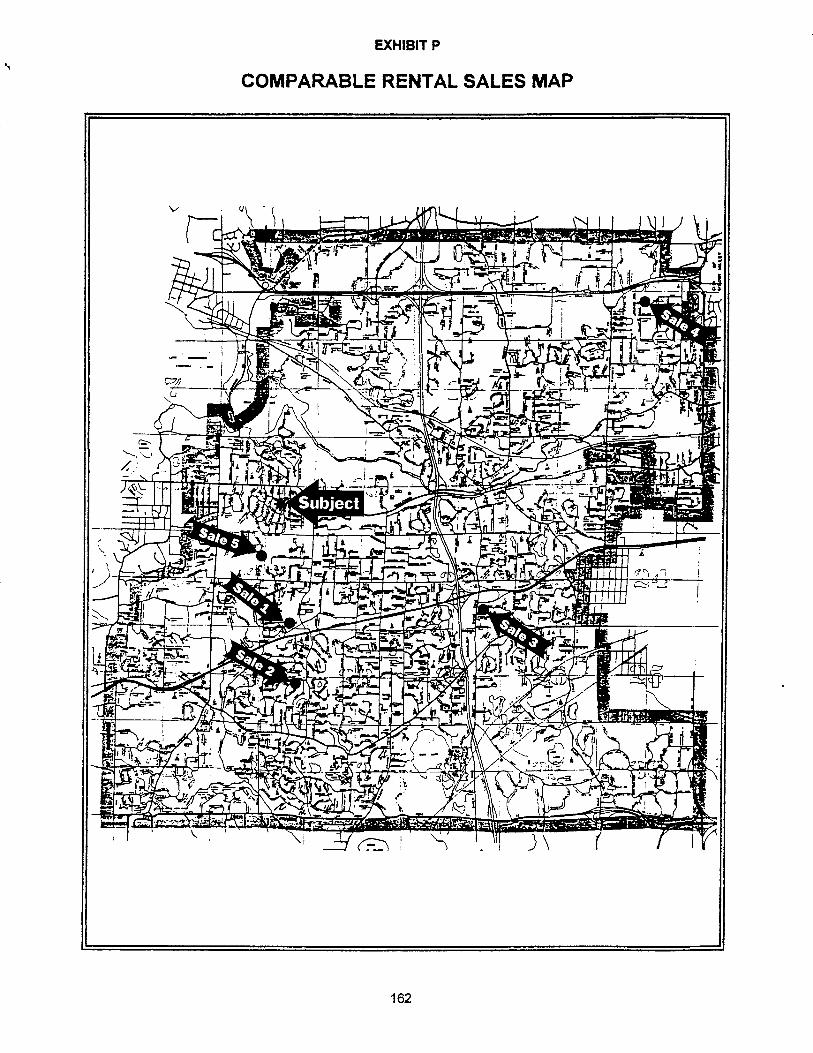
I Um"
• ci4MDIfdell''MAi- • 1: • • - .WZgaw_ ni
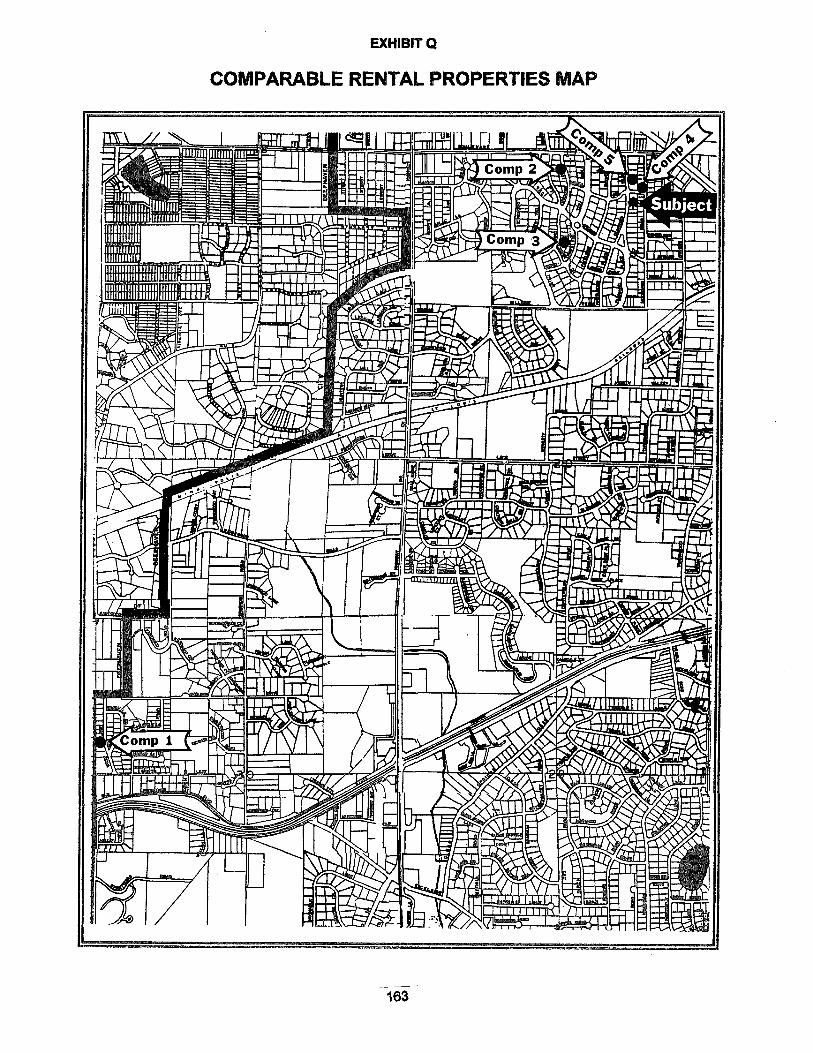
1111.
Ma-
EXHIBIT Q
COMPARABLE RENTAL PROPERTIES MAP
-
..r4
i
.l
0ias
d1
m.ga7
I
i /
a
4 V
Ivv
I&
eV
C
,
4.
sm
oIM.m
a
.
l
Tde
a
b. ..7..
1
,,.c
q
4.
4
t
.
4:
v
,!'h7, 4
N
.C
ih
O
40 T
1T il:17• 1 I
mI. .N..
i
I
;
r
s1
i
1
•
.
:if.
.
,u7
mii p2i :7
r ■..,
I.
#
!
.a.b
I
h0'.
Q
. I 1-
.
I
j
■
■I
1
e
t
1e l
*
1-
1
c
11‘
Comp 3 It.; 74.1t lb&
-7* RP all■ ;i in.I.T mis .. 'rritArt t
II i mr".1E- "sr
iii app--, Are ale NOUN 2P" t""PII,I1
, • .%: .r mown g- o* Iill IR, 1"
al•rnr. lAVAIT-c rail. Aria': mill P. p.m.
mow ...111 imm moo mit...-.1, _._
maw nip, ow :". i&
I. Ilipri waif 11 g, rtillg2,1••••=mi ._...1.1111401/1
•
LULA LA IL
dawn worry. qiinitionor4** 4%6:en' 94:10/411 •
MHO I
f4441 ittigt a &•• 16•Mbil
litaluaii P
- mel -,--- :4■41 It At. mi.. Irry Poo r.-- ■112: get, *goo. 4
11111 < Jil I,
Alai * s•Sif4.:
III= SN4 Ala. 4.._ Ito
Ity% 0
1.,...,,,,p.,.....„...,,....„.4—_ --to ,,, i ,
A, ot bro. . . s-10.17, 4.41711 Li
'1.PR °fr.' I
- yr*, 4:10-0•Alicliplub 441011' -:it'''ovapr. ffill111110-7.: 1
• NI; ' 4•0
it/ 0. ,ot 40
lik4f#P4
4/%114;1181171114ro arilfoillil
tatiliii
4141,4/14, : .'t *
--4706•All
4inineari
10..i:Tili
.....e.--'""*..."' /rot ow..
.-........e.
,
-4,1
,
,m
II IViiiip no
*Iola 4P• *et h. v. *- Nor VII MO '
AN A. OE*
,..._ at :4:11rilith,41 A ri • a ''' 4
10 .._ t- RN, lok .1-1.
N-L 0 "
1 PEI4 -- .1 am„
1m
,,1„1
111u1
„
1
I
Z
m
-
..
a att. Om-
111111*-
11,1111rilli NI viva t loiN-v I >
=1.1" ;IirmulaN IAN-111k7Zr 10" .1-00 re > ,$I!iu
Rpm/ Er
V' 110- 411 E 414/1,1ot 411
weft mum 44.
PIPP, Aglog
FICA Err) II I /11 I 0
.., IIIIIIIiiiiiii iIII1PHIM liljejr).1111101111M•11/11)=P, 1111111111111111111111111111111: MI 1111•411•111/111111•11 11 IIIIII-111iii 111111 111111 11111111 1111111[1111 11111
E711-114111 1111r M
111i:11n1101l11,l1
i11lnii111111111•.
itMIII: I 1
111
IP
F.11111•114 Enifini411 111111111111111 ;,..---=1.111111111111 01111111111 • Minn 111 11111111111 111 14, spintaz=iihopow 1i iiiiim sib, .2.4. miumlwiLimmorm109 1411,111A
IIIIIIIHIP ____i_1111'wo-1.11111 iIMMIalliVimMIX ' 106
mm imco nal iiiimiiimi MP' 1
Ar.
' 111 ' lir Irlai ll 111■111■ I
II r ■I■ urewir Allk Aro*. IP. '4 11#1* •IL„or.. 000
• AtlisU IPPAw
0.1
NIL
meg
ii1111111j1
wig
ai 11111111 ■11•111.
Pi?
MOM AWN *Pont foe aim& .41
OE
0,1 ABU
st*W1
11 Nal IIIIII
1111111111101
!win
‘17 Imn
"Ow 1114111/1 41-4,—, - AAP
• IOW 144.,
mit 4/
leillr:IIA4 111:IM •11444 1111 Ulir 1*-V 1 plfIlir 1.111.1117 3Ik iiiirpv.s. Ai• or,.
INIIIRSainillillIT
111 ""IPAPRI sip :11
Vs. ilt IF N :i a 111.1.- IC V It s iiir
lift LINAI
1-.7,-ur-- :ezpounorkwq tt.sustfkintr....: _
.47474v. 41W1 .1111
A A t , 1100
A‘'s 0 lm - osto 11/r
11iiirge Ira a
,f‘V Ir. AMU 66.- 01,
al
ma. Now
*4
121 cr-
•
163
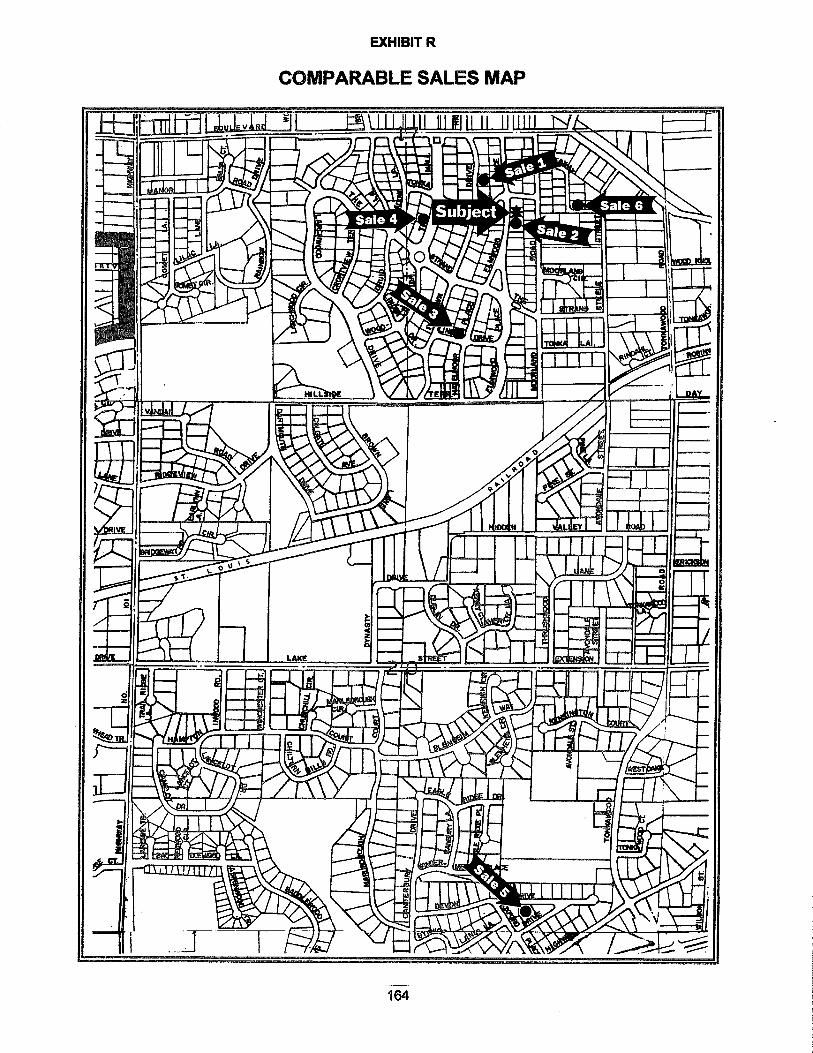
,Lluvlell 91 SIM i=ka.
HILL
F
EXHIBIT R
COMPARABLE SALES MAP
bib or ■• um =4 zit i ,„ is, ral nrmil. Row Roo mo 4..rv-- 11. A., .1 !mit **4";r:= .48:i4 flit Illosuj a
es
1111111.*
, dr•*Iv
Mr 44Z. rIE smar falai ar.
iP 11•111111•1;...-: sminen Sale f * iriire AO Wt. S, 4,...2.....4±. mai •
0040, lasi 40, fv. saw 2. &A‘
ts1100 i) 41.1 ••
ei Alfr, 111 orerow me it
1? V41. li Mal .. A.1% .. 1111111111111 illi • • ap r19111411 INIE ' Ve
. 11 r i r. MIP ar Num.. Ilik--
mit onti mr----
Altivu Nt Alii A
61111M mffinit USW
TIM
API as sim sr ------ t Ar
0 A" 1E- 414 Subject"•"1"1---- Sale lemb mi MAO nem
Niro.
Fik
ArAll
44
or4
74/0
lair NM mom= VEMMIL 111111
PRI
rail= MI MEI '41111111 MP INV 010 $ ,,,■ 00 4.tivp • t. • .A. fi 4. e t IV 0 ISO
1111111
LAKE
0-ammul 464410.0kfirot. altar-
10/PP!liqiumie■
1
medwAltallerffivipul
imMIAIMI MIL it lox .4409inur, 140% v. ,,1•41
in.11111111
/Fe
rt, 40Matioa •Ilon •
At! .111,11. IIPC :gm .011 XL Ia., IN
Iu 13■10: Alt Ili 1
TrIMIPPRI
OA II. d t '', AAit-v , •
MEG
LIE
mop
liii 1114ra S' r ! ke4:41- 41,
" INIELJ
Imic irmil, k • 11! 17 . II . ow ,wrilli
• aumaimin
1167-14171 ir
6111 111■Ne I•lattS■141,4 11.7
Ire*
164

QUALIFICATIONS OF THE APPRAISER
Experience:
Appraiser - (6/1998 - Present)
Senior Appraiser - (11/1997 - 6/1998)
Principal Property Appraiser - (2/1994- 11/1997)
Property Appraiser - _ (11/1990 - 2/1994) - Full-time (9/1990 - 11/1990) - Part-time (6/1990 - 9/1990) - Summer Intern
Real Estate and Related Education:
• International Association of Assessing Officers (IAAO) Courses
Course 2 Income Approach to Valuation Course 4 Assessment Administration Course 302 Mass Appraisal of Income Producing Property Standards of Practice and Professional Ethics Workshop Case Study Examination on the Mass Appraisal of Income-Producing Property
• University of Minnesota (U of M) Courses
Course A
Assessment Law, History, and Procedures Course B
Residential Appraisal Course H Mass Appraisal
• Seminars (U of M)
Contemporary Capitalization Methods and Techniques WCMAP - Narrative Report Writing Seminar Uses of Tax Increment Financing (TIF) Apartment Valuation Update Crime Free Housing Golf Course Valuation Lake Shore Valuation
165

Commercial Building Valuation Fundamentals
• St. Cloud State University (SCSU) Courses
Real Estate Principles Real Estate Finance Real Estate Investments Real Estate Appraisal Real Estate Property Management Real Estate Law
Degrees:
St. Cloud State University, St. Cloud, Minnesota - Bachelor of Science Degree 1111990 Major: Real Estate
Normandale Community College, Bloomington, Minnesota - Associates of Art Degree 6/1983
Professional Designations:
Senior Accredited Minnesota Assessor (SAMA)
Licenses:
Senior Accredited Minnesota Assessor (SAMA) #2153
Professional Memberships:
Minnesota Association of Assessing Officers International Association of Assessing Officers
.166

APPENDIX 1
REFERENCES
/ Eckert, Joseph K., ed. Property Appraisal and Assessment Administration. Chicago: The International Association of Assessing Officers, 1990. 80.
2 Shea-Joyce, Stephanie, ed. Appraising Residential Properties. Chicago: American Institute of Real Estate Appraisers, 1988. 15.
3 Eckert, Joseph K., ed. Property Appraisal and Assessment Administration. Chicago: The International Association of Assessing Officers, 1990. 80.
4 Eckert, Joseph K., ed. Property Appraisal and Assessment Administration. Chicago: The International Association of Assessing Officers, 1990. 654.
5 American Institute of Real Estate Appraisers. The Dictionary of Real Estate Appraisal. 2"l ed. Chicago: American Institute of Real Estate Appraisers, 1989. 149.
6 American Institute of Real Estate Appraisers. The Dictionary of Real Estate Appraisal. 21'1 ed. Chicago: American Institute of Real Estate Appraisers, 1989. 295.
7 American Institute of Real Estate Appraisers. The Dictionary of Real Estate Appraisal. 21-11i ed. Chicago: American Institute of Real Estate Appraisers, 1989. 293.
8 American Institute of Real Estate Appraisers. The Dictionary of Real Estate Appraisal. 2"l ed. Chicago: American Institute of Real Estate Appraisers, 1989. 23.
9 American Institute of Real Estate Appraisers. The Dictionary of Real Estate Appraisal. 2—nd ed. Chicago: American Institute of Real Estate Appraisers, 1989. 64.
" Harris, Jack C. and Jack P. Friedman. Barron's Real Estate Handbook. 211-21 Edition. New York: Barron's, 1988. 155.
ii Eckert, Joseph K., ed. Property Appraisal and Assessment Administration. Chicago: The International Association of Assessing Officers, 1990. 661.
12 Eckert, Joseph K., ed. Property Appraisal and Assessment Administration. Chicago: The International Association of Assessing Officers, 1990. 660.
13 Eckert, Joseph K., ed. Property Appraisal and Assessment Administration. Chicago: The International Association of Assessing Officers, 1990. 641.
167
14 Eckert, Joseph K., ed. Property Appraisal and Assessment Administration. Chicago: The International Association of Assessing Officers, 1990. 219.
15 Eckert, Joseph K., ed. Property Appraisal and Assessment Administration. Chicago: The International Association of Assessing Officers, 1990. 647.
16 Harris, Jack C. and Jack P. Friedman. Barron's Real Estate Handbook. 2'1 Edition. New York: Barron's, 1988. 258.
168