cost effective concrete pavement cross sections -...
TRANSCRIPT

REPORT NUMBER: WI/SPR-03-05
COST EFFECTIVE CONCRETE PAVEMENT CROSS SECTIONS
FINAL REPORT
JUNE 2006

Technical Report Documentation Page 1. Report Number WI/SPR-03-05
2. Government Accession No.
3. Recipient's Catalog No.
5. Report Date June 2006
4. Title and Subtitle Cost Effective Concrete Pavement Cross Sections – Final Report
6. Performing Organization Code 7. Author(s) James A. Crovetti
8. Performing Organization Report No. 10. Work Unit No. (TRAIS)
9. Performing Organization Name and Address Marquette University Dept. of Civil & Environmental Engineering P.O. Box 1881 Milwaukee, WI 53201-1881
11. Contract or Grant No. WisDOT SPR # 0092-45-79, 0092-45-80 and 0687-45-79 13. Type of Report and Period Covered Final Report; 1995 - 2005
12. Sponsoring Agency Name and Address Wisconsin Department of Transportation Division of Transportation System Development Bureau of Technical Services Pavements Section Madison, WI 53704
14. Sponsoring Agency Code WisDOT Research Study #95-03
15. Supplementary Notes
16. Abstract This report presents the findings of a study of alternate pavement designs targeted at reducing the initial construction costs of concrete pavements without compromising pavement performance. Test sections were constructed with alternate dowel materials, reduced dowel placements, variable thickness concrete slabs and alternate surface and subsurface drainage details. Performance data was collected out to 5 and 7 years after construction. The study results indicate that FRP composite dowels may not be a practical alternative to conventional epoxy coated steel dowels due to their reduced rigidity, which results in lower deflection load transfer capacities at transverse joints. Ride quality measures also indicate higher IRI values on sections constructed with FRP composite dowels. Study results for sections constructed with reduced placements of solid stainless steel dowels also indicate reduced load transfer capacity and increased IRI values as compared to similarly designed sections incorporating epoxy coated dowels. Reduced doweling in the driving lane wheel paths also is shown to be detrimental to performance for most constructed test sections. The performance of sections with reduced doweling in the passing lane wheel paths indicates that this alternate may be justifiable to maintain performance trends similar to those exhibited by the driving lane with standard dowel placements. Performance data from sections constructed with variable slab geometry and drainage designs indicate that one-way surface and base drainage designs are performing as well or better than standard crowned pavements with two-way base drainage. The drainage capacity of the base layer, constructed with open graded number 1 stone, appears sufficient to handle all infiltrated water. 17. Key Words FRP composite dowels, stainless steel dowels, alternate dowel locations, alternate dowel spacing, variable slab thickness
18. Distribution Statement
Distribution unlimited, authorized for public release
19. Security Classif.
(of this report) Unclassified
20. Security Classif. (of
this page) Unclassified
21. No. of Pages 99
22. Price

COST EFFECTIVE CONCRETE PAVEMENT CROSS SECTIONS
FINAL REPORT WI/SPR-03-05 WisDOT Highway Research Study # 95-03 by
James A. Crovetti, Ph.D.
Marquette University Department of Civil and Environmental Engineering
P.O. Box 1881, Milwaukee, WI 53201-1881 June 2006 for WISCONSIN DEPARTMENT OF TRANSPORTATION DIVISION OF TRANSPORTATION SYSTEM DEVELOPMENT BUREAU OF TECHNICAL SERVICES PAVEMENTS SECTION 3502 KINSMAN BOULEVARD, MADISON, WI 53704 The Pavements Section of the Division of Transportation System Development, Bureau of Technical Services, conducts and manages the pavement research program of the Wisconsin Department of Transportation. The Federal Highway Administration provides financial and technical assistance for these activities, including review and approval of publications. This publication does not endorse or approve any commercial product even though trade names may be cited, does not necessarily reflect official views or polices of the agency, and does not constitute a standard, specification or regulation.
i

ACKNOWLEDGEMENTS
The author gratefully acknowledges the support of Ms. Debra Bischoff of the
Wisconsin Department of Transportation (WisDOT) during the conduct of this study. The
following manufacturers are also acknowledged for providing dowel bars to WisDOT for
participation in this research effort: MMFG, Glasforms, Creative Pultrusions, RJD, Slater
Steels, Avesta Sheffield, and Damascus-Bishop Tube Company. The Composites Institute
and the Specialty Steel Industry of North America (SSNIA) are also gratefully
acknowledged for providing assistance with project coordination.
ii

TABLE OF CONTENTS 1.0 Introduction ................................................................................................................1
1.1 Project Background .........................................................................................1 1.2 Test Section Descriptions................................................................................5
2.0 Laboratory Tests ........................................................................................................9
2.1 Introduction......................................................................................................9 2.2 Load-Deflection Tests .....................................................................................9 2.3 Pull-Out Tests – Non-Oiled Dowels...............................................................16 2.4 Pull-Out Tests – Oiled Dowels.......................................................................19
3.0 Test Section Construction ........................................................................................28
3.1 Introduction....................................................................................................28 3.2 WIS 29 Abbotsford ........................................................................................28 3.3 WIS 29 Wittenberg ........................................................................................31 3.4 WIS 29 Tilleda ...............................................................................................34
4.0 Performance Monitoring...........................................................................................37
4.1 Introduction....................................................................................................37 4.2 Falling Weight Deflectometer (FWD) Analysis...............................................37
4.2.1 Pre-Paving Deflection Testing .......................................................37 4.2.2 Post-Paving Backcalculation of Pavement Parameters .................39 4.2.3 Post-Paving Transverse Joint Analysis..........................................41 4.2.4 Pre-Paving Deflection Testing – WIS 29 Abbotsford .....................43 4.2.5 Post-Paving Deflection Testing – WIS 29 Abbotsford....................47 4.2.6 Post-Paving Deflection Testing – WIS 29 Wittenberg....................57 4.2.7 Post-Paving Deflection Testing – WIS 29 Tilleda...........................62
4.3 Ride Quality Measures ..................................................................................68 4.3.1 WIS 29 Abbotsford.........................................................................68 4.3.2 WIS 29 Wittenberg.........................................................................73 4.3.3 WIS 29 Tilleda ...............................................................................77
4.4 Distress Measures.........................................................................................80 4.4.1 WIS 29 Abbotsford.........................................................................80 4.4.2 WIS 29 Wittenberg.........................................................................84 4.4.3 WIS 29 Tilleda ...............................................................................86
iii

TABLE OF CONTENTS (Cont.) 5.0 Construction Cost Considerations............................................................................88
5.1 WIS 29 Abbotsford ........................................................................................88 5.2 WIS 29 Wittenberg ........................................................................................89 5.3 WIS 29 Tilleda ..............................................................................................89 5.4 Initial Construction Costs..............................................................................90
5.4.1 Alternate Dowel Placements..........................................................92 5.4.2 Trapezoidal Cross Sections...........................................................92 5.4.3 Alternative Drainage Designs ........................................................92 5.4.4 Alternative Dowel Materials ...........................................................93
6.0 Summary and Recommendations ............................................................................94
6.1 Summary of Study Findings ..........................................................................94 6.2 Recommendations for Further Study.............................................................99
APPENDIX A – Test section Location Maps
iv

1
CHAPTER 1 INTRODUCTION 1.0 Introduction
This report presents details relating to the design, construction, and performance of
concrete pavement test sections constructed in the State of Wisconsin along WIS 29 in
Clark, Marathon and Shawano Counties. These test sections were constructed during the
summers of 1997 and 1999 to validate the constructability and performance of cost-
effective alternative concrete pavement designs incorporating variable dowel bar
placements, dowel bar materials, slab thicknesses, and drainage details.
Chapter 1 of this report provides project background information. Results of
laboratory tests conducted on test specimens fabricated prior to construction are provided
in Chapter 2. Details on the construction of each test section are provided in Chapter 3.
Chapter 4 provides the results of performance testing conducted immediately after
construction and over the study duration of each test section. Chapter 5 provides an
analysis of initial construction costs for the various test sections. A summary of all research
results and recommendations for further research is provided in Chapter 6.
1.1 Project Background
The present pavement selection policy of the Wisconsin Department of
Transportation (WisDOT), as provided in Procedure 14-10-10 of the Facilities Development
Manual, limits the design alternatives for Portland cement concrete (PCC) pavements and
inhibits the designer’s ability to select cross-sections deviating from uniform slab
thicknesses with doweled transverse joints. Currently, uniform slab thicknesses and
conventional joint load transfer devices are incorporated into the design based on the
heavy truck traffic in the driving lane. While this strategy provides for adequate pavement
structure in this truck lane to limit faulting and slab cracking to tolerable levels, there is a
potential for over-design in other traffic lanes which may experience significantly lower
Equivalent Single Axle Load (ESAL) applications over the service life of the pavement.
Pavement design analyses were conducted to investigate the effects of variable slab
thickness within and/or across traffic lanes, variable load transfer designs, and alternative

2
base layer drainage designs.
Four alternate dowel patterns were developed to reduce the number of dowel bars
installed across transverse pavement joints. These patterns were developed with the
constraint that dowel positions had to be consistent with dowel bar insertion (DBI)
equipment currently used within the State of Wisconsin. This constraint allowed for the
removal of certain dowels but did not allow for any repositioning of dowels, i.e., the 12-inch
center-to-center placement openings could not be changed. A minimum of three dowels
per wheel path was established and used for one alternate to provide marginal load transfer
capacity across the transverse joints of both travel lanes. Additional dowels were
positioned within the outer wheel path of the driving lane and/or near the slab edge to
increase the load transfer capacity of these critical pavement locations. This selection
strategy resulted in four dowel placement alternates which are illustrated in Figure 1.1.1.
In addition to the dowel placement alternates, test sections were also constructed
using alternative dowel materials which may be considered as corrosion resistant, including
fiber reinforced polymer (FRP) composite dowels, solid stainless steel dowels, and hollow-
core, mortar-filled (hollow-filled) stainless steel dowels. Variable thickness slab designs
were also developed in an effort to reduce the initial paving costs while maintaining the
constructability of the pavement structure. Two trapezoidal PCC slab cross-sections were
developed, each with the fully-reduced slab thickness coincident with the median edge of
the pavement. For one design alternate, the reduced median-edge slab thickness
increases linearly to the full design thickness at the center-lane joint, resulting in a
trapezoidal passing lane and full thickness driving lane. For the second design alternate,
the reduced median-edge slab thickness increases linearly across both lanes. For the
variable slab thickness designs, the passing lane width was increased to 15 ft (striped at 12
ft) to minimize the potential for extreme edge loadings along the thinnest portion of the
slab. Figure 1.1.2 provides illustrations of the trapezoidal slab thickness designs.

3
Figure 1.1.1 Standard and Alternate Dowel Placements
Standard placement – 12 inch c-c spacing, 26 dowels per joint
Alternate 1- 3 dowels in each wheel path at 12 in c-c spacing, 12 dowels per joint
Alternate 2 - 4 dowels in outer wheel path and 3 dowels in other wheel paths, 12 in c-c spacing, 13 dowels per joint
Alternate 4 - 3 dowels in each wheel path at 12 in c-c spacing, 1 dowel near outer edge, 13 dowels per joint
Alternate 3 - 4 dowels in outer wheel path and 3 dowels in other wheel paths, 12 in c-c spacing, 1 dowel at outer edge, 14 dowels per joint
Dowel Location Removed Dowel
12 ft passing lane
14 ft passing lane

4
Figure 1.1.2: Variable Slab Thickness and Drainage Designs (not to scale)
14 ft Driving Lane 15 ft Passing Lane
14 ft Driving Lane
14 ft Driving Lane 15 ft Passing Lane
15 ft Passing Lane
15 ft Passing Lane 14 ft Driving Lane
14 ft Driving Lane 12 ft Passing Lane
2%
2%
2%
2%
2%
2%
2%
2.57%
2%
2%
2%
2%
2%
0.89%
2%
10” 10”
8”
8”
10”
8”
10”
10”
10”
10”
9.03”
10”
10”
10”
10”
1%
Standard Section - 2-way surface & base drainage, uniform slab thickness
TS4 - 2-way surface & base drainage, trapezoidal passing lane
TS3 - 2-way surface & 1-way base drainage, trapezoidal passing lane
TS2 - 1-way surface & base drainage, trapezoidal passing & driving lanes
TS1 - 1-way surface & base drainage, uniform slab thickness

5
Alternative subsurface drainage layer designs were also developed in an effort to
reduce initial paving costs. The primary focus of these designs was to eliminate the median
side drainage details for typical tangent pavement sections, including the removal of the
longitudinal drainage trench/pipe and the transverse pipe/outlets. This focus was expanded
to include alternate surface drainage designs and variable slab thicknesses, resulting in
four separate design alternates as illustrated by Test Sections (TS) 1, 2, 3 and 4 in Figure
1.1.2. Note that TS 1 represents a tangent pavement section incorporating the typical
design details of a super-elevated pavement section.
1.2 Test Section Description
Ten test sections incorporating all four alternative dowel patterns and all of the
alternate dowel materials were constructed in 1997 within the eastbound lanes of WIS 29 in
Clark County between Owen and Abbotsford, herein referred to as WIS 29 Abbotsford.
Test sections incorporating alternative dowel placements, alternate dowel materials
and variable slab thicknesses were constructed in 1997 within the eastbound and
westbound lanes of WIS 29 in Marathon County between Hatley and Wittenberg, herein
referred to as WIS 29 Wittenberg. Three test sections constructed along the eastbound
lanes of WIS 29 Wittenberg incorporated FRP composite and solid stainless steel dowel
bars. One test section incorporating variable slab thickness, and another incorporating
placement alternate 1 with standard epoxy coated steel dowels, were constructed within the
westbound lanes of WIS 29 Wittenberg. All test sections constructed on WIS 29
Wittenberg are designated Strategic Highway Research Program (SHRP) test sections.
Test sections incorporating variable slab thicknesses and non-traditional surface
and/or base layer drainage details, including one-way surface and/or one-way base
drainage, were constructed in 1999 within the westbound lanes of WIS 29 in Shawano
County between Tilleda and Wittenberg, herein referred to as WIS 29 Tilleda. WIS 29
Tilleda test sections with variable slab thickness were constructed with a passing lane width
of 15 ft. A test section incorporating one-way surface and one-way base drainage with a
constant slab thickness was also constructed within the westbound lanes of WIS 29 Tilleda.

6
Descriptions of all test section design details, including test section codes utilized in
this report as well as SHRP test section designations, where applicable, are provided in
Tables 1.2.1 through 1.2.3. Appendix A provides location maps for all constructed test
sections.
Table 1.2.1 WIS 29 Abbotsford Test Section Design Details Description
Report Code
11-inch doweled JPCP, placement alternate 1 using standard epoxy coated dowels (3 dowels in each wheelpath, 12 per joint)
1E 11-inch doweled JPCP, placement alternate 2 using standard epoxy coated dowels (4 dowels in outer wheelpath of driving lane, 3 in other wheelpaths, 13 per joint)
2E
11-inch doweled JPCP, placement alternate 3 using standard epoxy coated dowels (4 dowels in outer wheelpath of driving lane, 3 in other wheelpaths, one at slab edge, 14 per joint)
3E
11-inch doweled JPCP, placement alternate 3 using solid stainless steel dowels supplied by Avesta Sheffield (4 dowels in outer wheelpath of driving lane, 3 in other wheelpaths, one at slab edge, 14 per joint)
3S
11-inch doweled JPCP, placement alternate 4 using standard epoxy coated dowels (3 dowels in each wheelpath, one near edge, 13 per joint)
4E 11-inch doweled JPCP, placement alternate 4 using solid stainless steel dowels supplied by Avesta Sheffield (3 dowels in each wheelpath, one near edge, 13 per joint)
4S
11-inch doweled JPCP, standard dowel placement using FRP composite dowels supplied by Creative Pultrusions (26 per joint)
CP 11-inch doweled JPCP, standard dowel placement using FRP composite dowels supplied by Glasforms (26 per joint)
GF 11-inch doweled JPCP, standard dowel placement using FRP composite dowels supplied by RJD (26 per joint)
RJD 11-inch doweled JPCP, standard dowel placement using hollow-core, mortar-filled stainless steel dowels supplied by Damascus-Bishop Tube Company (26 per joint)
HF
11-inch doweled JPCP, standard dowel placement (Control) using standard epoxy coated dowels (26 per joint)
C1, C2
7
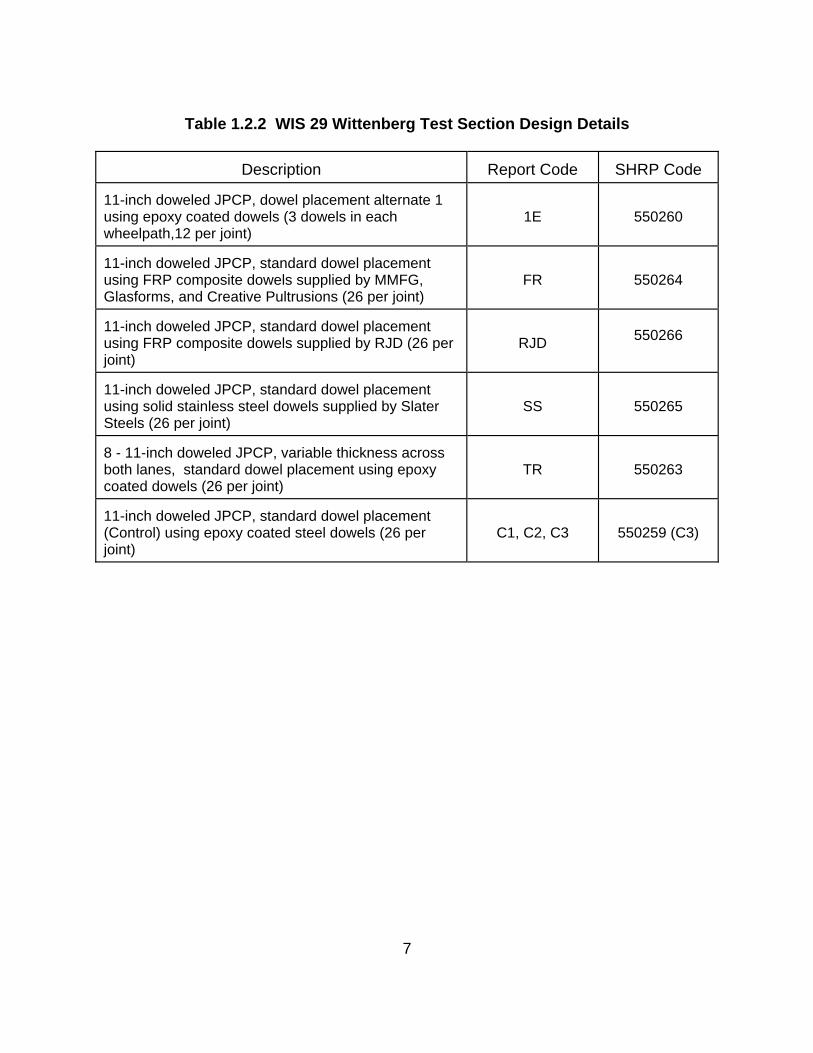
Table 1.2.2 WIS 29 Wittenberg Test Section Design Details Description
Report Code
SHRP Code
11-inch doweled JPCP, dowel placement alternate 1 using epoxy coated dowels (3 dowels in each wheelpath,12 per joint)
1E
550260
11-inch doweled JPCP, standard dowel placement using FRP composite dowels supplied by MMFG, Glasforms, and Creative Pultrusions (26 per joint)
FR
550264
11-inch doweled JPCP, standard dowel placement using FRP composite dowels supplied by RJD (26 per joint)
RJD
550266
11-inch doweled JPCP, standard dowel placement using solid stainless steel dowels supplied by Slater Steels (26 per joint)
SS
550265
8 - 11-inch doweled JPCP, variable thickness across both lanes, standard dowel placement using epoxy coated dowels (26 per joint)
TR
550263
11-inch doweled JPCP, standard dowel placement (Control) using epoxy coated steel dowels (26 per joint)
C1, C2, C3
550259 (C3)

8
Table 1.2.3 WIS 29 Tilleda Test Section Design Details Description
Report Code
Doweled JPCP, variable passing lane slab thickness (8 – 10 inches), widened passing lane (15 ft), two-way surface drainage (2%), two-way base layer drainage with passing lane base slope reduced from 2% to 0.89%, uniform drainage layer thickness (4-inch)
TS4
Doweled JPCP, variable passing lane slab thickness (8 – 10 inches), widened passing lane (15 ft), variable passing lane drainage layer thickness (4 – 7.3 inches) and uniform driving lane drainage layer thickness (7.3 inches), two-way surface drainage (2%), one-way base layer drainage, passing lane base slope reduced from 2% to1%, no inside shoulder edge drain
TS3
Doweled JPCP, uniform slab thickness (10-inch), widened passing lane (15 ft), uniform drainage layer thickness (4-inch), two-way surface and base layer drainage (2%)
STD
Doweled JPCP, variable pavement thickness across both lanes (8 – 10 inches), one-way surface drainage (2%), one-way base layer drainage (2.57%), uniform drainage layer thickness (4-inch), no inside shoulder edge drain
TS2
Doweled JPCP, uniform pavement thickness across both lanes (10 inches), one-way surface drainage and base layer drainage (2%), uniform drainage layer thickness (4-inch), no inside shoulder edge drain
TS1

9
CHAPTER 2 LABORATORY TESTS
2.1 Introduction
Laboratory testing, including joint deflection tests and dowel bar pull-out tests, were
conducted at Marquette University to investigate the behavior of doweled joints under
various loading conditions. Initial tests were conducted prior to pavement construction
using sample dowels provided by the manufacturers. Additional tests were conducted
using dowels obtained during the construction of WIS 29 Abbotsford.
2.2 Load-Deflection Tests
Load-defection tests were conducted in accordance with AASHTO Designation
T 253-76 (1993), Standard Method of Test for Coated Dowel Bars. These tests provide an
indication of the load transfer capacity of the dowels under extreme loading conditions.
The transverse joint is simulated as a wide crack with no available aggregate interlock
across the joint (no shear transfer across joint faces) and the loaded slab is fully
unsupported. While these conditions are not likely to occur under normal service loading,
they do serve to isolate the contribution of the dowel in transferring load between adjacent
slabs. Under normal service conditions, this contribution reduces slab edge and corner
deflections under loading and reduces the potential for slab faulting, corner cracking, and/or
base pumping.
Rectangular test specimens, 12 inches wide by 11 inches deep by 48 inches long
were constructed using paving grade concrete supplied by Tews Company. Two full-depth
joints, each 3/8 inches wide, were formed 12 inches from each specimen end using wood
inserts. Centered holes on each insert allowed for the placement of an 18-inch long dowel
bar (1.5 inch diameter) across each joint. Dowel bars were positioned at the mid-depth of
the test specimens. Figure 2.2.1 provides a schematic illustration of the fabricated
specimens.

10
Figure 2.2.1: Schematic Illustration of Joint Deflection Test Specimen
Test specimens were fabricated with the various dowel bar materials envisioned for
construction, including standard epoxy coated steel (control), polished solid stainless steel,
and three types of composite dowels as manufactured by MMFG, Creative Pultrusions, and
Glasforms. Cast specimens were cured for 21 days prior to the start of testing. The
specimen ends were then placed on neoprene capped steel support pedestals and
clamped to restrict rotation during loading. The formed joints were positioned
approximately ½ inches inwards from the edge of the support pedestals to allow for the
placement of a linear variable displacement transducer (LVDT) on the underside of each
end to monitor displacement during loading. LVDTs were also positioned on the underside
of the central (loaded) portion of the specimen to monitor displacement.
12 in 24 in
12 in
12 in
11 in
3/8 in Joints
Encased Dowels
PCC EndBlock
PCC EndBlock
PCC CentralBlock

11
The test load was applied using a manually actuated ENERPAC hydraulic ram
mounted on a steel reaction frame. The load ram was centered on the test specimen.
Steel plates and arched steel blocks were positioned over the central portion of the
specimen to distribute the load uniformly across the center section of the specimen. Four
load cells were positioned near the corners of the arched steel block to monitor the applied
load. Load cell and LVDT data were collected with a Datronic data collection system using
a 2 Hz sampling rate. The load was increased at a rate of approximately 2000 lb/min until a
maximum of 5000 lb was obtained. Figure 2.2.2 provides a photo of the test set-up during
loading.
Figure 2.2.2: Joint Deflection Test Set-up

12
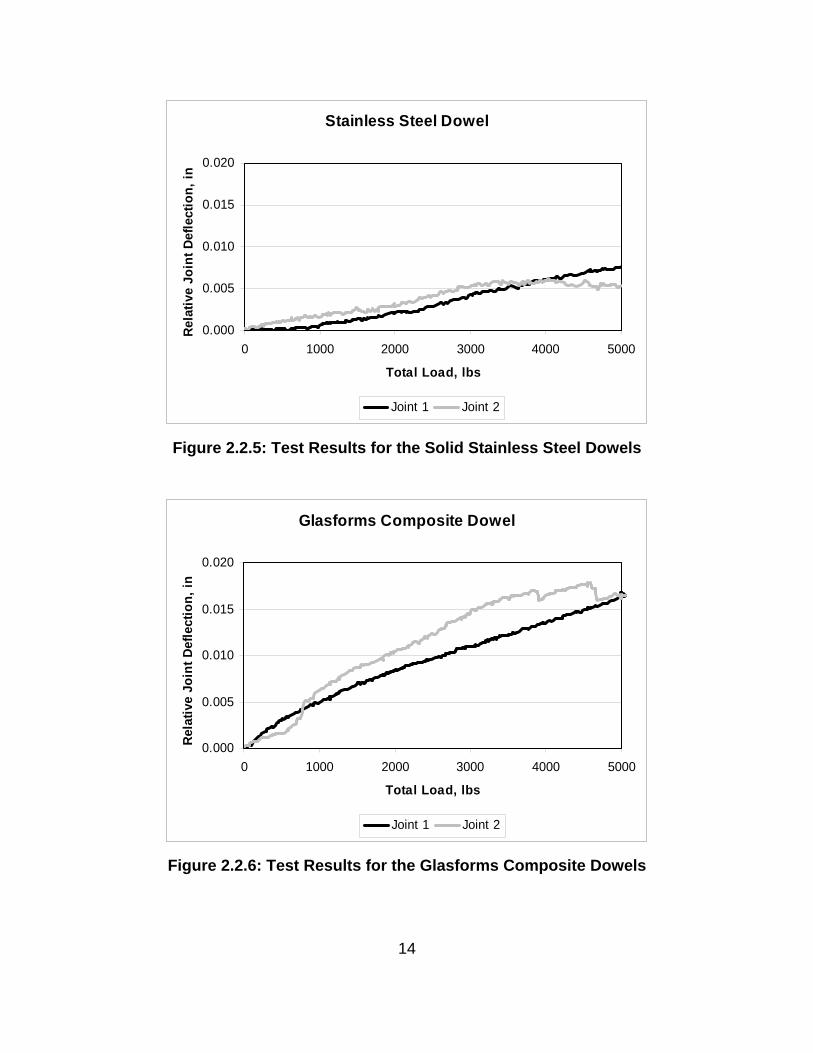
The maximum relative joint deflections, recorded at a load of 4,000 lb, are provided
in Table 2.2.1 and Figure 2.2.3. Figures 2.2.4 to 2.2.8 provide plots of the collected test
data. AASHTO T 253 test protocol stipulates a maximum relative joint deflection of 0.01
inches at a test load of 4,000 lb. As shown in Table 2.2.1 and the figures provided, all test
results, with the exception of the Glasforms specimen, met this criterion. Furthermore, the
composite dowel specimens exhibited higher relative joint deflections as compared to the
epoxy coated and solid stainless steel dowels, which may indicate the potential for lower
load transfer for in-service pavements constructed with composite dowels of this type.
Table 2.2.1: Summary of Joint Deflection Test Results
Relative Joint Deflection, inches
Dowel Type
Dowel Diameter
(inch)
Joint 1
Joint 2
Average
Epoxy Coated
1.52
0.006
0.008
0.0070
Stainless Steel
1.50
0.006
0.006
0.0060
Glasforms
1.50
0.013
0.016
0.0145
Creative
Pultrusions
1.50
0.009
0.010
0.0095
MMFG
1.49
0.008
0.007
0.0075

13
Figure 2.2.3: Joint Deflection Test Results
Expoy Coated Steel Dowel
0.000
0.005
0.010
0.015
0.020
0 1000 2000 3000 4000 5000
Total Load, lbs
Rel
ativ
e Jo
int D
efle
ctio
n, in
Joint 1 Joint 2
Figure 2.2.4: Test Results for the Epoxy Coated Steel Dowels
0.0
0.20.4
0.6
0.8
1.01.2
1.4
1.61.8
EpoxyCoated
StainlessSteel
Glasforms CreativePultrusions
MMFG
Rel
ativ
e Jo
int D
efle
ctio
n, 0
.01"
Joint 1 Joint 2
14
Stainless Steel Dowel
0.000
0.005
0.010
0.015
0.020
0 1000 2000 3000 4000 5000
Total Load, lbs
Rela
tive
Join
t Def
lect
ion,
in
Joint 1 Joint 2
Figure 2.2.5: Test Results for the Solid Stainless Steel Dowels
Glasforms Composite Dowel
0.000
0.005
0.010
0.015
0.020
0 1000 2000 3000 4000 5000
Total Load, lbs
Rel
ativ
e Jo
int D
efle
ctio
n, in
Joint 1 Joint 2
Figure 2.2.6: Test Results for the Glasforms Composite Dowels

15
MMFG Composite Dowel
0.000
0.005
0.010
0.015
0.020
0 1000 2000 3000 4000 5000
Total Load, lbs
Rela
tive
Join
t Def
lect
ion,
in
Joint 1 Joint 2
Figure 2.2.7: Test Results for the MMFG Composite Dowels
Creative Pultrusions Composite Dowel
0.000
0.005
0.010
0.015
0.020
0 1000 2000 3000 4000 5000
Total Load, lbs
Rel
ativ
e Jo
int D
efle
ctio
n, in
Joint 1 Joint 2
Figure 2.2.8: Test Results for the Creative Pultrusions Composite Dowels

16
2.3 Pull-Out Tests – Non-oiled Dowels
Dowel bar pull-out tests were conducted in accordance with AASHTO Designation
T 253-76 (1993), Standard Method of Test for Coated Dowel Bars. Rectangular test
specimens, 6 inches x 6 inches x 18 inches were cast in wooden forms using paving grade
concrete supplied by Tews Company. Dowel bars were positioned at the center of the 6 x
6-inch face, extending approximately 9 inches into the concrete beam. Figure 2.3.1
provides a schematic illustration of the fabricated specimens.
Figure 2.3.1: Schematic Illustration of Pull-Out Specimen
Concrete Block
Partially EncasedDowel Bar
Pull Rod
6 in
6 in
18 in

17
Pull-out tests were conducted prior to construction with non-oiled dowels supplied by the
manufacturers, including a standard epoxy coated steel bar (control), a polished solid
stainless steel bar, a brushed stainless steel bar, and three composite dowels as
manufactured by MMFG, Creative Pultrusions, and Glasforms. Cast specimens were
cured for 48 hours prior to the start of testing. Holes were drilled into the exposed ends of
the dowels to allow for the placement of a steel pull rod. Pull rods were threaded into the
steel dowels and epoxied into the composite dowels.
The pull-out specimens were mounted into a Riehle compression machine and the
pull rod was placed through the upper stationary head and capped. A dial gauge was
mounted onto the dowel with the indicator rod resting on the movable crosshead to monitor
relative displacements between the dowel and the moveable crosshead. Corresponding
pull-out loads were manually recorded off the digital display of the Riehle compression
machine. Figure 2.3.2 provides a photo of the pull-out test set-up.
Figure 2.3.2 Pull-Out Test Set-up

18
Tests were conducted using a crosshead movement rate of 0.03 in/min. This
movement slowly pushed the concrete block away from the restrained dowel. Load
readings were recorded for every 0.005 inches of relative dowel/concrete displacement, to
a total relative displacement of 0.05 inches. Additional readings were taken for every 0.05
inches of relative displacement to a total relative displacement of 0.5 inches.
The maximum pull-out loads and calculated maximum pull-out stresses are provided
in Table 2.3.1. Maximum pull-out stresses were calculated based on maximum pull-out
loads divided by the circumferential contact area between the dowel and the concrete at the
start of testing. The maximum pull-out load for the steel dowels (epoxy coated, brushed
stainless steel, polished stainless steel) typically occurred during the initial 0.05 inches of
relative displacement and then reduced significantly to a residual load level. The
roughened surface on the brushed stainless steel dowel resulted in a maximum pull-out
load which was 44% greater than the epoxy coated dowel whereas the maximum pull-out
load for the polished stainless steel dowel was approximately 39% lower than the epoxy
coated dowel.
Table 2.3.1: Summary of Pull-Out Tests on Non-Oiled Dowels
Dowel Bar Type
Maximum Pull-Out
Load, lb
Circumferential
Contact Area, in2
Maximum Pull-Out
Stress, psi
Epoxy Coated
4000
43.0
93 Polished Stainless
Steel
2420
42.8
57 Brushed Stainless
Steel
5725
42.7
134
Glasforms
430
43.3
10
Creative Pultrusions
155
41.7
4
MMFG
640
40.8
16

19
The maximum pull-out load for the composite dowels generally occurred within the
initial 0.05 inches of relative dowel displacement. Unlike the steel dowels, the residual
loads thereafter did not reduce significantly from the maximum value; however, the
maximum pull-out loads for all composite dowels tested were significantly reduced as
compared to the steel dowels.
2.4 Pull-Out Tests - Oiled Dowels
Pull-out tests were also conducted using the six different 1.5-inch nominal diameter
dowel types obtained during construction on WIS 29 Abbotsford, including the standard
epoxy coated steel dowels (control), polished solid stainless steel, polished hollow-core
stainless steel (grout filled), and composite dowels as manufactured by RJD, Creative
Pultrusions, and Glasforms. Rectangular test specimens, 6 inches x 6 inches x 12 inches
were cast in a specially fabricated steel form using fly ash concrete produced in the
Marquette lab. The mixture was proportioned according to the job mix used during
construction on WIS 29 Abbotsford. All dowel bars were oiled prior to casting using form oil
obtained during pavement construction. The dowels were positioned such that the dowel
would extend 9 inches into the beam at the center of the 6 inch x 6 inch face.
Initial pull-out tests were conducted after 48 hours of concrete curing. The test
specimens were then cured an additional 12 days prior to subjecting to 50 cycles of freeze-
thaw in a 10% by mass sodium chloride solution. After freeze-thaw conditioning, a second
pull-out test was conducted. During both test series, the data recording apparatus was
modified from the initial apparatus used in the uncoated tests to allow for continuous data
collection during the test. The modified apparatus utilized four load cells and two LVDTs for
monitoring load and relative dowel displacement, respectively. Load cell and LVDT data
were collected with a Strawberry Tree data collection system set at a 5 Hz sampling rate.
Figure 2.4.1 illustrates the modified test set-up.

20
Figure 2.4.1: Modified Pull-Out Test Set-Up
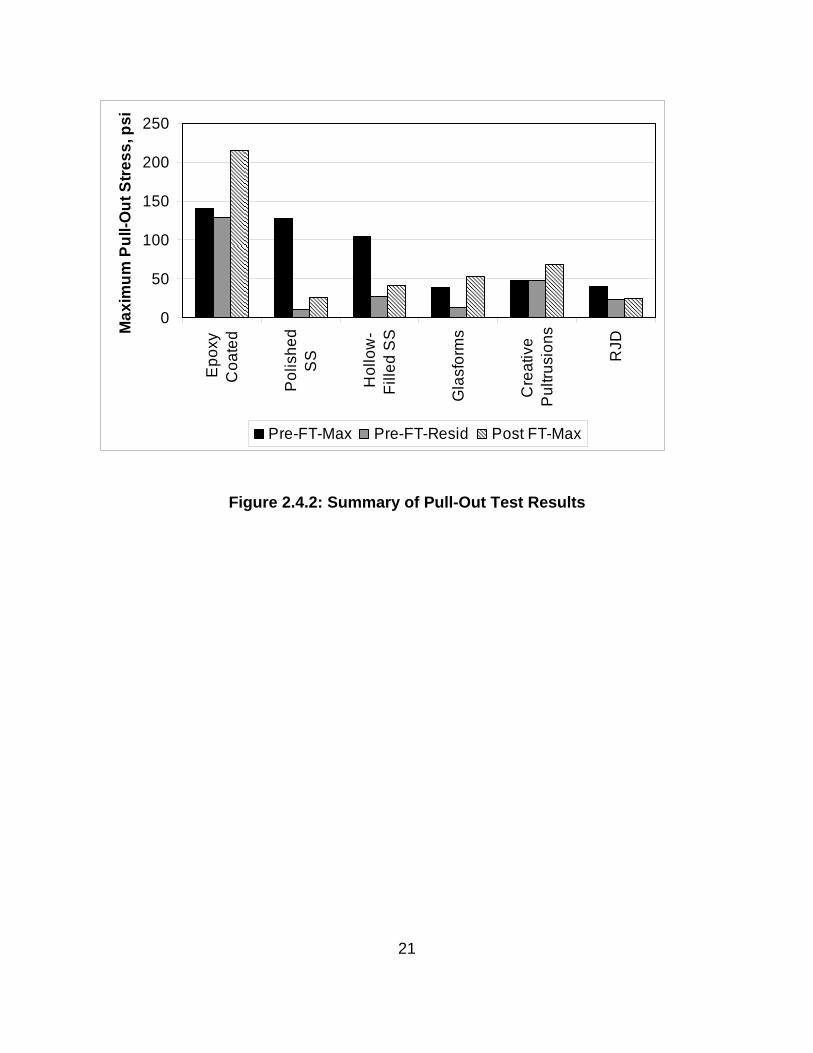
The maximum pull-out loads and calculated maximum pull-out stresses and residual
pull-out stresses for the pre-freeze thaw tests are provided in Table 2.4.1. Table 2.4.2
provides maximum values for the post-freeze thaw testing. Maximum pull-out stresses
were again calculated based on maximum pull-out loads divided by the circumferential
contact area between the dowel and the concrete at the start of each series of testing.
Figure 2.4.2 illustrates a summary of the maximum pull-out stresses for all tests as well as
the residual pull-out stress for the pre-freeze thaw testing. Figures 2.4.3 to 2.4.8 illustrate
the pull-out stress trends for all tested dowels.
21
0
50
100
150
200
250
Epo
xyC
oate
d
Pol
ishe
dS
S
Hol
low
-Fi
lled
SS
Gla
sfor
ms
Cre
ativ
eP
ultru
sion
s
RJD
Max
imum
Pul
l-Out
Stre
ss, p
si
Pre-FT-Max Pre-FT-Resid Post FT-Max
Figure 2.4.2: Summary of Pull-Out Test Results

22
Table 2.4.1: Summary of Pre-Freeze Thaw Pull-Out Tests on Oiled Dowels
Dowel Bar
Type
Maximum
Pull-Out Load lb
Circumferential Contact Area
in2
Maximum Pull-Out
Stress psi
Residual Pull-Out
Stress psi
Epoxy Coated
5876
41.6
141
130
Polished Stainless
Steel
5159
40.3
128
10
Hollow-Filled
Stainless Steel
4576
43.8
104
27
Glasforms
1604
41.2
38
13
Creative
Pultrusions
1943
41.3
46
48
RJD
1694
42.4
40
23
Table 2.4.2: Summary of Post-Freeze Thaw Pull-Out Tests on Oiled Dowels
Dowel Bar
Type
Maximum
Pull-Out Load lb
Circumferential Contact
Area in2
Maximum Pull-Out
Stress psi
Epoxy Coated
8493
39.4
216
Polished Stainless
Steel
995
38.0
25
Hollow-Filled Stainless
Steel
1716
41.5
41
Glasforms
2064
38.9
53
Creative Pultrusions
2630
38.9
68
RJD
974
40.1
24

23
The maximum pull-out stresses recorded during pre-freeze thaw testing of the oiled
dowels typically occurred during the initial 0.002 inches of dowel displacement, likely
indicating the force necessary to release the bond between the dowel end and concrete.
After peak readings, the pull-out stresses typically reduced to a significantly lower residual
level. After freeze-thaw conditioning, the peak pull-out stresses again typically occurred
during the initial 0.002 inches of displacement. In some cases this post-freeze thaw
maximum pull-out stress was approximately equal to the pre-freeze thaw residual pull-out
stress. This may be expected due to the breaking of the bond between the dowel end and
the PCC during pre-freeze thaw testing. However, in other cases the post-freeze thaw
maximum pull-out stress was greater than the pre-freeze thaw maximum value, which
cannot be explained by the dowel end release during pre-freeze thaw testing.
A notable exception to this trend was the epoxy coated dowel (Figure 2.4.3). During
pre-freeze thaw testing, the peak pull-out load occurred at approximately 0.05 inches of
displacement and only reduced slightly to a residual load that remained essentially constant
to a displacement of approximately 0.35 inches. The pull-out load then began to increase
with increasing displacements for the remaining 0.15 inches of displacement. After freeze-
thaw conditioning, pull-out loads again continually increased with increasing displacement,
with the most significant increase occurring during the initial 0.05 inches of displacement.
Pull-out stresses recorded for the composite dowels also revealed some
inconsistencies in behavior. As shown in Figures 2.4.6 and 2.4.7 for the RJD and
Glasforms dowels, the stress paths during relaxation include noticeable oscillations,
resulting in short-term stress “bumps” up to approximately 5 psi. In Figure 2.4.8, which
illustrates the stress paths for the Creative Pultrusions dowel, the post-freeze thaw stress
gain after initial relaxation is accompanied by significant “stepping” approaching 20 psi.

24
Epoxy Coated Steel Dowel
0.00
50.00
100.00
150.00
200.00
250.00
0 0.1 0.2 0.3 0.4 0.5
Relative Displacement, in
Pul
l-Out
Str
ess,
psi
Pre-FT Post-FT
Figure 2.4.3: Pull-Out Stress Trends for the Epoxy Coated Steel Dowel
Polished Stainless Dowel
0
20
40
60
80
100
120
140
0 0.1 0.2 0.3 0.4 0.5
Relative Displacement, in
Pull-
Out
Stre
ss, p
si
Pre-FT Post-FT
Figure 2.4.4: Pull-Out Stress Trends for the Solid Stainless Steel Dowel

25
Hollow-Filled Dowel
0
20
40
60
80
100
120
0 0.1 0.2 0.3 0.4 0.5
Relative Displacement, in
Pull-
Out
Stre
ss, p
si
Pre-FT
Figure 2.4.5: Pull-Out Stress Trends for the Hollow-Filled Dowel
RJD Composite Dowel
05
101520253035404550
0 0.1 0.2 0.3 0.4 0.5
Relative Displacement, in
Pul
l-Out
Stre
ss, p
si
Pre-FT Post-FT
Figure 2.4.6: Pull-Out Stress Trends for the RJD Composite Dowel

26
GlasForms Dowel
0
10
20
30
40
50
60
0.0 0.1 0.2 0.3 0.4 0.5
Relative Displacement, in
Pul
l-Out
Str
ess,
psi
Pre-FT Post- FT
Figure 2.4.7: Pull-Out Stress Trends for the Glasforms Composite Dowel
Creative Pultrusions Dowel
01020304050607080
0 0.1 0.2 0.3 0.4 0.5
Relative Displacement, in
Pul
l-Out
Stre
ss, p
si
Pre-FT Post-FT
Figure 2.4.8: Pull-Out Stress Trends for the Creative Pultrusions Composite Dowel

27
After completion of the pull-out tests the concrete blocks were split to reveal the
surface of the embedded dowels. No signs of corrosion were observed. Striations were
noted on the surfaces of all dowels and the exposed surfaces of the polished stainless steel
dowels resembled the brushed stainless steel surfaces of the dowels used during the initial,
non-oiled tests.

28
CHAPTER 3 TEST SECTION CONSTRUCTION
3.1 Introduction
This chapter provides details relating to the construction of each test section.
Information on each section was obtained from project plans and from observations of the
on-site research staff during construction operations.
3.2 WIS 29 Abbotsford
Paving of the eastbound lanes on WIS 29 Abbotsford incorporating all test sections
was completed by Streu Construction Company during the period of September 3 - 18,
1997 using a Gomaco paver equipped with an automatic dowel bar inserter. The limits of
paving were included as part of two separate paving projects. The western portion of
paving was included under State project number 1052-08-79 which was designed as a
metric project. The eastern portion of paving was included under State project number
1052-08-77. Both projects were part of planned WIS 29 improvements and represented a
reconstruction of the pre-existing 2-lane WIS 29 jointed plain concrete pavement (JPCP).
Planned improvements completed during the previous year added two westbound lanes to
WIS 29 in this project location. These lanes were used for bi-directional traffic during
construction of the WIS 29 Abbotsford test sections.
The standard pavement section includes a 26-ft wide, 11-inch thick doweled JPCP
with hot mix asphalt shoulders. The JPCP slab was placed over the existing 6-inch
crushed aggregate base and 9-inch granular subbase. Crushed aggregate materials from
the existing shoulders were used in combination with new crushed aggregates to provide a
re-shaped base layer of variable thickness above the existing crushed aggregate base
layer. The dowel bars were 1.5 inches in diameter and were placed at 12-inch c-c spacings
across the transverse joints (26 per joint). The eastern end of the project (1052-08-79) was
designed for a 20-year ESAL value of 11,366,100 based on WisDOT design procedures
using a 1993 construction year ADT of 7,925, a 2013 design year ADT of 10,300 and 18%
heavy truck traffic. The western end of the project (1052-08-77) was designed for a 20-
year ESAL value of 9,380,500 based on WisDOT design procedures using a 1993

29
construction year ADT of 6,450, a 2013 design year ADT of 8,600 and 27% heavy truck
traffic.
All paving within the limits of test section construction was completed using a single
paver configuration, which provided for a 25.6-ft paved width with repetitive random joint
spacings of 17-20-18-19 ft. The dowel bar inserter utilized fixed dowel spacings of 12
inches throughout the central portions of the slabs. The spacing between the outer dowel
and the next dowel inwards was reduced to approximately 9 inches on both slab edges to
account for the reduced paving width (25.6 ft versus the 26-ft standard). Each outer dowel
was positioned at 6 inches from the slab edge.
Paving progressed from west to east with minimal disruptions due to weather and/or
alternate dowel materials and placement configurations. On four of the twelve days of
paving, the dowel bar inserter was modified during paving to adjust for changes in dowel
bar placement alternates. These modifications required approximately five minutes and
resulted in minimal paving delays. A slight reduction in the travel speed of the dowel bar
carriage was required during placement of the composite dowels due to their light weight
which caused excessive rebound at normal carriage speeds.
Table 3.2.1 provides a daily summary of the paving operations and related test
section construction. Placement markers denoting the limits of test section paving were
fabricated and placed by WisDOT staff near the right-of-way limits on the south edge of the
highway. After construction, representative sections of approximately 528 ft were selected
from within each test section for long-term monitoring. Each monitoring section included 29
transverse joints with the exception of the hollow-filled stainless steel dowels where only 20
joints were constructed. Table 3.2.2 provides the station limits for each selected monitoring
section, which represent the center of each slab directly outside the first and last joints
included within the monitoring sections. Blue markers denoting the limits of each
monitoring section were placed by WisDOT staff along the south edge of the highway near
the ROW limits.

30
Table 3.2.1 Paving Summary - WIS 29 Abbotsford
Date
Start Station
End
Station
Comments (1)
09-03-97
80+730
79+760
Paving with standard dowel placement using epoxy coated dowels.
09-04-97
79+760
78+777
Paving with standard dowel placement using epoxy coated dowels.
09-05-97
78+777
78+484
Paving with Alternate 1 using epoxy coated dowels. Paving suspended at 9:15 AM due to heavy rain.
09-08-97
78+484
77+352
Paving Alternate 1 using epoxy coated dowels.
09-09-97
77+352 77+171
77+171 76+250
Paving with Alternate 1 using epoxy coated dowels. Paving with Alternate 2 using epoxy coated dowels.
09-10-97
76+250 75+885
75+885 74+997
Paving with Alternate 2 using epoxy coated dowels. Paving with Alternate 3 using epoxy coated dowels.
09-11-97
74+997 74+257
74+257 73+546
Paving with Alternate 3 using epoxy coated dowels. Paving with Alternate 4 using epoxy coated dowels.
09-12-97
73+546
72+388
Paving with Alternate 4 using epoxy coated dowels.
09-15-97
72+388 72+354
71+878
72+354 71+878
71+688
Paving with Alternate 4 using epoxy coated dowels. Paving with Alternate 4 using Avesta Sheffield solid stainless steel dowels. Paving with Alternate 3 using Avesta Sheffield solid stainless steel dowels.
09-16-97
71+688
71+384
71+384
70+997
Paving with Alternate 3 using Avesta Sheffield solid stainless steel dowels. Paving with Alternate 3 using epoxy coated steel dowels. Paving suspended at 1:20 PM due to rain.
09-17-97
70+997 70+979
70+867 2308+52
2292+97
70+979 70+867
2308+52(2) 2292+97
2276+85
Paving with standard placement using epoxy coated dowels. Paving with standard placement using Damascus-Bishop hollow-filled stainless steel dowels. Paving with standard placement using RJD composite dowels. Paving with standard placement using Glasforms composite dowels. Paving with standard placement using Creative Pultrusions composite dowels.
09-18-97
2276+85
2264+29
Paving with standard placement using epoxy coated dowels.
(1) Placement alternates illustrated in Figure 1.1.1 (2) Station change from metric to English, Sta 70+680 (M) = Sta 2318+89.76 (E)

31
Table 3.2.2 - Monitoring Section Locations - WIS 29 Abbotsford
Section Code
Start
Station
End
Station
Comments
C1
2270+00
2275+37
Control 1 - Standard Placement with Epoxy Coated Dowels
CP
2280+00
2285+36
Standard Placement with Creative Pultrusions Composite Dowels
GF
2300+00
2305+32
Standard Placement with Glasforms Composite Dowels
RJD
2310+10
2315+43* Standard Placement with RJD Composite Dowels
HF
70+867*
70+979
Standard Placement with Damascus-Bishop Hollow-Filled Stainless Steel Dowels
3Ea
71+047
71+210
Alternate 3 with Epoxy Coated Dowels
3S
71+523
71+681
Alternate 3 with Avesta Sheffield Solid Stainless Steel Dowels
4S
71+898
72+060
Alternate 4 with Avesta Sheffield Solid Stainless Steel Dowels
4E
72+800
72+961
Alternate 4 with Epoxy Coated Dowels
3Eb
75+680
75+841
Alternate 3 with Epoxy Coated Dowels
2E
76+600
756+761
Alternate 2 with Epoxy Coated Dowels
1E
77+560
77+721
Alternate 1 with Epoxy Coated Dowels
C2
78+900
79+061
Control 2 - Standard Placement with Epoxy Coated Dowels
* Station change from metric to English, Sta 70+680 (M) = Sta 2318+89.76 (E)
3.3 WIS 29 Wittenberg
Paving of the eastbound lanes on WIS 29 Wittenberg incorporating all eastbound
test sections was completed by James Cape & Sons Co. during the period of October 16-
17, 1997 under State project 1059-16-74. Paving was completed with a Rex paver and
progressed from west to east with no disruptions due to weather and minimal disruptions
due to dowel material supply problems. The standard pavement section includes a 26-ft
wide, 11-inch doweled JPCP with hot mix asphalt shoulders. The JPCP slab was placed
over a 4-inch open graded base course over a 6-inch dense graded crushed aggregate

32
base. The dowel bars are 1.5 inches in diameter and are placed at 12-inch c-c spacings
across the transverse joints. Dowels were placed using traditional dowel baskets which
were hand placed immediately in advance of paving operations. The project was designed
for a 20-year ESAL value of 10,658,000 based on WisDOT design procedures using a 1995
construction year ADT of 6,650, a 2015 design year ADT of 8,700 and 29.5% heavy truck
traffic.
Table 3.3.1 provides a daily summary of the paving operations related to eastbound
test section construction observed by Marquette University staff. Construction of the
westbound test sections was completed earlier in the paving season and was not observed
by Marquette staff.
The shipment of composite dowels produced by RJD was delayed which caused this
test section to be placed approximately one mile west of the remaining alternate dowel
material test sections in a pre-existing paving gap. Furthermore, the remaining composite
dowels were improperly distributed between the 12-ft and 14-ft basket lengths, resulting in
all of the Glasforms composite bars being placed in 12-ft baskets and most of the MMFG
composite bars being placed in the 14-ft baskets. As a result, of the 36 joints located within
the composite section, 27 contained mismatches of manufacturers between the passing
and driving lanes. Table 3.3.2 provides a listing of the composite dowel placement details.
After construction, representative monitoring sections of approximately 528 ft were
selected from within each eastbound and westbound test section for long-term monitoring.
All monitoring sections include 29 transverse joints with the exception of the RJD composite
dowel section where only 9 joints were constructed. Table 3.3.3 provides the station limits
for each selected section, which represent the center of each slab directly outside the first
and last joints included within the monitoring sections.

33
Table 3.3.1: Paving Summary - WIS 29 Wittenberg
Day Start Station
End Station
Comments
10-16-97
1194+30
1200+60
Paving with standard dowel placement using composite (MMFG, Glasforms, Creative Pultrusions) dowels
10-16-97
1200+76
1201+68
Paving with standard dowel placement using epoxy coated dowels
10-16-97
1201+86
1207+80
Paving with standard dowel placement using Slater Steels solid stainless steel dowels.
10-16-97
1207+98
1223+50
Paving with standard dowel placement using epoxy coated dowels
10-17-98
1144+68
1146+12
Paving with standard dowel placement using RJD composite dowels
Table 3.3.2: Composite Dowel Placement Details - WIS 29 Wittenberg
Joint Station
Driving Lane
Passing Lane
1144+68 - 1146+12
RJD
RJD
1194+30
MMFG
MMFG & Glasforms
1194+48 - 1194+66
MMFG
MMFG
1194+84 - 1197+36
MMFG
Glasforms
1197+54 - 1199+34
Creative Pultrusions
Glasforms
1199+52 - 1200+60
Creative Pultrusions
Creative Pultrusions

34
Table 3.3.3: Monitoring Section Locations - WIS 29 Wittenberg Eastbound Lanes
Section Code
Start
Station
End
Station
Comments
C1
1133+30
1138+55
Control 1 - Standard Placement with Epoxy Coated Dowels
RJD
1144+59
1146+21
Standard Placement with Composite Dowels (RJD)
FR
1194+22
1199+76
Standard Placement with Composite Dowels (Glasforms, Creative Pultrusions, MMFG)
SS
1202+14
1207+35
Standard Placement with Slater Steels Solid Stainless Steel Dowels
C2
1208+06
1213+31
Control 2 - Standard Placement with Epoxy Coated Dowels
Westbound Lanes
Section Code
Start
Station
End
Station
Comments
1E
1207+44
1202+20
Alternate 1 with Epoxy Coated Dowels
C3
1200+23
1195+00
Control 3 - Standard Placement with Epoxy Coated Dowels
TR
1193+55
1188+28
Standard Placement with Epoxy Coated Dowels and Trapezoidal Slab Design
3.4 WIS 29 Tilleda
Paving of the westbound lanes on WIS 29 Tilleda, incorporating all test sections,
was completed by James Cape & Sons Co. during the period of September 7-8,1999 under
state metric project number 1059-16-80. Paving was completed with a Town & Country
paver and progressed from east to west with no disruptions due to weather.
The standard pavement section includes a 26 ft wide, 10-inch doweled JPCP slab
with hot mix asphalt shoulders. The JPCP slab was placed over a 4-inch open graded
base course over a 6-inch dense graded crushed aggregate base. The dowel bars are 1.5
inches in diameter and are placed at 12-inch c-c spacings across the transverse joints (26
per joint). The pavement was designed for a 20-year ESAL value of 8,847,600 based on

35
WisDOT design procedures using a 2000 construction year ADT of 5,675, a 2020 design
year ADT of 7,088 and 19.8% heavy truck traffic.
Dowels were placed using traditional dowel baskets which were hand placed well in
advance of paving operations. A material transfer belt was used to move concrete
materials from supply trucks positioned along the outer shoulder to the paver. Table 3.4.1
provides a daily summary of the paving operations related to westbound test section
construction observed by Marquette University staff.
All dowel baskets were designed for a uniform depth, 10-inch (250 mm) PCC slab,
which required adjustments to avoid improper placement depths for the variable slab
thicknesses used within some of the WIS 29 Tilleda test sections. Placement adjustments
were made using a vibrating plate compactor running along the top rails of the basket and
sinking the baskets into the open graded permeable base layer to the desired depth. Hand
measurements made by Marquette staff indicated this method was generally effective in
positioning the dowels within 0.5 inches of the mid-depth of the PCC slab.
After construction, representative monitoring sections of approximately 500 ft were
selected from within each 1,000 ft test section for long-term monitoring. All monitoring
sections constructed with 15 ft joint spacings include 33 transverse joints. Test Section 1,
which was constructed with 18 ft joint spacings, includes 28 joints. Table 3.4.2 provides the
station limits for each selected section, which represent the center of each slab directly
outside the first and last joints included within the monitoring sections.
36
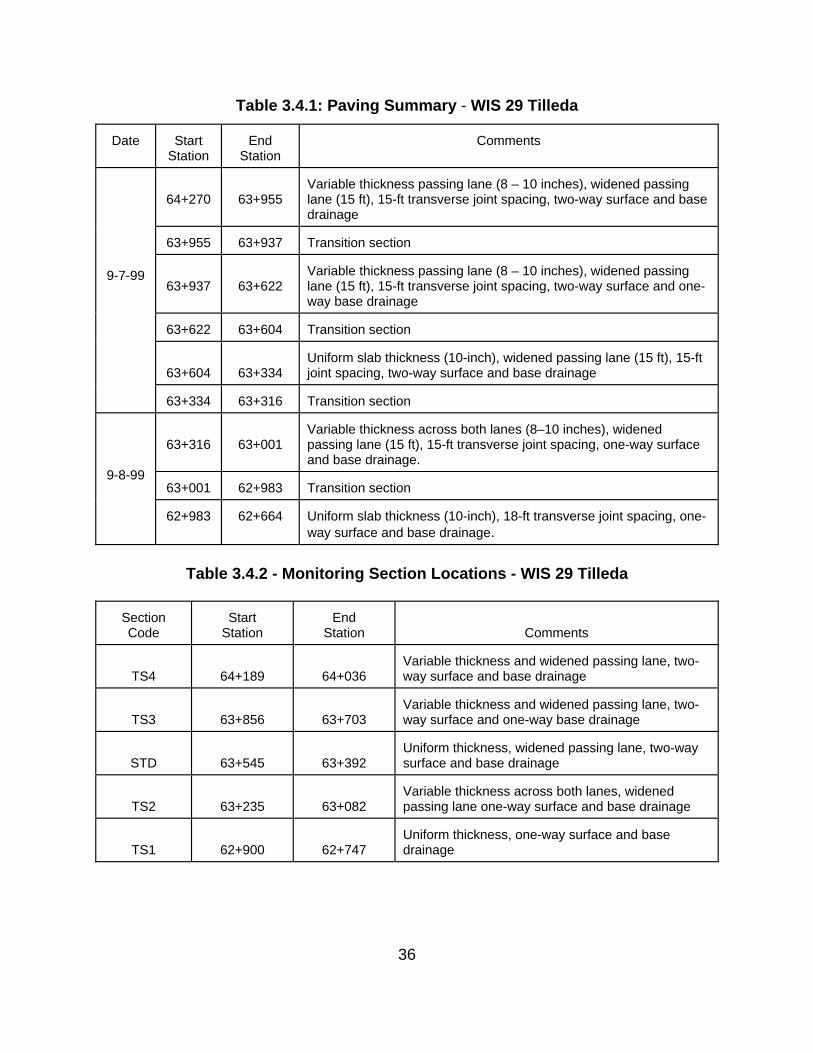
Table 3.4.1: Paving Summary - WIS 29 Tilleda
Date
Start Station
End
Station
Comments
64+270
63+955
Variable thickness passing lane (8 – 10 inches), widened passing lane (15 ft), 15-ft transverse joint spacing, two-way surface and base drainage
63+955
63+937
Transition section
63+937
63+622
Variable thickness passing lane (8 – 10 inches), widened passing lane (15 ft), 15-ft transverse joint spacing, two-way surface and one-way base drainage
63+622
63+604
Transition section
63+604
63+334
Uniform slab thickness (10-inch), widened passing lane (15 ft), 15-ft joint spacing, two-way surface and base drainage
9-7-99
63+334
63+316
Transition section
63+316
63+001
Variable thickness across both lanes (8–10 inches), widened passing lane (15 ft), 15-ft transverse joint spacing, one-way surface and base drainage.
63+001
62+983
Transition section
9-8-99
62+983
62+664
Uniform slab thickness (10-inch), 18-ft transverse joint spacing, one-way surface and base drainage.
Table 3.4.2 - Monitoring Section Locations - WIS 29 Tilleda
Section Code
Start
Station
End
Station
Comments
TS4
64+189
64+036
Variable thickness and widened passing lane, two-way surface and base drainage
TS3
63+856
63+703
Variable thickness and widened passing lane, two-way surface and one-way base drainage
STD
63+545
63+392
Uniform thickness, widened passing lane, two-way surface and base drainage
TS2
63+235
63+082
Variable thickness across both lanes, widened passing lane one-way surface and base drainage
TS1
62+900
62+747
Uniform thickness, one-way surface and base drainage

37
CHAPTER 4 PERFORMANCE MONITORING 4.1 Introduction
Performance monitoring, including falling weight deflectometer (FWD) testing,
distress measurements, and ride quality measurements, was initiated soon after
construction and completed in subsequent years. FWD measurements were conducted by
Marquette University and contract staff. Joint and slab distress measurements were
recorded by Marquette University staff during visual surveys. Distress surveys were also
completed by WisDOT staff following the Pavement Distress Index (PDI) procedures. Ride
quality measurements were completed by WisDOT staff using automated survey
equipment. The following sections provide details of the survey results.
4.2 Falling Weight Deflectometer (FWD) Analysis
Nondestructive deflection testing (NDT) using an FWD was conducted to provide a
measure of the structural response of the pavement systems to loads similar in magnitude
and duration to moving truck loadings. FWD testing was conducted using the Marquette
University KUAB Model 50 2m-FWD and the Engineering and Research International (ERI)
KUAB Model 150 2m-FWD. Both 2m-FWD models utilize a two-mass falling weight
package which produces a smooth, haversine load pulse to the pavement surface over a
12-inch segmented load plate. The magnitude of the dynamic load is varied by adjusting
the height of fall of the primary weight package. Deflection testing was conducted prior to
paving operations, after paving and immediately prior to opening to public traffic, and at
subsequent intervals after trafficking.
4.2.1 Pre-Paving Deflection Testing
Deflection tests conducted immediately prior to the paving operations provide a
measure of the strength and uniformity of the foundation materials. The maximum
deflection under loading, normalized to a reference load level, provides a general indication
of the overall uniformity of support provided by the foundation materials, which include the
natural subgrade and existing/constructed aggregate subbase and base layers. Deflections

38
measured at distances away from the center of loading may be used to estimate the elastic
moduli of foundation materials. A small load level and/or a larger load plate is suggested to
provide pre-paving top-of-base stress levels which are as close as possible to those which
would be induced during post-paving FWD testing on the top of constructed JPCP slabs. It
should be noted, however, that applied top-of-base stress levels during pre-paving testing
are generally much greater than the stress levels which would be anticipated under a 9,000
lb load after a 10 to 11-inch concrete slab is in place. Therefore, foundation material
properties which are derived from pre-paving surface deflections may be significantly lower
than those computed from post-paving deflections due to the stress-dependent behavior of
the foundation materials. However, a general comparison of foundation material properties
between constructed test sections can serve to identify variances that may contribute to
pavement performance variations.
Using single-layer elastic layer theory (Boussinesq 1885, Ahlvin and Ulery 1962), an
approximation of the equivalent modulus of the combined base-subgrade may be obtained
from the maximum deflection under loading using the equation:
Eeq = 1500 P / (π a δo) Eqn 4.1
where: Eeq = equivalent elastic modulus of foundation, psi P = applied load, lb a = load radius, in δ0 = maximum deflection, mils
The subgrade elastic moduli may be approximated using deflections away from the
center of loading by the equation (AASHTO 1993):
Esg = 0.24 P / (δr r) Eqn 4.2
where: Esg = subgrade elastic modulus, psi P = applied load, kips δr = surface deflection at r inches from the center of loading, mils r = distance from center of loading where deflection is measured, in
Based on previous research conducted by the author of this report, a reasonable
estimate of Esg may be obtained by first computing multiple values of Esg from Eqn 4.2
using all deflections measured at locations of r > 0 and then selecting the minimum

39
computed Esg as the estimate of the subgrade elastic modulus.
4.2.2 Post-Paving Backcalculation of Pavement Parameters
The foundation k-value and slab properties may be backcalculated from center slab
and joint deflections using the following 7-step process which is applicable to highway
pavements (Crovetti 1994):
Step 1: The deflection basin AREA (Hoffman, 1981) is computed from center slab
deflections using the equation:
AREA = (6 / δ0) (δ0 + 2δ12 + 2δ24 + δ36) Eqn 4.3
where: AREA = deflection basin AREA, in δi = surface deflection measure at i inches from the load
Step 2: A first estimate of the dense-liquid radius of relative stiffness of the pavement
system, lk-est is backcalculated using the equation:
l k-est = {ln[(36-AREA) / 1812.279133] / -2.55934}4.387009 Eqn 4.4
The dense-liquid radius of relative stiffness (Westergaard, 1926) is a combined term
which incorporates slab and subgrade properties and is defined as:
lk = [ (Ec Hc3) / (12 (1-µc
2) k) ] 0.25 Eqn 4.5
where: Ec = elastic modulus of concrete slab, psi Hc = thickness of concrete slab, in µc = Poisson=s ratio of concrete slab (assumed = 0.15) k = subgrade k-value, psi/in
Step 3: The effective dimensions of the test slab are computed as (Crovetti, 1994):
Leff = Lact + Σ ( Ladj * LTδ 2 ) Eqn 4.6
Weff = Wact + Σ ( Wadj * LTδ 2 ) Eqn 4.7
where: Leff, Weff = effective slab length or width, in Lact, Wact = actual slab length or width, in Ladj, Wadj = adjacent slab length or width, in LTδ = deflection load transfer across adjacent slab joint(s), decimal form LTδ = du / dl

40
du = deflection of unloaded slab at 12 inches from the load plate, mils dl = deflection of the loaded slab at the center of loading, mils
Step 4: Slab size correction factors are computed as (Crovetti, 1994):
CFlk-est = 1 - 0.89434 exp [ -0.61662 (Leff / lk-est) 1.04831 ] Eqn 4.8
CFδi = 1 - 1.15085 exp [ -0.71878 (Weff / lk-est) 0.80151 ] Eqn 4.9
where: CFlk-est = correction factor for estimated dense-liquid radius of relative stiffness CFδi = correction factor for maximum center slab deflection
Step 5: Compute adjusted lk and δi values by:
lk-adj = lk-est * CFlk-est Eqn 4.10
δi-adj = δi * CFdi Eqn 4.11
Step 6: The subgrade dynamic k-value is backcalculated using the equation (Crovetti,
1994):
ki = [1000 P / (δi-adj lk-adj2)] [0.1253 - 0.008 a / lk-adj - 0.028 (a/lk-adj)2] Eqn 4.12
where: ki = interior subgrade dynamic k-value, psi/in P = applied load, lb δi-adj = maximum adjusted center slab deflection, mils lk-adj = adjusted dense-liquid radius of relative stiffness, in a = radius of load, in
Step 7: The elastic modulus or effective thickness of the concrete slab is estimated from
previously backcalculated lk and k values by a rearrangement of Eqn 4.5 as follows:
Ec = 11.73 lk-adj4 ki / Hc
3 Eqn 4.13
Hc = [ 11.73 lk-adj4 ki / Ec ] 1/3 Eqn 4.14
where: Hc in Eqn 4.13 = known or assumed slab thickness, in
Ec in Eqn 4.14 = known or assumed PCC modulus, psi
The process described in analysis steps 1 - 7 generally provides reasonable
estimates for slab and foundation properties when the slab is relatively flat (i.e., no
temperature curling or moisture warping) and minimum effective slab dimension exceeds 3

41
times the radius of relative stiffness, lk. For typical highway applications, lk values of 36 +/-
12 inches are common, indicating effective slab dimensions of 9 +/- 3 feet are required.
For 12-14 ft wide slabs with transverse joint spacings of 15-20 ft, this requirement is easily
met. However, through-slab temperature gradients may produce sufficient downward
temperature curling when the top portions of the slab are significantly warmer than the
bottom portions and zones of non-contact near the slab center may be present. In these
cases, incremental analysis using at least two test load levels must be used to provide
reasonable estimates of slab and subgrade properties.
It may also be of interest to determine the elastic modulus of the subgrade instead of
the subgrade k-value. This property may be determined following a process similar to that
presented for the subgrade k-value with coefficients and exponents modified for elastic
solid response. Based on research conducted by the author, a reasonable estimate of the
subgrade elastic modulus may be computed directly from backcalculated ki and lk-adj values
using the equation (Crovetti 1994):
Esg = 3.39 ki lk-adj Eqn 4.15
where: Esg = elastic modulus of subgrade, psi
4.2.3 Post-Paving Transverse Joint Analysis
Deflection readings from tests conducted across transverse joints can provide a
number of useful parameters for assessing pavement performance. For maximum benefit,
deflection testing should be conducted with the load plate positioned tangent to adjacent
joints with deflection sensors located on both the loaded and unloaded slabs.
Load transfer measures can provide information on the ability of adjacent slabs to
distribute stress and deflection from critical edge and corner loadings which may lead to
joint faulting and/or load-induced transverse, longitudinal and corner cracking. In general,
deflection load transfer is relatively unaffected by the magnitude of the applied load,
provided the slab is uniformly supported. Marked reductions in load transfer at higher load
levels may be an indication of poor support under the unloaded slab. Poor support under
one slab may also result in significant differences in measured load transfer when the load
is positioned on both sides of the joint during testing. For doweled JPCP, properly

42
performing joints are typically expected to have deflection load transfer efficiencies of
approximately 85% or greater.
Maximum and total joint deflection can provide indications of existing or potential
future loss of support in the vicinity of slab edges and corners, which can lead to joint
faulting, pumping and/or slab cracking. For JPCP, the maximum joint deflection may vary
due to seasonal changes in deflection load transfer; however, the total joint deflection
should remain relatively constant, assuming there is no loss of support or temperature
curling. For comparative purposes, maximum and total joint deflections are commonly
normalized to a reference load level (e.g., 9 kips)
The deflection load transfer across joints may be simply calculated using the
equation:
LT% = δu / δl x 100% Eqn 4.16
where: LT% = deflection load transfer efficiency, % δu = deflection on unloaded slab at 12 inches from load center, mils δl = deflection on loaded slab at the load center, mils
The normalized total joint deflection may be computed using the equation:
δt = 9 (δl + δu) / P Eqn 4.17
where: δt = normalized total joint deflection, mils@9k δl = deflection on loaded slab at the load center, mils δu = deflection on unloaded slab at 12 inches from load center, mils P = applied load, kip

43
4.2.4 Pre-Paving Deflection Testing - WIS 29 Abbotsford
Deflection tests were conducted along WIS 29 Abbotsford in advance of paving
operations to provide a measure of the strength and uniformity of the foundation materials.
Deflection tests were conducted between September 3-14, 1997 with the Marquette
University 2m-FWD from stations 70+680 to 79+900 (SPN 1052-08-79) and from 2289+01
to 2318+90 (SPN 1052-08-77, equivalent metric stations 69+769 to 70+680). Tests were
conducted at approximately 300-ft intervals along the driving lane within the testing limits.
Additional tests were conducted along the passing lane at 300-ft intervals, staggered 150-ft
from the driving lane tests, between stations 72+150 and 79+650. The smallest load level
of approximately 3,000 lb was used to provide top-of-base stress levels of approximately 27
psi. The maximum deflection under loading, normalized to a common load level, was used
to provide a general indication of the overall uniformity of support provided by the
foundation materials in the areas of testing, which include the natural subgrade and
existing/constructed aggregate subbase and base layers. Table 4.2.1 provides overall
summary statistics for the maximum deflections recorded along the passing and driving
lanes, normalized to 3,000 lb load, as well as within test section values of average
maximum deflection within the driving lane. Figure 4.2.1 provides a profile plot of the
maximum deflection values.

44
Table 4.2.1: Maximum Pre-Paving Deflection Statistics - WIS 29 Abbotsford
Test Lane Test Statistic Driving Passing
Overall Mean, mils@3k 21.36 25.52 Standard Deviation, mils@3k 9.88 14.68
Coefficient of Variation, % 46.2 57.5 Test Section Driving Lane Mean Deflection,
mils@3k (1) CP 24.23 GF 24.02 RJD 16.17 HF 14.98 3Ea 19.06 3S 15.73 4S 27.22 4E 25.57 3Eb 14.12 2E 23.53 1E 22.18 C2 19.99
(1) mils at 3,000 lb load level (1 mil = 0.001 inch)

45
Pre-Paving Deflection ProfilesWIS 29 Abbotsford, September 3-14, 1997
0
10
2030
40
50
6070
80
90
69000 71000 73000 75000 77000 79000
Station, m
Max
imum
Def
lect
ions
, mils
@3k
Outer Lane Inner Lane
Figure 4.2.1: Pre-Paving Deflection Profiles, WIS 29 Abbotsford
The maximum deflection (r=0) and deflections away from the center of loading (r>0)
were used to estimate the elastic moduli of foundation materials. Table 4.2.2 provides
overall summary statistics for these estimated moduli values, determined by Eqns 4.1 and
4.2, as well as within section values based on measures within the driving lane. As shown,
the mean equivalent modulus of the combined base-subgrade is substantially higher than
the mean estimated Esg value, which is expected due to the increased stiffness of the in-
place base materials.

46
Table 4.2.2:Summary Statistics For Estimated Moduli Values - WIS 29 Abbotsford Combined Base/Subgrade
Elastic Modulus, ksi
AASHTO Subgrade Elastic Modulus, ksi
Test Statistic
Passing
Driving
Passing
Driving
Mean Value, ksi
12.4
13.5
8.2
8.8
Std. Deviation, ksi
6.4
5.4
4.5
4.1
Coeff. of Variation, %
51.7
39.8
55.1
46.5 Test
Section Mean Combined
Base/Subgrade Value, ksi Mean AASHTO Subgrade
Elastic Modulus, ksi CP 10.0 6.5 GF 10.9 7.0 RJD 15.4 9.8 HF 16.2 6.7 3Ea 13.1 8.1 3S 15.5 9.6 4S 10.6 6.0 4E 11.2 6.5 3Eb 18.7 11.7 2E 12.4 8.2 1E 13.3 10.2 C2 14.2 10.4

47
4.2.5 Post-Paving Deflection Testing - WIS 29 Abbotsford
Post-paving deflection tests were conducted within the driving lane of established
test sections just before opening to traffic and at subsequent times after paving. The initial
post-paving tests were conducted on October 29-30, 1997, approximately six weeks after
paving, and included center slab and outer wheel path transverse joint tests on five
selected slabs in each test section spaced at approximately 100 ft intervals. Additional mid-
lane transverse joint tests were conducted within test sections containing alternate dowel
placements and in the second control section. The analysis procedures outlined in Section
4.2.2 were used to estimate the subgrade dynamic k-value, the effective slab thickness,
and the effective slab modulus for each test section. The effective slab thicknesses were
backcalculated using an assumed PCC modulus of 3.8 Mpsi, which is equivalent to a
compressive strength of approximately 4,500 psi. The effective slab moduli were
backcalculated using an assumed thickness of 11 inches, which is equal to the design slab
thickness. Normalized total joint deflections and joint deflection load transfers were also
computed. Tables 4.2.3 and 4.2.4 provide summary statistics for these computed values.
As shown in Table 4.2.3, mean subgrade dynamic k-values are generally consistent
throughout all test sections, with test section values ranging from 294 to 378 psi/in. Within-
section variability is relatively low, with coefficients of variation ranging from 7.7 to 20.0%.
The mean effective thicknesses are also quite similar between test sections, with
backcalculated values ranging from 10.8 to 11.9 inches. Within-section variability is also
quite low, with coefficients of variation ranging from 3.3 to 12.9%. The mean effective slab
moduli are also quite similar between test sections, with backcalculated values ranging
from 3.4 to 4.6 Mpsi. Within-section variability is relatively high, with coefficients of
variation ranging from 9.7 to 43.3%.

48
Table 4.2.3: Post-Paving Test Results - WIS 29 Abbotsford (Oct 1997)
Subgrade
k-value
Effective Slab
Thickness(1)
Effective Slab
Modulus (2)
Test Section
Mean psi/in
COV
%
Mean
in
COV
%
Mean Mpsi
COV
%
C1
362
9.3
11.9
4.4
4.6
13.2
CP
367
19.6
11.8
12.9
4.6
43.3
GF
378
15.8
10.9
9.2
3.5
28.6
RJD
360
16.3
11.2
5.6
3.9
17.4
HF
376
16.0
10.8
10.9
3.5
33.9
3Ea
297
13.1
11.6
4.6
4.3
13.8
3S
343
14.9
11.6
6.1
4.3
17.9
4S
311
17.5
11.1
8.9
3.7
26.9
4E
330
10.8
10.8
3.3
3.4
9.7
3Eb
331
20.0
11.6
11.8
4.3
37.4
2E
354
7.7
11.4
7.2
4.0
22.3
1E
329
12.3
11.7
7.8
4.4
22.4
C2
294
11.0
11.4
6.9
4.1
20.3 (1) Backcalculated assuming Ec = 3.8 Mpsi (2) Backcalculated assuming Hc = 11 in

49
Table 4.2.4: Post-Paving Test Results - WIS 29 Abbotsford (Oct 1997)
Mean Deflection Load Transfer, %
Mean Total Joint Deflection
mils@9k
Test Section
Mean
k-value psi/in
OWP(1) Mid-Lane(2)
OWP(1)
Mid-Lane(2)
C1
362
90
n.a.
10.72
n.a.
CP
367
73
n.a.
8.96
n.a.
GF
378
71
n.a.
9.30
n.a.
RJD
360
62
n.a.
8.59
n.a.
HF
376
78
n.a.
8.24
n.a.
3Ea
297
78
59
8.43
7.75
3S
343
77
68
7.27
6.87
4S
311
73
62
8.53
7.75
4E
330
76
60
9.91
8.92
3Eb
331
79
63
9.34
7.98
2E
354
80
59
9.64
8.16
1E
329
68
57
8.88
8.36
C2
294
86
83
8.69
8.39
Overall Average
76.2
63.9
8.962
8.023
(1) OWP = outer wheel path of driving lane (2) Mid-lane = center of driving lane

50
The average transverse joint load transfer(s) provided in Table 4.2.4 indicate a
number of interesting trends which can be summarized as follows:
Dowel Bar Materials
- Average outer wheel path transverse joint load transfer provided by standard
placements with FRP composite (CP, GF, RJD) and hollow-filled stainless steel (HF)
dowels is markedly reduced as compared to conventional epoxy coated steel dowels
(C1, C2). The overall average transverse joint load transfer for the FRP, HF and
epoxy coated steel dowels was 69%, 78% and 88%, respectively.
- Average wheel path transverse joint load transfer provided by alternate placements
with stainless steel (3S, 4S) is slightly lower than comparable placements with
conventional epoxy coated steel dowels (3Ea, 3Eb, 4E). Mean test section values
for the stainless steel and conventional epoxy coated steel dowels ranged from 73%
to 77% and from 76% to 79%, respectively.
Alternate Placements
- Section average wheel path transverse joint deflection load transfer generally
decreases with decreasing wheel path dowels. For those sections with 4 dowels in
the outer wheel path (3Ea, 3Eb, 3S, 2E), section average deflection load transfers
ranged from 77% to 80%. For those sections with 3 dowels in the outer wheel path
(4E, 4S, 1E), section average deflection load transfers ranged from 68% (1E) to
73% (4S) to 76% (4E). The addition of a dowel near the slab edge increased
available deflection load transfer (4E compared to 1E).
- Eliminating dowels from mid-lane placements (4E, 4S, 3Ea, 3Eb, 3S, 2E, 1E)
resulted in a substantial reduction in mid-lane deflection load transfer. Within
section comparisons of wheel path to mid-lane load transfer values indicate
reductions ranging from 11% to 27%, with an overall average of 19%. In contrast,
the mean mid-lane load transfer within the standard placement epoxy coated steel
dowels (C2) was only 3% lower than the mean outer wheel path value (83% vs
86%).

51
The total joint deflections presented in Table 4.2.4 indicate general uniformity
between test sections. In all cases with comparative wheel path and mid-lane data, mean
outer wheel path total joint deflections are higher than the mid-lane values. This is
expected as deflections will continually increase as the test location transitions from the
mid-lane location to the pavement edge. For this test data, the overall average outer wheel
path total joint deflections are 10% greater than mid-lane values.
Subsequent deflection testing surveys were conducted in June 1998, November
1998, June 1999, November 2002 and October 2004 to examine the impacts of seasonal
variations and accumulated traffic loadings on deflection response parameters. Figure
4.2.2 summarizes mean outer wheel path deflection load transfer results for each test
section during the first year of service and illustrates the impacts of pavement temperature
on load transfer values. As shown, all sections exhibited high load transfers in June, 1998
when pavement temperatures ranged from 75 -100 oF, with computed load transfer values
ranging from 86% to 95%. In contrast, load transfer results from the November, 1998
testing, when pavement temperatures were in the range of 40 - 50 oF are markedly lower
than the June test results. Furthermore, the between-section comparisons of load transfer
from the November 1998 testing results are similar to those observed from the October
1997 testing. The standard placements of alternate materials (CP, GF, RJD, HF) again
show markedly lower deflection load transfer as compared to standard placements of epoxy
coated steel dowels. Alternate placements of stainless steel bars (3S, 4S) again show
slightly reduced deflection load transfer as compared to similar placements of epoxy coated
steel bars (3Ea, 3Eb, 4E). Also, reducing dowel bars in the outer wheel path also tends to
decrease load transfer, with section 1E (3 dowels in the outer wheel path) providing the
lowest deflection load transfer.
Figure 4.2.3 summarizes mean outer wheel path deflection load transfer values from
tests conducted out to 7 years of service. Included is one spring cycle and two fall cycles
of testing. During June 1999 testing when pavement temperatures ranged from 60-90 oF,
outer wheel path deflection load transfer is again high for all sections, ranging from 82% -
92%. During November 2002 testing, when pavement temperatures were in the range of
42 - 55 oF, markedly reduced deflection load transfer is noted for sections with conventional
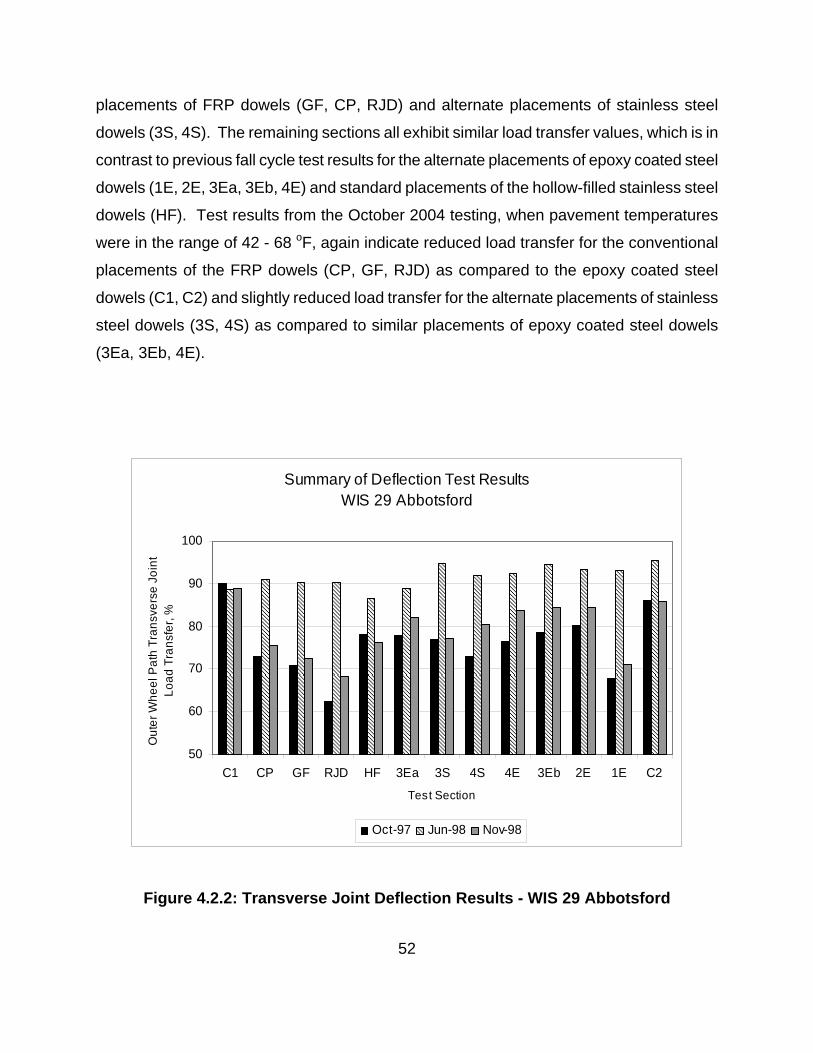
52
placements of FRP dowels (GF, CP, RJD) and alternate placements of stainless steel
dowels (3S, 4S). The remaining sections all exhibit similar load transfer values, which is in
contrast to previous fall cycle test results for the alternate placements of epoxy coated steel
dowels (1E, 2E, 3Ea, 3Eb, 4E) and standard placements of the hollow-filled stainless steel
dowels (HF). Test results from the October 2004 testing, when pavement temperatures
were in the range of 42 - 68 oF, again indicate reduced load transfer for the conventional
placements of the FRP dowels (CP, GF, RJD) as compared to the epoxy coated steel
dowels (C1, C2) and slightly reduced load transfer for the alternate placements of stainless
steel dowels (3S, 4S) as compared to similar placements of epoxy coated steel dowels
(3Ea, 3Eb, 4E).
Summary of Deflection Test ResultsWIS 29 Abbotsford
50
60
70
80
90
100
C1 CP GF RJD HF 3Ea 3S 4S 4E 3Eb 2E 1E C2
Test Section
Out
er W
heel
Pat
h Tr
ansv
erse
Joi
ntLo
ad T
rans
fer,
%
Oct-97 Jun-98 Nov-98
Figure 4.2.2: Transverse Joint Deflection Results - WIS 29 Abbotsford

53
Summary of Deflection Test ResultsWIS 29 Abbotsford
50
60
70
80
90
100
C1 CP GF RJD HF 3Ea 3S 4S 4E 3Eb 2E 1E C2
Test Section
Out
er W
heel
Pat
h Tr
ansv
erse
Joi
nt
Load
Tra
nsfe
r, %
Jun-99 Nov-02 Oct-04
Figure 4.2.3: Transverse Joint Deflection Results - WIS 29 Abbotsford
Figures 4.2.4 and 4.2.5 illustrate mean backcalculated values of subgrade k-value
and effective slab modulus, respectively, from the various test series which included center
slab deflection measurements. The variability noted in both figures for test results
subsequent to the initial October 1997 testing is most likely the result of temperature
gradients which induced downward curling during testing of some sections. Downward
curling may result in reduced support below the central portions of the slab, increased
center slab deflections and reduced curvature of the deflection basin. Downward curling
also tends to increase the deflection basin AREA and estimated dense liquid radius of
relative stiffness, reduce backcalculated interior k-values, and increase backcalculated
effective slab moduli. These negative effects are more pronounced as the stiffness of the
subgrade layer increases.
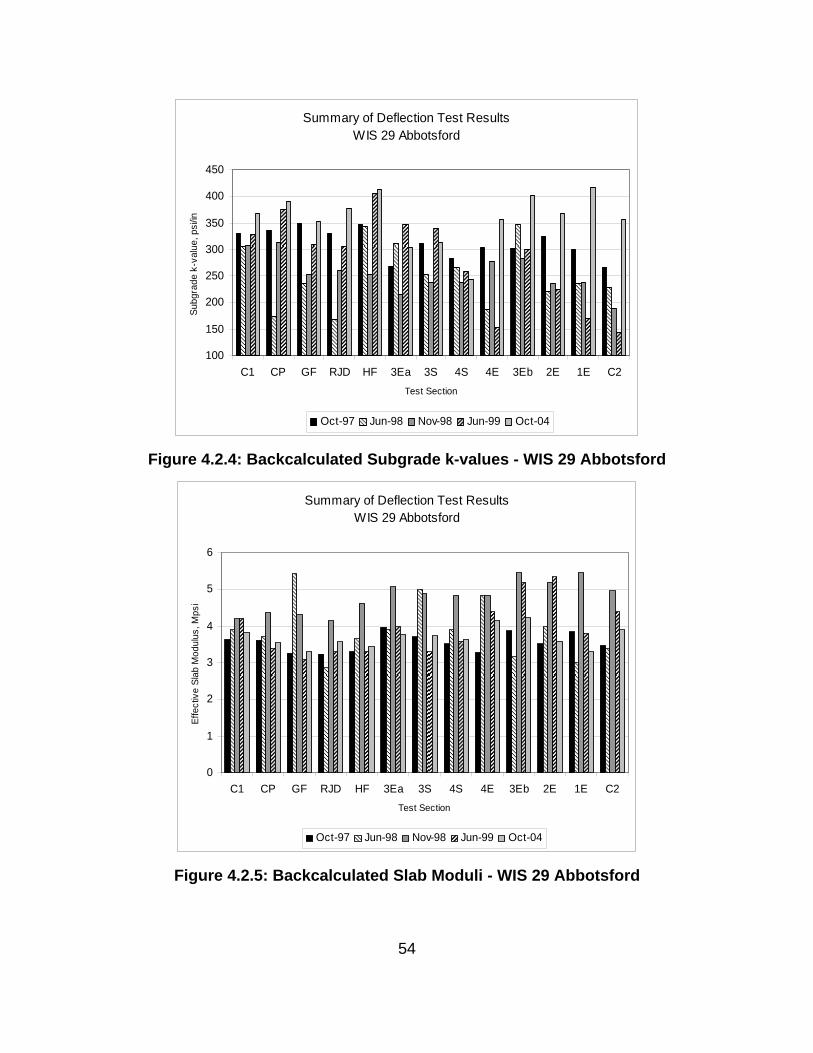
54
Summary of Deflection Test ResultsWIS 29 Abbotsford
100
150
200
250
300
350
400
450
C1 CP GF RJD HF 3Ea 3S 4S 4E 3Eb 2E 1E C2Test Section
Subg
rade
k-v
alue
, psi
/in
Oct-97 Jun-98 Nov-98 Jun-99 Oct-04
Figure 4.2.4: Backcalculated Subgrade k-values - WIS 29 Abbotsford
Summary of Deflection Test ResultsWIS 29 Abbotsford
0
1
2
3
4
5
6
C1 CP GF RJD HF 3Ea 3S 4S 4E 3Eb 2E 1E C2Test Section
Effe
ctiv
e Sl
ab M
odul
us, M
psi
Oct-97 Jun-98 Nov-98 Jun-99 Oct-04
Figure 4.2.5: Backcalculated Slab Moduli - WIS 29 Abbotsford

55
Figures 4.2.6 and 4.2.7 illustrate mean outer wheel path total joint deflections
obtained during the various test cycles. Data trends from testing conducted during the first
year of service, illustrated in Figure 4.2.6, indicate general agreement between late season
results (October 1997 and November 1998). Results from June 1998 testing indicate
general uniformity amongst all test sections, with mean deflections markedly reduced from
late season values. Data trends from subsequent testing, illustrated in Figure 4.2.7, again
indicate reduced deflections during early season testing (June 1999) as compared to late
season values (November 2002). For these two test series, there is general agreement
between all test sections. The results from the final series of testing, completed in October
2004 illustrate wide variations in test section results, most likely due to temperature curling
of the slabs. October 2004 testing was conducted over two days, with pavement surface
temperatures beginning in the mid 40s and rising each day under generally cloudy skies.
On the first day of testing, which included the testing of sections C1 through 4S, the
deflection trends suggest initial upward curling transitioning to flat-slab to downward curling.
This can be seen by the steep reductions in deflections as early testing progressed from
sections C1 to HF, which is atypical when compared to previous late season results
(October 1997, November 1998 and November 2002). By mid-day, continued testing in
sections HF through 4S indicate upwards curling had been eliminated. Similar trends can
be seen for the second day of testing, which was completed by mid-day and included
testing in sections 4E through C2

56
Summary of Deflection Test ResultsWIS 29 Abbotsford
4
5
6
7
8
9
10
11
12
C1 CP GF RJD HF 3Ea 3S 4S 4E 3Eb 2E 1E C2Test Section
Out
er W
heel
Pat
h To
tal
Join
t Def
lect
ion,
mils
@9k
Oct-97 Jun-98 Nov-98
Figure 4.2.6: Transverse Joint Deflection Results - WIS 29 Abbotsford
Summary of Deflection Test ResultsWIS 29 Abbotsford
4
5
6
7
8
9
10
11
12
C1 CP GF RJD HF 3Ea 3S 4S 4E 3Eb 2E 1E C2Test Section
Out
er W
heel
Pat
h To
tal
Join
t Def
lect
ion,
mils
@9k
Jun-99 Nov-02 Oct-04
Figure 4.2.7: Transverse Joint Deflection Results - WIS 29 Abbotsford

57
4.2.6 Post-Paving Deflection Testing - WIS 29 Wittenberg
Post-paving deflection testing was initiated along the eastbound test sections on
October 30, 1997 prior to opening to traffic. Pre-opening testing was not completed on the
westbound test sections. Eastbound testing was completed approximately 2 weeks after
paving, including center slab and transverse joint tests at mid-lane and outer wheel path
locations. The analysis procedures outlined in Section 4.2.2 were used to estimate the
subgrade dynamic k-value, the effective slab thickness (Ec assumed = 3.6 Mpsi), and the
effective slab modulus (Hc assumed = 11 in) for each section. Normalized total joint
deflections and joint deflection load transfer values were also computed. Tables 4.2.5 and
4.2.6 provide summary statistics for these computed values. As shown in Table 4.2.5,
mean subgrade dynamic k-values are generally consistent throughout the eastbound test
sections, with test section values ranging from 332 to 479 psi/in. Within-section variability
is relatively high, with coefficients of variation ranging from 11.5 to 26.1%. The mean
effective thicknesses are also quite similar between test sections, with backcalculated
values ranging from 11.0 to 12.0 inches. Within-section variability is relatively low, with
coefficients of variation ranging from 8.0 to 12.4%. The mean effective slab moduli are also
quite similar between test sections, with backcalculated values ranging from 3.6 to 4.8
Mpsi. Within-section variability is relatively high, with coefficients of variation ranging from
22.6 to 37.6%.
The average transverse joint load transfers and total deflections are provided in
Table 4.2.6. As shown, there is general uniformity among the load transfer measures
between test sections, with the RJD composite section exhibiting somewhat lower load
transfer, which is consistent with deflection test results obtained at WIS 29 Abbotsford.
Total joint deflection values are also generally comparable between test sections with the
stainless steel test section having somewhat lower values.

58
Table 4.2.5: Post-Paving Test Results - WIS 29 Wittenberg (Oct 1997)
Subgrade
Dynamic k-value
Effective Slab
Thickness(1)
Effective Slab
Modulus (2)
Test Section
Mean psi/in
COV %
Mean
in
COV %
Mean Mpsi
COV %
C1
352
12.3
12.0
8.0
4.8
23.7
RJD
421
21.4
11.0
8.3
3.6
22.6
FR
332
26.1
12.0
10.1
4.8
31.1
SS
423
11.5
11.7
12.4
4.5
37.6
C2
479
22.1
11.2
12.4
3.9
35.7
(1) Backcalculated assuming Ec = 3.6 Mpsi (2) Backcalculated assuming Hc = 11 in
Table 4.2.6: Post-Paving Test Results - WIS 29 Wittenberg (Oct 1997)
Mean Deflection Load Transfer, %
Mean Total Joint Deflection
mils@9k
Test Section
Mean
Dynamic k-value psi/in
OWP(1)
Mid-Lane(2)
OWP(1)
Mid-Lane(2)
C1
352
87
83
6.92
6.53
RJD
421
82
81
6.63
6.11
FR
332
87
85
6.88
6.81
SS
423
89
88
6.14
5.62
C2
479
88
82
6.86
6.24
Overall Average
86.6
83.8
6.69
6.26
(1) OWP = outer wheel path of driving lane (2) Mid-lane = center of driving lane

59
Additional deflection data was collected at subsequent times up to 7 years after
paving. Figures 4.2.8 to 4.2.11 provide plots of comparative section data. The
backcalculated pavement parameters illustrated in Figures 2.4.8 and 2.4.9 show marked
variability between test periods. There is general agreement between test sections during
each test period; however, the subgrade support within the FR, SS and TR sections
appears markedly reduced during the June 1999 testing. Furthermore, subgrade support
within the TR section appears lower than other sections throughout the test periods.
The outer wheelpath load transfer results provided in Figure 4.2.10 indicate general
uniformity between sections with the exception of the November 1998 testing where the
composite (RJD, FR) and the alternate dowel placement (1E) sections provide markedly
reduced load transfer. Load transfers within these sections during subsequent testing are
similar to other sections, which is contrary to expectations. The total joint deflection results
displayed in Figure 4.2.11 indicate general uniformity amongst sections during each test
period; however, joint deflections within the composite (RJD, FR) and stainless steel (SS)
sections are somewhat higher than other sections during later test periods.

60
Summary of Deflection Testing ResultsWIS 29 Wittenberg
0
100
200
300
400
500
600
C1 RJD FR SS C2 1E C3 TR
Test Section
Subg
rade
k-v
alue
, psi
/in
Oct-97 Jun-98 Nov-98 Jun-99 Oct-04
Figure 4.2.8: Backcalculated Subgrade k-values – WIS 29 Wittenberg
Summary of Deflection Testing ResultsWIS 29 Wittenberg
3.0
4.0
5.0
6.0
7.0
8.0
9.0
10.0
C1 RJD FR SS C2 1E C3 TR
Test Section
Effe
ctiv
e Sl
ab M
odul
us, M
psi
Oct-97 Jun-98 Nov-98 Jun-99 Oct-04
Figure 4.2.9: Backcalculated Slab Moduli – WIS 29 Wittenberg

61
Summary of Deflection Testing ResultsWIS 29 Wittenberg
50
60
70
80
90
100
C1 RJD FR SS C2 1E C3 TR
Test Section
Out
er W
heel
Pat
h Tr
ansv
erse
Jo
int L
oad
Tran
sfer
, %
Oct-97 Jun-98 Nov-98 Jun-99 Oct-04
Figure 4.2.10: Transverse Joint Load Transfer – WIS 29 Wittenberg
Summary of Deflection Testing ResultsWIS 29 Wittenberg
0
2
4
6
8
10
12
C1 RJD FR SS C2 1E C3 TR
Test Section
Out
er W
heel
Pat
h To
tal J
oint
D
efle
ctio
n, m
ils@
9k
Oct-97 Jun-98 Nov-98 Jun-99 Oct-04
Figure 4.2.11: Total Joint Deflection – WIS 29 Wittenberg

62
4.2.7 - Post-Paving Deflection Testing - WIS 29 Tilleda
Post-paving deflection testing was conducted along the westbound test sections on
October 10, 1999 prior to opening to traffic. Testing was completed approximately 4 weeks
after paving and included center slab and transverse joint tests along the Passing and
driving lanes. The analysis procedures outlined in Section 4.2.2 were used to estimate the
dynamic subgrade k-value and effective slab thickness (Ec assumed = 3.6 Mpsi) for each
section. Normalized total joint deflections and joint deflection load transfer values were
also computed. Tables 4.2.7 and 4.2.8 provide summary statistics for these computed
values. Section average values are also provided in Figures 4.2.12 to 4.2.15.
The backcalculated dynamic k-values provided in Table 4.2.7 and Figure 4.2.12
indicate a general trend toward increased subgrade stiffness moving from east to west, with
the exception of the westernmost test section (TS1) which exhibits the lowest support. The
average backcalculated effective slab thicknesses provided in Table 4.2.7 and Figure
4.2.13 are in good agreement with design thicknesses of each travel lane. Total joint
deflections provided in Table 4.2.8 and Figure 4.2.14 indicate a general trend of reduced
deflection moving east to west, with a noted increase for the westernmost section. These
results are in agreement with interior k-value trends noted earlier.
Transverse joint load transfer values provided in Table 4.2.8 and Figure 4.2.15
indicate generally low values (78.2 to 82.0) for the two sections with highest subgrade
support (TS3, TS2). The remaining sections exhibit generally uniform load transfer ranging
from 86.3 to 89.1%.
Deflection tests were again conducted in October 2004. Figures 2.4.16 and 2.4.17
illustrate average section values of backcalculated slab parameters. As shown in Figure
2.4.16, the backcalculated average dynamic k–values are significantly different from
original values, most notably within the passing lane where dynamic k-values are
appreciably lower. The backcalculated effective slab modulus values provided in Figure
2.4.17 also display erratic behavior, which roughly parallels the results of the k-values in
that higher k-values are associated with significantly reduced moduli values. This effect
typically occurs with excessive temperature curling during testing, which was not evident
during this test series.

63
Table 4.2.7: Post-Paving Test Results - WIS 29 Tilleda (Oct 1999) Dynamic Subgrade k-value Effective Slab Thickness
Driving Lane Passing Lane Driving Lane Passing Lane
Test
Section Mean
Psi/in
COV
%
Mean
Psi/in
COV
%
Mean
in
COV
%
Mean
in
COV
%
TS4 420 31.7 375 25.6 10.4 15.6 9.0 13.2
TS3 608 29.6 422 35.0 9.9 11.7 9.1 10.5
STD 485 34.1 438 24.9 10.0 9.7 9.0 10.8
TS2 605 21.3 567 21.3 9.2 7.1 8.0 8.4
TS1 324 40.7 296 33.5 10.4 19.2 10.3 11.7 (1) Backcalculated assuming Ec = 3.6 Mpsi
Table 4.2.8: Post-Paving Test Results - WIS 29 Tilleda (Oct 1999) Total Joint Deflection Deflection Load Transfer
Driving Lane Passing Lane Driving Lane Passing Lane
Test
Section Mean
mils@9k
COV
%
Mean
mils@9k
COV
%
Mean
%
COV
%
Mean
%
COV
%
TS4 12.48 8.3 14.08 7.7 87.3 5.5 87.5 4.1
TS3 10.66 10.1 12.22 7.1 81.0 12.4 78.2 29.6
STD 8.96 5.2 10.00 5.1 89.1 4.7 88.3 5.0
TS2 7.74 6.5 9.49 7.1 81.8 6.1 82.0 9.8
TS1 9.70 7.0 9.90 7.1 86.7 4.3 86.3 2.8

64
WIS 29 TilledaOctober, 1999
0
100
200
300
400
500
600
700
TS4 TS3 STD TS2 TS1
Section
Ave
rage
Bac
kcal
cula
ted
k-va
lue,
pci
Outer Lane Inner Lane
Figure 4.2.12: Backcalculated Subgrade k-values – WIS 29 Tilleda
WIS 29 TilledaOctober, 1999
0.0
2.0
4.0
6.0
8.0
10.0
12.0
TS4 TS3 STD TS2 TS1
Section
Ave
rage
Bac
kcal
cula
ted
Hef
f, in
Outer Lane Inner Lane
Figure 4.2.13: Backcalculated Effective Slab Thickness – WIS 29 Tilleda

65
WIS 29 TilledaOctober, 1999
0.00
2.00
4.00
6.00
8.00
10.00
12.00
14.00
16.00
TS4 TS3 STD TS2 TS1
Section
Ave
rage
Tot
al J
oint
D
efle
ctio
n, m
ils@
9k
Outer Lane Inner Lane
Figure 4.2.14: Total Joint Deflections – WIS 29 Tilleda
WIS 29 TilledaOctober, 1999
70
75
80
85
90
95
100
TS4 TS3 STD TS2 TS1
Section
Ave
rage
Joi
nt L
oad
Tran
sfer
, %
Outer Lane Inner Lane
Figure 4.2.15: Joint Load Transfer – WIS 29 Tilleda

66
WIS 29 TilledaOctober, 2004
0
100
200
300
400
500
600
700
TS4 TS3 STD TS2 TS1
Section
Ave
rage
Bac
kcal
cula
ted
k-va
lue,
pci
Outer Lane Inner Lane
Figure 4.2.16: Backcalculated Subgrade k-values – WIS 29 Tilleda
WIS 29 TilledaOctober, 2004
0.0
1.02.0
3.0
4.05.0
6.0
7.08.0
9.0
TS4 TS3 STD TS2 TS1
Section
Ave
rage
Bac
kcal
cula
ted
Sla
b M
odul
us, M
psi
Outer Lane Inner Lane
Figure 4.2.17: Backcalculated Effective Slab Modulus – WIS 29 Tilleda

67
WIS 29 TilledaOctober, 2004
0.00
2.00
4.00
6.00
8.00
10.00
12.00
14.00
16.00
18.00
TS4 TS3 STD TS2 TS1
Section
Ave
rage
Tot
al J
oint
Def
lect
ion,
m
ils@
9k
Outer Lane Inner Lane
Figure 4.2.18: Total Joint Deflection – WIS 29 Tilleda
WIS 29 TilledaOctober, 2004
0.010.020.030.040.050.060.070.080.090.0
100.0
TS4 TS3 STD TS2 TS1
Section
Ave
rage
Joi
nt L
oad
Tran
sfer
, %
Outer Lane Inner Lane
Figure 4.2.19: Total Joint Deflection – WIS 29 Tilleda

68
The joint deflection results displayed in Figure 4.2.18 are in general agreement with
results obtained from pre-opening testing with the noted exception within the driving lanes
of STD, TS2 and TS1 where deflections are substantially higher. Combined with the results
of backcalculated slab parameters, it appears these anomalies may be the result of
excessive upward slab warping within these sections. The joint deflection load transfer
values displayed in Figure 4.2.19 are relatively consistent with pre-opening test results.
4.3 Ride Quality Measures
Ride quality measures were collected by WisDOT using their high-speed survey
vehicle. Data was collected throughout the entire length of construction for each test
section. International Roughness Index (IRI) values were provided for one or both
wheelpaths for each test section in metric units of m/km. In general, IRI values below 1.5
m/km are indicative of a smooth ride while values in excess of 2.5 indicate a rough ride.
When both wheelpaths were provided, these values were averaged to provide a general
indicator of the ride quality within that test section. The provided IRI values were recorded
at different periods from year to year and, as such, it is difficult to establish yearly trends for
the various sections. Instead, IRI variations within each test section were examined to
identify performance variations that may be attributed to any specific design alternate.
4.3.1 WIS 29 - Abbotsford
Figures 4.3.1 to 4.3.5 provide summary plots of yearly IRI values collected along the
driving and passing lanes along WIS 29 Abbotsford during the period of 2000-2004. As
shown in these figures, the passing lane values are predominantly lower than driving lane
values, as expected. However, Year 2000 IRI values indicate slight higher IRI values within
the passing lane of the westernmost sections (C1, CP, GF, RJD). The overall average IRI
values within each lane are provided in Table 4.3.1. For comparative purposes, the yearly
average IRI values within various design subsets are provided in Table 4.3.2.

69
Table 4.3.1: Overall Average IRI Values, WIS 29 Abbotsford Year Driving Lane IRI Passing Lane IRI
2000 1.25 1.17
2001 1.30 1.12
2002 1.23 1.10
2003 1.67 1.68
2004 1.41 1.24
Table 4.3.2: Group Average IRI Values, WIS 29 Abbotsford Year
Lane
Group
Subset 2000 2001 2002 2003 2004
C1, C2 1.20 1.19 1.16 2.02 1.31
RJD, GF, CP 1.24 1.45 1.19 1.51 1.31
HF 1.39 1.78 1.44 1.49 1.63
4E, 4S 1.24 1.22 1.31 1.59 1.54
3Ea,3Eb,3S 1.27 1.24 1.24 1.52 1.41
2E 1.29 0.92 1.03 1.93 1.48
Driving
1E 1.18 1.36 1.33 2.06 1.38
C1, C2 1.19 1.05 1.01 1.49 1.19
RJD, GF, CP 1.29 1.28 1.14 1.68 1.22
HF 1.30 1.45 1.37 1.59 1.43
4E, 4S 1.06 1.07 1.11 1.93 1.27
3Ea,3Eb,3S 1.15 1.08 1.09 1.66 1.24
2E 1.10 0.71 0.84 1.47 1.16
Passing
1E 1.03 1.14 1.18 1.90 1.21

70
WIS 29 AbbotsfordSection Average IRI values
0.500.751.001.251.501.752.002.252.502.753.00
C1 CP GF RJD HF 3Ea 3S 4S 4E 3Eb 2E 1E C2
Test Section
Year
200
0 Av
erag
e IR
I, m
/km
Driving Lane Passing Lane
Figure 4.3.1 Year 2000 Profiler Readings - WIS 29 Abbotsford
WIS 29 AbbotsfordSection Average IRI values
0.500.751.001.251.501.752.002.252.502.753.00
C1 CP GF RJD HF 3Ea 3S 4S 4E 3Eb 2E 1E C2
Test Section
Yea
r 200
1 Av
erag
e IR
I, m
/km
Driving Lane Passing Lane
Figure 4.3.2 Year 2001 Profiler Readings - WIS 29 Abbotsford
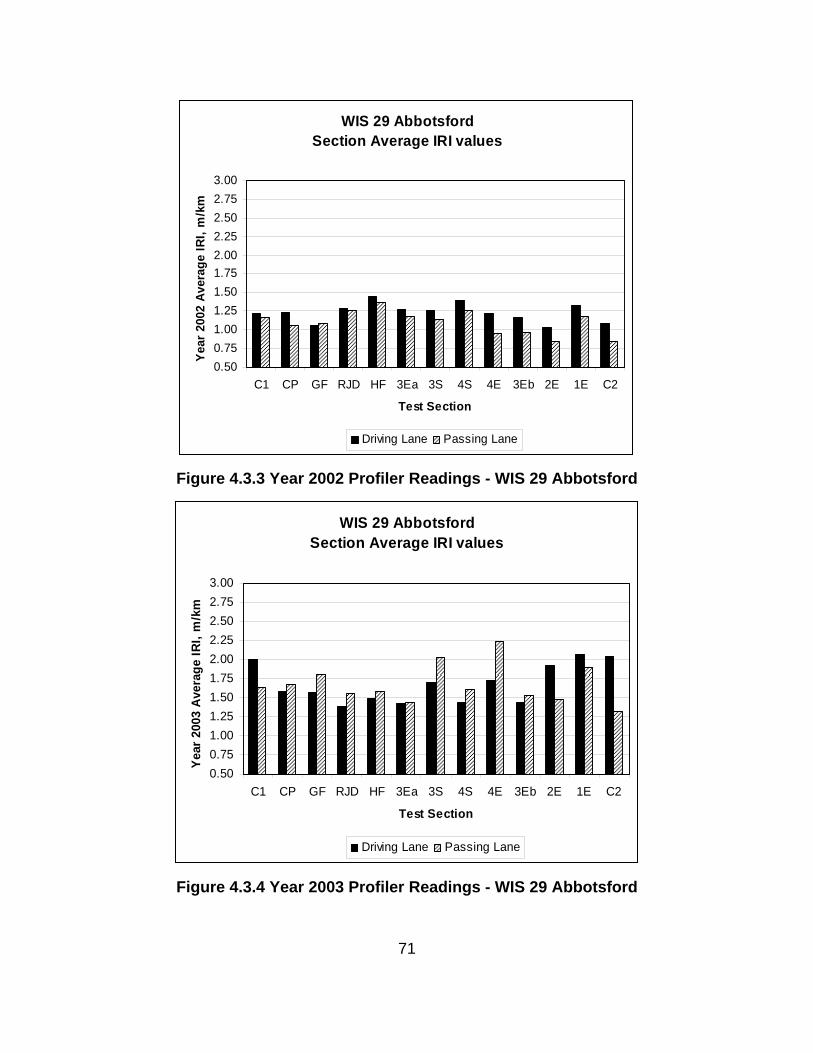
71
WIS 29 AbbotsfordSection Average IRI values
0.500.751.001.251.501.752.002.252.502.753.00
C1 CP GF RJD HF 3Ea 3S 4S 4E 3Eb 2E 1E C2
Test Section
Year
200
2 Av
erag
e IR
I, m
/km
Driving Lane Passing Lane
Figure 4.3.3 Year 2002 Profiler Readings - WIS 29 Abbotsford
WIS 29 AbbotsfordSection Average IRI values
0.500.751.001.251.501.752.002.252.502.753.00
C1 CP GF RJD HF 3Ea 3S 4S 4E 3Eb 2E 1E C2
Test Section
Year
200
3 A
vera
ge IR
I, m
/km
Driving Lane Passing Lane
Figure 4.3.4 Year 2003 Profiler Readings - WIS 29 Abbotsford

72
WIS 29 AbbotsfordSection Average IRI values
0.500.751.001.251.501.752.002.252.502.753.00
C1 CP GF RJD HF 3Ea 3S 4S 4E 3Eb 2E 1E C2
Test Section
Year
200
4 Av
erag
e IR
I, m
/km
Driving Lane Passing Lane
Figure 4.3.5 Year 2004 Profiler Readings - WIS 29 Abbotsford
The data provided in Table 4.3.2 can be utilized to asses the relative performance of
the various test sections in relation to the standard design control group (C1,C2). The
sections incorporating composite dowels (RJD, GF, CP) have consistently higher IRI values
than the control group in both the passing and driving lanes for all years except 2003. Data
from year 2003 appears to be biased for an unknown reason, yielding higher than expected
IRI values for all sections. The hollow-filled section (HF) generally has the highest IRI
values amongst all groups which may, to a large extent, be due to the fact that this is the
shortest section and it contains a faulted mid-panel crack across both lanes which
disproportionately contributes to higher roughness. The alternate dowel placement groups
generally indicate higher roughness than the control group with the exception of alternate
2E, which includes 4 dowels in the outer wheel path of the driving lane. This section
generally has the lowest IRI values amongst all section groups.

73
4.3.2 WIS 29 Wittenberg
Figures 4.3.6 to 4.3.10 provide summary plots of yearly IRI values collected along
the driving and passing lanes along WIS 29 Wittenberg during the period of 2000-2004.
The overall average IRI values within each lane are provided in Table 4.3.3. For
comparative purposes, the yearly average IRI values within various design subsets are
provided in Table 4.3.4. The IRI trends presented in the figures and tables are difficult to
summarize due to the variability in performance trends. In general, it can be stated that the
overall average passing lane IRI values are typically lower than driving lane values, as
shown in Table 4.3.3. However, the data provided in Table 4.3.4 indicates the passing lane
of the composite dowel section group (RJD, FR) consistently has IRI values equal to or
greater than the driving lane values. Furthermore, based on the most recent data collected
(2003 & 2004), the group average IRI values within the composite dowel section group are
the highest amongst all groups. The best performance, in terms of the lowest average IRI
value, is observed for the variable thickness slab (TR) section.
Table 4.3.3 Overall Average IRI Values – WIS 29 Wittenberg
Eastbound Sections Westbound Sections
Year Driving Lane Passing Lane Driving Lane Passing Lane
2000 1.71 1.60 1.43 1.36
2001 1.29 0.93 1.48 0.90
2002 1.38 1.34 1.41 1.15
2003 1.34 1.35 1.32 1.18
2004 1.35 1.24 1.32 1.15
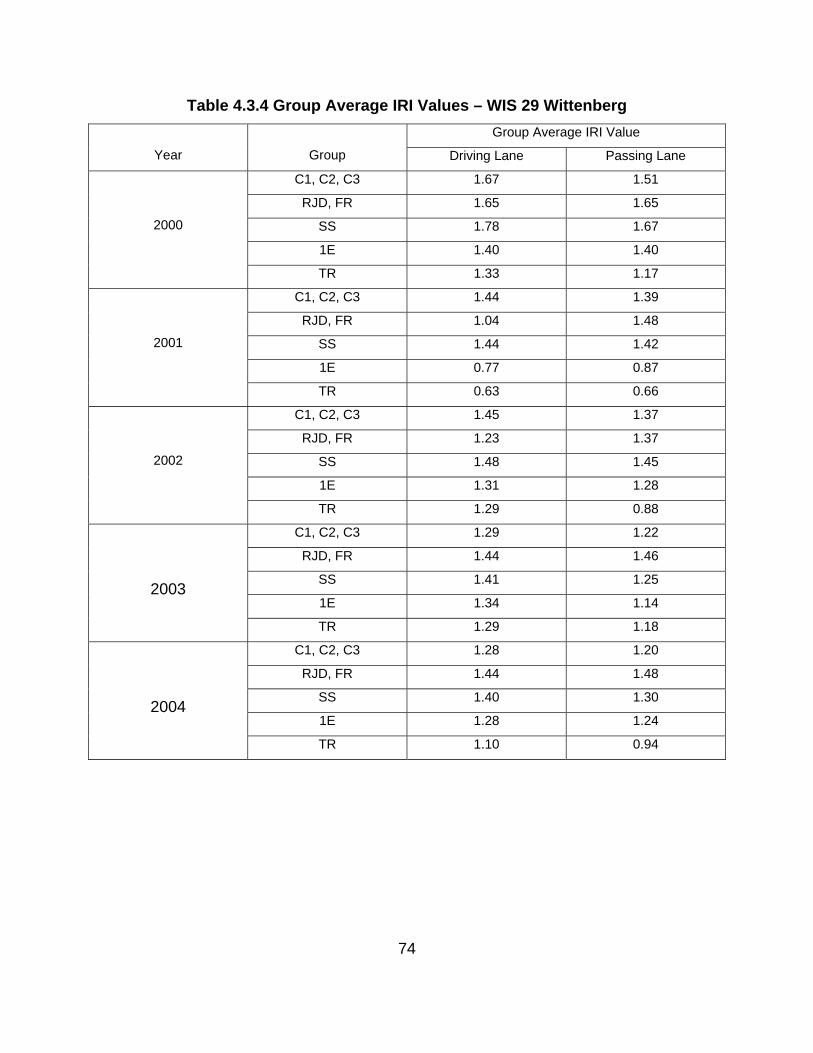
74
Table 4.3.4 Group Average IRI Values – WIS 29 Wittenberg Group Average IRI Value
Year
Group Driving Lane Passing Lane
C1, C2, C3 1.67 1.51
RJD, FR 1.65 1.65
SS 1.78 1.67
1E 1.40 1.40
2000
TR 1.33 1.17
C1, C2, C3 1.44 1.39
RJD, FR 1.04 1.48
SS 1.44 1.42
1E 0.77 0.87
2001
TR 0.63 0.66
C1, C2, C3 1.45 1.37
RJD, FR 1.23 1.37
SS 1.48 1.45
1E 1.31 1.28
2002
TR 1.29 0.88
C1, C2, C3 1.29 1.22
RJD, FR 1.44 1.46
SS 1.41 1.25
1E 1.34 1.14
2003
TR 1.29 1.18
C1, C2, C3 1.28 1.20
RJD, FR 1.44 1.48
SS 1.40 1.30
1E 1.28 1.24
2004
TR 1.10 0.94
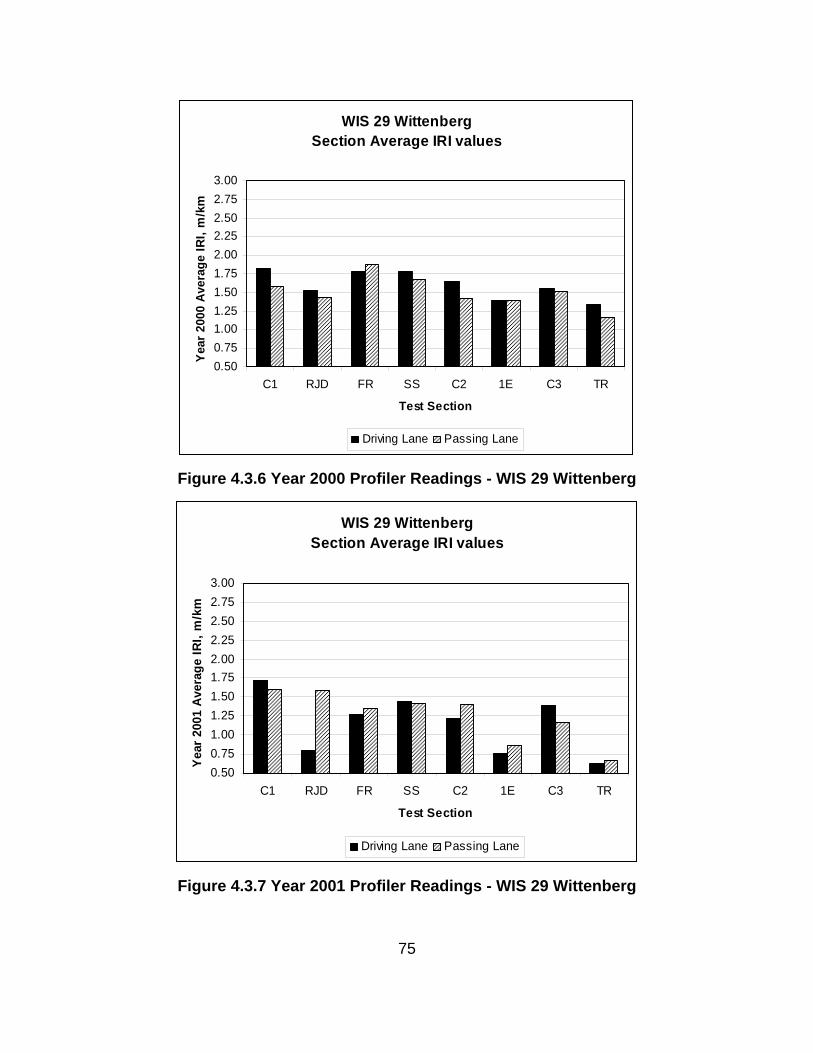
75
WIS 29 WittenbergSection Average IRI values
0.500.751.001.251.501.752.002.252.502.753.00
C1 RJD FR SS C2 1E C3 TR
Test Section
Year
200
0 Av
erag
e IR
I, m
/km
Driving Lane Passing Lane
Figure 4.3.6 Year 2000 Profiler Readings - WIS 29 Wittenberg
WIS 29 WittenbergSection Average IRI values
0.500.751.001.251.501.752.002.252.502.753.00
C1 RJD FR SS C2 1E C3 TR
Test Section
Year
200
1 A
vera
ge IR
I, m
/km
Driving Lane Passing Lane
Figure 4.3.7 Year 2001 Profiler Readings - WIS 29 Wittenberg

76
WIS 29 WittenbergSection Average IRI values
0.500.751.001.251.501.752.002.252.502.753.00
C1 RJD FR SS C2 1E C3 TR
Test Section
Year
200
2 A
vera
ge IR
I, m
/km
Driving Lane Passing Lane
Figure 4.3.8 Year 2002 Profiler Readings - WIS 29 Wittenberg
WIS 29 WittenbergSection Average IRI values
0.500.751.001.251.501.752.002.252.502.753.00
C1 RJD FR SS C2 1E C3 TR
Test Section
Yea
r 200
3 A
vera
ge IR
I, m
/km
Driving Lane Passing Lane
Figure 4.3.9 Year 2003 Profiler Readings - WIS 29 Wittenberg

77
WIS 29 WittenbergSection Average IRI values
0.500.751.001.251.501.752.002.252.502.753.00
C1 RJD FR SS C2 1E C3 TR
Test Section
Yea
r 200
4 A
vera
ge IR
I, m
/km
Driving Lane Passing Lane
Figure 4.3.10 Year 2004 Profiler Readings - WIS 29 Wittenberg
4.3.3 WIS 29 Tilleda
Figures 4.3.11 to 4.3.13 provide summary plots of yearly IRI values collected along the
driving and passing lanes along WIS 29 Tilleda during the period of 2002-2004. The overall
average IRI values within each lane are provided in Table 4.3.5. For comparative
purposes, the yearly average IRI values within various design sections are provided in
Table 4.3.6.
The IRI trends presented in the figures and tables indicate that the overall and
section average passing lane IRI values are consistently lower than driving lane values.
Based on all data provided in Table 4.3.6, the best performance, in terms of the lowest
average IRI value, is seen for the uniform slab thickness with one-way surface and base
layer drainage (TS1). The one-way surface and base layer drainage section with variable
slab thickness across both lanes (TS2) is also performing as good or better than the control
section (STD) in terms of ride. Performance of the widened passing lane, in terms of

78
section average IRI values, is poorer than the section with the standard 12 ft. width passing
lane (TS1). TS3, with variable slab thickness in the passing lane, two-way surface and
one-way base drainage, consistently shows the roughest ride (i.e., highest IRI).
Table 4.3.5 Overall average IRI Values – WIS 29 Tilleda
Overall Average IRI Values Year Driving Lane Passing Lane 2002 1.62 1.42 2003 2.07 1.70 2004 1.41 1.15
Table 4.3.6 Section Average IRI Values – WIS 29 Tilleda
Section Average IRI Value
Year
Group Driving Lane Passing Lane
TS4 1.69 1.47
TS3 2.30 1.75
STD 1.47 1.39
TS2 1.50 1.37
2002
TS1 1.14 1.10
TS4 1.89 1.67
TS3 2.95 2.16
STD 1.94 1.88
TS2 1.93 1.45
2003
TS1 1.66 1.36
TS4 1.34 1.10
TS3 2.08 1.50
STD 1.33 1.22
TS2 1.29 1.09
2004
TS1 1.01 0.85

79
WIS 29 TilledaSection Average IRI Values
0.5
1.0
1.5
2.0
2.5
3.0
TS4 TS3 STD TS2 TS1
Test Section
Yea
r 200
2 A
vera
ge IR
I, m
/km
Driving Lane Passing Lane
Figure 4.3.11 Year 2002 Profiler Readings - WIS 29 Tilleda
WIS 29 TilledaSection Average IRI Values
0.5
1.0
1.5
2.0
2.5
3.0
TS4 TS3 STD TS2 TS1
Test Section
Year
200
3 Av
erag
e IR
I, m
/km
Driving Lane Passing Lane
Figure 4.3.12 Year 2003 Profiler Readings - WIS 29 Tilleda

80
WIS 29 TilledaSection Average IRI Values
0.5
1.0
1.5
2.0
2.5
3.0
TS4 TS3 STD TS2 TS1
Test Section
Year
200
4 Av
erag
e IR
I, m
/km
Driving Lane Passing Lane
Figure 4.3.13 Year 2004 Profiler Readings - WIS 29 Tilleda
4.4 Distress Measures
Distress measures including joint spalling, slab cracking and joint faulting were
recorded during FWD testing periods by Marquette University staff. Additional measures
were made at selected times when no FWD measurements were made. Distress
measures were visually identified and manually recorded. Joint faulting measurements
were made using a portable fault meter provided by WisDOT staff, which provides for
measurements with a resolution of approximately 1/16 inch.
4.4.1 WIS 29 Abbotsford
Distress measures recorded during the year 2004 survey are provided in Figures
4.4.1 to 4.4.4. As shown there is a limited amount of joint spalling and faulting and more
extensive joint chipping. Observed joint chipping is related to the saw cutting of the
transverse joints where localized coarse aggregates become dislodged soon after
construction. Figure 4.4.5 provides a photo of a typical transverse joint with chipping. The

81
slab cracking data provided in Figure 4.4.4 indicates five test sections contain cracks.
There was one low-severity transverse or longitudinal crack per section except for section
3S, which contained a longitudinal crack along nine consecutive slabs. This crack initiated
during the second year of service and is most likely related to an ineffective parting strip
installed during construction.
2004 Joint Distress SurveyWIS 29 Abbotsford
0
5
10
15
20
25
C1 CP GF RJD HF 3Ea 3S 4S 4E 3Eb 2E 1E C2
Test Section
% S
palle
d Jo
ints
Driving Lane Passing Lane
Figure 4.4.1 Joint Spalling Data – WIS 29 Abbotsford

82
2004 Joint Distress SurveyWIS 29 Abbotsford
0
10
20
30
40
50
60
70
80
90
100
C1 CP GF RJD HF 3Ea 3S 4S 4E 3Eb 2E 1E C2
Test Section
% C
hipp
ed J
oint
s
Driving Lane Passing Lane
Figure 4.4.2 Chipped Joint Data – WIS 29 Abbotsford
2004 Joint Distress SurveyWIS 29 Abbotsford
0.0
0.1
0.2
0.3
0.4
0.5
0.6
0.7
0.8
0.9
1.0
C1 CP GF RJD HF 3Ea 3S 4S 4E 3Eb 2E 1E C2
Test Section
Tota
l Joi
nt F
aulti
ng, i
n
Driving Lane Passing Lane
Figure 4.4.3 Joint Faulting Data – WIS 29 Abbotsford

83
2004 Slab Distress SurveyWIS 29 Abbotsford
0
5
10
15
20
25
30
35
C1 CP GF RJD HF 3Ea 3S 4S 4E 3Eb 2E 1E C2
Test Section
% S
lab
Cra
ckin
g
Driving-Trans Driving-Long Passing-Trans Passing-Long
Figure 4.4.4 Slab Cracking Data – WIS 29 Abbotsford
Figure 4.4.5 Typical Chipped Joint – WIS 29 Abbotsford

84
4.4.2 WIS 29 Wittenberg
Distress measures recorded during the year 2004 survey are provided in Figures
4.4.6 to 4.4.8. As shown there is a limited amount of joint spalling and faulting and more
extensive joint chipping which has been evident since soon after construction. In general,
all sections are performing well with a limited amount of joint faulting measured within the
FRP composite and stainless steel test sections. The total faulting measured was across
one joint with the RJD and SS section and 2 joints within the FR section.
2004 Slab Distress SurveyWIS 29 Wittenberg
0
2
4
6
8
10
12
14
16
18
20
RJD FR SS 1E CTL TR
Test Section
% S
palle
d Jo
ints
Driving Lane Passing Lane
Figure 4.4.6 Joint Spalling Data – WIS 29 Wittenberg

85
2004 Slab Distress SurveyWIS 29 Wittenberg
0
10
20
30
40
50
60
70
80
90
100
RJD FR SS 1E CTL TR
Test Section
% C
hipp
ed J
oint
s
Driving Lane Passing Lane
Figure 4.4.7 Chipped Joint Data – WIS 29 Wittenberg
2004 Slab Distress SurveyWIS 29 Wittenberg
0.0
0.1
0.2
0.3
0.4
0.5
0.6
0.7
0.8
0.9
1.0
RJD FR SS 1E CTL TR
Test Section
Tota
l Joi
nt F
aulti
ng, i
n
Driving Lane Passing Lane
Figure 4.4.8 Joint Faulting Data – WIS 29 Wittenberg

86
4.4.3 WIS 29 Tilleda
Distress measures recorded during the year 2004 survey are provided in Figures
4.4.9 to 4.4.11. As shown there is an increased amount of joint spalling and joint faulting
as compared to test sections at WIS 29 Abbotsford and WIS 29 Wittenberg and reduced
joint chipping. Transverse contraction joints within these test sections were saw cut with a
multiple blasé joint cutter which appears to have produced a more durable joint face.
2004 Slab Distress SurveyWIS 29 Tilleda
0
5
10
15
20
25
TS4 TS3 STD TS2 TS1
Test Section
% S
palle
d Jo
ints
Driving Lane Passing Lane
Figure 4.4.9 Joint Spalling Data – WIS 29 Tilleda

87
2004 Slab Distress SurveyWIS 29 Tilleda
0
5
10
15
20
25
30
35
40
TS4 TS3 STD TS2 TS1
Test Section
% C
hipp
ed J
oint
s
Driving Lane Passing Lane
Figure 4.4.10 Chipped Joint Data – WIS 29 Tilleda
2004 Slab Distress SurveyWIS 29 Tilleda
0.0
0.1
0.2
0.3
0.4
0.5
TS4 TS3 STD TS2 TS1
Test Section
Tota
l Joi
nt F
aulti
ng, i
nch
Driving Lane Passing Lane
Figure 4.4.11 Joint Faulting Data – WIS 29 Tilleda

88
CHAPTER 5
CONSTRUCTION COST CONSIDERATIONS
The cost-effectiveness of the various design sections described in this report may be
analyzed on the basis of reduced first costs or reduced life-cycle costs. The premise for
the design of many of the test sections was to reduce the initial cost of construction without
compromising long-term pavement performance. In this respect, any savings in initial
construction costs would automatically result in a reduced life-cycle cost and yield a cost-
effective concrete pavement design. In contrast, test section designs which would result in
an increased construction cost would only be considered as cost-effective if there was a
proven increase in the service life of the pavement and/or a reduction in overall
maintenance costs.
The performance data collected to date provides some insight into the long-range
performance trends for the various test sections, but insufficient clarity in the data makes it
difficult to accurately assess the life-cycles costs associated with the various design
alternatives. Since ride quality is a factor in long term performance, the collected ride
quality data obtained from the three project sites will be used to illustrate the potential cost-
effectiveness of each alternate design section.
5.1 WIS 29 Abbotsford
The 2004 IRI values, representing approximately seven years of service life, suggest
the following:
- The passing lane is performing better (i.e., lower IRI value) than the driving lane for
all constructed sections. This result is as expected due to the increased traffic
loadings typically experienced within the driving lane.
- The performance of the FRP sections (RJD, GF, CP) is comparable to the control
sections in both the driving and passing lanes, indicating that the ride quality of
these sections has not been compromised by the reduction in joint deflection load
transfer associated with the FRP bars.

89
- The passing lane within all alternate placement sections (1E, 2E, 3E, 4E, 3S, 4S) is
performing better than the driving lane of the control sections, which suggests that a
reduction in the dowel placements within the passing lane may not compromise the
long-term performance of the pavement as a whole. In other words, both lanes
would be expected to deteriorate at comparable rates.
5.2 WIS 29 – Wittenberg
The 2004 IRI values, representing approximately seven years of service life, suggest
the following:
- The passing lane is performing better (i.e., lower IRI value) than the driving lane for
all constructed sections except the FRP sections (RJD, FR).
- The performance of the alternate placement section (1E) is comparable to the
control sections in both the driving and passing lanes.
- The performance of the alternate placement section (1E) is comparable to the
control sections in both the driving and passing lanes.
- The passing lane within the trapezoidal (TR) and alternate placement section (1E)
is performing better than the driving lane of the control sections, which suggests that
a reduction in slab thickness or in the dowel placements within the passing lane may
not compromise the long-term performance of the pavement as a whole.
5.3 WIS 29 – Tilleda
The 2004 IRI values, representing approximately five years of service life, suggest
the following:
- The passing lane is performing better (i.e., lower IRI value) than the driving lane for
all constructed sections.
- The performance of all sections except Test Section 3 (2-way surface drainage, 1-
way base drainage, trapezoidal passing lane) is comparable or better than the
control sections in both the driving and passing lanes.
- The one-way surface and one-way base drainage sections (TS1, TS2) are
performing better than all other sections.

90
5.4 Initial Construction Costs
The performance data trends presented in Sections 5.1 to 5.3 suggest potential
savings may be realized for the initial construction and/or long-term costs of various test
sections. In order to quantify these costs savings, contacts were made with paving
contractors, concrete pavement associations, and material suppliers to develop appropriate
units costs for the specific paving items which varied amongst the test sections. Table
5.4.1 provides estimates of current unit prices for specific construction items relating to the
various test section designs. Table 5.4.2 provides initial construction cost comparisons for
each test section, computed on a per-mile basis for the 4-lane divided highway cross
section, based on the unit costs provided in Table 5.4.1.
Table 5.4.1 Estimates of Unit Construction Costs
Item Unit Unit Price Epoxy Coated Steel Dowel 1-1/2” x 18” Loose, Each $4.00
Polyester FRP Dowel 1-1/2” x 18” Loose, Each $6.11
Solid Stainless Steel Dowel 1-1/2” x 18” Loose, Each $30.00
Hollow-Filled Stainless Steel Dowel, 1-1/2” x 18” Loose, Each $15.00
Paving Grade Concrete Cubic Yard $50.00
Longitudinal Drainage System Foot $6.50
Aggregate Base, Open Graded No. 2 Cubic Yard $17.19

91
Table 5.4.2 Comparative Initial Costs of Test Sections
WIS 29 – Abbotsford
Test Section
Initial Construction Cost Comparison $/mile – 4-lane Divided Pavement
C1, C2 $0
RJD, GF, CP + $31,325
HF + $163,306
4S + $163,306
3S + $180,436
4E - $29,692
3E - $27,408
2E - $29,692
1E - $31,976
WIS 29 – Wittenberg
Test Section
Initial Construction Cost Comparison $/mile – 4-lane Divided Pavement
C1, C2, C3 $0
RJD, FR + $32,203
SS + $396,812
1E - $32,872
TR - $63,600
WIS 29 – Tilleda
Test Section
Initial Construction Cost Comparison $/mile – 4-lane Divided Pavement
STD $ 0
TS1 - $68,640
TS2 - $60,302
TS3 + $2,207
TS4 + $31,138

92
5.4.1 Alternate Dowel Placements
The performance data indicates that a reduction in dowels bars within the passing
lane may be a viable alternative to reduce initial construction costs without compromising
the overall pavement performance. The current design procedures for jointed concrete
pavements, as detailed in Facilities Development Manual Procedure 14-10-10, requires a
transverse contraction joint spacing of 18 feet for pavement thicknesses of 10 inches or
greater. Using this benchmark, a total of 3,520 dowels per lane-mile would be required for
construction of a standard passing lane with 12 dowels per joint (12 inch c-c spacing).
Reducing the passing lane dowel placements to 3 dowels per wheel path (6 dowels per
joint), represents a potential cost savings of $14,080 per 4-lane mile using epoxy coated
steel dowels.
5.4.2 Trapezoidal Cross Sections
The performance data indicates that the use of a trapezoidal slab may be a viable
design alternate to reduce initial construction costs. Based on the full-width trapezoidal
slab used for the WIS 29 – Wittenberg section, a potential savings of 636 cubic yards of
concrete per 2-lane mile (26-ft width) may be realized, potentially reducing initial
construction costs by $63,600 per 4-lane mile. For the trapezoidal sections used for WIS
29 – Tilleda (TS2, TS3, TS4), the increased slab width used for the passing lane results in
an increase in concrete materials when compared to a typical design cross section (26-ft
width). Based on the design slab thickness of 10-inches, additional concrete material
requirements per constructed 2-lane mile are 16 cubic yards (TS2) and 244 cubic yards
(TS3, TS4), representing increases in initial construction costs of $1,600 (TS2) and $24,440
(TS3, TS4) per 4-lane mile.
5.4.3 Alternative Drainage Designs
The alternative drainage designs used for the better performing WIS 29 – Tilleda
sections (TS1, TS2, TS4) represent changes to the drainage layer and/or the longitudinal
collection system. As compared to the standard design section (4-inch drainage layer, 2-
way drainage, 26-ft width), TS2 and TS4 (4-inch drainage layer, 29-ft width) require an

93
additional 196 cubic yards of open graded aggregate base per mile, representing an
increase in initial construction costs of $3,369 per mile for both sections. The open graded
aggregate material requirements for TS1 (4-inch drainage layer, 26-ft width) are identical to
a standard section. For the sections with one-way base drainage (TS1, TS2), the
elimination of the median edge longitudinal drainage system represents a potential cost
savings of $34,320 per one-way mile. Combining these two cost factors, the initial
construction cost variations for each of the better performing WIS 29 – Tilleda sections are:
TS1 - $68,640 savings per 4-lane mile TS2 - $60,302 savings per 4-lane mile TS4 - $31,138 increase per 4-lane mile
5.4.4 Alternative Dowel Materials
The alternative dowel bar materials used for the WIS 29 – Abbotsford and WIS
29 – Wittenberg test sections, including FRP, Solid Stainless Steel, and Hollow-Filled
Stainless Steel, are all more costly at present than the standard epoxy coated steel
dowels. The performance data collected to date does not indicate that test sections
constructed with these alternative dowels are performing substantially better than
conventional epoxy coated steel dowels and thus these alternate dowel materials may
not be cost-effective. Longer term performance data will be required to better define
performance enhancements that may be associated with these alternative dowel
materials.

94
CHAPTER 6
SUMMARY & RECOMMENDATIONS
This report presents details on the design and performance of alternative pavement
sections constructed within the State of Wisconsin along portions of WIS 29 in Shawano,
Clark and Marathon Counties. These pavement test sections were designed and
constructed in order to investigate the feasibility of incorporating design changes which
would lower the initial construction costs without compromising pavement performance.
These designs, if suitable, may increase the cost effectiveness of concrete pavements and
offer pavement designers with alternatives to the standard designs currently used by
WisDOT.
6.1 Summary of Study Findings
Pavement test sections incorporating variable dowel positioning and alternative
dowel materials were constructed in 1997 along WIS 29, west of Abbotsford. These
sections were constructed to investigate the impacts of reduced doweling within the driving
lanes and/or alternate dowel materials with enhanced corrosion resistance, including fiber
reinforced polymer (FRP) composite and stainless steel dowels. The following summarizes
the performance data collected to date within these sections:
- Through the first seven years of service, no significant distress, including joint
spalling, joint faulting or slab cracking, is noted within the FRP composite sections.
The ride quality of the FRP composite sections, in terms of computed IRI values, is
poorer than comparable sections with standard epoxy coated steel dowels.
- The reduced stiffness of the FRP composite dowels, as compared to standard
epoxy coated steel dowels, results in markedly lower transverse joint deflection load
transfer during periods of cooler weather when joint openings are increased and
aggregate interlock is minimal. This reduced deflection load transfer will typically
result in higher stresses and deflections within the loaded slab and may lead to a

95
shortened service life in terms of longitudinal and/or corner cracking and slab
faulting.
- Deflection load transfer provided by the solid stainless steel dowels is slightly to
markedly lower than conventional epoxy coated steel dowels for WIS 29 Abbotsford
placement alternates 3 and 4. For the standard placement on WIS 29 Wittenberg,
joint deflection load transfer values are comparable to the epoxy coated steel bars.
The hollow-core, mortar-filled stainless steel dowels appear to be providing
deflection load transfer roughly equivalent to standard epoxy coated steel dowels.
- Section-average transverse joint load transfer values generally decreases with a
reduced number of wheel path dowels. However, sections with four dowels in the
outer wheel path are providing deflection load transfer values comparable to the
standard full-width dowel placement. Sections with three dowels in the outer wheel
path generally provide reduced load transfer compared to other placements.
Reduced deflection load transfer within the outer wheel path will typically result in
higher stresses and deflections within the loaded slab and may lead to a shortened
service life in terms of longitudinal and/or corner cracking and slab faulting.
- Test sections with alternate dowel placements are performing relatively well with
limited low severity joint spalling noted within the driving lane in three of the seven
sections. Test sections with 3 and 4 epoxy coated steel dowels in the outer wheel
path, but no dowel at or near the edge, have 10.3% (1E) and 13.8% (2E) spalled
joints, respectively. The remaining test section, with three stainless steel wheel path
dowels and 1 dowel at the edge (4SS) has 3.4% spalled joints.
Test sections incorporating alternate dowel materials, placement locations, and slab
geometry were constructed within the eastbound and westbound lanes of WIS 29
Wittenberg. The following summarizes the performance data collected to date within these
sections:

96
- Test sections constructed with FRP composite dowels are showing slightly to
substantially lower deflection load transfer as compared to standard epoxy
coated steel dowels. However, the relative reduction in load transfer capacity
varies depending on the period of deflection testing. After 7 years of service,
there is minimal joint faulting and spalling within the driving lane of the FRP test
sections. Recent profiling data from these sections indicate slightly higher IRI
values as compared to control sections values.
- The test section constructed with solid stainless steel dowels is providing
deflection load transfer capacity essentially equal to the control sections with
epoxy coated steel dowels. After 7 years of service, joint faulting was evident
across only 1 joint (0.3 inches) which was coincident with a high early strength
slab placement at a driveway location. The profile readings within this section
also indicate higher IRI values as compared to the control sections, likely a result
of the joint faulting.
- The test section incorporating a reduced number of dowels (three per wheel
path) is performing essentially on par with the control section, in terms of IRI,
load transfer and joint distress.
- After 7 years of service, the test section incorporating the trapezoidal slab is
performing equal to or better than the control section in terms of IRI and joint
faulting. Low severity transverse joint spalls are noted at 3 joints within the
driving lane but this distress has not affected ride quality measures.
Test sections incorporating alternate slab geometry and drainage designs were
constructed within the westbound lanes of WIS 29 Tilleda. The following summarizes the
performance data collected to date within these sections:
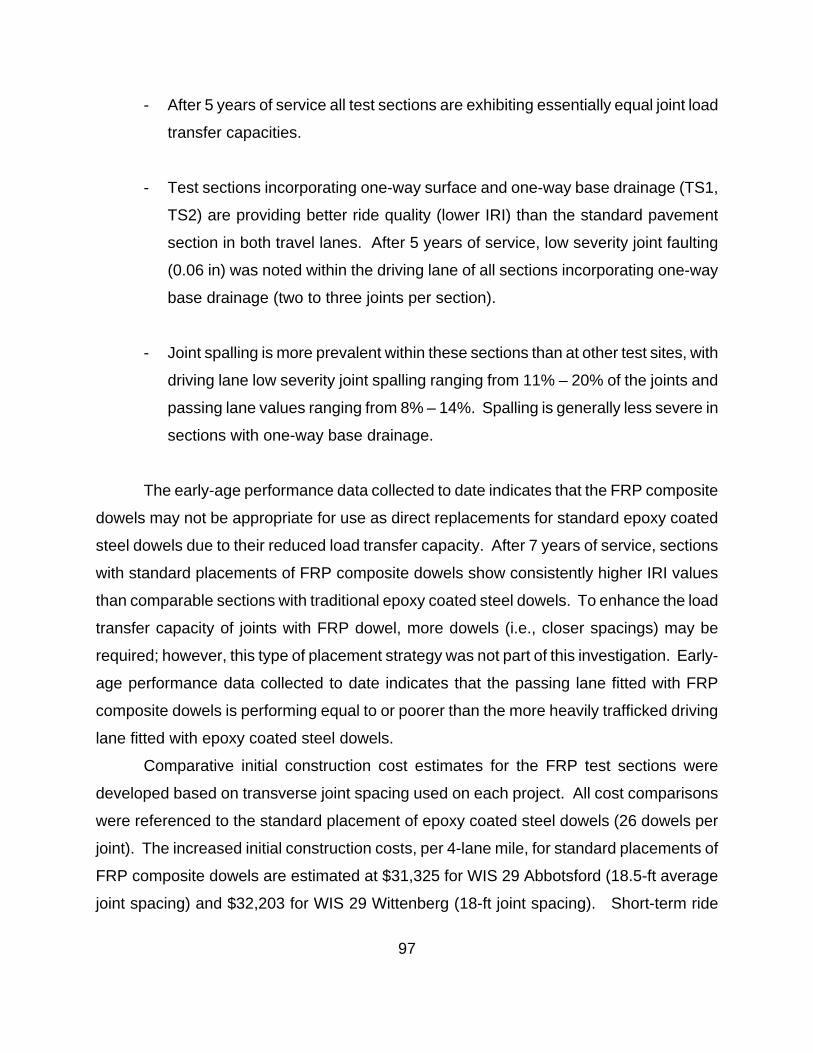
97
- After 5 years of service all test sections are exhibiting essentially equal joint load
transfer capacities.
- Test sections incorporating one-way surface and one-way base drainage (TS1,
TS2) are providing better ride quality (lower IRI) than the standard pavement
section in both travel lanes. After 5 years of service, low severity joint faulting
(0.06 in) was noted within the driving lane of all sections incorporating one-way
base drainage (two to three joints per section).
- Joint spalling is more prevalent within these sections than at other test sites, with
driving lane low severity joint spalling ranging from 11% – 20% of the joints and
passing lane values ranging from 8% – 14%. Spalling is generally less severe in
sections with one-way base drainage.
The early-age performance data collected to date indicates that the FRP composite
dowels may not be appropriate for use as direct replacements for standard epoxy coated
steel dowels due to their reduced load transfer capacity. After 7 years of service, sections
with standard placements of FRP composite dowels show consistently higher IRI values
than comparable sections with traditional epoxy coated steel dowels. To enhance the load
transfer capacity of joints with FRP dowel, more dowels (i.e., closer spacings) may be
required; however, this type of placement strategy was not part of this investigation. Early-
age performance data collected to date indicates that the passing lane fitted with FRP
composite dowels is performing equal to or poorer than the more heavily trafficked driving
lane fitted with epoxy coated steel dowels.
Comparative initial construction cost estimates for the FRP test sections were
developed based on transverse joint spacing used on each project. All cost comparisons
were referenced to the standard placement of epoxy coated steel dowels (26 dowels per
joint). The increased initial construction costs, per 4-lane mile, for standard placements of
FRP composite dowels are estimated at $31,325 for WIS 29 Abbotsford (18.5-ft average
joint spacing) and $32,203 for WIS 29 Wittenberg (18-ft joint spacing). Short-term ride

98
quality data collected to date indicates that these may not be cost-effective design
alternates. Longer-term data is needed to better define the cost-effectiveness of these
alternate dowel materials.
The collected performance data from WIS 29 Abbotsford also suggests that
pavement sections with a reduced number of epoxy coated steel dowels are providing
better service than stainless steel alternates. The increased initial construction costs for
alternate placements of solid stainless steel dowels are estimated at $163,306 and
$180,436, respectively, per 4-lane mile (compared to standard placements of expoxy
coated steel bars). Short-term ride quality data collected to date indicates that these may
not be cost-effective design alternates. In contrast, performance data from WIS 29
Wittenberg indicates the section with standard placements of solid stainless steel dowels is
performing as well as the section with traditional epoxy coated steel dowels. The variation
in comparative performance between project locations may also be related to the dowel
placement techniques used, namely the automatic dowel bar inserter (DBI) at WIS 29
Abbotsford and standard dowel baskets at WIS 29 Wittenberg. The increased initial
construction cost for standard placements of solid stainless steel dowels is estimated at
$396,812 per 4-lane mile. Longer-term performance data is needed to better define the
cost-effectiveness of this alternate dowel material.
The early age performance data from WIS 29 Abbotsford also suggests that reduced
dowel placements in the heavily trafficked driving lane will result in a compromised service
life. However, for the majority of test sections the performance of the passing lane with
reduced dowel placements is equal to or better than the performance of the driving lane.
Reducing the number of dowels in the passing lane only is estimated to reduce initial
constructions cost by $14,080 per 4-lane mile and would yield a pavement with equivalent
lane performance. In this respect, the cost savings associated with reduced dowel
placements in the passing lane may be justifiable.
The trapezoidal slab design used on WIS 29 Wittenberg yields an estimated savings
of $63,600 per 4-lane mile. Short-term ride quality data collected to date indicates that this
design alternate is performing better than all other sections at this location and thus may be
a viable, cost-effective design alternate.

99
The early age performance data from the WIS 29 Tilleda sections constructed with
variable slab geometry and drainage designs indicate that one-way surface and one-way
base drainage designs (TS1, TS2) are performing as well or better than standard crowned
pavements with two-way base drainage. The initial construction cost savings associated
with these sections range from $60,302 (TS2) to $68,640 (TS1) per 4-lane mile, indicating
both may be viable, cost-effective design alternates. The drainage capacity of the base
layer within these sections, constructed with open graded number 1 stone, appears
sufficient to handle all infiltrated water. It is unclear if a similarly designed drainage using
open graded number 2 stone, which is the current WisDOT standard, would provide
comparable performance. It is also unclear if long tangent sections constructed with one-
way surface drainage would result in a safety problem due to vehicle drift.
6.2 Recommendations for Further Study
This report presents study results for pavement test sections in service for 5 – 7
years. In the life of well-designed concrete pavement systems, this can be considered as
very early-age performance. While estimations of long-term performance may be
generated from early-age indicators, sufficient clarity regarding the cost effectiveness of
alternate design strategies generally requires an extended period of observation. To this
end, it is recommended that all tests sections be continually monitored on a 2-3 year cycle
to document their performance. Ride quality and distress information should be gathered
on a routine basis following WisDOT protocol for the state-wide pavement survey.
Deflection data should be collected at 3-5 year intervals to document the long-term
structural performance of all sections.

APPENDIX A
Test Section Location Maps

A-1

A-2
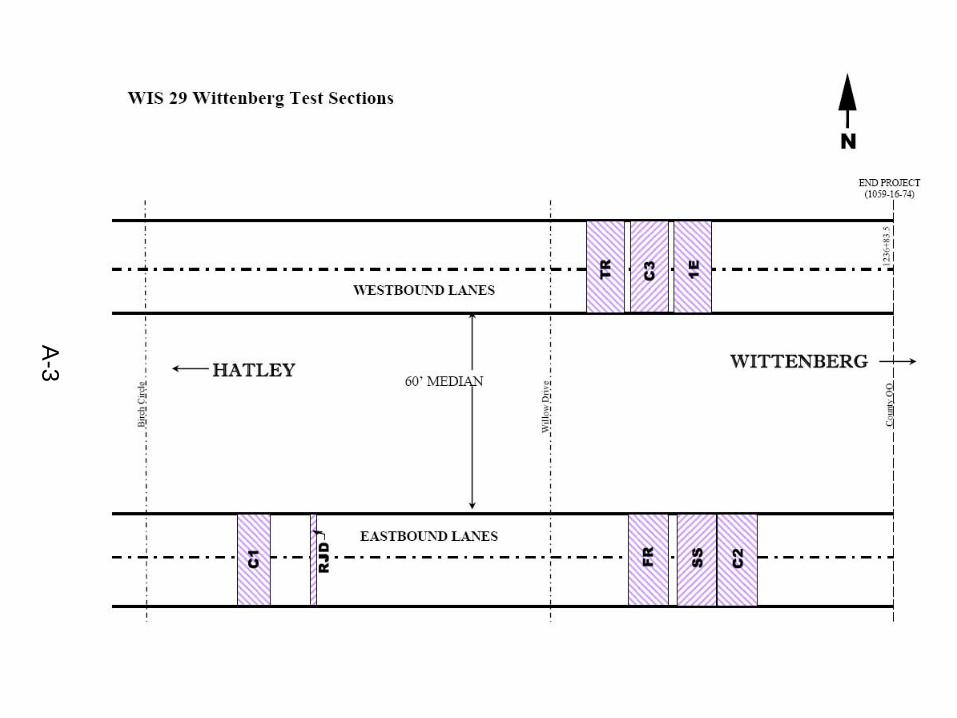
A-3

A-4