citethis:phys. chem. chem. phys.,2011,13 …ivo/pub/2011/toh_pccp13_11985.pdf11986 phys. chem. chem....
TRANSCRIPT
This journal is c the Owner Societies 2011 Phys. Chem. Chem. Phys., 2011, 13, 11985–11997 11985
Cite this: Phys. Chem. Chem. Phys., 2011, 13, 11985–11997
Fluorescence quantum yield and photochemistry of bacteriophytochrome
constructsw
K. C. Toh,za Emina A. Stojkovic,yb Ivo H. M. van Stokkum,aKeith Moffat
bcand
John T. M. Kennis*a
Received 6th January 2011, Accepted 5th May 2011
DOI: 10.1039/c1cp00050k
Bacteriophytochromes (Bphs) are red-light photoreceptor proteins with a photosensory core that
consists of three distinct domains, PAS, GAF and PHY, and covalently binds biliverdin (BV)
to a conserved cysteine in the PAS domain. In a recent development, PAS–GAF variants were
engineered for use as a near-infrared fluorescent marker in mammalian tissues (Tsien and
co-workers, Science, 2009, 324, 804–807). Here, we report the fluorescence quantum yield and
photochemistry of two highly-related Bphs from Rps. palustris, RpBphP2 (P2) and RpBphP3 (P3)
with distinct photoconversion and fluorescence properties. We applied ultrafast spectroscopy to
wild type P3 and P2 PAS–GAF proteins and their P3 D216A, Y272F and P2 D202A
PAS–GAF–PHY mutant proteins. In these mutants hydrogen-bond interactions between a
conserved aspartate (Asp) which connects the BV chromophore with the PHY domains are
disrupted. The excited-state lifetime of the truncated P3 and P2 PAS–GAF proteins was
significantly longer than in their PAS–GAF–PHY counterparts that constitute the full
photosensory core. Mutation of the conserved Asp to Ala in the PAS–GAF–PHY protein had a
similar but larger effect. The fluorescence quantum yields of the P3 D216A and Y272F mutants
were 0.066, higher than that of wild type P3 (0.043) and similar to the engineered Bph of Tsien
and co-workers. We conclude that elimination of a key hydrogen-bond interaction between Asp
and a conserved Arg in the PHY domain is responsible for the excited-state lifetime increase in all
Bph variants studied here. H/D exchange resulted in a 1.4–1.7 fold increase of excited-state
lifetime. The results support a reaction model in which deactivation of the BV chromophore
proceeds via excited-state proton transfer from the BV pyrrole nitrogens to the backbone
of the conserved Asp or to a bound water. This work may aid in rational structure- and
mechanism-based conversion of constructs based on P3 and other BPhs into efficient near-IR,
deep tissue, fluorescent markers.
Introduction
Phytochromes are red-light sensing proteins found in plants,
bacteria, cyanobacteria and fungi that act as photochromic
switches activated by distinct wavelengths in the red or far red
regions.1–8 Their light-sensing module comprises PAS, GAF
and PHY domains and covalently binds a linear tetrapyrrole,
phycochromobilin (PFB) in plant phytochromes, phycocyano-
bilin (PCB) in cyanobacterial phytochromes, and biliverdin
(BV) in bacteriophytochromes (BPh). They exist as dimers in
which interfaces between the monomers are formed both by
the N-terminal photosensory core and the C-terminal kinase
domain.9 In the dark, most phytochromes adopt a red-absorbing
state known as Pr and upon light absorption convert to a far-red
absorbing state known as Pfr. The light activation mechanism
involves an isomerization process about the C15QC16 double
bond of the linear tetrapyrrole, changing its configuration
from 15Za to 15Ea.10–12 Light-induced Z/E isomerization of
the tetrapyrrole takes place on a timescale of tens to hundreds
of ps.13–18 The reaction then proceeds through several inter-
mediate, spectroscopically-distinct states such as Lumi-R
before the Pfr state is established.19–22
The recent determination of crystal structures of various
BPhs, the cyanobacterial phytochrome Cph1 and the NMR
structure of the single domain, GAF-only cyanobacterial
a Biophysics Section, Department of Physics and Astronomy,VU University, De Boelelaan 1081, 1081HV Amsterdam,The Netherlands. E-mail: [email protected]
bDepartment of Biochemistry and Molecular Biology,The University of Chicago, USA
c Institute for Biophysical Dynamics, The University of Chicago, USAw Electronic supplementary information (ESI) available. See DOI:10.1039/c1cp00050kz Current address: Division of Molecular Biosciences, ImperialCollege, London, UK.y Current address: Department of Biology, Northeastern IllinoisUniversity, Chicago, IL, USA.
PCCP Dynamic Article Links
www.rsc.org/pccp PAPER
Dow
nloa
ded
by V
RIJ
E U
NIV
ER
SIT
EIT
on
16 J
une
2011
Publ
ishe
d on
25
May
201
1 on
http
://pu
bs.r
sc.o
rg |
doi:1
0.10
39/C
1CP0
0050
KView Online

11986 Phys. Chem. Chem. Phys., 2011, 13, 11985–11997 This journal is c the Owner Societies 2011
SyB23 has explored the light-activated function of phyto-
chromes.10,11,24–26 BPhs bind BV through a covalent thioether
linkage to the PAS domain. BV is largely engulfed by the GAF
domain, which provides most of the hydrogen bonding, steric
and hydrophobic interactions that secure the chromophore
in position.10,24,26,27 The pyrrole rings form an intricate
hydrogen-bond network in which a conserved Asp, a conserved
His and a water molecule interact with the pyrrole nitrogens
(Fig. 1). The PHY domain extends the PAS–GAF core to tune
spectral properties and facilitate physiologically functional
photochemistry. Crystal structures of the complete photosensory
core module comprising the PAS–GAF–PHY domains are
available only for Cph1 in the Pr state and Pseudomonas
PaBphP in the Pfr state.10,28 For P3 and Deinococcus Bph
(DrBphP), structures of only the PAS–GAF domains are
known.24–26 The PHY domain engages the chromophore
pocket through hydrogen bonding with the conserved Asp,
and seals off the chromophore from contact from the solvent.
Deletion of the PHY domain affects the photochemistry and
impairs Pfr formation.26,29
In an important recent development, the PAS–GAF protein
from DrBphP was engineered by Shu, Tsien and co-workers
for use as a fluorescent marker in mammalian tissues.30
Fluorescent phytochromes were first reported by Fischer and
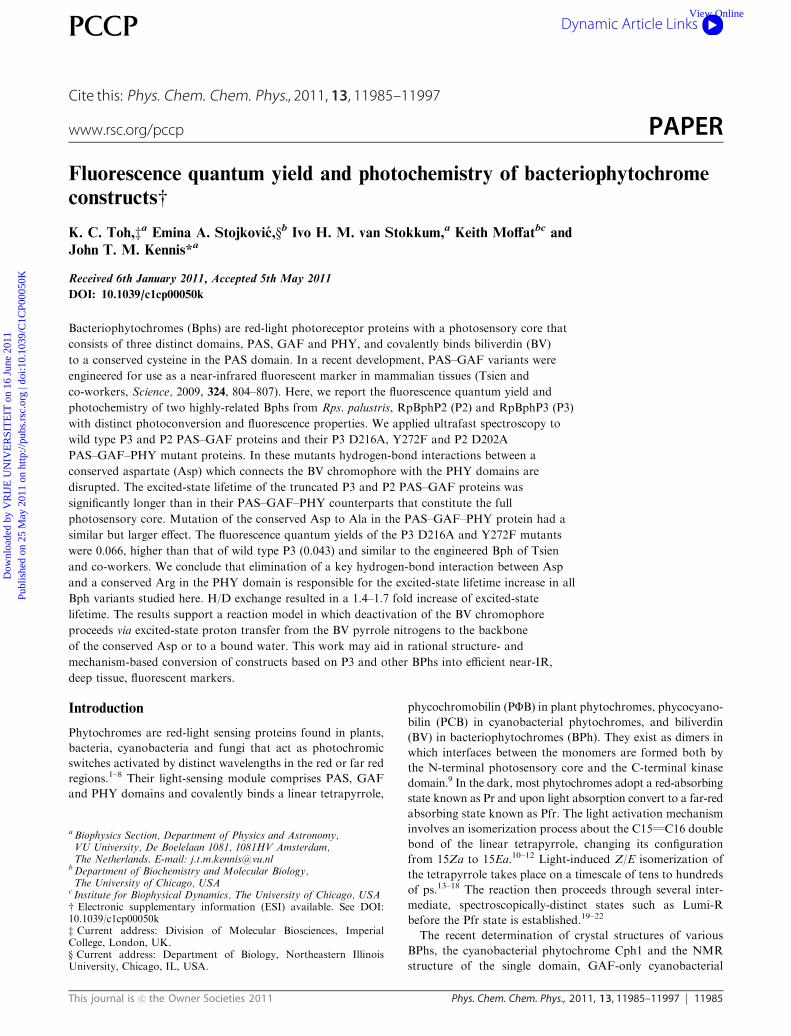
Fig. 1 (A) The BV binding site in the X-ray structure (Protein Data Bank code 2OOL) of Rhodopseudomonas palustris P3; (B) the BV binding site
in the X-ray structure (1ZTU) of Deincococcus radioduransDrBphP; (C) the BV binding site in the X-ray structure (2VEA) of the Cph1 full length
construct in the Pr ground state. Asp-207 of the PASDIP motif in the GAF domain forms together with its main chain an extensive hydrogen
bonding network with the chromophore and Arg-472 in the PRSXF motif of the PHY domain; lower panel: partial protein sequence alignment of
bacteriophytochromes P3 and P2 from Rhodopseudomonas palustris, DrBphP from Deinoccocus radiodurans, AtBphP1 from Agrobacterium
tumafeciens, PaBphP from Pseudomonas aeruginosa and cyanobacterial phytochrome Cph1 from Synechocystis sp. pcc 6803. Numerical values
indicate positions of amino acids in P3 primary sequence.
Dow
nloa
ded
by V
RIJ
E U
NIV
ER
SIT
EIT
on
16 J
une
2011
Publ
ishe
d on
25
May
201
1 on
http
://pu
bs.r
sc.o
rg |
doi:1
0.10
39/C
1CP0
0050
KView Online
This journal is c the Owner Societies 2011 Phys. Chem. Chem. Phys., 2011, 13, 11985–11997 11987
Lagarias31 and Vierstra and co-workers.32 DrBphP fluoresces
in the near-IR at B720 nm, a wavelength substantially longer
than that emitted by GFP-derived fluorescent proteins.
Longer-wavelength fluorescence is less prone to scattering
and therefore can penetrate more deeply into tissue. Shu
et al.30 engineered the PAS–GAF chromophore binding
domain of DrBphP to yield a monomeric protein with a
fluorescence quantum yield of 0.07, and explored a series of
mutations around BV ring D and the dimerization surface.
Recent work by Zhao and co-workers explored alternative
routes to produce fluorescent phytochromes.33 Since BV is a
naturally occurring cofactor in mammalian tissue that covalently
binds in an uncatalyzed reaction to a conserved cysteine in the
PAS domain, BPhs can readily be genetically encoded and
assembled in vivo. BPh photochemistry is thus of considerable
significance for biomedical research and technology. However,
Bph fluorescence properties and in particular the fluorescence
quantum yield need substantial improvement for routine
applications as a fluorescence marker. This led us to explore
other Bphs and domain constructs which might offer improved
fluorescence properties.
BPhs RpBphP2 (P2) and RpBphP3 (P3) from Rhodopseudo-
monas palustris are examples of classical and non-classical
phytochromes respectively that have a common ground state
(Pr) but different photoactivated states. Upon illumination, P2
forms the classical Pfr state. P3 is unique with respect to
classical phytochromes: it forms a near-red light absorbing
state at 645 nm denoted Pnr22 and in particular, its ring D is
restrained by three hydrogen bonds from His, Ser and Lys side
chains to its carbonyl group (Fig. 1A).26 In classical Bphs, only
one hydrogen bond from His stabilizes ring D (Fig. 1B).24,25 In
our recent femtosecond time-resolved absorption studies on
the complete, three-domain, PAS–GAF–PHY photosensory
core modules of P2 and P3, we showed that the excited state
lifetimes and the spectra of P3 differ substantially from those
of P2 and other classical Bphs.13,34 Strikingly, the BV excited
state of P3 decayed with a monoexponential time constant of
330 ps, significantly longer than that observed in P2 and other
phytochromes. We related these differences to the number and
strength of the hydrogen bonds between the protein and ring
D.34 We determined that the presence of two additional polar
residues, lysine and serine located in the immediate vicinity of
ring D, lowers the quantum yield for Lumi-R formation and
increases the excited-state lifetime of BV. Excited-state decay
predominantly proceeds through an excited-state proton
transfer reaction (ESPT) from the pyrrole nitrogens to a
conserved Asp or to bound water. Altogether, the fluorescence
quantum yield of P3 is significantly higher than that of
classical Bph. With detailed knowledge of its structure and
excited-state dynamics, P3 forms an attractive starting material
on which to base a fluorescent probe.
Under the assumption that the Pr states of the
PAS–GAF–PHY constructs of P2 and P3 are structurally
similar to that of Cph1 (whose X-ray structure from Protein
Data Bank entry 2VEA is shown in Fig. 1), the BV chromophore
forms an intricate hydrogen-bond network with the main-
chain carbonyl of conserved Asp from the Proline-Alanine-
Serine-Aspartate-Isoleucine-Proline (PASDIP) sequence motif
and a bound water at its pyrrole nitrogens. In turn, the Asp
side chain forms double hydrogen bonds with a conserved Arg
from the PRXSF motif in the PHY domain. Thus, Asp bridges
BV with the PHY domain through extensive hydrogen
bonding.
Here, we explore the consequences of the absence of the
PHY domain for photochemistry and the quantum yield for
fluorescence. We experimentally address the impact of the
hydrogen-bond network on these factors through an ultrafast
transient absorption and time-resolved fluorescence study of
truncated P2 and P3 variants that comprise only the PAS and
GAF domains, and of PAS–GAF–PHY constructs where the
conserved Asp from the PASDIP motif is replaced by
Ala. These Bph variants exhibit a further increase of the
fluorescence quantum yield with respect to wild type
PAS–GAF–PHY proteins. Importantly, none of these
constructs form a canonical Pfr or Pnr state.26 This work
provides important clues for understanding the light activation
mechanism of Bph that can be utilized for further development
of Bph PAS–GAF proteins into an efficient near-infrared
deep-tissue fluorescent probe by means of rational structure-
and mechanism-based engineering.13
Materials and methods
Sample preparation
The detailed preparation of P2 and P3 PAS–GAF BPhs, the P2
PAS–GAF–PHY D202A mutant and the P3 PAS–GAF–PHY
D216A mutant was described previously.26 Proteins were
dissolved in a 20 mM TRIS�HCl buffer at pH 8. For H/D
exchange experiments, they were dissolved in D2O buffer
(20 mM TRIS�HCl, pD 8 at room temperature). H/D exchange
was carried out by removing the H2O buffer using an Amicon
filter (30 kD) and an ultracentrifuge, and then adding the D2O
buffer to dilute the protein concentration. These procedures
were repeated for at least 6 times to minimize the content of
the H2O buffer. The deuterated proteins were prepared at least
24 hours prior to the experiments. On the day of the experiments,
the samples (in D2O buffer) were further diluted by adding
D2O buffer.
Femtosecond transient absorption spectroscopy
Femtosecond transient absorption experiments were performed
using the amplified Ti:sapphire-based laser setup described
previously.35 A seed pulse from a diode-pumped oscillator
(Coherent Vitesse, 800 nm, 76.6 MHz, 50 fs) was amplified to
2.5 W by using a Nd:YLF high-power pump-laser (Coherent
Evolution-20, 527 nm, 1 kHz). The Ti:Sapphire-based amplifier
(Coherent Legend-USP) incorporates chirped pulse amplification
and a stretcher/compressor combination to deliver sub-50 fs
pulses, with a centre wavelength at 800 nm and a bandwidth of
30 nm (FWHM) at a repetition rate of 1 kHz. The beam was
guided into an optical parametric amplification setup (Coherent
OpeRA), which converts the pump laser output to a tunable
pair of outputs: the signal (1150–1600 nm) and the idler
(1600 nm–2630 nm). To generate a 680 nm pump beam, the
signal at 1360 nm was frequency-doubled in a nonlinear
crystal. A small fraction of the initial 800 nm beam was used
to generate the white-light probe light using a sapphire crystal.
Dow
nloa
ded
by V
RIJ
E U
NIV
ER
SIT
EIT
on
16 J
une
2011
Publ
ishe
d on
25
May
201
1 on
http
://pu
bs.r
sc.o
rg |
doi:1
0.10
39/C
1CP0
0050
KView Online
11988 Phys. Chem. Chem. Phys., 2011, 13, 11985–11997 This journal is c the Owner Societies 2011
The protein solution was contained in a quartz flow cuvette
with 2 mm path length. A diaphragm metering pump
(STEPDOS 03S from KNF Neuberger, Inc.) was used to flow
fresh sample to the cuvette from an external reservoir with
3–4 ml sample volume. Background illumination to photo-
revert the Bph sample to Pr was provided with an LED of
center wavelength 750 nm (P2 D202A, P2 PAS–GAF and P3
PAS–GAF) or 650 nm (P3 D216A). Alternatively, a 2 mm
quartz sample cuvette was attached to a high frequency shaker
and used without flow, but retaining direct illumination by a
750 nm or 650 nm LED. The flow and shaking cuvette
methods gave identical results. The sample had an absorbance
of about 0.2–0.4 for a 2 mm sample thickness at the excitation
wavelength. Both the pump light of 680 nm with energy of
200 nJ to 400 nJ (generated from the OPA-SFG) and the probe
light are focused and overlapped at the sample in the cuvette.
The probe light was focused on the entrance slit of a spectro-
graph, spectrally dispersed and projected on a 256 diode-array
detector. The spectral resolution was 1.2 nm. A reference
dataset using water was collected under identical experimental
conditions and used to correct artifacts caused by cross-phase
modulation near time zero arising from interaction between
the probe and the pump pulses in the solvent and on the
cuvette windows.
Time-resolved fluorescence spectroscopy
Time-resolved fluorescence measurements were carried out
using the streak camera setup described earlier.36,37 An integrated
Ti-sapphire oscillator (Coherent Vitesse) produced pulses of
800 nm with 100 fs duration at 80 MHz repetition rate. This
beam was directed into a regenerative amplifier (Coherent
RegA) operating rate between 48 kHz to 128 kHz and then
fed into an optical parametric amplifier (Coherent OPA)
tunable between 470 and 720 nm. The pump light was focused
on a 1 cm path length quartz cuvette placed on a magnetic
stirrer. The sample (with an absorbance of 0.1) was excited by
the 680 nm laser beam. Background illumination used a 750 nm
or 650 nm LED to revert the light-activated sample to the
ground state. Fluorescence emission from the sample was
collected at right angles to the pump beam and focused into
the slit and grating using an achromatic lens. A sheet polarizer
was used to adjust the magic angle (54.71, with respect to the
polarization angle of the pump beam) of the collected emission.
The dispersed light was converted to electrons at the photo-
cathode and time-resolved by varying the voltage applied to
sweep electrodes. A microchannel-plate (MCP) was used to
amplify the photocathode signal and projected to a phosphor
screen where it was visualized by a CCD camera.
Data analysis
The femtosecond transient absorption data were globally
analyzed using a kinetic model consisting of sequentially
interconverting, evolution-associated difference spectra
(EADS), i.e. 1 - 2 - 3 - . . . in which the arrows indicate
successive mono-exponential decays of increasing time
constant, which can be regarded as the lifetime of each
EADS.38 The first EADS corresponds to the time-zero difference
spectrum. This procedure clearly visualizes the evolution of
the (excited and intermediate) states of the system. In time-
resolved fluorescence measurements, an independent exponential
decay scheme (sum of exponentials) is applied which produces
the decay associated spectra (DAS). It is important to note
that a sequential analysis is mathematically equivalent to a
parallel (sum-of-exponentials) analysis. The analysis program
calculates both EADS and decay-associated difference spectra
(DADS), and the time constants that follow from the analysis
apply to both. Throughout the manuscript, the EADS are
shown in the main text and the corresponding DADS are
shown in ESI.w In general, the EADS may well reflect mixtures
of molecular states such as may arise, for instance, from
heterogeneous ground states or branching at any point in
the molecular evolution.13,39–44 The advantage of showing
EADS over DADS is that the former are qualitatively and
intuitively more easily interpreted in terms of which molecular
species is present at what time. We stress that the sequential
model used in this approach to data analysis should not
a priori be taken literally. The combination of different time-
resolved spectroscopy information such as the transient
absorption and time-resolved fluorescence with close inspection
of EADS, DADS and DAS is required to arrive at conclusions
regarding the parallel, branched or sequential nature of the
spectral evolution. A detailed account of the global analysis
methodology is given in ESI.w
Fluorescence quantum yield experiments
Fluorescence quantum yield measurements were performed
using a commercial fluorometer with right-angle detection
geometry (Jobin-Yvon Fluorolog). Cy5 dissolved in water
was used as a fluorescence quantum yield standard (FF =
0.27).45 The samples were contained in a cuvette with 1 cm
pathlength in the excitation direction and 0.4 cm pathlength in
the detection direction. The excitation wavelength was 645 nm.
The absorbance of Bph and reference samples were adjusted to
similar values at the excitation wavelength and the absorbance
of Bph at the maximum of the Q band was less than 0.03 per cm
pathlength. The excitation density was kept low to avoid
photoconversion of the Bph samples; its absence was
confirmed by the identity of absorbance spectra immediately
before and after the fluorescence experiments. The fluorescence
intensities were corrected for the number of absorbed photons.
The fluorescence spectra were corrected for the wavelength
sensitivity of the detection system and converted to an energy
scale, thereby correcting the change in bandpass through the
relation I(n) = l2I(l).46 The fluorescence spectra were recordedand integrated up to 850 nm. All experiments were performed
at room temperature.
Results
Fluorescence properties of bacteriophytochromes
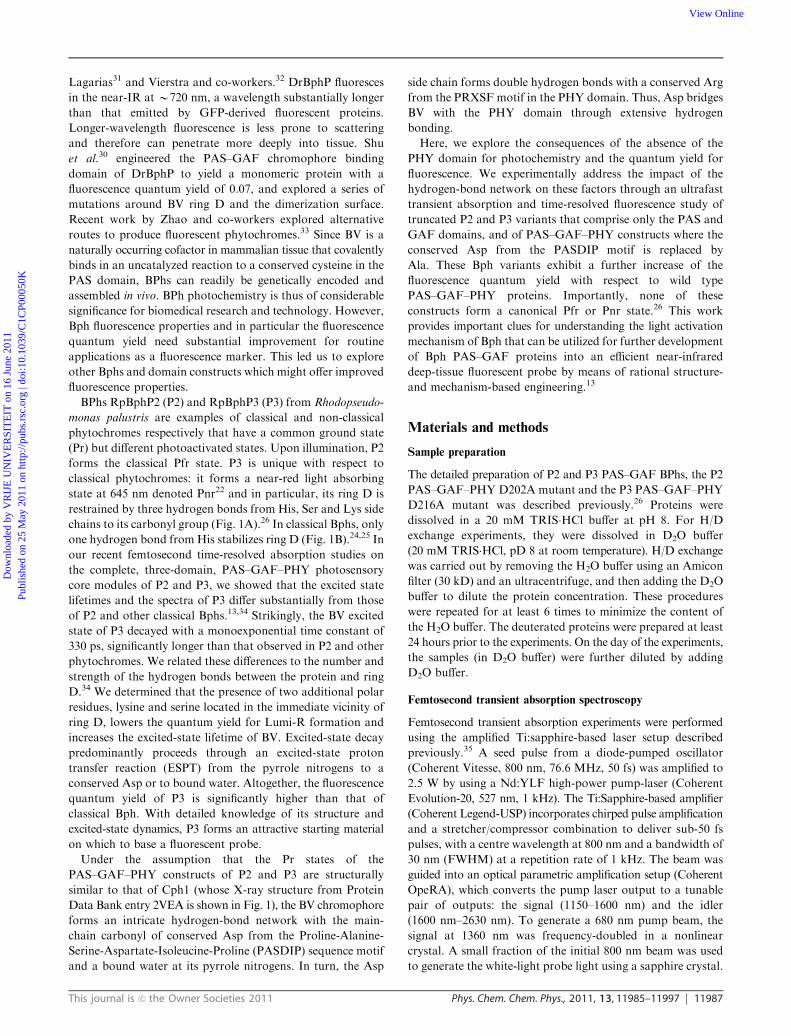
Fig. 2 shows fluorescence emission spectra of P3 PAS–GAF–
PHY (red line), the two-domain version of P3 PAS–GAF
chromophore binding domain (CBD) (blue), the P3 PAS–GAF–
PHY D216A mutant (cyan), the P3 PAS–GAF–PHY Y272F
mutant (black) and the classical BPh P2 PAS–GAF–PHY
(dark green). The spectra are scaled to the number of absorbed
Dow
nloa
ded
by V
RIJ
E U
NIV
ER
SIT
EIT
on
16 J
une
2011
Publ
ishe
d on
25
May
201
1 on
http
://pu
bs.r
sc.o
rg |
doi:1
0.10
39/C
1CP0
0050
KView Online

This journal is c the Owner Societies 2011 Phys. Chem. Chem. Phys., 2011, 13, 11985–11997 11989
photons to enable their intensities to be directly compared.
The fluorescence emission maxima of all samples are located
near 715 nm, which indicates that the fluorescence originates
from the BPh-bound BV chromophore. Their fluorescence
quantum yields were determined to be 0.043 � 0.005 (P3 PAS–
GAF–PHY), 0.055 � 0.005 (P3 PAS–GAF), 0.066 � 0.005
(P3 PAS–GAF–PHY D216A) and 0.066 � 0.005 (P3 PAS–
GAF–PHY Y272F) In contrast, the classical BPh P2
(PAS–GAF–PHY) had a roughly five-fold lower fluorescence
quantum yield of o0.01. Notably, the fluorescence quantum
yield of the P3 PAS–GAF–PHY D216A and Y272F mutants
is (within error margin) identical to that of the extensively
engineered IFP1.4 PAS–GAF monomeric construct from
Deinococcus BPh, namely 0.07.30 Zhao and co-workers
recently reported that a cyanobacteriochrome comprising an
isolated GAF domain had a fluorescence quantum yield of
0.06.33
The photochemistry of wild type P3 PAS–GAF and the D216A
and Y272F mutants of P3 PAS–GAF–PHY
The primary photochemistry of the unusual BPh P3
PAS–GAF was investigated by employing femtosecond time-
resolved absorption spectroscopy. With excitation at 680 nm,
the course of the time-resolved absorbance changes was
monitored over the wavelength range from 550 to 780 nm.
Global fitting of the data was applied using a kinetic scheme
with sequentially interconverting species, where each species is
represented by an evolution-associated difference spectrum
(EADS). The EADS displays the difference spectrum of the
photoexcited species of a particular lifetime with respect to the
Pr ground state. Negative signals correspond to ground-state
depletion (bleach) of the Pr state or to stimulated emission
from the excited state to the ground state; positive signals
denote absorption by the excited-state or product states. This
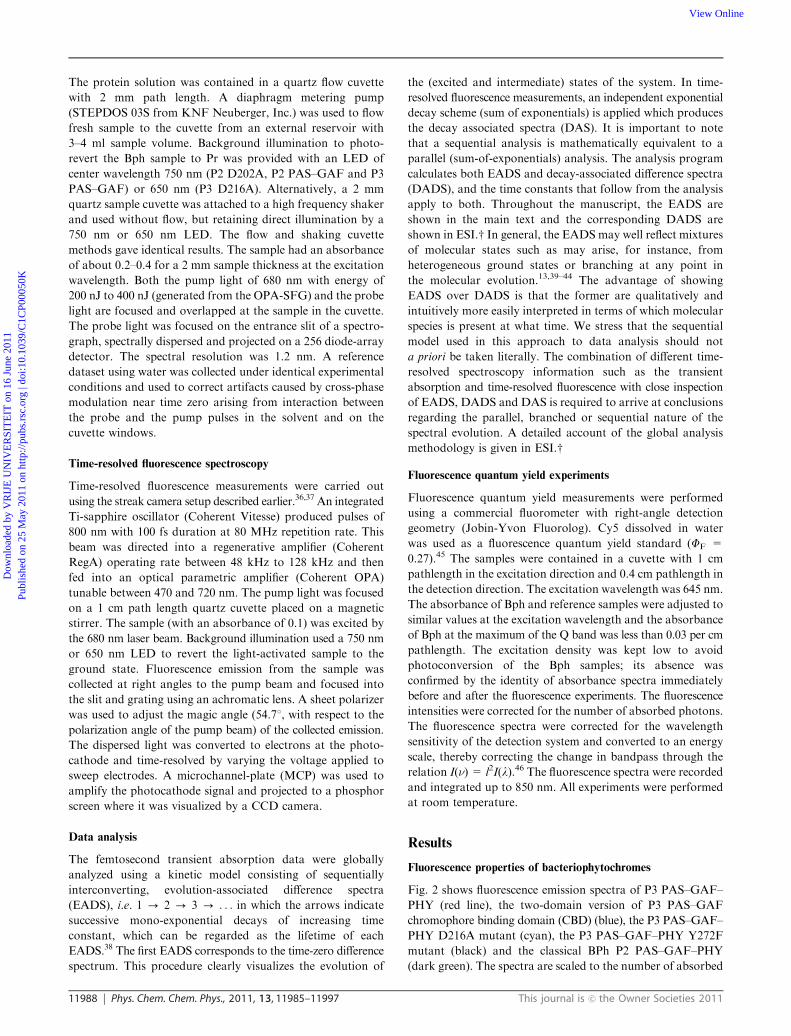
procedure quantifies the spectral evolution. Five components
were required for an adequate fit with lifetimes of 0.6, 4.9, 46,
408 ps and a non-decaying component. The resulting EADS
are depicted in Fig. 3A and the decay-associated difference
spectra (DADS) in Fig. S1A (ESIw). (The sub-ps component
may have been affected by cross-phase modulation, coherent
artifacts and saturation effects which render it difficult to
interpret, and its spectra are therefore not shown.) Fig. 3B
(black circles) shows a kinetic trace detected at 717 nm.
The 4.9 ps component is associated with an overall red-shift
of the transient absorption spectra, whose lifetime and
spectral characteristics are very similar to those of the P3
PAS–GAF–PHY construct.13 Importantly, this component
does not represent excited-state decay: rather, we assign it to
structural evolution on the excited state potential energy
surface of the protein-bound BV. This can be clearly seen
from the DADS in Fig. S1A (ESIw): the 4.9 ps DADS is largely
conservative with a negative lobe at 690 nm and a positive lobe
at 720 nm. A positive lobe can be interpreted as a decay of
absorption, rise of bleach or stimulated emission; a negative
lobe can be interpreted as a rise of absorption, decay of bleach
or of stimulated emission. Ground-state bleach or stimulated
emission should result in a relatively sharp feature near
700 nm, which is absent in the DADS. We therefore exclude
the interpretation in which the 4.9 ps component represents
BV excited-state decay. Instead, it represents a blue-shift of
excited-state absorption or a red-shift of stimulated emission
(or a combination of the two). Hence, it arises from dynamic
processes in the BV excited state such as structural distortions.13
Given the modest Huang–Rhys factor for vibronic coupling of
BV and the excitation conditions in the main Q band,
vibrational relaxation is unlikely to contribute to these
processes.47 As this paper primarily deals with excited-state
decay processes in BPh, this component and similar ones
described below for other P3 and P2 samples will not be
further discussed.
The 46 ps component represents a minor spectral evolution:
its DADS (Fig. S1A, green line, ESIw) primarily shows a
small decay of ground state bleach, which indicates that this
component represents a small fraction of nonemissive
excited-state BPh that returns to the Pr ground state. In the
P3 PAS–GAF–PHY construct an identical time constant was
observed (45 ps) but with an entirely different spectral signature
that involved a pronounced blue-shift of BV excited-state
absorption.13
The next EADS has a lifetime of 408 ps. It shows a major
ground state bleach at 708 nm, a smaller bleach band at
636 nm, and a pronounced excited-state absorption (ESA)
around 725 nm. We assign this EADS to a structurally
distorted BV in the excited state, in which the 408 ps time
constant represents the excited-state lifetime. This interpretation
is consistent with time-resolved fluorescence measurements
(Fig. S2A and B, ESIw) which indicate a single exponential
decay with a similar 382 ps time constant. These observations
indicate that the excited-state lifetime of the P3 PAS–GAF
construct is somewhat longer than that of P3 PAS–GAF–PHY
with an excited-state lifetime of 330 ps.13 The prolonged
excited-state lifetime in P3 PAS–GAF induces a higher
fluorescence quantum yield, when compared to classical phyto-
chromes whose lifetimes range between 3 and 100 ps.14–18,48
The 408 ps EADS evolves to a component that does not
decay on the timescale of the experiment (3 ns). It shows a
ground state bleach at 702 nm and an induced absorption at
around 731 nm. In phytochromes, such primary photoproducts
are conventionally assigned to the Lumi-R intermediate
state.13,16–18 However, the spectral features of this particular
Fig. 2 Fluorescence properties of BPh. Photographs of the P3 Y272F
mutant under (A) ambient light and (B) blue light at 405 nm, observed
through a red-transmitting filter. (C) Fluorescence spectra of Bph
samples indicated in the legend.
Dow
nloa
ded
by V
RIJ
E U
NIV
ER
SIT
EIT
on
16 J
une
2011
Publ
ishe
d on
25
May
201
1 on
http
://pu
bs.r
sc.o
rg |
doi:1
0.10
39/C
1CP0
0050
KView Online

11990 Phys. Chem. Chem. Phys., 2011, 13, 11985–11997 This journal is c the Owner Societies 2011
photoproduct differ significantly from the Lumi-R species
observed in the P3 PAS–GAF–PHY construct: the induced
absorption band near 720 nm is broader and has a lower
amplitude than in P3 PAS–GAF–PHY. It may have a different
molecular origin, as discussed below. The amplitude of the
primary photoproduct is very low with a remaining bleach of
about 4% of the initial signal amplitude, as was also found in
the P3 PAS–GAF–PHY protein (6%). With a fluorescence
quantum yield of 0.06, this observation indicates that the vast
majority (B0.9) of BV excited states deactivate nonradiatively
to the Pr ground state.
The results on the D216A mutant of the PAS–GAF–PHY
protein are similar overall to those on the P3 PAS–GAF
construct. Global analysis indicated five components of 0.5,
4.7, 68, 500 ps and a non-decaying component. The EADS and
DADS are shown in Fig. 3C and S1B, ESIw, respectively;
Fig. 3D shows the kinetics at 709 nm. The EADS with lifetime
of 500 ps, assigned to the BV excited state that decays in 500 ps
Fig. 3 Time-resolved spectroscopy of P3 PAS–GAF, the P3 PAS–GAF–PHY D216A mutant and the P3 PAS–GAF–PHY Y272F mutant. (A)
Evolution-associated difference spectra (EADS) of P3 PAS–GAF; (B) kinetic traces of P3 PAS–GAF in H2O (black circles) and D2O (red circles);
(C) EADS of the P3 D216A mutant; (D) kinetic traces of the P3 D216A mutant in H2O (black circles) and D2O (red circles); (E) EADS of the P3
Y272F mutant; (F) kinetic trace of the P3 Y272F mutant in H2O.
Dow
nloa
ded
by V
RIJ
E U
NIV
ER
SIT
EIT
on
16 J
une
2011
Publ
ishe
d on
25
May
201
1 on
http
://pu
bs.r
sc.o
rg |
doi:1
0.10
39/C
1CP0
0050
KView Online
This journal is c the Owner Societies 2011 Phys. Chem. Chem. Phys., 2011, 13, 11985–11997 11991
(green line), shows a significant longer time constant than that
observed in P3 PAS–GAF–PHY (330 ps) and P3 PAS–GAF
(408 ps). This observation is consistent with the steady-state
fluorescence spectra shown in Fig. 2, in which the highest
fluorescence intensity occurs for the P3 PAS–GAF–PHY
D216A mutant.
The Y272F mutant is of special interest because along with
D216A, it shows the highest fluorescence quantum yield
(Fig. 2). In addition, it shows no photoproduct under
steady-state illumination26 which is a favorable property for
fluorescence applications. Fig. 3E and S3 (ESIw) show the
EADS and DADS, respectively, and the kinetics in Fig. 3F.
The spectral evolution was similar to that of the P3 PAS–GAF
and D216A proteins, with time constants of 3, 78, 500 ps and a
nondecaying component. The 500 ps component represents
BV excited-state decay, which is consistent with its relatively
high fluorescence quantum yield. An important difference
from the other BPh constructs reported here is that the
amplitude of the primary photoproduct is significantly lower,
roughly 4 times smaller than that for wild type P3, corresponding
to a quantum yield of about 0.01. This low photoproduct
quantum yield by itself does not explain the photochemical
inactivity of Y272F under steady-state illumination, as photo-
receptor proteins with similar photochemical quantum yields
are known to fully convert to their lit state.49 Hence, its
photoproduct must be relatively short-lived.
The fluorescence quantum yields and excited-state lifetimes
for the various P3 samples allow determination of the radiative
lifetime of the BPh-bound BV chromophore. The fluorescence
quantum yield FF is related to fluorescence lifetime tF (i.e. the
excited-state lifetime) and radiative lifetime tR through
the relation tF = FFtR. With the experimentally observed
fluorescence lifetimes and quantum yields for the P3 constructs,
we obtain a radiative lifetime of about 7.5 ns for the BPh-bound
BV chromophore. This number is significantly shorter than
early reports for phytochrome-bound PFB in the literature,
which range from 14 ns to 20 ns.50,51 However, these lifetimes
were based on extinction coefficients e that are now known to
be incorrect. BPh has an extinction coefficient at its absorbance
maximum in Pr of about 90 000 M�1 cm�1.5,30 A Strickler–
Berg analysis of plant phytochrome A (PhyA) indicated a
radiative lifetime of 5 ns, under the assumption that
e = 110 000 M�1 cm�1 at the absorbance maximum,17
which reasonably agrees with our findings. (Note that
e = 121 000 M�1 cm�1 was reported by Lagarias and
co-workers for plant phytochrome.)52 In allophycocyanin
(APC), the well-known fluorescence marker which binds
PCB, a fluorescence quantum yield of 0.6853 and a fluorescence
lifetime of 4 ns54 were reported, which implies a similar
radiative lifetime of 5.9 ns.
The photochemistry of wild type P2 PAS–GAF and the D202A
mutant of P2 PAS–GAF–PHY
To assess the influence of the PHY domain on the photo-
chemistry of a classical BPh that exhibits Pr-Pfr photoconversion,
we performed femtosecond time-resolved absorption spectro-
scopy studies on the P2 PAS–GAF construct. The structure of
this construct is not yet known but is likely to be similar to the
DrBphP protein, for which the high resolution X-ray
structure24,25 formed the basis for engineering by Shu et al.30
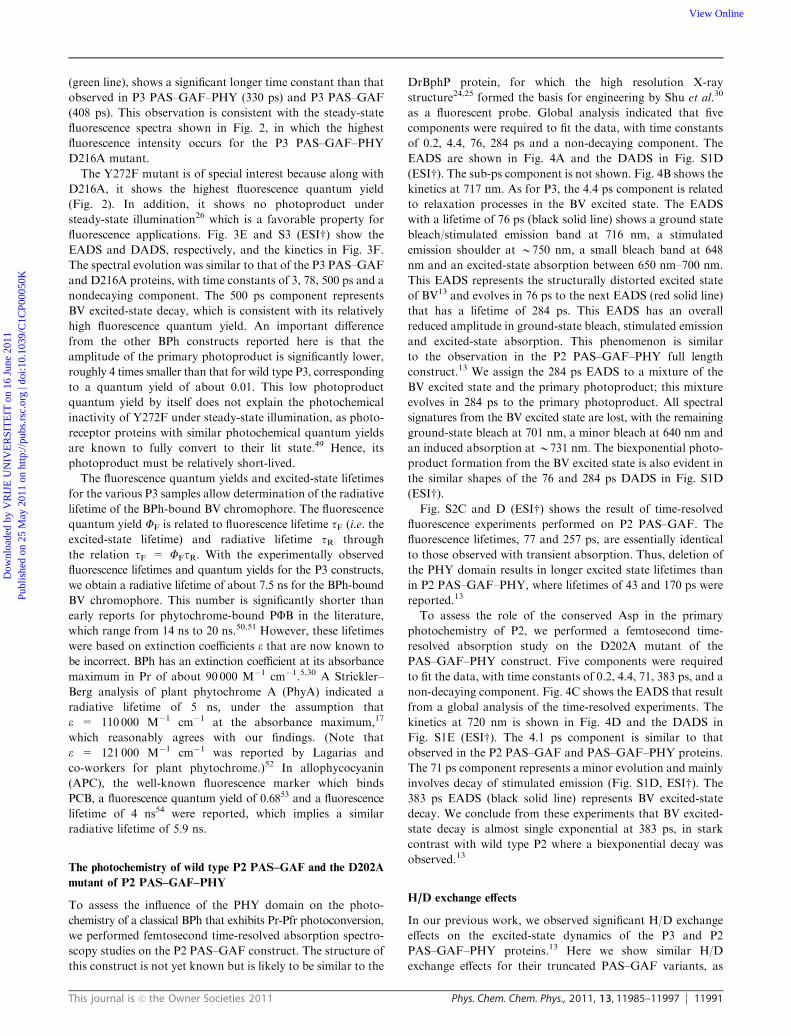
as a fluorescent probe. Global analysis indicated that five
components were required to fit the data, with time constants
of 0.2, 4.4, 76, 284 ps and a non-decaying component. The
EADS are shown in Fig. 4A and the DADS in Fig. S1D
(ESIw). The sub-ps component is not shown. Fig. 4B shows the
kinetics at 717 nm. As for P3, the 4.4 ps component is related
to relaxation processes in the BV excited state. The EADS
with a lifetime of 76 ps (black solid line) shows a ground state
bleach/stimulated emission band at 716 nm, a stimulated
emission shoulder at B750 nm, a small bleach band at 648
nm and an excited-state absorption between 650 nm–700 nm.
This EADS represents the structurally distorted excited state
of BV13 and evolves in 76 ps to the next EADS (red solid line)
that has a lifetime of 284 ps. This EADS has an overall
reduced amplitude in ground-state bleach, stimulated emission
and excited-state absorption. This phenomenon is similar
to the observation in the P2 PAS–GAF–PHY full length
construct.13 We assign the 284 ps EADS to a mixture of the
BV excited state and the primary photoproduct; this mixture
evolves in 284 ps to the primary photoproduct. All spectral
signatures from the BV excited state are lost, with the remaining
ground-state bleach at 701 nm, a minor bleach at 640 nm and
an induced absorption at B731 nm. The biexponential photo-
product formation from the BV excited state is also evident in
the similar shapes of the 76 and 284 ps DADS in Fig. S1D
(ESIw).Fig. S2C and D (ESIw) shows the result of time-resolved
fluorescence experiments performed on P2 PAS–GAF. The
fluorescence lifetimes, 77 and 257 ps, are essentially identical
to those observed with transient absorption. Thus, deletion of
the PHY domain results in longer excited state lifetimes than
in P2 PAS–GAF–PHY, where lifetimes of 43 and 170 ps were
reported.13
To assess the role of the conserved Asp in the primary
photochemistry of P2, we performed a femtosecond time-
resolved absorption study on the D202A mutant of the
PAS–GAF–PHY construct. Five components were required
to fit the data, with time constants of 0.2, 4.4, 71, 383 ps, and a
non-decaying component. Fig. 4C shows the EADS that result
from a global analysis of the time-resolved experiments. The
kinetics at 720 nm is shown in Fig. 4D and the DADS in
Fig. S1E (ESIw). The 4.1 ps component is similar to that
observed in the P2 PAS–GAF and PAS–GAF–PHY proteins.
The 71 ps component represents a minor evolution and mainly
involves decay of stimulated emission (Fig. S1D, ESIw). The383 ps EADS (black solid line) represents BV excited-state
decay. We conclude from these experiments that BV excited-
state decay is almost single exponential at 383 ps, in stark
contrast with wild type P2 where a biexponential decay was
observed.13
H/D exchange effects
In our previous work, we observed significant H/D exchange
effects on the excited-state dynamics of the P3 and P2
PAS–GAF–PHY proteins.13 Here we show similar H/D
exchange effects for their truncated PAS–GAF variants, as
Dow
nloa
ded
by V
RIJ
E U
NIV
ER
SIT
EIT
on
16 J
une
2011
Publ
ishe
d on
25
May
201
1 on
http
://pu
bs.r
sc.o
rg |
doi:1
0.10
39/C
1CP0
0050
KView Online

11992 Phys. Chem. Chem. Phys., 2011, 13, 11985–11997 This journal is c the Owner Societies 2011
observed in P3 PAS–GAF (Fig. 3B and Fig. S2B, ESIw, KIE 1.6)
and P2 PAS–GAF (Fig. 4B and Fig. S2D ESIw, KIE E1.5 on
the slow component). Likewise, the Asp to Ala mutants of P3
and P2 PAS–GAF–PHY show similar H/D exchange effects:
the P3 PAS–GAF–PHY D216A mutant exhibits a KIE of
1.7 on its 500 ps excited-state lifetime, while the P2
PAS–GAF–PHY D202A mutant shows a KIE of 1.4 for its
383 ps excited-state lifetime. We conclude that in these BPh
variants, excited-state deactivation to Pr is rate-limited by a
proton transfer process similar to that observed in their wild
type PAS–GAF–PHY constructs.
Discussion
ESPT affects the BV excited-state lifetime in
bacteriophytochrome
Here and in our previous work we observed a significant
kinetic isotope effect on the BV excited-state lifetime of BPh.
We argued that the moderate KIE of B1.4 corresponds to a
proton transfer reaction in the fully adiabatic limit, reflecting
strong hydrogen-bond interactions between donor and acceptor
groups and shallow barriers where the dominating effect of the
KIE is reflected in isotope-dependent splitting in the crossing
region of the potential surfaces in question.13,55 Inspection of
the BPh X-ray structure26 indicated that an ESPT reaction at
the pyrrole nitrogens constitutes the most likely explanation
for the experimental observations. Note that all four pyrrole
nitrogens are protonated in both the Pr and the Pfr
states.11,19,56,57 Fig. 5 schematically shows the proposed ESPT
process. For clarity, Lumi-R formation was omitted from this
figure. Note that ESPT may take place from either ring A, B or
C.13 Quantum chemical calculations on the PCB model
chromophore indicate that rings B and C are the most acidic
in the excited state,58 which identifies these rings as the most
likely proton donors.
Early work by Falk and co-workers suggested that in bilin
pigments in solution, proton transfer at the pyrrole rings
competes with Z/E isomerization,59 which supports our reaction
model. Quantum chemical studies of the PCB chromophore in
solution indicated that ESPT processes significantly contributed
to the excited-state dynamics.60 Further support is provided by
recent work on Agp1 variants with locked chromophores, which
showed that processes additional to ring Dmotion can deactivate
the BV excited state.61 In addition, recent computational studies
suggest that reduced accessibility to conformations geared to
excited state proton transfer may be responsible for the increased
fluorescence of engineered BPh.62
In general, moderate KIEs such as observed here may also
correspond to solvent motions affected by the H/D exchange
Fig. 4 Time-resolved spectroscopy of P2 PAS–GAF and the P2 PAS–GAF–PHY D202A mutant (A) evolution-associated difference spectra
(EADS) of P2 PAS–GAF; (B) kinetic traces of P2 PAS–GAF in H2O (black circles) and D2O (red circles); (C) EADS of the P2 D202A mutant
(D) kinetic traces of the P2 D202A mutant in H2O (black circles) and D2O (red circles);
Dow
nloa
ded
by V
RIJ
E U
NIV
ER
SIT
EIT
on
16 J
une
2011
Publ
ishe
d on
25
May
201
1 on
http
://pu
bs.r
sc.o
rg |
doi:1
0.10
39/C
1CP0
0050
KView Online

This journal is c the Owner Societies 2011 Phys. Chem. Chem. Phys., 2011, 13, 11985–11997 11993
that are somehow coupled to the reaction in question, rather
than to an actual proton transfer event. However, in BPh the
KIE acts on an excited-state deactivation process, which must
be coupled to changes in the BV p-electron system. The latter
is insensitive to the aqueous solvent. Likewise, a hydrogen-
bond rearrangement between BV and apoprotein is unlikely to
occur because such a process will not deactivate the excited
state, unless the BV chromophore deprotonates at some point
in the process. Hence, ESPT is the only process that properly
explains our experimental observations.13
It is interesting to compare the fluorescence properties of
phytochromes with those of phycobilisomes, the main light
harvesting antenna proteins of cyanobacteria. APC is the best
characterized phycobilisome antenna and used as a fluorescence
marker.53 APC trimers bind six PCB chromophores and have
a fluorescence quantum yield of 0.68,53 significantly larger
than that of BPh despite binding a very similar chromophore.
In APC, the bilin chromophores are tightly bound.63 Recent
NMR studies have demonstrated that in APC, the PCB
chromophore has low mobility, whereas in Cph1 and Agp1,
the PCB and BV chromophores show a significantly higher
mobility.64 Chromophore mobility generally is considered to
provide an important channel for excited-state deactivation in
bilin and other extended chromophores: through rotations of
single and/or double bonds, excited states may deactivate to
the ground state potential energy surface through conical
intersections or avoided crossing regions near 901 twist
angles.65–68 In the GFP protein family, chromophore mobility
determines whether the protein is bright or dark.69–71 In the
case of BPh, BV twisting may contribute to excited-state decay
by inducing ESPT.13 In addition, BV twisting may directly
deactivate the excited state at rates that are comparable to that
of ESPT: if the two processes are in competition, H/D
exchange may still become apparent in the kinetics because
the latter process slows down. Thus, minimizing ESPT
processes and constraining the BV chromophore mobility
may offer two routes to increasing the BPh fluorescence
quantum yield.
Conserved Asp and the PHY domain interaction affect excited-
state lifetime and fluorescence quantum yield
Our results show that P3 from Rps. palustris has a significantly
higher fluorescence quantum yield than classical (bacterio)-
phytochromes. In particular the P3 PAS–GAF–PHY D216A
mutant shows a level of fluorescence (0.066) that rivals that
observed in the engineered IFP4.1 BPh.30 This observation is
quite remarkable given that in P3, just a single amino acid
exchange is required to confer these favorable fluorescence
properties.
We relate the observed fluorescence quantum yields and
excited-state lifetimes in the P3 and P2 variants to the
structures available for phytochromes. In the structures, the
main-chain carbonyl of this Asp 216 is an integral part of an
extensive hydrogen-bonding network with the BV pyrrole
nitrogens, a conserved His and a bound water.24–26,28 In the
cyanobacterial Cph1 Pr state crystal structure, the carboxylate
side chain of the corresponding conserved Asp-207 doubly
hydrogen bonds with Arg-472 from the PRXSF motif of the
PHY domain (Fig. 1C).28 Thus, the conserved Asp connects
BV, the GAF domain and the PHY domain. Both the PHY
domain and the conserved Asp are required to generate a
canonical Pfr or Pnr state26,27 and for the BV protonation
cycle from Meta-R to Pfr.20,32
Since there is no structure available for any
PAS–GAF–PHY construct of BPh in the Pr state, we base
discussion of the interactions between BV and the GAF and
PHY domains on the X-ray structure of Cph128 (Fig. 1C) in its
Fig. 5 Reaction scheme that accounts for BV excited-state deactivation in P3 through excited-state proton transfer, adapted from ref. 13. Panel
(A) shows two hydrogen-bonds between Asp-216 in the GAF domain and Arg-481 in the PHY domain, as modeled on the basis of the Cph1
structure.28 Note that this figure only considers the deactivation process to the Pr ground state; for a description of the full photochemistry see
ref. 13.
Dow
nloa
ded
by V
RIJ
E U
NIV
ER
SIT
EIT
on
16 J
une
2011
Publ
ishe
d on
25
May
201
1 on
http
://pu
bs.r
sc.o
rg |
doi:1
0.10
39/C
1CP0
0050
KView Online
11994 Phys. Chem. Chem. Phys., 2011, 13, 11985–11997 This journal is c the Owner Societies 2011
Pr state. It should be noted that Cph1 covalently binds a PCB
chromophore to its GAF domain rather than a BV chromo-
phore to the PAS domain. Nevertheless, the structures of
Cph1 and BPh are sufficiently similar in their PAS and GAF
domains24–26,28 to warrant such a comparison at this stage.
In the PaBphP PAS–GAF–PHY crystal structure, the inter-
actions between BV and the PAS–GAF–PHY domains
are quite different, but this is very likely due to this structure
being in the Pfr state rather than to a fundamental structural
difference between BPh and Cph1.10,28 Comparison with
the recently determined cyanobacterial SyB–Cph1 NMR
structure is less relevant because SyB–Cph1 lacks any PAS
domain (the protein is comprised naturally of GAF–PHY
domains) and the structure was that of the isolated GAF
domain.23
An important observation is that deletion of the PHY
domain or replacement of the conserved Asp by Ala in P3
or P2 PAS–GAF–PHY proteins results in a significant
increase of the BV excited-state lifetime with respect to their
wild type PAS–GAF–PHY constructs. In addition, we
observe pronounced H/D exchange effects in all BPh
constructs studied. Thus, similar proton transfer events govern
excited state dynamics in all these proteins. Because the
excited-state lifetime of P3 PAS–GAF and D216A is subject
to a KIE of 1.6 and 1.7 respectively, the excited-state lifetime
increase of these BPh variants with respect to P3
PAS–GAF–PHY must be a consequence of an ESPT rate
decrease upon replacement of Asp with Ala, or upon deletion
of the PHY domain.
According to the PAS–GAF–PHY structure of Cph1 in the
Pr state, the carboxyl side chain of the conserved Asp forms a
double hydrogen bond to a conserved Arg in the PRXSF
motif in the PHY domain (Fig. 1C, ref. 28). We assume here
that P3 and P2 PAS–GAF–PHY proteins in their Pr states
assume a structure in this region similar to that of Cph1 in Pr,
as illustrated in Fig. 5A. There, Asp-216 forms a double
hydrogen bond with Arg-481 in the P3 PAS–GAF–PHY
protein. Obviously, this strong hydrogen bond interaction is
absent in the P3 PAS–GAF–PHY D216A and P2
PAS–GAF–PHY D202A mutants. As a consequence, the
backbone of the newly inserted Ala may assume a slightly
different conformation, which will affect the hydrogen-bond
network at the BV pyrrole nitrogens shown in Fig. 1A and B,
i.e. between BV, the main-chain carbonyl of newly inserted
Ala and (possibly) bound water. Similarly, deletion of the
PHY domain will eliminate the same hydrogen bonds between
the Arg of the PHY domain and the conserved Asp, with the
same effect. We propose that the local perturbation of the
hydrogen-bond network around the pyrrole nitrogens slows
down ESPT. The perturbation may be very small and difficult
to observe by X-ray or NMR techniques: an increase in
hydrogen-bond length between the BV pyrrole nitrogens and
the Asp backbone carbonyl of as little as a few tenths of an
Angstrom may be sufficient to produce such an effect.72 A
more definitive molecular picture will have to await detailed
structural information on P3 PAS–GAF–PHY, now in
progress.
The increase of the BV excited-state lifetime through
mutation of the conserved Asp or deletion of the PHY
domain obviously affects the fluorescence quantum yield
(Fig. 2). Studies are in progress in which both alterations
are made: mutate the conserved Asp and delete the PHY
domain.
Both Asp and the PHY domain affect high-fluorescent and
low-fluorescent Pr conformers in classical BPh
In the P2 PAS–GAF–PHY protein, the BV excited-state
dynamics is characterized by two decay components, one ‘fast’
decay of 43 ps and one ‘slow’ decay of 170 ps.13 Both decay
components contribute to Lumi-R formation. The fast decay
component is dominant with an amplitude 1.5 times greater
than that of the slow component. In contrast, P3
PAS–GAF–PHY shows only one long-lived decay component
of 330 ps. The occurrence of two distinct decay phases in P2
was assigned to heterogeneity in the Pr ground state, which
may result in a distinct excited-state decay rate for each
conformer.13 Such conformational heterogeneity in Pr was
reported in DrBphP and Agp1 by resonance Raman spectro-
scopy,32,73 for plant Phy and Cph1 by solid-state NMR,74 and
in the Pfr ground state of Ps. aeruginosa BPh by crystallo-
graphy.10 Note that ground-state heterogeneity is frequently
observed in biological photoreceptors42,75–77 and for the PCB
chromophore in solution.78,79 For application of BPh as a
fluorescent probe, it is important to engineer BPh in such a
way that it only shows ‘slow’ excited-state decay components,
as such components are associated with a high fluorescence
quantum yield.
The P2 PAS–GAF protein also shows excited-state decay
with two components, whose lifetimes of 76 and 280 ps
are increased in comparison with the PAS–GAF–PHY
protein. Importantly, the amplitude of the ‘slow’ 280 ps
component has now become dominant, being 1.5 times greater
than that of the fast component (see the DADS in Fig. S1D,
ESIw). In the P2 D202A mutant, excited-state decay
takes place almost entirely with a single ‘slow’ time constant
of 383 ps (Fig. 4C and S1E, ESIw). Thus, deletion of the PHY
domain or replacement of the conserved Asp affects the
equilibrium that exists in the Pr ground state between ‘fast’
and ‘slow’ reacting Pr conformers. The observation that this
equilibrium can be changed and even almost entirely shifted
towards the ‘slow’ conformer by such a minor local structural
perturbation strongly suggests that the difference between
the conformers finds its origin in the exact configuration
of the hydrogen-bond network that connects BV, the
conserved Asp and bound water (Fig. 1). The ‘fast’ and ‘slow’
reacting Pr conformers may differ in the hydrogen bonding
patterns near this site that are apparent in the X-ray structures.
In DrBph and Cph1, the BV pyrrole rings hydrogen bond to an
internal bound water and to the main-chain carbonyl of the
conserved Asp,24,28 while in P3 the pyrrole rings hydrogen bond
only to the main-chain carbonyl of Asp-21626 (Fig. 1). We
propose that the ‘fast’ reacting conformer corresponds to BV
pyrrole hydrogen bonding within a more extensive hydrogen-
bond network, while the ‘slow’ reacting conformer corresponds
to BV pyrrole hydrogen bonding only to the Asp backbone
carbonyl. This proposal is consistent with the observation of a
single slow BV decay component in P3 (Fig. 3 and ref. 13).
Dow
nloa
ded
by V
RIJ
E U
NIV
ER
SIT
EIT
on
16 J
une
2011
Publ
ishe
d on
25
May
201
1 on
http
://pu
bs.r
sc.o
rg |
doi:1
0.10
39/C
1CP0
0050
KView Online

This journal is c the Owner Societies 2011 Phys. Chem. Chem. Phys., 2011, 13, 11985–11997 11995
The primary photoproducts of P3 PAS–GAF, P3
PAS–GAF–PHY D216A and P2 PAS–GAF–PHY D202A:
deprotonated BV states?
In the P2 and P3 PAS–GAF–PHY constructs, Lumi-R is
formed with quantum yields of 0.13 and 0.06, respectively.13
The Lumi-R-minus-Pr difference spectra show a ground state
bleach and a red-shifted induced absorption. The latter has an
amplitude that is similar to or exceeds that of the bleach, and
has a bandwidth comparable to the bleach. Thus, Lumi-R is
red-shifted with respect to Pr and has a dipole strength similar
to Pr. These features define the spectral properties of canonical
Lumi-R. Fig. 6 shows the shapes and relative amplitudes of
the BV excited state and the primary photoproduct of P3
PAS–GAF–PHY wild type, P3 PAS–GAF, the P3
PAS–GAF–PHY D216A mutant, P2 PAS–GAF–PHY wild
type, P2 PAS–GAF and the P2 PAS–GAF–PHY D202A
mutant.
It is difficult to accurately estimate the quantum yield of
primary photoproduct formation, as spectrally overlapping
contributions by ground-state bleach and photoproduct
absorption strongly affect signal amplitude, as does a reduced
oscillator strength of the product. Such overlap is least likely
to occur for the vibronic bands near 640 nm. By comparing
bleach amplitudes of the EADS of BV singlet excited states
and photoproducts at this wavelength, one can estimate the
yield of the latter.13 Following this procedure, we arrive
at quantum yields of 0.04 (P3 PAS–GAF), 0.03 (P3 D216A),
0.01 (P3 Y272F), 0.10 (P2 PAS–GAF) and 0.09 (P2 D202A)
(not shown).
Interestingly, the primary photoproducts of P3 PAS–GAF,
P3 PAS–GAF–PHY D216A and P2 PAS–GAF–PHY D202A
exhibit difference spectra that deviate substantially from the
canonical Lumi-R lineshape observed in the P2 and P3
PAS–GAF–PHY constructs. Hence, their molecular nature
must be quite different in these proteins. In particular, the
induced absorption of the primary photoproducts has a lower
amplitude and is broader overall than in canonical Lumi-R. In
addition, the absorption maximum is shifted to the red, to 745
and 755 nm for the P2 D202A and the P3 D216A mutants,
respectively. A lower amplitude implies that the dipole
strength of the primary photoproduct is significantly reduced
with respect to that of canonical Lumi-R. This may be caused
by deprotonation of the BV chromophore, such as observed in
‘bleached’ Meta-R intermediates.19,21,80 In addition, Meta-R
intermediate states have a red-shifted induced absorption
relative to Lumi-R states,19,22,81 possibly arising from a more
planar conformation of ring D.11 Thus, the primary photo-
product in P3 PAS–GAF and the P3 D216A and P2 D202A
mutants might resemble the Meta-R intermediate with regard
to protonation state and ring D conformation. However,
structural relaxation of the protein will not have taken place
so the system as a whole is probably still strained. The Meta-R
intermediate is normally formed on a much longer timescale
(B100 ms) in wild type BPh PAS–GAF–PHY constructs.
This observation suggests that the pKa of BV in its 15Ea
Fig. 6 Comparison of spectral shape and amplitudes of the relaxed BV excited states (black lines) and the primary photoproducts (red lines) for
P2 and P3 PAS–GAF, the P3 PAS–GAF–PHY D216A mutant, the P2 PAS–GAF–PHY D202A mutant and P3 and P2 PAS–GAF–PHY.
The dashed lines indicate the Pr ground-state absorption profiles.
Dow
nloa
ded
by V
RIJ
E U
NIV
ER
SIT
EIT
on
16 J
une
2011
Publ
ishe
d on
25
May
201
1 on
http
://pu
bs.r
sc.o
rg |
doi:1
0.10
39/C
1CP0
0050
KView Online
11996 Phys. Chem. Chem. Phys., 2011, 13, 11985–11997 This journal is c the Owner Societies 2011
configuration is significantly affected by the amino acid
identity at position 216 (P3 numbering), as shown earlier for
Agrobacterium Agp1 phytochrome.20
Abbreviations
BPh bacteriophytochrome
BV biliverdin
PCB phycocyanobilin
PFB phycochromobilin
KIE kinetic isotope effect
EADS evolution-associated difference spectrum
DADS decay-associated difference spectrum
DAS decay-associated spectrum
ESPT excited-state proton transfer
APC allophycocyanine
Acknowledgements
K.C.T. and J.T.M.K. were supported by the Earth and Life
Sciences Council of the Netherlands Foundation for Scientific
Research (NWO-ALW) through a VIDI grant to J.T.M.K.
E.A.S and K.M. were supported by NIH grant GM036452
to K.M.
References
1 H. A. Borthwick, S. B. Hendricks, M. W. Parker, E. H. Toole andV. K. Toole, Proc. Natl. Acad. Sci. U. S. A., 1952, 38, 662–666.
2 W. L. Butler, K. H. Norris, H. W. Siegelman and S. B. Hendricks,Proc. Natl. Acad. Sci. U. S. A., 1959, 45, 1703–1708.
3 S. J. Davis, A. V. Vener and R. D. Vierstra, Science, 1999, 286,2517–2520.
4 J. Hughes, T. Lamparter, F. Mittmann, E. Hartmann, W. Gartner,A. Wilde and T. Borner, Nature, 1997, 386, 663.
5 T. Lamparter, N. Michael, F. Mittmann and B. Esteban, Proc.Natl. Acad. Sci. U. S. A., 2002, 99, 11628–11633.
6 A. Blumenstein, K. Vienken, R. Tasler, J. Purschwitz, D. Veith,N. Frankenberg-Dinkel and R. Fischer, Curr. Biol., 2005, 15,1833–1838.
7 N. C. Rockwell, Y. S. Su and J. C. Lagarias, Annu. Rev. PlantBiol., 2006, 57, 837–858.
8 M. E. Auldridge and K. T. Forest, Crit. Rev. Biochem. Mol. Biol.,2011, 46, 67–88.
9 H. Li, J. R. Zhang, R. D. Vierstra and H. L. Li, Proc. Natl. Acad.Sci. U. S. A., 2010, 107, 10872–10877.
10 X. Yang, J. Kuk and K. Moffat, Proc. Natl. Acad. Sci. U. S. A.,2008, 105, 14715–14720.
11 T. Rohmer, C. Lang, J. Hughes, L. O. Essen, W. Gartner andJ. Matysik, Proc. Natl. Acad. Sci. U. S. A., 2008, 105,15229–15234.
12 M. A. Mroginski, D. H. Murgida and P. Hildebrandt, Acc. Chem.Res., 2007, 40, 258–266.
13 K. C. Toh, E. A. Stojkovic, I. H. M. van Stokkum, K. Moffat andJ. T. M. Kennis, Proc. Natl. Acad. Sci. U. S. A., 2010, 107,9170–9175.
14 J. J. van Thor, K. L. Ronayne and M. Towrie, J. Am. Chem. Soc.,2007, 129, 126–132.
15 C. Schumann, R. Gross, N. Michael, T. Lamparter and R. Diller,ChemPhysChem, 2007, 8, 1657–1663.
16 K. Heyne, J. Herbst, D. Stehlik, B. Esteban, T. Lamparter,J. Hughes and R. Diller, Biophys. J., 2002, 82, 1004–1016.
17 F. Andel, K. C. Hasson, F. Gai, P. A. Anfinrud and R. A. Mathies,Biospectroscopy, 1997, 3, 421–433.
18 M. G. Muller, I. Lindner, I. Martin, W. Gartner andA. R. Holzwarth, Biophys. J., 2008, 94, 4370–4382.
19 B. Borucki, D. von Stetten, S. Seibeck, T. Lamparter, N. Michael,M. A. Mroginski, H. Otto, D. H. Murgida, M. P. Heyn andP. Hildebrandt, J. Biol. Chem., 2005, 280, 34358–34364.
20 D. von Stetten, S. Seibeck, N. Michael, P. Scheerer,M. A. Mroginski, D. H. Murgida, N. Krauss, M. P. Heyn,P. Hildebrandt, B. Borucki and T. Lamparter, J. Biol. Chem.,2007, 282, 2116–2123.
21 P. Piwowarski, E. Ritter, K. P. Hofmann, P. Hildebrandt, D. vonStetten, P. Scheerer, N. Michael, T. Lamparter and F. Bartl,ChemPhysChem, 2010, 11, 1207–1214.
22 E. Giraud, S. Zappa, L. Vuillet, J. M. Adriano, L. Hannibal,J. Fardoux, C. Berthomieu, P. Bouyer, D. Pignol andA. Vermeglio, J. Biol. Chem., 2005, 280, 32389–32397.
23 A. T. Ulijasz, G. Cornilescu, C. C. Cornilescu, J. R. Zhang,M. Rivera, J. L. Markley and R. D. Vierstra, Nature, 2010, 463,250–U143.
24 J. R. Wagner, J. S. Brunzelle, K. T. Forest and R. D. Vierstra,Nature, 2005, 438, 325–331.
25 J. R. Wagner, J. Zhang, J. S. Brunzelle, R. D. Vierstra andK. T. Forest, J. Biol. Chem., 2007, 282, 12298–12309.
26 X. Yang, E. A. Stojkovic, J. Kuk and K. Moffat, Proc. Natl. Acad.Sci. U. S. A., 2007, 104, 12571–12576.
27 J. R. Wagner, J. Zhang, D. von Stetten, M. Gunther,D. H. Murgida, M. A. Mroginski, J. M. Walker, K. T. Forest,P. Hildebrandt and R. D. Vierstra, J. Biol. Chem., 2008, 283,12212–12226.
28 L. O. Essen, J. Mailliet and J. Hughes, Proc. Natl. Acad. Sci.U. S. A., 2008, 105, 14709–14714.
29 Y. Oka, T. Matsushita, N. Mochizuki, T. Suzuki, S. Tokutomi andA. Nagatani, Plant Cell, 2004, 16, 2104–2116.
30 X. Shu, A. Royant, M. Z. Lin, T. A. Aguilera, V. Lev-Ram,P. A. Steinbach and R. Y. Tsien, Science, 2009, 324,804–807.
31 A. J. Fischer and J. C. Lagarias, Proc. Natl. Acad. Sci. U. S. A.,2004, 101, 17334–17339.
32 J. R. Wagner, J. R. Zhang, D. von Stetten, M. Guenther,D. H. Murgida, M. A. Mroginski, J. M. Walker, K. T. Forest,P. Hildebrandt and R. D. Vierstra, J. Biol. Chem., 2008, 283,12212–12226.
33 J. A. Zhang, X. J. Wu, Z. B. Wang, Y. Chen, X. Wang, M. Zhou,H. Scheer and K. H. Zhao, Angew. Chem., Int. Ed., 2010, 49,5456–5458.
34 K. C. Toh, E. A. Stojkovic, A. B. Rupenyan, I. H. M. vanStokkum, M. Salumbides, M. L. Groot, K. Moffat and J. T. M.Kennis, J. Phys. Chem. A, 2011, 115, 3778–3786.
35 R. Berera, R. van Grondelle and J. T. M. Kennis, Photosynth. Res.,2009, 101, 105–118.
36 B. Gobets, I. H. M. van Stokkum, M. Rogner, J. Kruip,E. Schlodder, N. V. Karapetyan, J. P. Dekker and R. vanGrondelle, Biophys. J., 2001, 81, 407–424.
37 B. Gobets, J. T. M. Kennis, J. A. Ihalainen, M. Brazzoli, R. Croce,L. H. M. van Stokkum, R. Bassi, J. P. Dekker, H. van Amerongen,G. R. Fleming and R. van Grondelle, J. Phys. Chem. B, 2001, 105,10132–10139.
38 I. H. M. van Stokkum, D. S. Larsen and R. van Grondelle,Biochim. Biophys. Acta, Bioenerg., 2004, 1657, 82–104.
39 J. T. M. Kennis and M. L. Groot, Curr. Opin. Struct. Biol., 2007,17, 623–630.
40 E. Papagiannakis, J. T. M. Kennis, I. H. M. van Stokkum,R. J. Cogdell and R. van Grondelle, Proc. Natl. Acad. Sci.U. S. A., 2002, 99, 6017–6022.
41 C. Bonetti, M. T. A. Alexandre, I. H. M. van Stokkum,R. G. Hiller, M. L. Groot, R. van Grondelle and J. T. M. Kennis,Phys. Chem. Chem. Phys., 2010, 12, 9256–9266.
42 R. Berera, I. H. M. van Stokkum, G. Kodis, A. E. Keirstead,S. Pillai, C. Herrero, R. E. Palacios, M. Vengris, R. van Grondelle,D. Gust, T. A. Moore, A. L. Moore and J. T. M. Kennis, J. Phys.Chem. B, 2007, 111, 6868–6877.
43 C. C. Gradinaru, J. T. M. Kennis, E. Papagiannakis, I. H. M. vanStokkum, R. J. Cogdell, G. R. Fleming, R. A. Niederman andR. van Grondelle, Proc. Natl. Acad. Sci. U. S. A., 2001, 98,2364–2369.
44 C. Bonetti, T. Mathes, I. H. M. van Stokkum, K. M. Mullen,M. L. Groot, R. van Grondelle, P. Hegemann and J. T. M. Kennis,Biophys. J., 2008, 95, 4790–4802.
Dow
nloa
ded
by V
RIJ
E U
NIV
ER
SIT
EIT
on
16 J
une
2011
Publ
ishe
d on
25
May
201
1 on
http
://pu
bs.r
sc.o
rg |
doi:1
0.10
39/C
1CP0
0050
KView Online
This journal is c the Owner Societies 2011 Phys. Chem. Chem. Phys., 2011, 13, 11985–11997 11997
45 R. B. Mujumdar, L. A. Ernst, S. R. Mujumdar, C. J. Lewis andA. S. Waggoner, Bioconjugate Chem., 1993, 4, 105–111.
46 J. R. Lakowicz, The principles of fluorescence spectroscopy, Springer.47 W. S. Struve, Biophys. J., 1995, 69, 2739–2744.48 J. Dasgupta, R. R. Frontiera, K. C. Taylor, J. C. Lagarias and
R. A. Mathies, Proc. Natl. Acad. Sci. U. S. A., 2009, 106,1784–1789.
49 A. Wilson, C. Punginelli, A. Gall, C. Bonetti, M. Alexandre,J. M. Routaboul, C. A. Kerfeld, R. van Grondelle, B. Robert,J. T. M. Kennis and D. Kirilovsky, Proc. Natl. Acad. Sci. U. S. A.,2008, 105, 12075–12080.
50 J. Wendler, A. R. Holzwarth, S. E. Braslavsky and K. Schaffner,Biochim. Biophys. Acta, 1984, 786, 213–221.
51 P. S. Song, Q. Chae and J. D. Gardner, Biochim. Biophys. Acta,1979, 576, 479–495.
52 J. C. Litts, J. M. Kelly and J. C. Lagarias, J. Biol. Chem., 1983,258, 1025–1031.
53 A. N. Glazer, J. Appl. Phycol., 1994, 6, 105–112.54 G. F. W. Searle, J. Barber, G. Porter and C. J. Tredwell, Biochim.
Biophys. Acta, 1978, 501, 246–256.55 A. M. Kuznetsov and J. Ulstrup, Can. J. Chem., 1999, 77,
1085–1096.56 H. M. Strauss, J. Hughes and P. Schmieder, Biochemistry, 2005,
44, 8244–8250.57 C. Kneip, P. Hildebrandt, W. Schlamann, S. E. Braslavsky,
F. Mark and K. Schaffner, Biochemistry, 1999, 38, 15185–15192.58 O. A. Borg and B. Durbeej, J. Phys. Chem. B, 2007, 111,
11554–11565.59 H. Falk, K. Grubmayr and F. Neufingerl, Monatsh. Chem., 1977,
108, 1185–1188.60 A. H. Goller, D. Strehlow and G. Hermann, ChemPhysChem,
2005, 6, 1259–1268.61 B. Zienicke, L. Y. Chen, H. Khawn, M. A. S. Hammam,
H. Kinoshita, J. Reichert, A. S. Ulrich, K. Inomata andT. Lamparter, J. Biol. Chem., 2011, 286, 1103–1113.
62 A. A. Samma, C. K. Johnson, S. A. Song, S. Alvarez andM. Zimmer, J. Phys. Chem. B, 2010, 114, 15362–15369.
63 K. Brejc, R. Ficner, R. Huber and S. Steinbacher, J. Mol. Biol.,1995, 249, 424–440.
64 M. Roben, J. Hahn, E. Klein, T. Lamparter, G. Psakis, J. Hughesand P. Schmieder, ChemPhysChem, 2010, 11, 1248–1257.
65 P. Altoe, T. Climent, G. C. De Fusco, M. Stenta, A. Bottoni,L. Serrano-Andres, M. Merchan, G. Orlandi and M. Garavelli,J. Phys. Chem. B, 2009, 113, 15067–15073.
66 R. Gonzalez-Luque, M. Garavelli, F. Bernardi, M. Merchan,M. A. Robb and M. Olivucci, Proc. Natl. Acad. Sci. U. S. A.,2000, 97, 9379–9384.
67 M. Ben-Nun, F. Molnar, K. Schulten and T. J. Martinez, Proc.Natl. Acad. Sci. U. S. A., 2002, 99, 1769–1773.
68 W. Humphrey, H. Lu, I. Logunov, H. J. Werner and K. Schulten,Biophys. J., 1998, 75, 1689–1699.
69 H. Mizuno, T. K. Mal, M. Walchli, A. Kikuchi, T. Fukano,R. Ando, J. Jeyakanthan, J. Taka, Y. Shiro, M. Ikura andA. Miyawaki, Proc. Natl. Acad. Sci. U. S. A., 2008, 105,9227–9232.
70 D. Mandal, T. Tahara and S. R. Meech, J. Phys. Chem. B, 2004,108, 1102–1108.
71 M. Vengris, I. H. M. van Stokkum, X. He, A. F. Bell, P. J. Tonge,R. van Grondelle and D. S. Larsen, J. Phys. Chem. A, 2004, 108,4587–4598.
72 S. Scheiner, Acc. Chem. Res., 1985, 18, 174–180.73 D. von Stetten, M. Gunther, P. Scheerer, D. H. Murgida,
M. A. Mroginski, N. Krauss, T. Lamparter, J. Zhang,D. M. Anstrom, R. D. Vierstra, K. T. Forest andP. Hildebrandt, Angew. Chem., Int. Ed., 2008, 47, 4753–4755.
74 C. Song, G. Psakis, C. Lang, J. Mailliet, W. Gartner, J. Hughesand J. Matysik, Proc. Natl. Acad. Sci. U. S. A., 2011, 108,3842–3847.
75 D. S. Larsen, I. H. M. van Stokkum, M. Vengris, M. A. van derHorst, F. L. de Weerd, K. J. Hellingwerf and R. van Grondelle,Biophys. J., 2004, 87, 1858–1872.
76 M. Gauden, J. S. Grinstead, W. Laan, H. M. van Stokkum,M. Avila-Perez, K. C. Toh, R. Boelens, R. Kaptein, R. vanGrondelle, K. J. Hellingwerf and J. T. M. Kennis, Biochemistry,2007, 46, 7405–7415.
77 J. S. Grinstead, S. T. D. Hsu, W. Laan, A. Bonvin,K. J. Hellingwerf, R. Boelens and R. Kaptein, ChemBioChem,2006, 7, 187–193.
78 B. Dietzek, R. Maksimenka, G. Hermann, W. Kiefer, J. Popp andM. Schmitt, ChemPhysChem, 2004, 5, 1171–1177.
79 M. Schmitt, B. Dietzek, G. Hermann and J. Popp, Laser PhotonicsRev., 2007, 1, 57–78.
80 D. von Stetten, S. Seibeck, N. Michael, P. Scheerer,M. A. Mroginski, D. H. Murgida, N. Krauss, M. P. Heyn,P. Hildebrandt, B. Borucki and T. Lamparter, J. Biol. Chem.,2007, 282, 2116–2123.
81 C. F. Zhang, D. L. Farrens, S. C. Bjorling, P. S. Song andD. S. Kliger, J. Am. Chem. Soc., 1992, 114, 4569.
Dow
nloa
ded
by V
RIJ
E U
NIV
ER
SIT
EIT
on
16 J
une
2011
Publ
ishe
d on
25
May
201
1 on
http
://pu
bs.r
sc.o
rg |
doi:1
0.10
39/C
1CP0
0050
KView Online
S.1
Supporting Information to Fluorescence quantum yield and photochemistry of bacteriophytochrome constructs
K.C. Toh, Emina A. Stojković, Ivo H.M. van Stokkum, Keith Moffat, John T.M Kennis
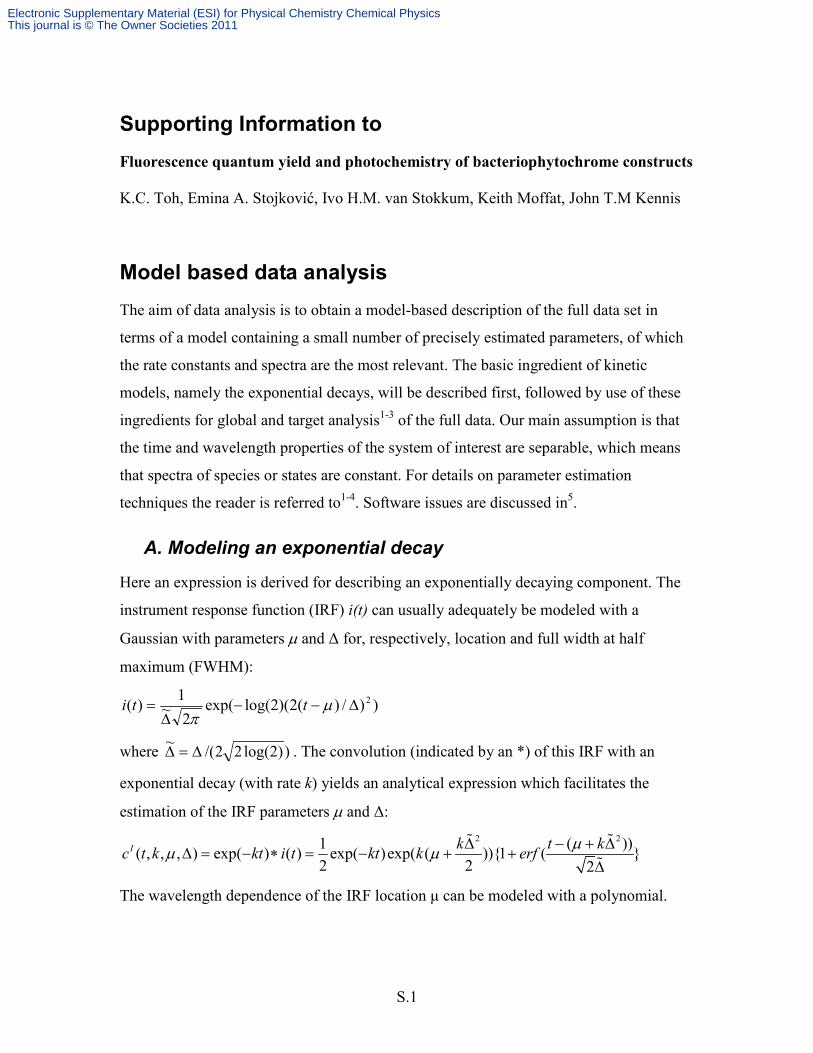
Model based data analysis The aim of data analysis is to obtain a model-based description of the full data set in
terms of a model containing a small number of precisely estimated parameters, of which
the rate constants and spectra are the most relevant. The basic ingredient of kinetic
models, namely the exponential decays, will be described first, followed by use of these
ingredients for global and target analysis1-3 of the full data. Our main assumption is that
the time and wavelength properties of the system of interest are separable, which means
that spectra of species or states are constant. For details on parameter estimation
techniques the reader is referred to1-4. Software issues are discussed in5
A. Modeling an exponential decay
.
Here an expression is derived for describing an exponentially decaying component. The
instrument response function (IRF) i(t) can usually adequately be modeled with a
Gaussian with parameters µ and Δ for, respectively, location and full width at half
maximum (FWHM):
))/)(2)(2log(exp(2~
1)( 2∆−−∆
= µπ
tti
where ))2log(22/(~ ∆=∆ . The convolution (indicated by an *) of this IRF with an
exponential decay (with rate k) yields an analytical expression which facilitates the
estimation of the IRF parameters µ and Δ:
2 21 ( ))( , , , ) exp( ) ( ) exp( )exp( ( )){1 ( }2 2 2
I k t kc t k kt i t kt k erf µµ µ ∆ − + ∆∆ = − ∗ = − + +
∆
The wavelength dependence of the IRF location μ can be modeled with a polynomial.
Electronic Supplementary Material (ESI) for Physical Chemistry Chemical PhysicsThis journal is © The Owner Societies 2011

S.2
max
1( ) ( )
c
jj
j cj
aλµ λ µ λ λ=
= + −∑
Typically, a parabola is adequate and the order of this polynomial ( maxj ) is two. The
reference wavelength cλ is usually at the center of the spectrograph.
B. Global and target analysis
The basis of global analysis is the superposition principle, which states that the measured
data ),( λψ t result from a superposition of the spectral properties )(λε l of the
components present in the system of interest weighted by their concentration )(tcl .
∑=
=compn
lll tct
1)()(),( λελψ
The )(tcl of all compn components are described by a compartmental model that consists
of first-order differential equations, with as solution sums of exponential decays. We
consider three types of compartmental models: (1) a model with components decaying
monoexponentially in parallel, which yields Decay Associated Difference Spectra
(DADS), (2) a sequential model with increasing lifetimes, also called an unbranched
unidirectional model6
(1) With parallel decaying components the model reads
, which yields Evolution Associated Difference Spectra (EADS),
and (3) a full compartmental scheme which may include possible branchings and
equilibria, which yields Species Associated Difference Spectra (SADS). The last is most
often referred to as target analysis, where the target is the proposed kinetic scheme,
including possible spectral assumptions. In this paper we did not attempt a target
analysis. Instead, throughout the manuscript, the EADS are shown in the main text and
the corresponding DADS are shown in the Supporting Information.
1( , ) ( ) ( )
compnI
l ll
t c k DADSψ λ λ=
= ∑
The DADS thus represent the estimated amplitudes of the above defined exponential
decays ( )Ilc k . When the system consists of parallel decaying components the DADS are
true species difference spectra. In all other cases, they are interpreted as a weighted sum
(with both positive and negative contributions) of true species difference spectra.
Electronic Supplementary Material (ESI) for Physical Chemistry Chemical PhysicsThis journal is © The Owner Societies 2011

S.3
(2) A sequential model reads
1( , ) ( )
compnIIl l
lt c EADSψ λ λ
=
= ∑
where each concentration is a linear combination of the exponential decays,
1( )
lII Il jl l
jc b c k
=
=∑ , and the amplitudes6jlb are given by 11 1b = and for j l≤ :
1
1 1,
/ ( )l l
jl m n jm n n j
b k k k−
= = ≠
= −∏ ∏
When the system consists of sequentially decaying components 1 2 ... compn→ → → the
EADS are true species difference spectra. In all other cases, they are interpreted as a
weighted sum (with only positive contributions) of true species difference spectra.
Equivalence of the parallel and the sequential model
It is important to note that the fit is identical when using a parallel or a sequential model.
Both the estimated lifetimes and the residuals from the fit are identical. This can be
demonstrated as follows. Since the concentrations of the sequential model are a linear
combination of the exponential decays we can write for the matrix of concentrations
(where column l corresponds to component l) II IC C B=
where the upper triangular matrix B contains the elements jlb defined above.
Furthermore, in matrix notation the parallel model reads I TC DADSΨ =
where TDADS is the transpose of the matrix that contains the DADS of component l in
column l. Likewise, in matrix notation the sequential model reads II TC EADSΨ =
Combining these three equations we obtain the relations TDADS EADS B= ⋅
TEADS DADS B−= ⋅
where the coefficients of the lower triangular matrix TB− are given by 11 11 Tl lb b− −= = and
for j l≤ :
Electronic Supplementary Material (ESI) for Physical Chemistry Chemical PhysicsThis journal is © The Owner Societies 2011

S.4
11
1
( )jTn l
jl ljn n
k kb bk
−− −
=
−= =∏
Thus the DADS are linear combinations of the EADS, and vice versa. Thus, the lth
EADS is a linear combination of the lth and following DADS. In particular, the first
EADS, which corresponds to the time zero difference spectrum, is the sum of all DADS;
and the final EADS is proportional to the final DADS.
In systems where photophysical and photochemical processes occur the sequential model
with increasing lifetimes provides a convenient way to visualize the evolution of the
(excited and intermediate) states of the system. Therefore, the EADS are shown in the
main text and the corresponding DADS are shown in the Supporting Information.
References
(1) Holzwarth, A. R. Data Analysis of Time-Resolved Measurements. In Biophysical Techniques in Photosynthesis; Amesz, J., Hoff, A. J., Eds.; Kluwer: Dordrecht, The Netherlands, 1996; pp 75. (2) van Stokkum, I. H. M.; Larsen, D. S.; van Grondelle, R. Biochimica Et Biophysica Acta-Bioenergetics 2004, 1657, 82. (3) van Stokkum, I. H. M.; van Oort, B.; van Mourik, F.; Gobets, B.; van Amerongen, H. (Sub)-Picosecond Spectral Evolution of Fluorescence Studied with a Synchroscan Streak-Camera System and Target Analysis. In Biophysical Techniques in Photosynthesis Vol. II; Aartsma, T. J., Matysik, J., Eds.; Springer: Dordrecht, The Netherlands, 2008; pp 223. (4) van Stokkum, I. H. M. “Global and Target Analysis of Time-resolved Spectra,” Department of Physics and Astronomy, Faculty of Sciences, Vrije Universiteit, Amsterdam, The Netherlands, 2005. (5) van Stokkum, I. H. M.; Bal, H. E. “A Problem Solving Environment for interactive modelling of multiway data”, 2006. (6) Nagle, J. F.; Parodi, L. A.; Lozier, R. H. Biophysical Journal 1982, 38, 161.
Electronic Supplementary Material (ESI) for Physical Chemistry Chemical PhysicsThis journal is © The Owner Societies 2011