ceepa discussion paper series isbn 0-9584508-1-1 discussion paper...
TRANSCRIPT
CEEPA Discussion Paper Series ISBN 0-9584508-1-1
Discussion Paper ISBN 0-9584508-2-X March 2002
NATURAL RESOURCE ACCOUNTING AND SOUTH
AFRICAN FISHERIES: A BIO-ECONOMIC ASSESSMENT OF THE WEST COAST DEEP-SEA HAKE FISHERY WITH REFERENCE TO THE OPTIMAL UTILISATION AND MANAGEMENT OF THE
RESOURCE
Trevor Hutton Fisheries Centre, University of British Columbia, Vancouver, Canada
and U.R. Sumaila
Chr. Michelsen Institute, Fantoft, Bergen, Norway
University of Pretoria
No 1, 2002
ii
This study was carried under a research grant from The Resource Accounting Network for Eastern and Southern Africa (RANESA). RANESA is a non-profit network that aims to support capacity building and awareness in environmental economics and policy in Africa through research, training, networking and public education and awareness activities. The network is funded by the Swedish International Development Agency (SIDA) and coordinated jointly by CEEPA at the University of Pretoria and the Beijer International Institute of Ecological Economics in Stockholm. For more information about RANESA visit the network’s website at: www.ceepa.co.za
No 1, 2002
iii
Table of Contents Summary………………………………………………………………..…… iii List of Tables………………………………………..……………………… iv List of Figures ……….……………………………..……………………… vi Acknowledgements…………..…………………………………………….. vi 1. INTRODUCTION…...…………………………………………... 1 1.1 Natural resource accounting and South African
fisheries………..….………………………………………..…………. 1 1.2 Aim of Study………………….………………………………………. 4 2. BACKGROUND: THE MANAGEMENT OF CAPE HAKES …… 5 2.1 Management of the fishery…………………………………………... 6 2.1 The long-line versus trawl debate ………………………………..…. 8 3. METHODS…………………………………………………….……. 11 3.1 Age-structured models and yield simulation ……………………….. 11 3.1a Life-history data utilized…………………………………………….. 13 3.1b Estimation of parameters…………………………………………….. 14 3.1c The regression approach……………………………………….……. 19 3.2 The bio-economic model……………………………………………. 20 3.2a Calculating the NPV……………………………………………..…. 20 3.2b A brief review of the literature………………………………………. 21 3.2c Economic data utilized………………………………………………. 22
4. PREDICTING GAME THEORETIC OUTCOMES………………… 29 4.1 Using non-cooperative game theory………………………………….. 29 5. RESULTS……………………………………………………………. 32 5.1 Physical flow accounts: the biological model results………………… 32 5.2 Bio-economic simulations of the west coast hake stock……………… 36 6. DISCUSSION………………………………………………………... 39 6.1 Trawling versus longlining…………………………………………... 39 6.2 Non-cooperative versus cooperative management…………………… 40 7. REFERENCES………………………………………………………. 42
No 1, 2002
iv
SUMMARY
The cooperative versus non-cooperative management of the South African west
coast hake stock is explored using game theoretic modelling in conjunction with an
age-structured model. The age-structured model is used to produce a physical flow
account for input into national resource accounts. Between 1989 and 1998, the
average catch of hake on the west coast was 92000 tons, most of which was
harvested by the demersal trawl sector. The physical flow account indicates that the
conservative re-building management strategy pursued for the fishery over the
same time period mentioned above, has resulted in a 29% increase in the demersal
trawl catch over the last decade.
We simulated the effects of alternative quota restrictions on two fishing
sectors (the established demersal trawl fleet and the new longline sector) that
compete for the rights to fish the stock. The results from the bio-economic analysis
(which forms a basis for a monetary flow account as we calculate the Net Present
Value of the stock) indicate that the greatest rent can be obtained by allocating a
share of the total allowable catch (TAC) to longliners. This share that achieves the
greatest benefits approximates the current TAC allocations to each sector under the
present conservative management policy implemented by the management
authority, assuming one takes into account the uncertainties inherit in a
computational exercise like ours. This outcome implies that the current management
initiatives by the government are such that they meet the objectives of the new
Marine Living Resources Act. That is, the need to achieve optimal utilisation of
resources is being adequately implemented.
The results of the game theoretic analysis provide an indication of why the
current introduction of longlining may affect the government-industry cooperative
management arrangements. A difference of R50 million will accrue to longliners
No 1, 2002
v
over the next thirty years if they engage in non-cooperative rather than cooperative
strategies. The latter occurs under the assumption that the trawl sector reduces
effort under a cooperative strategy. The results indicate that management policies,
which ignore economic realities, could fail. However, a cooperative strategy is still a
viable option for the trawl sector, because a difference of R1357 million can be
obtained over the same time period if the trawl sector engages in cooperative
behaviour.
These results are based on the assumption that benefits accrue to the quota holders
under security of tenure allowing them to consider the long-term sustainability of
the resource. Some form of security of tenure is still uncertain under the
government’s re-structuring program, although a number of new policies are now in
place to help implement longer term rights. These policy initiatives should create a
positive environment for all the stakeholders such that they can consider the long-
term sustainable utilisation of the resource. Otherwise, rent will be forgone if the
rules governing participation (i.e., rights) and the allocation of benefits for shared
stocks are not well defined and constrained.
No 1, 2002
vi
LIST OF TABLES
Table 1 The catches and economic value of the commercial fisheries in
1994 …………………………………….…….………. 2
Table 2 Estimates for MSY, BMSY and B(1997)/K and K (the pre-exploited
biomass) ………………. ……………………….… 33
Table 3 The physical flow account (all values in ‘000 tons) for the west
coast Cape hake stocks over a ten year period (1989-
1998)……………………………...…………...……….. 35
No 1, 2002
vii
LIST OF FIGURES
Figure 1 The distribution of Merluccius capensis and M. paradoxus off the coast
of South Africa and Namibia………………………. ……………..….. 6
Figure 2 The total catch from 1917 to 1997 in ICSEAF division 1.6 …….… 7
Figure 3 The hake CPUE from 1955 to 1997 in ICSEAF division 1.6 …...…. 10
Figure 4 Selectivity versus age relationship for the trawl ……………...….…… 16
Figure 5 A typical fit of the Beverton-Holt stock recruitment relationship to the
observed data ……………………………………………………….. 19
Figure 6 The relationship between unit cost and production (tonnes landed) for a
fishing firm harvesting hake with longliners in 1999 …………….…. 24
Figure 7 The relationship between cost and trawl fishing effort based on the
assumption that it costs on average R30000 for a std boat day of trawl
fishing effort in 2000 ………………………………………………….25
Figure 8 The relationship between total cost and fishing effort for the trawl
Fleet …………………………………………………………………. 28
Figure 9 The theoretical outcomes of a two player model. ………….………… 31
Figure 10 The fitted age-structured model predicted catch-per-unit effort to the
CPUE data ……………………………………………………………. 32
Figure 11 The sustainable yield versus fishing mortality for the trawl fleet under the
current effort levels being exerted by the longline fleet. ….……..…… 34
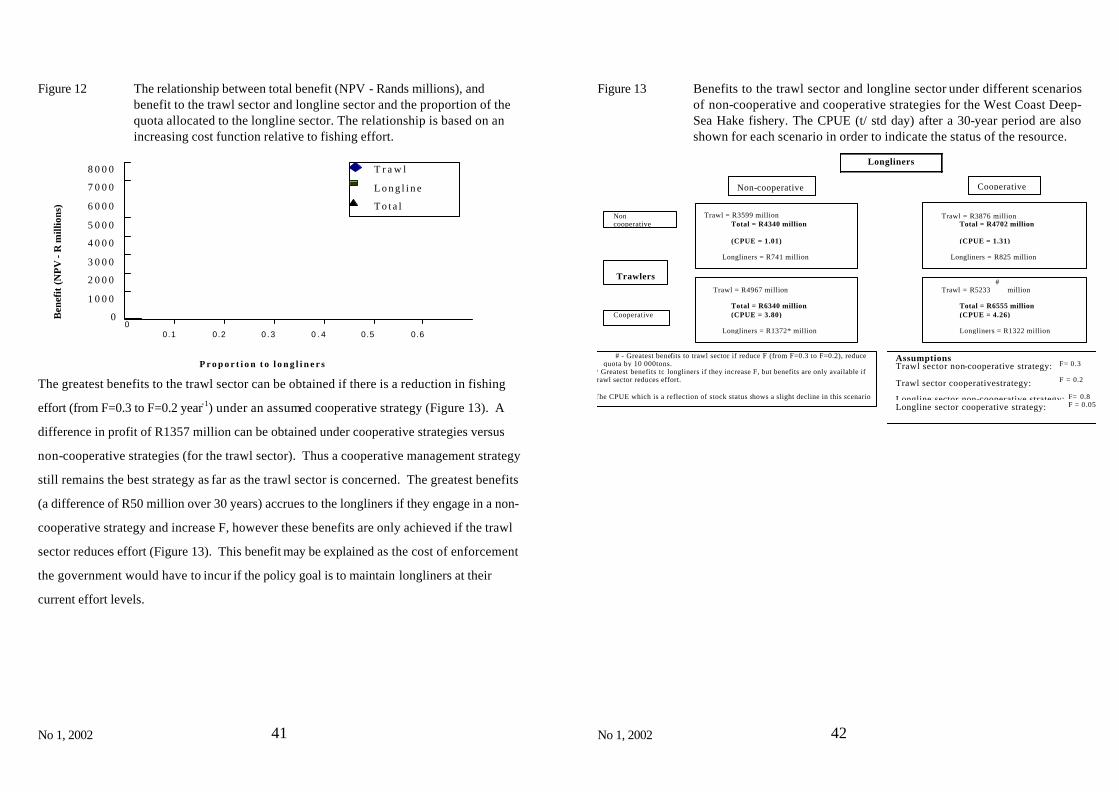
Figure 12 The relationship between total benefit (NPV - Rands millions), and benefit
to the trawl sector and longline sector and the proportion of the quota
allocated to the longline sector ………………………………... 37
Figure 13 Benefits to the trawl sector and longline sector under different scenarios
of non-cooperative and cooperative strategies for the West Coast Deep-
Sea Hake fishery .……………………………………..……………. 38
No 1, 2002
viii
ACKNOWLEDGEMENTS
Prof Rashid Hassan, Prof A Leiman and Dr G-M Lange are all acknowledged for
their support and valuable advice. Dr Rob Tilney and Dr Rob Leslie (Marine and
Coastal Management, Department of Environmental Affairs and Tourism) are both
acknowledged for providing data on the Cape hake resource. The Resource
Accounting Network for Eastern and Southern Africa (RANESA), the Swedish
International Development Agency (SIDA) and the Beijer Institute (Sweden) are all
gratefully acknowledged for providing funding for this project.
No 1, 2002
1
1. INTRODUCTION
1.1 Natural resource accounting and South African fisheries
The new Marine Living Resources Act (1998) has sustainable fisheries management as its
first objective. Policy reforms are also underway to re-structure the industry in order to
address the inequities of the past. The Act focuses on maximum utilization of marine
resources for the benefit of all South Africans while also increasing foreign earnings. The
development costs of this policy still have to be assessed along with both economic and
social benefits. The construction of a set of Natural Resource Accounts (NRA) would
represent a necessary step towards assessing whether the current resource utilization is
sustainable under the new policy initiatives in South Africa.
South Africa’s coastline is over 3 000km long and the nation has an Exclusive Economic
Zone (EEZ) of approximately 1 million km2 which contains a variety of fish species. The
fishing industry is complex in terms of fishing sectors, processing capability, markets,
capital investment, equipment and infrastructure. South Africa is a medium-sized fishing
nation on global standards, landing between half a million and one million tons of fish
annually from 1975 to 1991 (SFRI 1993). This catch generates foreign exchange and
provides employment. At the national level the fishing industry comprises 0.5 per cent of
the US$136.2 billion GDP1. However in the Western Cape, where the majority of fishing
occurs, the industry represents 1.5 per cent of the local economy and employs more than
25 000 people. In 1994 the harvest for the entire South African fishing industry had an
1 The Economist, 2000.
No 1, 2002
2
estimated annual wholesale value of US$390 million, to which the demersal and mid-water
trawl contribute just over 50 per cent (Table 1, Stuttaford 1996). The bulk of the South
African demersal catch comprise of Cape hakes (for example 62 per cent in 1991, Stuttaford
1993). Thus the two species of Cape hakes form the basis of the most important fishery in
the country and therefore the subject of our study. Table 1 The catches and economic value of South Africa’s commercial fisheries
in 1994 (from Stuttaford (1996) $US 1 = Rand SA 3.57 (exchange rate on 31.12.94)).
Sector
Nominal Catch (t)
Wholesale Value – processed US$ millions
Demersal and Midwater trawl* 188 842 201 Pelagic 315 545 81 Rock lobster 3 190 47 Linefisheries
Tuna 4 069 6 Squid-jigging 6 442 19 Handline fishery 12 878 21
Abalone 613 15 TOTAL 531579 390
*Includes hake - the main species targeted which is reviewed in this case study. There is a need to quantify the natural capital of fish stocks in economic terms
and to consider South Africa’s options for long term investment in natural capital versus
stock depletion and ecosystem degradation. This can be assessed by calculating the net
present value of future income streams under alternative harvesting methods and
management policies. The potential outcomes of alternative policy options are particularly
important to managers because the opportunity costs of providing fishers with alternative
means of employment are often high.
Of particular interest is the application of bio-economic models to evaluate
tradeoffs between alternative fishing methods using game theoretic methodology (see for
No 1, 2002
3
example Sumaila 1997). The fisheries along with alternative harvesting methods must be
included in an assessment of South Africa’s marine living resources. The Resource
Accounting Network for Eastern and Southern Africa (RANESA) is a regional network
tasked with enhancing capacity in the development and use of NRAs in Southern Africa.
Our aim was to carry out an analyses that would provide a crucial input for a NRA for the
South African economy, namely an assessment of the value of South Africa’s fishery
resources. In a review of the application of NRA to various countries, Leefers and Castillo
(1998) do not list any cases where fisheries are studied. Thus there is a need to include
South African fisheries within a NRA.
Various methods have been proposed and applied for the integration of
environmental concerns into economic indices (see Gilbert and Hafkamp 1986, El Serafy
and Lutz 1989, Repetto et al. 1989, Hull 1993, Moffat 1995, Alfsen 1996, Bartelmus 1996,
Daly 1996, Lai 1997, Nordhaus and Kokkelenberg 1999). Prudham and Lonergan (1993)
provide a summary of the various techniques although there is a need for a more recent
review. Natural resource accounting has also been applied to Southern African resources,
for example, Crowards (1996) considered woodlands, soils and minerals in Zimbabwe. One
method is to follow the United Nation’s SEEA (System of Integrated Environmental and
Economic Accounts)(United Nations, 1993) which emphasizes the compilation of physical
and monetary accounts. Bloem and Weisman (1996) provide a critique of the SEEA
approach. Lange (1998), in another example of a NRA assessment of resources in Southern
Africa, used the SEEA methodology to consider the incorporation of Namibia’s water
resources in the national accounts.
Both the physical and monetary accounts rely on the compilation of stock and
use accounts constructed for a benchmark year and all other years for which data are
available. Economic data also needs to be collected to calculate the economic
contribution of fish harvests to different sectors of the economy. Our goal is to analyse
No 1, 2002
4
current harvest levels and policy using flow accounts of NRA. The natural capital of hake
stocks, which contribute the greatest value to the wealth generated from the nations fish
stocks, have to be quantified in economic terms and future options for long term
investment in this capital have to be considered. The concept of managing fish stocks in a
similar way as managing human-made capital is well established (see Munro 1992, Clark
and Munro 1994). The alternative of negative investment due to poor management would
result in depleted fish stocks and degradation of marine ecosystems. Depleted stocks
would have negative effects on a country as a whole because a decrease in the net
aggregate investment will result in a decrease in social welfare (Dasgupta and Mäler 1999).
Thus it is essential that the net aggregate investment be quantified for natural capital such
as a fish stocks.
The benefits of management can only be assessed by calculating the net present
value of future income streams under alternative harvesting methods (trawl versus longline
for the hake stock) and management policies. Thus the potential rent from the hake fishery
under different configurations of trawl/longline catch levels must be calculated, providing
vital input to future studies on rent capture and its distribution among different
stakeholders. This will allow the management authorities to consider realistic policy
alternatives that can then be evaluated in a multi-sectoral framework. Such a framework
would take into account the full range of development objectives and the sectoral
strategies for achieving alternative objectives. This would form the basis of an input of
fisheries into a NRA. The NRA can then be linked to national accounts through the use of
the same classification of economic activities as was undertaken by Lange (1998) for
Namibia’s water resources. The case study in this project will construct the physical and
monetary accounts for the west coast deepwater hake fishery providing a model for future
fisheries assessments in the region.
No 1, 2002
5
1.2 Aim of study
The aim of this study is firstly to undertake a bio-economic assessment of Cape hake on
the west coast of South Africa and secondly to analyze potential outcomes under
alternative management arrangements. Numerous requests have been made for the
redistribution of quotas in South Africa in order to redress the imbalances of the past. The
re-distribution of quota to newcomers and previously disadvantaged South Africans is
occurring with the creation of new players, rather than via the elimination of existing quota
holders. It is worth noting that up until now a bio-economic assessment, which considers
both sectors (the demersal trawl and longline sector), has not been undertaken for this
fishery. The research is important in that it will add a scientific perspective to the ongoing
debate over the restructuring of the industry. Although the hake fishery has traditionally
been a trawl-based fishery, the question that needs to be asked is whether the longline
fishery will have positive or negative effects on the traditional fishery. More importantly,
the question needs to be asked whether the longline fishery will provide greater economic
benefits to the country. The specific questions addressed include (i) what are the short-
term economic losses to the trawl fleet of an increase in the longline fleet, (ii) what mix of
trawlers and longliners provides the greatest catch, and more importantly (iii) what mix
provides the greatest economic benefits?
No 1, 2002
6
2. BACKGROUND: THE MANAGEMENT OF CAPE HAKES
The Cape hake or Stockfish (a popular name for hake in South Africa) is an important
commercial demersal fish species. Its distribution extends along the entire western
seaboard of South Africa from Cape Point to north of the border where it is also fished in
Namibia. Hake are also found on the south-east coast on the Agulhas Bank. The Cape
hake fishery is of considerable social and economic value to South Africa. Annual hake
catches by the South African fishing fleet over the period 1982-1991 remained fairly
constant, averaging 138 000 tons per year. Payne (1989) provides a detailed history of the
hake fishery off southern Africa.
Reviews of the biology of this resource are provided by Botha (1980), Crawford et
al. (1987), Payne (1989) and Payne and Punt (1992). Cape hakes consist of two
morphologically similar hake species, Merluccius capensis and M. paradoxus (Van Eck
1969). Since it is not easy to distinguish visually between the two species only the total
combined species catch is recorded. The distribution of each species is depth-dependent;
M. paradoxus occurs in deep water while M. capensis is a shallow water species (Botha
1973) (Figure 1). The distribution areas of the two species overlap in intermediate waters
where small M. paradoxus occur together with medium to large M. capensis individuals as
the size of fish of each species tends to increase with depth (Botha 1973). Consequently
the adults of the two species do not mix and the species maintain their integrity by
spawning at different depths (Botha 1973).
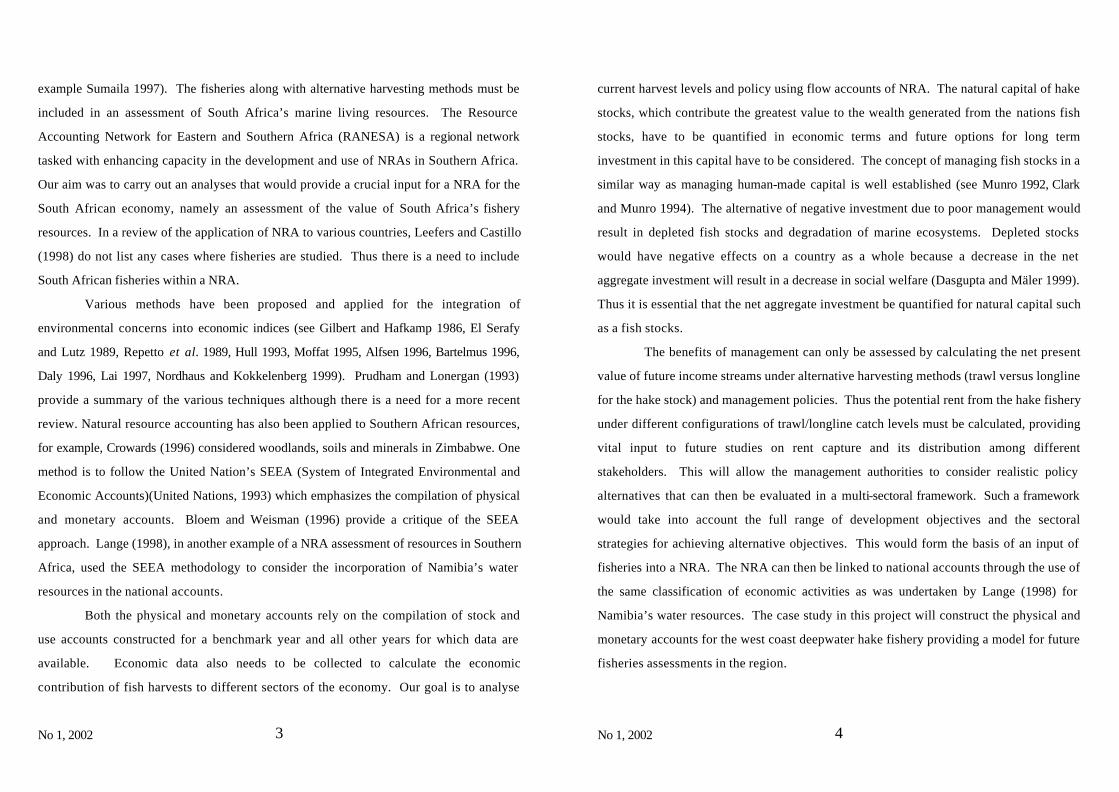
Figure 1 The distribution of Merluccius capensis (Shallow-water Cape Hake) and M.
paradoxus (Deep-water Cape Hake) off the coast of South Africa and Namibia. The ICSEAF divisions are also shown.
No 1, 2002
7
Earlier workers (for example Roux 1949) were convinced that there was some form
of horizontal annual hake migration, but such conclusions were drawn on the erroneous
premise that only one species existed. Van Eck (1969) later confirmed the presence of two
hake species in local waters. There is a tendency for hake to move offshore into deeper
water as they grow older and there appears to be some seasonal movement of adults
inshore and offshore (Payne et al. 1989), but apart from that, there is no firm proof of
extensive horizontal migration (Botha 1973, 1980).
2.1 Management of the fishery
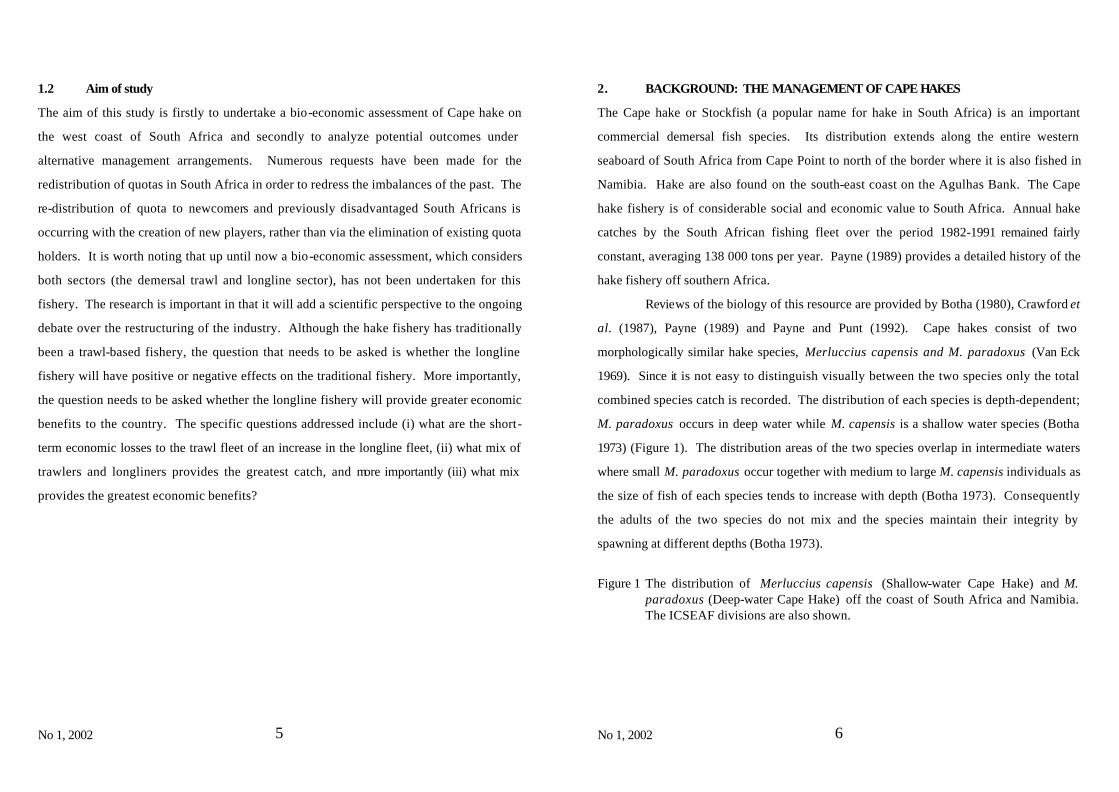
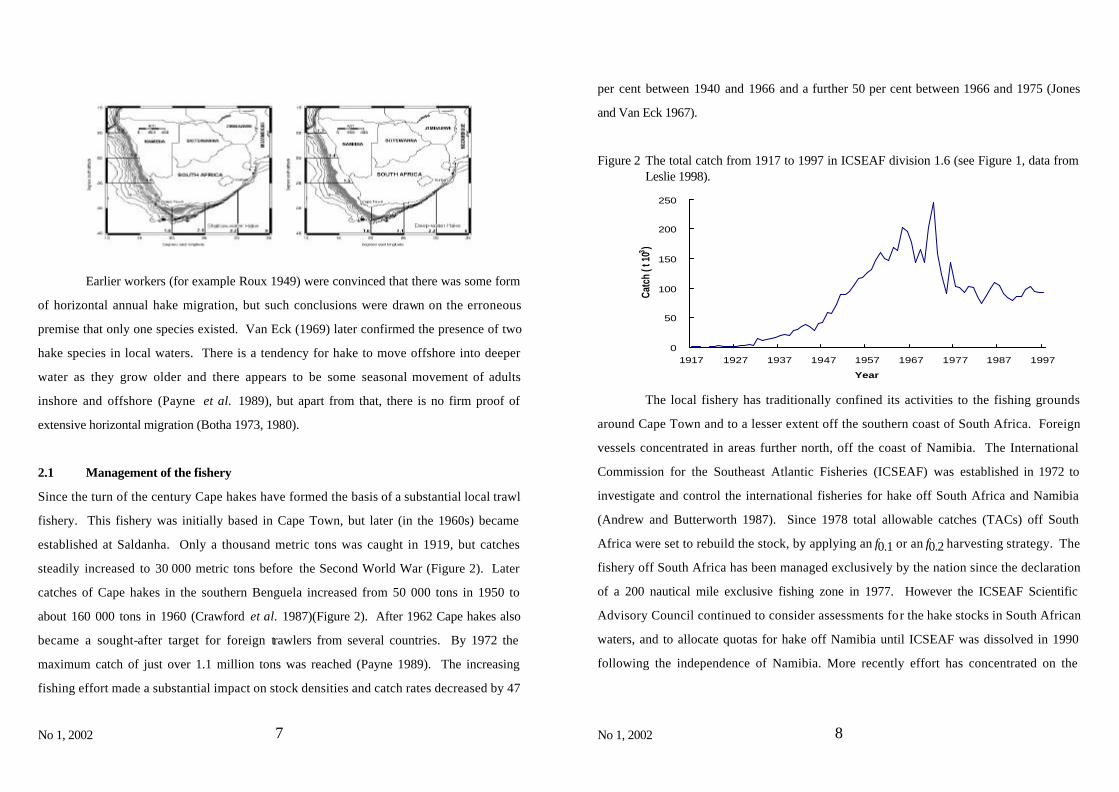
Since the turn of the century Cape hakes have formed the basis of a substantial local trawl
fishery. This fishery was initially based in Cape Town, but later (in the 1960s) became
established at Saldanha. Only a thousand metric tons was caught in 1919, but catches
steadily increased to 30 000 metric tons before the Second World War (Figure 2). Later
catches of Cape hakes in the southern Benguela increased from 50 000 tons in 1950 to
about 160 000 tons in 1960 (Crawford et al. 1987)(Figure 2). After 1962 Cape hakes also
became a sought-after target for foreign trawlers from several countries. By 1972 the
maximum catch of just over 1.1 million tons was reached (Payne 1989). The increasing
fishing effort made a substantial impact on stock densities and catch rates decreased by 47
No 1, 2002
8
per cent between 1940 and 1966 and a further 50 per cent between 1966 and 1975 (Jones
and Van Eck 1967).
Figure 2 The total catch from 1917 to 1997 in ICSEAF division 1.6 (see Figure 1, data from Leslie 1998).
0
50
100
150
200
250
1917 1927 1937 1947 1957 1967 1977 1987 1997
Year
Catc
h ( t
103 )
The local fishery has traditionally confined its activities to the fishing grounds
around Cape Town and to a lesser extent off the southern coast of South Africa. Foreign
vessels concentrated in areas further north, off the coast of Namibia. The International
Commission for the Southeast Atlantic Fisheries (ICSEAF) was established in 1972 to
investigate and control the international fisheries for hake off South Africa and Namibia
(Andrew and Butterworth 1987). Since 1978 total allowable catches (TACs) off South
Africa were set to rebuild the stock, by applying an f0.1 or an f0.2 harvesting strategy. The
fishery off South Africa has been managed exclusively by the nation since the declaration
of a 200 nautical mile exclusive fishing zone in 1977. However the ICSEAF Scientific
Advisory Council continued to consider assessments for the hake stocks in South African
waters, and to allocate quotas for hake off Namibia until ICSEAF was dissolved in 1990
following the independence of Namibia. More recently effort has concentrated on the
No 1, 2002
9
investigation of alternative management procedures for the Cape hake resource off the
west coast of South Africa (see Punt 1991).
For management purposes ICSEAF divided the area under its management into
Divisions. Off South Africa Division 1.6 corresponds to the west coast, and Divisions 2.1
and 2.2 correspond to the south coast (see Figure 1). In all four ICSEAF Divisions, catch
per unit effort (CPUE) figures indicate a steady decline up to the late 1970s, when catch
rates reached their lowest recorded levels. At that time a dynamic production model was
introduced for managing the resource using CPUE data (Andrew and Butterworth 1987).
Although a global TAC is set for management purposes, the hake resource off
South Africa has been divided into two stocks, and scientific TAC's are formulated for
each stock, under the assumption that the stocks of hake off the south and west coasts are
biologically isolated (Payne and Punt 1992). However Payne et al. (1987) suggests that
there may be some interaction between the M. paradoxus stocks on the south and west
coasts. Current scientific TAC recommendations for the South African hake fishery are
based on a dynamic production model estimation procedure which utilizes catch, CPUE
and survey biomass data (see Punt 1988, 1992).
2.2 The long-line versus trawl debate
Successful trials on the capture of hake by longlines in 1983 led to a rush for concessions
(42 in one year). The method resulted in high catch rates, was selective and could be
employed on a rough substrate (Stander 1995). Realizing the potential of this new fishery,
the authorities in May 1983 prohibited the capture of hake using the longline method
(Stander 1995). During 1983 six experimental permits for longlining were issued (for 1500 t
of hake) and despite the high catch of kingklip and the warnings from the Sea Fisheries
Research Institute (SFRI, now Marine and Coastal Management), the authorities issued a
further six permits to non-hake quota-holders in 1985. The longline operations were to
No 1, 2002
10
target hake, however Kingklip (the bycatch of the longline permits), were immediately
targeted as the species of preference as they were worth four times the value of hake.
Prices for landed kingklip were in the region of R8/kg in 1985.
By 1986 longline catches reached a peak of 10364 tons of which hake constituted
a mere 16 per cent, the rest comprising mostly of kingklip (Stander 1995). From 1986 to 1990
the Minister, the Fisheries Advisory Council and Sea Fisheries attempted to formulate
measures to satisfy conflicting interests. However by March 1990 it was clear that the
kingklip resource was severely overfished. In June 1990 the Minister announced an end to
all longlining. The six non-quota-holders were compensated by means of a hake quota of
240 tons each and have since regrouped into four companies (Stander 1995).
In 1993 a cooperative Longline Experiment was set up. The longline experiment
involved a joint strategy between tuna and squid fishers (who were longlining), the
established industry and government in order to evaluate the bio-economic value of
longlining (Anon. 1995, Badenhorst 1995). The parties involved in the experiment were
brought together in workshops to evaluate alternative strategies for data collection (see
Fowkes and Sowman 1994). It is often suggested that longlining is potentially detrimental
to the established trawl based industry as they target larger fish and thus threaten the large
fecund females, reducing the spawning stock biomass (SSB) and thus threatening the long-
term productivity of the stock (Anon. 1992, 1993). On the other hand the longline sector
question the biological rationale for being precautionary with longlining even though
kingklip were overfished as the trawl fleet target immature fish (65 per cent of the fish
landed are less that 0.8kg). Preliminary assessments on both coasts, the west coast and
south coast (Butterworth et al. 1992, Geromont et al. 1995, 1995b) indicate that a higher
yield-per-recruit can be obtained by using longlines. These assessments were based on
extensive research undertaken by Armstrong and Japp (1992) and Japp (1993, 1995a-e,
1996).
No 1, 2002
11
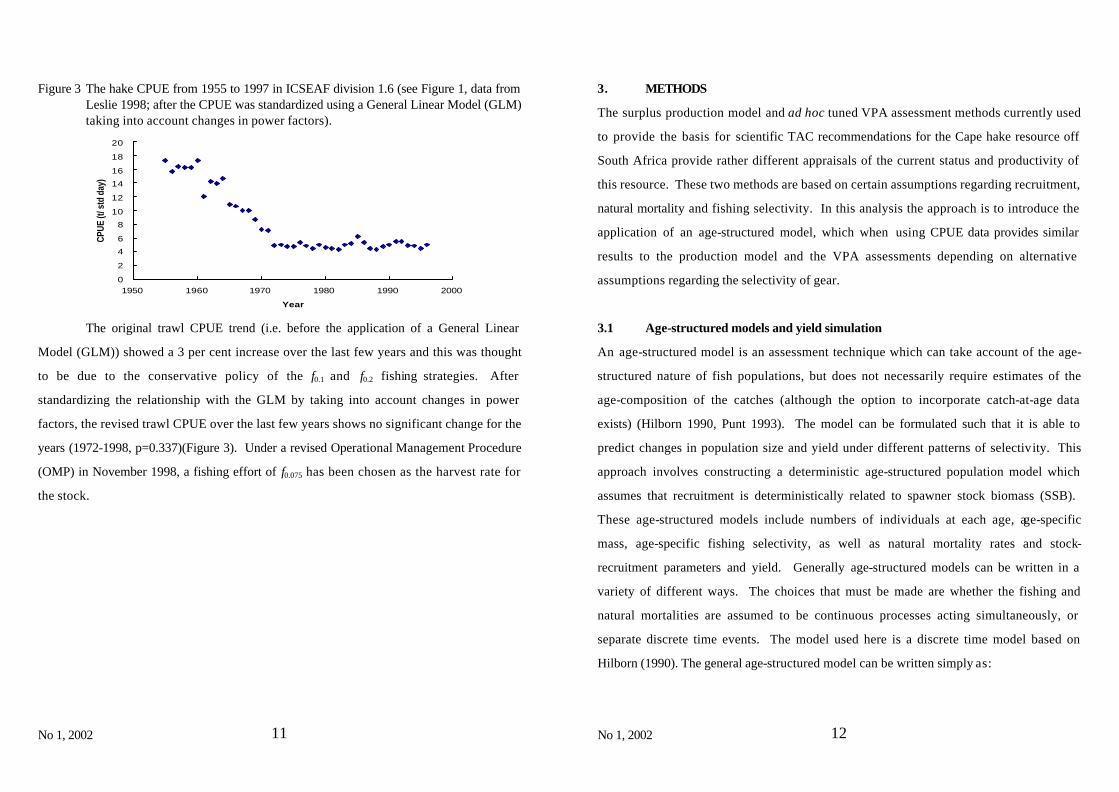
Figure 3 The hake CPUE from 1955 to 1997 in ICSEAF division 1.6 (see Figure 1, data from Leslie 1998; after the CPUE was standardized using a General Linear Model (GLM) taking into account changes in power factors).
0
2
4
6
8
10
12
14
16
18
20
1950 1960 1970 1980 1990 2000
Year
CPUE
(t/ s
td d
ay)
The original trawl CPUE trend (i.e. before the application of a General Linear
Model (GLM)) showed a 3 per cent increase over the last few years and this was thought
to be due to the conservative policy of the f0.1 and f0.2 fishing strategies. After
standardizing the relationship with the GLM by taking into account changes in power
factors, the revised trawl CPUE over the last few years shows no significant change for the
years (1972-1998, p=0.337)(Figure 3). Under a revised Operational Management Procedure
(OMP) in November 1998, a fishing effort of f0.075 has been chosen as the harvest rate for
the stock.
No 1, 2002
12
3. METHODS
The surplus production model and ad hoc tuned VPA assessment methods currently used
to provide the basis for scientific TAC recommendations for the Cape hake resource off
South Africa provide rather different appraisals of the current status and productivity of
this resource. These two methods are based on certain assumptions regarding recruitment,
natural mortality and fishing selectivity. In this analysis the approach is to introduce the
application of an age-structured model, which when using CPUE data provides similar
results to the production model and the VPA assessments depending on alternative
assumptions regarding the selectivity of gear.
3.1 Age-structured models and yield simulation
An age-structured model is an assessment technique which can take account of the age-
structured nature of fish populations, but does not necessarily require estimates of the
age-composition of the catches (although the option to incorporate catch-at-age data
exists) (Hilborn 1990, Punt 1993). The model can be formulated such that it is able to
predict changes in population size and yield under different patterns of selectivity. This
approach involves constructing a deterministic age-structured population model which
assumes that recruitment is deterministically related to spawner stock biomass (SSB).
These age-structured models include numbers of individuals at each age, age-specific
mass, age-specific fishing selectivity, as well as natural mortality rates and stock-
recruitment parameters and yield. Generally age-structured models can be written in a
variety of different ways. The choices that must be made are whether the fishing and
natural mortalities are assumed to be continuous processes acting simultaneously, or
separate discrete time events. The model used here is a discrete time model based on
Hilborn (1990). The general age-structured model can be written simply as:
No 1, 2002
13
Ny+1,a+1 = Ny,a e - ( Ma + Sa Fy ) (E.1)
where
Ny,a is the number of fish of age a at the start of year y,
Ma is the rate of natural mortality on the fish of age class a,
Sa is the selectivity of the fishery on fish aged a years (0< Sa <1),
Fy is the fishing mortality for fully vulnerable individuals in year y, i.e. fish with
Sa = 1 (the year effect for the fishing mortality). To take age effects into account fishing mortality-at-age (Fy,a) is separated into
an age-component which is common to all years (age-specific selectivity - Sa) and a year-
component which is common to all ages within a particular year (year effect of fishing
mortality - Fy). This assumption is justifiable if the distribution of fish and fishing vessels
does not vary substantially from one year to the next. Two scenarios in which the
separability assumption would not be justified, and which might be pertinent to any fishery
(Punt 1991). The separability assumption is based on the following relationship:
Fy,a = Fy Sa (E.2)
where
Fy,a is the instantaneous rate of fishing mortality on fish aged a during year
y,
The spawning stock biomass SBBy can be calculated as:
SSBy = ∑=
Max
maNy,a Wa
(E.3)
where
SSBy is the spawning biomass at the beginning of the year y,
Wa is the mass-at-age for a fish
No 1, 2002
14
m is the age at sexual maturity (assumed to be 5 years)
It is assumed further that there is a relationship between the spawning biomass
SSBy in one year, and the average recruitment in the following year (Beverton and Holt
1957):
Ny+1,1 = (? SSBy) / (SSBy+? ?) (E.4)
where
?, ? are the stock-recruitment relationship parameters.
Equations (E.1) - (E.4) define the dynamics of both numbers-at-age and biomass-
at-age. It is possible to relate the model to observed data, however additional relationships
need to be defined. It is assumed that the available indices of population abundance are
proportional to stock biomass (where the abundance index is either CPUE or survey
biomass). For the age-structured population model the equation for model-predicted catch
(or sustainable yield if F is held constant) is:
Cy = ∑=
Max
a 1Wa- Sa Fy Ny,a (1- e - ( Ma + Sa Fy )
)/(Ma +Sa Fy) (E.5)
3.1a Life-history data utilized
Annual recorded trawl catch and trawl CPUE data for the South African west
coast hake stock are shown in Figure 2 and Figure 3 respectively. The estimated total
annual landed hake catch from the west coast is available (that is published) for the period
1917 to 1996 and landed catch by fishing method for 1983 to 1996 (Leslie 1998). Cape hakes
consist of two morphologically similar hake species, Merluccius capensis and M.
paradoxus (Van Eck 1969). Since it is not easy to distinguish visually between the two
species only the total combined species catch is recorded thus the model is not single-
species. Although Cape hake in Division 1.6 have been fished since the turn of the
century, comprehensive trawl CPUE are only available from 1955. The catch statistics are
No 1, 2002
15
usually reported in tonnes landed weight. Fish are headed and gutted before being
weighed and therefore catch figures were converted to tonnes whole (nominal) weight by
multiplying by a factor of 1.46 (Chalmers 1976). Nominal catches prior to 1972 were
increased by 39 per cent to account for discarding of small hake (Andrew 1986). The
collection of otoliths for ageing purposes and catch-length frequency data permits the
breakdown of the total catch-by-mass into catch-at-age estimates. Length frequency data
also exist for the years 1964 to 1977 for the west coast. In principle these data can be used
to estimate catch-at-age for these years.
Although survey biomass data are available from 1983, they are not utilized here.
Punt (1993) incorporated survey biomass data in his age-structured production model
assessments and found in his sensitivity tests that the results scarcely changed when
survey biomass data were not taken into account. Andrew et al. (1989) incorporated
biomass survey data into their assessment and found that fits to the relative indices of
survey biomass and CPUE data hardly changed from fits to the CPUE data alone.
Although the biomass estimates have fluctuated over the period since 1983, they show no
significant trend.
3.1.2 Estimation of parameters
3.1.2.1 Input parameters
Four age-specific parameters are needed before the population can be simulated. These
include selectivity-at-age (Sa), mass-at-age (Wa), and mortality-at-age (Ma). The
remaining parameter is age-at-maturity. The estimates of selectivity-at-age, mass-at-age
and age-at-maturity were obtained from other sources. The parameter values for the
logistic selectivity function are based on the analysis of selectivity-at-age conducted by
Punt (1991). The values for the parameters related to growth and maturation were taken
from Punt and Leslie (1991). The natural mortality-at-age was assumed to be constant over
No 1, 2002
16
the age classes considered. There are rarely any data to justify the assumption that
mortality is age-specific and it is normally assumed to be the same regardless of age. In
must be borne in mind that the hake size mix in the population is dynamic and affected by
the survival of the different age classes. As Botha (1980) pointed out enhanced survival of
both species to a large size will increase the rate of cannibalism on younger age classes.
However increased fishing pressure on large hake will correspondingly increase the
survival of younger age classes. Therefore it would be important to consider the effects of
cannibalism on the age-specific mortality as well, however the paucity of data precludes
such a study.
3.1.2.2 Selectivity-at-age
The selectivity function used in the "base case" model is a logistic curve which is assumed
to be time invariant. The paucity of data on the selectivity of trawl gear changes over time
preclude estimation of the extra parameters that would be required to reflect changes over
time. The model used is:
Sa = 1/(1+ e ((-a - Ac)/? )) (E.6)
where
Sa is the selectivity of the trawl gear on fish of age a,
Ac is the age-at-50%-selectivity,
? is a "steepness" parameter for the selectivity curve.
The values Ac = 2yr and ? ?= 0.5 yr-1 used for the model are based on an analysis
by Punt (1991). However to investigate the effect of decreasing selectivity-at-age for older
fish the following selectivity function was used:
Sa = 1/(1+ e ((-a - Ac)/? )) for a<am (E.7)
No 1, 2002
17
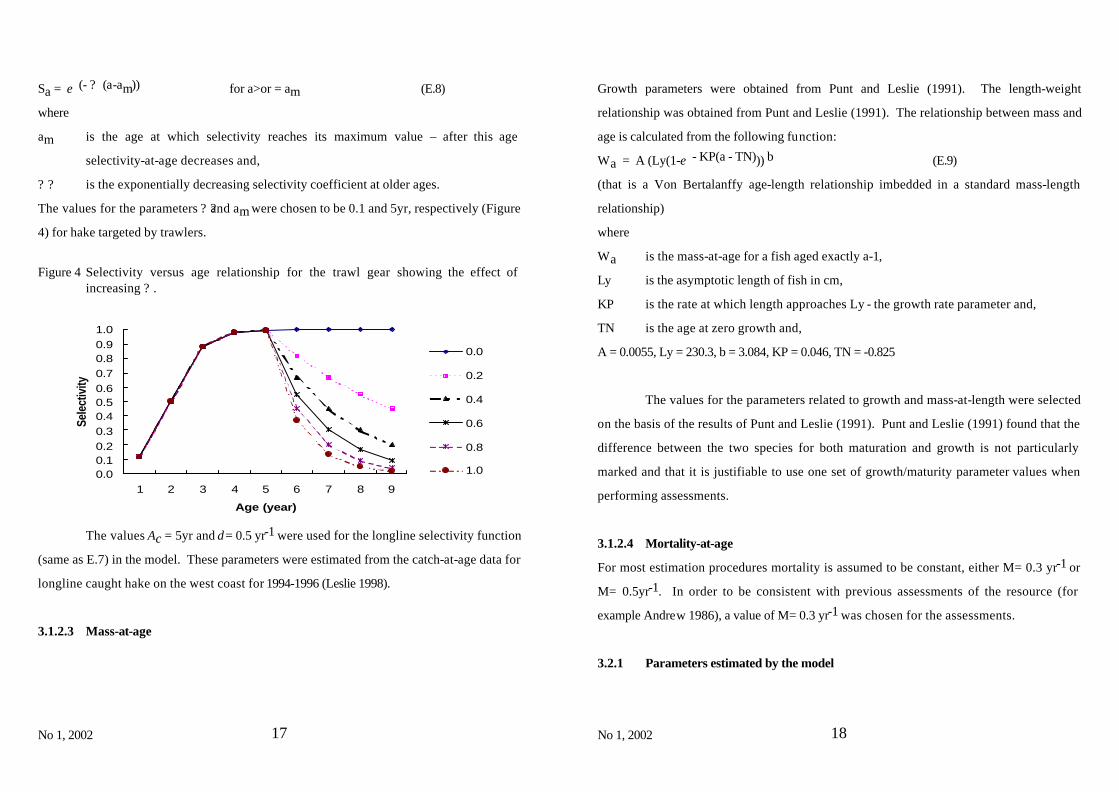
Sa = e (- ? (a-am)) for a>or = am (E.8)
where
am is the age at which selectivity reaches its maximum value – after this age
selectivity-at-age decreases and,
? ? is the exponentially decreasing selectivity coefficient at older ages.
The values for the parameters ? ?and am were chosen to be 0.1 and 5yr, respectively (Figure
4) for hake targeted by trawlers.
Figure 4 Selectivity versus age relationship for the trawl gear showing the effect of
increasing ? .
0.00.10.20.30.40.50.60.70.80.91.0
1 2 3 4 5 6 7 8 9
Age (year)
Sele
ctiv
ity
0.0
0.2
0.4
0.6
0.8
1.0
The values Ac = 5yr and δ = 0.5 yr-1 were used for the longline selectivity function
(same as E.7) in the model. These parameters were estimated from the catch-at-age data for
longline caught hake on the west coast for 1994-1996 (Leslie 1998).
3.1.2.3 Mass-at-age
No 1, 2002
18
Growth parameters were obtained from Punt and Leslie (1991). The length-weight
relationship was obtained from Punt and Leslie (1991). The relationship between mass and
age is calculated from the following function:
Wa = A (Ly(1-e - KP(a - TN))) b (E.9)
(that is a Von Bertalanffy age-length relationship imbedded in a standard mass-length
relationship)
where
Wa is the mass-at-age for a fish aged exactly a-1,
Ly is the asymptotic length of fish in cm,
KP is the rate at which length approaches Ly - the growth rate parameter and,
TN is the age at zero growth and,
A = 0.0055, Ly = 230.3, b = 3.084, KP = 0.046, TN = -0.825
The values for the parameters related to growth and mass-at-length were selected
on the basis of the results of Punt and Leslie (1991). Punt and Leslie (1991) found that the
difference between the two species for both maturation and growth is not particularly
marked and that it is justifiable to use one set of growth/maturity parameter values when
performing assessments.
3.1.2.4 Mortality-at-age
For most estimation procedures mortality is assumed to be constant, either M= 0.3 yr-1 or
M= 0.5yr-1. In order to be consistent with previous assessments of the resource (for
example Andrew 1986), a value of M= 0.3 yr-1 was chosen for the assessments.
3.2.1 Parameters estimated by the model
No 1, 2002
19
The parameters which are obtained by fitting the model to the available data are the
catchability coefficient (q), the relationship between the biomass and index of abundance
(CPUE) and the two stock-recruitment parameters α and β. The first step in the regression
is to obtain a set of initial age-class numbers, Ny,1. This is done by setting the initial age-
distribution equal to that of the deterministic unexploited equilibrium (denoted by *) level
for the stock (i.e. the age-structure corresponding to Fy = 0, for y<1917, see Punt 1990),
therefore:
N*y,a = R*1 e - ∑−
=
1
1
a
r
Mr (E.10)
and
SB*1 = ∑=
Max
maN*y,a Wa (E.11)
where
N*y,a is the equilibrium number of fish of age a at the start of year y
R*1 is the average equilibrium recruitment
SB*1 is the spawning biomass at equilibrium.
By substituting equation (E.10) into equation (E.11) it is possible to obtain a
relationship for spawning biomass at equilibrium (SB*1) in terms of average equilibrium
recruitment (R*1):
SB*1 = R*1∑=
Max
maWae- ∑
−
=
1
1
a
r
Mr (E.12)
setting
No 1, 2002
20
γ =∑=
Max
ma Wae- ∑
−
=
1
1
a
r
Mr (E.13)
gives
R*1 = SB*1/ γ (E.14)
For the Ricker stock-recruitment relationship:
R*1 = α SB*y e - β SB*y (E.15)
Equations (E.14) and (E.15) can be solved for the average equilibrium recruitment
(R*1) and the equilibrium spawning biomass (SB*1). The result is:
R*1 = ln (α γ )/(β γ ) (E.16)
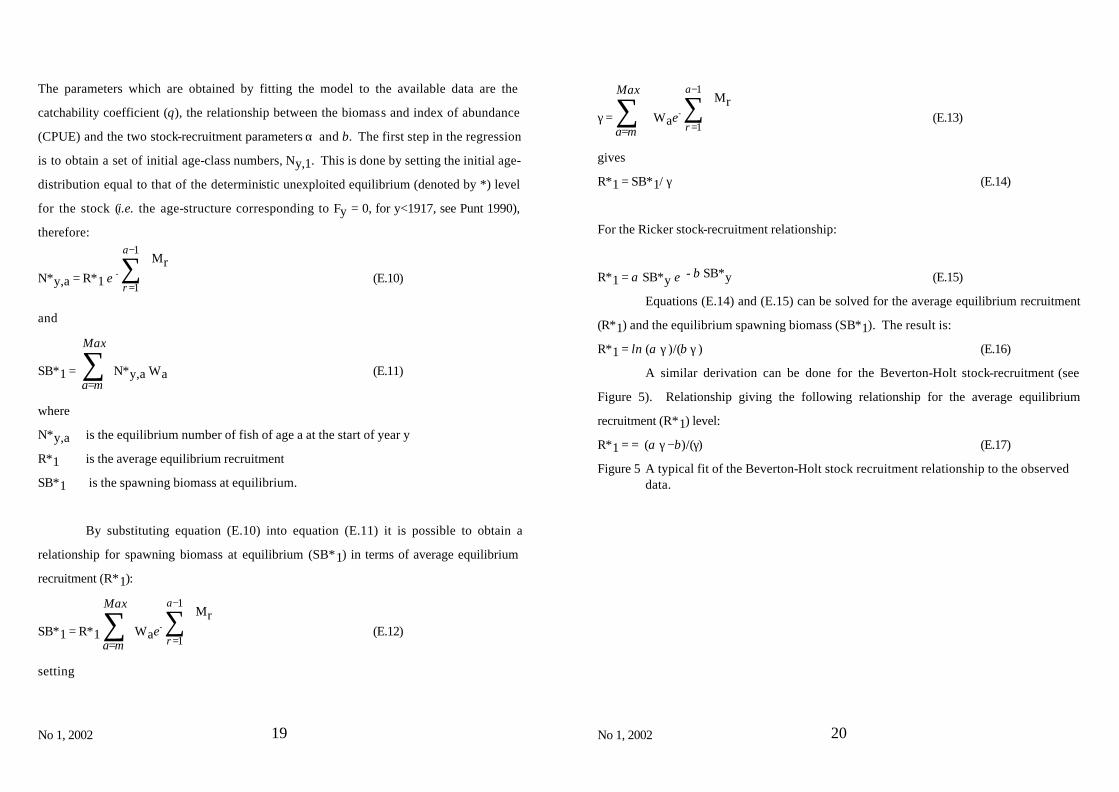
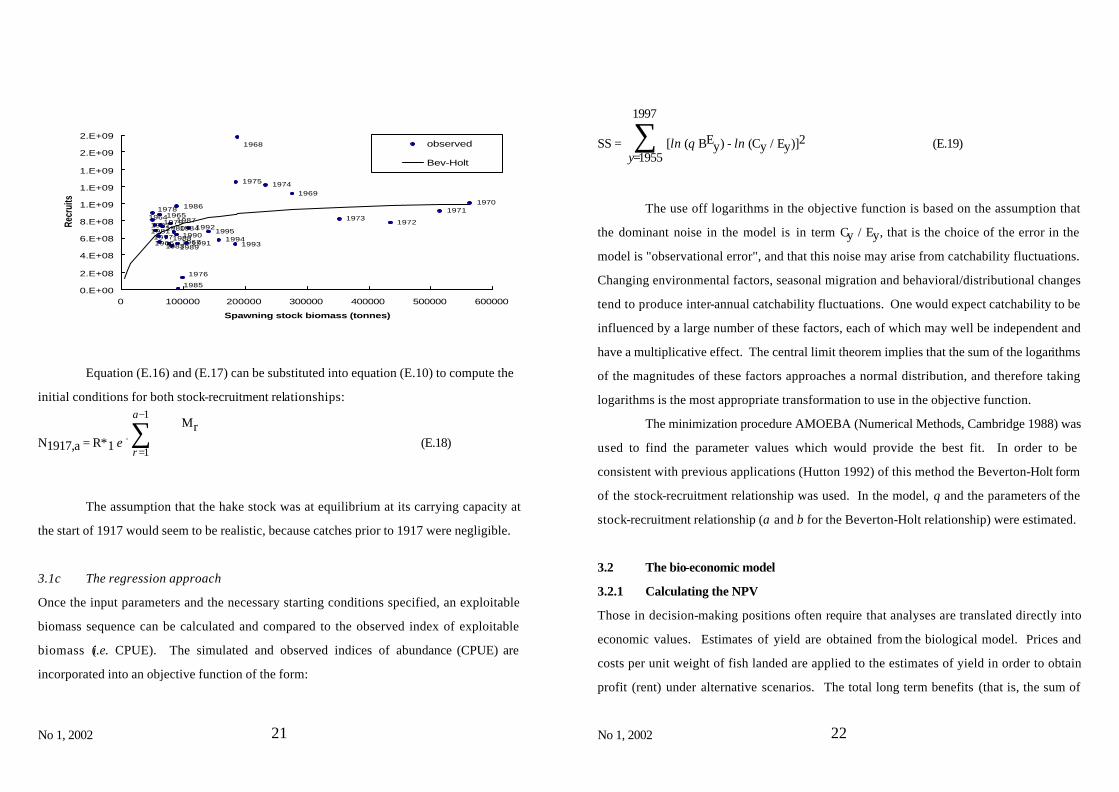
A similar derivation can be done for the Beverton-Holt stock-recruitment (see
Figure 5). Relationship giving the following relationship for the average equilibrium
recruitment (R*1) level:
R*1 = = (α γ −β)/(γ) (E.17)
Figure 5 A typical fit of the Beverton-Holt stock recruitment relationship to the observed data.
No 1, 2002
21
19641965
198219811977
1978
1966
19791980
19881983
1987
1989
1984
1986
19901967
1985
1976
1991
19921995
19941993
1975
1968
19741969
19731972
19711970
0.E+00
2.E+08
4.E+08
6.E+08
8.E+08
1.E+09
1.E+09
1.E+09
2.E+09
2.E+09
0 100000 200000 300000 400000 500000 600000
Spawning stock biomass (tonnes)
Recr
uits
observed
Bev-Holt
Equation (E.16) and (E.17) can be substituted into equation (E.10) to compute the
initial conditions for both stock-recruitment relationships:
N1917,a = R*1 e - ∑−
=
1
1
a
r
Mr (E.18)
The assumption that the hake stock was at equilibrium at its carrying capacity at
the start of 1917 would seem to be realistic, because catches prior to 1917 were negligible.
3.1c The regression approach
Once the input parameters and the necessary starting conditions specified, an exploitable
biomass sequence can be calculated and compared to the observed index of exploitable
biomass (i.e. CPUE). The simulated and observed indices of abundance (CPUE) are
incorporated into an objective function of the form:
No 1, 2002
22
SS = ∑=
1997
1955y [ln (q BEy) - ln (Cy / Ey)]2 (E.19)
The use off logarithms in the objective function is based on the assumption that
the dominant noise in the model is in term Cy / Ey, that is the choice of the error in the
model is "observational error", and that this noise may arise from catchability fluctuations.
Changing environmental factors, seasonal migration and behavioral/distributional changes
tend to produce inter-annual catchability fluctuations. One would expect catchability to be
influenced by a large number of these factors, each of which may well be independent and
have a multiplicative effect. The central limit theorem implies that the sum of the logarithms
of the magnitudes of these factors approaches a normal distribution, and therefore taking
logarithms is the most appropriate transformation to use in the objective function.
The minimization procedure AMOEBA (Numerical Methods, Cambridge 1988) was
used to find the parameter values which would provide the best fit. In order to be
consistent with previous applications (Hutton 1992) of this method the Beverton-Holt form
of the stock-recruitment relationship was used. In the model, q and the parameters of the
stock-recruitment relationship (α and β for the Beverton-Holt relationship) were estimated.
3.2 The bio-economic model
3.2.1 Calculating the NPV
Those in decision-making positions often require that analyses are translated directly into
economic values. Estimates of yield are obtained from the biological model. Prices and
costs per unit weight of fish landed are applied to the estimates of yield in order to obtain
profit (rent) under alternative scenarios. The total long term benefits (that is, the sum of
No 1, 2002
23
predicted rent per year over the time horizon of the analysis) under alternative scenarios of
resource exploitation can be calculated by computing the Net Present Value (NPV) of the
stream of benefits over time. This would provide as with the equivalent of a monetary flow
account as here we assume that cost is the sum of all the costs to the producer (for example
intermediate consumption, compensation to employees, depreciation of capital, return on
investment). The NPV depends on the discount rate (δ), which captures both society’s
time preference for consumption and the opportunity cost of capital. Total discounted net
present value (NPV, that is the long term benefits) can be calculated over a set period of
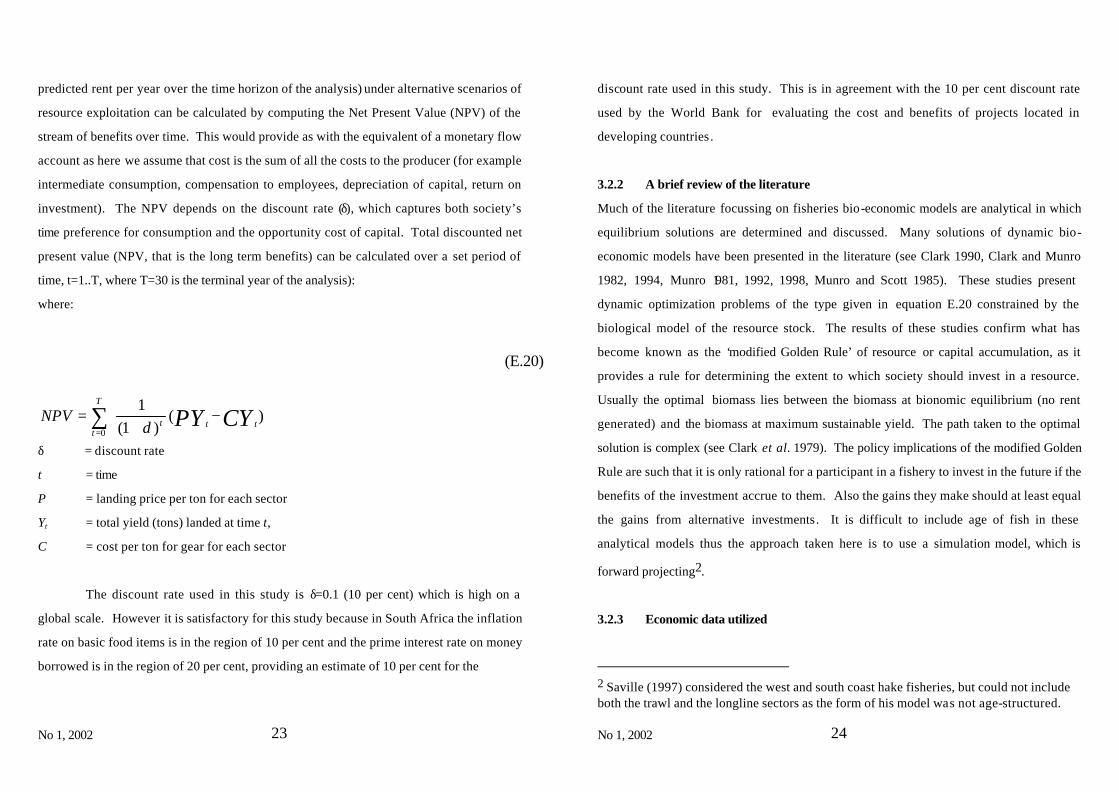
time, t=1..T, where T=30 is the terminal year of the analysis):
where:
δ = discount rate
t = time
P = landing price per ton for each sector
Yt = total yield (tons) landed at time t,
C = cost per ton for gear for each sector
The discount rate used in this study is δ=0.1 (10 per cent) which is high on a
global scale. However it is satisfactory for this study because in South Africa the inflation
rate on basic food items is in the region of 10 per cent and the prime interest rate on money
borrowed is in the region of 20 per cent, providing an estimate of 10 per cent for the
(E.20)
∑=
−
+=
T
tttt CYPYNPV
0
)()1(
1δ
No 1, 2002
24
discount rate used in this study. This is in agreement with the 10 per cent discount rate
used by the World Bank for evaluating the cost and benefits of projects located in
developing countries.
3.2.2 A brief review of the literature
Much of the literature focussing on fisheries bio-economic models are analytical in which
equilibrium solutions are determined and discussed. Many solutions of dynamic bio-
economic models have been presented in the literature (see Clark 1990, Clark and Munro
1982, 1994, Munro 1981, 1992, 1998, Munro and Scott 1985). These studies present
dynamic optimization problems of the type given in equation E.20 constrained by the
biological model of the resource stock. The results of these studies confirm what has
become known as the ‘modified Golden Rule’ of resource or capital accumulation, as it
provides a rule for determining the extent to which society should invest in a resource.
Usually the optimal biomass lies between the biomass at bionomic equilibrium (no rent
generated) and the biomass at maximum sustainable yield. The path taken to the optimal
solution is complex (see Clark et al. 1979). The policy implications of the modified Golden
Rule are such that it is only rational for a participant in a fishery to invest in the future if the
benefits of the investment accrue to them. Also the gains they make should at least equal
the gains from alternative investments. It is difficult to include age of fish in these
analytical models thus the approach taken here is to use a simulation model, which is
forward projecting2.
3.2.3 Economic data utilized
2 Saville (1997) considered the west and south coast hake fisheries, but could not include both the trawl and the longline sectors as the form of his model was not age-structured.
No 1, 2002
25
Obtaining cost data and particularly the short run cost data (marginal and average) can be
problematic. In South Africa it is difficult to obtain cost relationships considering the
paucity of information from the demersal trawl sector, since the various companies make
every effort to remain competitive. Companies do not readily publish their cost information
(Saville 1997). It is easier to obtain cost data from the longline sector as they have made
numerous submissions to the government requesting larger quota shares based on
economic factors. In practice it is possible to present short-run cost data as the fixed costs
plus variable costs of vessels and obtain short-run fleet cost data by aggregating short-run
vessel cost data (see Doll 1988). Based on the latter method, Sumaila (1995) presents a cost
function for each vessel, which even though for most practical purposes is linear in effort
includes a parameter (b=0.01). The introduction of this parameter in the cost function
ensures strict concavity of individual profits as a function of individual effort. However in
fisheries models a special case exists as the long run fleet cost data is required for
simulations of alternative harvest strategies (Doll 1988).
One of the first attempts, to obtain reliable economic data for both the longline
and trawl sector, was made during the Longline Experiment which began in 1993, when
3000t were allocated to the longliners. Data were collected in 1995, 1996 and 1997 (that is
three consecutive years).
The economic data from the Longline Experiment consisted of:
• Sales price per kilogram hake caught;
• Landing cost per kilogram hake caught;
• Total cost per kilogram hake caught;
• Net income before interest and tax per kilogram hake caught;
• Return before interest & taxation on capital investment.
However the reliability of the data collected during the Longline Experiment (see
Anon 1998) can be questioned because of the high confidence intervals. At that time
No 1, 2002
26
(average data for 1995-1997), the cost for landing a kilogram of hake by the longline fleet
was R5.75 and the cost for landing a kg. of hake by the trawl fleet was R5.00 (Anon 1998).
The average price paid for longline landings was R8.50 R/kg and the price paid for trawl
landings was R6.75 R/kg (Anon 1998).
Short-run cost data
The assumption that short-run marginal cost is equal to the average cost for longlining is
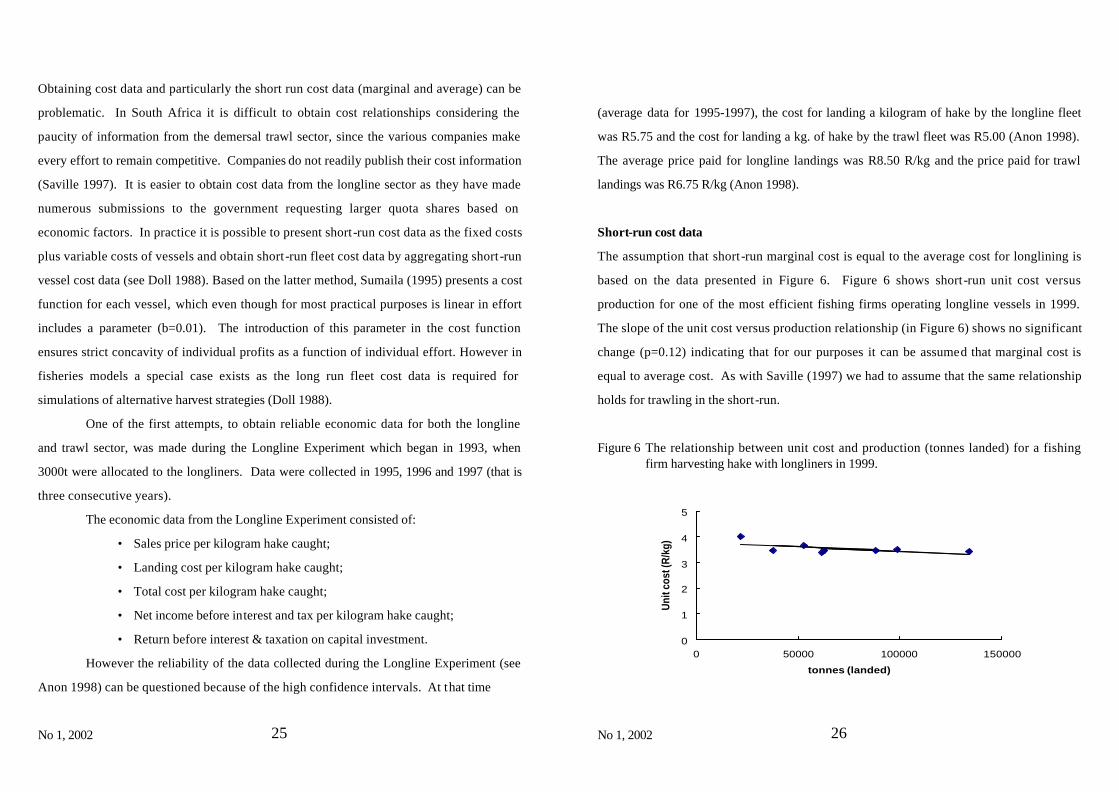
based on the data presented in Figure 6. Figure 6 shows short-run unit cost versus
production for one of the most efficient fishing firms operating longline vessels in 1999.
The slope of the unit cost versus production relationship (in Figure 6) shows no significant
change (p=0.12) indicating that for our purposes it can be assumed that marginal cost is
equal to average cost. As with Saville (1997) we had to assume that the same relationship
holds for trawling in the short-run.
Figure 6 The relationship between unit cost and production (tonnes landed) for a fishing firm harvesting hake with longliners in 1999.
0
1
2
3
4
5
0 50000 100000 150000
tonnes (landed)U
nit c
ost (
R/k
g)
No 1, 2002
27
Obtaining data from the trawl sector is always problematic because of the
extremely low level of disclosure by the industry. However we were provided with an
estimate for the cost of fishing effort from the industry (from one the two largest
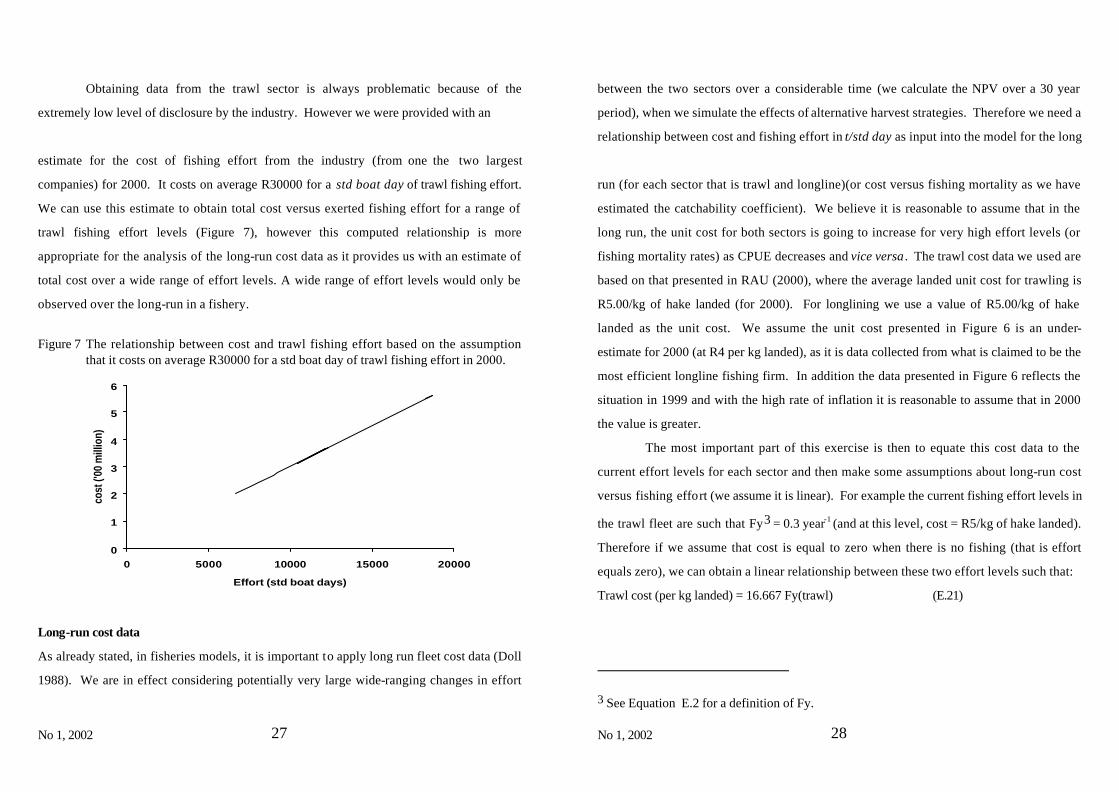
companies) for 2000. It costs on average R30000 for a std boat day of trawl fishing effort.
We can use this estimate to obtain total cost versus exerted fishing effort for a range of
trawl fishing effort levels (Figure 7), however this computed relationship is more
appropriate for the analysis of the long-run cost data as it provides us with an estimate of
total cost over a wide range of effort levels. A wide range of effort levels would only be
observed over the long-run in a fishery.
Figure 7 The relationship between cost and trawl fishing effort based on the assumption
that it costs on average R30000 for a std boat day of trawl fishing effort in 2000.
0
1
2
3
4
5
6
0 5000 10000 15000 20000
Effort (std boat days)
cost
('00
mill
ion)
Long-run cost data
As already stated, in fisheries models, it is important to apply long run fleet cost data (Doll
1988). We are in effect considering potentially very large wide-ranging changes in effort
No 1, 2002
28
between the two sectors over a considerable time (we calculate the NPV over a 30 year
period), when we simulate the effects of alternative harvest strategies. Therefore we need a
relationship between cost and fishing effort in t/std day as input into the model for the long
run (for each sector that is trawl and longline)(or cost versus fishing mortality as we have
estimated the catchability coefficient). We believe it is reasonable to assume that in the
long run, the unit cost for both sectors is going to increase for very high effort levels (or
fishing mortality rates) as CPUE decreases and vice versa . The trawl cost data we used are
based on that presented in RAU (2000), where the average landed unit cost for trawling is
R5.00/kg of hake landed (for 2000). For longlining we use a value of R5.00/kg of hake
landed as the unit cost. We assume the unit cost presented in Figure 6 is an under-
estimate for 2000 (at R4 per kg landed), as it is data collected from what is claimed to be the
most efficient longline fishing firm. In addition the data presented in Figure 6 reflects the
situation in 1999 and with the high rate of inflation it is reasonable to assume that in 2000
the value is greater.
The most important part of this exercise is then to equate this cost data to the
current effort levels for each sector and then make some assumptions about long-run cost
versus fishing effort (we assume it is linear). For example the current fishing effort levels in
the trawl fleet are such that Fy3 = 0.3 year-1 (and at this level, cost = R5/kg of hake landed).
Therefore if we assume that cost is equal to zero when there is no fishing (that is effort
equals zero), we can obtain a linear relationship between these two effort levels such that:
Trawl cost (per kg landed) = 16.667 Fy(trawl) (E.21)
3 See Equation E.2 for a definition of Fy.
No 1, 2002
29
Note that in this case we relate cost to fishing mortality, but as stated before
fishing mortality is correlated with fishing effort if we assume q is constant. Furthermore
for longlining the same exercise can be carried out. The current fishing effort levels are
such that Fy = 0.05 year-1 for longline caught hake (and cost is equal to R5/kg of hake
landed). Thus using the same arguments as presented above we obtain a relationship such
that:
Longline cost (per kg landed) = 100 Fy(longline) (E.22)
This does not directly imply that the cost of longlining is greater than trawling as
Fy (trawl) is not equal to Fy (longline), because of the large difference in the selectivity of
the gear. In fact, with the same Fy the trawl fleet lands more hake. Hence the cost of
fishing effort in the longline fleet is less than fishing effort in the trawl fleet for the same Fy,
remembering that the relationship between Fy and fishing effort for each fleet is not the
same.
The final process in this procedure is to verify whether the above assumptions
and parameter estimates provide us with the long-run fleet cost data, that is, total cost
versus fishing effort. The total cost versus fishing effort is computed by multiplying the
unit cost at a particular level of Fy by the yield obtainable at Fy (in this case for the trawl
fleet).
Since, we assume q is constant and fishing effort is equal to Fy/q, we can plot the resultant
total cost versus trawl effort (a function which is a by-product of the parameter estimates,
the various stated assumptions and the dynamics of the model). The relationship is shown
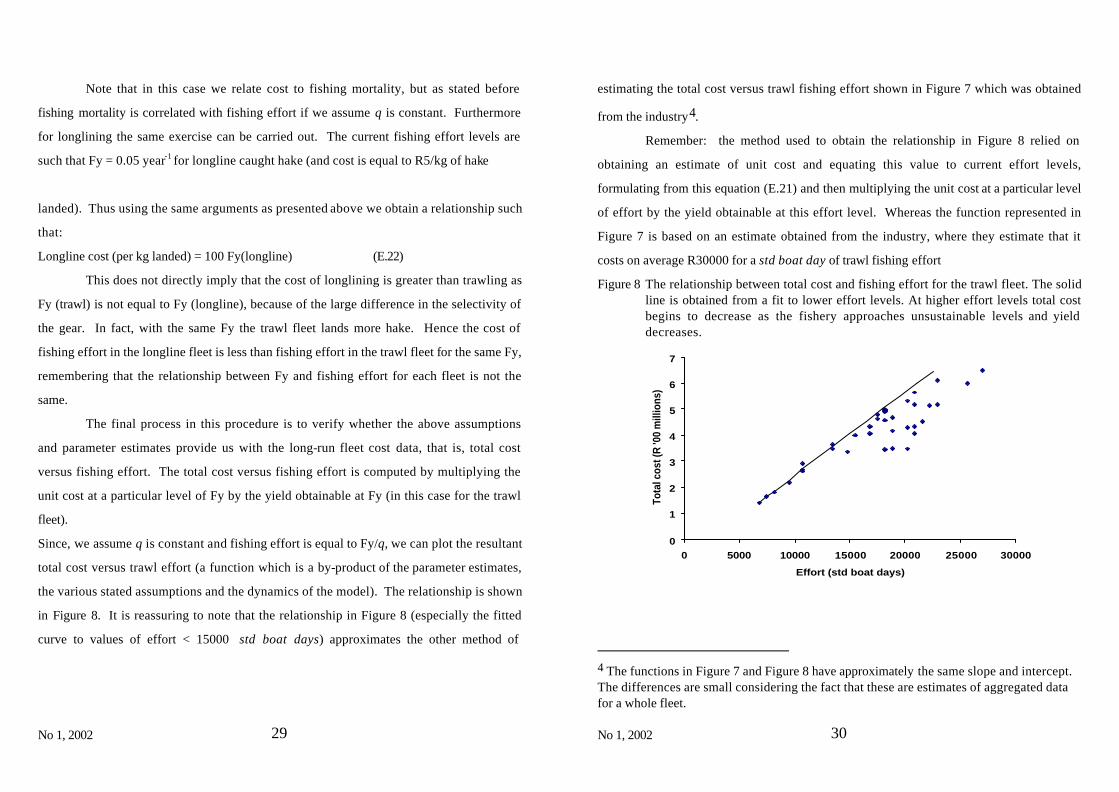
in Figure 8. It is reassuring to note that the relationship in Figure 8 (especially the fitted
curve to values of effort < 15000 std boat days) approximates the other method of
No 1, 2002
30
estimating the total cost versus trawl fishing effort shown in Figure 7 which was obtained
from the industry4.
Remember: the method used to obtain the relationship in Figure 8 relied on
obtaining an estimate of unit cost and equating this value to current effort levels,
formulating from this equation (E.21) and then multiplying the unit cost at a particular level
of effort by the yield obtainable at this effort level. Whereas the function represented in
Figure 7 is based on an estimate obtained from the industry, where they estimate that it
costs on average R30000 for a std boat day of trawl fishing effort
Figure 8 The relationship between total cost and fishing effort for the trawl fleet. The solid line is obtained from a fit to lower effort levels. At higher effort levels total cost begins to decrease as the fishery approaches unsustainable levels and yield decreases.
0
1
2
3
4
5
6
7
0 5000 10000 15000 20000 25000 30000
Effort (std boat days)
Tota
l cos
t (R
'00
mill
ions
)
4 The functions in Figure 7 and Figure 8 have approximately the same slope and intercept. The differences are small considering the fact that these are estimates of aggregated data for a whole fleet.
No 1, 2002
31
It is pertinent to observe that for high effort levels (> 15000t per std boat day),
which are not sustainable in the long term, the total cost values are lower than the assumed
linear relationship which exists at low effort levels (< 15000 std boat days)(Figure 8). The
reason is because at high effort levels the stock is being over-exploited at non-sustainable
levels and yield is decreasing. A similar relationship between total cost and effort is
assumed to exist for the longline fleet in our model as we have made similar assumptions
with regard to all the functions, although the parameters and the values for the total costs
differ.
Price data
Constant year 2000 prices were assumed when we project forward and calculate the NPV.
The price data for each sector were obtained from RAU (2000). The price paid for trawl
caught hake is R10/kg (wholesale). For longline caught hake the price is R30/kg (wholesale)
when the market (in Spain) is not affected by imports of hake from other regions like South
America. For example in July 2000 the price fell to very low levels and at one stage it was
not worth exporting longline caught hake (that is for export hake the price was R0/kg).
Therefore, in this model we use a price of R15/kg for longline hake, as this price
approximates the R14/kg estimate for average landed price in South Africa (RAU 2000).
No 1, 2002
32
4. PREDICTING GAME THEORETIC OUTCOMES
Game theoretic modelling allows for the analysis of strategic interaction between agents
(Osborne and Ruberstein 1994). As more than one agent typically has property rights to
fisheries, game theoretic-modelling has been used to study non-cooperative and co-
operative outcomes between agents within alternative fisheries management systems and
property rights regimes (Ostrom et al. 1997). A review of game-theoretic models of fishing
has been undertaken by Sumaila (1999) who notes that only a few attempts have been
made to develop empirical game theoretic model of fisheries5.
4.1 Using non-cooperative game theory
In many fisheries specific rules for allocation of the TAC do not exist for scarce resources,
thus fishing units compete for access. The outcome of this competition is often negative
leading to overfishing, overcapitalization, rent dissipation and conflict between interest
groups, whose objective is to maximize own private benefits without due regard to the
consequences of their actions on the payoffs of other players. Non-cooperative game
theory (Nash 1951) allows us to consider the equilibrium outcomes of this competition.
Cooperative strategies are used interchangeably with co-operative management
throughout this paper. This is realistic considering that co-operative management is only
possible if participants are willing to engage in binding agreements implying they will
behave in a cooperative fashion. Fishers will not enter agreements or obey regulations if
the benefits of non-cooperation they receive are much greater than benefits of cooperation.
5 Game theory has been applied to virtually all areas of economics and there is an increase in the number of studies (see references in Sumaila 1999). The contributions in Weintraub (1992) consider the history of game theory based on the classic work of von Neumann and Morgenstern (1944).
No 1, 2002
33
The aim of this study is to isolate the negative effects of non-cooperative strategies. This
follows from the argument presented by Nash (1951, page 295): "The writer has developed
a dynamical approach to the study of co-operative games based upon a reduction to non-
cooperative form". The approach is thus similar to that applied in Sumalia (1995)6.
Thus the approach of this paper is to assume that binding agreements are not
feasible at this stage7. For example in South Africa various interests are in a real
competitive situation for rights to the resource. The aim is to isolate the negative effects of
non-cooperation (for example biological) and evaluate whether there are economic
incentives for non-cooperation or not. This method is presented in Clark (1981, 1990) and
for the sake of simplicity the computation is open-loop. Clark's (1981) terminology of
‘deplete = non-cooperative’ and ‘not-deplete = co-operative’ is used in this paper. The
loss in potential rent to the government needs to be quantified assuming the government
does not facilitate binding agreements. It is postulated that in this situation the
government is not maximizing total benefits.
Within a non-cooperative game theoretic modelling approach, as in Sumaila
(1995), where he uses an algorithm to find a solution, the benefits to each player can be
generated. Under these conditions it is possible to compute the Nash equilibrium, which is
the outcome when each player seeks to maximize on their private own payoffs, given the
supposed actions of the others (Kreps 1990). In this paper we consider the effects of non-
cooperative behaviour and therefore compute the difference in the outcomes between
6 Hart (1998) considers the characteristics required for fishers to cooperate in the south Devon inshore fishery after reflecting on the ‘Prisoner’s Dilemma’. (as named by Albert Tucker in an unpublished paper - see references in Rasmusen 1995). 7 Thus the aim is not to apply a cooperative game theoretic analysis as in other studies which assume the establishment of binding agreements is feasible (see Amstrong and
No 1, 2002
34
potential co-operative strategies and existing non-cooperative strategies (defined in each
case depending on the status of the stock). In this case the payoffs to each player, as well
as the total payoffs, are revealed. Thus it is possible to generate the total NPV of economic
rent and estimate the maximum value (graphically in this case as the model is not of an
analytical form as in Sumaila 1995).
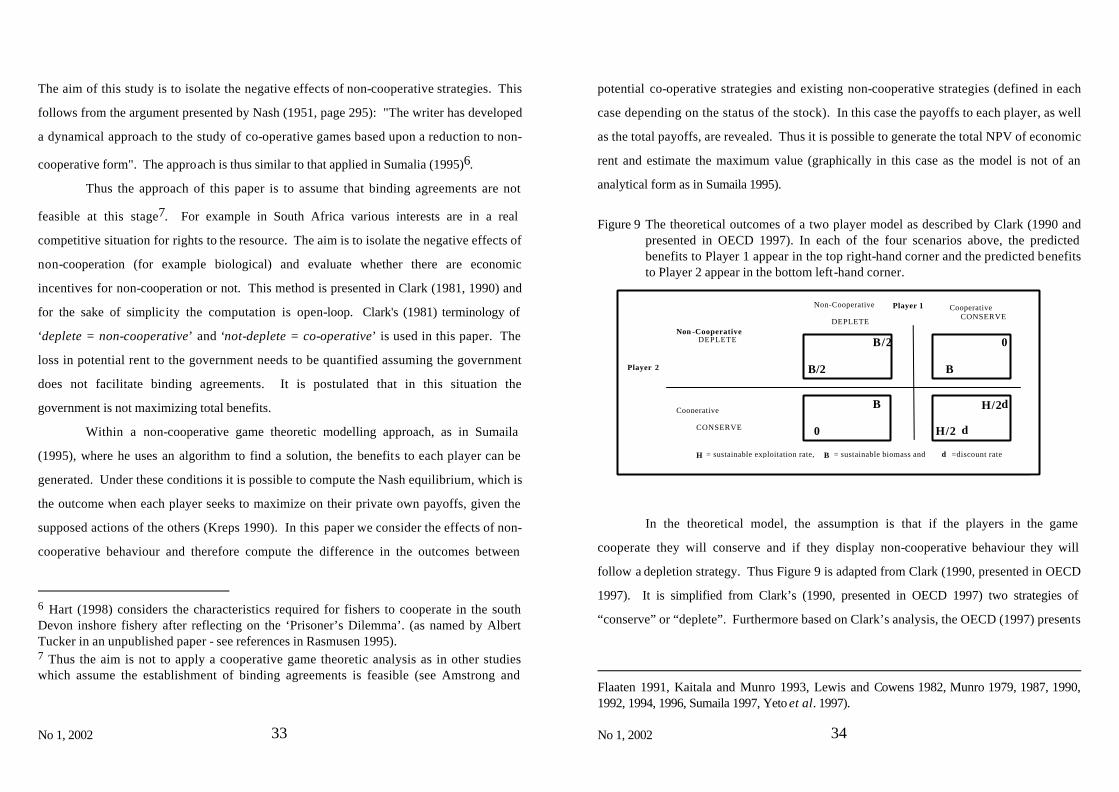
Figure 9 The theoretical outcomes of a two player model as described by Clark (1990 and
presented in OECD 1997). In each of the four scenarios above, the predicted benefits to Player 1 appear in the top right-hand corner and the predicted benefits to Player 2 appear in the bottom left-hand corner.
B/2
B/2
0
B
H/2δδδ
H/2 δ
B
0
Cooperative
CONSERVE
Cooperative CONSERVE
Non-Cooperative
DEPLETE
H = sustainable exploitation rate, B = sustainable biomass and δ
Non -Cooperative DEPLETE
=discount rate
Player 2
Player 1
In the theoretical model, the assumption is that if the players in the game
cooperate they will conserve and if they display non-cooperative behaviour they will
follow a depletion strategy. Thus Figure 9 is adapted from Clark (1990, presented in OECD
1997). It is simplified from Clark’s (1990, presented in OECD 1997) two strategies of
“conserve” or “deplete”. Furthermore based on Clark’s analysis, the OECD (1997) presents
Flaaten 1991, Kaitala and Munro 1993, Lewis and Cowens 1982, Munro 1979, 1987, 1990, 1992, 1994, 1996, Sumaila 1997, Yeto et al. 1997).
No 1, 2002
35
two cases: (1) where the discount rate (δ) is large and larger payoffs are obtained from
depletion or not cooperating even if others do or (2) there is an incentive to cooperate and
conserve (the discount rates are low and there are only a few players). However if the
number of players (N) is large then each one receives a payoff of H/δ*N. A “cheater” then
receives a much larger share of B, than if he/she cooperates. Thus there are huge
incentives to cheat as the number of players becomes large.
We assume that fishing companies that target hake will not enter agreements if
the benefits of non cooperation to them are greater than the benefits to them from
cooperation. The assumptions are that under the current re-structuring, the assumed non-
cooperative
strategy by the trawl sector will be to maintain fishing effort at its current levels (F= 0.3
year-1), and the assumed cooperative strategy will be to reduce fishing effort (F = 0.2 year-
1). In 1998 after extensive negotiations the trawl sector accepted a reduction in their quota
of 8000 t (which equates approximately to the latter effort reductions, that is F is reduced
by 0.05 year-1). For the Longline sector the non-cooperative strategy will be to increase F
beyond their current quota limits (for example, F= 0.08 year-1), whereas a cooperative
strategy will be to maintain their effort at the level required to meet their current quota
(which equates approximately to the longline sector effort being F = 0.05 year-1). It should
be noted that over the last five years participants have made numerous requests for an
increase in their share of the total TAC.
No 1, 2002
36
5. RESULTS
5.1 Physical flow accounts: the biological model results
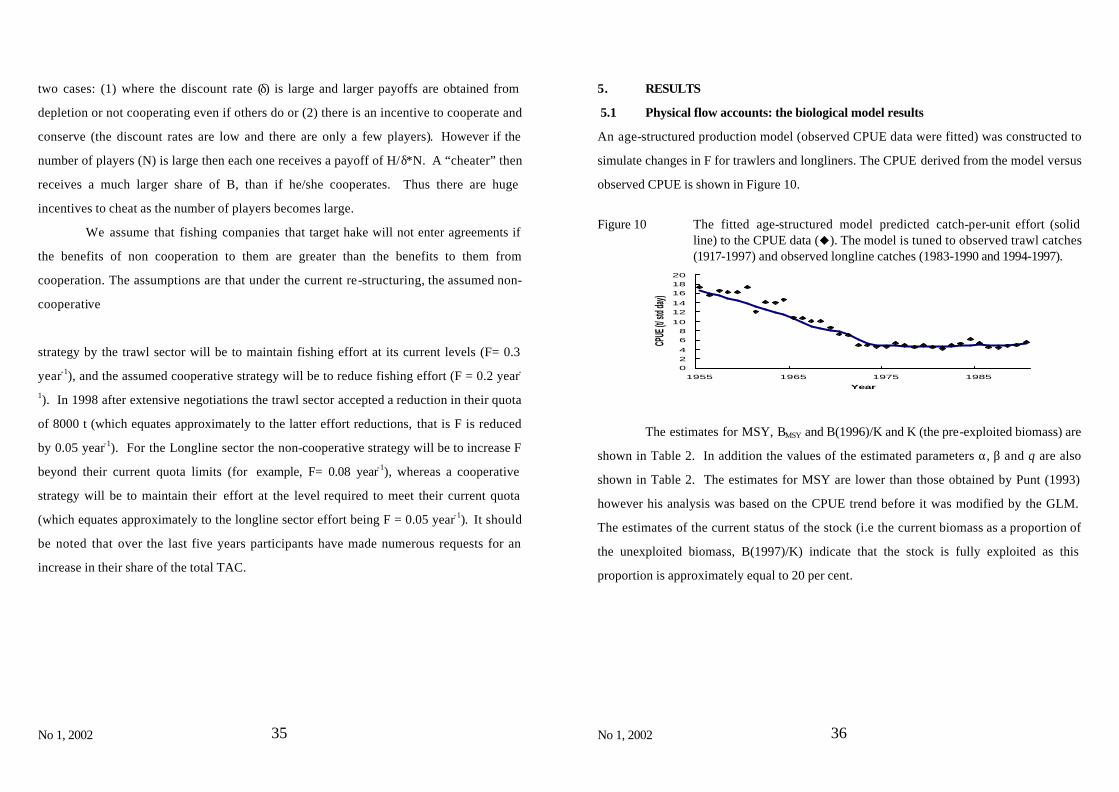
An age-structured production model (observed CPUE data were fitted) was constructed to
simulate changes in F for trawlers and longliners. The CPUE derived from the model versus
observed CPUE is shown in Figure 10. Figure 10 The fitted age-structured model predicted catch-per-unit effort (solid
line) to the CPUE data (u). The model is tuned to observed trawl catches (1917-1997) and observed longline catches (1983-1990 and 1994-1997).
024
68
10
1214
161820
1955 1965 1975 1985
Year
CPUE
(t/ st
d day)
The estimates for MSY, BMSY and B(1996)/K and K (the pre-exploited biomass) are
shown in Table 2. In addition the values of the estimated parameters α, β and q are also
shown in Table 2. The estimates for MSY are lower than those obtained by Punt (1993)
however his analysis was based on the CPUE trend before it was modified by the GLM.
The estimates of the current status of the stock (i.e the current biomass as a proportion of
the unexploited biomass, B(1997)/K) indicate that the stock is fully exploited as this
proportion is approximately equal to 20 per cent.
No 1, 2002
37
Table 2 Estimates for MSY, BMSY and B(1997)/K and K (the pre-exploited biomass). The values of the estimated parameters α, β and q are also shown. Biomass units are in ‘000 tonnes.
Parameter Estimate
MSY 105.65
BMSY 1021.79
B(1997)/K 0.2081
K 1917.60
α 1.34 x 10⁹
β 6.36 x 10¹¹
q 1.11 x 10⁻¹¹
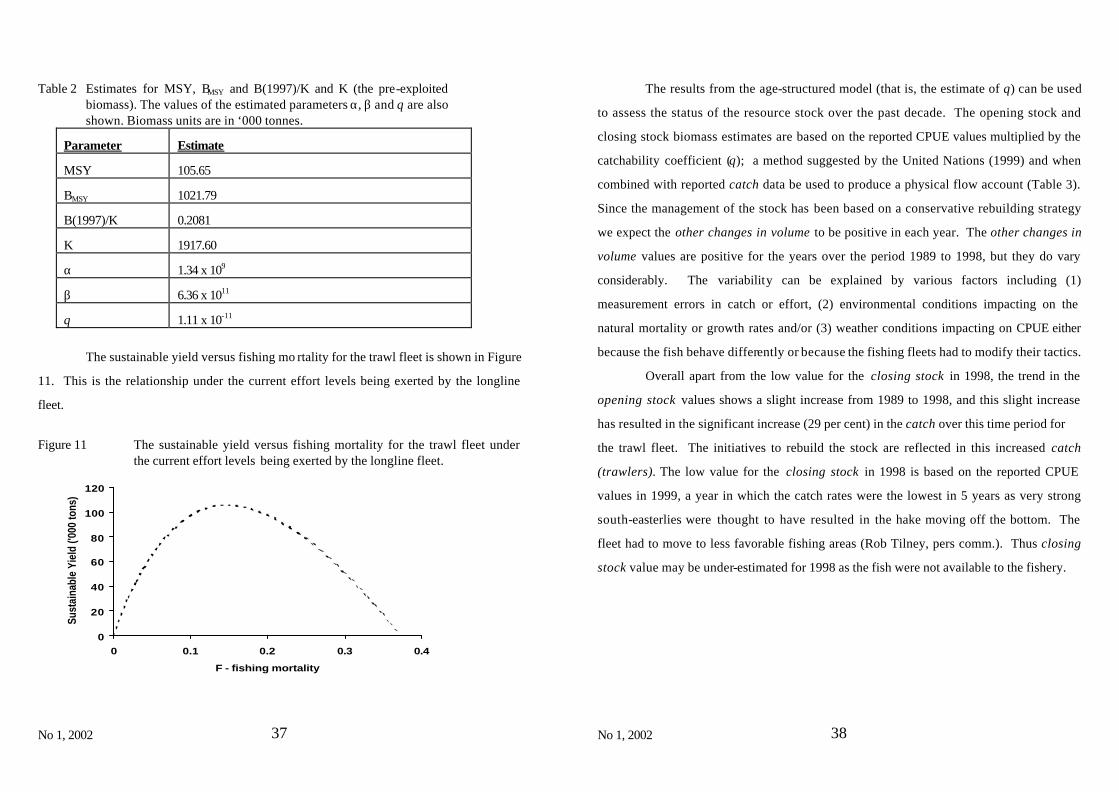
The sustainable yield versus fishing mo rtality for the trawl fleet is shown in Figure
11. This is the relationship under the current effort levels being exerted by the longline
fleet.
Figure 11 The sustainable yield versus fishing mortality for the trawl fleet under
the current effort levels being exerted by the longline fleet.
0
20
40
60
80
100
120
0 0.1 0.2 0.3 0.4
F - fishing mortality
Sust
aina
ble
Yiel
d ('0
00 to
ns)
No 1, 2002
38
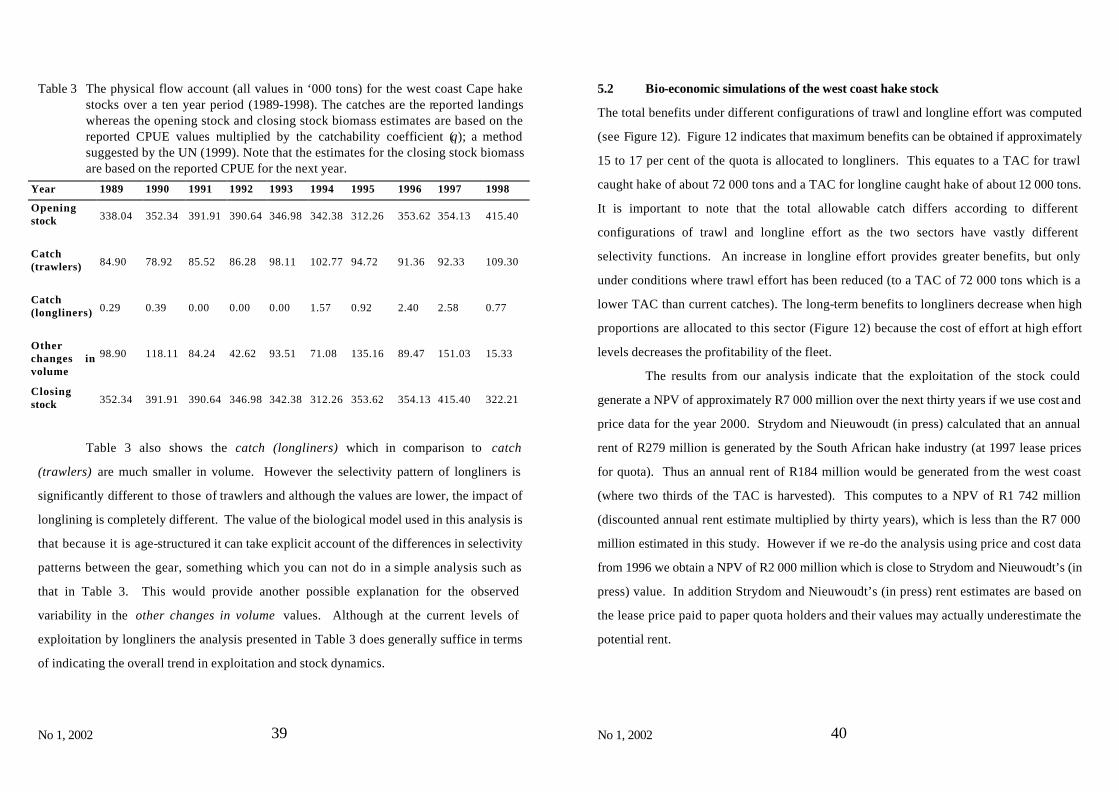
The results from the age-structured model (that is, the estimate of q) can be used
to assess the status of the resource stock over the past decade. The opening stock and
closing stock biomass estimates are based on the reported CPUE values multiplied by the
catchability coefficient (q); a method suggested by the United Nations (1999) and when
combined with reported catch data be used to produce a physical flow account (Table 3).
Since the management of the stock has been based on a conservative rebuilding strategy
we expect the other changes in volume to be positive in each year. The other changes in
volume values are positive for the years over the period 1989 to 1998, but they do vary
considerably. The variability can be explained by various factors including (1)
measurement errors in catch or effort, (2) environmental conditions impacting on the
natural mortality or growth rates and/or (3) weather conditions impacting on CPUE either
because the fish behave differently or because the fishing fleets had to modify their tactics.
Overall apart from the low value for the closing stock in 1998, the trend in the
opening stock values shows a slight increase from 1989 to 1998, and this slight increase
has resulted in the significant increase (29 per cent) in the catch over this time period for
the trawl fleet. The initiatives to rebuild the stock are reflected in this increased catch
(trawlers). The low value for the closing stock in 1998 is based on the reported CPUE
values in 1999, a year in which the catch rates were the lowest in 5 years as very strong
south-easterlies were thought to have resulted in the hake moving off the bottom. The
fleet had to move to less favorable fishing areas (Rob Tilney, pers comm.). Thus closing
stock value may be under-estimated for 1998 as the fish were not available to the fishery.
No 1, 2002
39
Table 3 The physical flow account (all values in ‘000 tons) for the west coast Cape hake stocks over a ten year period (1989-1998). The catches are the reported landings whereas the opening stock and closing stock biomass estimates are based on the reported CPUE values multiplied by the catchability coefficient (q); a method suggested by the UN (1999). Note that the estimates for the closing stock biomass are based on the reported CPUE for the next year.
Table 3 also shows the catch (longliners) which in comparison to catch
(trawlers) are much smaller in volume. However the selectivity pattern of longliners is
significantly different to those of trawlers and although the values are lower, the impact of
longlining is completely different. The value of the biological model used in this analysis is
that because it is age-structured it can take explicit account of the differences in selectivity
patterns between the gear, something which you can not do in a simple analysis such as
that in Table 3. This would provide another possible explanation for the observed
variability in the other changes in volume values. Although at the current levels of
exploitation by longliners the analysis presented in Table 3 does generally suffice in terms
of indicating the overall trend in exploitation and stock dynamics.
Year 1989 1990 1991 1992 1993 1994 1995 1996 1997 1998
Opening stock 338.04 352.34 391.91 390.64 346.98 342.38 312.26 353.62 354.13 415.40
Catch (trawlers) 84.90 78.92 85.52 86.28 98.11 102.77 94.72 91.36 92.33 109.30
Catch (longliners) 0.29 0.39 0.00 0.00 0.00 1.57 0.92 2.40 2.58 0.77
Other changes in volume
98.90 118.11 84.24 42.62 93.51 71.08 135.16 89.47 151.03 15.33
Closing stock 352.34 391.91 390.64 346.98 342.38 312.26 353.62 354.13 415.40 322.21
No 1, 2002
40
5.2 Bio-economic simulations of the west coast hake stock
The total benefits under different configurations of trawl and longline effort was computed
(see Figure 12). Figure 12 indicates that maximum benefits can be obtained if approximately
15 to 17 per cent of the quota is allocated to longliners. This equates to a TAC for trawl
caught hake of about 72 000 tons and a TAC for longline caught hake of about 12 000 tons.
It is important to note that the total allowable catch differs according to different
configurations of trawl and longline effort as the two sectors have vastly different
selectivity functions. An increase in longline effort provides greater benefits, but only
under conditions where trawl effort has been reduced (to a TAC of 72 000 tons which is a
lower TAC than current catches). The long-term benefits to longliners decrease when high
proportions are allocated to this sector (Figure 12) because the cost of effort at high effort
levels decreases the profitability of the fleet.
The results from our analysis indicate that the exploitation of the stock could
generate a NPV of approximately R7 000 million over the next thirty years if we use cost and
price data for the year 2000. Strydom and Nieuwoudt (in press) calculated that an annual
rent of R279 million is generated by the South African hake industry (at 1997 lease prices
for quota). Thus an annual rent of R184 million would be generated from the west coast
(where two thirds of the TAC is harvested). This computes to a NPV of R1 742 million
(discounted annual rent estimate multiplied by thirty years), which is less than the R7 000
million estimated in this study. However if we re-do the analysis using price and cost data
from 1996 we obtain a NPV of R2 000 million which is close to Strydom and Nieuwoudt’s (in
press) value. In addition Strydom and Nieuwoudt’s (in press) rent estimates are based on
the lease price paid to paper quota holders and their values may actually underestimate the
potential rent.
No 1, 2002
41
Figure 12 The relationship between total benefit (NPV - Rands millions), and benefit to the trawl sector and longline sector and the proportion of the quota allocated to the longline sector. The relationship is based on an increasing cost function relative to fishing effort.
0
1 0 0 0
2 0 0 0
3 0 0 0
4 0 0 0
5 0 0 0
6 0 0 0
7 0 0 0 8 0 0 0
0 0.1 0.2 0 . 3 0 . 4 0.5 0.6
P r o p o r t i o n t o l o n g l i n e r s
Ben
efit
(N
PV
- R
mill
ions
)
T r a w l
L o n g l i n e
T o t a l
The greatest benefits to the trawl sector can be obtained if there is a reduction in fishing
effort (from F=0.3 to F=0.2 year-1) under an assumed cooperative strategy (Figure 13). A
difference in profit of R1357 million can be obtained under cooperative strategies versus
non-cooperative strategies (for the trawl sector). Thus a cooperative management strategy
still remains the best strategy as far as the trawl sector is concerned. The greatest benefits
(a difference of R50 million over 30 years) accrues to the longliners if they engage in a non-
cooperative strategy and increase F, however these benefits are only achieved if the trawl
sector reduces effort (Figure 13). This benefit may be explained as the cost of enforcement
the government would have to incur if the policy goal is to maintain longliners at their
current effort levels.
No 1, 2002
42
Figure 13 Benefits to the trawl sector and longline sector under different scenarios of non-cooperative and cooperative strategies for the West Coast Deep-Sea Hake fishery. The CPUE (t/ std day) after a 30-year period are also shown for each scenario in order to indicate the status of the resource.
Longliners
Trawl = R3876 million Total = R4702 million
(CPUE = 1.31)
Longliners = R825 million
Trawl = R3599 million Total = R4340 million
(CPUE = 1.01)
Longliners = R741 million
Trawl = R4967 million
Total = R6340 million (CPUE = 3.80)
Longliners = R1372* million
Trawl = R5233 #
million
Total = R6555 million (CPUE = 4.26)
Longliners = R1322 million
Non-cooperative
Cooperative
Non- cooperative
Trawlers
Cooperative
# - Greatest benefits to trawl sector if reduce F (from F=0.3 to F=0.2), reduce quota by 10 000tons.
* Greatest benefits to longliners if they increase F, but benefits are only available if trawl sector reduces effort.
The CPUE which is a reflection of stock status shows a slight decline in this scenario
Assumptions Trawl sector non-cooperative strategy: F= 0.3
Trawl sector cooperativestrategy: F = 0.2
Longline sector non-cooperative strategy: F= 0.8 Longline sector cooperative strategy: F = 0.05
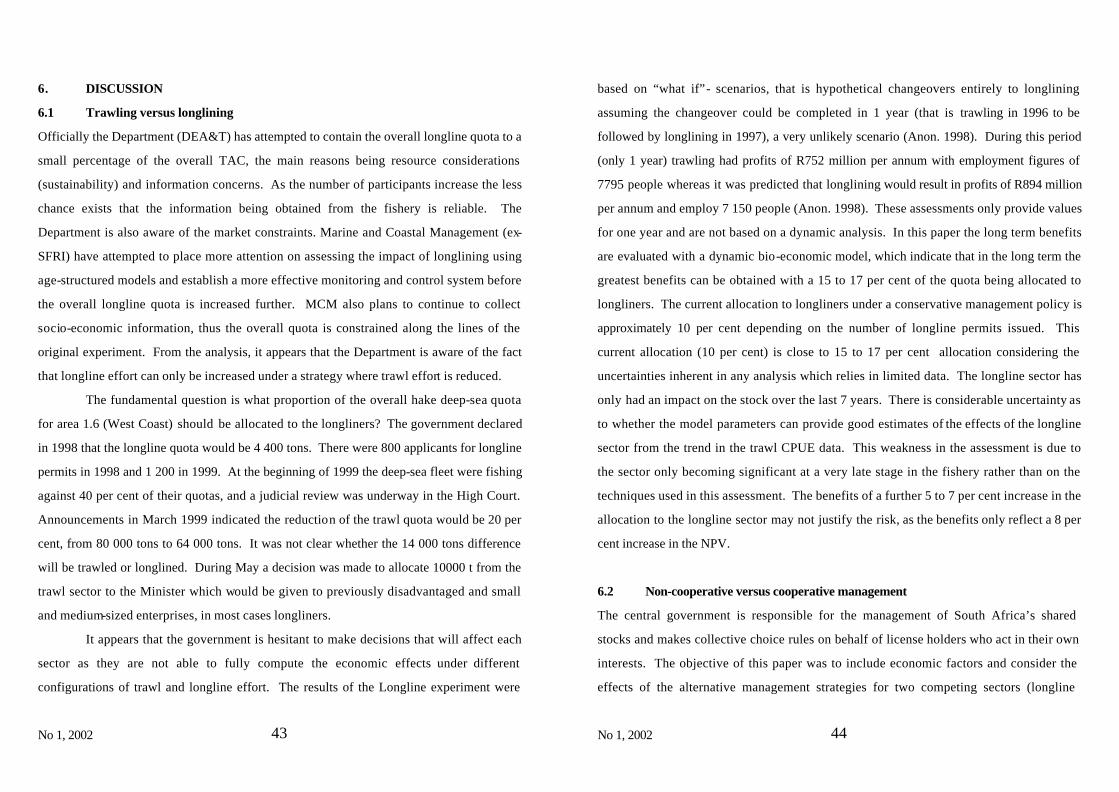
No 1, 2002
43
6. DISCUSSION
6.1 Trawling versus longlining
Officially the Department (DEA&T) has attempted to contain the overall longline quota to a
small percentage of the overall TAC, the main reasons being resource considerations
(sustainability) and information concerns. As the number of participants increase the less
chance exists that the information being obtained from the fishery is reliable. The
Department is also aware of the market constraints. Marine and Coastal Management (ex-
SFRI) have attempted to place more attention on assessing the impact of longlining using
age-structured models and establish a more effective monitoring and control system before
the overall longline quota is increased further. MCM also plans to continue to collect
socio-economic information, thus the overall quota is constrained along the lines of the
original experiment. From the analysis, it appears that the Department is aware of the fact
that longline effort can only be increased under a strategy where trawl effort is reduced.
The fundamental question is what proportion of the overall hake deep-sea quota
for area 1.6 (West Coast) should be allocated to the longliners? The government declared
in 1998 that the longline quota would be 4 400 tons. There were 800 applicants for longline
permits in 1998 and 1 200 in 1999. At the beginning of 1999 the deep-sea fleet were fishing
against 40 per cent of their quotas, and a judicial review was underway in the High Court.
Announcements in March 1999 indicated the reduction of the trawl quota would be 20 per
cent, from 80 000 tons to 64 000 tons. It was not clear whether the 14 000 tons difference
will be trawled or longlined. During May a decision was made to allocate 10000 t from the
trawl sector to the Minister which would be given to previously disadvantaged and small
and medium-sized enterprises, in most cases longliners.
It appears that the government is hesitant to make decisions that will affect each
sector as they are not able to fully compute the economic effects under different
configurations of trawl and longline effort. The results of the Longline experiment were
No 1, 2002
44
based on “what if”- scenarios, that is hypothetical changeovers entirely to longlining
assuming the changeover could be completed in 1 year (that is trawling in 1996 to be
followed by longlining in 1997), a very unlikely scenario (Anon. 1998). During this period
(only 1 year) trawling had profits of R752 million per annum with employment figures of
7795 people whereas it was predicted that longlining would result in profits of R894 million
per annum and employ 7 150 people (Anon. 1998). These assessments only provide values
for one year and are not based on a dynamic analysis. In this paper the long term benefits
are evaluated with a dynamic bio-economic model, which indicate that in the long term the
greatest benefits can be obtained with a 15 to 17 per cent of the quota being allocated to
longliners. The current allocation to longliners under a conservative management policy is
approximately 10 per cent depending on the number of longline permits issued. This
current allocation (10 per cent) is close to 15 to 17 per cent allocation considering the
uncertainties inherent in any analysis which relies in limited data. The longline sector has
only had an impact on the stock over the last 7 years. There is considerable uncertainty as
to whether the model parameters can provide good estimates of the effects of the longline
sector from the trend in the trawl CPUE data. This weakness in the assessment is due to
the sector only becoming significant at a very late stage in the fishery rather than on the
techniques used in this assessment. The benefits of a further 5 to 7 per cent increase in the
allocation to the longline sector may not justify the risk, as the benefits only reflect a 8 per
cent increase in the NPV.
6.2 Non-cooperative versus cooperative management
The central government is responsible for the management of South Africa’s shared
stocks and makes collective choice rules on behalf of license holders who act in their own
interests. The objective of this paper was to include economic factors and consider the
effects of the alternative management strategies for two competing sectors (longline
No 1, 2002
45
versus trawl). Game theoretic modeling was used to evaluate outcomes of assumed non-
cooperative versus cooperative management. The results show that the greatest benefits
to
the trawl sector occur if they reduce F under a cooperative strategy. An amount of R1 357
million is obtained if the trawl sector follows a cooperative strategy in the future (over the
next thirty years) and this strategy is not qualitatively sensitive to the discount rate.
However as the discount rate increases the benefits decrease quantitatively. In any event
a cooperative management strategy still remains the best strategy as far as the trawl sector
is concerned. The extensive government-industry (the trawl sector) commitments to
rebuilding has reversed the declining trends in CPUE observed in the 1960s and 1970s, and
it is beneficial as far as the trawl sector are concerned for them to engage in cooperative
strategies.
The government is redistributing quota to new entrants and previously
disadvantaged South Africans, resulting in competition between the established demersal
trawl fleet and a new longline sector for access rights. The greatest benefits (R50 million
over thirty years) accrues to the longliners if they engage in a non-cooperative strategy
and increase F, however these benefits are only achieved if the trawl sector reduces effort
(Figure 13). This benefit will be felt as the cost of enforcement the government would have
to spend if they wish to maintain longliners at their current effort levels. The current re-
structuring and institutional changes are thus impacting on the extensive interaction that
existed in the past between the industry and the government. The challenge in the future
is for the government to engage in co-management arrangements, which replicate the
successful agreements of the past with all the stakeholders; that is, both the established
industry and the new participants despite the fact that if new participants are longlining it
is beneficial for them to engage in non-cooperative strategies.
No 1, 2002
46
No 1, 2002
47
7. REFERENCES
Alfsen, K.H. 1996. Macroeconomics and the environment: Norwegian Experience. In: Macroeconomics and the environment. Ved. P. Gandhi (Ed.) International Monetary Fund. Pages: 165-186.
Amstrong, C. and O. Flaaten. 1991. The optimal management of a transboundary fish resource: the Arcto-Norwegian cod stock. In: Essays on the economics of migratory fish stocks. R. Arnason and T. Bjørndal (Eds.) Springer-Verlag, Berlin, pp 137-150.
Andrew, P.A. 1986. Dynamic catch-effort models for the southern African Hake populations. Rep. Benguela Ecol. Progm. S. Afr. 10: 248 pp.
Andrew, P.A. and Butterworth, D.S. 1987. Is f0.1 an appropriate harvesting strategy for the Cape hakes? In: The Benguela and Comparable Ecosystems. Payne A.I.L., Gulland J.A., and K.H. Brink (Eds). S. Afr. J. mar. Sci. 5: 925-935.
Andrew, P.A., Butterworth, D.S.and Punt, A.E. 1989. Analysis of the Cape hake stock in Division 1.6 using an extension of the Butterworth-Andrew estimation procedure which takes biomass surveys into account. Colln Scient. Pap. int. Commn SE. Atl. Fish ., 16(1): 15-30.
Anon, 1992. Exploitation if Demersal Resources Using Longlines, Handlines and the Interaction with Otter Trawl Fisheries. Demersal Working Group (DWG), Department of Environmental Affairs, Sea Fisheries Research Institute. Working Document: WG/02/92/D: H: 8.
Anon, 1993. Historical overview and scientific perspective of longlining in South Africa prepared by the Sea Fisheries Research Institute for the subcommittee of the SFAC on longlining for hake. Department of Environmental Affairs, Sea Fisheries Research Institute. Working Document: WG/02/93/D: H: 8.
Anon, 1995. Report of the Multi-disciplinary task group on the first phase of the longline experiment. Department of Environmental Affairs, Sea Fisheries Research Institute. Working Document: WG/010/95/D: H: 26.
Anon, 1998. Final Report. Socioeconomic Investigation of the Hake-directed Longline Experiment. The Multidisciplinary Task Group (MTG), Cape Town, March 1998.
Armstrong, M.A. and Japp, D.W. 1992. Longlining vs Otter trawling in the Hake fishery. Sea Fisheries Research Institute, WG/01/92/D:H:3, 11pp.
Badenhorst, A. 1995. Hake-directed Longline Experiment. Demersal Working Group (DWG), Department of Environmental Affairs, Sea Fisheries Research Institute. Working Document: WG/09/95/D: H: 15.
Bartelmus, P. 1996. Environmental accounting: a framework for assessment and policy integration. In: Macroeconomics and the environment. Ved. P. Gandhi (Ed.) International Monetary Fund. Pages: 107-135.
No 1, 2002
48
Beverton, R.J.H. and Holt, S.J. 1957. On the dynamics of exploited fish populations. U.K. Min. Agric. Fish Invest. (Ser. 2) 19: 533pp.
Bloem, A.M. and E. Weisman. 1996. National accounts and the environment. In: Macroeconomics and the environment. Ved. P. Gandhi (Ed.) International Monetary Fund. Pages: 136-150.
Botha, L. 1973. Migrations and spawning behaviour of the Cape hakes. S. Afr. Shipp. News Fish. Ind. Rev. 28(4): 62, 63, 65, 67.
Botha, L. 1980. The biology of the Cape Hakes Merluccius capensis Cast and M. paradoxus Franca in the Cape of Good Hope area. Ph.D. thesis, University of Stellenbosch: 182pp.
Butterworth, D.S., Punt, A.E. and R.B. Thomson 1992. The relative biological merits of trawl and longline fisheries for hake. Demersal Working Group (DWG), Department of Environmental Affairs, Sea Fisheries Research Institute. Working Document: WG/01/92/D: H: 25
Chalmers, D.S. 1976. Weight conversion factors, length/ weight relationships, and annual landings of the South Afircan trawl-caught fish. Fish. Bull. S. Afr. 8: 1-4.
Clark, C.W. 1981. Bioeconomics of the ocean. Bioscience 31: 231-237. Clark, C.W. 1990. Mathematical bioeconomics: the optimal management of renewable
resources. 2nd edition. John Wiley and Sons, Inc. Clark, C.W. and G.R. Munro. 1982. The economics of fishing and modern capital theory: a
simplified approach. In: Essays in the economics of renewable resources. L.J. Mirman and D.F. Spulber (Eds.). North-Holland Publishing Company, pp.: 31-54.
Clark, C.W. and G.R. Munro. 1994. Renewable resources as natural capital: the fishery. In: Investing in natural capital: the ecological economics approach to sustainability. AnnMari Jannsson (Ed.). Island Press, Washington, D.C. Press.
Clark, C.W., F.H. Clarke, and G.R. Munro. 1979. The optimal exploitation of renewable resource stocks: problems of irreversible investment. Econometrica, 47(1): 25-48.
Crawford, R.J.M., Shannon, L.V. and D.E. Pollock. 1987. The Benguela ecosystem 4. The major fish stocks and invertebrate resources. In: Oceanography and Marine Biology. An Annual Review 25. Barnes, M. (Ed.). Aberdeen; University Press: 353-505.
Crawford, R.J.M., Shannon, L.V. and D.E. Pollock. 1987. The Benguela ecosystem 4. The major fish stocks and invertebrate resources. In: Oceanography and Marine Biology. An Annual Review 25. Barnes, M. (Ed.). Aberdeen; University Press: 353-505.
Crowards, T.M. 1996. Natural resource accounting. Environmental and Resource Economics 7(3): 213-241.
Daly, H.E. 1996. Beyond growth: the economics of sustainable development. Beacon Press, Boston.
No 1, 2002
49
Dasgupta, P. and K-G. Mäler. 1999. Net national product and social well-being. The Beijer Institute Of Ecological Economics - The Royal Swedish Academy of Sciences. Paper No. 125.
Doll, J.P. 1988. Traditional economic models of fishing vessels: a review with discussion. Mar. Res. Econ., 5: 99-123.
El Serafy, S. and E. Lutz. 1989. Environmental and natural resource accounting. In: Environmental management and economic development. G. Schramm and J.J. Warford (Eds.). A World Bank Publication.
Fowkes, S. and Sowman, M. 1994. Proceeding of the Workshop on Hake Longlining experiment 23 and 24 February 1994. EEU Report Number 5/94/116.
Geromont, H., D. Butterworth, D.S., Japp, D. and R. Leslie 1995a. Preliminary Assessment of Longline Experiment West Coast Hake. Demersal Working Group (DWG), Department of Environmental Affairs, Sea Fisheries Research Institute. Working Document: WG/09/95/D: H: 15.
Geromont, H., D. Butterworth, D.S., Japp, D. and R. Leslie 1995b. Preliminary Assessment of Longline Experiment South Coast Hake. Demersal Working Group (DWG), Department of Environmental Affairs, Sea Fisheries Research Institute. Working Document: WG/11/95/D: H: 28.
Gilbert, A. and W. Hafkamp. 1986. Natural resource accounting in a multi-objective context. Annals of Regional Science. 20(3): 10-37.
Hart, P. 1998. Enlarging the shadow of the future: avoiding conflict and conserving fish. In: Reinventing Fisheries Management. T.J. Pitcher, P.J.B. Hart and D. Pauly (Eds.). Chapman and Hall, London, pp. 227-238.
Hilborn, R. 1990. Estimating the parameters of full age-structured models from catch and abundance data. Bull. Int. North Pac. Fish. Comm., 50: 207-213.
Hull, B. 1993. Valuing the environment: full cost pricing - an inquiry and a goal. The Conference Board of Canada. Report 103-93.
Hutton, T. 1992. The status and productivity of the Cape hake stock off the west coast of South Africa based on an age-structured production model with different stock-recruitment and fishing selectivity-at-age relationships. Unpublished Masters Dissertation, Zoology Department, University of Cape Town, South Africa.
Japp, D.W. 1993. Longlining in South Africa. In: Fish, Fishers and Fisheries. Proceedings of the Second South African Marine Linefish Symposium, Durban, 23-24 October, 1992. Beckley, L.E. and R.P. van der Elst (eds). Oceanographic Research Institute, Marine Parade, Durban, South Africa. Pages: 134-159.
Japp, D.W. 1995a. Report submitted to the Longline Management committee on the hake directed longline pilot study conducted from 23 May 1994 to 31 May 1995. Department of Environmental Affairs, Sea Fisheries Research Institute, Cape Town. Working Document: WG/09/95/D: H: 16.
No 1, 2002
50
Japp, D.W. 1995b. Strategy to test the feasibility of hake-directed longlining in South Africa (Phase 2 – Experimental Fishery). Demersal Working Group (DWG), Department of Environmental Affairs, Sea Fisheries Research Institute. Working Document: WG/11/95/D: H: 29.
Japp, D.W. 1995c. Summary of the Hake Fishery in 1993. Demersal Working Group (DWG), Department of Environmental Affairs, Sea Fisheries Research Institute. Working Document: WG/05/94/D: H: 7.
Japp, D.W. 1995d. Summary of the Hake Fishery in 1994. Demersal Working Group (DWG), Department of Environmental Affairs, Sea Fisheries Research Institute. Working Document: WG/05/95/D: H: 8b.
Japp, D.W. 1995e. Historical overview of longlining in South Africa. Demersal Working Group (DWG), Department of Environmental Affairs, Sea Fisheries Research Institute. Working Document: WG/DEM/93/02/H: 8.
Japp, D.W. 1996. Summary of the Hake fishery in 1995. SFRI Working document WG/05/64/D:H: 7
Jones, B.W. and Van Eck, T.H. 1967. The Cape Hake: its biology and the fishery. S. Afr. Shipp. News Fish. Ind. Rev., 22(11): 90-97.
Kaitala, V. and G. Munro. 1993. The economic management of high seas fishery resources: some game theoretic aspects. Department of Economics, University of British Columbia, Vancouver, B.C. Canada. Discussion Paper No.: 93-41.
Kreps, D.M. 1990. Game Theory and Economic Modelling. Claredon Press. Oxford. Lai, A. 1997. Natural Resource Accounting for Thailand’s forests: a theoretical framework.
International and Development Studies Working Paper. Queen’s University, John Deutsch Institute for the Study of Economic Policy.
Lange, G-M. 1998. An approach to sustainable water management in Southern Africa using natural resource accounts: the Experience of Namibia. Ecological Economics 26(3): 299-311.
Leefers, L.A. and G.B. Castillo. 1998. Bridging the gap between economics and ecology. Conservation Ecology (online) 2(2):19.
Leslie, R.W. 1998. Final data document for west coast hake assessments. Sea Fisheries Research Institute. Working Group Document WG/03/98/D:H:12
Lewis, T.R. and J. Cowens, 1982. The Great Fish War: a cooperative solution. University of British Columbia, Department of Economics. Programme in Natural Resources Economics. Resources Paper No. 84.
Moffat, I. 1996. Sustainable development: principles, analysis and policies. The Parthenon Publishing Group, London.
Munro, G.R. 1979. The optimal management of transboundary renewable resources. Can. J. Econ., 12(8): 355-376.
No 1, 2002
51
Munro, G.R. 1981. The economics of fishing: an introduction. In: Economics and Resources Policy. J. A. Butlin (Ed.). Longman, London, pp.: 129-140.
Munro, G.R. 1987. The management of shared fishery resources under extended jurisdiction. Mar. Res. Econ., 3(4): 271-296.
Munro, G.R. 1990. The optimal management of transboundary fisheries: game theoretic considerations. Natural Resource Modeling 4(4): 403-426.
Munro, G.R. 1992. Mathematical bio-economics and the evolution of modern fisheries economics. Bulletin of Mathematical Biology 54(2/3): 163-184.
Munro, G.R. 1994. Coastal states and distant water fleets under extended jurisdiction: the search for optimal incentive schemes. In: Advances in Dynamic Games and Applications. T. Basar and A. Haurie (Eds.). Birkhauser, Boston, pp.: 301-317.
Munro, G.R. 1996. Approaches to the economics of the management of High Seas fishery resources. In: Fisheries and Uncertainty: A precautionary approach to resource management. D.V. Gordon and G.R. Munro (Eds.). University of Calgary Press, pp. 161-180.
Munro, G.R. 1998. The economics of overcapitalization and fishery resource management: a review. Discussion Paper No.: 98-21. Department of Economics, University of British Columbia, Vancouver, Canada.
Munro, G.R. and A.T. Scott. 1985. The economics of fisheries management. In: Handbook of Natural Resource and Energy Economics, Vol 2 . A.V. Kneese and J.L. Sweeney (eds). Elsevier Publishers, B.V, pp.: 623-676.
Nash, J.F. 1951. Non-cooperative games. The Annuals of Mathematics, 54(2): 286-295. Nordhaus, W.D. and E.C. Kokkelenberg (Eds.). 1999. Nature’s numbers: Expanding the
national economic accounts to include the environment. Panel on Integrated Environmental and Economic Accounting. National Academy Press, Washington, D.C. pp. 250.
OECD. 1997. Towards Sustainable Fisheries. Economic Aspects of the Management of Living Marine Resources. Organisation For Economic Co-operation and Development. OECD Publications, Paris, France. 268pp.
Osborne, M.J. and A. Ruberstein. 1994. A Course in Game Theory. The MIT Press. Cambridge, Massachusetts.
Ostrom, E., Gardner, R. and J. Walker 1997. Rules, Games, and Common-Pool Resources. The University of Michigan Press, Ann Arbor.
Payne, A.I.L. 1989. Cape Hakes. In: Oceans of Life off Southern Africa. Vlaeberg, Cape Town. pages 136-147, Payne, A.I.L. and R.J.M. Crawford (Eds).
Payne, A.I.L. and A.E. Punt. 1992. Biology and fisheries of South African Cape hakes (M. capensis and M. paradoxus). Pages 15-47, In: Hake: Biology, fisheries, and markets. Alheit, J. and T.J Pitcher (Eds).
No 1, 2002
52
Payne, A.I.L. Rose, B. and Leslie, R.W. 1987. Feeding of hake and a first attempt at determining their role trophic role in the South African west coast marine environment. In: The Benguela and Comparable Ecosystems. Payne, A.I.L., Gulland, J.A. and K.H. Brink (Eds). S. Afr. J. mar. Sci. 5: 471-501.
Payne, A.I.L., Badenhorst, A., Augustyn, C.J. and Leslie, R.W. 1989. Biomass indices for Cape hake and other demersal fish species in South African waters in 1988 and earlier. Colln Scient. Pap. int. Commn SE. Atl. Fish ., 16(2): 25-62.
Prudham, W.S. and S. Lonergan. 1993. Natural resource accounting (I): A review of existing frameworks. Canadian Journal of Regional Science 16(3): 363-386.
Punt, A.E. 1988. Model Selection for the Dynamics of South African Hake Resources. M.Sc. Thesis. University of Cape Town, South Africa. Rep. Benguela Ecol. Progm. S.Afr. 15:[vii] + 395 pp.
Punt, A.E. 1990. Is B1 = K an appropriate assumption when applying an observation error production model estimator to catch-effort data. S. Afr. J. mar. Sci. 9: 249-259.
Punt, A.E. 1991. Management procedure for Cape Hake and Baleen Whale resources. Ph.D.. Thesis. University of Cape Town, South Africa. Rep. Benguela Ecol. Progm. S.Afr. 23:[viii] + 689 pp.
Punt, A.E. 1992. Selecting management methodologies for marine resources, with an illustration for southern African hake. In: Benguela Trophic-Functioning. Payne, A.I.L., Brink, K.H. Mann, K.H., and R. Hilborn (Eds). S. Afr. J. mar. Sci., 12: 943-958.
Punt, A.E. 1993. Assessments of the stocks of Cape hake (Merluccius spp.) off South Africa. S. Afr. J. mar Sci. 13
Punt, A.E. and Leslie, R.W. 1991. Estimates of some biological parameters for the Cape hakes off the South African west coast. S. Afri. J. mar. Sci., 10: 271-284.
Rasmusen, E. 1995. Games and Information: An Introduction to Game Theory. Blackwell, Cambridge, MA.
Repetto, R., Magrath, W., Wells, M., Beer, C. and F. Rossini. 1989. Wasting assets: natural resources in the national income accounts. World Resources Institute. 68pp.
RAU, 2000. Rights Allocation Unit. Draft discussion document for the fisheries management plan to improve the process of allocating fishing rights. August, 2000. (Version 6.1), 48p.
Roux, E.R. 1949. Migrations of the Cape hake or stockfish (Merluccius capensis Cast) on the west coast of South Africa. Trans. R. Soc. S. Afri. 32(2): 217-231.
Saville, A.D. 1997. A Computable Dynamic Bioeconomic model of the Optimal Utilisation and Management of South Africa’s Renewable Marine Resources: a case Study of the Hake Fishery. Unpublished thesis, Doctor of Philosophy in the Department of Economics, University of Natal, Durban (December 1997).
No 1, 2002
53
SFRI 1993. South African Commercial Fisheries Review 1991, No. 1. Chief Directorate Sea Fisheries (Cape Town), Department of Environmental Affairs, Republic of South Africa. 41pp.
Stander, G. 1995. Aspects of the development and the regulation of South Africa fisheries. In: Review of International Experiences in Access Rights and their implications for Fisheries Management in South Africa. Access Rights and Resource Implications Task Group (ARRITG), pp. 51-72. Sea Fisheries Research Institute. Cape Town, South Africa.
Strydom, M.B. and W.L. Nieuwoudt (in press). Restructuring the management of the South African hake fishery: analysis of industry attitudes. S. Afr. J. mar. Sci. 22
Stuttaford, M. (Ed.) 1993. South African Fishing Industry Handbook and Buyer’s Guide. Marine Info. Services (Pty) Ltd.
Stuttaford, M. (Ed.) 1996. South African Fishing Industry Handbook: South Africa, Namibia and Moçambique. 24th Edition. Marine Information cc, Stellenbosch, South Africa.
Sumaila, U.S. 1995. Irreversible capital investment in a two-stage bi-matrix fishery game model. Mar. Res. Econ., 10: 263-283.
Sumaila, U.S. 1997. Cooperative and non-cooperative exploitation of Arcto-Norwegian Cod Stock. Environmental and Resource Economics 10: 147-165.
Sumaila, U.S. 1999. A review of game-theoretic models of fishing. Marine Policy 23(1): 1-10. United Nations, 1993. Integrated environmental and economic accounting. Studies in
methods, Handbook of national accounting, Series F, No. 61. United Nations, New York, pp. 182.
United Nations, 1999. Integrated environmental and economic accounting. An operational manual, Series F, No. 78. United Nations, New York, pp. 239.
Van Eck, T.H. 1969. The South African hake 'Merluccius capensis' or 'Merluccius paradoxus'. S. Afr. Shipp. News Fishg Ind. Rev. 24(5): 95-97.
von Neumann, J. and O. Morgenstern. 1944. Theory of Games and Economic Behavior. Princeton Univerity Press. Princeton.
Weintraub, E.R. (Ed.). 1992. Toward a History of Game Theory. Duke University Press. Durham and London.
Yeto, S.C., Garcia, R.G. and G.R. Bravo. 1997. Potential gains from co-operation for vessels and countries. Marine Resource Economics 12: 145-158.