carcinogenesis in chronic ulcerative colitis: flow...
TRANSCRIPT
lBD: CARCINOGENESIS
Carcinogenesis in chronic ulcerative colitis:
Flow cytotnetry
DJ AIINEN, MD, JB MCHUGI I, MD, PHO, JM BoZDECII, MD, GH WARREN, MD
ABSTRACT: Flow cytometry is a conceptually straightforward quantitative method that can be used to determine the DNA content (and many ocher parameters) of individual cells. It has been used in chronic ulcerative colitis to evaluate the presence of aneuplo idy as a marker of colon cancer risk. In this paper, the basic principles offlow cytometry are reviewed, the current status of published studies using flow cytometric analysis of DNA content in chronic ulcerative colitis outlined, conclusions from the research are proposed and future research needs it~cntified. Overall, aneuploidy correlates with the current best markers of cancer risk in ulcerative colitis, ie, dysplasia and established cancer. Whether aneuplo1dy will be useful for the prospective identification of individuals at increased risk for colon cancer deserves rigorous evaluation. An important technical issue of potential variability in interpretation of near diplo id peak5 is emphasized. Can J Gastroenterol 1990;4(7):390-396
Key Words: Cancer, Flow cycometry, Surveillance, Ulcerarit1e colitis
La carcinogenese dans la colite ulcereuse chronique et la cytometrie de flux
RESUME: La cytometrie de flux est une methode quantitative simple pouvant servir a determiner le contenu d'ADN (parmi de nombreux parametres) des cellules individuelles. Elle permet de reperer l'aneuplo'idie en tant que marqueur de risque de cancer du colon dans la co lite ulcereuse chronique. Le present article passe en revue les principes elementaires de la cytometrie de flux, evalue le statue present des etudes publiees dans le domaine, presence leun, conclusions et definit les futurs besoins de la recherche. En general, ii ya correlation entre l'aneuplo'idie et les meilleurs indices de risque de cancer clans la colite ulcereuse, c'est-a-dire la dysplasie et le cancer etabli.11 est necessaire de proceder a un examen rigoureux afin de determiner si l'aneuplo'idie permettra de determiner qui presentent un risque eleve de cancer colique. L'auteur souleve une question technique importante: celle de la variabilite potentielle d'interpretation des pies proches de l'etat diplo'ide.
Department of Medicine, Denver Vecerans Adminisrra11on Medical Cencer, Unr1.1ers1ty of Colorado Health Sciences Cencer; Department of Pathology, Rose Medical Cencer Denver, Colorado; and Department of Medicine, Cleveland Clinic Foundation, Cleveland, Ohio
Correspondence and repnnts · Dr DJ Ahnen, University of Colorado Health Sciences Cencer, 4 200 East 9ch Avenue, Denver, CO 80262, USA
TIil: PURPOSE OF THIS ARTICLEIS to review the applic:uion of flow
cytometry to the problem of carcinogenes1~ in chronic ulcerative colm,. In this review, methodology will be described including the capacity anJ lim1tatiom of flow cytomctry; the <lau concerning flow cytometric analyMs<i DNA content in chronic ulccrat1vc colitis will be reviewed; reasonabk conclusions wi II he drawn from exm1ng Jara; and finally, some research nce<l1
in this area will be identified.
FLOW CYTOMETRY METHODOLOGY
The hasic principle of Ov. cytomctry is the abi lity to measure the mtens1cy of fluorescence in an in
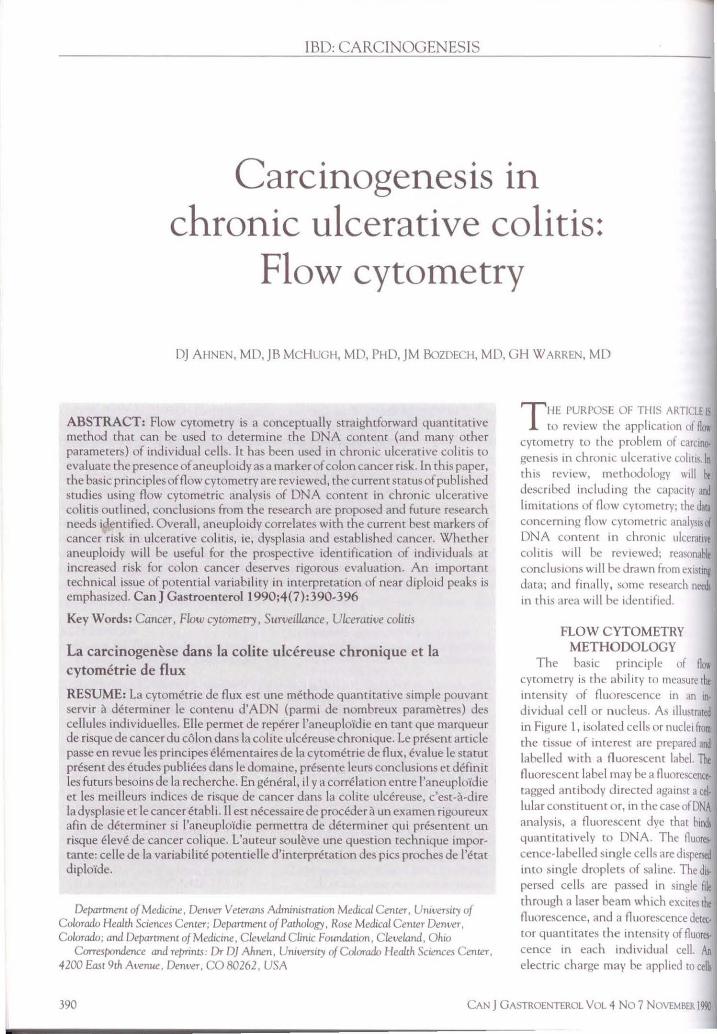
dividual cell or nucleus. As 11lustrn1eJ in Figure l, isolated ce lls or nuclei from the tissue of interest arc prepared and labelled with a fluorescent label. Th fluorescent label may be a fluorescence· tagged antibody Jirected against a eel. lular constituent or, in the case ofDNA analysis, a fluorescent dye that binds quantitatively to DNA. The fluort,· cence-labelled single cells are d1sper,ed into single droplets of salme. The Jb, persed cells arc passed in single ftle through a laser beam which exc1teH!x fluorescence, and a fluorescence detec, tor quantita tes the intensity of fluorCl· cence in each individual cell. An electric charge may be applied to celb
390 CAN J GASTROENTEROL VOL 4 No 7 NOVEMBER Im
IJ1U(JICf\
• homt ..:onto,n,nq I cdJ
·; . \· . . •' . : . •'
I I ltll \t"°rQIIO'\ by opply1f\Q ChOrqt 10 dtQp&fl •1lh O U,1 of dtstttd ON A con1ent tie synct,1o,1,1ed w,lh ftuOfescencc c,erecro,I
uu delt(IO,
Figure 1) The principal features of a flow cywmeter. Smgle cells are labelled wrth a fluorescent probe and dtrected m single file through a laser beam. Analysis off orward angle light scatter rnn be u.wd to
estimate cell volume Fluorescence emission from che excited cell chen provides a dmr1hut1on of fiuarescence intensity. Elecmc charge related co fluorescence mcensity can al10 11<! applied to dro/ilecs contammg single cells. allowing their se/Jaraticm m an electrosratic field Thi.1 /mJCess is known as 'fiuore.scence-acuvatecl cell sorcmg'
r .... a
)(1.
14
7
•
2N
.. CJ,anne I Nu•••"
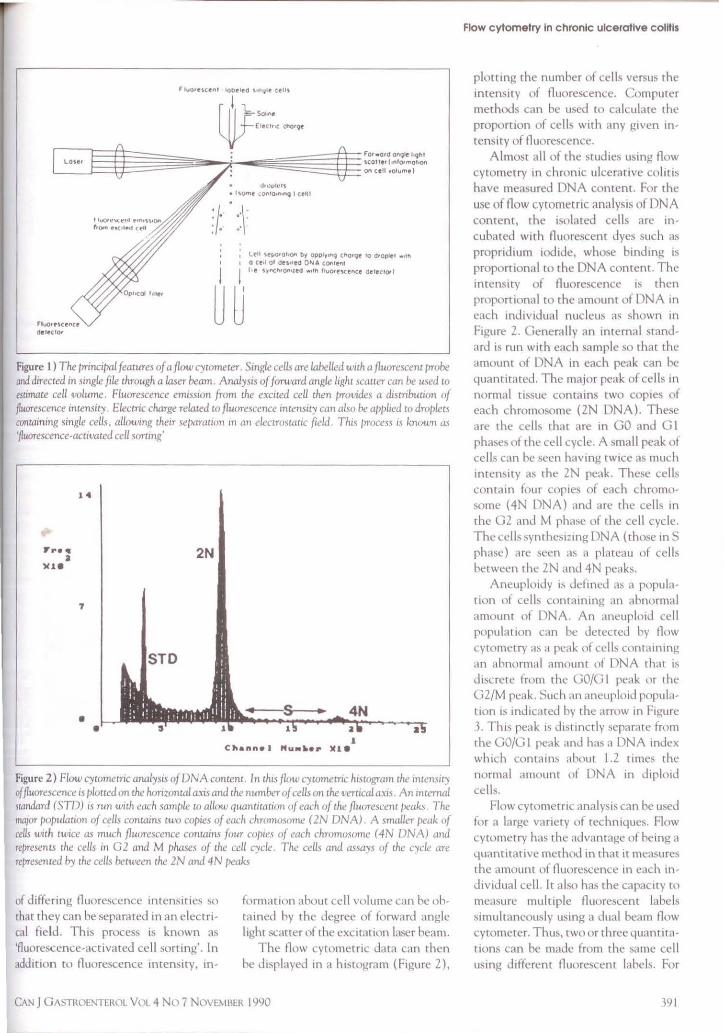
Figure 2) Flow cywmecric analysis of DNA content. In this flc~w cytomecric histogram the intensity of fiuorescence is />lotted on the horiznncal a).is and che number of cells on the ,1erucal axis. An mtemal sumdard (STD) 1s nm wirh each mmple to allow quanmation of each of the fluorescent J,eak.1 The IMJOT population of cells contanl.'i two copies of each chromosome ( 2N DNA) A small~'T {'c!ak of cells wrth twice as much fluorescence contaim four copre.s of each chromosome ( 4N DNA) and represents the cells in G 2 and M phases of the cell cycle The cells and assays of the cycle are represented /ry the celLs h.ttween the 2N and 4N peak.s
of differing fluorescence intens1tie~ ~o that they can be separateJ in an electrical field. This process 1s known as 'fluorescence-activated cell sorting'. In addition to fluorescence intensity, in-
formanon about cell volume can he ohtaineJ 1:-,y the Jegree of forwarJ angle I ighr scatter of the excitation lrn;er heam.
The flow cyrometric data can then be displayed in a histogram (Figure 2),
CAN J GA~TROENTEROL Vol 4 No 7 NOVE~IBER 1990
Flow cytometry in chronic ulcerative colitis
plotting the number of cells versus the intensity of fluorescence. Computer methods can be used to calculate the propomon of celb with any given intensity of fluorescence.
Almost all of the studies using flow cytometry in chronic ulcerative colitis have measured DNA content. For the use of flow cyrornetric analysis of DNA content, the isolated cells are incubateJ with fluorescent dyes ~uch as propndium iodide, whose binding is proportional co the DNA content. The intensity of fluorescence 1s then proportional co the amount of DNA in each inJividual nucleus as shown in Figure 2. Generally an internal standard i~ run with each sample so that the amount of DNA m each peak can he quantitated. The major peak of cells in normal tissue contains two copies of each chromosome (ZN DNA). These are the cells that are in GO and GI pha:,es of the cell cycle. A small peak of cclb can be seen having twice .is much intemrty as the ZN peak. These cells contain four copies of each chromosome (4N DNA) and arc the cells in the G2 and M rhase of the cell cycle. The cells synthcs1Z1ng DNA (those in S phase) nre seen as a plateau of eel b herween the ZN and 4N peab.
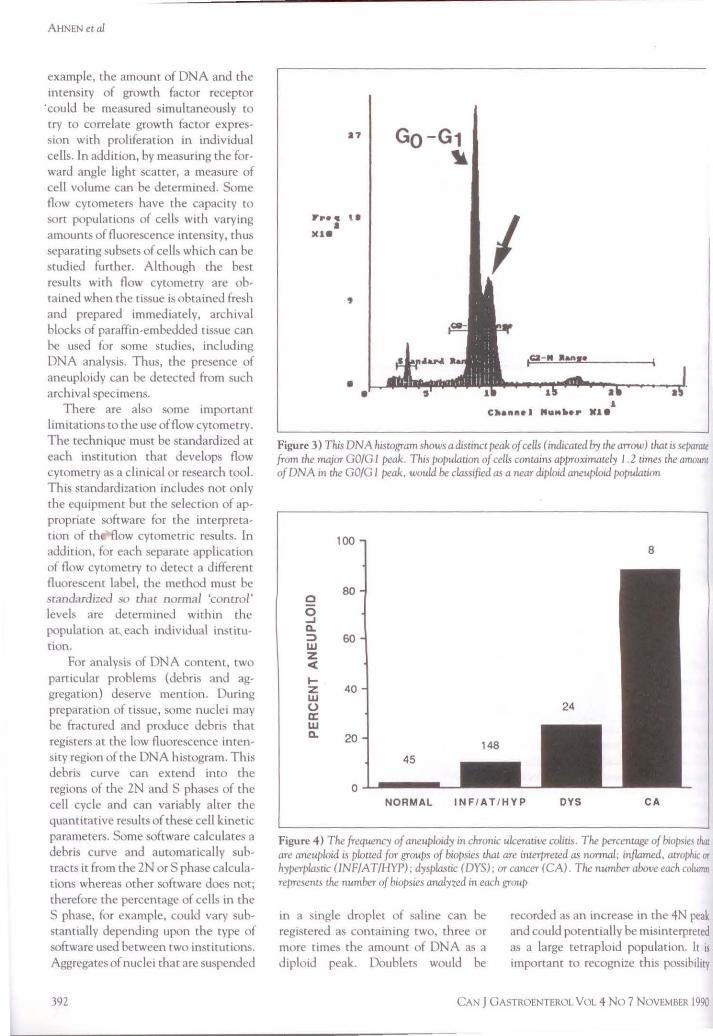
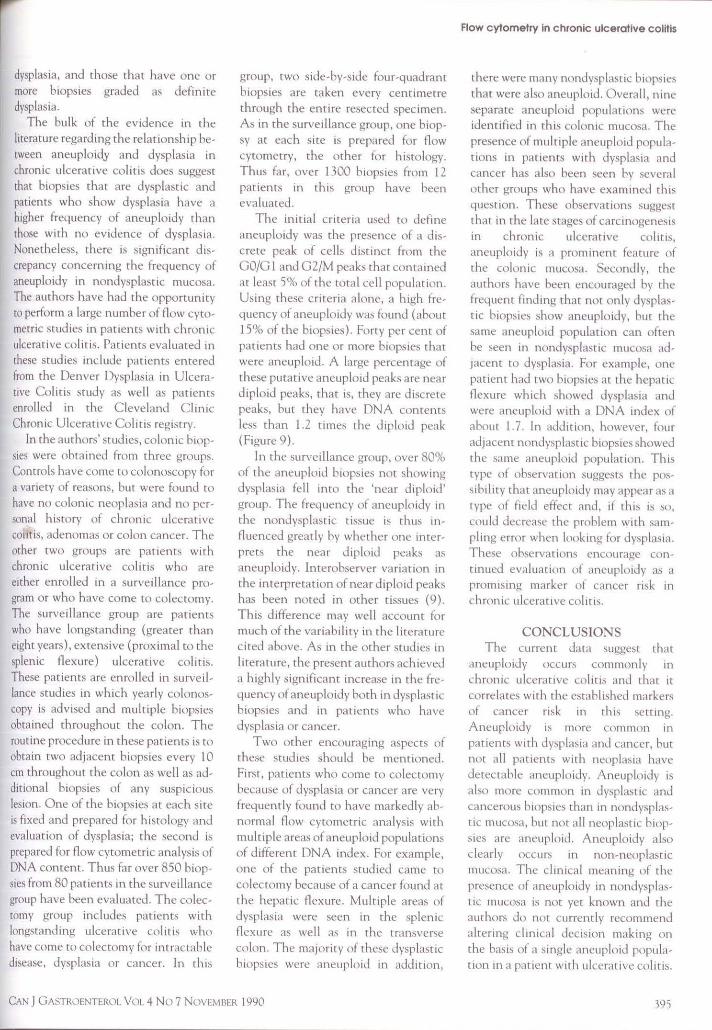
Aneupl01dy is JefincJ as a population of cells containing an ahnonnal amount of DNA. An aneupl01d cell population can be detected hy flow cycometry as a peak of cells containing an ahnonmd amount of DNA that 1s dbcrete from the GO/GI pc.ik or tht· GZ/M peak. Such an aneuploid population 1s 111d1cared hy the ,1rrow m Figure 3. Th i~ peak 1s diMmcrly separate from the GO/GI peak and has a DNA mdcx which conrnms ahout 1.2 times the normal amount of DNA in d1plo1d cells.
Flow cytomctnc analys is can be used for a large variety of techniques. Flow cytometry has the advantage of heing a 4uant1tat1vc methoJ in that it measures the amount of fluorescence in each inJividual cell. It also has the capacity w measure multiple fluore~cenl labels simultaneously using a dual beam flow cyrometer. Thus, two or three quantitat1ons can be made from the same cell usmg different fluorescent lahels. For
191
AHNEN etal
example, the amount of DNA and the intensity of growth factor receptor
·coul<l be measured simultaneously co try to correlate growth factor expression with proliferation in individual cells. In addition, by measuring the forward angle light scatter, a measure of cell volume can be determine<l. Some flow cytometers have the capacity to sore populations of cells with varying amounts of fluorescence intensity, thus separating subsets of cells which can be studied further. Although the best results with flow cytometry are obtained when the t1ssue is obtaine<l fresh and prepared immediately, archival blocks of paraffin-embedded nssue can be used for some stu<lies, including DNA analysis. Thus, the presence of aneuploidy can be <letected from such archival specimens.
There are also some important limitations to the use of flow cytometry. The technique must be standardized at each institution that develops flow cytometry as a clinical or research tool. This standardization includes not only the equipment but the selection of appropriate software for the interpretation of th flow cytometric results. In addition, for each separate application of flow cytometry to detect a differenl fluorescent label, the method must be standardized so thar normal 'control' levels are determineJ within the population at each individual institution.
For analysis of DNA content, two particular problems (<lebris and aggregation) deserve mention. During preparation of tissue, some nuclei may be fractured and produce debris that registers at the low fluorescence intensity region of the DNA histogram. This debris curve can extend into the regions of the 2N and S phases of the cell cycle and can variably alter the quantitative results of these cell kinetic parameters. Some software ca lculates a debris curve and automatically subtracts it from the 2N or S phase calculations whereas other software docs not; therefore the percentage of cells in the S phase, for example, could vary substantially depending upon the type of software used between two institutions. Aggregates of nuclei that are suspended
392
a,
Fr•• \ I • )Ue
• •
Go - G1 1l
I 1c.a- N Jlant•
1 C~ann•I Nu•••• Mle
Figure 3) This DNA hiswgram shows a distmct peak of cells ( indicated by the arrow) that 1s separait from the major GO/G 1 peak. This populauon of cells con tams approximately I . 2 umes the amount of DNA m the GO/G 1 peak, woula be classified as a near diploul aneuploid population
100 8
0 80
0 ...I Q. :::, 60 UI z < .... z 40 w 0 a: w Q. 20
45
0 NORMAL INFI AT / HYP DYS CA
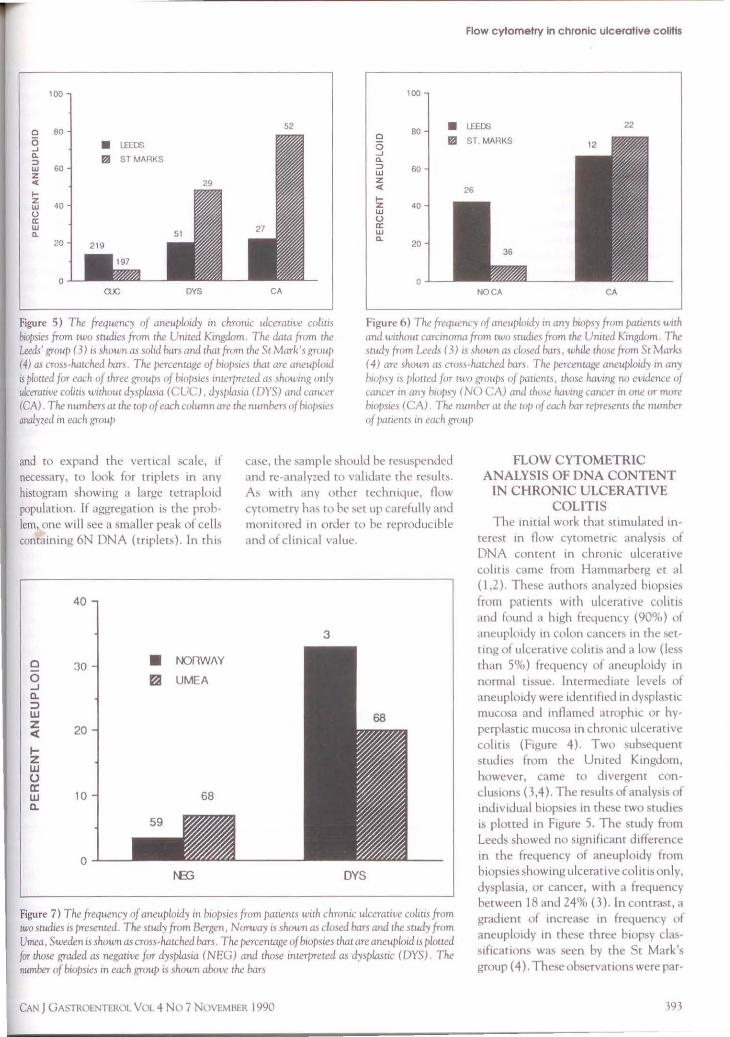
Figure 4) The frequency of aneuploidy in chronic ulcerauve colrcis. The percenwge of biopsies Ural are aneuploid is plotted for groups of biopsies that are interpreted as normal; inflamed, atrophic rrr hyperplasuc (INFIAT/HYP); dysplasuc (DYS), or cancer (CA) The number above each column represents the number of biopsies analyzed in each group
in a single droplet of saline can be registered as containing cwo, three or more times the amount of DNA as a diploid peak. Doublets would be
recorded a~ an increase m the 4N peak and could potentially be misinterpreted as a large tetraplo1d population. It is important to recognize this poss1b1lity
CAN J 0ASTROENTEROL VOL 4 No 7 NOVEMBER 1990
Flow cytometry in chronic ulcerative colitis
100 100
60 52 • L[E.DS 22
0 0 60
6 6 Ea ST. MARKS ..J a. ...J
::> Q.
w 60 ::) 60 z w <( z
< ... z ... w 40 z 40 (.) w a: 0 w (C
a. w 20
a. 20
0 0 QJC DYS CA NOCA CA
Figure 5) The frequency of aneuploidy in chronic ulceratit•e colws biopsies from cwo su«I,cs from che United Kingdom The daca from che Leeds' group ( 3) is shown as solid bars and chat from the Sr Mark's grnu/1 /4) as cross-hatched han. The />ercencagc of b1ops1e.1 thac arc aneuplmd is plocccd for each of chree groups of b,o/mes 111terprewd as showmg 011/y ulcerative coliu1 without dysplasia (CUC), dysJ>lasia ( DYS) and cmmir (CA) The numbers ac che cop of each column are che numbers of biop11cs analyzed in each group
Figure 6) The frequency of aneuplmd°'i in any biopsy frnm pauenis tmh and w11ho1t1 carcmoma from cwo mu.lies from che United Kmgdom. The swdy from Leeds ( 3) 1.1 shown as closed hars, while chose from St Marks ( 4) are shown as cro.1.1 hacchcd bars The (><!rcencage aneuploid'! m an'/ l110/>.1y 1.1 ploued f nr two grvu/).1 of /X!Uencs, those havmg no evidence of cancer 111 any biopsy ( NO CA) and chose havmg cancer 111 one or more biopsies (CA) The number ,H the W/> of each bar rcpre1encs the number of pacienrs in each group
and to expand the vertical scale, if necessary, to look for triplets m any histogram showing a large teLraploiJ population. If aggregation is the problem, one will see a smaller peak of cells containing 6N DNA (rnplets). In this
0
0 ...J 0.. :::::, w z < 1-z w 0 a: w a.
40
30
20
10
0
• t-OnW/\Y
121 UMEA
68
case, the :;ample should be resuspended and re-analyzed to validate the result~. As with any other technique, flow cyrometry has to he set up carefully and mon1toreJ in order to be reproducible and of clmical value.
3
DYS
Figure 7) The frequency of aneuploidy in b1u/>sies from patients with chronic ulcerative colim from cwoscud1es is presenced. The study from Bergen, Norway is shown as closed bars and the study from Umea, Sweden is shown as cross-hacched bars. The percentage of biopsies chat are aneuploid is ploued far those graded as negative for dysplasia (NEG) and those mcerpreted as dysplasnc (DYS) The number of bwpsies in each group IS shown above the bars
CAN J GA~"TROENTEROL VOL 4 No 7 NOVEMBER 1990
FLOW CYTOMETRIC ANALYSIS OF DNA CONTENT
IN CHRONIC ULCERATIVE COLITIS
The initial work that Stimulated in
terest 111 flow cytometnc analysis of DNA content in chrornc ulcerative col1 t1s came from Hammarherg ct al (1,2). These authors analyzed biopsies from patients with ulcerative colius and founJ a high frequency (90%) of aneuplo1dy in colon cancers in the setting of ulcerative colitis and a low ( less than 5%) frequency of aneuploidy 111 normal tissue. lnrermed,ate levels of aneuploidy were identified in dysplastic mucosa and 111flamed ,1troph1, or hyperplastic mucosa in chronic ulcerative colitis (Figure 4 ). Two subsequent studies from the United K111gdom, however, came to J1vergent conclusions (3,4 ). The results of analysis of individual biopsies in these cwo studies is plotted 111 Figure 5. The study from Leeds showed no significant difference in the frequency of aneuploidy from biopsies show111g ulcerative colitis only, dysplasia, or cancer, with a frequency between 18 and 24% (3 ). In contrast, a gradient of 111crcase in frequency of aneuploidy in these three biopsy classifications was seen by the St Mark's group ( 4 ). These observations were par-
393
AIINEN era/
ticularly disturbing because the studies were done in a very similar manner using archival fixed anJ paraffin-embedded tissues, and using similar flow cytometric techniques. Furthermore, it was initially difficult to envision a systematic difference in preparation or interpretation that might account for the differences because the Leeds group found both a higher frequency of aneuploidy in the biop~ies showing no dysplasia or cancer, and a substantia lly lower frequency of aneuploidy in the dysplastic and cancer biopsies. If there was a systematic difference in the detection or interpretation of aneuploidy, one would expect to show consistent differences in the same direction in all of the groups rather than this disparate result. Subsequently, however, the Leeds group reported that their frequency in cancer had increased to about 46% so that the disparity seemed to be more in the biopsies graded negative for dysplasia or cancer. This is also the case if one analyzes the data with respect to the number of patients rather than the individual biopsies (Figure 6). The percentage of patients with cancer that had aneuploidy was similar between the Leeds and St Marks studies; however the Leeds group found that over 40% of patients with no evidence of cancer had aneuploidy, whereas it was less than 10% in the study from St. Marks. Thus, it seems chat the major difference between the two studies is the finding of a higher frequency of aneuplo idy in the non-neoplastic biopsies in patients by the group at Leeds compared to St Macks. lt is possible that a difference in the c riteria used for the classification of aneuploidy between the two studies could account for such differing results.
There have been several other studies that have presented data related to the frequency of aneuploidy in chronic ulcerative colitis. In Figure 7, the results of two studies reporting the correlation between aneuploidy and histology in ind ividual biopsies are shown. In both the study from Bergen, Norway (5) and from Umea, Sweden (6) a substantially higher frequency of aneuploidy was seen in biopsies showing dysplasia than in those negative for
394
0
0 ...J a. :::, w z < .... z w () a: w
100
80
60
40
c. 20
• ~
37
8
STOCKHOLM SEATILE 8
12
IND DYS
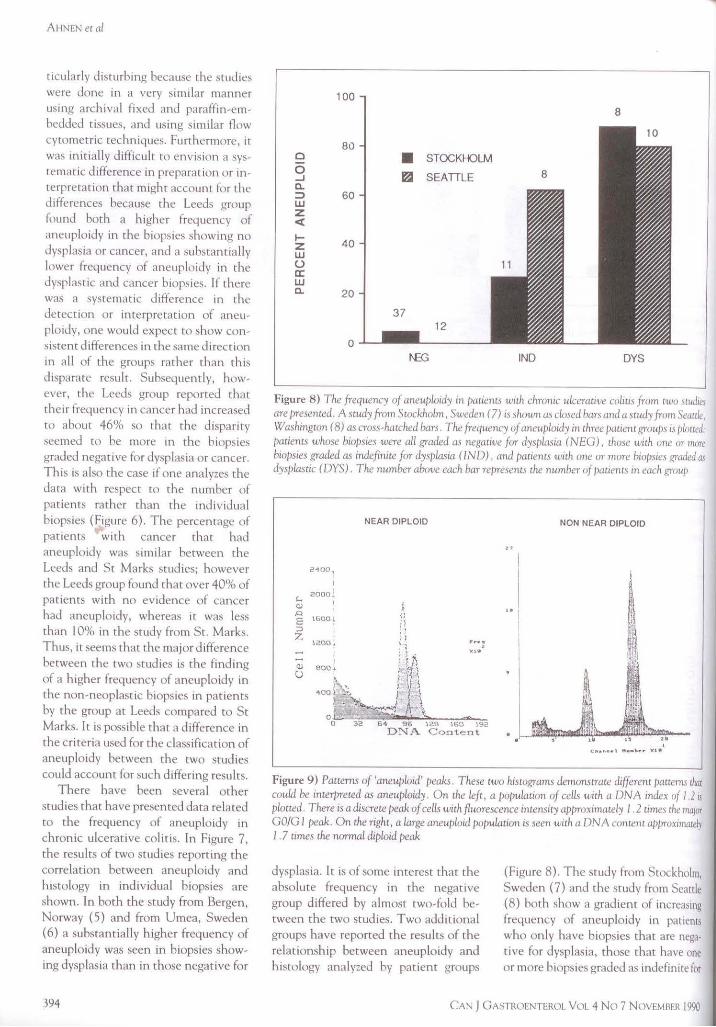
Figure 8) The frequency of aneuploidy m />aiients with chronic ulcerative colitis frnm two srudiei are /)resented. A study from Scocklwlm, Su-eden (7) is shown as closed bars and a srndy from Seactle, Washington (8) as cross-hatched bars. The frequency vf aneuploidy in three />atient grou/Js rs ploued: patients whose biopsies were all graded as negative for clysplasiti (NEG), those with one or more biopsies graded a.~ indefinite for dys/Jlasia (IND), and pauents with one or more biopsies graded as dysplasrrc (DYS). The number above each bar represents tlte number of />auents rn each group
2-100,
1600/
1200.1.
NEAR DIPLOID
i ·.'i i1 n \,
QJ BOO 1 ! \tf·
0
\ C) ~ • •,
r,,. f I
400 . ~~ . j \ ~,,,__..) ~-0 ·-,...; ~ \. ..,..., o 32 64 96 120 160 192
DNA Content
I
I "I
I I
NON NEAR DIPLOID
' C"••uu• I Nu .. l>•r kt•
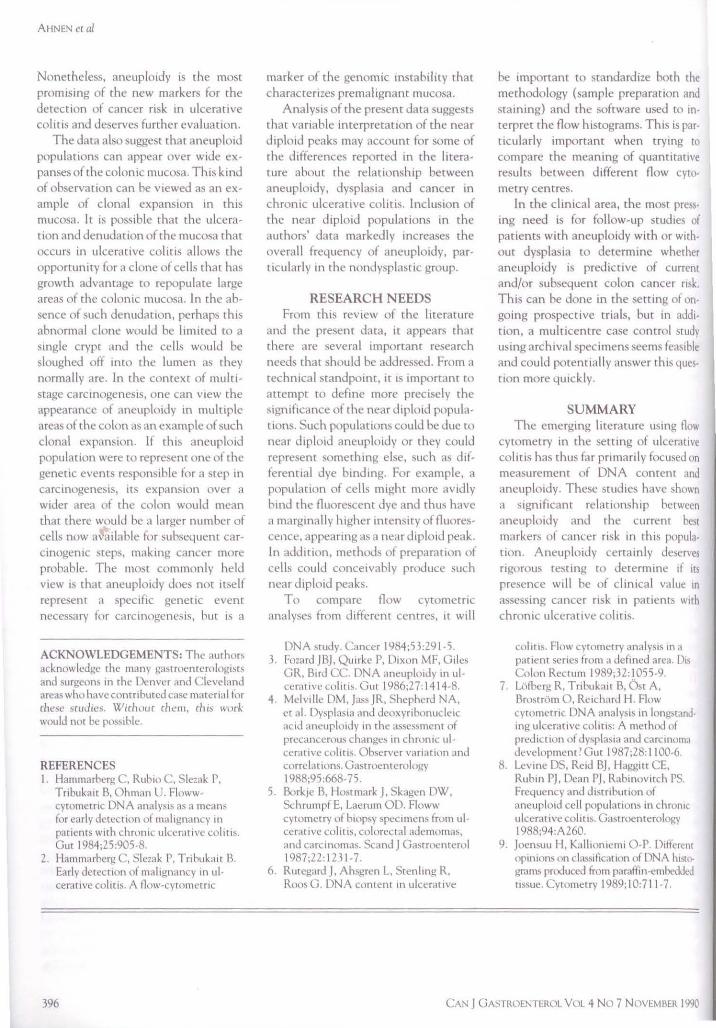
Figure 9) Patterns of 'aneuploid' peaks. These two histograms demonsrrate different pauems chat couu.l be interpreted as aneuploidy. On the left, a populauon of cells with a DNA index of/ .2 rs plotted. There is a discrete peak of cells with fluorescence intensity approximately I . 2 umes 1he major GO/GI peak. On the right, a large aneuploid />0pulacion is seen with a ONA content a/J/)roximatdJ I . 7 times 1he n01711al diploid peak
dysplasia. lt is of some interest chat the absolute frequency in the negative group differed by almost two-fold between the two studies. Two additional groups have reported the results of the relationship between aneuploidy and histology analyzed by patient groups
(Figure 8). The study from Stockholm, Sweden (7) and the study from Seattle (8) both show a gradient of increasing frequency of aneuplo idy in pauents who only have biopsies chat are negative for dysplasia, those that have one or more biopsies graJeJ as indefinite for
CAN J GASTROENTEROL Vc.1L 4 No 7 NOVEMBER 1990
dysplasia, and those that have one or more biopsies graded as definite dysplasia.
The bulk of the evi<lence in the literature regarding the relationship between aneuploid.Y and dysplasia in chronic ulcerative colitis <loes suggest that biopsies that are dysplastic and patients who show dysplasia have a higher frequency of aneuploidy than those with no evidence of dysplasia. Nonetheless, there is significant discrepancy concerning the frequency of aneuploidy in nondysplastic mucosa. The authors have ha<l the opportunity to perform a large number of flow cytornetric studies in patients with chronic ulcerative colitb. Patients evaluate<l in these studies include patients entered from the Denver Dysplasia in Ulcerative Colitis study as well as patients enrolled in the C leveland C linic Chronic Ulcerative Colitis registry.
In the authors' studies, colon ic biopsies were obtained from three groups. Controls have come to colonoscopy for a variety of reasons, but were found to have no colonic neoplas ,a and no personal history of chronic ulcerative co11tis, adenoma~ or colon cancer. The other two groups are pat ienb with chronic ulcerat ive colitis who are either enrolled in a surveillance program or who have come to colectomy. The survei !lance group are patients who have longstanding (greater than eight years), extensive (proximal to the splenic flexure) ulcerative coli tis. These patients are enrolled in surveil lance studies in which yearly colonoscopy is advised and multiple biopsies obtained throughout the colon . The routine procedure in these pa tients is to obtain cwo adjacent biopsies every 10 cm throughout the colon as well as additional biopsies of any suspic ious lesion. O ne of the biopsies at each site is fixed and prepared for histology and evaluation of dysplasia; the second is prepared for flow cytometric analysis of DNA content. Thus far over 850 biopsies from 80 patients in the surveillance group have been evaluated. The colectomy group includes patients with longstanding ulcerative colitis who have come to colectomy for intractable disease, dysplasia or cancer. In this
group, two side-by-side four-quadrant biopsies are taken every centimetre through the entire resected spec imen . As in the surveillance group, one biopsy at each site is prepared for flow cytometry, the other for histology. Thus far, over 1300 biopsies from 12 patients in this group have been evaluated.
The initia l criteria used to define aneuploidy was the presence of a discrete peak of cells distinct from the GO/G l an<l G2/M peaks that conta ined at least 5% of the total cell population. Using these criteria alone, a high frequency of aneuploidy was found (about 15% of the biopsies). Forty per cent of patients had one or more biopsies that were aneuploid. A large percentage of these putative aneuploid peaks are near d iploid peaks, that is, they are discrete peaks, hut they have DNA contents less than 1.2 times the diplo id peak (Figure 9).
In the surveillance group, over 80<.)i, of the aneuploid biopsies not showing dysplasia fell into the 'near diploid ' group. The frequency of aneuploidy in the nondysplast ic tissue is thus influenced greatly by whether one interprets the near diploid peaks as aneuploidy. Interobserver variation in the interpre tation of near diploid peaks has been noted in other tissues (9). This difference may well account for much of the variabili ty in the literatu re c ited above. As in the other studies in lite ra ture, the present authors achieved a highly significant increase in the frequency of aneuploidy both in dysplastic biopsies and in patients who have dysplas ia or cancer.
Two other encouraging aspects of these studies should be mentioned. First, patients who come to colectomy because of dysplasia or cancer a re very frequently found ro have markedly abnormal flow cytometric analysis with multiple areas of aneuploid populations of d ifferent DNA index. For example, one of the patients studied came to
colectomy because of a cancer found at the hepatic flexure. Multiple areas of dysplas ia were seen in the splenic flexure as well as in the transverse colon. T he majori ty of these dysplastic biopsies were aneuplo id in ad<licion,
CAN J GASTROENTEROL VOL 4 No 7 NOVEMRl:R 1990
Flow cytometry in chronic ulcerative colitis
there were many nondysplast1c biopsies that were a lso aneuplo id. Overa ll , n ine separate aneuploid popul:uions were identified in this colonic mucosa. The presence of multiple aneuploid populations in patients with <lysplasia and cancer has also been seen by several other groups who have examined this question. These observations suggest that in the late stages of carcinogenesis in chronic ulcerative colitis, aneuploidy is a prominent featu re of the colonic mucosa. Secondl y, the authors have been encouraged by the frequent find ing that not only dysplastic biopsies show aneuploidy, but the same aneuploid population can often be seen in nondysplastic mucosa adjacent to dysplasia. For example, one patient had two biopsies at the hepatic flexure which showed dysplasia and were ancuploid with a DNA index of about l.7. In addition, however, four a<ljaccnt nondysplastic biopsies showed the same aneuploid population. This type of observa1 ion suggests the possi bi Ii ty that aneuploidy may appear as a type of field effect and, if th is is so, could decrease the problem with sampling error when looking for dysplasia. These observations encourage cont mued evaluation of aneuploidy as a promising marker of cancer risk in chronic ulcerative colitis.
CONCLUSIONS The current data suggest that
aneuploidy occur~ commonly in ch ronic ulcera tive colitis and that it correlates with the established markers of cancer risk in this setting. Aneuploidy is more common in patients with dysplasia and cancer, but not all patients wi th ncoplasia have detectable aneuplo idy. Aneuploidy is also more common in dysplastic and cancerous hiopsie~ than in nondysplastic mucosa, but not all neoplastic biopsies a re aneuploid. Aneuploidy abo clearly occurs in non-neoplast ic mucosa. The cl inical meaning of the presence of aneuploidy in nondysplastic mucosa is not yet known and the authors Jo not currently recommend altering clinical decision making on the basis of a single ancuploid population in a pat ient with ulcerat ive coli tis.
395
AHNEN eta/
Nonetheless, ancuplmdy 1s the most promismg of the new markers for the detection of cancer nsk m ulcerative colitis and Jescrves further evaluation.
The data al o suggest that aneuploiJ populations can appear over wide expanses of the colonic mucosa. This kind of observation can be viewed as an example of clonal expansion in this mucosa. It 1s possible th<1t the ulceration and denudation of the mucosa that occurs in ulcera tive colitis a llows the opportunity fur a clone of cells that has growth advantage to repopulate large areas of the colonic mucosa. In the absence of such denudatton, perhaps this abnormal clone would be limited to a single crypt anJ the cells woulJ be slougheJ off inro the lumen as they norma lly a re. In the context of multi stage carcmogenesis, one can view the appearance of aneuplo1dy m mult1ple areas of the colon as an example of such clonal expansion. If this aneuploiJ population were to represent one of the genetic events responsible for a seep in carcmogenes1s, its expansion over a wiJer area of the colon would mean that there would be a larger number of cells now a'-'ailable for subsequent carc inogenic steps, making cancer more probable. The most commonly held view is that ane uploidy does not ibelf represent a spec ific genetic event necessary for carcmogenesis, but 1s a
ACKNOWLEDGEMENTS: The authors acknowledge che many gast roenrerologiMs and surgeom in the Denver .ind C levchmJ areas who have conmhured case material for rhcsc sruJks. ~/ rrlwur rhl'm, rim, 1~'<>rl.. woulJ not be possihlc.
REFERENCES I. Hammarherg C, Ruh10 C, Slezak P,
Tribukair B, Ohman U. Flowwcytomcm c DNA ana lysis as a means for early detection of malignancy 111
pancnrs with chm111c ulceranve coliu,. Gut 1984;25:905-8.
2. Hammarbcrg C, Slezak P, Trihuka,r B. Early detccnon of malignancy 111 ulcerati ve colitis. A flow-cytomcm c
396
marker of the genomic instability that charac tenzes premalignant mucosa.
Analysts of the present Jara suggests that variable interpretation of the near d1plo1d peaks may account for some of the diffe rences reported m the literature about the relationship between aneuploidy, dysplasia and cancer m chronic ulcerative colitis. Inclusion of the near diploid populations in the authors' data markedly mcreases the overall frequency of aneuplo idy, particularly m the nondysplnstic group.
RESEARCH NEEDS From this review of the literature
and the present data, 1t appears that there are several important research needs that should be addressed. From a technical standpoint, 1t 1s important tn
attempt to define more prec isely the ..'i tgnificance of the near Jiplotd populations. Such populations coulJ be Jue to near diploiJ aneuploidy or they could represent somethmg else, such as differential dye bindmg. For example, a population of cells might more avidly bmd the fluorescent dye anJ thus have a marginally higher intensity of fluorescence, appeanng as a near diploid peak. In adJ1tion, methods of preparation of cells could conceivably produce such near d1plmd peaks.
To compare flow cytometrtc analyses from Jifferent cen tres, 1t will
DNA study. Camer 1984;5 3:291-5. 3. Fozard JBJ , Q uirke P, Dixon MF, Giles
GR, B1rJ CC. DNA ancuplo1dy 111 ulcenm ve col ms. G ut 1986;27: 1414-8.
4. Melville OM, Jass JR, Shepherd NA, er ,11. Dysplasia and dcoxynhonucleic ac1J ancuplmdy 111 the assessment of precancerous changes 111 chrome ulceranve colitis. Ohservcr variation Jnd corrchmons. Gastmcmerology I 988;95:668-75.
5 Borkic R, Host mark J, Skagen OW, Schrumpf E, Lacrum OD. Floww cytomctry of h1opsy spec1mem from ulcerative cola11,, colorcc tal ademomas, and carc111omas. &.and J G,1stroentcml 1987;22: 1231-7.
6. Ruregard J, Ahsgrcn L, Stcnlmg R, Roos G. DNA concem 111 ulccnmve
be important to standardize both the methodology (sample preparation and stammg) anJ the software used to interpret the flow histograms. This is particu larly important when trying to compare the meaning of quanmat1ve results between different flow cytometry centres.
In the clinical area, the most pressing need is for follow-up stuJies of patients with aneuploidy with or without dysplasia to determme whether aneuploidy is predictive of current anJ/or subsequent colon can cer nsk. This can be Jone in the settmg of ongoing prospecttve trials, but in addition, a multicentre case control study using archival specime ns seems feasible and could po tentia lly answer this question more quickly.
SUMMARY The emerging literature usmg flow
cytome try in the setting of ulcerative colitis has thus far prnnarily focused on measurement of DNA rnntent and aneuplo1dy. These studies have sh<lwn a significant relat1onsh1p hetwccn aneuplo 1dy and the current be~t markers of cancer risk tn this population. Aneuplo1dy certainly deserves rigorous test ing to determine 1f its presence will he of clinical value in assessing cancer risk tn patients with chronic ulcerative colttis.
col ms. Flow cyromerry analysis 111 a patient series from a defined arc,1. D1s Colon Rectum 1989; 32: 1055-9.
7. Ll\fberg R, Tnhukait B, Ost A, Rmstriim 0, Reichard H. Flow cycomemc DNA analysis 111 long~tanJ. ing ulcera11ve colitis: A method of preJiction of Jysplm,m anJ carc111om,1 development? G ut 1987;28: 1100-6.
8. Levine OS, Reid BJ, Haggm CE. Ruhm PJ, Dean PJ, Rabmovitch PS. Frequency ,md J1stnbution of ancuplmd cell populations m chronic ulcerative colim. Grn,trocnccmloh'Y I 988;94:A260.
9. Joensuu H, Kall10111em1 0-P. Different (>piniom on cla.ssifkauon of DNA h1sto· gram., produced fmm paraffin-embcdJcJ nssue Cyrometry 1989; I 0: 711 -7.
CAN J GASTROENT!oROL VOL 4 No 7 NOVEMBER 1990

Submit your manuscripts athttp://www.hindawi.com
Stem CellsInternational
Hindawi Publishing Corporationhttp://www.hindawi.com Volume 2014
Hindawi Publishing Corporationhttp://www.hindawi.com Volume 2014
MEDIATORSINFLAMMATION
of
Hindawi Publishing Corporationhttp://www.hindawi.com Volume 2014
Behavioural Neurology
EndocrinologyInternational Journal of
Hindawi Publishing Corporationhttp://www.hindawi.com Volume 2014
Hindawi Publishing Corporationhttp://www.hindawi.com Volume 2014
Disease Markers
Hindawi Publishing Corporationhttp://www.hindawi.com Volume 2014
BioMed Research International
OncologyJournal of
Hindawi Publishing Corporationhttp://www.hindawi.com Volume 2014
Hindawi Publishing Corporationhttp://www.hindawi.com Volume 2014
Oxidative Medicine and Cellular Longevity
Hindawi Publishing Corporationhttp://www.hindawi.com Volume 2014
PPAR Research
The Scientific World JournalHindawi Publishing Corporation http://www.hindawi.com Volume 2014
Immunology ResearchHindawi Publishing Corporationhttp://www.hindawi.com Volume 2014
Journal of
ObesityJournal of
Hindawi Publishing Corporationhttp://www.hindawi.com Volume 2014
Hindawi Publishing Corporationhttp://www.hindawi.com Volume 2014
Computational and Mathematical Methods in Medicine
OphthalmologyJournal of
Hindawi Publishing Corporationhttp://www.hindawi.com Volume 2014
Diabetes ResearchJournal of
Hindawi Publishing Corporationhttp://www.hindawi.com Volume 2014
Hindawi Publishing Corporationhttp://www.hindawi.com Volume 2014
Research and TreatmentAIDS
Hindawi Publishing Corporationhttp://www.hindawi.com Volume 2014
Gastroenterology Research and Practice
Hindawi Publishing Corporationhttp://www.hindawi.com Volume 2014
Parkinson’s Disease
Evidence-Based Complementary and Alternative Medicine
Volume 2014Hindawi Publishing Corporationhttp://www.hindawi.com