aviralbranchingmodelforpredictingthe ... · aviralbranchingmodelforpredictingthe ......
TRANSCRIPT
Vol. 29, No. 2, March–April 2010, pp. 348–365issn 0732-2399 �eissn 1526-548X �10 �2902 �0348
informs ®
doi 10.1287/mksc.1090.0520©2010 INFORMS
A Viral Branching Model for Predicting theSpread of Electronic Word of Mouth
Ralf van der Lans, Gerrit van BruggenRotterdam School of Management, Erasmus University, 3000 DR Rotterdam, The Netherlands
{[email protected], [email protected]}
Jehoshua EliashbergThe Wharton School of the University of Pennsylvania, Philadelphia, Pennsylvania 19104,
Berend WierengaRotterdam School of Management, Erasmus University, 3000 DR Rotterdam, The Netherlands,
In a viral marketing campaign, an organization develops a marketing message and encourages customersto forward this message to their contacts. Despite its increasing popularity, there are no models yet thathelp marketers to predict how many customers a viral marketing campaign will reach and how marketerscan influence this process through marketing activities. This paper develops such a model using the theory ofbranching processes. The proposed viral branching model allows customers to participate in a viral marketingcampaign by (1) opening a seeding e-mail from the organization, (2) opening a viral e-mail from a friend, and(3) responding to other marketing activities such as banners and offline advertising. The model parametersare estimated using individual-level data that become available in large quantities in the early stages of viralmarketing campaigns. The viral branching model is applied to an actual viral marketing campaign in whichover 200,000 customers participated during a six-week period. The results show that the model quickly predictsthe actual reach of the campaign. In addition, the model proves to be a valuable tool to evaluate alternativewhat-if scenarios.
Key words : branching processes; forecasting; Markov processes; online marketing; viral marketing; word ofmouth
History : Received: March 4, 2008; accepted: May 27, 2009; processed by Carl Mela. Published online in Articlesin Advance August 26, 2009.
1. IntroductionIn October 2006, Unilever launched a 75-second viralvideo film, Dove Evolution. This campaign generatedover 2.3 million views in its first 10 days and threetimes more traffic to its website than the 30-secondcommercial that aired during the Super Bowl (vanWyck 2007). More recently, Comic Relief, a Britishcharity organization, achieved 1.16 million partici-pants in the first week after launching their viralgame “Let It Flow” that promoted Red Nose Day,their main money-raising event (New Media Age 2007).These two examples illustrate a new way of market-ing communication in which organizations encouragecustomers to send e-mails to friends containing a mar-keting message or a link to a commercial website.Because information spreads rapidly on the Internet,viral marketing campaigns have the potential to reachlarge numbers of customers in a short period of time.Not surprisingly, many companies such as Microsoft,Philips, Sony, Ford, BMW, and Procter & Gamble
have gone viral. However, not all viral marketingcampaigns are successful, and because of competi-tive clutter, they need to become increasingly sophis-ticated in order to be effective and successful. It isalso important that marketers be able to predict thereturns on their expenditures and thus how manycustomers they will reach. As one marketing agencyexecutive stated: “The move to bring a measure ofpredictability to the still-unpredictable world of viralmarketing is being driven by clients trying to balancethe risks inherent in a new marketing medium withthe need to prove return on investment” (Morrissey2007, p. 12). Despite their importance, no forecastingtools for these purposes are available yet. The aim ofthis research is to develop a model that predicts howmany customers a viral marketing campaign reaches,how this reach evolves, and how it depends on mar-keting activities.The structure of this paper is as follows. Section 2
defines viral marketing campaigns and describes
348
van der Lans et al.: A Viral Branching Model for Predicting the Spread of Electronic Word of MouthMarketing Science 29(2), pp. 348–365, © 2010 INFORMS 349
how marketers can influence the viral process. Sec-tion 3 shows how the flow of communication amongcustomers in viral marketing campaigns follows abranching process, and we introduce our viral branch-ing model (VBM). Section 4 describes the data of areal-life viral marketing campaign that reached over200,000 customers after only six weeks. The predic-tive performance of our model, analyzed using datafrom this campaign, is presented in §5. The final sec-tion discusses implications of our research and sug-gestions for further research.
2. Viral Marketing CampaignsIn a viral marketing campaign, an organization devel-ops an online marketing message and stimulates cus-tomers to forward this message to members of theirsocial network. These contacts are subsequently moti-vated to forward the message to their contacts, and soon. Because messages from friends are likely to havemore impact than advertising and because informa-tion spreads rapidly over the Internet, viral market-ing is a powerful marketing communication tool thatmay reach many customers in a short period of time(De Bruyn and Lilien 2008). Furthermore, the natureof the Internet allows marketers to use many differ-ent forms of communication such as videos, games,and interactive websites in their viral campaigns. Theterm viral marketing may (incorrectly) suggest thatinformation spreads automatically (Watts and Peretti2007). However, marketers need to actively managethe viral process to facilitate the spread of information(Kalyanam et al. 2007).
2.1. Marketing Activities for Managing ViralMarketing Campaigns
In viral marketing campaigns, marketers may use twotypes of strategies to influence the spread of infor-mation. The first focuses on motivating customers toforward marketing messages to their contacts (Chiuet al. 2007, Godes et al. 2005, Phelps et al. 2004).As suggested by Godes et al. (2005) motivations toforward messages are either intrinsic or extrinsic. Theformer can be triggered by the content of the mar-keting message. Important components of the mar-keting message are the subject line of the e-mail andthe text in the e-mail itself (Bonfrer and Drèze 2009).Furthermore, marketers nowadays develop websitescontaining videos and games that attract customerattention and interests. These websites usually facili-tate the viral process by providing tools to easily for-ward e-mails to friends, such as “Tell a Friend” or“Share Video” buttons. Examples of extrinsic motiva-tions to forward marketing messages are prizes andother monetary incentives (Biyalogorsky et al. 2001).Although increasing customers’ motivation to for-
ward messages to friends has a strong impact on the
reach of the viral campaign, this is usually a diffi-cult and expensive task. In contrast, controlling thenumber of initial or seeded customers is much morecost effective. In general, marketers can choose fromthree distinct categories to seed their viral marketingcampaign: (1) seeding e-mails, (2) online advertising,and (3) offline advertising. Seeding e-mails are usu-ally sent by the company itself or by a specializedmarketing agency to customers who have given per-mission to receive promotional e-mails (Bonfrer andDrèze 2009). Using this seeding tool, a marketer cantarget a specific group of customers that are poten-tially interested in the campaign. The design and con-tent of the e-mails are crucial because customers easilycategorize such e-mails as spam and quickly deletethem. For this reason, seeding e-mails are expectedto be less effective than viral e-mails that are sent byfriends or acquaintances of the recipient.Online advertising is another important seeding
tool that marketers can use to influence the viralprocess. The effectiveness of online advertising maydiffer depending on the customers as well as the web-sites on which the ads are placed. It is worth notingthat marketers can directly observe when a specificonline ad generates a visitor to the viral campaign.Hence, the effectiveness of online advertising can bemonitored accurately, and based on its performance,marketers can decide to adapt their online advertis-ing strategy. Furthermore, online advertising agenciesoffer contracts that guarantee a predetermined num-ber of clicks to the campaign website within a certaintime window. In such cases organizations usually payfor each click. Because online ads may be perceived asless obtrusive than promotional e-mails, this seedingtool may be very attractive.Finally, besides online seeding tools, marketers may
still use “traditional” offline advertising to seed theircampaigns. Examples are magazine or TV ads thatrefer to the website of the viral marketing campaign,and package labels or coupons that try to attract vis-itors to the campaign website. However, offline seed-ing is less popular and expected to be less effectivebecause customers cannot directly visit the campaignwebsite by clicking a link. Another disadvantage ofoffline seeding is that it is more difficult to measureits effectiveness, because marketers cannot directlyobserve when offline advertising generates a cus-tomer to the viral campaign. Possible solutions forthis problem are asking customers on the website howthey were informed or to ask for the barcode of theproduct or coupon that was used to enter the website.As described above, the appropriate strategic deci-
sion of the marketing activities at the right momentstrongly depends on the spread of the process andthe effectiveness of each marketing communicationtool. Therefore, marketers need to closely monitor thespread of information in viral marketing campaigns.
van der Lans et al.: A Viral Branching Model for Predicting the Spread of Electronic Word of Mouth350 Marketing Science 29(2), pp. 348–365, © 2010 INFORMS
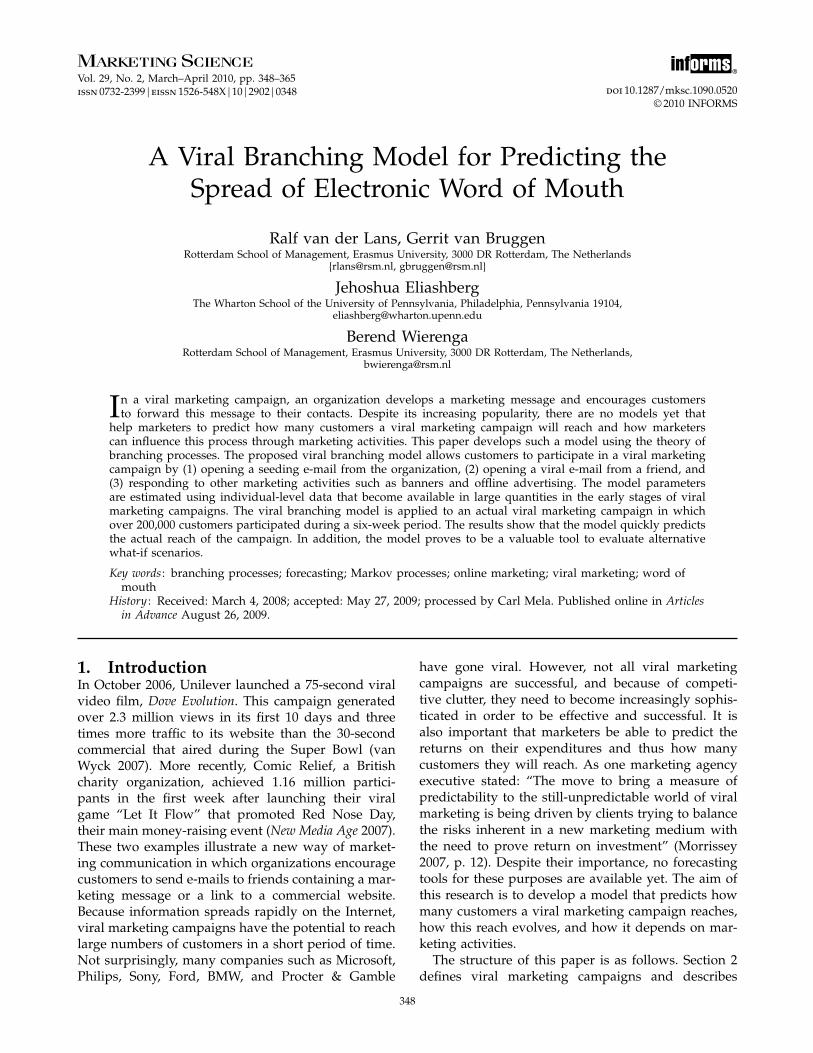
Figure 1 Decision Tree to Participate in Viral Marketing Campaign
1. Receiving invitation to viralcampaign at t1
2. Reading invitation at t2
3. Visiting landing page viralcampaign at t3
4. Participating in viralcampaign at t4
5. Inviting x = 0,1,2,... friendsx~arbitrary distribution
with mean �Exit
1– �12b
�12b
�23b
�34b
1– �23b
1– �34b
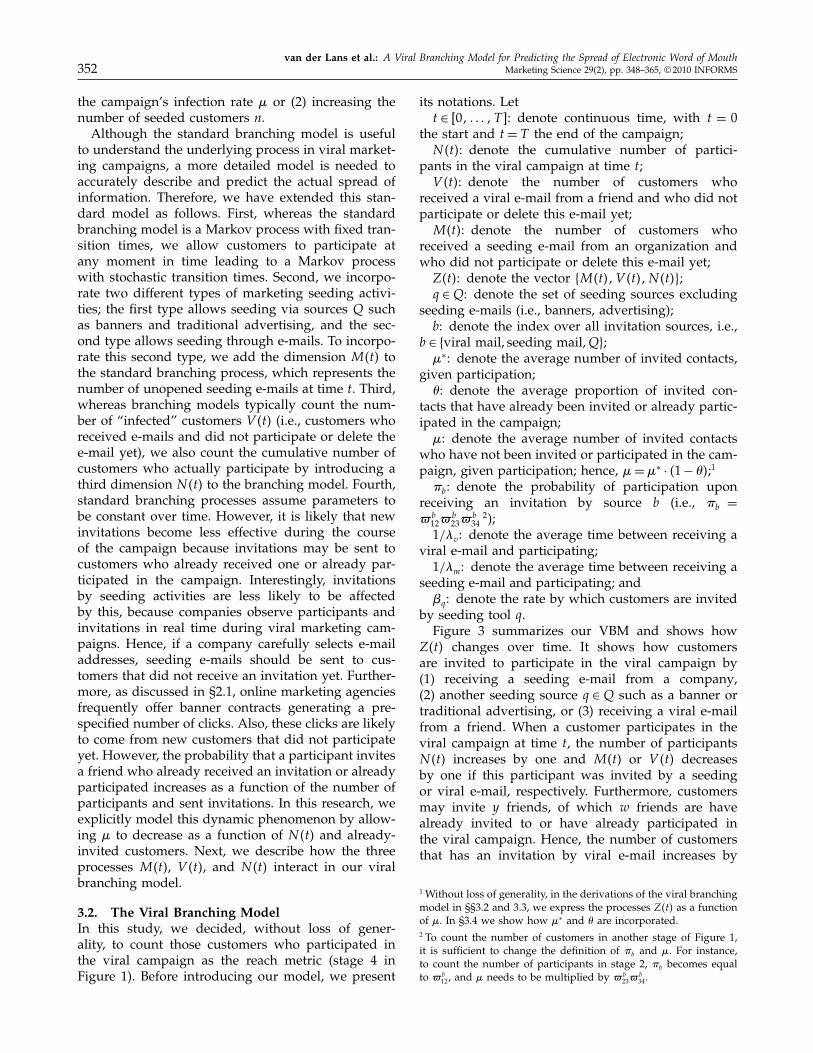
2.2. Monitoring Viral Marketing CampaignsAn important feature of viral marketing campaignsis that marketers are able to accurately measure theactions of customers, such as when they open ane-mail (Bonfrer and Drèze 2009) and which pagesthey visit (Moe 2003). Hence, marketers may obtainlarge databases containing detailed customer behav-ior. Monitoring such behavior is not straightforward,and it is therefore important to retain only those vari-ables that are relevant to the viral process.Figure 1 summarizes the five-stage process that a
customer may go through during a viral marketingcampaign. In the first stage, a customer receives aninvitation at time t1 from source b, i.e., through aviral e-mail from a friend or through one of the seed-ing tools of a company. At the end of this stage,the customer decides with probability �b
12 to go tothe second stage and read the invitation at time t2,or with probability 1 − �b
12 to exit the campaign bydeleting or ignoring the invitation. This probability�b12 is likely to depend on the source of invitation b,
because customers are less likely to open and read aseeding e-mail from a company than a viral e-mailfrom a friend. After reading the invitation to the viralcampaign, a customer decides to accept the invitationwith probability �b
23 by clicking a link to the landingpage of the campaign website. After arriving on thelanding page at time t3 (stage 3), a customer decidesto participate in the viral campaign (stage 4) withprobability �b
34 at time t4. Participation may consist ofwatching a video, playing a game, and/or subscrib-ing to a service. Finally, a customer decides to forwardthe message to x friends.Figure 1 indicates that the number of customers
receiving an e-mail is not necessarily the same as thenumber of customers who ultimately participate in
the viral campaign, as this depends on the probabil-ities �b
12, �b23, and �b
34. As described in §2.1, theseprobabilities depend on marketing activities such asthe attractiveness of the subject line (�b
12), the con-tent of the invitation (�b
23), and the design and con-tent of the website (�b
34). Although the sequence ofstages is quite generic for most viral marketing cam-paigns (De Bruyn and Lilien 2008), we recognize thatit does not necessarily hold for all viral marketingcampaigns. For instance, participation may consist ofseveral stages (activities) such as watching a video,subscribing to a newsletter, and/or playing a game.In addition, it is possible that customers forward themessage before participation, i.e., in cases where cus-tomers can only participate when they invite a certainnumber of friends. Therefore, marketers should adaptFigure 1 depending on the specific structure of theircampaign. For the campaign of interest in our empir-ical application, Figure 1 accurately matches its struc-ture. However, the agency executing our campaigndid not store data for stages 2 and 3. Hence, for eachparticipant we observed the transition from stages1 to 4, which occurred with probability �b
12�b23�
b34.
Adapting our model (§3) to an alternative structureof a viral marketing campaign is straightforward.To manage viral marketing campaigns, marketers
need to monitor the stages represented in Figure 1for each individual customer. Specifically, they shouldregister the following variables: (1) the source of theinvitation, (2) if and when a customer arrives at eachstage, and (3) how many friends a customer invites.This leads to a dynamic database in which each rowrepresents a customer and in which correspondingvariables are updated when a customer switches tothe next stage. New rows are added when new cus-tomers are invited. Such a database can be automat-ically generated in real time during the process of aviral marketing campaign.In summary, viral marketing is an effective online
marketing communication tool that may reach manycustomers in a short period of time. The reach ofa viral marketing campaign is a function of seedingactivities and the number of forwarded viral e-mails.Although the seeding activities are under the directcontrol of marketers, they can only influence the num-ber of forwarded e-mails through incentives. To reachthe campaign’s goals, it is important for marketersto be able to forecast the reach of a viral marketingcampaign as early as possible and to determine howthis reach depends on marketing activities. Becausetools for supporting these forecasts do not yet exist,we have developed such a forecasting model in thenext section.
van der Lans et al.: A Viral Branching Model for Predicting the Spread of Electronic Word of MouthMarketing Science 29(2), pp. 348–365, © 2010 INFORMS 351
3. Modeling the ViralMarketing Process
Insights from epidemics about the spread of virusesare useful to understand and model the spread ofmarketing messages in viral marketing campaigns.In epidemics, both aggregate- and disaggregate-levelmodels have been developed to describe the spreadof viruses (Bartlett 1960). Aggregate-level or diffu-sion models assume an underlying infection process,and the corresponding model parameters are inferredfrom the total number of infected individuals overtime. Based on these insights, Bass (1969) developedhis famous diffusion model and assumed adoptionto depend on two forces: one that is independent ofprevious adoptions and one that depends positivelyon previous adoptions. As the number of customersin viral marketing campaigns (i.e., adopters) is alsoinfluenced by these two forces, the Bass model shouldbe able to describe the spread of information duringviral marketing campaigns. However, there are twoimportant reasons why the Bass model does not opti-mally describe the viral marketing process. First, itassumes a specific process but does not include actualinformation on this process at the individual level.Such information becomes readily available in viralmarketing campaigns and can be used to describe theprocess accurately at the aggregate level. Second, theBass model assumes that every customer who hasadopted the product increases the probability of oth-ers adopting in each time period after adoption. How-ever, in viral marketing campaigns, customers onlyinfluence each other right after participation whenthey invite their friends.Disaggregate-level or branching process models
(Athreya and Ney 1972, Dorman et al. 2004, Harris1963) may alleviate these two limitations as parame-ters are estimated based on individual-level informa-tion, and they assume that customers only influenceeach other right after participation by infecting afixed number of others. Although branching processmodels have proven to be very useful in describingthe spread of viruses theoretically, to our knowledge,they have not been applied to real empirical pro-cess data so far. The reason for this is that, similarto the diffusion of products, the process of the actualspread of viruses is typically not observed. Interest-ingly, in viral marketing campaigns, marketers canobserve the actual spread of information across cus-tomers, and branching processes might therefore bea promising tool to describe and predict the reachof these campaigns. Furthermore, because standardbranching models and their extensions are not capa-ble of describing viral marketing campaigns, anothercontribution of our research is to extend the standardbranching model. To do so, we now first explain thestandard branching process.
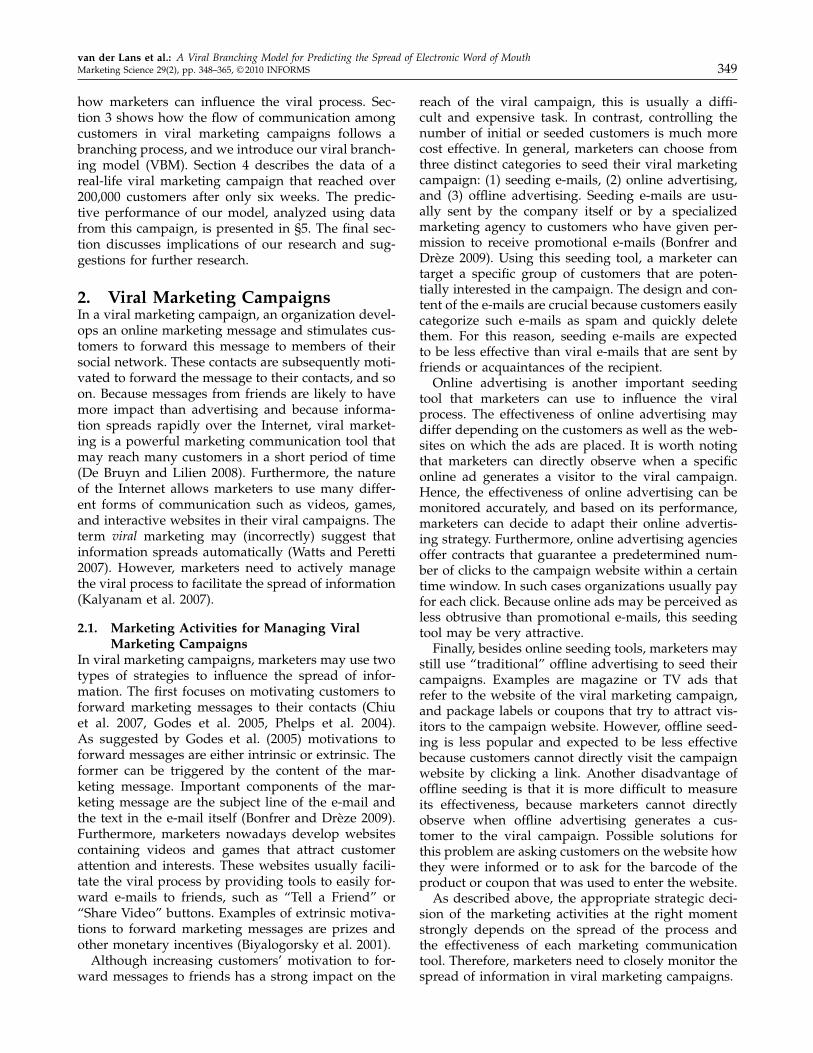
3.1. Viral Marketing as a Branching ProcessBranching processes, or Galton-Watson processes,were originally developed at the end of the 19th cen-tury to derive the probability of extinction of families(Athreya and Ney 1972, Dorman et al. 2004, Harris1963). Generalizations of these processes, of whichthe birth-and-death process is an example, have beenapplied to model phenomena in physics, biology, andepidemiology to describe the spread of viruses inpopulations. Figure 2 graphically demonstrates thespread of information according to a standard branch-ing process. The process represents T generations ofcustomers that all invite x = 2 other customers. Inthe branching literature, x is crucial and has an arbi-trary probability distribution with mean �, which iscalled the infection or reproduction rate of the pro-cess. In Figure 2, the first generation (represented bystars) consists of an initial seed of n “infected” cus-tomers that forward the message to a second gen-eration of customers that subsequently forward themessage to a third generation, etc. Therefore, thetotal number of customers V t in generation t equalsnxt−1, and the total reach of the campaign at gen-eration T equals n
∑Tt=1 x
t−1. In situations where theinfection rate is greater than one, it is sufficient formarketers to seed only a few initial customers to startthe viral process, after which the whole populationwill ultimately be infected. However, unlike in an epi-demic, the infection rate in viral marketing campaignsis generally smaller than one (Watts and Peretti 2007),which means that the spread of information dies outquickly as each customer generates on average lessthan one new customer. In such situations, marketersshould influence the viral process by (1) increasing
Figure 2 Spread of a Message in a Viral Marketing Campaign as aBranching Process
SeedsCustomers ingeneration T
Generation
..
..
..
..
..
..
..
..
..
..
..
..
..
..
..
1 2 3 4 T
van der Lans et al.: A Viral Branching Model for Predicting the Spread of Electronic Word of Mouth352 Marketing Science 29(2), pp. 348–365, © 2010 INFORMS
the campaign’s infection rate � or (2) increasing thenumber of seeded customers n.Although the standard branching model is useful
to understand the underlying process in viral market-ing campaigns, a more detailed model is needed toaccurately describe and predict the actual spread ofinformation. Therefore, we have extended this stan-dard model as follows. First, whereas the standardbranching model is a Markov process with fixed tran-sition times, we allow customers to participate atany moment in time leading to a Markov processwith stochastic transition times. Second, we incorpo-rate two different types of marketing seeding activi-ties; the first type allows seeding via sources Q suchas banners and traditional advertising, and the sec-ond type allows seeding through e-mails. To incorpo-rate this second type, we add the dimension Mt tothe standard branching process, which represents thenumber of unopened seeding e-mails at time t. Third,whereas branching models typically count the num-ber of “infected” customers V t (i.e., customers whoreceived e-mails and did not participate or delete thee-mail yet), we also count the cumulative number ofcustomers who actually participate by introducing athird dimension Nt to the branching model. Fourth,standard branching processes assume parameters tobe constant over time. However, it is likely that newinvitations become less effective during the courseof the campaign because invitations may be sent tocustomers who already received one or already par-ticipated in the campaign. Interestingly, invitationsby seeding activities are less likely to be affectedby this, because companies observe participants andinvitations in real time during viral marketing cam-paigns. Hence, if a company carefully selects e-mailaddresses, seeding e-mails should be sent to cus-tomers that did not receive an invitation yet. Further-more, as discussed in §2.1, online marketing agenciesfrequently offer banner contracts generating a pre-specified number of clicks. Also, these clicks are likelyto come from new customers that did not participateyet. However, the probability that a participant invitesa friend who already received an invitation or alreadyparticipated increases as a function of the number ofparticipants and sent invitations. In this research, weexplicitly model this dynamic phenomenon by allow-ing � to decrease as a function of Nt and already-invited customers. Next, we describe how the threeprocesses Mt, V t, and Nt interact in our viralbranching model.
3.2. The Viral Branching ModelIn this study, we decided, without loss of gener-ality, to count those customers who participated inthe viral campaign as the reach metric (stage 4 inFigure 1). Before introducing our model, we present
its notations. Lett ∈ �0� � � � � T �: denote continuous time, with t = 0
the start and t = T the end of the campaign;Nt: denote the cumulative number of partici-
pants in the viral campaign at time t;V t: denote the number of customers who
received a viral e-mail from a friend and who did notparticipate or delete this e-mail yet;
Mt: denote the number of customers whoreceived a seeding e-mail from an organization andwho did not participate or delete this e-mail yet;
Zt: denote the vector �Mt�V t�N t�;q ∈Q: denote the set of seeding sources excluding
seeding e-mails (i.e., banners, advertising);b: denote the index over all invitation sources, i.e.,
b ∈ {viral mail, seeding mail,Q};�∗: denote the average number of invited contacts,
given participation;�: denote the average proportion of invited con-
tacts that have already been invited or already partic-ipated in the campaign;
�: denote the average number of invited contactswho have not been invited or participated in the cam-paign, given participation; hence, �=�∗ · 1− �;1
�b: denote the probability of participation uponreceiving an invitation by source b (i.e., �b =�b12�
b23�
b342);
1/�v: denote the average time between receiving aviral e-mail and participating;1/�m: denote the average time between receiving a
seeding e-mail and participating; and�q : denote the rate by which customers are invited
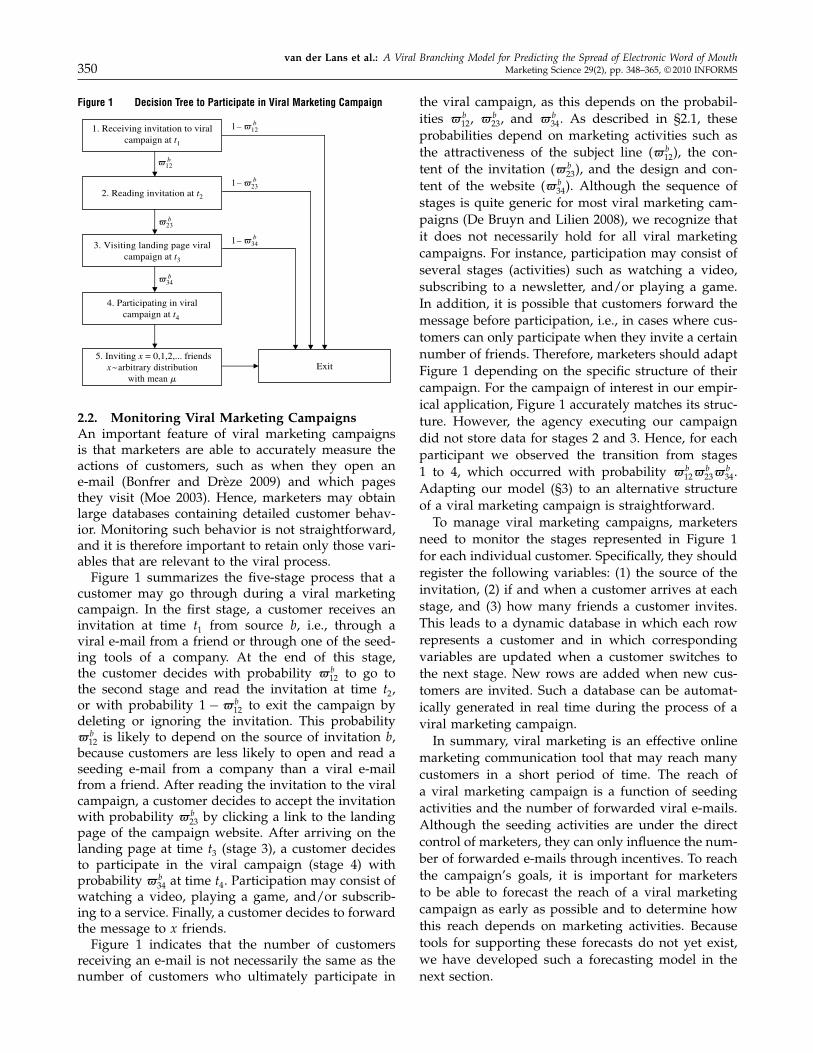
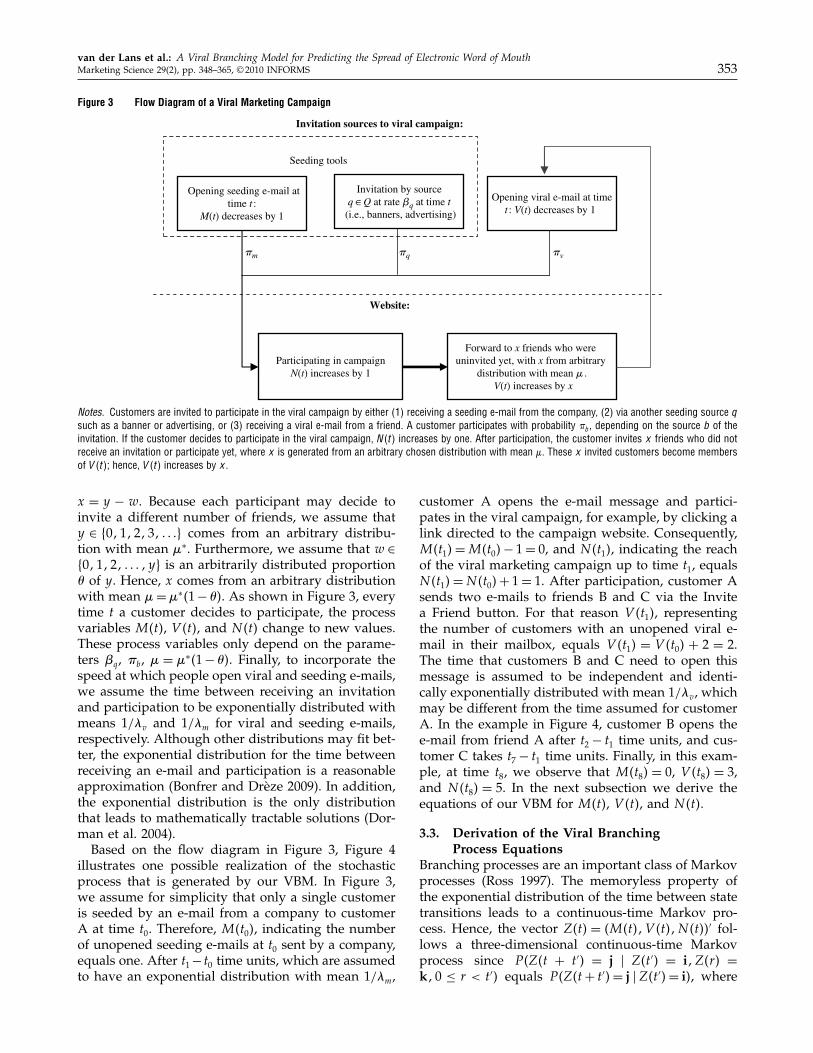
by seeding tool q.Figure 3 summarizes our VBM and shows how
Zt changes over time. It shows how customersare invited to participate in the viral campaign by(1) receiving a seeding e-mail from a company,(2) another seeding source q ∈Q such as a banner ortraditional advertising, or (3) receiving a viral e-mailfrom a friend. When a customer participates in theviral campaign at time t, the number of participantsNt increases by one and Mt or V t decreasesby one if this participant was invited by a seedingor viral e-mail, respectively. Furthermore, customersmay invite y friends, of which w friends are havealready invited to or have already participated inthe viral campaign. Hence, the number of customersthat has an invitation by viral e-mail increases by
1 Without loss of generality, in the derivations of the viral branchingmodel in §§3.2 and 3.3, we express the processes Zt as a functionof �. In §3.4 we show how �∗ and � are incorporated.2 To count the number of customers in another stage of Figure 1,it is sufficient to change the definition of �b and �. For instance,to count the number of participants in stage 2, �b becomes equalto �b
12, and � needs to be multiplied by �b23�
b34.
van der Lans et al.: A Viral Branching Model for Predicting the Spread of Electronic Word of MouthMarketing Science 29(2), pp. 348–365, © 2010 INFORMS 353
Figure 3 Flow Diagram of a Viral Marketing Campaign
Participating in campaignN(t) increases by 1
Forward to x friends who were uninvited yet, with x from arbitrary
distribution with mean � .V(t) increases by x
time t :M(t) decreases by 1
t : V(t) decreases by 1
Invitation by sourceq ∈ Q at rate �q at time t
(i.e., banners, advertising)
Invitation sources to viral campaign:
Website:
Seeding tools
�m �q �v
Opening seeding e-mail atOpening viral e-mail at time
Notes. Customers are invited to participate in the viral campaign by either (1) receiving a seeding e-mail from the company, (2) via another seeding source q
such as a banner or advertising, or (3) receiving a viral e-mail from a friend. A customer participates with probability �b , depending on the source b of theinvitation. If the customer decides to participate in the viral campaign, N�t� increases by one. After participation, the customer invites x friends who did notreceive an invitation or participate yet, where x is generated from an arbitrary chosen distribution with mean . These x invited customers become membersof V �t�; hence, V �t� increases by x.
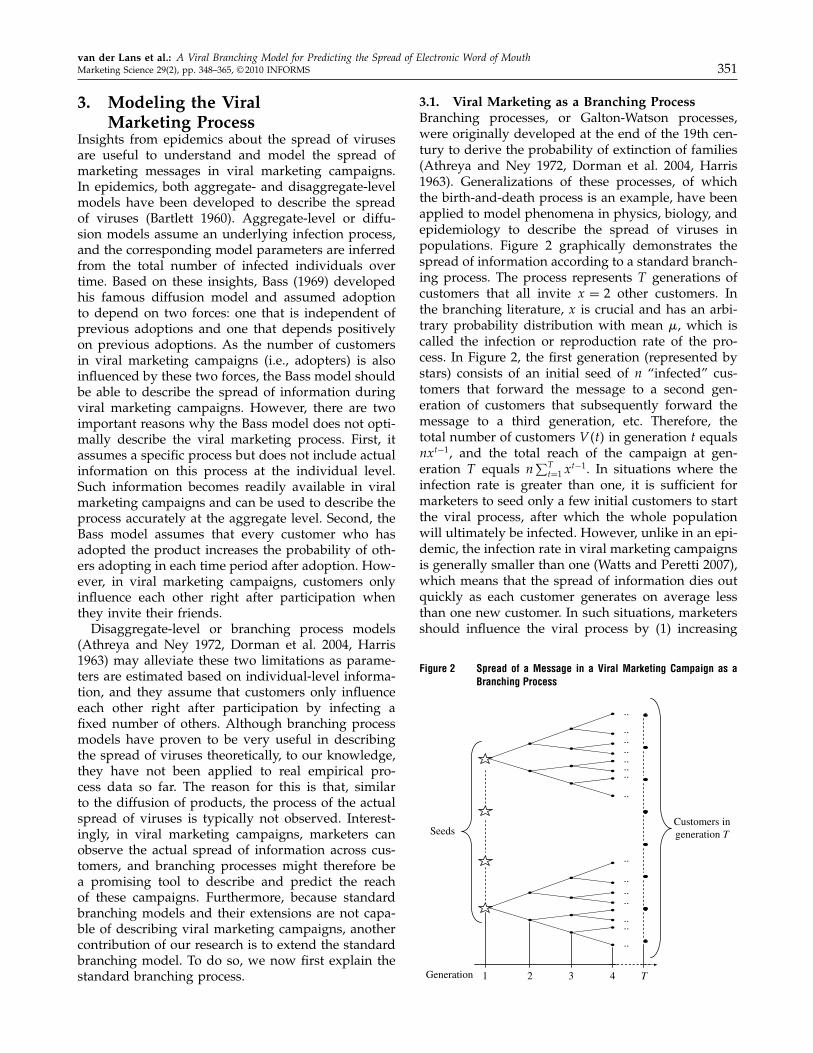
x = y − w. Because each participant may decide toinvite a different number of friends, we assume thaty ∈ �0�1�2�3� � � �� comes from an arbitrary distribu-tion with mean �∗. Furthermore, we assume that w ∈�0�1�2� � � � � y� is an arbitrarily distributed proportion� of y. Hence, x comes from an arbitrary distributionwith mean �=�∗1− �. As shown in Figure 3, everytime t a customer decides to participate, the processvariables Mt, V t, and Nt change to new values.These process variables only depend on the parame-ters �q , �b, � = �∗1− �. Finally, to incorporate thespeed at which people open viral and seeding e-mails,we assume the time between receiving an invitationand participation to be exponentially distributed withmeans 1/�v and 1/�m for viral and seeding e-mails,respectively. Although other distributions may fit bet-ter, the exponential distribution for the time betweenreceiving an e-mail and participation is a reasonableapproximation (Bonfrer and Drèze 2009). In addition,the exponential distribution is the only distributionthat leads to mathematically tractable solutions (Dor-man et al. 2004).Based on the flow diagram in Figure 3, Figure 4
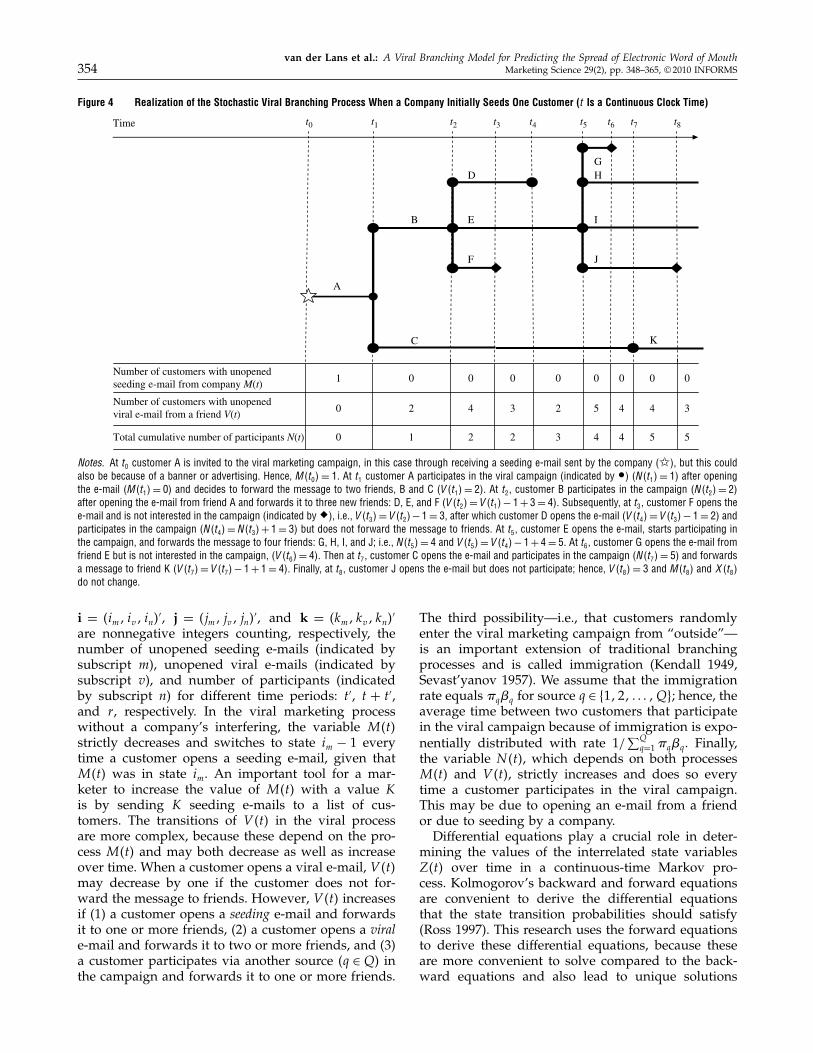
illustrates one possible realization of the stochasticprocess that is generated by our VBM. In Figure 3,we assume for simplicity that only a single customeris seeded by an e-mail from a company to customerA at time t0. Therefore, Mt0, indicating the numberof unopened seeding e-mails at t0 sent by a company,equals one. After t1− t0 time units, which are assumedto have an exponential distribution with mean 1/�m,
customer A opens the e-mail message and partici-pates in the viral campaign, for example, by clicking alink directed to the campaign website. Consequently,Mt1=Mt0− 1= 0, and Nt1, indicating the reachof the viral marketing campaign up to time t1, equalsNt1=Nt0+ 1= 1. After participation, customer Asends two e-mails to friends B and C via the Invitea Friend button. For that reason V t1, representingthe number of customers with an unopened viral e-mail in their mailbox, equals V t1 = V t0 + 2 = 2.The time that customers B and C need to open thismessage is assumed to be independent and identi-cally exponentially distributed with mean 1/�v, whichmay be different from the time assumed for customerA. In the example in Figure 4, customer B opens thee-mail from friend A after t2− t1 time units, and cus-tomer C takes t7− t1 time units. Finally, in this exam-ple, at time t8, we observe that Mt8 = 0, V t8 = 3,and Nt8 = 5. In the next subsection we derive theequations of our VBM for Mt, V t, and Nt.
3.3. Derivation of the Viral BranchingProcess Equations
Branching processes are an important class of Markovprocesses (Ross 1997). The memoryless property ofthe exponential distribution of the time between statetransitions leads to a continuous-time Markov pro-cess. Hence, the vector Zt = Mt�V t�N t′ fol-lows a three-dimensional continuous-time Markovprocess since PZt + t′ = j � Zt′ = i�Zr =k�0 ≤ r < t′ equals PZt+ t′= j �Zt′= i, where
van der Lans et al.: A Viral Branching Model for Predicting the Spread of Electronic Word of Mouth354 Marketing Science 29(2), pp. 348–365, © 2010 INFORMS
Figure 4 Realization of the Stochastic Viral Branching Process When a Company Initially Seeds One Customer (t Is a Continuous Clock Time)
3453
Time t0 t1 t2 t3 t4 t5 t6 t7 t8
seeding e-mail from company M(t)
viral e-mail from a friend V(t)
1
0
0
0
2
1
0 0 0 0 0 0 0
4
2 2
2
3 44
4
5 5
A
B
C
D
E
F
GH
I
J
K
Number of customers with unopened
Number of customers with unopened
Total cumulative number of participants N(t)
Notes. At t0 customer A is invited to the viral marketing campaign, in this case through receiving a seeding e-mail sent by the company (✩), but this couldalso be because of a banner or advertising. Hence, M�t0�= 1. At t1 customer A participates in the viral campaign (indicated by �) �N�t1�= 1� after openingthe e-mail �M�t1�= 0� and decides to forward the message to two friends, B and C �V �t1�= 2�. At t2, customer B participates in the campaign �N�t2�= 2�after opening the e-mail from friend A and forwards it to three new friends: D, E, and F �V �t2�= V �t1�− 1+ 3= 4�. Subsequently, at t3, customer F opens thee-mail and is not interested in the campaign (indicated by �), i.e., V �t3�= V �t2�−1= 3, after which customer D opens the e-mail �V �t4�= V �t3�− 1= 2� andparticipates in the campaign �N�t4�= N�t3�+ 1= 3� but does not forward the message to friends. At t5, customer E opens the e-mail, starts participating inthe campaign, and forwards the message to four friends: G, H, I, and J; i.e., N�t5�= 4 and V �t5�= V �t4�− 1+ 4= 5. At t6, customer G opens the e-mail fromfriend E but is not interested in the campaign, �V �t6�= 4�. Then at t7, customer C opens the e-mail and participates in the campaign �N�t7�= 5� and forwardsa message to friend K �V �t7�= V �t7�− 1+ 1= 4�. Finally, at t8, customer J opens the e-mail but does not participate; hence, V �t8�= 3 and M�t8� and X�t8�
do not change.
i = im� iv� in′, j = jm� jv� jn
′, and k = km�kv� kn′
are nonnegative integers counting, respectively, thenumber of unopened seeding e-mails (indicated bysubscript m), unopened viral e-mails (indicated bysubscript v), and number of participants (indicatedby subscript n) for different time periods: t′, t + t′,and r , respectively. In the viral marketing processwithout a company’s interfering, the variable Mtstrictly decreases and switches to state im − 1 everytime a customer opens a seeding e-mail, given thatMt was in state im. An important tool for a mar-keter to increase the value of Mt with a value Kis by sending K seeding e-mails to a list of cus-tomers. The transitions of V t in the viral processare more complex, because these depend on the pro-cess Mt and may both decrease as well as increaseover time. When a customer opens a viral e-mail, V tmay decrease by one if the customer does not for-ward the message to friends. However, V t increasesif (1) a customer opens a seeding e-mail and forwardsit to one or more friends, (2) a customer opens a virale-mail and forwards it to two or more friends, and (3)a customer participates via another source (q ∈ Q) inthe campaign and forwards it to one or more friends.
The third possibility—i.e., that customers randomlyenter the viral marketing campaign from “outside”—is an important extension of traditional branchingprocesses and is called immigration (Kendall 1949,Sevast’yanov 1957). We assume that the immigrationrate equals �q�q for source q ∈ �1�2� � � � �Q�; hence, theaverage time between two customers that participatein the viral campaign because of immigration is expo-nentially distributed with rate 1/
∑Qq=1�q�q . Finally,
the variable Nt, which depends on both processesMt and V t, strictly increases and does so everytime a customer participates in the viral campaign.This may be due to opening an e-mail from a friendor due to seeding by a company.Differential equations play a crucial role in deter-
mining the values of the interrelated state variablesZt over time in a continuous-time Markov pro-cess. Kolmogorov’s backward and forward equationsare convenient to derive the differential equationsthat the state transition probabilities should satisfy(Ross 1997). This research uses the forward equationsto derive these differential equations, because theseare more convenient to solve compared to the back-ward equations and also lead to unique solutions
van der Lans et al.: A Viral Branching Model for Predicting the Spread of Electronic Word of MouthMarketing Science 29(2), pp. 348–365, © 2010 INFORMS 355
for all generalizations of branching processes (Harris1963). Because the VBM is new to the literature, wederive and solve these differential equations in Tech-nical Appendix A of the electronic companion to thispaper, available as part of the online version thatcan be found at http://mktsci.pubs.informs.org. Next,we provide the solutions of the expectations of Mt,V t, and Nt.
3.3.1. The Conditional Expected Number of Un-opened Seeding E-mails Mt. As derived in Tech-nical Appendix A of the electronic companion, theconditional expected number of unopened seeding e-mails at time t, given that at time t′, with 0 ≤ t′ ≤ t,there are im unopened seeding e-mails, equals
EMt �Mt′= im= ime−�mt−t′� (1)
Clearly, as �m is always positive,Mt decreases expo-nentially over time and reaches zero as time passes.A marketer, however, may increase Mt by sendingan additional set of seeding e-mails to a list of cus-tomers; i.e., marketers control the value im directly.
3.3.2. The Conditional Expected Number of Un-opened Viral E-mails V t. The conditional expectednumber of unopened viral e-mails at time t, given ivunopened viral e-mails at time t′, equals (see Techni-cal Appendix A of electronic companion):
EV t � V t′= iv = ive�v�v�−1t−t′
+K1e�v�v�−1t−t′ − e−�mt−t′
+K2e�v�v�−1t−t′ − 1� (2)
with K1 = �m�m�im/�v�v�− 1+�m, and K2 =∑Qq=1�q�q�/�v�v�− 1. In (2), �v� represents the
infection rate of the viral marketing campaign, whichis smaller than � because not every customer whoreceives an e-mail decides to participate. Note that if�v� > 1, V t grows exponentially and reaches infin-ity when t becomes very large.
3.3.3. The Conditional Expected Number of Par-ticipants in the Viral Campaign Nt. TechnicalAppendix A of the electronic companion shows thatthe conditional expected number of participants Nt,given in participants at time t′, equals
ENt �Nt′= in = in+K3e�v�v�−1t−t′−1
+K4e−�mt−t′−1+K5t−t′� (3)
with
K3 = �v/�v�−1K1+K2+iv�
K4 = im�m�v−�m/�m+�v�v�−1�
and
K5 = −Q∑
q=1�q�q/�v�−1�
Equation (3) represents highly nonlinear effects ofthe model parameters on the reach of the campaignNt. Fortunately, the model parameters are estimatedon the disaggregate level, and hence Equation (3) isnot used in the estimation procedure. In fact, it isrelatively straightforward to code this equation in aspreadsheet program, which calculates the expectedreach of the campaign based on the individual-levelparameter estimates �, �b, �m, �v, and �q .
3.4. Estimating the Model ParametersThe strength of the VBM is that its parameters canbe estimated using the individual-level data obtainedfrom viral marketing campaigns as described in §2.2.Hence, in contrast to most models in marketing, wedo not estimate the model parameters using the func-tional form as represented by Equations (1)–(3) anddata on the actual process variables Zt. Instead,we use the dynamically generated database (see §2.2)containing the individual-level data of the processfrom which we infer the model parameters. The esti-mates based on these individual-level data are subse-quently inserted into the model to predict the numberof participants over time. This approach is similar topretest market models (Hauser and Wisniewski 1982,Shocker and Hall 1986), including Sprinter (Urban1970), Perceptor (Urban 1975), ASSESSOR (Silk andUrban 1978), Tracker (Blattberg and Golanty 1978),and MOVIEMOD (Eliashberg et al. 2000) that predictmarket shares or diffusion curves based on customers’trial and adoption processes. For these models, theprocess parameters are estimated before the start ofthe diffusion process using data from surveys andexperiments. For our VBM, we estimate the parame-ter values directly from the individual-level data thatbecome available from the viral process of interestand that are stored in a dynamic database. The modelparameters can be quickly estimated reliably becausethis database contains many customers already in thecampaign’s early stages.We now describe how the basic parameters of the
VBM can be estimated for a given time period. Todo so, we first discretize the time period �0� � � � � T �into d = 1� � � � �D time periods, with period d =�td−1� � � � � td�, t0 = 0, and tD = T . Note that we stillaccount for a continuous time viral branching processbut allow the model parameters to vary across timeperiods d. Hence, we estimate �d, �bd, �qd, �md, and�vd for each time period d. In the empirical applica-tion, each time period d corresponds to one day thatthe viral campaign is online. For each period d, weobserve c = 1� � � � �nd customers that participate in theviral campaign.
van der Lans et al.: A Viral Branching Model for Predicting the Spread of Electronic Word of Mouth356 Marketing Science 29(2), pp. 348–365, © 2010 INFORMS
3.4.1. Estimating the Average Number of For-warded E-mails � = �∗1− �. Each customer c inperiod d forwards ycd e-mails to friends. We introducevariable ucdj , which equals one if e-mail j ∈ �1� � � � � ycd�forwarded by customer c in period d reaches a cus-tomer who already participated or already receivedan invitation, and zero otherwise. Hence, the effec-tive number of forwarded e-mails equals xcd = ycd −∑ycd
j=1 ucdj . These xcd e-mails are automatically storedin the dynamically updated database by adding xcd
rows, i.e., rows Rc−1�d + 1 to Rc−1�d + xcd (see §2.2).Rc−1�d represents the number of rows in the databaseup to customer c − 1 in period d, which correspondsto the cumulative number of customers who alreadyparticipated or were already invited up to customerc−1 in period d−1. Given variables ycd and ucdj , it isrelatively easy to estimate both parameters, �∗ and �d,as follows:
�∗ = 1nd
D∑d=1
nd∑c=1
ycd� and (4)
�d =1nd
nd∑c=1
∑ycd
j=1 ucdj
ycd
� (5)
As described above, for prediction we expect the prob-ability that an e-mail is ineffective, i.e., Pucdj = 1, toincrease as a function of Rnd−1�d−1. We use a binarylogit specification to estimate this increase:
Pucdj = 1=exp.1+.2Rc−1�d
1+ exp.1+.2Rc−1�d� (6)
For prediction of Rnd′ �d′ in period d′ > D after theobservation period �1� � � � �D�, we use the followingequation:
Rnd′ �d′ = nd′�d′ +Q∑
q=1�qd′�qd′ · td′ − td′−1+Kd′� (7)
where nd′�d′ = N td′−Ntd′−1�d′ represents the ex-pected number of forwarded e-mails in period d′,∑Q
q=1�qd′�qd′ · td′ − td′−1 represents the expected num-ber of customers who join the campaign because ofseeding activities q ∈Q, and Kd′ represents the numberof seeding e-mails that a company sends in period d′.Given the predicted value of Rnd′ �d′ , we use (6) to pre-dict �d′+1 as Pund′ �d′j = 1, which in combination with(4) leads to the predicted value of �d′+1 =�∗1− �d′+1.We use this procedure iteratively to forecast the viralprocess for all future periods of interest.
3.4.2. Estimating the Probabilities �m��v andthe Distribution Parameters �m��v of the Timeto Participate. In general, we do not observe whenan invited customer opens an e-mail and decides todelete it and hence to exit the campaign (see Fig-ure 2). Therefore, we need to infer �md and �md,
and �vd and �vd3 simultaneously from the observed
number of participants in the viral marketing cam-paign for each period d. Because the time betweenreceiving a seeding e-mail and participation isassumed to be exponentially distributed, the prob-ability that customers open an e-mail in period d,given they receive a seeding e-mail before this period,equals
∫ tdtd−1
�mde−�mt dt = e−�mdtd−1 − e−�mdtd . Hence, the
probability of participating in period d, after receivinga seeding e-mail, equals /d = �mde
−�mdtd−1 − e−�mdtd .Given that Kd customers receive a seeding e-mailin period d, we observe in each time periodd�d + 1� � � � �D, how many of these customershd participate, which has a multinomial distribu-tion4 �hd�hd+1� � � � � hD� ∼ MNKd1 /d�/d+1� � � � �/D.Because of the many observations available after onlyshort time periods, the parameters �md and �md canbe estimated using maximum likelihood. �vd and �vd
are estimated in a similar fashion.
3.4.3. Estimating the Immigration Rate �q�q Be-cause of Seeding Tool q. Parameters �qd and �qd,representing the number of customers who visit thecampaign website because of seeding tool q in timeperiod d, and �qd representing the fraction of thesecustomers who also start participating, are directlyobserved and stored in the dynamically updateddatabase. For specific seeding tools such as banners,a marketer frequently has the opportunity to buy aspecific amount of clicks on the banner to the website.In this case, �qd does not need to be estimated andcan be directly determined (i.e., set) by the marketingmanager.
4. Empirical Study: A Real-LifeViral Campaign
4.1. Description of the CampaignFrom Friday, April 1, 2005 to Friday, May 6, 2005,a large financial services provider ran a viral mar-keting campaign. The goal of this campaign was topromote financial services to highly educated poten-tial customers aged between 20 and 29. The structureof the campaign is as shown in Figure 1. Customersparticipated in the campaign while playing a gameduring which they answered questions, which then
3 In the empirical application, we assume both �md and �vd to beequal across days during the week and across days during week-ends. However, both �md and �vd are allowed to be different duringweekends and weekdays.4 In the empirical application, we assume that the number ofe-mails sent in period d is uniform over time; hence, theexpected probability that a customer opens a seeding e-mail inperiod d, given that it was received at time 2 in period d, equals∫ tdtd−1
∫ td−2
0 �mde−�mdt dt d2 = 1− 1/�md1− e−�mdtd−td−1.
van der Lans et al.: A Viral Branching Model for Predicting the Spread of Electronic Word of MouthMarketing Science 29(2), pp. 348–365, © 2010 INFORMS 357
Figure 5 Events and Number of Participants by Day During the Viral Campaign
00 7 14 21
Day28 35
2
4
6
8
Num
ber
by d
ay (
× 1
,000
)
10
12
14
16
18
20
22
24
26
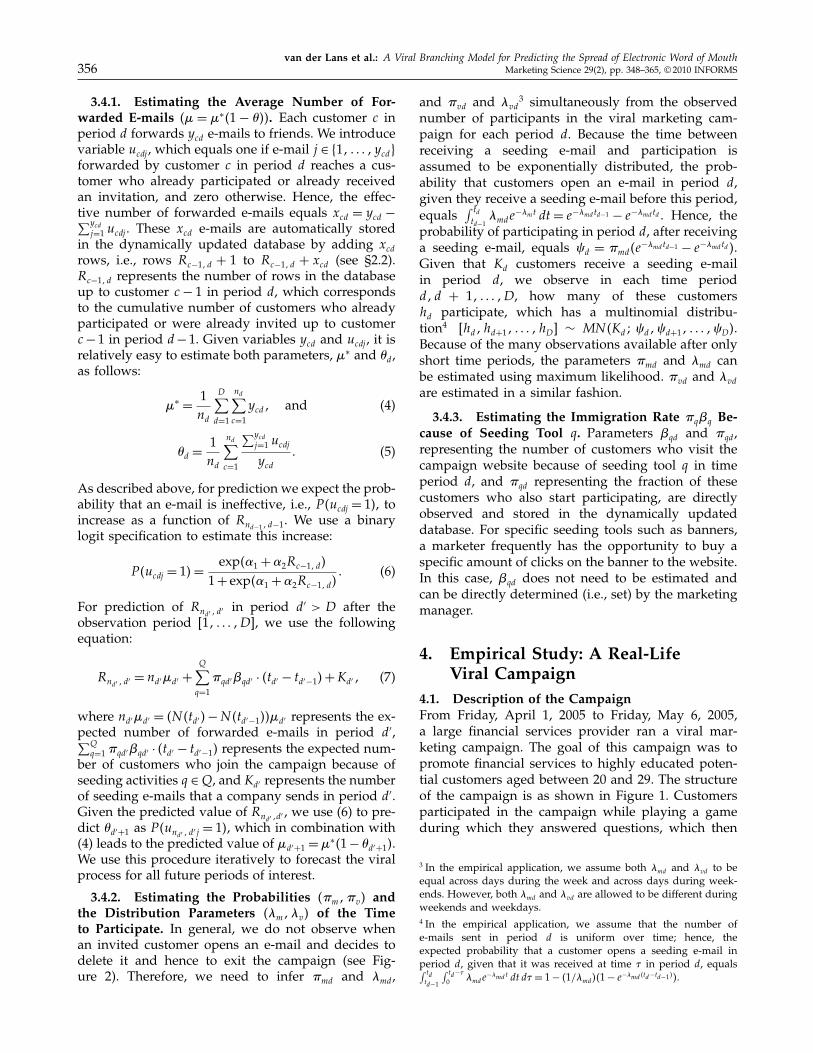
Notes. The viral campaign started on a Friday and was online for 36 days. On Day 4, the number of participants grew rapidly because of marketing activities.On this day, the company sent 4,500 seeding e-mails and placed banners on websites that generated 200 participants by day for 11 consecutive days. On Day 7,the company sent an additional set of 24,258 seeding e-mails to further promote the viral campaign.
led to a career profile. Then, in return for a guar-anteed prize, participants could fill out an onlineform requesting personal information. After fillingout this information, participants were informed thatthey could win bigger prizes if they invited one ormore of their friends to the campaign by sendinge-mails via the Send to a Friend button. Software con-nected to the campaign website checked in real timewhether the e-mail addresses of these friends werevalid (i.e., each e-mail address was filled out onlyonce, e-mails were not sent to the participants them-selves, and the viral e-mail did not bounce within aprespecified time period).The viral campaign was online on April 1, but
the organization started seeding on April 4. How-ever, because of the novelty of the campaign, employ-ees of the organization already started participatingand inviting their contacts before the campaign wasformally seeded. This resulted in 846 participants atthe end of Day 3. To seed the campaign, the orga-nization bought 6,400 banner clicks to the campaignwebsite between April 4 and April 14 by placing abanner on a popular website. Of the 6,400 visitors,2,200 people decided to participate in the viral cam-paign. Furthermore, on April 4 and April 7, the mar-keting agency sent 4,500 and 24,258 seeding e-mails,respectively, to customers who agreed to receive pro-motional e-mails. These marketing activities and theresulting viral process resulted in a total of 228,351participants by Day 36 since the viral campaign wasonline. Figure 5 summarizes the marketing activitiesaround the viral campaign and the resulting num-ber of participants by day over time. This figureshows that the daily number of participants grew
rapidly during the first 11 days, after which it slowlydecreased over time. Note that during weekends thenumber of participants is lower, which is because dur-ing these days customers read their e-mail less fre-quently compared to weekdays, as is also shown inthe following section.
4.2. Data DescriptionAll 228,351 participants in the viral campaign reg-istered on the campaign website by providing theire-mail addresses. Hence, we know the e-mail addressof each participant and the time they participated inthe viral campaign. Furthermore, we also obtainedthe e-mail addresses of over one million friendswho were invited (some of which are also amongthe 228,351 because they actually participated) andthe 28,758 seeding e-mail addresses that the market-ing agency used to seed the campaign. Given thesedata, we coded, for each participant, how many virale-mails were sent by counting the number of virale-mails that were sent to new customers who had notparticipated yet or had not received an invitation atthe moment the e-mails were sent.Next to the number of e-mails a participant sent,
we also coded how and when a participant wasinvited. Unfortunately, the marketing agency did notretain the source by which a participant was invitedin their database. Therefore, we were only able toidentify the source through which participants wereinvited by matching sent seeding and viral e-mailaddresses with the registered e-mail addresses of par-ticipants. Using this procedure we were able to deter-mine the source of invitation to the campaign websitefor 73% of the participants. Most of the remaining
van der Lans et al.: A Viral Branching Model for Predicting the Spread of Electronic Word of Mouth358 Marketing Science 29(2), pp. 348–365, © 2010 INFORMS
27% of the customers registered under a differente-mail address through which they were invited, mostlikely because of privacy concerns. This percentageclosely corresponds to findings of a recent survey thatshowed that 42% of Internet users have more thanone e-mail account and that 33% of them providee-mail addresses that would not identify them per-sonally (Wireless News 2006). From this 27%, we knowthat between April 4 and April 14, 2,200 participatedbecause of bannering. Hence, we randomly assigned2,200 of these participants, equally distributed overthe 11 days, to the banner as the source of invitation.We subsequently computed for each day the propor-tions of participants for which we knew whether theywere invited by a viral or seeding e-mail. For exam-ple, on Sunday, April 10, 9,245 participants (98.5%)participated because of a viral e-mail and 145 par-ticipants (1.5%) participated after being invited by aseeding e-mail. On this day, after excluding 200 par-ticipants because of banners, there were 2,406 par-ticipants for which we did not observe the sourceof invitation. Hence, we randomly selected 98.5% ofthese 2,406 participants, and we assumed that theystarted participating because of a viral e-mail. For theremaining 1.5% of the participants, we assumed theywere invited by a seeding e-mail. Sensitivity analysesshowed that our results are not sensitive to differentchoices of proportions to allocate these customers toseeding e-mail or viral e-mail invitation sources.5 Werepeated this procedure for all days during the cam-paign so that all participants were assigned a sourcethrough which they were invited.In summary, after these computations, our data set
consists of 228,351 lines corresponding to participants.Each line contains the identity of the participant, thedate of participation, the source of invitation, the datethat the participant received the invitation, the num-ber of e-mails that are sent to friends, and how manyof these friends already participated or were alreadyinvited.
5. Results5.1. Performance of the Viral Branching ModelUsing the procedures as described in §§3.4.1–3.4.3, wewere able to estimate the model parameters, whichwere subsequently plugged into Equations (1)–(3) topredict the number of participants by day. To capturethe effect that customers read their e-mail less fre-quently during weekends, we estimated different dis-tribution parameters of the time to participate for theweekdays and for the weekends. Using our parameter
5 In the sensitivity analyses, we varied the proportions to allocatecustomers to seeding e-mails from zero to twice as many customersas expected from the observed proportions.
estimates, we assessed the VBM fit and its predictiveperformance. In addition to using all data during the36 days that the campaign was online, we also esti-mated the parameters using only the first part of ourdata set and then developed forecasts for the remain-ing days of the 36-day period. Because we were inter-ested in how early in the process we would be ableto accurately predict the spread of the campaign, weestimated the parameters using the data obtained infour different time periods and then developed fore-casts for the remaining days of the 36-day period (i.e.,holdout periods). Because marketing activities onlystarted on Day 4, we chose the first calibration periodto be Days 1–7, just after the company seeded thecampaign. This led to the following five scenarios:1. Calibration period: Days 1–7Forecasting (holdout) period: Days 8–36
2. Calibration period: Days 1–14Forecasting (holdout) period: Days 15–36
3. Calibration period: Days 1–21Forecasting (holdout) period: Days 22–36
4. Calibration period: Days 1–28Forecasting (holdout) period: Days 29–36
5. Calibration period: Days 1–36.Furthermore, we examined whether it is worth-
while to treat viral e-mails separately from seedinge-mails in our model. To test this, we also estimated arestricted version of our model by setting �m =�v and�m = �v, which we call the nested VBM. Finally, wealso compared the predictive accuracy of the nestedand the nonnested VBM with the simplest form ofthe Bass (1969) model, and with an extended ver-sion of the Bass model that served as benchmarks.For the extended Bass model, we followed Kamakuraand Balasubramanian (1988) and Parker (1992), andallowed the market potential �Nd
6 to be a function ofmarketing activities and the innovation parameter ad
to be different for weekdays and days of the weekend,leading to the following extended Bass model:
Nd−Nd−1=(ad+b
Nd−1�Nd
) �Nd−Nd−1� (8)
In (8), b represents the imitation parameter; ad =4a0+4a1 ·weekendd, where weekendd represents adummy that equals one if Day d is during the week-end, zero otherwise; and �Nd = 4 �N0 + 4 �N1 ·
∑di=1Ki +
4 �N2 ·∑d
i=1�i, with Ki the number of seeding e-mailssent on Day i, and �i the number of customers whostart participating because of bannering on Day i. Theparameters of the Bass model are estimated so thatthey optimally fit the process Nt, whereas the VBMapproach estimates parameters at the disaggregate
6 To avoid confusion with the parameters of the VBM, we slightlydeviated from conventional notation of the Bass model.
van der Lans et al.: A Viral Branching Model for Predicting the Spread of Electronic Word of MouthMarketing Science 29(2), pp. 348–365, © 2010 INFORMS 359
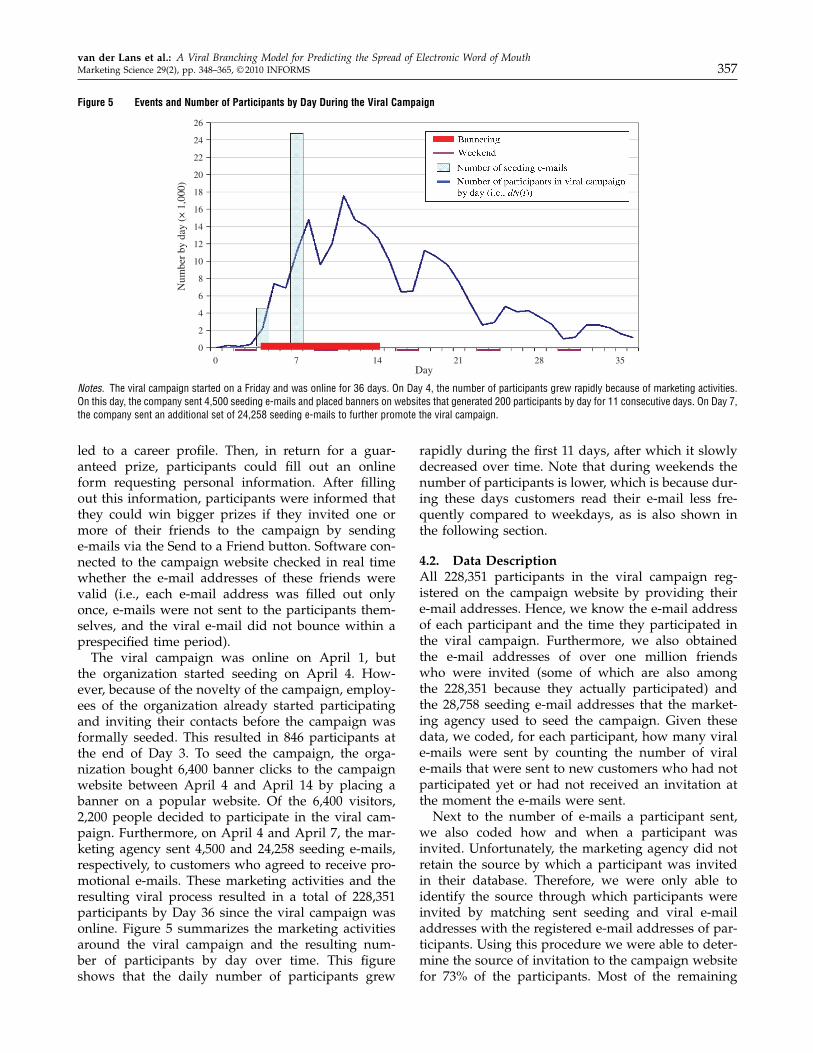
Table 1 Model Performance—Cumulative Number of Participants in a Time Period
In-sample fit Out-of-sample forecast (MAPE) for daysEstimationperiod Model RMSEa MAPE 8–14 15–21 22–28 29–36
Days 1–7 VBM 1 79 0 07 0 09 0 03 0 07 0 14Nested VBM 4 02 0 23 0 39 0 60 0 37 0 25Standard Bass model 8 73 2 58 0 51 0 77 0 82 0 84Extended Bass model 0 48 0 24 0 08 0 19 0 33 0 39
Days 1–14 VBM 4 47 0 05 — 0 02 0 03 0 03Nested VBM 44 41 0 48 — 0 21 0 38 0 46Standard Bass model 15 85 2 66 — 0 09 0 25 0 32Extended Bass model 1 12 0 40 — 0 15 0 33 0 39
Days 1–21 VBM 6 06 0 06 — — 0 01 0 02Nested VBM 83 60 0 58 — — 0 06 0 14Standard Bass model 14 79 2 51 — — 0 03 0 10Extended Bass model 2 35 0 43 — — 0 02 0 02
Days 1–28 VBM 3 48 0 04 — — — 0 01Nested VBM 116 54 0 66 — — — 0 01Standard Bass model 12 85 2 07 — — — 0 04Extended Bass model 2 04 0 28 — — — 0 00
Days 1–36 VBM 6 98 0 05 — — — —Nested VBM 119 70 0 61 — — — —Standard Bass model 9 90 1 65 — — — —Extended Bass model 1 83 0 22 — — — —
aRoot mean squared errors are multiplied by 1,000.
level and does not choose parameter values to opti-mize the fit of Nt. The Bass model and its extendedversion, therefore, serve as a strong benchmark forour VBM. This is particularly true when we comparethe in-sample fit over the calibration period.7
In Tables 1 and 2 we present the results of thefive scenarios for the different models. Table 1 showsthe in-sample fit statistics (root mean square error(RMSE) and mean absolute percentage error (MAPE))and the forecasting accuracy (MAPE) for the cumu-lative number of participants (i.e., the reach Nt) ofthe viral marketing campaign. Table 2 presents thesestatistics for the fit and prediction of the models forthe increase (i.e., dNt) in the number of participantsby day.Overall, when analyzing the fit of the models, the
results in Tables 1 and 2 (see also Figure 6) indi-cate that our VBM does very well in fitting thespread of the viral marketing campaign. The fit ofthe nested VBM, where the effectiveness of seed-ing e-mails is assumed to be equal to that of virale-mails, is extremely low. This confirms the impor-tance of incorporating different parameters for viraland seeding e-mails. Furthermore, although the stan-dard Bass model does not seem to fit the process well,
7 We tried several alternative specifications to incorporate market-ing activities and weekend effects by incorporating these in func-tions for the innovation parameter a, imitation parameter b, andthe market potential �N . We selected the best-performing model asthe extended Bass model.
the extended Bass model fits the process Nt betterthan our viral branching model based on RMSE (1.83versus 6.98 for the total estimation period). Interest-ingly, however, compared to the extended Bass model,the viral branching model fits the cumulative pro-cess better based on MAPE (0.05 versus 0.22) and thedifferenced process, dNt, based on both measures(RMSE: 1.23 versus 1.30; MAPE: 0.18 versus 0.31).These results are due to the fact that the extended
Bass model optimizes the RMSE of the cumulativenumber of participants, and suggests that the VBMbetter captures the actual process, which becomesapparent in the other fit statistics and the forecastingperformance. As indicated by the results in Tables 1and 2, and in contrast to all three competing models,the VBM was able to accurately predict the spreadof the campaign already on Day 7, when the cam-paign was still not fully seeded. The nested versionof the model is not able to predict the number ofparticipants accurately in the early stages of the cam-paign and only starts doing better at the end of thecampaign when the viral process has almost died outand does not attract many new customers. A simi-lar phenomenon is true for the standard Bass model.Although the extended Bass model does slightly bet-ter, it is not able to predict the number of customersin the campaign after Day 7 or Day 14. As a matterof fact, after Day 14, the extended Bass model hugelyunderpredicts at 134,682, whereas the prediction ofthe VBM is at 221,429, which is very close to the trueultimate level of 228,351. The extended Bass model
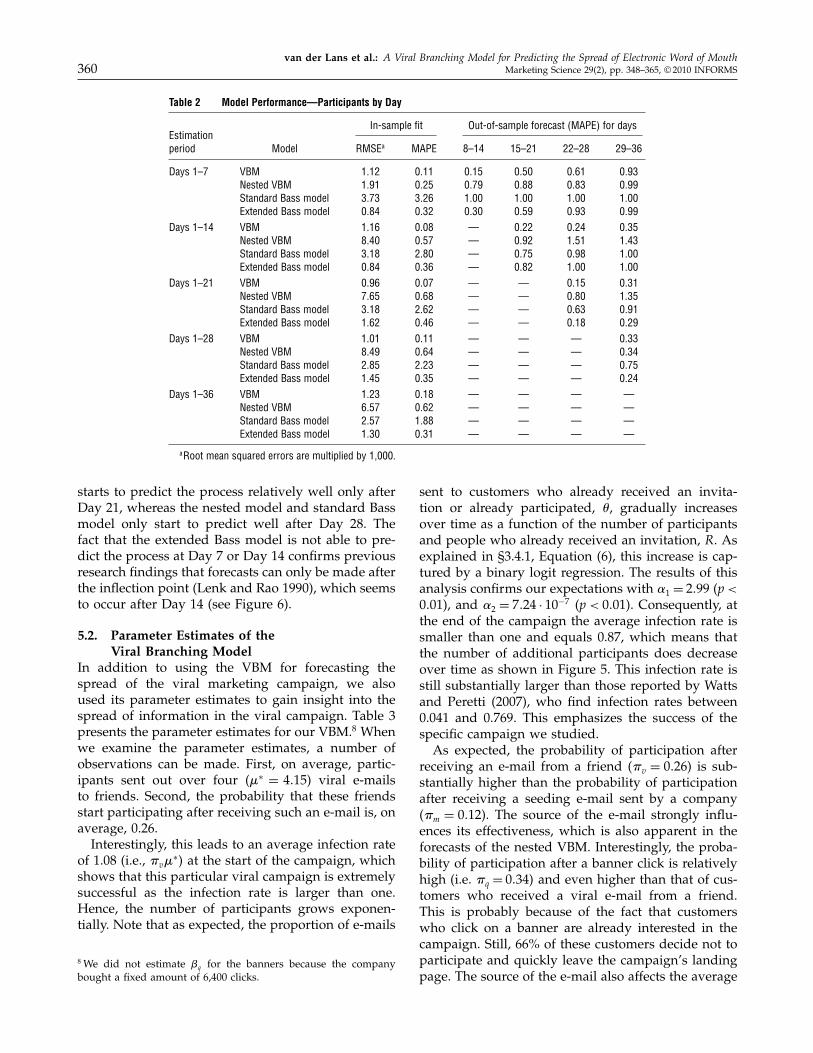
van der Lans et al.: A Viral Branching Model for Predicting the Spread of Electronic Word of Mouth360 Marketing Science 29(2), pp. 348–365, © 2010 INFORMS
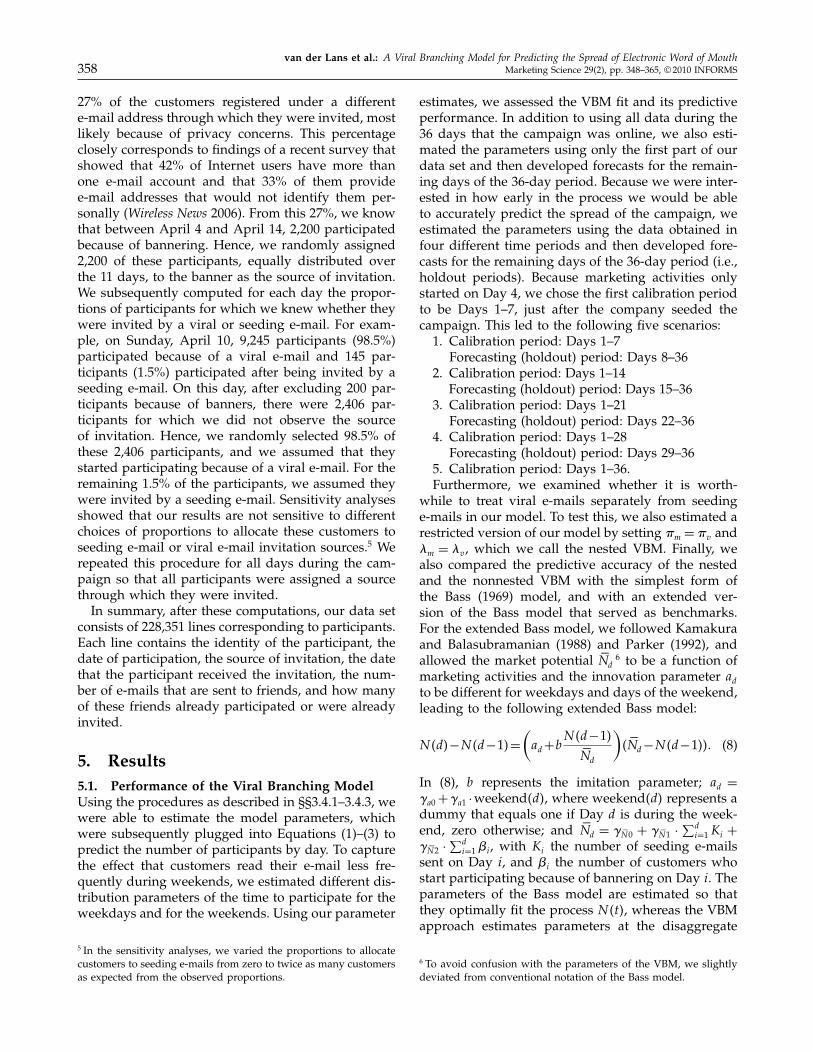
Table 2 Model Performance—Participants by Day
In-sample fit Out-of-sample forecast (MAPE) for daysEstimationperiod Model RMSEa MAPE 8–14 15–21 22–28 29–36
Days 1–7 VBM 1 12 0 11 0 15 0 50 0 61 0 93Nested VBM 1 91 0 25 0 79 0 88 0 83 0 99Standard Bass model 3 73 3 26 1 00 1 00 1 00 1 00Extended Bass model 0 84 0 32 0 30 0 59 0 93 0 99
Days 1–14 VBM 1 16 0 08 — 0 22 0 24 0 35Nested VBM 8 40 0 57 — 0 92 1 51 1 43Standard Bass model 3 18 2 80 — 0 75 0 98 1 00Extended Bass model 0 84 0 36 — 0 82 1 00 1 00
Days 1–21 VBM 0 96 0 07 — — 0 15 0 31Nested VBM 7 65 0 68 — — 0 80 1 35Standard Bass model 3 18 2 62 — — 0 63 0 91Extended Bass model 1 62 0 46 — — 0 18 0 29
Days 1–28 VBM 1 01 0 11 — — — 0 33Nested VBM 8 49 0 64 — — — 0 34Standard Bass model 2 85 2 23 — — — 0 75Extended Bass model 1 45 0 35 — — — 0 24
Days 1–36 VBM 1 23 0 18 — — — —Nested VBM 6 57 0 62 — — — —Standard Bass model 2 57 1 88 — — — —Extended Bass model 1 30 0 31 — — — —
aRoot mean squared errors are multiplied by 1,000.
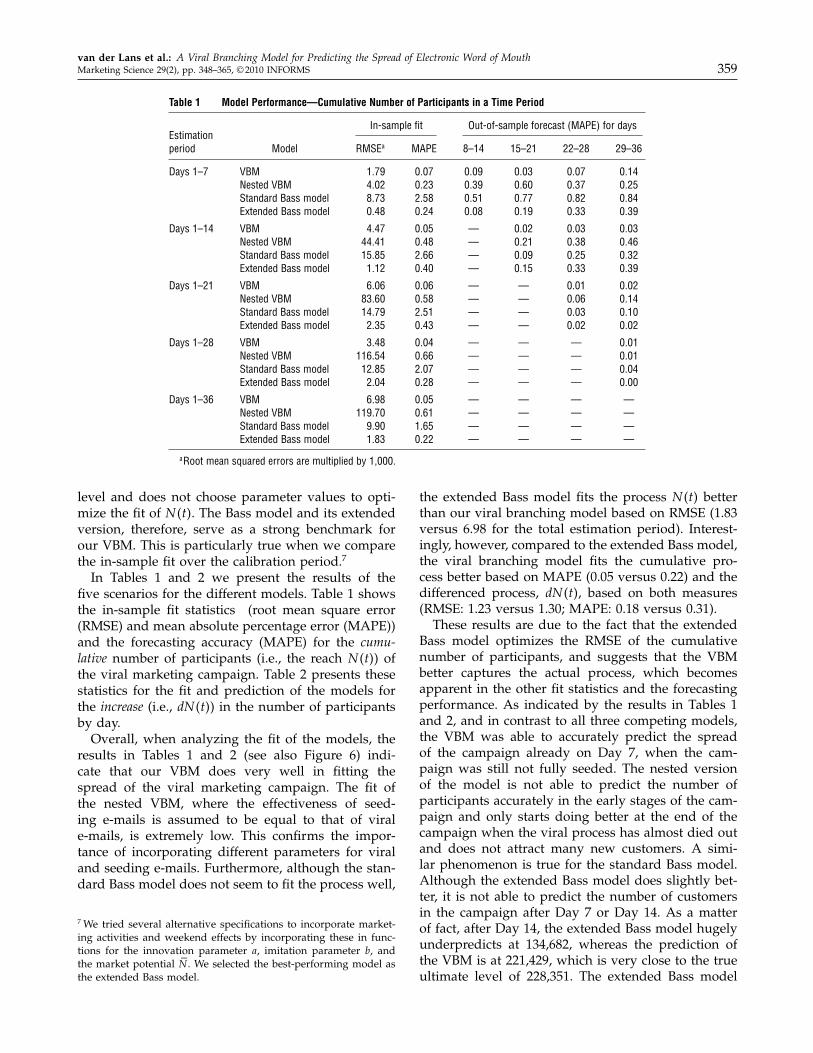
starts to predict the process relatively well only afterDay 21, whereas the nested model and standard Bassmodel only start to predict well after Day 28. Thefact that the extended Bass model is not able to pre-dict the process at Day 7 or Day 14 confirms previousresearch findings that forecasts can only be made afterthe inflection point (Lenk and Rao 1990), which seemsto occur after Day 14 (see Figure 6).
5.2. Parameter Estimates of theViral Branching Model
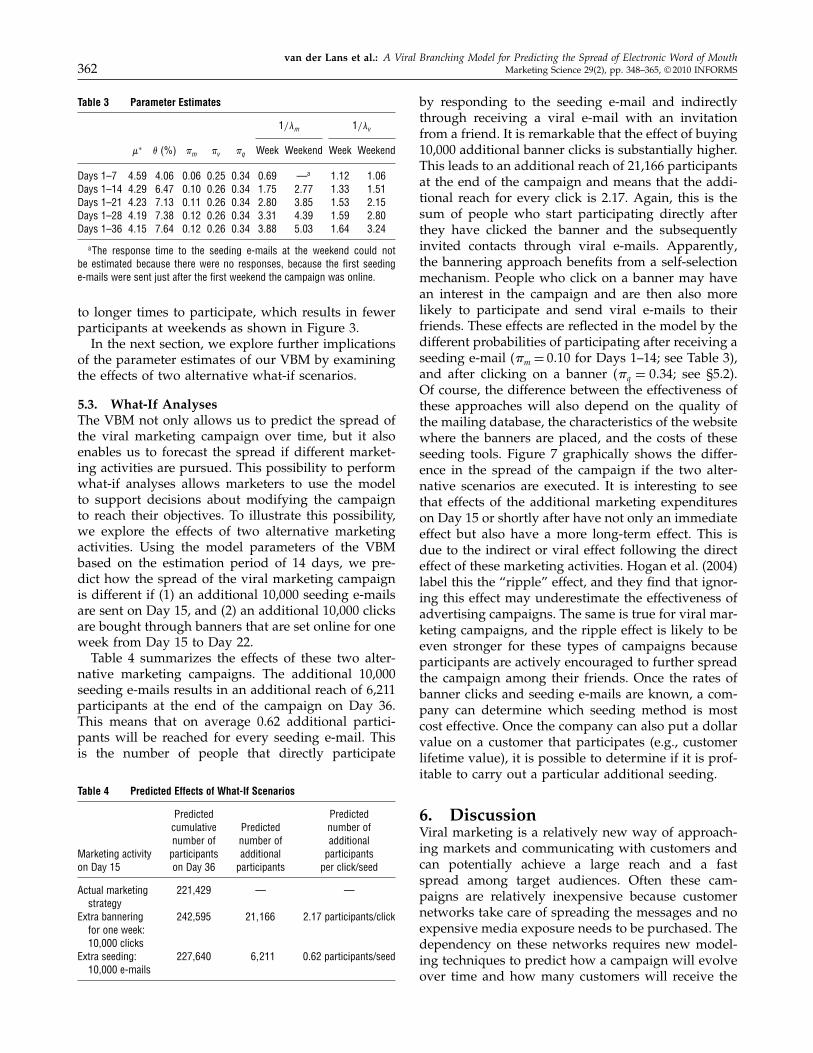
In addition to using the VBM for forecasting thespread of the viral marketing campaign, we alsoused its parameter estimates to gain insight into thespread of information in the viral campaign. Table 3presents the parameter estimates for our VBM.8 Whenwe examine the parameter estimates, a number ofobservations can be made. First, on average, partic-ipants sent out over four (�∗ = 4�15) viral e-mailsto friends. Second, the probability that these friendsstart participating after receiving such an e-mail is, onaverage, 0.26.Interestingly, this leads to an average infection rate
of 1.08 (i.e., �v�∗ at the start of the campaign, which
shows that this particular viral campaign is extremelysuccessful as the infection rate is larger than one.Hence, the number of participants grows exponen-tially. Note that as expected, the proportion of e-mails
8 We did not estimate �q for the banners because the companybought a fixed amount of 6,400 clicks.
sent to customers who already received an invita-tion or already participated, �, gradually increasesover time as a function of the number of participantsand people who already received an invitation, R. Asexplained in §3.4.1, Equation (6), this increase is cap-tured by a binary logit regression. The results of thisanalysis confirms our expectations with .1 = 2�99 (p <0�01), and .2 = 7�24 · 10−7 (p < 0�01). Consequently, atthe end of the campaign the average infection rate issmaller than one and equals 0.87, which means thatthe number of additional participants does decreaseover time as shown in Figure 5. This infection rate isstill substantially larger than those reported by Wattsand Peretti (2007), who find infection rates between0.041 and 0.769. This emphasizes the success of thespecific campaign we studied.As expected, the probability of participation after
receiving an e-mail from a friend (�v = 0�26) is sub-stantially higher than the probability of participationafter receiving a seeding e-mail sent by a company(�m = 0�12). The source of the e-mail strongly influ-ences its effectiveness, which is also apparent in theforecasts of the nested VBM. Interestingly, the proba-bility of participation after a banner click is relativelyhigh (i.e. �q = 0�34 and even higher than that of cus-tomers who received a viral e-mail from a friend.This is probably because of the fact that customerswho click on a banner are already interested in thecampaign. Still, 66% of these customers decide not toparticipate and quickly leave the campaign’s landingpage. The source of the e-mail also affects the average
van der Lans et al.: A Viral Branching Model for Predicting the Spread of Electronic Word of MouthMarketing Science 29(2), pp. 348–365, © 2010 INFORMS 361
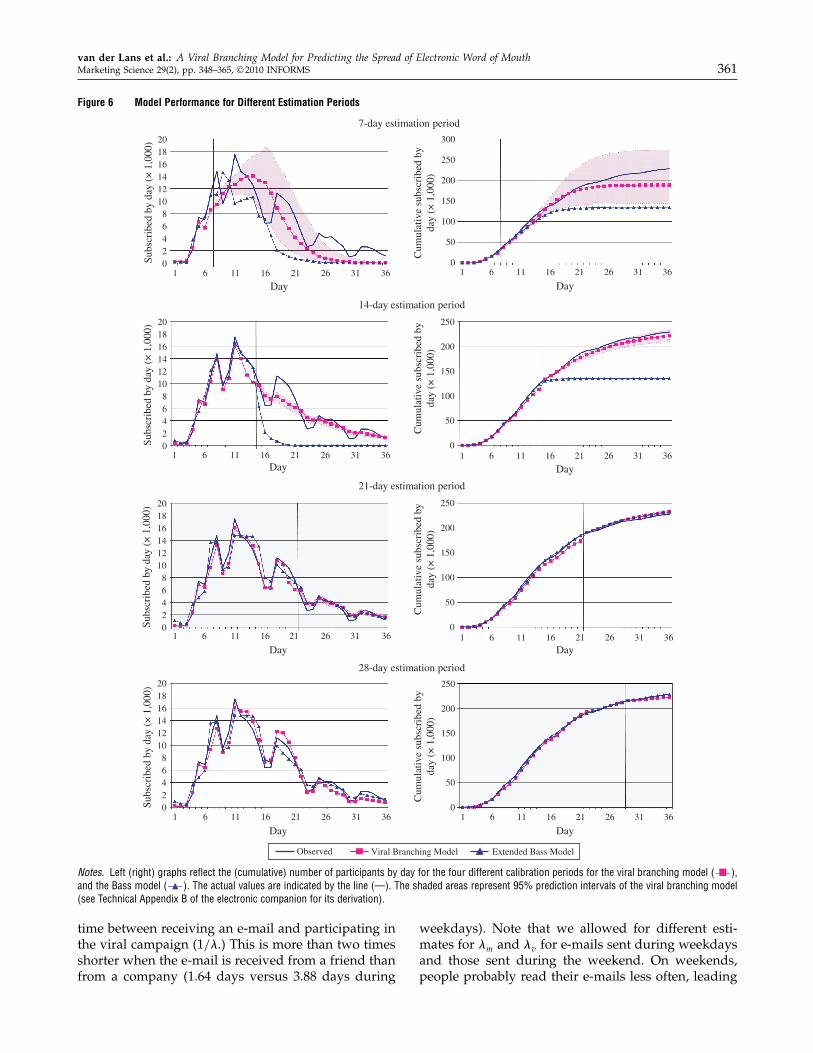
Figure 6 Model Performance for Different Estimation Periods
7-day estimation period
1 6 11 16 21 26 31 36
Observed Viral Branching Model Extended Bass Model
Day
10
50
Cum
ulat
ive
subs
crib
ed b
yda
y (×
1,0
00)
Cum
ulat
ive
subs
crib
ed b
yda
y (×
1,0
00)
Cum
ulat
ive
subs
crib
ed b
yda
y (×
1,0
00)
100
150
200
250
0
50
100
150
200
250
0
50
100
150
200
250
Cum
ulat
ive
subs
crib
ed b
yda
y (×
1,0
00)
0
50
100
150
200
300
250
6 11 16 21 26 31 36
Day
1 6 11 16 21 26 31 36
Day
1 6 11 16 21 26 31 36
Day
2018161412108
Subs
crib
ed b
y da
y (×
1,0
00)
6420
1 6 11 16 21
Day26 31 36
2018161412108
Subs
crib
ed b
y da
y (×
1,0
00)
6420
1 6 11 16 21 26 31 36Day
2018161412108
Subs
crib
ed b
y da
y (×
1,0
00)
6420
1 6 11 16 21 26 31 36
Day
2018161412108
Subs
crib
ed b
y da
y (×
1,0
00)
6420
1 6 11 16 21 26 31 36
Day
14-day estimation period
21-day estimation period
28-day estimation period
Notes. Left (right) graphs reflect the (cumulative) number of participants by day for the four different calibration periods for the viral branching model (−�−),and the Bass model (−�−). The actual values are indicated by the line (—). The shaded areas represent 95% prediction intervals of the viral branching model(see Technical Appendix B of the electronic companion for its derivation).
time between receiving an e-mail and participating inthe viral campaign (1/�.) This is more than two timesshorter when the e-mail is received from a friend thanfrom a company (1.64 days versus 3.88 days during
weekdays). Note that we allowed for different esti-mates for �m and �v for e-mails sent during weekdaysand those sent during the weekend. On weekends,people probably read their e-mails less often, leading
van der Lans et al.: A Viral Branching Model for Predicting the Spread of Electronic Word of Mouth362 Marketing Science 29(2), pp. 348–365, © 2010 INFORMS
Table 3 Parameter Estimates
1/�m 1/�v
∗ � (%) �m �v �q Week Weekend Week Weekend
Days 1–7 4 59 4 06 0 06 0 25 0 34 0 69 —a 1 12 1 06Days 1–14 4 29 6 47 0 10 0 26 0 34 1 75 2 77 1 33 1 51Days 1–21 4 23 7 13 0 11 0 26 0 34 2 80 3 85 1 53 2 15Days 1–28 4 19 7 38 0 12 0 26 0 34 3 31 4 39 1 59 2 80Days 1–36 4 15 7 64 0 12 0 26 0 34 3 88 5 03 1 64 3 24
aThe response time to the seeding e-mails at the weekend could notbe estimated because there were no responses, because the first seedinge-mails were sent just after the first weekend the campaign was online.
to longer times to participate, which results in fewerparticipants at weekends as shown in Figure 3.In the next section, we explore further implications
of the parameter estimates of our VBM by examiningthe effects of two alternative what-if scenarios.
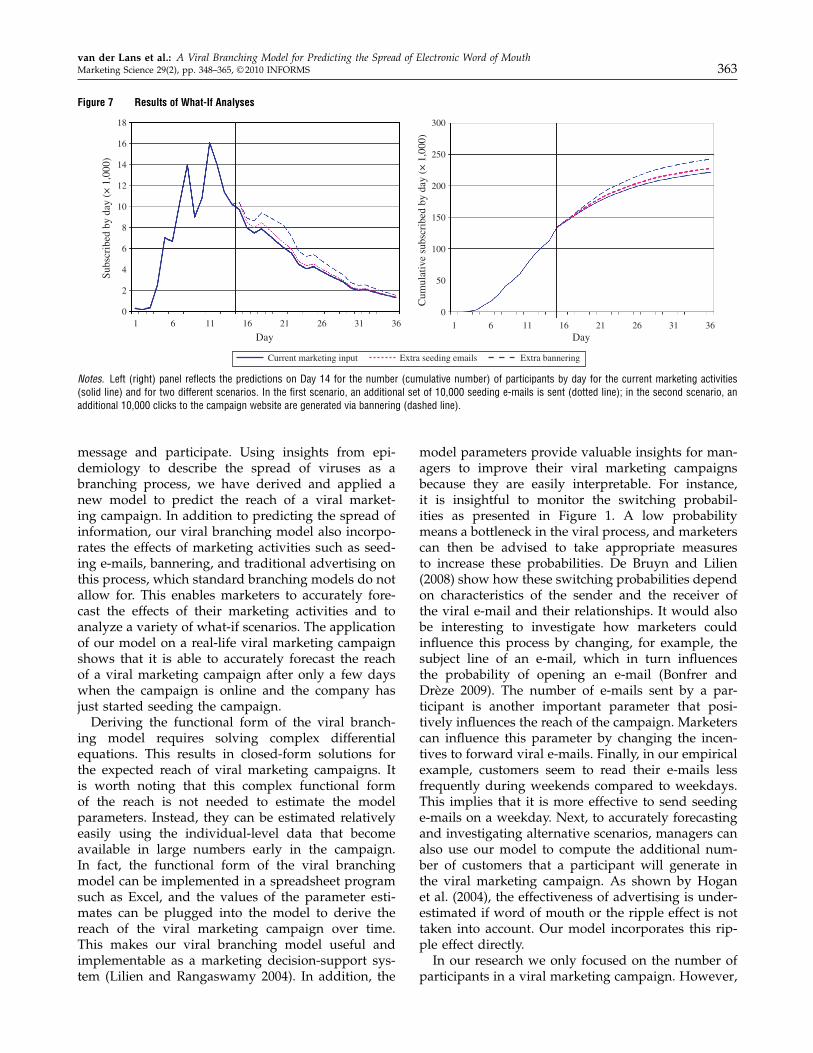
5.3. What-If AnalysesThe VBM not only allows us to predict the spread ofthe viral marketing campaign over time, but it alsoenables us to forecast the spread if different market-ing activities are pursued. This possibility to performwhat-if analyses allows marketers to use the modelto support decisions about modifying the campaignto reach their objectives. To illustrate this possibility,we explore the effects of two alternative marketingactivities. Using the model parameters of the VBMbased on the estimation period of 14 days, we pre-dict how the spread of the viral marketing campaignis different if (1) an additional 10,000 seeding e-mailsare sent on Day 15, and (2) an additional 10,000 clicksare bought through banners that are set online for oneweek from Day 15 to Day 22.Table 4 summarizes the effects of these two alter-
native marketing campaigns. The additional 10,000seeding e-mails results in an additional reach of 6,211participants at the end of the campaign on Day 36.This means that on average 0.62 additional partici-pants will be reached for every seeding e-mail. Thisis the number of people that directly participate
Table 4 Predicted Effects of What-If Scenarios
Predicted Predictedcumulative Predicted number ofnumber of number of additional
Marketing activity participants additional participantson Day 15 on Day 36 participants per click/seed
Actual marketing 221,429 — —strategy
Extra bannering 242,595 21�166 2.17 participants/clickfor one week:10,000 clicks
Extra seeding: 227,640 6�211 0.62 participants/seed10,000 e-mails
by responding to the seeding e-mail and indirectlythrough receiving a viral e-mail with an invitationfrom a friend. It is remarkable that the effect of buying10,000 additional banner clicks is substantially higher.This leads to an additional reach of 21,166 participantsat the end of the campaign and means that the addi-tional reach for every click is 2.17. Again, this is thesum of people who start participating directly afterthey have clicked the banner and the subsequentlyinvited contacts through viral e-mails. Apparently,the bannering approach benefits from a self-selectionmechanism. People who click on a banner may havean interest in the campaign and are then also morelikely to participate and send viral e-mails to theirfriends. These effects are reflected in the model by thedifferent probabilities of participating after receiving aseeding e-mail (�m = 0�10 for Days 1–14; see Table 3),and after clicking on a banner (�q = 0�34; see §5.2).Of course, the difference between the effectiveness ofthese approaches will also depend on the quality ofthe mailing database, the characteristics of the websitewhere the banners are placed, and the costs of theseseeding tools. Figure 7 graphically shows the differ-ence in the spread of the campaign if the two alter-native scenarios are executed. It is interesting to seethat effects of the additional marketing expenditureson Day 15 or shortly after have not only an immediateeffect but also have a more long-term effect. This isdue to the indirect or viral effect following the directeffect of these marketing activities. Hogan et al. (2004)label this the “ripple” effect, and they find that ignor-ing this effect may underestimate the effectiveness ofadvertising campaigns. The same is true for viral mar-keting campaigns, and the ripple effect is likely to beeven stronger for these types of campaigns becauseparticipants are actively encouraged to further spreadthe campaign among their friends. Once the rates ofbanner clicks and seeding e-mails are known, a com-pany can determine which seeding method is mostcost effective. Once the company can also put a dollarvalue on a customer that participates (e.g., customerlifetime value), it is possible to determine if it is prof-itable to carry out a particular additional seeding.
6. DiscussionViral marketing is a relatively new way of approach-ing markets and communicating with customers andcan potentially achieve a large reach and a fastspread among target audiences. Often these cam-paigns are relatively inexpensive because customernetworks take care of spreading the messages and noexpensive media exposure needs to be purchased. Thedependency on these networks requires new model-ing techniques to predict how a campaign will evolveover time and how many customers will receive the
van der Lans et al.: A Viral Branching Model for Predicting the Spread of Electronic Word of MouthMarketing Science 29(2), pp. 348–365, © 2010 INFORMS 363
Figure 7 Results of What-If Analyses
36312621
Day Day161161
0
2
4
6
8
10
12
Subs
crib
ed b
y da
y (×
1,0
00)
Cum
ulat
ive
subs
crib
ed b
y da
y (×
1,0
00)
14
16
18
36312621161161
0
50
100
150
200
250
300
Extra seeding emails Extra banneringCurrent marketing input
Notes. Left (right) panel reflects the predictions on Day 14 for the number (cumulative number) of participants by day for the current marketing activities(solid line) and for two different scenarios. In the first scenario, an additional set of 10,000 seeding e-mails is sent (dotted line); in the second scenario, anadditional 10,000 clicks to the campaign website are generated via bannering (dashed line).
message and participate. Using insights from epi-demiology to describe the spread of viruses as abranching process, we have derived and applied anew model to predict the reach of a viral market-ing campaign. In addition to predicting the spread ofinformation, our viral branching model also incorpo-rates the effects of marketing activities such as seed-ing e-mails, bannering, and traditional advertising onthis process, which standard branching models do notallow for. This enables marketers to accurately fore-cast the effects of their marketing activities and toanalyze a variety of what-if scenarios. The applicationof our model on a real-life viral marketing campaignshows that it is able to accurately forecast the reachof a viral marketing campaign after only a few dayswhen the campaign is online and the company hasjust started seeding the campaign.Deriving the functional form of the viral branch-
ing model requires solving complex differentialequations. This results in closed-form solutions forthe expected reach of viral marketing campaigns. Itis worth noting that this complex functional formof the reach is not needed to estimate the modelparameters. Instead, they can be estimated relativelyeasily using the individual-level data that becomeavailable in large numbers early in the campaign.In fact, the functional form of the viral branchingmodel can be implemented in a spreadsheet programsuch as Excel, and the values of the parameter esti-mates can be plugged into the model to derive thereach of the viral marketing campaign over time.This makes our viral branching model useful andimplementable as a marketing decision-support sys-tem (Lilien and Rangaswamy 2004). In addition, the
model parameters provide valuable insights for man-agers to improve their viral marketing campaignsbecause they are easily interpretable. For instance,it is insightful to monitor the switching probabil-ities as presented in Figure 1. A low probabilitymeans a bottleneck in the viral process, and marketerscan then be advised to take appropriate measuresto increase these probabilities. De Bruyn and Lilien(2008) show how these switching probabilities dependon characteristics of the sender and the receiver ofthe viral e-mail and their relationships. It would alsobe interesting to investigate how marketers couldinfluence this process by changing, for example, thesubject line of an e-mail, which in turn influencesthe probability of opening an e-mail (Bonfrer andDrèze 2009). The number of e-mails sent by a par-ticipant is another important parameter that posi-tively influences the reach of the campaign. Marketerscan influence this parameter by changing the incen-tives to forward viral e-mails. Finally, in our empiricalexample, customers seem to read their e-mails lessfrequently during weekends compared to weekdays.This implies that it is more effective to send seedinge-mails on a weekday. Next, to accurately forecastingand investigating alternative scenarios, managers canalso use our model to compute the additional num-ber of customers that a participant will generate inthe viral marketing campaign. As shown by Hoganet al. (2004), the effectiveness of advertising is under-estimated if word of mouth or the ripple effect is nottaken into account. Our model incorporates this rip-ple effect directly.In our research we only focused on the number of
participants in a viral marketing campaign. However,
van der Lans et al.: A Viral Branching Model for Predicting the Spread of Electronic Word of Mouth364 Marketing Science 29(2), pp. 348–365, © 2010 INFORMS
an interesting feature of online marketing is the pos-sibility to track the behavior of visitors on websites(Manchanda et al. 2006). This allows marketers notonly to investigate the number of customers who vis-ited the campaign website but also to inspect thequality of these visits. An interesting opportunity forfuture research would be to study the impact of viralmarketing campaigns by integrating the reach of thecampaign with behavioral data, such as the time cus-tomers spend on the website, which pages they visit,and whether they subscribe for a service or buy spe-cific products.We applied the viral branching model to one
specific viral marketing campaign. Future researchshould investigate the performance of our modelon other viral marketing campaigns. More interest-ingly, using a large set of viral marketing campaigns,it would be useful to determine the relationshipsbetween viral marketing campaign characteristics andthe value of the model parameter estimates. This willprovide interesting insights into what makes a cam-paign successful and under which circumstances. Fur-thermore, such insights could be useful to predict thereach of viral marketing campaigns even before theirlaunch. In addition to relating model parameters tocampaign characteristics, it would also be valuable toinvestigate how model parameters evolve over timeduring the course of a viral marketing campaign. Forinstance, in our research we found that response timesare slower during weekends and that the number ofeffectively forwarded e-mails decreases as more cus-tomers are invited. It is possible that in other cam-paigns other parameters evolve as well. For instance,the effectiveness of seeding activities may change ifmore customers joined the campaign. How to designthese seeding tools effectively is another fruitful areafor future research. For example, in a field experi-ment one could study the effect of timing and differ-ent formats of seeding e-mails and banners on trafficto the campaign website. Moreover, the effect of othermedia, such as blogs, and search engines would bevaluable to study.In conclusion, this paper is the first to describe
and predict the spread of electronic word of mouthin viral marketing campaigns. Our approach cap-tures the interactions between customers as they aredirectly observed in viral marketing campaigns. Fur-thermore, it shows how offline and online marketingactivities affect these interactions. We believe that ourviral branching model is a valuable tool to developand optimize viral marketing campaigns.
7. Electronic CompanionAn electronic companion to this paper is available aspart of the online version that can be found at http://mktsci.pubs.informs.org/.
AcknowledgmentsThe authors thank Klaas Weima, Patrick Filius, and AyseGeertsma of Energize for providing the data set and fortheir helpful suggestions during this project. The authorsalso gratefully acknowledge the valuable suggestions of theeditor, area editor, and two anonymous reviewers.
ReferencesAthreya, K. B., P. E. Ney. 1972. Branching Processes. Springer-Verlag,
Berlin.
Bartlett, M. S. 1960. Stochastic Population Models in Ecology and Epi-demiology. Methuen, London.
Bass, F. M. 1969. A new product growth for model consumerdurables. Management Sci. 15(5) 215–227.
Biyalogorsky, E., E. Gerstner, B. Libai. 2001. Customer referral man-agement: Optimal reward programs.Marketing Sci. 20(1) 82–95.
Blattberg, R., J. Golanty. 1978. Tracker: An early test market fore-casting and diagnostic model for new product planning. J. Mar-keting Res. 15(2) 192–202.
Bonfrer, A., X. Drèze. 2009. Real-time evaluation of e-mail campaignperformance. Marketing Sci. 28(2) 251–263.
Chiu, H.-C., Y.-C. Hsieh, Y.-H. Kao, M. Lee. 2007. The determinantsof e-mail receivers’ disseminating behaviors on the Internet.J. Advertising Res. 47(4) 524–534.
De Bruyn, A., G. L. Lilien. 2008. A multi-stage model of word-of-mouth influence through viral marketing. Internat. J. Res.Marketing 25(3) 151–163.
Dorman, K. S., J. S. Sinsheimer, K. Lange. 2004. In the garden ofbranching processes. SIAM Rev. 46(2) 202–229.
Eliashberg, J., J.-J. Jonker, M. S. Sawhney, B. Wierenga. 2000.MOVIEMOD: An implementable decision support system forpre-release market evaluation of motion pictures.Marketing Sci.19(3) 226–243.
Godes, D., D. Mayzlin, Y. Chen, S. Das, C. Dellarocas, B. Pfeiffer,B. Libai, S. Sen, M. Shi, P. Verlegh. 2005. The firm’s manage-ment of social interactions. Marketing Lett. 16(3-4) 415–428.
Harris, T. E. 1963. The Theory of Branching Processes. Springer-Verlag,Berlin.
Hauser, J. R., K. J. Wisniewski. 1982. Application, predictive test,and strategy implications for a dynamic model of consumerresponse. Marketing Sci. 1(2) 143–179.
Hogan, J. E., K. N. Lemon, B. Libai. 2004. Quantifying the rip-ple: Word-of-mouth and advertising effectiveness. J. Advertis-ing Res. 44(3) 271–280.
Kalyanam, K., S. McIntyre, J. T. Masonis. 2007. Adaptive experi-mentation in interactive marketing: The case of viral marketingat Plaxo. J. Interactive Marketing 21(3) 72–85.
Kamakura, W. A., S. K. Balasubramanian. 1988. Long-term view ofthe diffusion of durables: A study of the role of price and adop-tion influence processes via tests of nested models. Internat. J.Res. Marketing 5(1) 1–13.
Kendall, D. G. 1949. Stochastic processes and population growth.J. Roy. Statist. Soc. Ser. B 11(2) 230–264.
Lenk, P. J., A. G. Rao. 1990. New models from old: Forecastingproduct adoption by hierarchical Bayes procedures. MarketingSci. 9(1) 42–53.
Lilien, G. L., A. Rangaswamy. 2004. Marketing Engineering:Computer-Assisted Marketing Analysis and Planning, Revised2nd ed. Trafford Publishing, Victoria, BC, Canada.
van der Lans et al.: A Viral Branching Model for Predicting the Spread of Electronic Word of MouthMarketing Science 29(2), pp. 348–365, © 2010 INFORMS 365
Manchanda, P., J.-P. Dubé, K. Y. Goh, P. K. Chintagunta. 2006. Theeffect of banner advertising on Internet purchasing. J. Market-ing Res. 43(1) 98–108.
Moe, W. W. 2003. Buying, searching, or browsing: Differentiat-ing between online shoppers using in-store navigational click-stream. J. Consumer Psych. 13(1-2) 29–39.
Morrissey, B. 2007. Clients try to manipulate “unpredictable” viralbuzz. Adweek 48(March 19) 12.
New Media Age. 2007. Red Nose Day viral game played 1.16m times.(March 29) 3.
Parker, P. M. 1992. Price elasticity dynamics over the adoption lifecycle. J. Marketing Res. 29(3) 358–367.
Phelps, J. E., R. Lewis, L. Mobilo, D. Perry, N. Raman. 2004. Viralmarketing or electronic word-of-mouth advertising: Examin-ing consumer responses and motivations to pass along e-mail.J. Advertising Res. 44(4) 333–348.
Ross, S. M. 1997. Introduction to Probability Models. Academic Press,San Diego.
Sevast’yanov, B. A. 1957. Limit theorems for branching stochasticprocesses of special form. Theory Probab. Appl. 2(3) 321–331.
Shocker, A. D., W. G. Hall. 1986. Pretest market models: A criticalevaluation. J. Product Innovation Management 3(2) 86–107.
Silk, A. J., G. L. Urban. 1978. Pretest market evaluation of new pack-aged goods: A model and measurement methodology. J. Mar-keting Res. 15(2) 171–191.
Urban, G. L. 1970. Sprinter Mod III: A model for the analysis ofnew frequently purchased consumer products. Oper. Res. 18(5)805–854.
Urban, G. L. 1975. Perceptor: A model for product postioning.Man-agement Sci. 21(8) 858–871.
Watts, D. J., J. Peretti. 2007. Viral marketing for the real world.Harvard Bus. Rev. 85(May) 22–23.
Wireless News. 2006. TRUSTE/TNS survey: Most Internet users arenot taking action to protect online privacy. (December 8) 1.
van Wyck, S. 2007. Viral is worth the investment. B&T Weekly57(February 23) 14.