atmos. chem. phys. discuss., … · absorption cross -section,Ó a metric describing absorption of...
TRANSCRIPT

1
Characterizing the evolution of physical properties and mixing state of black carbon particles: from near a major highway to the broader urban plume in Los Angeles Trevor S. Krasowsky1, Gavin R. McMeeking2, Constantinos Sioutas1, George Ban-Weiss1 5 1Sonny Astani Department of Civil and Environmental Engineering, University of Southern California, Los Angeles, 90089, U.S.A 2Handix Scientific, Boulder, 80301, U.S.A
Correspondence to: George Ban-Weiss (E-mail: [email protected])
Abstract. Black carbon particles can have deleterious human health consequences and impact regional and global climate. 10
Uncertainties remain in part due to incomplete knowledge on the evolution of physical properties and mixing state of black
carbon from sources to the remote atmosphere. We aim to understand how road-to-ambient processing and longer timescale
aging in an urban plume affect black carbon physical properties. Refractory black carbon (rBC) was measured during
summer 2016 using a Single Particle Soot Photometer (SP2) in two distinct environments: near a major freeway and
downwind of downtown Los Angeles. The near-road measurements were made at distances ranging from 30 to 114 m 15
downwind of Interstate 405 in Los Angeles. These results were compared with measurements performed 100 km east of Los
Angeles in Redlands, California. Coatings on rBC particles were quantified using two methods. As distance from the
highway increased at the near-road site, we observed decreases in rBC mass and number concentrations and increases in the
number fraction of rBC particles with thick coatings (f). The latter likely occurred due to rapid processing of the highway
plume and entrainment of urban background particles. Most rBC-containing particles measured near the highway were either 20
uncoated or thinly-coated. In Redlands, we found that rBC mass concentrations on weekdays were similar to those observed
at the furthest measured distance from the highway (114 m). However, rBC number concentrations for the smallest measured
sizes were an order of magnitude lower in Redlands than all measured distances from the highway. Observations of f indicate
that values in Redlands during periods when estimated photochemical age was highest (6-8 hours) were similar to
corresponding values at the furthest measured distance from the highway. This suggests that the residence time of air in the 25
Los Angeles basin under typical summertime conditions measured during this campaign may not be sufficient for rBC to
acquire thick coatings. However, under certain meteorological conditions, f was observed to be ~0.20 in Redlands, with
coating thickness histograms showing a larger contribution of rBC particles with coating thickness > 80 nm. This occurred
during a weekend day when local emissions from diesel vehicles were lower (compared to weekdays) and winds brought air
from the desert regions to the Northeast of Los Angeles, both of which would increase the relative contribution of remote 30
sources of rBC. Afternoon values of f (and O3) were found to be systematically higher on weekends than weekdays,
suggesting that the “weekend effect” can create more thickly-coated rBC particles presumably due to enhanced secondary
organic aerosol and reduced available rBC as condensation sites.
Atmos. Chem. Phys. Discuss., https://doi.org/10.5194/acp-2017-1020Manuscript under review for journal Atmos. Chem. Phys.Discussion started: 9 November 2017c© Author(s) 2017. CC BY 4.0 License.
2
1 Introduction
Black carbon (BC) is considered the second strongest climate-forcing agent following carbon dioxide (CO2) and causes a
myriad of pernicious health effects including cancer (Hart et al., 2009; Lloyd and Cackette, 2011; WHO, 2012; Bond et al.,
2013). Ambient BC absorbs solar radiation, which leads to overall increases in shortwave radiation being absorbed by the
climate system and local atmospheric heating with consequences on atmospheric thermodynamics (Cooke and Wilson, 1996; 5
Hansen et al., 1997, 2005; Ban-Weiss et al., 2012). Through its ability to act as cloud condensation nuclei, BC can also
influence cloud microphysics (IPCC, 2007). Estimates of emissions and climate consequences of BC remain uncertain
compared to other climate forcing agents (Bond et al., 2013). Unlike long-lived greenhouse gases, which are globally well-
mixed, BC has a relatively short atmospheric lifetime and is therefore spatially heterogeneous (Sardar et al., 2014;
Krasowsky et al., 2014). Improving understanding of spatiotemporal variation (from pollutant source to the remote 10
atmosphere) in BC concentrations and physical properties is critical for reducing uncertainties in quantifying its climate and
health impacts.
The “mixing state” of black carbon describes whether other aerosol species exist as separate particles (i.e. externally
mixed) or are attached to (or coated on) BC particles (i.e. interally mixed) (Jacobson, 2001; Willis et al., 2016). Though
characterizing the mixing state of ambient black carbon through observations is challenging, there have been recent advances 15
in instrumentation and data analysis methods capable of determining coating thickness in addition to BC mass and number
concentrations and BC size distributions (e.g. Gao et al., 2007; Moteki and Kondo, 2007). Uncertainties remain in part due to
variability in the structure of BC-containing particles (Sedlacek et al., 2012). BC is generally considered externally mixed at
the emission source. With time, BC can become internally mixed with other species (e.g., sulfates, nitrates, and organics) in
a process often referred to as “aging” (Weingartner et al., 1997; Riemer et al., 2010; Bond et al., 2013; Zhang et al., 2015). 20
Past research has suggested that the mixing state of black carbon at the emissions source can influence the aging of BC even
after time for significant atmospheric processing (Willis et al., 2016). Coatings on BC are thought to enhance its “mass
absorption cross-section,” a metric describing absorption of radiation normalized by the mass of the particle (Fuller et al.,
1999; Lack et al., 2009; Subramanian et al., 2010; Healy et al., 2015). Furthermore, coatings influence the hygroscopicity of
BC with significant effects on climate (Laborde et al., 2013; Schwarz et al., 2014) in addition to possible but largely 25
unexplored effects on particle health impacts. Uncoated BC has been shown to be hydrophobic while coated BC has a higher
affinity for water (i.e. hydrophilic) (Dahlkötter et al., 2014). This change in hygroscopicity has an influence on BC’s ability
to act as cloud condensation nuclei with subsequent effects on wet deposition rates and lifetime, but this phenomenon still
has associated uncertainties. The high relative humidity in the human lungs (99.5%) (Ferron et al., 1988; Anselm et al.,
1990) suggests a relationship between BC hygroscopicity and lung deposition probability. As BC becomes hydrophilic with 30
acquired coatings, health impacts may be modified due to competition between (1) the decrease in deposition probability as
particles in the ultrafine mode (particle diameter < 100 nm) grow to the accumulation mode (0.1 µm < particle diameter <
2.5 µm), and (2) the potential for coated BC to be more toxic than uncoated BC.
Atmos. Chem. Phys. Discuss., https://doi.org/10.5194/acp-2017-1020Manuscript under review for journal Atmos. Chem. Phys.Discussion started: 9 November 2017c© Author(s) 2017. CC BY 4.0 License.
3
The mixing state of BC is sensitive to a variety of factors and varies in time and space. Composition and timescales
for development of coatings can depend on season and location. As an example of seasonal dependence, one modeling study
focusing on southwestern Germany showed that condensation of sulfuric acid dominates aging of BC during the summer
season while the relative importance of ammonium nitrate coatings increases during the winter season (Riemer et al., 2004).
A more recent observational study in urban Los Angeles found that BC coatings are mostly comprised of secondary organic 5
aerosol (Lee et al., 2017). Previous observations have also concluded that the mixing state of BC in urban areas can vary for
weekdays versus weekends. The substantial decrease in heavy-duty diesel traffic on weekends compared to weekdays has
been shown to increase secondary organic aerosol (SOA) formation. This would lead to a higher ratio of organic aerosol to
refractory BC, leading to a higher fraction of BC with thick coatings on weekends (Metcalf et al., 2012; Krasowsky et al.,
2016). Time of day can also influence the mechanisms that create coatings on BC. For example, a recent modeling study 10
suggested that BC aging over central-eastern China is dominated by condensation of photochemical pollutants while
coatings at night occur at slower time scales dominated by coagulation aging (Chen et al., 2017).
The physical properties and mixing state of ambient black carbon can be determined using the Single-Particle Soot
Photometer (SP2). This instrument uses laser-induced incandescence and scattering to determine (a) refractory black carbon
(rBC) mass and number concentrations and size distributions and (b) physical properties of rBC-containing particles 15
including coating thickness (Laborde et al., 2012; Dahlkötter et al., 2014). Two different data analysis techniques can be
used with SP2 measurements to quantify the mixing state of individual rBC-containing particles. The first is the “lag-time”
method, which takes advantage of the time delay between peak scattering and incandescence signal responses to stratify
particles as those that are (1) uncoated or “thinly” coated, versus (2) “thickly” coated, based on a selected time delay
threshold. rBC-containing particles with time delays greater than the set threshold are deemed as thickly-coated and vice 20
versa. More information on the lag-time method can be found in previous studies (e.g. Moteki et al., 2007; McMeeking et
al., 2011; Wang et al., 2014; Krasowsky et al., 2016). The second technique, called the leading-edge-only (LEO) method
(Gao et al., 2007), is capable of quantifying coating thickness. Coatings vaporize as rBC-containing particles traverse the
laser beam in the SP2. Thus, the LEO method works by reconstructing the Gaussian scattering function of scattering signal
response curves (i.e. the scattering signal prior to coating vaporization) using the initial 1 to 5% of the measured signal. The 25
LEO method employs measurements from the two-element avalanche photodiode in the SP2 to determine particle position as
it traverses the laser beam at a near-fixed velocity. After Mie theory modeling with assumed refractive indices, the
reconstructed scattering signal is used to quantify coating thickness for internally mixed rBC-containing particles (Gao et al.,
2007). For more details on the LEO method see section 2.6. Several studies have used the LEO method or related analyses to
quantify coating thickness for internally mixed rBC-containing particles. We summarize these studies in the Materials and 30
Methods section 2.5. Note that there have been important variations in how the LEO method has been applied in previous
literature (e.g. variations in rBC core size ranges for which coating thicknesses are analyzed), making synthesizing previous
investigations difficult. We aim to provide sufficient detail on each study to aid in interpreting differences in analysis
techniques and conclusions.
Atmos. Chem. Phys. Discuss., https://doi.org/10.5194/acp-2017-1020Manuscript under review for journal Atmos. Chem. Phys.Discussion started: 9 November 2017c© Author(s) 2017. CC BY 4.0 License.

4
Most previous research on the mixing state of rBC-containing particles focuses on time scales of hours or longer as
pollutant plumes advect away from sources (see Section 2.5). To our knowledge, there is limited prior work assessing the
evolution of mixing state on more rapid timescales as pollutants are transported away from sources. Earlier studies have
investigated the evolution of particle size distributions (i.e. including all species) during “road-to-ambient” processing (i.e.
where highly concentrated aerosols from highway emissions dilute to ambient urban background concentrations). Zhang et 5
al. (2004) showed that condensation, evaporation, and dilution dominate the evolution of aerosol physical properties
associated with road-to-ambient processing. Changes in aerosol size on these rapid timescales near sources can be described
through the competition of partial pressure and saturation vapor pressure, where particle growth through condensation has
been shown to occur beyond 90 m from a major highway (Zhang et al., 2004). In theory, these processes could also impact
the mixing state of rBC. Note that during these more rapid timescales there is likely insufficient time for complex 10
photochemical reactions or coagulation of rBC with non-refractory material to occur. Coagulation becomes more significant
when particle number concentrations are high and/or aging time scales are greater than 10 hours (Riemer et al., 2004),
substantiating assertions that particle growth of fresh emissions near a major highway is attributed primarily to condensation
of semi-volatile species, with coagulation playing a supporting role (Zhang et al., 2004). One previous study (Willis et al.,
2016) used a soot-particle aerosol mass spectrometer to measure traffic emissions in an urban environment. They found that 15
BC near emissions sources is internally mixed with hydrocarbon-like aerosols (HOA) as either “rBC-rich” or “HOA-rich”
with the majority of measured BC mass associated with rBC-rich particles. Another study (Lee et al., 2017) investigated the
evolution of rBC-containing particles near major highways in the Los Angeles Basin using the ratio of NOx to NOy as a
surrogate for photochemical age of the aerosol. They found that SOA was responsible for substantial coatings on rBC during
the day when photochemistry is most important. Note that measurements were made roughly 3 km (2 miles) from the nearest 20
highway, meaning that measured rBC-containing particles included a mix of fresh vehicular emissions along with the greater
urban plume. An earlier study by Massoli et al. (2012) reported that under stable atmospheric conditions, vehicular air
pollution becomes relatively well mixed with background air within 150 m of the Long Island Expressway (Interstate 495) in
Queens, New York. This assertion alludes to the difficulty of attributing specific atmospheric processing mechanisms to
describe changes in the mixing state of aerosols at locations greater than 150 m downwind of highways where air masses are 25
heavily influenced from vehicular traffic emissions but not independent of the broader city’s emissions. Additional
measurements are needed at a variety of locations and over a range of aging timescales to develop a comprehensive
understanding for how morphology of rBC-containing particles varies from source to urban, continental, and global scale.
The overarching goal of this study is to systematically compare the evolution of physical properties and mixing
state for rBC-containing particles at two distinct spatiotemporal scales: rapid timescales during road-to-ambient processing 30
near a major highway, and longer timescales after urban emissions have aged during transport to a measurement site
downwind of urban Los Angeles. The evolution of physical properties and mixing state at rapid timescales is investigated by
making measurements of rBC-containing particles from 30 to 114 m from a major highway on the west side of Los Angeles
near the Pacific Ocean. This location was chosen to minimize the contribution of the broader urban plume on measurements.
Atmos. Chem. Phys. Discuss., https://doi.org/10.5194/acp-2017-1020Manuscript under review for journal Atmos. Chem. Phys.Discussion started: 9 November 2017c© Author(s) 2017. CC BY 4.0 License.

5
Longer time scales are investigated here by measuring rBC-containing particles in Redlands, CA, roughly 100 km downwind
(assuming prevailing westerly winds) of downtown Los Angeles. Mass and number concentrations of rBC-containing
particles, rBC size distributions, the fraction of rBC-containing particles that are thickly-coated (i.e. using the lag-time
method), and coating thickness histograms (i.e. using the LEO method) are reported. Besides comparing the mixing state of
rBC-containing particles at these two aging timescales, the results reported here investigate the influence of meteorology and 5
vehicle fleet (i.e. weekdays versus weekends) on the mixing state of rBC-containing particles at the Redlands site. A detailed
procedure for how we perform the LEO method is also described in the supplement.
2 Materials and Methods
2.1 Sampling locations
Two measurement campaigns were completed in 2016 during the hottest season in southern California. Ambient rBC-10
containing particles were measured in two distinct environments: the first campaign was conducted near a major highway in
Los Angeles, California (i.e., Interstate 405), while the second campaign was conducted ~100 km east and generally
downwind of downtown Los Angeles (i.e., Redlands, California) in an area where rBC is presumably more aged relative to
locations closer to downtown.
2.1.1 Near-road campaign 15
The near-road campaign was carried out at the Los Angeles National Cemetery, which is adjacent to Interstate 405. This site
is on the west side of the Los Angeles basin, ~7km (~4 miles) from the Pacific Ocean, and upwind (assuming the dominant
westerly on-shore flow) of most of the basin including downtown. A previous study by Zhu et al. (2002) demonstrated that
the winds at this site are generally westerly and perpendicular to Interstate 405. See section 2.4.1 for a summary of observed
meteorology during our campaign. The Los Angeles National Cemetery is therefore an ideal location for investigating the 20
evolution of rBC mixing state from road to ambient environments given that measured aerosols over a relatively large area
are dominated by highway emissions (Zhang et al., 2004). Adjacent to the cemetery, Interstate 405 runs along a 330-degree
path or virtually north/south (Zhu et al., 2002). The western (eastern) edge of the Los Angeles National Cemetery is 30 m
(730 m) from Interstate 405 (Zhu et al., 2002). Measurements were recorded in increments of about 8 m (25 ft.) beginning at
30 m (100 ft.) and progressing downwind to 114 m (375 ft.) from the highway for each day using a mobile platform. As 25
described in Zhu et al. (2002), there was not a true “0 m” measurement location given (a) the difficulty of approaching the
highway with the mobile platform, and (b) the width (~60 m) of the highway itself (i.e. even if we could have sampled at the
edge of the highway, we would have been measuring a mix of particles emitted from the nearest lane to the farthest lane).
The fraction of vehicles that is heavy-duty diesel trucks on Interstate 405 is estimated to be about 5% (Zhang et al., 2004).
Atmos. Chem. Phys. Discuss., https://doi.org/10.5194/acp-2017-1020Manuscript under review for journal Atmos. Chem. Phys.Discussion started: 9 November 2017c© Author(s) 2017. CC BY 4.0 License.

6
2.1.2 Redlands campaign
Measurements were made at the South Coast Air Quality Management District’s Redlands Site (500 N. Dearborn St.
Redlands, CA 92374). The location is approximately 100 km east of downtown Los Angeles in a neighborhood ~1.5 km (~1
mile) from a major highway (Interstate 10). Therefore, aerosols measured at this location are dominated by a mix of sources:
(a) vehicular emissions from the nearby highway, and (b) aerosols advected from the greater Los Angeles basin when winds 5
are westerly, or presumably more aged aerosols from the east when winds are easterly. Instruments were housed in an air-
conditioned trailer kept at roughly 24°C (75°F) throughout the campaign.
2.2 Sampling time periods
The near-road measurement campaign was completed on four separate days from 12:00−14:00 local time. Morning and
afternoon rush hour on Interstate 405 causes traffic to slow and even halt. Therefore, we chose a time period between these 10
rush hour episodes when traffic flow was uncongested and speeds were steady at roughly 105−120 kph (65−75 mph)
(estimated, not measured). Because the goal of this campaign was to assess rBC mixing state with respect to distance from
the highway, short sampling time periods of 5 minutes (per distance from the highway) were used to reduce the influence of
other confounding factors such as changes in traffic flow, wind speed and direction, atmospheric stability, and solar
irradiance, that would shift following a typical diurnal cycle. Sampling dates were August 4, August 5, September 12, and 15
September 14, 2016.
The Redlands measurement campaign was completed continuously during the late summer from September
16−October 10, 2016 using stationary instrumentation with measurements recording 24 hours per day to capture diurnal
changes in rBC-containing particles.
2.3 Instrumentation 20
During both sampling campaigns, an SP2 (Droplet Measurement Technologies, Boulder, CO) was used to quantify the
physical characteristics of rBC-containing particles. Briefly, the SP2 measures physical properties of rBC-containing
particles by focusing a flow of sample air across a high-intensity intra-cavity Nd:YAG laser (λ = 1064 nm). As an individual
rBC-containing particle traverses the cross-section of the laser beam, the temperature of the particle increases to the point
that any coatings on the rBC vaporize and the rBC core incandesces. The SP2 is capable of detecting rBC-containing 25
particles to a lower detection limit of approximately 0.5 fg (Gao et al., 2007; Moteki and Kondo, 2007; Dahlkötter et al.,
2014; Krasowsky et al., 2016).
A MicroAeth (MA) model AE51 (Aeth Labs, San Francisco, CA) was positioned at a fixed location ~35 m from
Interstate 405 to ensure the black carbon mass concentration remained consistent (±20%) throughout each 2-hour
measurement period. The MA is a handheld aethelometer capable of measuring black carbon mass concentrations in real 30
time. A study completed by De Nazelle et al. (2012) shows good agreement for measurements from the MA when compared
Atmos. Chem. Phys. Discuss., https://doi.org/10.5194/acp-2017-1020Manuscript under review for journal Atmos. Chem. Phys.Discussion started: 9 November 2017c© Author(s) 2017. CC BY 4.0 License.

7
to other filter-based black carbon measurements. A correction was applied to the MA data to account for a decrease in
measurement efficiency as the filter becomes increasingly loaded when sampling (Kirchstetter et al., 2007).
For the near-road measurement campaign, a standard gasoline powered vehicle was used to house and transport
instrumentation, and measurements were taken when the engine was turned off. The SP2 was powered by a 12-volt deep
cycle battery along with a DC to AC power inverter. On each day of the near-road measurement campaign (before and after 5
each day’s sampling period), and at the beginning and end of the Redlands measurement campaign, an Aerosol Generator
AG-100 (Droplet Measurement Technologies, Boulder, CO) was used to suspend 269 nm polystyrene-latex spheres (PSLs)
(Thermo Scientific, formerly Duke Scientific) in particle free air. The purely scattering PSLs were measured by the SP2 and
used in the LEO analysis to aid in understanding its performance and to verify the position of optical components after
transit to a new location. Sampling a known size of purely scattering particles can provide detailed information on where the 10
notch in the split detector occurs as described in Gao et al. (2007). Also see Laborde et al. (2013) for more information. The
LEO analysis is further described in section 2.6.
2.4 Meteorology
2.4.1 Meteorology near-road
Temperatures for the near-road measurement campaign were moderate with maximum daily temperatures of 25.6°C (78°F), 15
23.9°C (75° F), 21.7°C (71°F), and 21.7°C (71°F) for August 4, August 5, September 12 and September 14, respectively
(Weather Underground, 2016a). Winds were westerly, causing pollutants to advect across the cemetery perpendicular to
Interstate 405. Similar wind patterns were reported at the same location in Zhu et al. (2002).
2.4.2 Meteorology Redlands
Temperatures for the Redlands measurement campaign ranged from 10.6−40.6°C (51−105°F) (Weather Underground, 20
2016b). For most days, winds were westerly during the day, with speeds increasing in the afternoon as is typical for the sea
breeze in this region. For a few sampling days winds were variable in both speed and direction.
2.5 Review of methods in past studies that determine rBC mixing state using the SP2
Prior to discussing our methods for determining properties of coatings on rBC (section 2.6), we review past literature that
determines rBC mixing state using the SP2. Taylor et al. (2014) investigated rBC wet removal in biomass burning plumes to 25
help constrain rBC radiative forcing estimates. Along with measurements of rBC core size and removal efficiency, the
mixing state for 130−230 nm rBC cores was measured using the LEO method with parameters similar to many other studies
reported here. They used the scattering signal up to 5% of peak intensity to reconstruct the Gaussian scattering signal.
Coating thickness was quantified using Mie calculations with an assumed core refractive index of RI=2.26+1.26i at 1064 nm
based on previous work by Moteki et al. (2010), and an assumed shell (or coating) refractive index of RI=1.5+0i. Results 30
Atmos. Chem. Phys. Discuss., https://doi.org/10.5194/acp-2017-1020Manuscript under review for journal Atmos. Chem. Phys.Discussion started: 9 November 2017c© Author(s) 2017. CC BY 4.0 License.

8
from this study demonstrated more efficient scavenging of larger rBC cores with thicker coatings. Liu et al. (2014) measured
size distributions, performed a source apportionment analysis, and characterized the mixing state of rBC-containing aerosols
in London as part of the Clean Air for London project. To perform the mixing state analysis, Liu et al. (2014) used the LEO
method with 1 to 5% peak laser intensity for rBC cores ranging from 100−200 nm with the same refractive indices as Taylor
et al. (2014). Results showed that traffic-related rBC-containing particles exhibited very thin coatings with remarkably 5
similar rBC core size distributions for summer and winter measurements (Liu et al., 2014). Laborde et al. (2013) investigated
the relationship between hygroscopicity and black carbon mixing state during the wintertime in suburban Paris for rBC core
diameters in the range of 180−220 nm and 240−280 nm. The LEO method was applied using up to 1% of peak laser intensity
to reduce the chance of including the vaporization signal when performing the Gaussian fitting, effectively using much less
of the initial scattering signal than Taylor et al. (2014). Results from Laborde et al. suggest that particles emitted by traffic 10
have essentially no coatings (<10nm), and that as coatings increase in size, the rBC cores become more spherical,
demonstrating the influence of coatings on rBC morphology. Schwarz et al. (2008a) measured mass, mixing state, and
optical size of individual rBC-containing particles. The LEO method was used to compare the mixing state of urban and
biomass burning emissions of rBC cores in the size range of 190−210 nm volume-equivalent-diameter (VED). Results
indicated that urban rBC-containing particles consistently had smaller rBC core sizes and thinner non-rBC coatings than 15
those in biomass burning plumes. Schwarz et al. (2008b) assessed coatings using the LEO method for measurements in a
NASA research aircraft in the tropics over Costa Rica. They found that 200 nm VED rBC cores had mean coating
thicknesses of 30 nm. Schwarz et al. (2014) developed a compact humidification system to quantify the hygroscopicity of
rBC in relation to coating thickness quantified by the LEO method. This study introduced a unique way to bridge SP2-
measured light scattering to aerosol water uptake properties based on Mie and κ-Köhler theory. Dahlkötter et al. (2014) 20
evaluated aerosol properties and rBC mixing state after long-range transport to the upper troposphere using an aircraft during
the CONCERT 2011 field experiment. They found coatings to be much thicker than many other studies (i.e. median
thickness ranged from 105 to 136 nm depending on the flight). The SP2 settings used by Dahlkötter et al. made
measurements sensitive to scattering material in the optical diameter range of 140 to 290 nm. This study showed that,
assuming a homogenous sphere with refractive index of 1.59 + 0.00i versus the previous literature value of 1.50 + 0.00i, 25
produced uncertainty in the range of 5% for a 200 nm particle. Thus, the assumed RI did not vastly impact the computed
coating thickness. Their reported LEO coating thickness histogram showed values ranging from 20 to 180 nm for rBC cores
in the range of 140 to 160 nm and 180 to 220 nm. Metcalf et al. (2012) performed a study over the Los Angeles basin during
the CalNex campaign and evaluated mixing state using both the LEO and lag-time methods. They presented evidence that
shifts in the vehicle fleet on weekends can induce more SOA formation and consequently more thickly-coated rBC particles 30
during the weekends. Shiraiwa et al. (2008) assessed the radiative impacts of rBC mixing state in the Asian outflow at
Fukue, a Japanese island. They showed that coating thicknesses ranged from 25 to 400 nm with dependence on source
region. Measurements made for Asian continental and maritime air masses exhibited a greater shell to core diameter (1.6)
than for Japanese and free troposphere air masses (1.3−1.4). For the LEO method, they elected to set the last point of the
Atmos. Chem. Phys. Discuss., https://doi.org/10.5194/acp-2017-1020Manuscript under review for journal Atmos. Chem. Phys.Discussion started: 9 November 2017c© Author(s) 2017. CC BY 4.0 License.

9
leading edge of the scattering signal to a triple Gaussian width away from the center position of the Gaussian. As part of the
MIRAGE campaign, Subramanian et al. (2010) performed an analysis over Mexico to investigate rBC mixing state and light
interactions as it relates to atmospheric transport. Results from this study show relatively more thinly-coated rBC for
measurements made within the urban Mexico City area relative to rBC-containing particles measured at locations away from
the city where air masses are more aged. 5
2.6 Methodology for estimating the number fraction of thickly-coated particles (f) in our study
As previously mentioned, the mixing state of rBC can be identified using the lag-time method to bin rBC-containing
particles in two categories: (1) uncoated and thinly-coated, and (2) thickly-coated. The lag-time method has been used in
numerous studies and takes advantage of the connection between coating thickness and time delay between measured
pseudo-Gaussian scattering and incandescence signal peaks for a given rBC-containing particle (Moteki et al., 2007; 10
McMeeking et al., 2011; Metcalf et al., 2012; Wang et al., 2014; Krasowsky et al., 2016). Generally, both incandescence and
scattering signals will increase as an rBC-containing particle begins to traverse the cross-section of the SP2 laser beam.
However, thickly-coated rBC-containing particles will have a discernable peak in scattering as the coating vaporizes prior to
the measured peak in incandescence, which occurs when the particle reaches the center of the laser beam. This method
assumes that rBC-containing particles have a core-shell morphology, and that coatings of differing species evaporate at the 15
same rate (Metcalf et al., 2012). A small fraction of rBC-containing particles have an incandescence signal that precedes the
scattering signal due to non-core-shell structure (Sedlacek et al., 2012). Measurements of ambient air usually show a bimodal
distribution of lag-times where the cluster of longer (shorter) lag-times corresponds to rBC-containing particles with thicker
(thinner) coatings. To stratify rBC-containing particles as thinly or thickly-coated, the user selects a fixed lag-time cutoff
based on this measured bimodal distribution, and particles with lag-times greater than the set cutoff are binned as thickly-20
coated. For our study, we chose a time cutoff (1 µs) based on the near-road site and applied this to both sampling locations
for consistency. We note that this cutoff is lower than used in our previous measurements in the Los Angeles basin using the
same instrument (Krasowsky et al., 2016). After classifying each measured particle as thinly or thickly-coated, we computed
the number fraction of rBC-containing particles that are thickly-coated (f) as the ratio of particles with lag-times greater than
1 µs to the number of all rBC-containing particles. To perform the lag-time method, it is necessary to restrict the lower size 25
limit of detection of incandescence to 170 nm MED rBC cores, ensuring that the smallest possible rBC-containing particles
reported in the f analysis would be detectible by the scattering channel. For this reason, reported values of f represent a
subset of the detectable rBC size range of the SP2. We note that an important limitation of reporting f is that the metric gives
insight as to whether or not thick coatings are present without attempting to quantify the coating thickness.
2.7 Leading-edge-only fit methodology for quantifying coating thickness on rBC-containing particles 30
Rather than stratifying particles as thinly or thickly-coated, numerous studies (see Introduction) have employed the leading-
edge-only (LEO) fit method to quantify coating thickness on rBC particles. In this study, we use the Paul Scherrer Institute’s
Atmos. Chem. Phys. Discuss., https://doi.org/10.5194/acp-2017-1020Manuscript under review for journal Atmos. Chem. Phys.Discussion started: 9 November 2017c© Author(s) 2017. CC BY 4.0 License.
10
Single-Particle Soot Photometer Toolkit (PSI-TK) version 4.100a (originally developed by Martin Gysel with the help of
Marie Laborde and others) in IGOR v. 6.36 to perform the LEO method. Please see the supplement for a detailed description
of our implementation of the LEO method to quantify coating thickness. For the LEO analysis, we report coating thickness
for rBC-containing particles that have rBC core diameters ranging from 240 to 280 nm.
For the measurements reported here we loaded one of every five particles into Igor Pro. The SP2 can accurately size 5
light scattering particles (both free of as well as containing rBC) down to ~170 nm VED (Krasowsky et al., 2016). However,
for the LEO analysis, care was taken to set the lower size thresholds in the PSI-TK to a more conservative value (200 nm).
The more conservative limit reduces noise in LEO verification statistics by eliminating particles with size near the lower
detection limit of the split detector. We note that our instrument was particularly prone to noise at lower optical diameters
(<200 nm VED). Though 200 nm VED was the minimum cutoff used from the scattering signal, we report LEO coating 10
thickness for rBC cores ranging from 240−280 nm. For this rBC core size range, coating thickness can be determined for all
rBC-containing particles. Theoretically, the smallest possible rBC-containing particle included in this analysis would be a
pure rBC particle 240 nm in diameter without internally mixed scattering material. The aforementioned minimum cutoff of
200 nm VED only applies to the LEO analyses described here; the lower threshold for other analyses presented in this study
was 170 nm. 15
2.8 Estimation of photochemical age
Photochemical age (PCA) was assessed using co-located nitrogen oxides (NOx) and total reactive nitrogen (NOy)
measurements supplied by the SCAQMD from their Rubidoux site (500 N. Dearborn St. Redlands, CA 92374), which is
approximately 30 km southwest (i.e. upwind, assuming typical afternoon westerly sea breezes) of Redlands. This estimate of
PCA was computed using the same method described in Cappa et al. (2012) and Krasowsky et al. (2016) where NOx is 20
assumed to be the source of all NOy and HNO3 is the dominant loss product of NOx. This metric is intended to give a
relative estimate of the sample age by ranking measurements from least to most aged. We assume that PCA derived from
measurements at Rubidoux are fairly representative of values for Redlands. Because we lacked the required NOx and NOy
measurements at the Redlands location to perform a direct analysis of PCA at the measurement site, we also used hourly
ozone mixing ratios supplied by the SCAQMD for Redlands to get a sense of photochemical air pollutant production per 25
day.
2.9 Weekday versus weekend analysis
An analysis of differences in physical properties of rBC-containing particles for weekdays versus weekends is presented in
this study for measurements at the Redlands site. (All measurements at the near-road site are for weekdays.) We define
weekdays as Tuesdays through Thursdays and weekends as Sundays. This avoids confounding weekday/weekend 30
differences by aerosols with lifetime greater than one day in the LA basin. For example, measurements made on Mondays
likely include a contribution of aerosols that were emitted within the basin on Sunday.
Atmos. Chem. Phys. Discuss., https://doi.org/10.5194/acp-2017-1020Manuscript under review for journal Atmos. Chem. Phys.Discussion started: 9 November 2017c© Author(s) 2017. CC BY 4.0 License.
11
3 Results and discussion
3.1 Near-road campaign
3.1.1 rBC mass and number concentrations and number fraction of thickly-coated particles at different distances from the highway
Figure 1 shows rBC mass concentration, rBC number concentration, and f versus distance from the highway. Markers and 5
error bars shown here represent the mean ± 95% confidence intervals for measurements made during the four sampling days
in August and September. While results are not monotonic as distance from the highway increases, likely due to turbulent
eddies and flow irregularities near the highway, there is an overall decrease in rBC mass concentrations as distance
increases, as was similarly reported in Zhu et al. (2002). In addition, increases in distance are associated with overall
decreases in rBC number concentrations and increases in f. The observed trend in rBC mass and number concentrations 10
likely occur because of vehicle emissions from the highway being transported away from the source and entraining
background air with lower rBC concentrations. Regarding f, we propose three possible explanations for the observed trend.
The first is analogous to the driver of rBC mass and number concentration decreases; as distance from the highway
increases, the plume dilutes and entrains “background” air that would likely include a greater fraction of thickly-coated aged
particles. Because f is a relative measurement that bins particles as either thinly or thickly-coated, and values of f are small 15
near the highway, entraining aged rBC into the highway plume could have large relative impacts on the fraction of particles
that are thickly-coated. A second possible explanation is that rBC may be acquiring coatings as it is transported away from
the highway, likely dominated by condensation of condensable vapors onto rBC, with a lower relative contribution of
coagulation of externally mixed particles. Zhang et al. (2004) found that condensation led to particle growth as distance from
the highway increased at the same site. A third possible explanation is that as rBC mass and number concentrations decrease 20
as distance from the highway increases, the availability of condensation sites (i.e. rBC particles) may decrease relative to
condensable vapor concentrations, would could lead to increased coating thicknesses. This is somewhat analogous to the
aerosol “indirect effect” in which cloud droplet size can increase when there are a reduced numbers of cloud condensation
nuclei (IPCC, 2007).
Zhu et al. (2002) investigated ultrafine particles at the same site over a decade ago. As a part of their campaign, they 25
measured BC mass concentrations using a dual-beam aethalometer (Model AE-20, Andersen Model RTAA-900, Andersen
Instruments, Inc.) at 30, 60, 90, 150, and 300 m downwind and upwind of Interstate 405. We compare here our SP2
measurements of refractory black carbon made at 30, 61, and 91 m downwind of the highway to their measurements made
30, 60, and 90 m downwind of the highway. Relative to values at 30 m, our study suggests that rBC mass concentrations at
61 and 91 m decrease by 54% and 58%, respectively. Corresponding values for Zhu et al. are 41% and 54% (Table 1). 30
Values from our measurements were about an order of magnitude lower than the 2001 measurements. We suggest that this
decrease is primarily the result of stringent and effective policy implementation aimed at curbing carbonaceous aerosol
emissions from vehicles as has shown to be the case at locations across the Los Angeles basin (e.g. Hasheminassab et al.,
Atmos. Chem. Phys. Discuss., https://doi.org/10.5194/acp-2017-1020Manuscript under review for journal Atmos. Chem. Phys.Discussion started: 9 November 2017c© Author(s) 2017. CC BY 4.0 License.
12
2014). It is important to note that some differences may also be attributed to variations in measurement technique including
contributions of particle mass for rBC below the lower limit of detection of the SP2 (core diameter = 70 nm).
Figure 2a and b show f versus rBC mass and number concentrations with color coding highlighting the dependence
of these variables on distance from the highway. Each point represents 10 second averages. The highest values of f (~0.2) are
associated with the lowest values of rBC mass (~0.1 µg m-3) and number concentrations (~100 cm-3). Similarly, the lowest 5
values of f (~0.01) are associated with the highest values of rBC mass (~0.3 – 1.1 µg m-3) and number concentrations (~200
– 1000 cm-3). rBC mass concentration and f are anti-correlated with r = -0.21; similarly, rBC number concentration and f are
anti-correlated with r = -0.25. There appears to be a denser population of thickly-coated rBC at distances greater than
roughly 60 m from the highway. Given that rBC mass concentrations can be considered a conservative tracer, Fig. 2a shows
systematic increases in f as emissions from motor vehicles become increasingly diluted away from the highway. Though rBC 10
number concentrations are theoretically not conserved due to possible coagulation of rBC-containing particles, Fig. 2b
nonetheless shows systematic increases in f as rBC number concentrations decrease.
3.1.2 rBC mass and number size distributions at different distances from the highway
Refractory black carbon mass and number size distributions were computed for three distances from the highway averaged
over the 4 sampling days (Fig. 3a and b). We report size distributions for rBC-containing particles with mass equivalent 15
diameters (MED) ranging from 70 to 450 nm, similar to previous studies (Gao et al., 2007; Moteki and Kondo, 2007;
Dahlkötter et al., 2014; Krasowsky et al., 2016). rBC mass and number concentration decreased at all core diameters
measured as distance from the highway increased. Concentrations at most sizes were substantially greater nearest the
highway (i.e. 30 m) relative to other distances. Diameter of rBC corresponding to peaks in the mass size distribution are
~180 nm MED for 30 m from the highway, higher than values for 61 and 114m of ~80 and 100 nm, respectively. 20
3.1.3 Quantifying coating thickness for rBC near the highway using LEO-fit
In this section we investigate coating thickness for rBC-containing particles near the highway. Median coating thickness
using the LEO method was determined for all measured distances from the highway over one of the sampling days (August
4). The histogram of coating thickness for each measured rBC-containing particle is shown in Fig. 4. The median coating
thickness was -1 nm or approximately 0 nm. While some particles with coating thickness up to ~240nm were measured, the 25
majority of values range from -40 to 40 nm. This implies that while there are some rBC particles with thick coatings, as can
also be observed from the reported values of f (Figure 1), the majority of particles have little to no coatings. We note that it is
common in past studies to have reported LEO histograms that include negative values up to about -40 nm (e.g. Metcalf et al.,
2012; Laborde et al., 2013) as in our study; these negative coating thicknesses are attributed to experimental uncertainty.
Atmos. Chem. Phys. Discuss., https://doi.org/10.5194/acp-2017-1020Manuscript under review for journal Atmos. Chem. Phys.Discussion started: 9 November 2017c© Author(s) 2017. CC BY 4.0 License.

13
3.2 Redlands campaign
3.2.1 Campaign overview
Figure 5 shows an overview from September 16 to October 10 of hourly average results for the Redlands measurement
campaign, including rBC mass concentration, f, ozone mixing ratio, and an estimate of photochemical age (PCA). The
overall rBC mass concentration (mean ± standard deviation) was 0.14 ± 0.097 µg m-3. rBC mass concentrations reach values 5
up to about 0.6 µg m-3, not including what appears to be an outlier on October 9 at 03:00, which could have been due to a
strong nearby source. Values of f vary by day and reach values up to about 0.2. Values of PCA show strong diurnal variation,
as expected, with daily peaks generally occurring in the early afternoon and ranging in value up to a maximum of about 7
hours. Diurnal cycles for PCA are similar in shape to those for O3, providing confidence that PCA derived from
measurements in Rubidoux, California, can be used to reasonably approximate the photochemical age of air in nearby 10
Redlands, California.
3.2.2 Diurnal cycles of rBC mass concentrations and number fraction of thickly-coated particles
Campaign average diurnal cycles of rBC mass concentrations and number fraction of thickly-coated particles are shown
separately for weekdays and weekends in Fig. 6a and b. On weekdays, the highest mass concentrations occur between
7:00−9:00 when commuter traffic peaks and the atmospheric mixing height is low. There is a secondary peak in the early 15
evening when commuter traffic increases and mixing heights start decreasing (relative to mid-day). rBC concentrations on
weekends show less hour-to-hour variation during daytime than weekdays, as expected, due to more consistent traffic flows.
rBC concentrations are higher at night than during the day due to low nocturnal mixing heights. Note that the peak at 03:00
for weekends stems from the previously discussed outlier on October 9. At the 95% confidence level there were not
statistically distinguishable differences between weekdays and weekends at most times of day. (Note that error bars are 20
larger for weekends than weekdays due to the reduced weekend days sampled.) However, rBC mass concentrations were
systematically higher for weekdays than weekends for all hours of the day besides the early morning hours. This is likely due
to higher diesel truck activity on weekdays versus weekends (Marr and Harley, 2002; Lough et al., 2006). The average
diurnal cycle for weekdays in this study shows less variability than our recent study (Krasowsky et al., 2016) reporting
measurements in Rubidoux during winter. This is likely because (a) Rubidoux is closer to downtown Los Angeles where a 25
large fraction of the emissions from the LA basin occur, and (b) atmospheric mixing heights during winter are generally
lower than during summer. (Future work could investigate whether weekday/weekend differences in rBC are diminishing
due to particulate matter regulations for trucks but this is beyond the scope of the current study.)
Campaign average diurnal cycles for f are shown in Fig. 6b. On weekdays, values of f are relatively consistent
throughout the day. However, values of f for weekends show a discernable peak at 14:00 when PCA and O3 (Fig. 7) values 30
are at (or near) their diurnal peak. f is systematically higher on weekends than weekdays, though differences are generally
not statistically significant. Previous studies have shown that coatings on rBC in urban plumes can be sensitive to differences
Atmos. Chem. Phys. Discuss., https://doi.org/10.5194/acp-2017-1020Manuscript under review for journal Atmos. Chem. Phys.Discussion started: 9 November 2017c© Author(s) 2017. CC BY 4.0 License.
14
in the vehicle fleet for weekdays versus weekends (Metcalf et al., 2012; Krasowsky et al., 2016). Traffic is overall lower on
weekends than weekdays, but relative decreases in diesel truck traffic are larger than for light-duty vehicles. Thus, reductions
in NOx are larger than those for non-methane volatile organic compounds (NMVOC), which due to nonlinearities in ozone
chemistry can lead to higher ozone concentrations on weekends relative to weekdays. During our campaign, the weekday
and weekend mean (± 95% confidence interval) O3 mixing ratio at 15:00 was 60.4 ± 13.6 ppb and 68.9 ± 16.5 ppb, 5
respectively (see Fig. 7). Since ozone can be used as a surrogate for secondary organic aerosol (SOA) (Turpin and
Huntzicker, 1991; Turpin et al., 1994; Bahreini et al., 2012; Pollack et al., 2012; Warneke et al., 2013; Heo et al., 2015), we
expect that SOA concentrations would also be higher on measured weekends than weekdays. Thus, weekends are expected
to have higher SOA and lower rBC concentrations relative to weekdays, leading to a higher fraction of rBC particles that are
thickly-coated, as shown in Fig. 6b. 10
3.2.3 Number fraction of thickly-coated particles versus photochemical age
Figure 8 shows the number fraction of rBC-containing particles that are thickly-coated versus photochemical age, using
hourly average values between the hours of 13:00−16:00. Boxes depict the 25th and 75th percentiles, whiskers depict the 10th
and 90th percentiles, and the horizontal lines within the boxes show the median. Only afternoon values were included to
highlight coatings that likely result from photochemistry. As the photochemical age of the measured air increases, so does 15
the fraction of particles that are thickly-coated. For PCA < 2 hours, the median, 25th, and 75th percentiles for f are about 0.04,
0.02, and 0.05, respectively. For PCA values ranging from 6 to 8 hours, corresponding values for f are about 0.06, 0.04, and
0.14. Krasowsky et al. (2016) performed a similar analysis comparing f versus PCA, but results were for wintertime
measurements in Rubidoux and included f for all hours of the day. The previous study also used a greater lag-time cutoff of 3
µs. Both studies show increases in f as PCA increases, though the previous study shows slightly higher median values for f at 20
the highest PCA bin even though the lag-time cutoff is higher. 90th percentiles of f for the highest PCA bin are quite similar
for both studies. Nonetheless, the two studies are not directly comparable given the (a) difference in lag-time cutoffs used to
define thickly-coated rBC particles, and (b) the difference in time of day analyzed. Including the entire daily cycle as in
Krasowsky et al. (2016) could confound results by including times when coatings develop via processes other than
photochemistry. We note that NOx and NOy data supplied by SCAQMD used to estimate PCA was hourly, and thus boxes 25
and whiskers summarize hourly values.
3.2.4 rBC mass concentration versus number fraction of thickly-coated particles
Figure 9 shows rBC mass concentration versus number fraction of rBC particles that are thickly-coated. Unlike Fig. 8, which
summarizes hourly averages, Fig. 9 shows one-minute values. This higher temporal resolution allows for observing short
periods with much higher values of f (i.e. > 0.6) relative to hourly averages. Median values of rBC mass concentrations are 30
found to decrease as f increases. For f ranging from 0 to 0.1, rBC mass concentrations are 0.21 µg m-3, while f > 0.6 is
associated with much lower rBC concentrations of 0.04 µg m-3. Overall, rBC mass concentration and f are anti-correlated ,
Atmos. Chem. Phys. Discuss., https://doi.org/10.5194/acp-2017-1020Manuscript under review for journal Atmos. Chem. Phys.Discussion started: 9 November 2017c© Author(s) 2017. CC BY 4.0 License.

15
with correlation coefficient r = -0.087. As sampled air becomes more aged, rBC concentrations in general are expected to
decrease primarily due to dilution, while f would be expected to increase. In addition, the weekend-effect discussed in the
previous section is represented in this figure; weekend values show lower rBC mass concentrations and higher f (Fig. 7).
3.2.5 rBC size distributions and mixing state analysis using LEO-fit for four days
We conducted more in-depth analysis of the physical properties and mixing state of rBC-containing particles for four 5
afternoons (15:00-16:00) for the Redlands campaign. Days were chosen to sample over a variety of meteorological
conditions (e.g. wind speed, wind direction, ambient temperature), as well as both weekdays and weekends. Thus, the days
were chosen to include atypical meteorology for the Los Angeles basin. For the four afternoons chosen, the National Oceanic
and Atmospheric Administration’s HYbrid Single-Particle Lagrangian Integrated Trajectory (HYSPLIT) model (Draxler and
Hess, 1998) was employed to assess 12-hour back trajectories starting at 15:00 on each day (Fig. 10). Properties quantified 10
include coating thickness distributions using LEO-fit and rBC number and mass particle size distributions.
The first afternoon examined was Sunday, September 18 (Fig. 11, top row). During 15:00-16:00 winds were
westerly at 2.7 m s-1, and the daily maximum temperature was very high (40.6°C). Back trajectories suggest that sampled air
included contributions from both nearby regions to the west of Redlands, and “low desert” regions to the east including the
city of Palm Desert. The median coating thickness was 14 nm, and a few relatively high coating thickness bins (e.g. centered 15
at 130 nm) show local peaks. rBC mass concentrations on this day were typical of campaign-average weekend values at this
time of day (see Fig. 6a). The rBC mass size distribution shows a peak at core size of about 135 nm MED, while the number
size distribution indicates that its peak was at particle sizes smaller than the lower limit of detection (70 nm).
We examined another Sunday, September 25 (Fig. 11, second row), with noticeably different atmospheric flow
patterns (Fig. 10). During 15:00-16:00, winds were from the south at 1.8 m s-1. Back trajectories indicate that sampled air 20
largely originated from the desert regions to the Northeast as far away as Las Vegas, NV. On this day, the median coating
thickness was 24 nm. Compared to Sunday, September 18, several coating thickness bins above 80 nm show higher
frequencies of occurrence. rBC mass concentration was very low (0.02 ± 0.01 µg m-3), below the campaign-average weekend
value shown in Fig. 6a. Particle size distributions indicate that all sizes of rBC were at lower concentrations relative to
September 18, though the rBC core size associated with the peak in mass size distribution was similar on both days. 25
Differences in computed back trajectories, relatively lower rBC mass concentrations, and relatively higher amounts of rBC
with thick coatings, all suggest that a higher fraction of measured rBC came from farther away sources and was increasingly
aged compared to September 18. Lower ambient temperatures on September 25 may have also played a role by favoring
partitioning of semi-volatile species to the particle phase, though we have no way of determining the relative contribution of
this effect. 30
The remaining two days under investigation were weekdays. Wednesday September 28 (Fig. 11, third row) had
slower and more irregular winds and cooler temperatures relative to the Sundays already discussed. Back trajectories
indicate that sampled air originated from relatively close to Redlands compared to the other days (Fig. 10), which is
Atmos. Chem. Phys. Discuss., https://doi.org/10.5194/acp-2017-1020Manuscript under review for journal Atmos. Chem. Phys.Discussion started: 9 November 2017c© Author(s) 2017. CC BY 4.0 License.
16
consistent with the observed low wind speeds. The median coating thickness was 8 nm, lower than the Sundays already
discussed. The rBC mass concentration was 0.04 ± 0.01 µg m-3, higher than Sunday, September 25 but lower than Sunday,
September 18. Number size distributions for this day are quite similar to those for September 18; however, mass size
distributions on September 28 show lower concentrations at most sizes relative to September 18, and the size of rBC
associated with the peak mass concentration is shifted toward smaller mass equivalent diameter (i.e. 94 nm). Given the 5
differences in back trajectories, coating thickness histograms, size distributions, and the fact that this was a weekday with
higher black carbon emission rates in the LA basin than for weekends, we conclude these measurements were dominated by
rBC that was emitted by nearby sources and did not have sufficient time to acquire thick coatings.
The last day of interest was Friday, October 7 (Fig. 11, bottom row), with winds from the northwest at 1.3 m s-1
from 15:00-16:00 and the same daily maximum temperature as the other weekday under investigation here. Back trajectories 10
indicate that sampled air largely came from the “high desert” region of southern California including the Barstow area (Fig.
10). Interestingly, of the four days discussed in this section, rBC sampled on this afternoon had the smallest median coating
thickness (3 nm), and the least discernable peaks for coating thickness > 80 nm. rBC mass concentrations were higher than
other days investigated in this section, presumably due to both higher weekday emissions in the LA basin and distinct
atmospheric flow patterns for this day. We cannot isolate individual factors that contributed to the low coating thicknesses 15
measured on this afternoon. However, we suggest that important contributors include the fact that (a) this was a weekday,
and (b) back trajectories indicate that sampled air came from regions with low source emissions rates, suggesting that
measured rBC was dominated by relatively fresh emissions from nearby sources.
3.3 Comparison of near-road and Redlands campaigns
We have evaluated the physical properties of rBC at (a) different distances from a major highway on the west side of Los 20
Angeles, and (b) the east side of the Los Angeles basin where secondary pollutant (e.g. ozone) concentrations are among the
highest observed in the basin (Hersey et al., 2011).
rBC mass concentrations at 30 m from the highway were about a factor of 3.0 higher than those measured 114 m
from the highway. rBC mass concentrations 114 m from the highway were quite similar to campaign average values for
midday on weekdays in Redlands. 25
Particle number size distributions for rBC indicate that the smallest measured sizes (~70-100 nm mass equivalent
diameter), which dominate total rBC number concentrations, decreased by a factor of about 2.7 from 30 m to 114 m from the
highway. Interestingly, rBC number concentrations for the smallest measured diameters showed values that were about an
order of magnitude higher at 114 m from the highway relative to those measured in Redlands (i.e. compare Fig. 3a to 11).
Thus, rBC number concentrations were significantly higher at all near-highway distances measured relative to Redlands, 30
while rBC mass concentrations were quite similar at Redlands versus 114 m from the highway at the near-road site.
Assessing the number fraction of rBC that was thickly-coated indicates that while f increased as the measurement
location moved from 30 m to 114 m from the highway, values observed 114 m from the highway were roughly similar to the
Atmos. Chem. Phys. Discuss., https://doi.org/10.5194/acp-2017-1020Manuscript under review for journal Atmos. Chem. Phys.Discussion started: 9 November 2017c© Author(s) 2017. CC BY 4.0 License.
17
median for Redlands at PCA values of 6 to 8 hours (Fig. 1 vs 8). This suggests that the residence time of air in the Los
Angeles basin under typical conditions measured during this campaign may not be long enough for rBC to acquire thick
coatings. On the other hand, as indicated by the boxes and whiskers in Fig. 8, there were hourly time periods during the
sampling campaign where f reached nearly 0.20 in Redlands, and shorter time periods where f reached values greater than
0.6 (Fig. 9). 5
Assessing coating thickness histograms suggests that most measured rBC was uncoated or thinly-coated near the
highway. Measurements in Redlands showed relatively more rBC with coating thickness > 80 nm under certain atmospheric
conditions. This occurred especially when atmospheric flows favored rBC being transported from the east on weekends,
causing rBC emissions from nearby traffic sources to be lower and the relative contribution of more remote sources to be
higher. (Fig. 11 shows coating thickness histograms for both Redlands and near-road sites.) 10
4 Summary and Conclusions
Improving understanding in spatiotemporal distributions of refractory black carbon, as well as evolution of rBC physical
properties and mixing state at both (a) rapid timescales near sources (e.g. road-to-ambient processing), and (b) longer
timescales as pollutants are transported on urban, continental, and global scales, is critical for reducing uncertainty on the
impacts of aerosols on human health and regional and global climate. This study carries out measurements of ambient 15
particles containing refractory black carbon in two distinct locations during the hottest months in southern California to
systematically evaluate differences in rBC physical properties and mixing state near a highway and downwind of urban Los
Angeles. The results reported here attempt to highlight the influence of road-to-ambient processing, varying meteorological
regimes, and changing vehicle fleets, on the physical properties and mixing state of rBC. Two techniques for quantifying
coatings on rBC particles (i.e. the lag-time and LEO method) were employed using measurements made with a single-20
particle soot photometer (SP2). Sampling for the first location was completed near Interstate 405 at the Los Angeles
National Cemetery between 12:00−14:00 local time on August 4, August 5, September 12, and September 14, 2016.
Measurements were made in ~8 m increments from 30 to 114 m downwind of the highway using a mobile platform. As
distance from the highway increased, rBC mass concentrations decreased. A previous study (Zhu et al., 2002) that measured
BC with an aethalometer in 2001 at the same site reported similar trends with respect to distance from the freeway, though 25
concentrations reported here are about an order of magnitude lower than the values reported in the previous study. This
highlights the efficacy of stringent policies for reducing black carbon emissions in California though differences in
measurement technique between the two studies could have also contributed. rBC number concentrations decreased, while
the number fraction of thickly-coated rBC particles (f) showed an overall increase, as distance from the highway increased
from 30 to 114 m. rBC mass concentrations were overall anti-correlated with f at this measurement site, suggesting that the 30
fraction of thickly-coated rBC-containing particles increased as the plume from the highway diluted. On August 4, 2016, the
LEO method was used to quantify coating thickness histograms; the median coating thickness for rBC-containing particles at
Atmos. Chem. Phys. Discuss., https://doi.org/10.5194/acp-2017-1020Manuscript under review for journal Atmos. Chem. Phys.Discussion started: 9 November 2017c© Author(s) 2017. CC BY 4.0 License.

18
all distances measured was about 0 nm. While f indicated that a small fraction of rBC-containing particles (i.e. 5%) acquired
coatings as downwind distances approached ~100 m away from the highway, most particles were essentially uncoated or
thinly-coated.
Sampling for the second location was completed in Redlands, California, approximately 100 km east of downtown
Los Angeles, from September 16−October 10, 2016. The overall rBC mass concentration (± standard deviation) was 0.14 ± 5
0.097 µg m-3. Campaign-average diurnal cycles of rBC mass concentration and f were analysed separately for weekdays and
weekends. During daytime, hourly values of rBC mass concentrations were larger on weekdays than weekends, though
differences were not statistically distinguishable at the 95% confidence level. There was less hour-to-hour variation in rBC
mass concentrations on weekends relative to weekdays presumably due to more consistent traffic flows throughout the day.
Values of f were systematically higher on weekends than weekdays, with the peak value occurring at 14:00h when 10
photochemistry is prevalent. We suggest that the higher weekend values in f are analogous to the ozone “weekend effect”,
but in this case apply to higher secondary organic aerosol loadings that condense onto reduced available rBC, leading to
more thickly-coated refractory black carbon particles. Previous research by Metcalf et al. (2012) and Krasowsky et al. (2016)
corroborate this theory. We also investigated f as a function of photochemical age (PCA) for the hours of 13:00−16:00 and
found that f increased as PCA increased. Similar to the near-road site, f was anti-correlated with rBC mass concentrations. 15
An examination on how various meteorological regimes impact the physical properties and mixing state of rBC-
containing particles in Redlands was completed for four afternoons (two weekdays and two weekend days at 15:00-16:00)
using 12-hour back trajectories computed with the HYSPLIT model. We found that the afternoon with the most prevalent
mode of thickly-coated rBC corresponded to a Sunday with back trajectories indicating that measurements were dominated
by air originating from the desert regions to the northeast of the Los Angeles basin. Relatively lower weekend emissions 20
from diesel truck traffic in the Los Angeles basin and transport of air from the northeast suggests that measured rBC
contained a larger contribution of aged particles emitted from remote locations than the other days under investigation.
Comparing rBC at the near-road site versus Redlands shows remarkable similarity in some properties and
divergence in others. At the furthest measured downwind distance (114 m) from Interstate 405, rBC mass concentrations
were similar to campaign average values for midday on weekdays in Redlands, California. On the other hand, the rBC 25
number concentrations near the highway for the smallest size range measured (70 – 100 nm MED) was about an order of
magnitude higher than for Redlands. While values of f increased as distance from the highway increased, the observed values
of f at 114 m from the roadway were about the same as median f values measured in Redlands when photochemistry was
most prevalent. This suggests that the residence time of air in the Los Angeles basin under typical conditions measured
during this campaign may not be sufficient for rBC to acquire thick coatings. However, under certain meteorological 30
conditions, f was observed to be ~0.20, with coating thickness histograms showing a larger contribution of rBC particles with
coating thickness > 80 nm. This occurred during a weekend day when local emissions from diesel vehicles were lower
(compared to weekdays) and winds brought air from the desert regions to the Northeast of Los Angeles, both of which
increase the relative contribution of remote sources of rBC.
Atmos. Chem. Phys. Discuss., https://doi.org/10.5194/acp-2017-1020Manuscript under review for journal Atmos. Chem. Phys.Discussion started: 9 November 2017c© Author(s) 2017. CC BY 4.0 License.

19
5 Data Availability
Processed data used to make figures may be available from the corresponding author. Due to the extremely large file sizes
for the particle-by-particle data acquired by the SP2, raw data are not publically available.
6 Author Contributions
Authors TK and GBW designed the study. TK performed the field measurements. TK and GBW carried out the data 5
analysis. TK and GBW wrote the paper. CS and GM provided technical guidance on field measurements and data analysis,
and edited the paper.
7 Acknowledgements
We thank Eyuphan Koc for his technical expertise and Cole Meyers, Theresa Berkovich, and Anders Hasselquist for their
help with field measurements. 10
References
Anselm, A., Heibel, T., Gebhart, J., and Ferron, G.: “In vivo” studies of growth factors of sodium chloride particles in the human respiratory tract, J. Aerosol Sci., 21, 427-430, 1990.
Bahreini, R., Middlebrook, A. M., Gouw, J. D., Warneke, C., Trainer, M., Brock, C. A., Stark, H., Brown, S. S., Dube, W. P., Gilman, J. B., and Hall, K.: Gasoline emissions dominate over diesel in formation of secondary organic aerosol 15 mass, Geophys. Res. Lett., 39, no. 6, 2012.
Ban-Weiss, G. A., Cao, L., Bala, G., and Caldeira, K.: Dependence of climate forcing and response on the altitude of black carbon aerosols, Clim. Dynam., 38, 897-911, doi: 10.1007/s00382-011-1052-y, 2012.
Bond, T. C., Doherty, S. J., Fahey, D. W., Forster, P. M., Berntsen, T., DeAngelo, B. J., Flanner, M. G., Ghan, S., Kärcher, B., Koch, D., Kinne, S., Kondo, Y., Quinn, P. K., Sarofim, M. C., Schultz, M. G., Schulz, M., Venkataraman, C., 20 Zhang, H., Zhang, S., Bellouin, N., Guttikunda, S. K., Hopke, P. K., Jacobson, M. Z., Kaiser, J. W., Klimont, Z., Lohmann, U., Schwarz, J. P., Shindell, D., Storelvmo, T., Warrent, S. G., and Zender, C. S.: Bounding the role of black carbon in the climate system: A scientific assessment, J. Geophys. Res., 118, 5380-5552, 2013.
Cappa, C. D., Onasch, T. B., Massoli, P., Worsnop, D., Bates, T. S., Cross, E., Davidovits, P., Hakala, J., Hayden, K., Jobson, B. T., Kolesar, K. R., Lack, D. A., Lerner, B., Li, S. M., Mellon, D., Nuaanman, I., Olfert, J., Petaja, T., 25 Quinn, P. K., Song, C., Subramanian, R., Williams, E. J., and Zaveri, R. A.: Radiative Absorption Enhancements Due to the Mixing State of Atmospheric Black Carbon, Science, 337, 1078-1081, 2012.
Chen, X., Wang, Z., Yu, F., Pan, X., Li, J., Ge, B., Wang, Z., Hu, M., Yang, W., and Chen, H.: Estimation of atmospheric aging time of black carbon particles in the polluted atmosphere over central-eastern China using microphysical process analysis in regional chemical transport model, Atmos. Environ., 163, 44-56, 2017. 30
Atmos. Chem. Phys. Discuss., https://doi.org/10.5194/acp-2017-1020Manuscript under review for journal Atmos. Chem. Phys.Discussion started: 9 November 2017c© Author(s) 2017. CC BY 4.0 License.
20
Cooke, W. F., and Wilson, J. J.: A global black carbon aerosol model, J. Geophys. Res. Atmos., 101(D14), 19395-19409, 1996.
Dahlkötter, F., Gysel, M., Sauer, D., Minikin, A., Baumann, R., Seifert, P., Ansmann, A., Fromm, M., Voigt, C., and Weinzierl, B.: The Pagami Creek smoke plume after long-range transport to the upper troposphere over Europe–aerosol properties and black carbon mixing state, Atmos. Chem. Phys., 14, 6111-6137, 2014. 5
De Nazelle, A., Fruin, S., Westerdahl, D., Martinez, D., Ripoll, A., Kubesch, N., Nieuwenhuijsen, M.: A travel mode
comparison of commuters’ exposures to air pollutants in Barcelona, Atmos. Environ., 59, 151-159, 2012. Draxler, R. R. and Hess, G. D.: An overview of the HYSPLIT_4 modeling system for trajectories, dispersion and deposition, 10
Austr. Met. Mag., 47, 295-308, 1998. Ferron, G. A., Haider, B., and Kreyling, W. G.: Inhalation of salt aerosol particles-I. Estimation of the temperature and
relative humidity of the air in the human upper airways, J. Aerosol. Sci., 19, 343-363, 1988. 15 Fuller, K. A., Malm, W. C., and Kreidenweis, S. M.: Effects of mixing on extinction by carbonaceous particles, J. Geophys.
Res., 104(D13), 15941-15954, 1999. Gao, R. S., Schwarz , J. P., Kelly, K. K., Fahey, D. W., Watts, L. A., Thompson, T. L., Spackman, J. R., Slowik, J. G., Cross,
E. S., Han, J. H., Davidovits, P., Onasch, T. B., and Worsnop, D. R.: A novel method for estimating light-scattering 20 properties of soot aerosols using a modified single-particle soot photometer, Aerosol Sci. Tech., 41, 125-135, 2007.
Hart, J. E., Laden, F., Eisen, E. A., Smith, T. J., and Garshick, E.: Chronic obstructive pulmonary disease mortality in
railroad workers, Occup. Environ. Med., 66, 221-226, 2009.
Hasheminassab, S., Ramanathan, N., Ostro, B., and Sioutas, C.: Long-term source apportionment of ambient fine particulate 25 matter (PM 2.5) in the Los Angeles Basin: A focus on emissions reduction from vehicular sources, Environ. Pollut., 193, 54-64, 2014.
Hansen, J., Sato, M., and Ruedy, R.: Radiative forcing and climate response, J. Geophys. Res., 102, 6831-6864, doi:10.1029/96JD03436, 1997.
Hansen, J., Sato, M. K. I., Ruedy, R., Nazarenko, L., Lacis, A., Schmidt, G. A., Russell, G., Aleinov, I., Bauer, M., Bauer, 30 S., and Bell, N.: Efficacy of climate forcings, J. Geophys. Res., 110(D18104), doi:10.1029/2005JD005776, 2005.
Healy, R. M., Wang, J. M., Jeong, C. H., Lee, A. K., Willis, M. D., Jaroudi, E., Zimmerman, N., Hilker, N., Murphy, M.,
Eckhardt, S., and Stohl, A.: Light-absorbing properties of ambient black carbon and brown carbon from fossil fuel and biomass burning sources, J. Geophys. Res. Atmos., 120, 6619–6633, doi:10.1002/2015jD023382, 2015. 35
Heo, J., de Foy, B., Olson, M. R., Pakbin, P., Sioutas, C., and Schauer, J. J.: Impact of regional transport on the
anthropogenic and biogenic secondary organic aerosols in the Los Angeles Basin, Atmos. Environ., 103, 171–179, doi:10.1016/j.atmosenv.2014.12.041, 2015.
40 Hersey, S. P., Craven, J. S., Schilling, K. A., Metcalf, A. R., Sorooshian A., Chan, M. N., Flagan, R. C., and Seinfeld, J. H.:
The Pasadena Aerosol Characterization Observatory (PACO): chemical and physical analysis of the Western Los Angeles basin aerosol, Atmos. Chem. Phys., 11, 7417-7443, 2011.
Atmos. Chem. Phys. Discuss., https://doi.org/10.5194/acp-2017-1020Manuscript under review for journal Atmos. Chem. Phys.Discussion started: 9 November 2017c© Author(s) 2017. CC BY 4.0 License.
21
Intergovernmental Panel on Climate Change: the physical science basis, Contribution of Working Group 1 to the fourth assessment report of the Intergovernmental Panel on Climate Change, In: Solomon S, Qin D, Manning M, Chen Z, Marquis M, Averyt KB, Tignor M, Miller HL, Cambridge University Press, New York, 2007.
Jacobson, M. Z.: Strong radiative heating due to the mixing state of black carbon in atmospheric aerosols, Nature, 409, 695-5
697, 2001.
Kirchstetter, T. W., and Novakov, T.: Controlled generation of black carbon particles from a diffusion flame and applications in evaluating black carbon measurement methods, Atmos. Env., 41, 1874–1888, 2007.
Krasowsky, T. S., Daher, N., Sioutas, C., and Ban-Weiss, G. A.: Measurement of emission factors from in-use locomotives, Atmos. Env., 113, 187-196, doi:10.1016/j.atmosenv.2015.04.046, 2014. 10
Krasowsky, T. S., Wang, D., McMeeking, G., Sioutas, C., and Ban-Weiss, G. A.: Real-world measurements of the impact of atmospheric aging on physical and optical properties of ambient black carbon particles, Atmos. Env., 142, 496-504, doi:10.1016/j.atmosenv.2016.08.010, 2016.
Lack, D. A., Cappa, C. D., Cross, E. S., Massoli, P., Ahern, A. T., Davidovits, P., and Onasch, T. B.: Absorption Enhancement of coated absorbing aersols: Validation of the photo-acoustic technique for measuring the 15 enhancement, Aersol Sci. Tech., 43, 1006-1012, doi:10.1080/02786820903117932, 2009.
Laborde, M., Mertes, P., Zieger, P., Dommen, J., Baltensperger, U., and Gysel, M.: Sensitivity of the Single Particle Soot
Photometer to different black carbon types, Atmos. Meas. Tech., 5, 1031-1043, 2012. 20 Laborde, M., Crippa, M., Tritscher, T., Jurányi, Z., Decarlo, P. F., Temime-Roussel, B., Marchand, N., Eckhardt, S., Stohl,
A., Baltensperger, U., and Prévôt, A. S. H.: Black carbon physical properties and mixing state in the European megacity Paris, Atmos. Chem. Phys., 13, 5831-5856, 2013.
Lee, A. K. Y., Chen, C., Liu, J., Price, D. J., Betha, R., Russell, L. M., Zhang, X., and Cappa, C. D.: Formation of secondary 25
organic aerosol coating on black carbon particles near vehicular emissions, Atmos. Chem. Phys., Accepted for discussion July 2017.
Liu, D., Allan, J.D., Young, D.E., Coe, H., Beddows, D., Fleming, Z.L., Flynn, M.J., Gallagher, M. W., Harrison, R. M.,
Lee, J., Prevot, A. S. H., Taylor, J. W., Yin, J., Williams, P.I., and Zotter, P.: Size distribution, mixing state, and 30 source apportionment of black carbon aerosol in London during wintertime, Atmos. Chem. Phys., 14, 10061-10084, doi:10.5194/acp-14-10061-2014, 2014.
Lloyd, A. C. and Cackette, T.A.: Diesel engines: environmental impact and control, J. Air and Waste Manage. Assoc., 51,
809–847, 2001. 35
Lough, G. C., Schauer, J. J., and Lawson, D. R.: Day-of-week trends in carbonaceous aerosol composition in the urban atmosphere, Atmos. Environ., 40, 4137-4149, 2006.
Marr, L.C. and Harley, R.A.: Modeling the effect of weekday-weekend differences in motor vehicle emissions on
photochemical air pollution in central California, Environ. Sci. Technol., 36, 4099-4106, 2002. 40 Massoli, P., Fortner, E. C., Canagaratna, M. R., Williams, L. R., Zhang, Q. Sun, Y., Schwab, J. J., Trimborn, A., Onasch, T.
B., Demerjian, K. L., Kolb, C. E., Worsnop, D. R., and Jayne, J. T.: Pollution gradients and chemical characterization of particulate matter from vehicular traffic near major roadways: results from the 2009 Queens College Air Quality Study in NYC, Aerosol Sci. Tech., 46, 1201-1218, 2012. 45
Atmos. Chem. Phys. Discuss., https://doi.org/10.5194/acp-2017-1020Manuscript under review for journal Atmos. Chem. Phys.Discussion started: 9 November 2017c© Author(s) 2017. CC BY 4.0 License.

22
McMeeking, G.R. Morgan, W.T. Flynn, M. Highwood, E.J. Turnbull, K. Haywood, J. and Coe, H.: Black carbon aerosol
mixing state, organic aerosols and aerosol optical properties over the United Kingdom, Atmos. Chem. Phys., 11(17), 9037-9052, 2011.
5 Metcalf, A. R., Craven, J. S., Ensberg, J. J., Brioude, J., Angevine, W., Sorooshian, A., Duong, H. T., Jonsson, H. H.,
Flagan, R. C. and Seinfeld, J. H.: Black carbon aerosol over the Los Angeles Basin during CalNex, J. of Geophys. Res. Atmos., 117(D21), 2012.
Moteki, N. and Kondo, Y.: Effects of mixing state on black carbon measurements by laser-induced incandescence, Aerosol 10
Sci. Tech., 41, 398-417, 2007.
Pollack, I. B., Ryerson, T. B., Trainer, M., Parrish, D. D., Andrews, A. E., Atlas, E. L., Blake, D. R., Brown, S. S., Commane, R., Daube, B. C., and Gouw, J. A.: Airborne and ground-based observations of a weekend effect in ozone, precursors, and oxidation products in the California South Coast Air Basin, J. Geophys. Res. Atmos., 117, D00V05, doi:10.1029/2011JD016772, 2012. 15
Riemer, N., Vogel, H., and Vogel, B.: Soot aging time scales in polluted regions during day and night, Atmos. Chem. Phys.,
4.7, 1885-1893, 2004 Riemer, N., West, M., Zaveri, R., and Easter, R.: Estimating black carbon aging time-scales with a particle-resolved aerosol 20
model, J. Aerosol Sci., 41, 143-158, 2010. Sardar, S., Fine, P., and Sioutas, C.: Seasonal and spatial variability of the size-resolved chemical composition of particulate
matter (PM10) in the Los Angeles Basin, J. Geophys. Res. Atmos., 110, D07S08, doi:10.1029/2004JD004627, 2005.
Sedlacek, A. J., Lewis, E. R., Kleinman, L., Xu, J., and Zhang, Q.: Determination of and evidence for non-core-shell 25 structure of particles containing black carbon using the Single-Particle Soot Photometer (SP2), Geophys. Res. Lett., 39, L06802, doi:10.1029/2012GL050905, 2012.
Schwarz, J. P., Gao, R. S., Spackman, J. R., Watts, L. A., Thomson, D. S., Fahey, D. W., Ryerson, T. B., Peischl, J.,
Holloway, J. S., Trainer, M., and Frost, G. J.: Measurement of the mixing state, mass, and optical size of individual 30 black carbon particles in urban and biomass burning emissions, Geophys. Res. Lett., 35(13), 2008a.
Schwarz, J. P., Spackman, J. R., Fahey, D. W., Gao, R. S., Lohmann, U., Stier, P., Watts, L. A., Thomson, D. S., Lack, D.
A., Pfister, L., and Mahoney, M. J.: Coatings and their enhancement of black carbon light absorption in the tropical atmosphere, J. Geophys. Res. Atmos., 113(D3), 2008b. 35
Schwarz, J. P., Perring, A. E., Markovic, M. Z., Gao, R. S., Ohata, S., Langridge, J., Law, D., McLaughlin, R. and Fahey, D.
W.: Technique and theoretical approach for quantifying the hygroscopicity of black-carbon-containing aerosol using a single particle soot photometer, J. Aerosol Sci., 81, 110-126, 2014.
40 Shiraiwa, M., Kondo, Y., Moteki, N., Takegawa, N., Sahu, L. K., Takami, A., Hatakeyama, S., Yonemura, S., and Blake, D.
R.: Radiative impact of mixing state of black carbon aerosol in Asian outflow, J. Geophys. Res. Atmos., 113(D24), 2008.
Subramanian, R., Kok, G. L., Baumgardner, D., Clarke, A., Shinozuka, Y., Campos, T. L., Heizer, C. G., Stephens, B. B., De 45
Foy, B., Voss, P. B., and Zaveri, R. A.: Black carbon over Mexico: the effect of atmospheric transport on mixing state, mass absorption cross-section, and BC/CO ratios, Atmos. Chem. Phys., 10, 219-237, 2010.
Atmos. Chem. Phys. Discuss., https://doi.org/10.5194/acp-2017-1020Manuscript under review for journal Atmos. Chem. Phys.Discussion started: 9 November 2017c© Author(s) 2017. CC BY 4.0 License.

23
Taylor, J. W., Allan, J. D., Allen, G., Coe, H., Williams, P. I., Flynn, M. J., Le Breton, M., Muller, J. B. A., Percival, C. J., Oram, D., and Forster, G.: Size-dependent wet removal of black carbon in Canadian biomass burning plumes, Atmos. Chem. Phys., 14, 13755-13771, 2014.
Turpin, B. J. and Huntzicker, J. J.: Secondary formation of organic aerosol in the Los Angeles basin: A descriptive analysis 5
of organic and elemental carbon concentrations, Atmos. Environ., 25, 207–215, doi:10.1016/0960-1686(91)90291-E, 1991.
Turpin, B., Huntzicker, J., and Hering, S.: Investigation of organic aerosol sampling artifacts in the Los Angeles Basin,
Atmos. Environ., 28, 3061-3071, 1994. 10 Wang, Q., Huang, R. J., Cao, J., Han, Y., Wang, G., Li, G., Wang, Y., Dai, W., Zhang, R., and Zhou, Y.: Mixing State of
Black Carbon Aerosol in a Heavily Polluted Urban Area of China: Implications for Light Absorption Enhancement, Aerosol Sci. Tech., 48, 689–697, doi: 10.1080/02786826.2014.917758, 2014.
15 Warneke, C., Gouw, J. A., Edwards, P. M., Holloway, J. S., Gilman, J. B., Kuster, W. C., Graus, M., Atlas, E., Black, D.,
Gentner, D. R., and Goldstein, A. H.: Photochemical aging of volatile organic compounds in the Los Angeles basin: Weekday-weekend effect, J. Geophys. Res. Atmos., 118, 5018-5028, doi:10.1002/jgrd.50423, 2013.
Weather Underground Redlands: Weather History for Redlands, CA, Available at http://www.wunderground.com/history, 20
accessed October 2016a.
Weather Underground Santa Monica: Weather History for Santa Monica, CA, 2016. Available at http://www.wunderground.com/history, accessed October 2016b.
Weingartner, E., Burtscher, H., and Baltensperger, U.: Hygroscopic properties of carbon and diesel soot particles, Atmos. Env., 31, 2311-2327, 1997. 25
Willis, M. D., Healy, R. M., Riemer, N., West, M., Wang, J. M., Jeong, C.-H., Wenger, J. C., Evans, G. J., Abbatt, J. P. D., and Lee, A. K. Y.: Quantification of black carbon mixing state from traffic: implications for aerosol optical properties, Atmos. Chem. Phys., 16, 4693-4706, doi.org/10.5194/acp-16-4693-2016, 2016.
World Health Organization (WHO).: Health effects of black carbon. ISBN: 9789289002653, Available at 30
http://www.euro.who.Int/__data/assets/pdf_file/0004/162535/e96541.pdf, 2012.
Zhang, K. M., Wexler, A. S., Zhu, Y. F., Hinds, W. C., and Sioutas, C.: Evolution of particle number distribution near roadways. Part II: the ‘Road-to-Ambient’ process, Atmos. Env., 38, 6655-6665, 2004.
Zhang, J., Liu, J., Tao, S., and Ban-Weiss, G. A.: Long-range transport of black carbon to the Pacific Ocean and its dependence on aging timescale, Atmos. Chem. Phys., 15, 11521-11535, doi:10.5194/acp-15-11521-2015, 2015. 35
Zhu, Y., Hinds, W. C., Kim, S., and Sioutas, C.: Concentration and size distribution of ultrafine particles near a major
highway, J. Air and Waste Manage. Assoc., 52, 1032-1042, 2002.
40
Atmos. Chem. Phys. Discuss., https://doi.org/10.5194/acp-2017-1020Manuscript under review for journal Atmos. Chem. Phys.Discussion started: 9 November 2017c© Author(s) 2017. CC BY 4.0 License.

24
Table 1. Mean rBC mass concentration for the Redlands measurement campaign, and mean rBC (and black carbon) mass concentrations corresponding to three measured distances downwind of Interstate 405 in the Los Angeles National Cemetery in 2016 (from the current study) and 2001 (from Zhu et al. (2002)).
§ Study
§ Location
§ Time period
§ BC Mass Concentration
(µg m-3)
§ This
Study a
§ Redlands Campaign § September 16-
October 10, 2016
§ 0.14 ± 0.10 d
§ 30 m downwind of
Interstate 405 c
§ August 4, 2016
§ August 5, 2016
§ September 12,
2016
§ September 14,
2016
§ 0.67
§ 61 m downwind of
Interstate 405 c
§ August 4, 2016
§ August 5, 2016
§ September 12,
2016
§ September 14,
2016
§ 0.31
§ 91 m downwind of
Interstate 405 c
§ August 4, 2016
§ August 5, 2016
§ September 12,
2016
§ September 14,
2016
§ 0.28
Atmos. Chem. Phys. Discuss., https://doi.org/10.5194/acp-2017-1020Manuscript under review for journal Atmos. Chem. Phys.Discussion started: 9 November 2017c© Author(s) 2017. CC BY 4.0 License.
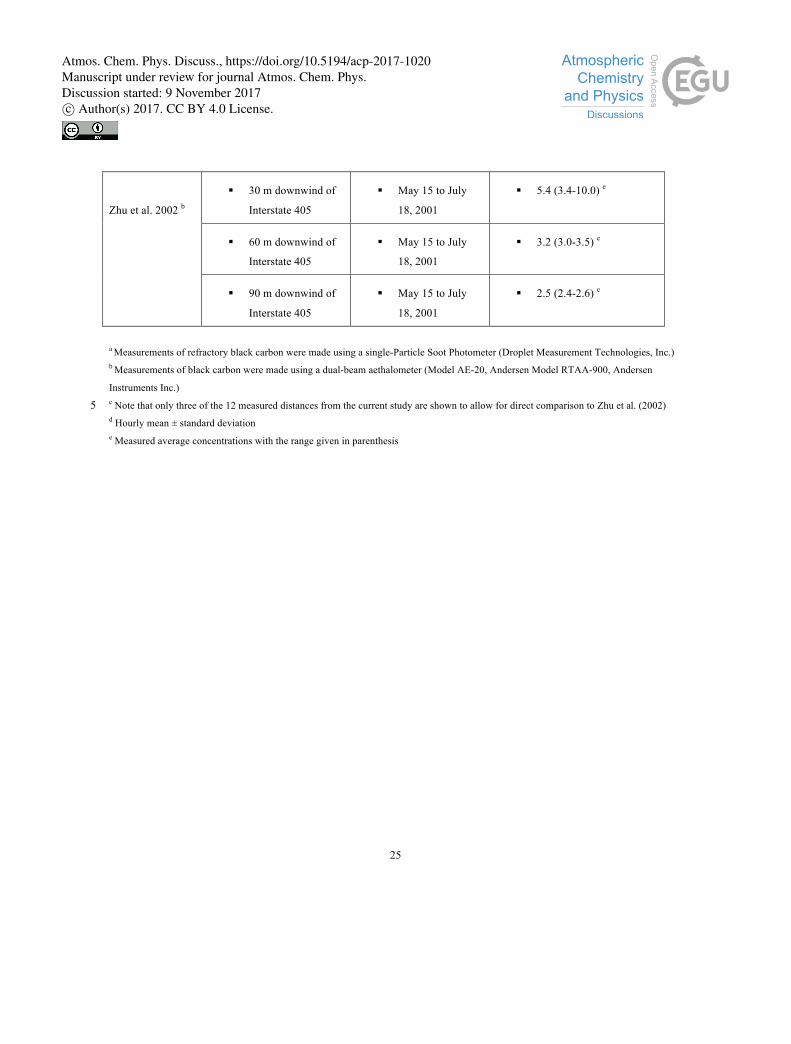
25
Zhu et al. 2002 b
§ 30 m downwind of
Interstate 405
§ May 15 to July
18, 2001
§ 5.4 (3.4-10.0) e
§ 60 m downwind of
Interstate 405
§ May 15 to July
18, 2001
§ 3.2 (3.0-3.5) e
§ 90 m downwind of
Interstate 405
§ May 15 to July
18, 2001
§ 2.5 (2.4-2.6) e
a Measurements of refractory black carbon were made using a single-Particle Soot Photometer (Droplet Measurement Technologies, Inc.) b Measurements of black carbon were made using a dual-beam aethalometer (Model AE-20, Andersen Model RTAA-900, Andersen
Instruments Inc.) c Note that only three of the 12 measured distances from the current study are shown to allow for direct comparison to Zhu et al. (2002) 5 d Hourly mean ± standard deviation e Measured average concentrations with the range given in parenthesis
Atmos. Chem. Phys. Discuss., https://doi.org/10.5194/acp-2017-1020Manuscript under review for journal Atmos. Chem. Phys.Discussion started: 9 November 2017c© Author(s) 2017. CC BY 4.0 License.

26
Figure 1: Black carbon mass concentration (µg m-3), black carbon number concentration (cm-3), and fraction of black carbon that is thickly-coated (f) versus downwind distance from Interstate 405 in Los Angeles, California.
1.00
0.75
0.50
0.25
0.00
375350325300275250225200175150125100
550500450400350300250200150
0.0600.0550.0500.0450.0400.0350.0300.0250.020
11010090807060504030
Atmos. Chem. Phys. Discuss., https://doi.org/10.5194/acp-2017-1020Manuscript under review for journal Atmos. Chem. Phys.Discussion started: 9 November 2017c© Author(s) 2017. CC BY 4.0 License.
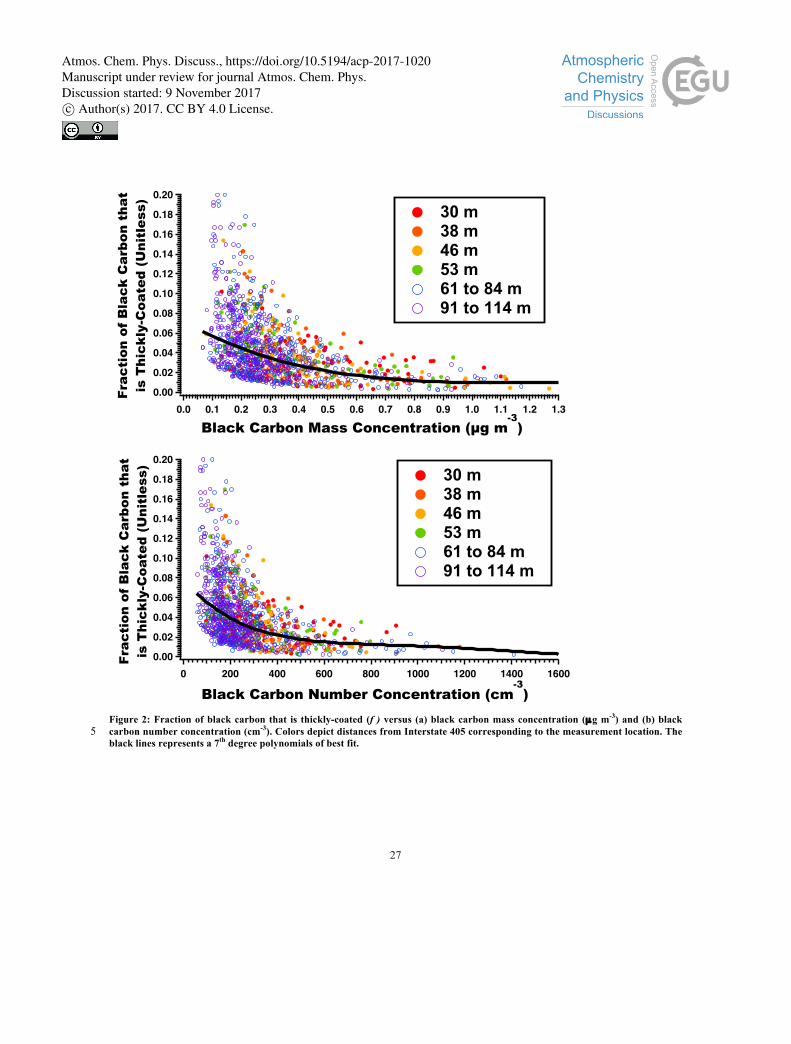
27
Figure 2: Fraction of black carbon that is thickly-coated (f ) versus (a) black carbon mass concentration (µg m-3) and (b) black carbon number concentration (cm-3). Colors depict distances from Interstate 405 corresponding to the measurement location. The 5 black lines represents a 7th degree polynomials of best fit.
0.20
0.18
0.16
0.14
0.12
0.10
0.08
0.06
0.04
0.02
0.001.31.21.11.00.90.80.70.60.50.40.30.20.10.0
0.20
0.18
0.16
0.14
0.12
0.10
0.08
0.06
0.04
0.02
0.0016001400120010008006004002000
Atmos. Chem. Phys. Discuss., https://doi.org/10.5194/acp-2017-1020Manuscript under review for journal Atmos. Chem. Phys.Discussion started: 9 November 2017c© Author(s) 2017. CC BY 4.0 License.
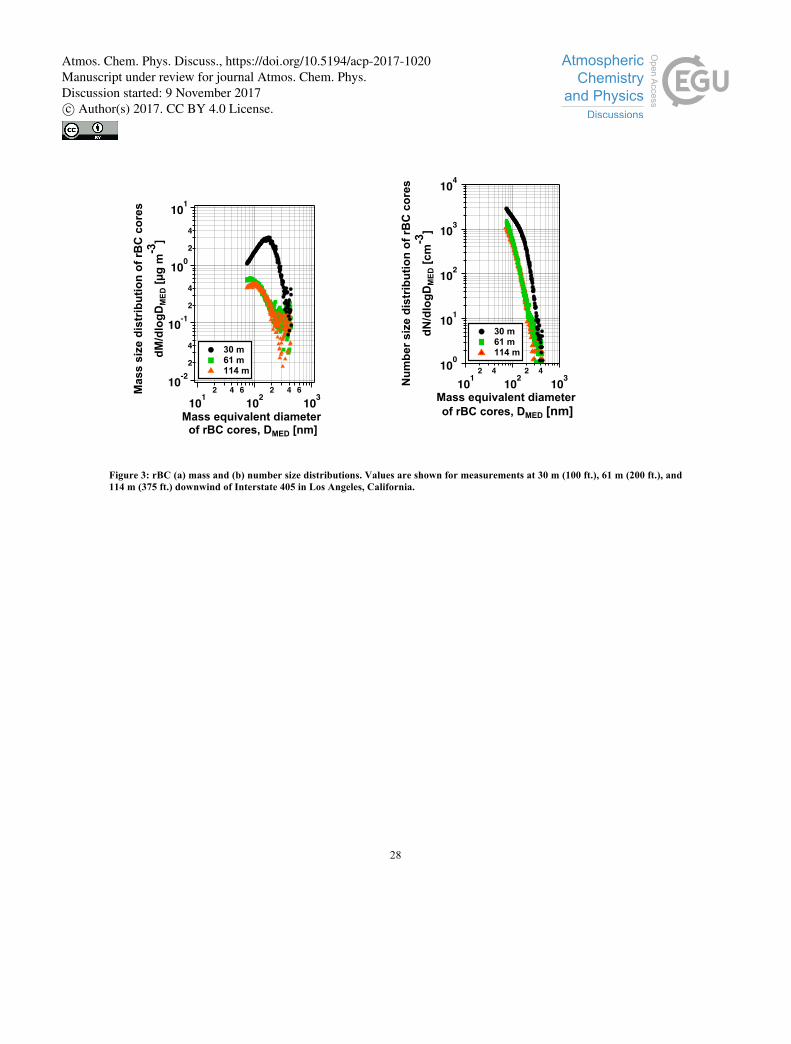
28
Figure 3: rBC (a) mass and (b) number size distributions. Values are shown for measurements at 30 m (100 ft.), 61 m (200 ft.), and 114 m (375 ft.) downwind of Interstate 405 in Los Angeles, California.
10-22
4
10-12
4
1002
4
101
1012 4 6
1022 4 6
103
100
101
102
103
104
1012 4
1022 4
103
Atmos. Chem. Phys. Discuss., https://doi.org/10.5194/acp-2017-1020Manuscript under review for journal Atmos. Chem. Phys.Discussion started: 9 November 2017c© Author(s) 2017. CC BY 4.0 License.
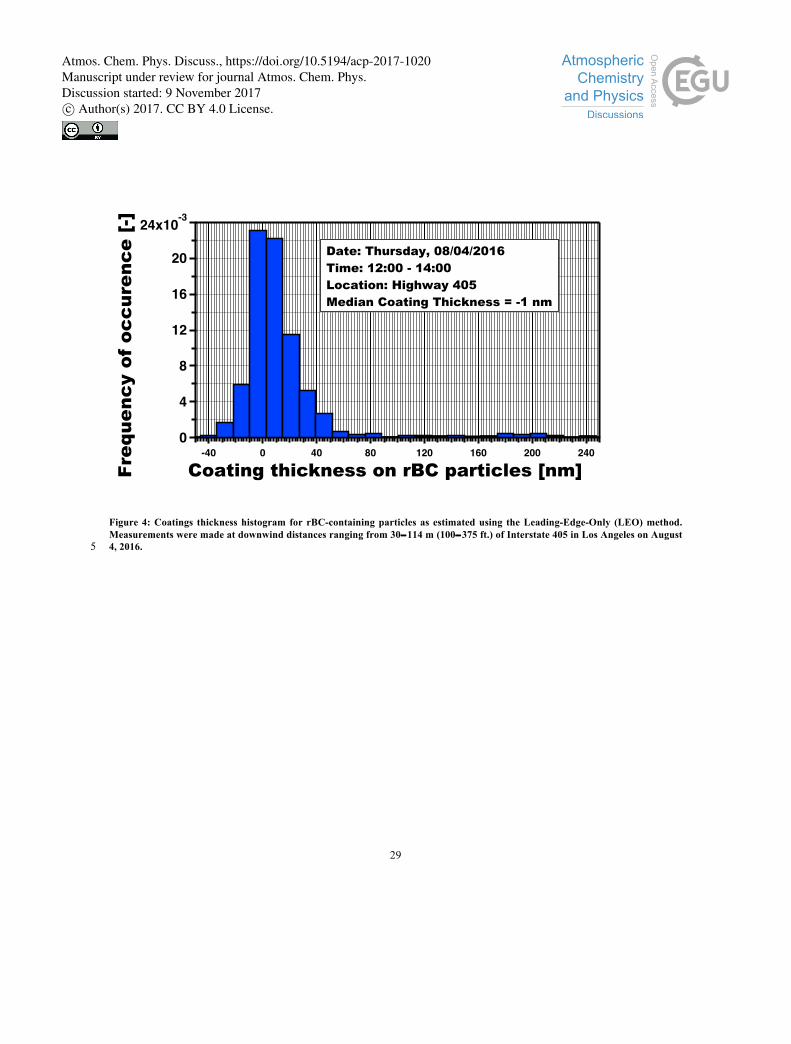
29
Figure 4: Coatings thickness histogram for rBC-containing particles as estimated using the Leading-Edge-Only (LEO) method. Measurements were made at downwind distances ranging from 30−114 m (100−375 ft.) of Interstate 405 in Los Angeles on August 4, 2016. 5
24x10-3
20
16
12
8
4
024020016012080400-40
Atmos. Chem. Phys. Discuss., https://doi.org/10.5194/acp-2017-1020Manuscript under review for journal Atmos. Chem. Phys.Discussion started: 9 November 2017c© Author(s) 2017. CC BY 4.0 License.

30
Figure 5: Overview of hourly mean results for the Redlands campaign including fraction of rBC that is thickly-coated (f, estimate using the lag-time method), rBC mass concentration (µg m-3), and ozone mixing ratio (ppb). Photochemical age (PCA) was computed using measurements of NOx to NOy at Rubidoux, California, roughly 30 km to the southwest of Redlands. You may 5 want to check again the 3 am peak associated with a huge error bar- using geometric as opposed to arithmetic means might help- it’s a small comment but I can see a picky reviewer having problems.
9/16 9/17 9/18 9/19 9/20 9/21 9/22 9/23 9/24 9/25 9/26 9/27 9/28 9/29 9/30 10/1 10/2 10/3 10/4 10/5 10/6 10/7 10/8 10/9 10/10
1.00.80.60.40.20.0
0.250.200.150.100.050.00
86420
120100806040200
Atmos. Chem. Phys. Discuss., https://doi.org/10.5194/acp-2017-1020Manuscript under review for journal Atmos. Chem. Phys.Discussion started: 9 November 2017c© Author(s) 2017. CC BY 4.0 License.
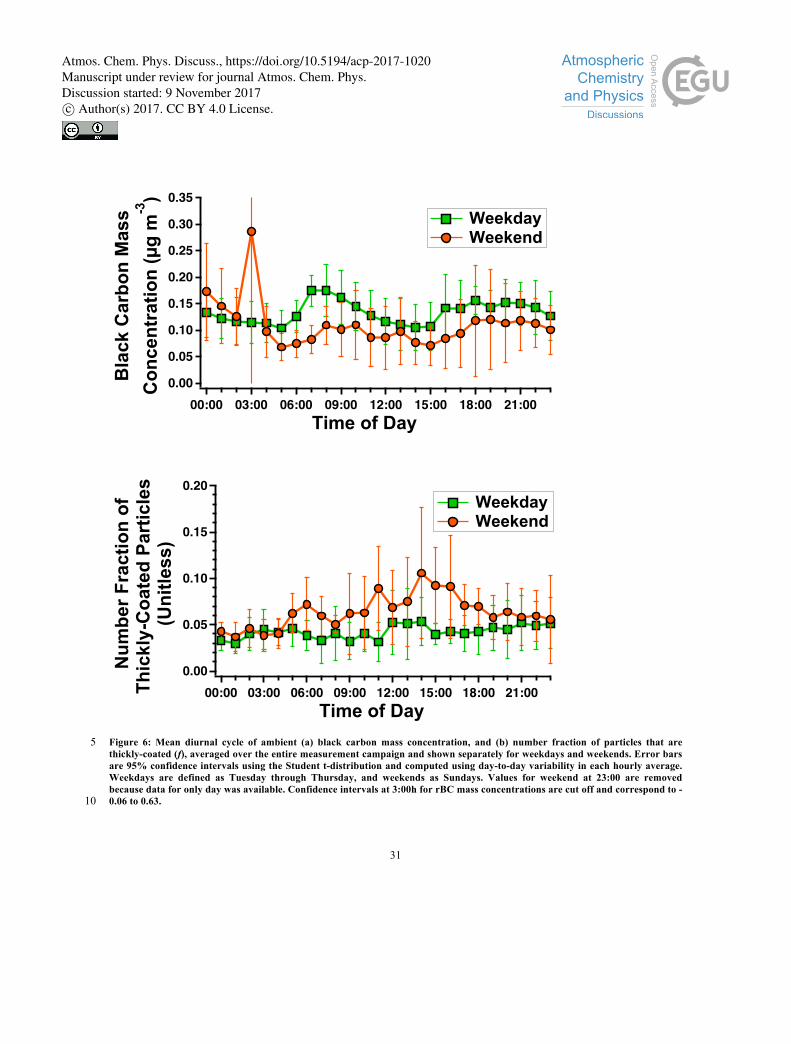
31
Figure 6: Mean diurnal cycle of ambient (a) black carbon mass concentration, and (b) number fraction of particles that are 5 thickly-coated (f), averaged over the entire measurement campaign and shown separately for weekdays and weekends. Error bars are 95% confidence intervals using the Student t-distribution and computed using day-to-day variability in each hourly average. Weekdays are defined as Tuesday through Thursday, and weekends as Sundays. Values for weekend at 23:00 are removed because data for only day was available. Confidence intervals at 3:00h for rBC mass concentrations are cut off and correspond to -0.06 to 0.63. 10
0.35
0.30
0.25
0.20
0.15
0.10
0.05
0.0000:00 03:00 06:00 09:00 12:00 15:00 18:00 21:00
0.20
0.15
0.10
0.05
0.0000:00 03:00 06:00 09:00 12:00 15:00 18:00 21:00
Atmos. Chem. Phys. Discuss., https://doi.org/10.5194/acp-2017-1020Manuscript under review for journal Atmos. Chem. Phys.Discussion started: 9 November 2017c© Author(s) 2017. CC BY 4.0 License.

32
Figure 7: Mean diurnal cycles of the ozone mixing ratio (ppb) measured in Redlands, California. Weekdays and weekends are defined as in Figure 6. Peak values occur at 15:00, and correspond to 60.4 ± 13.6 (± 95% confidence interval) on weekdays and 68.9 ± 16.5 weekends.
100
75
50
25
000:00 03:00 06:00 09:00 12:00 15:00 18:00 21:00
Atmos. Chem. Phys. Discuss., https://doi.org/10.5194/acp-2017-1020Manuscript under review for journal Atmos. Chem. Phys.Discussion started: 9 November 2017c© Author(s) 2017. CC BY 4.0 License.

33
Figure 8: Number fraction of rBC particles that are thickly-coated versus photochemical age for the hours of 13:00 to 16:00. Boxes depict the 25th and 75th percentiles, whiskers depict the 10th and 90th percentile, and the horizontal lines within the boxes show the median.
0.20
0.18
0.16
0.14
0.12
0.10
0.08
0.06
0.04
0.02
0.00
Atmos. Chem. Phys. Discuss., https://doi.org/10.5194/acp-2017-1020Manuscript under review for journal Atmos. Chem. Phys.Discussion started: 9 November 2017c© Author(s) 2017. CC BY 4.0 License.
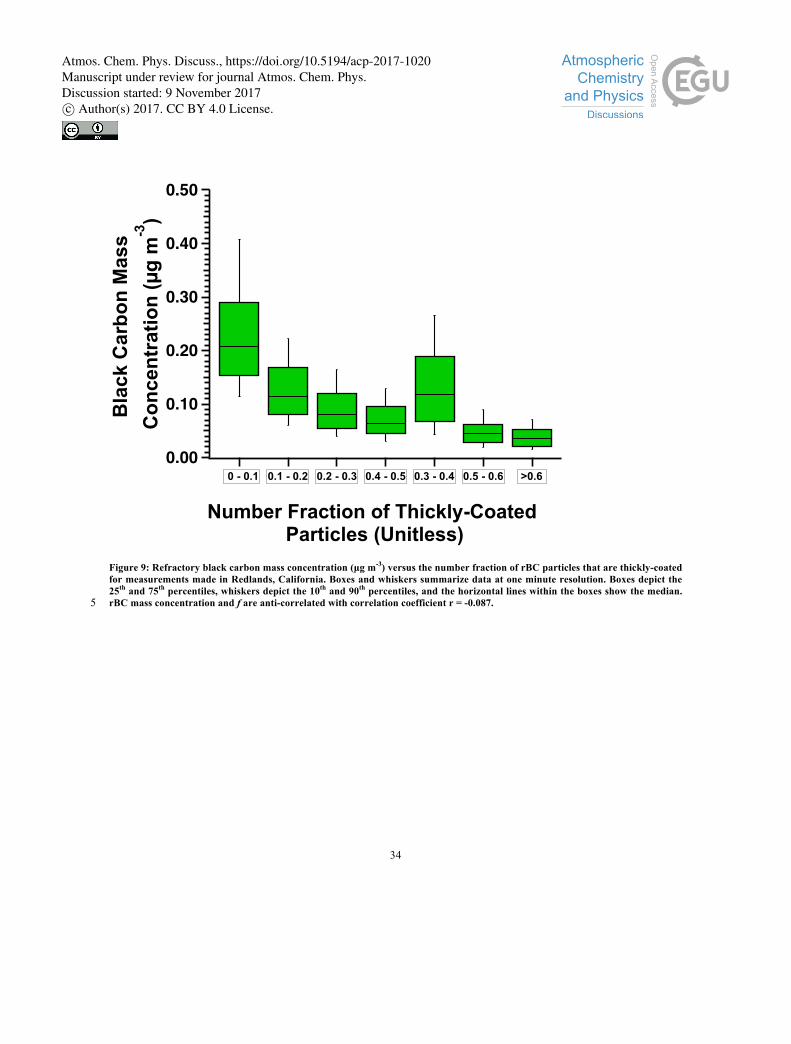
34
Figure 9: Refractory black carbon mass concentration (µg m-3) versus the number fraction of rBC particles that are thickly-coated for measurements made in Redlands, California. Boxes and whiskers summarize data at one minute resolution. Boxes depict the 25th and 75th percentiles, whiskers depict the 10th and 90th percentiles, and the horizontal lines within the boxes show the median. rBC mass concentration and f are anti-correlated with correlation coefficient r = -0.087. 5
0.50
0.40
0.30
0.20
0.10
0.00
Atmos. Chem. Phys. Discuss., https://doi.org/10.5194/acp-2017-1020Manuscript under review for journal Atmos. Chem. Phys.Discussion started: 9 November 2017c© Author(s) 2017. CC BY 4.0 License.
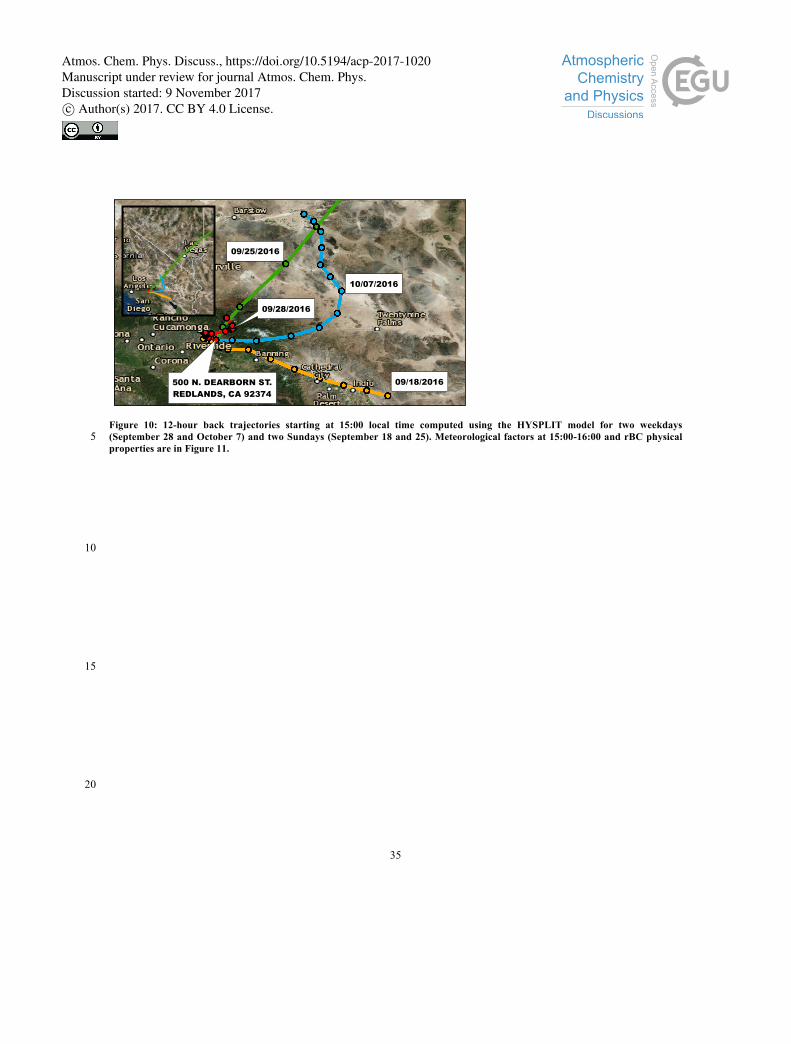
35
Figure 10: 12-hour back trajectories starting at 15:00 local time computed using the HYSPLIT model for two weekdays (September 28 and October 7) and two Sundays (September 18 and 25). Meteorological factors at 15:00-16:00 and rBC physical 5 properties are in Figure 11.
10
15
20
10/07/2016
09/25/2016
09/18/2016500 N. DEARBORN ST.
REDLANDS, CA 92374
09/28/2016
Atmos. Chem. Phys. Discuss., https://doi.org/10.5194/acp-2017-1020Manuscript under review for journal Atmos. Chem. Phys.Discussion started: 9 November 2017c© Author(s) 2017. CC BY 4.0 License.

36
24x10-3
20
16
12
8
4
024020016012080400-40
102 4
1002 4
10000.1
1
10
100
1000
0.001
0.01
0.1
1
10
24x10-3
20
16
12
8
4
024020016012080400-40
102 4
1002 4
10000.1
1
10
100
1000
0.001
0.01
0.1
1
10
24x10-3
20
16
12
8
4
024020016012080400-40
102 4
1002 4
10000.1
1
10
100
1000
0.001
0.01
0.1
1
10
Atmos. Chem. Phys. Discuss., https://doi.org/10.5194/acp-2017-1020Manuscript under review for journal Atmos. Chem. Phys.Discussion started: 9 November 2017c© Author(s) 2017. CC BY 4.0 License.

37
Figure 11: Coatings thickness histograms (left column) and rBC number and mass size distributions (right column) for two Sundays (first two rows) and two weekdays (3rd and 4th rows) averaged for 15:00-16:00 in Redlands. Also shown in the insets are meteorological variables and median coating thicknesses (left column) and rBC mass concentrations (right column) for each of the four afternoons. Note that corresponding back trajectories are shown in Figure 10. Coating thickness histograms in red are for Redlands and the near-road histogram (equivalent to that shown in Figure 4) is shown with blue dashed outlines. 5
24x10-3
20
16
12
8
4
024020016012080400-40
102 4
1002 4
10000.1
1
10
100
1000
0.001
0.01
0.1
1
10
Atmos. Chem. Phys. Discuss., https://doi.org/10.5194/acp-2017-1020Manuscript under review for journal Atmos. Chem. Phys.Discussion started: 9 November 2017c© Author(s) 2017. CC BY 4.0 License.