anomalous effects induced by d2o electrolysis of titanium...
TRANSCRIPT
Bernardini, M., et al. Anomalous Effects Induced by D2O Electrolysis of Titanium. in 8th InternationalConference on Cold Fusion. 2000. Lerici (La Spezia), Italy: Italian Physical Society, Bologna, Italy.
ANOMALOUS EFFECTS INDUCED BY D2OELECTROLYSIS OF TITANIUM
M. BERNARDINI1, C. MANDUCHI2, G. MENGOLI1 and G. ZANNONI2
1CNR IPELP, Corso Stati Uniti 4, 35127 Padova, Italy2Dipartimento di Fisica dell’Universita di Padova, via F. Marzolo 8, 35131 Padova
1 SummaryThis investigation emphasizes the heat output (~1 W) measured at open circuit after the
electrolysis of 0.6 M K2CO3 in D2O on titanium. This thermal phenomenon decayedslowly over the course of several days. “Post-mortem” γ-spectroscopy analysis of the Tisamples cathodized in D2O evidenced transientγ-emissions which cannot be attributed toimpurities of the electrolytic system.
2 IntroductionSince Fleischmann and Pons announced they had induced D-D fusion into a Pd lattice
by electrolytic deuterium loading [1], it was speculated that the phenomenon might not berestricted to Pd only. Titanium soon appeared a viable alternative to Pd. Thus, theFrascati ENEA group first [2] and others later [3-5], after submitting the Ti–D2 systemto thermal cycles, were able to detect sporadic neutron emissions of energy compatiblewith D-D fusion. That the Ti lattice could constitute a suitable host for low energynuclear reactions of hydrogen isotopes is also stressed by recent reports on D+
implantation onto TiD2 targets [6-8], whereby unpredicted fusion channels would operatein the solid and thereby greatly enhance the fusion rates.
But what about the induction of nuclear phenomena at Ti by D2O electrolysis? Toaddress this question, much careful work has been performed by Sanchez and his group[9-10] but without definitive results, due probably to the difficulty of the Ti-watersystem.
Water discharge at a Ti cathode can lead to Ti hydride formation in acid media [11],where evolving hydrogen directly interacts with the bare metal. Indeed, several reportsqualitatively account for Ti hydride formation from acidic electrolytes, whereashydriding seems hindered at pH≥ 9 [12]. However, the extent and penetration of the electrolytic reaction are expected to be very low, as indeed confirmed by Escarpizo et al[10].
The efficiency of electrolytic hydriding could therefore be increased by operating attemperatures near boiling, but not in acid electrolytes owing to the possible dissolution ofTi at open circuit. Here we have chosen to perform the electrolytic experiments attemperatures near boiling (95° C) by using a relatively mild alkaline electrolyte (0.6Μ K2CO3 in D2O, pD=11.3), wherein the metal is stabilized by surface oxides.
3 Experimental Procedures and Results
3.1 Electrochemical testsTi foils (purity≥ 99.5%, 0.02-0.07cm thick) were supplied by Goodfellow, Johnson
Matthey and a local producer. The typical Ti sample working electrode was a square witharea of 1.5cm2; the counter electrode was a Pt coil; the reference was Ag|AgCl KC1 sat.The Ti sample was charged galvanostatically at I = -200mA for periods≥ 24 h, either at 25° C or at 95° C, while a continuous flow of N2 removed the electrolysis gas from thecell.
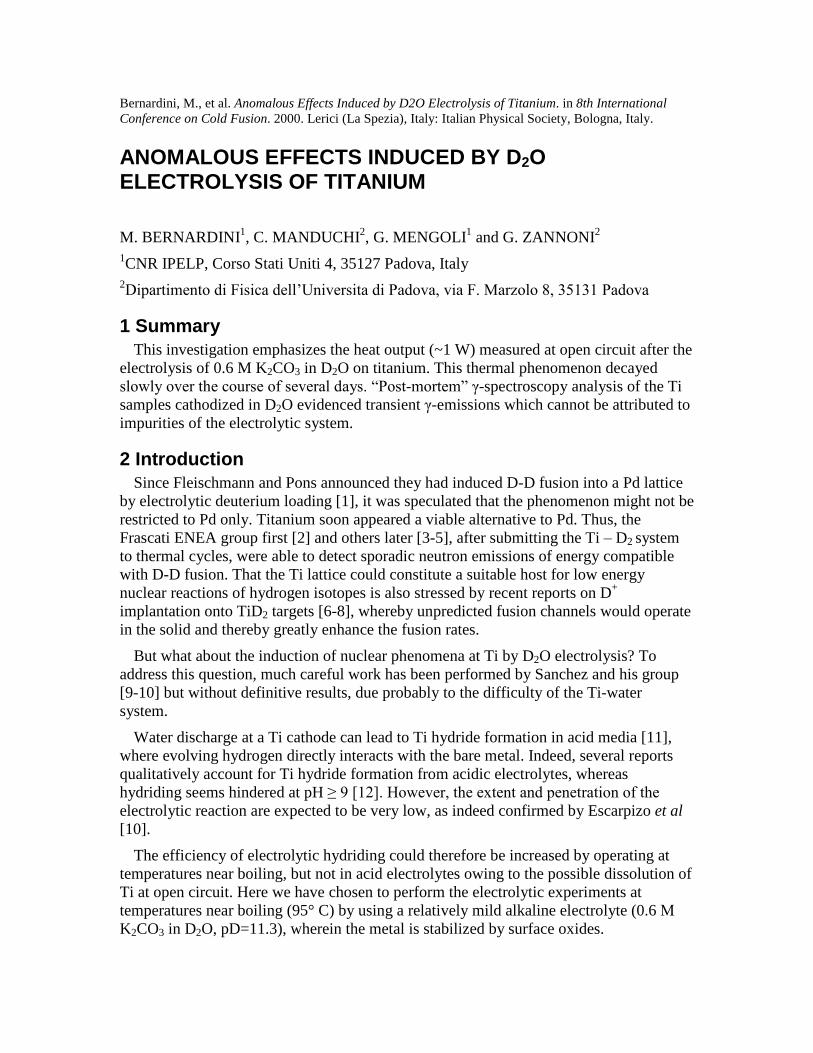
At electrolysis interruption, we observed the relaxation with time of the open circuitelectrode potential and accordingly divided the various Ti samples into three groups: twogroups that gave totally different responses and one group that gave intermediateresponse.
Figure 1: Ti electrode potential transients following the electrolysis interruption
Figure 1 illustrates the two limit behaviours at 25° C (broken curves) and 95° C (plaincurves) of two samples I and II. For sample I at both temperatures, electrolysisinterruption was followed by a fast potential increase to attain the potential of TiU2 [11].
For sample II, at 25° C the potential of TiO2 was eventually achieved after a slowlyincreasing potential transient, whereas at 95° C the rate of potential increase dropped withfluctuations and oscillations, as the insert of Figure 1 shows. We associate the behaviourof Sample II with the decomposition (by corrosion) of a bulk hydride phase, theformation of which had occurred much more efficiently at 95° C than at 25° C.
3.2 CalorimetryThe calorimetric runs were carried out at 95° C [13-14]. The core of the calorimetric
system was a Dewar electrolytic cell equipped with a refrigerated column to condense thevapour. In addition to the (Ti) cathode and (Ni) anode, the cell was further equipped witha Pt 100 thermometer, a NiCr resistance heater and a glass pipe conveying a controlledN2 flow (3.5cm3 min-1) into the electrolyte to ensure homogeneous heat distribution.
The cell, filled with 100ml of 0.6Μ K2CO3 in D2O and immersed in a silicon oil bathkept at 95 ±0.01° C by a Hake F3 thermostat, was made isothermal with the bath bysupplying continuously the power required for NiCr resistance. In the experiment detailedbelow we have chosen to measure the free temperature increments (above 95° C) andconvert them into power through repeated calibrations (typical cell constant was2.0±0.1°CW-1).
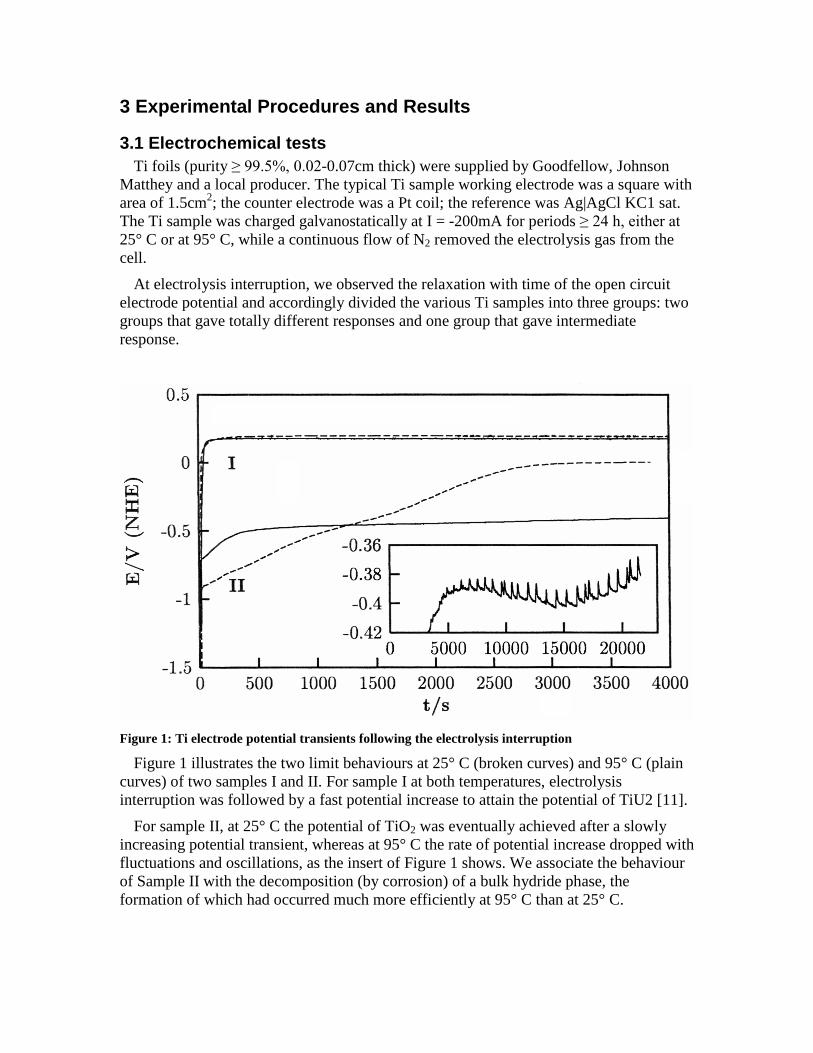
Figure 2(a-d) accounts for the evolution with time of the calorimetric response duringelectrolysis at a Ti cathode from the same batch of sample II (1.2 cmχ 2.5 cmχ 0.07cm).The left ordinate gives, with accuracy ±0.1° C, the increment in temperature of theelectrolyte (continuous line). The right ordinate gives, with accuracy ±0.1 W, the powercorrespondingly determined by the cell constant. The accuracy of this datum is lowerthan that of the thermometric readings since we considered the range 95-97° C,ΔΤ/° Clinear with P/W. The two broken lines indicate (E-1.52 V) × I (i.e., electrolytic joulepower-------) andΕ × I (i.e., total electrolysis power— ·—) fed to the cell.
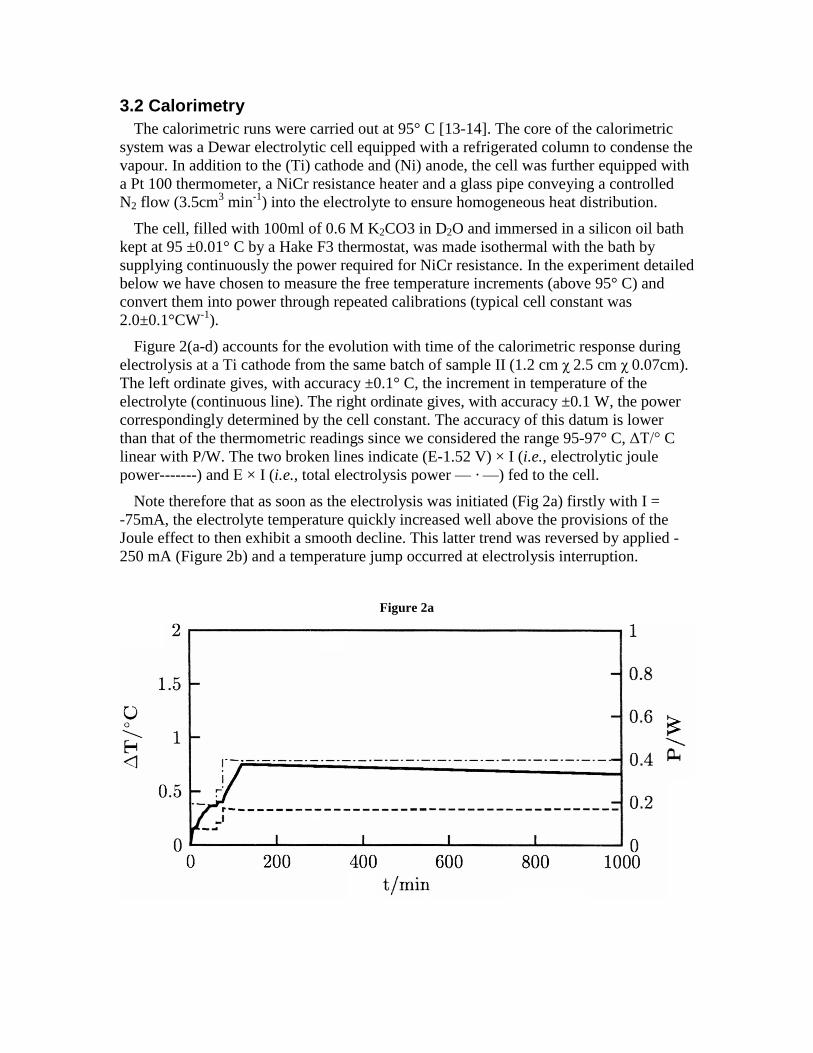
Note therefore that as soon as the electrolysis was initiated (Fig 2a) firstly with I =-75mA, the electrolyte temperature quickly increased well above the provisions of theJoule effect to then exhibit a smooth decline. This latter trend was reversed by applied -250 mA (Figure 2b) and a temperature jump occurred at electrolysis interruption.
Figure 2a
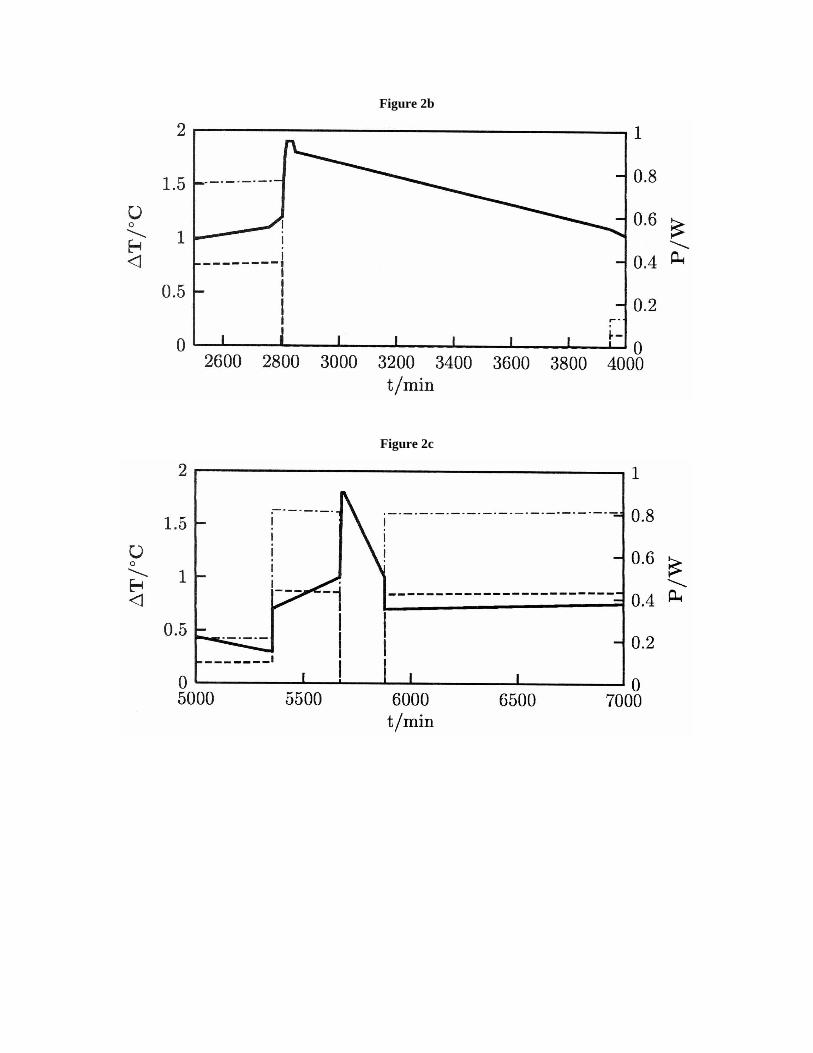
Figure 2b
Figure 2c
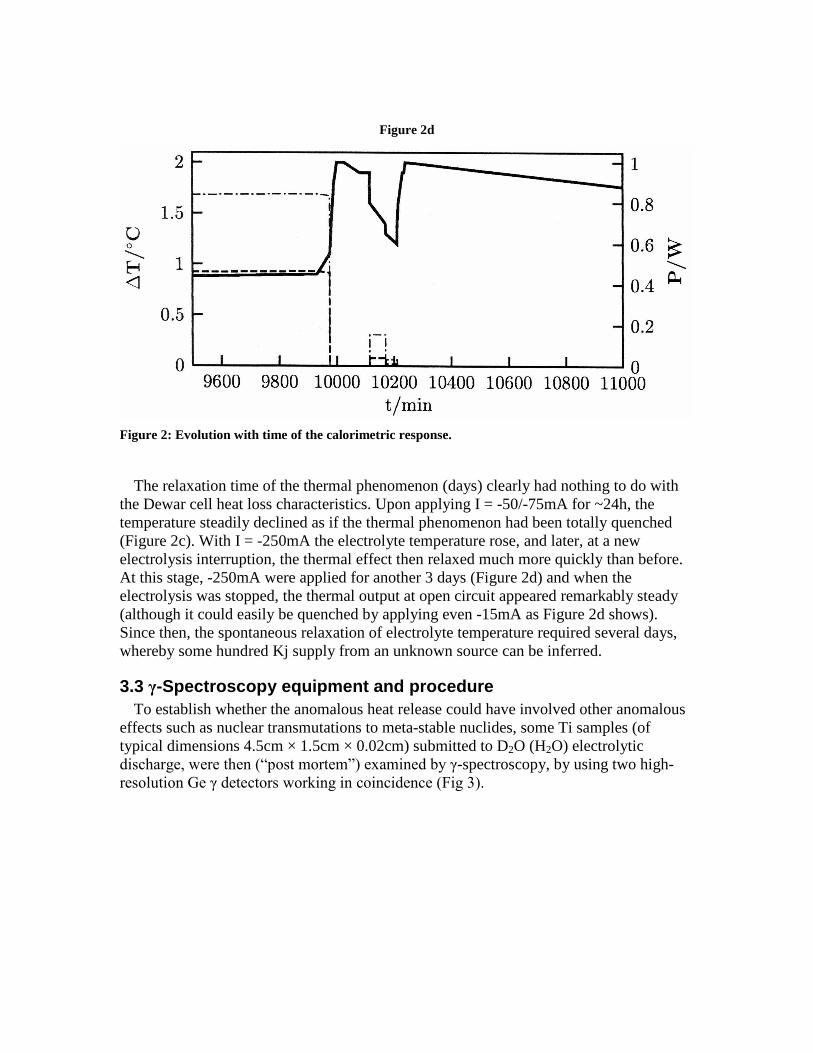
Figure 2d
Figure 2: Evolution with time of the calorimetric response.
The relaxation time of the thermal phenomenon (days) clearly had nothing to do withthe Dewar cell heat loss characteristics. Upon applying I = -50/-75mA for ~24h, thetemperature steadily declined as if the thermal phenomenon had been totally quenched(Figure 2c). With I = -250mA the electrolyte temperature rose, and later, at a newelectrolysis interruption, the thermal effect then relaxed much more quickly than before.At this stage, -250mA were applied for another 3 days (Figure 2d) and when theelectrolysis was stopped, the thermal output at open circuit appeared remarkably steady(although it could easily be quenched by applying even -15mA as Figure 2d shows).Since then, the spontaneous relaxation of electrolyte temperature required several days,whereby some hundred Kj supply from an unknown source can be inferred.
3.3γ-Spectroscopy equipment and procedureTo establish whether the anomalous heat release could have involved other anomalous
effects such as nuclear transmutations to meta-stable nuclides, some Ti samples (oftypical dimensions 4.5cm × 1.5cm × 0.02cm) submitted to D2O (H2O) electrolyticdischarge, were then (“post mortem”) examined by γ-spectroscopy, by using two high-resolution Ge γ detectors working in coincidence (Fig 3).
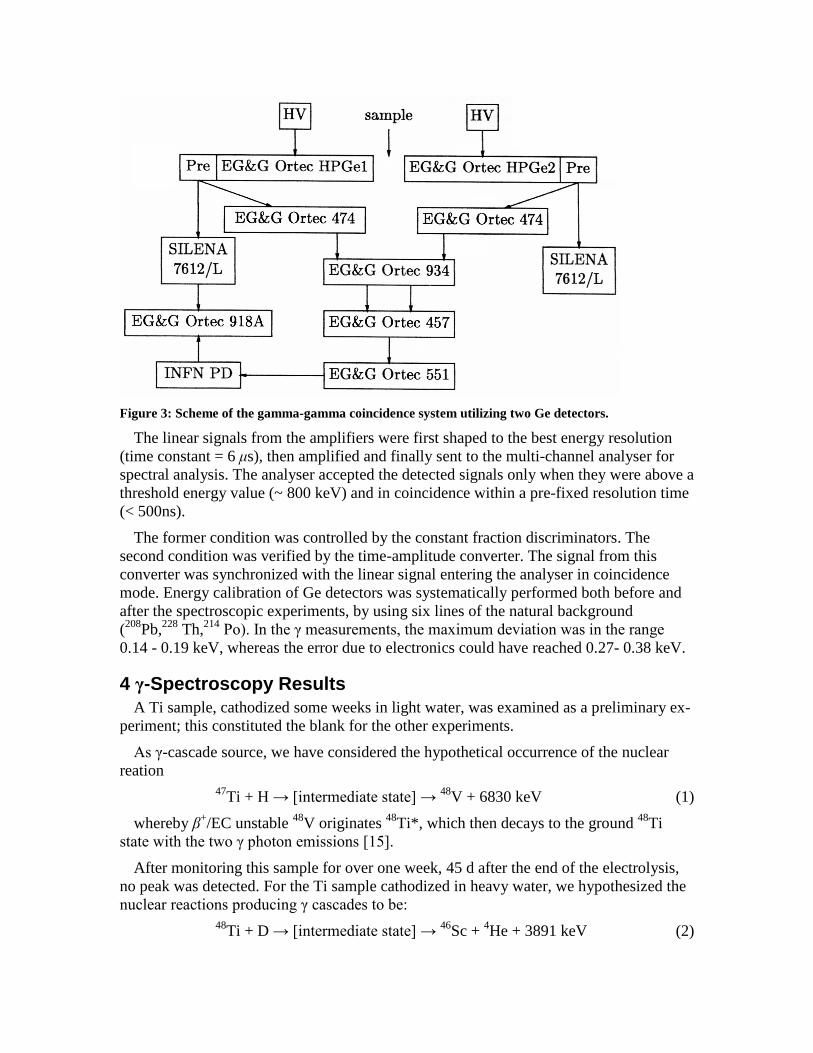
Figure 3: Scheme of the gamma-gamma coincidence system utilizing two Ge detectors.
The linear signals from the amplifiers were first shaped to the best energy resolution(time constant = 6 μs), then amplified and finally sent to the multi-channel analyser forspectral analysis. The analyser accepted the detected signals only when they were above athreshold energy value (~ 800 keV) and in coincidence within a pre-fixed resolution time(< 500ns).
The former condition was controlled by the constant fraction discriminators. Thesecond condition was verified by the time-amplitude converter. The signal from thisconverter was synchronized with the linear signal entering the analyser in coincidencemode. Energy calibration of Ge detectors was systematically performed both before andafter the spectroscopic experiments, by using six lines of the natural background(208Pb,228 Th,214 Po). In the γ measurements, the maximum deviation was in the range 0.14 - 0.19 keV, whereas the error due to electronics could have reached 0.27- 0.38 keV.
4γ-Spectroscopy ResultsA Ti sample, cathodized some weeks in light water, was examined as a preliminary ex-
periment; this constituted the blank for the other experiments.
As γ-cascade source, we have considered the hypothetical occurrence of the nuclearreation
47Ti +Η → [intermediate state] → 48V + 6830 keV (1)
wherebyβ+/EC unstable 48V originates 48Ti*, which then decays to the ground 48Tistate with the two γ photon emissions [15].
After monitoring this sample for over one week, 45 d after the end of the electrolysis,no peak was detected. For the Ti sample cathodized in heavy water, we hypothesized thenuclear reactions producing γ cascades to be:
48Ti + D→ [intermediate state] → 46Sc + 4He + 3891 keV (2)
50Ti + D→ [intermediate state] → 48Sc + 4He + 3686 keV (3)
The half-life of 46Sc (reaction 2) is 83.81 dand the γ cascade to 46Ti ground state isconstituted by two photons of energy equal to 889.277 and 1120.545 keV respectively[15]. The half-life of 48Sc (reaction 3) is 43.7h and γ cascade to 48Ti consists of γ photons of energy equal to 983.524 keV, 1037.522 keV and 1312.050keV respectively [15].
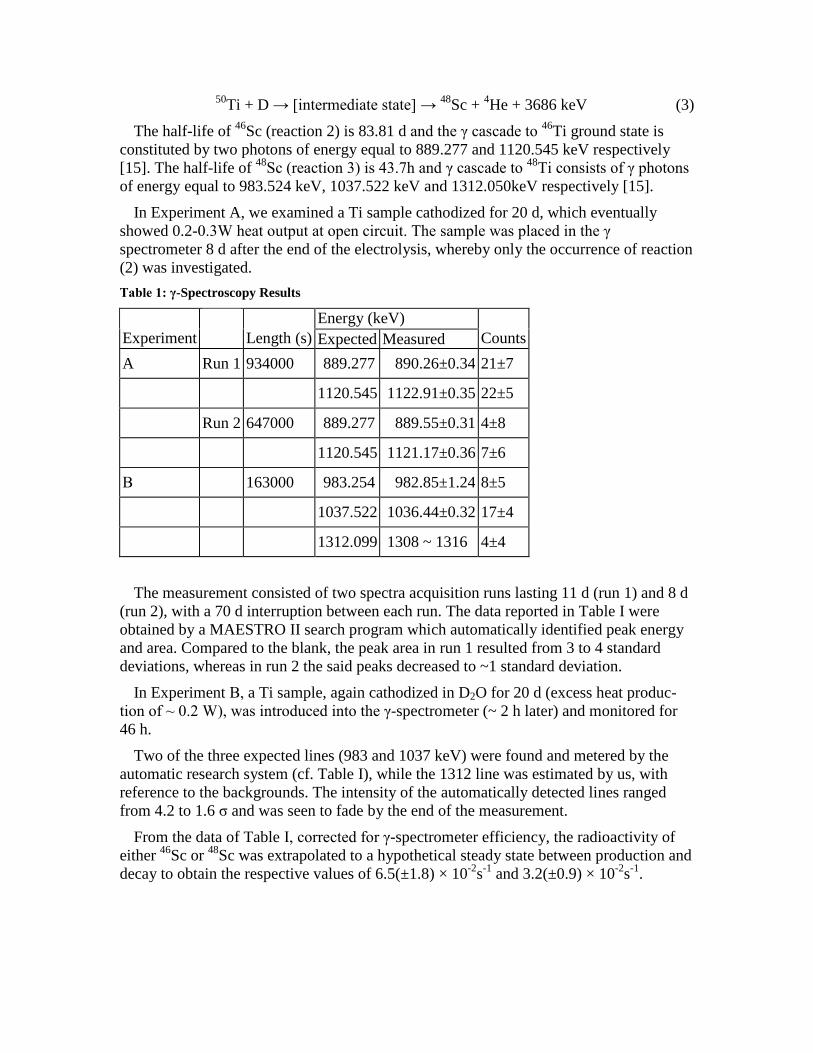
In Experiment A, we examined a Ti sample cathodized for 20 d, which eventuallyshowed 0.2-0.3W heat output at open circuit. The sample was placed in the γ spectrometer 8 d after the end of the electrolysis, whereby only the occurrence of reaction(2) was investigated.Table 1: γ-Spectroscopy Results
Energy (keV)Experiment Length (s) Expected Measured Counts
A Run 1 934000 889.277 890.26±0.34 21±7
1120.545 1122.91±0.35 22±5
Run 2 647000 889.277 889.55±0.31 4±8
1120.545 1121.17±0.36 7±6
Β 163000 983.254 982.85±1.24 8±5
1037.522 1036.44±0.32 17±4
1312.099 1308 ~ 1316 4±4
The measurement consisted of two spectra acquisition runs lasting 11 d (run 1) and 8 d(run 2), with a 70 d interruption between each run. The data reported in Table I wereobtained by a MAESTRO II search program which automatically identified peak energyand area. Compared to the blank, the peak area in run 1 resulted from 3 to 4 standarddeviations, whereas in run 2 the said peaks decreased to ~1 standard deviation.
In ExperimentΒ, a Ti sample, again cathodized in D2O for 20 d (excess heat produc-tion of ~ 0.2 W), was introduced into the γ-spectrometer (~ 2 h later) and monitored for46 h.
Two of the three expected lines (983 and 1037 keV) were found and metered by theautomatic research system (cf. Table I), while the 1312 line was estimated by us, withreference to the backgrounds. The intensity of the automatically detected lines rangedfrom 4.2 to 1.6σ and was seen to fade by the end of the measurement.
From the data of TableI, corrected for γ-spectrometer efficiency, the radioactivity ofeither 46Sc or 48Sc was extrapolated to a hypothetical steady state between production anddecay to obtain the respective values of 6.5(±1.8) × 10-2s-1 and 3.2(±0.9) × 10-2s-1.
AcknowledgmentsThe authors wish to thank C. Baiocchi and Profs. F. Gramigna, F. Brandolini, M. Nigro
of INFN-Legnaro for making possible our γ-spectroscopy investigation. Thanks are alsodue to Torresin s.r.l for the Ti supply and to the INFN group of Trieste for the loan of adata acquisition system.
References[1] Fleischmann M. and Pons S., J. Electroanal. Chem., 261, (1990) 301.
[2] De Ninno A., Frattolillo A., Lollobattista G., Martinis L., Martone M., Mori L., PoddaS., and Scarammuzzi F., Nuovo Cim., 101, (1989) 841.
[3] Menlove H.O., Fowler M.M., Garcia E., Miller M.C., Paciotti M.A., Ryan R.R. andJones S.E., J., Fusion Energy, 9(4), (1990) 495.
[4] Bressani T., Calvo D., Felicello A., Lamberti C., Iazzi F., Minetti B., Cherubim R.,Hague A.M.I., and Ricci R.A., Nuovo Cim. A, 101, (1991) 1413, 1587.
[5] Botta E., Bressani T., Calvo D., Felicello A., Gianotti P., Lamberti C., Agnello M.,lazzi F., Minetti B., and Zecchina A., Nuovo Cim. A, 105, (1992) 1663.
[6] Kasagi J., Ohtsuki T., Ishii K., and Hiraga M., J. Phys. Soc. Japan, 64, (1995) 777.
[7] Takahashi A., Iida T., Miyamaru H., Fukuhara M., Fusion Tech., 27, (1995) 71.
[8] Takahashi A., Iida T., Miyamaru H., Fukuhara M., Fusion Tech., 34, (1998) 256.
[9] Sevilla J., Escarpizo B., Fernandez F.J., Sanchez C., Fusion Tech., 19, (1991) 188.
[10] Escarpizo B., Fernandez F., Sevilla J., Cuevas F. and Sanchez C: in The Science ofCold Fusion, Proceedings of the Second Annual Conference on Cold Fusion, Como June29-July 4, 1991, edited by T. Bressani, E. Del Guidice and G. Preparata, 33 (SocietaItaliana di Fisica) 1991, p. 15.
[11] Pourbaix M., Atlas D’Equilibres Electrochim. (Gauthier-Villars, Parigi) p. 213.
[12] Mizuno T. and Enyo M., in Modern Aspects of Electrochemistry, edited by R.E.White et al., Vol. 30 (plenum Press, New York) 1996, p. 415.
[13] Mengoli G., Bernardini M., Manduchi C., Zannoni G., J. Electroanal. Chemistry,444, (1998) 155.
[14] Mengoli G., Bernardini M., Manduchi C., Zannoni G., Nuovo Cim., 20D, (1998)331.
[15] Nuclear Data Sheets, ed. J.K. Tuli, (Academic Press, New York-London) 1977-1986.