andhra pradesh demography
TRANSCRIPT
CHAPTER 2
DEMOGRAPHY
39
40
Andhra Pradesh
MAY2014
Source: Population Census (2011)
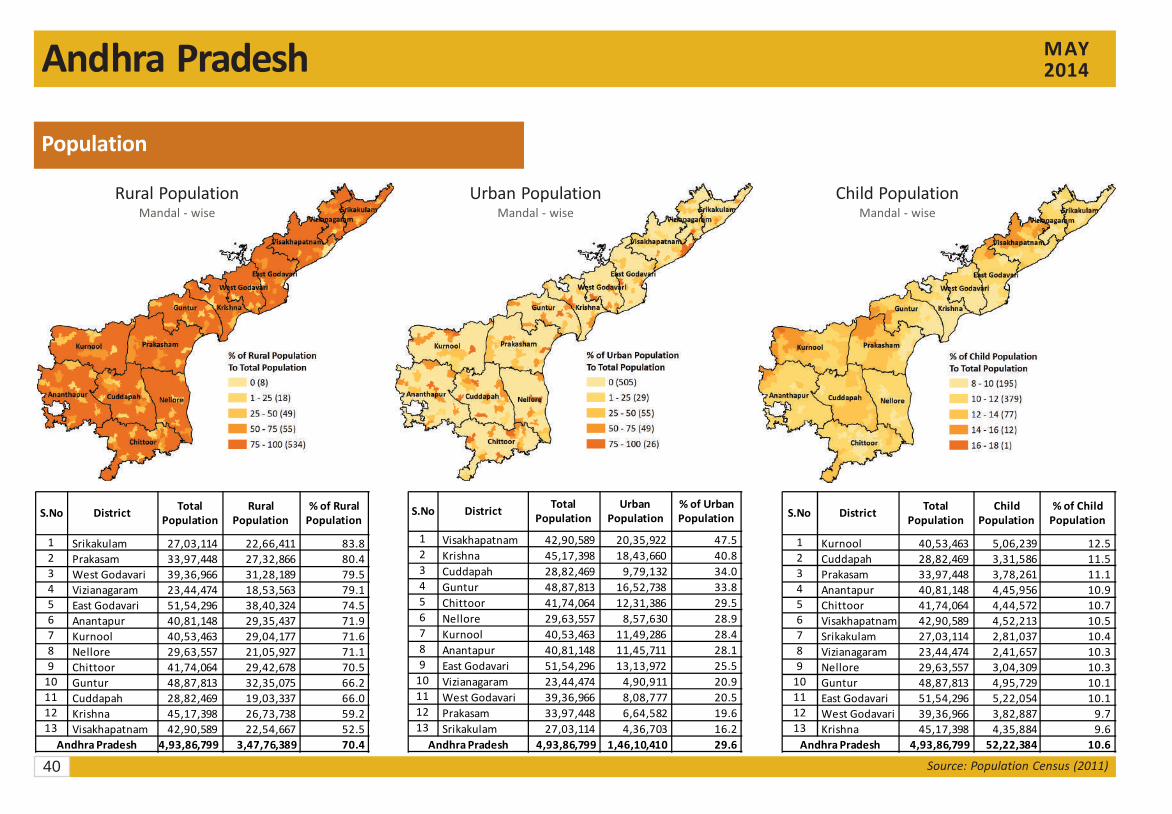
Population
Rural PopulationMandal - wise
Urban PopulationMandal - wise
Child PopulationMandal - wise
S.No DistrictTotal
Population
Rural
Population
% of Rural
Population
1 Srikakulam 27,03,114 22,66,411 83.8
2 Prakasam 33,97,448 27,32,866 80.4
3 West Godavari 39,36,966 31,28,189 79.5
4 Vizianagaram 23,44,474 18,53,563 79.1
5 East Godavari 51,54,296 38,40,324 74.5
6 Anantapur 40,81,148 29,35,437 71.9
7 Kurnool 40,53,463 29,04,177 71.6
8 Nellore 29,63,557 21,05,927 71.1
9 Chittoor 41,74,064 29,42,678 70.5
10 Guntur 48,87,813 32,35,075 66.2
11 Cuddapah 28,82,469 19,03,337 66.0
12 Krishna 45,17,398 26,73,738 59.2
13 Visakhapatnam 42,90,589 22,54,667 52.5
Andhra Pradesh 4,93,86,799 3,47,76,389 70.4
S.No DistrictTotal
Population
Urban
Population
% of Urban
Population
1 Visakhapatnam 42,90,589 20,35,922 47.5
2 Krishna 45,17,398 18,43,660 40.8
3 Cuddapah 28,82,469 9,79,132 34.0
4 Guntur 48,87,813 16,52,738 33.8
5 Chittoor 41,74,064 12,31,386 29.5
6 Nellore 29,63,557 8,57,630 28.9
7 Kurnool 40,53,463 11,49,286 28.4
8 Anantapur 40,81,148 11,45,711 28.1
9 East Godavari 51,54,296 13,13,972 25.5
10 Vizianagaram 23,44,474 4,90,911 20.9
11 West Godavari 39,36,966 8,08,777 20.5
12 Prakasam 33,97,448 6,64,582 19.6
13 Srikakulam 27,03,114 4,36,703 16.2
Andhra Pradesh 4,93,86,799 1,46,10,410 29.6
S.No DistrictTotal
Population
Child
Population
% of Child
Population
1 Kurnool 40,53,463 5,06,239 12.5
2 Cuddapah 28,82,469 3,31,586 11.5
3 Prakasam 33,97,448 3,78,261 11.1
4 Anantapur 40,81,148 4,45,956 10.9
5 Chittoor 41,74,064 4,44,572 10.7
6 Visakhapatnam 42,90,589 4,52,213 10.5
7 Srikakulam 27,03,114 2,81,037 10.4
8 Vizianagaram 23,44,474 2,41,657 10.3
9 Nellore 29,63,557 3,04,309 10.3
10 Guntur 48,87,813 4,95,729 10.1
11 East Godavari 51,54,296 5,22,054 10.1
12 West Godavari 39,36,966 3,82,887 9.7
13 Krishna 45,17,398 4,35,884 9.6
Andhra Pradesh 4,93,86,799 52,22,384 10.6
41
Andhra Pradesh MAY2014
Source: Population Census (2011)
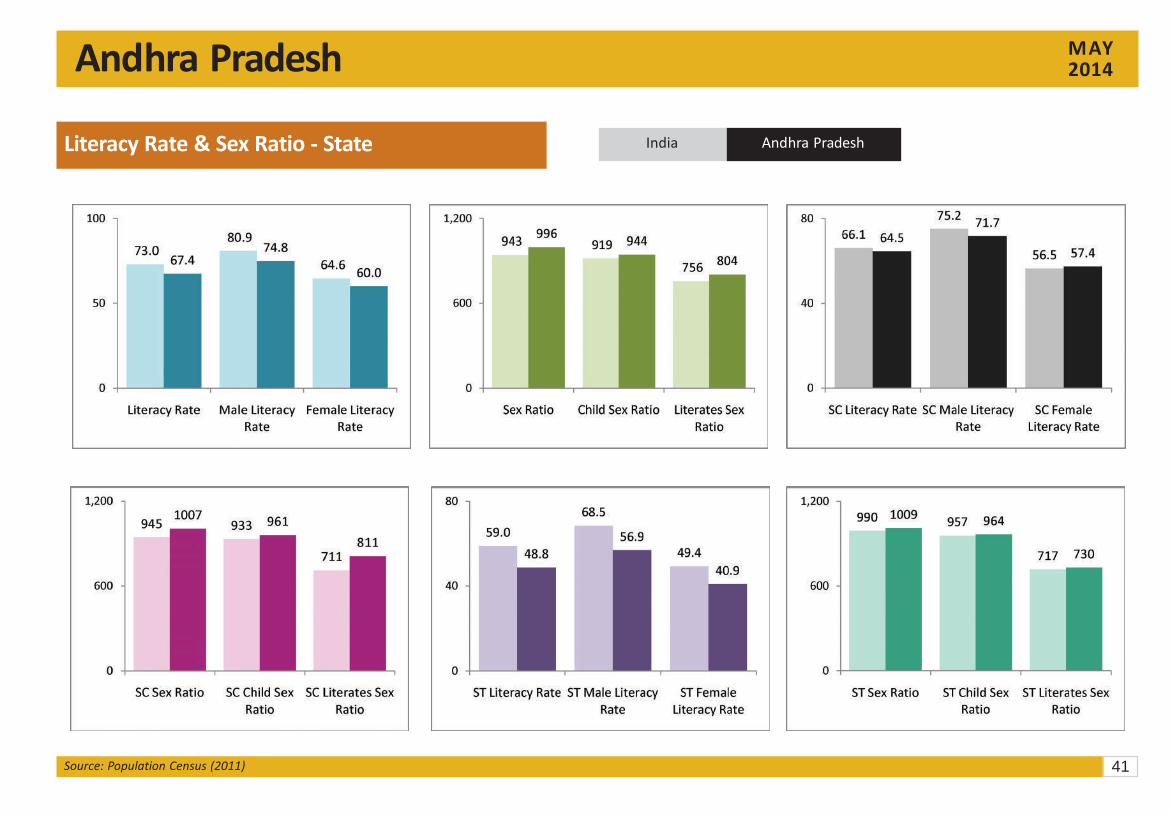
Literacy Rate & Sex Ratio - State India Andhra Pradesh
42
Andhra Pradesh
MAY2014
Source: Population Census (2011)
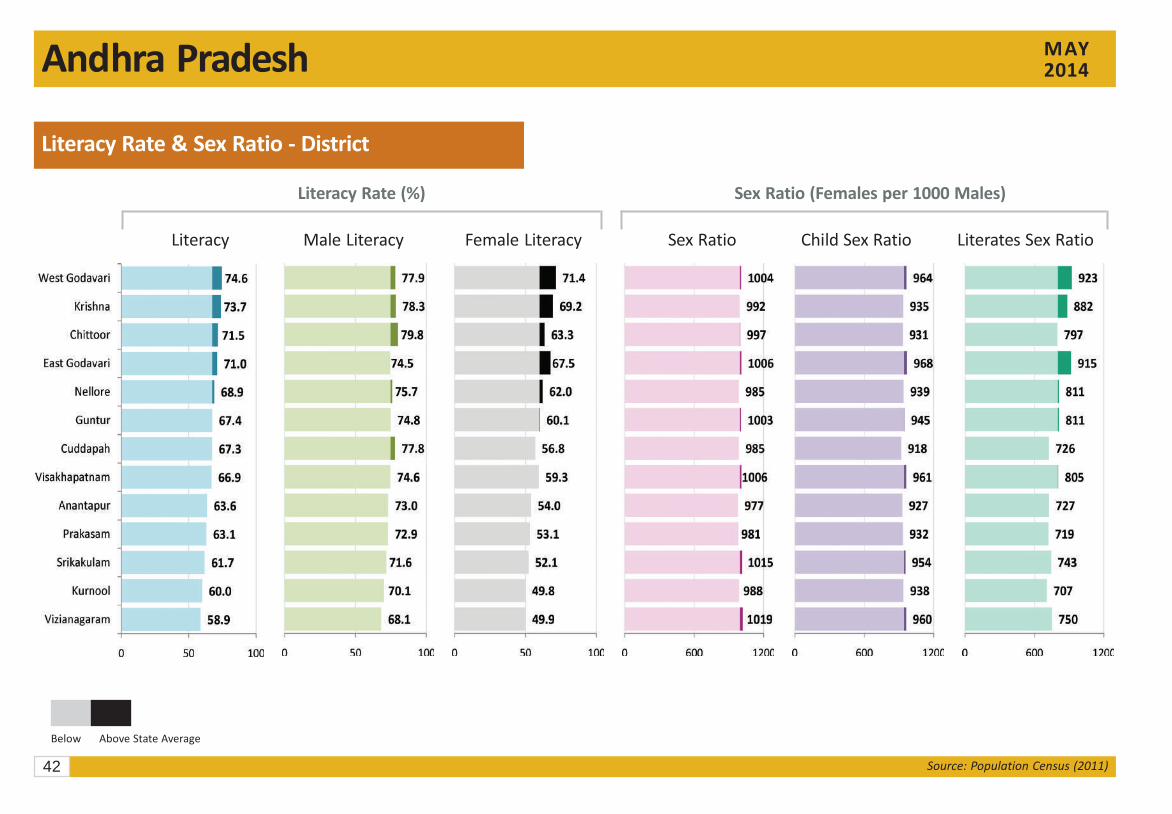
Literacy Rate & Sex Ratio - District
Literacy Rate (%) Sex Ratio (Females per 1000 Males)
Literacy Male Literacy Female Literacy Sex Ratio Child Sex Ratio Literates Sex Ratio
Below Above State Average
43
Andhra Pradesh MAY2014
Source: Population Census (2011)
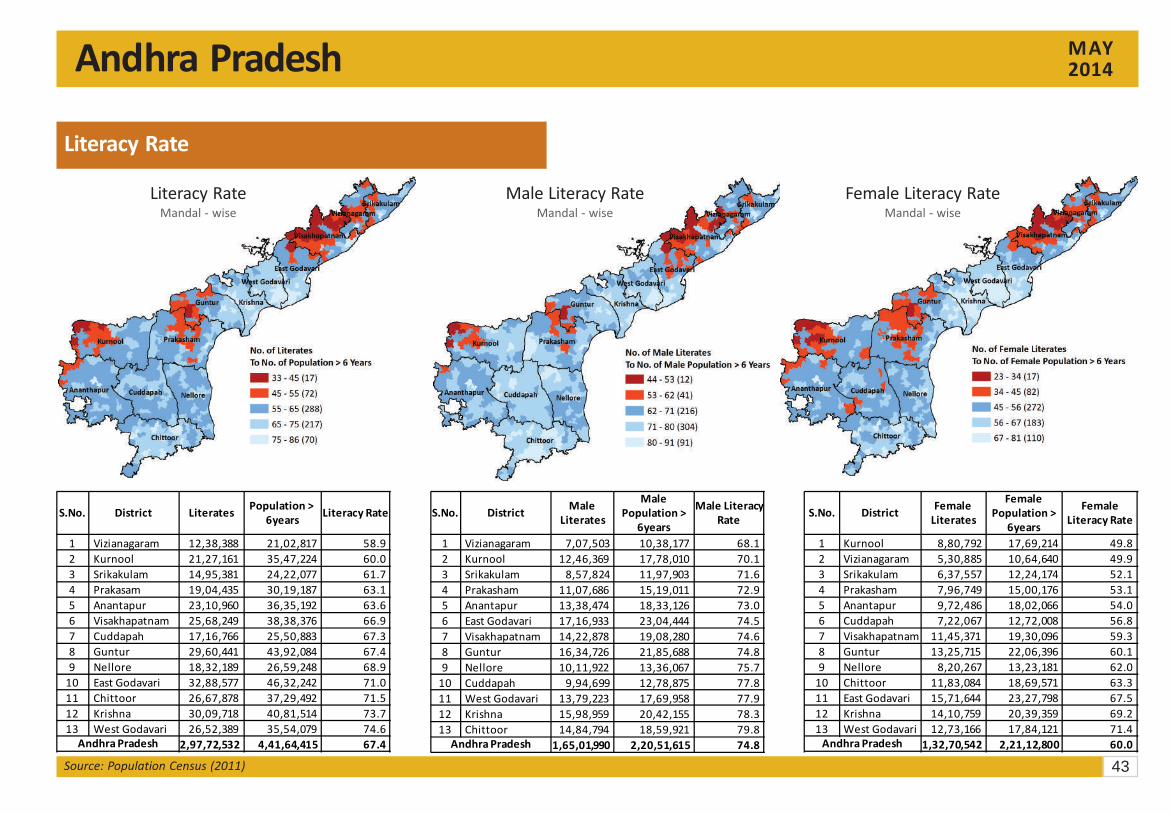
Literacy Rate
Literacy RateMandal - wise
Male Literacy RateMandal - wise
Female Literacy RateMandal - wise
S.No. District LiteratesPopulation >
6yearsLiteracy Rate
1 Vizianagaram 12,38,388 21,02,817 58.9
2 Kurnool 21,27,161 35,47,224 60.0
3 Srikakulam 14,95,381 24,22,077 61.7
4 Prakasam 19,04,435 30,19,187 63.1
5 Anantapur 23,10,960 36,35,192 63.6
6 Visakhapatnam 25,68,249 38,38,376 66.9
7 Cuddapah 17,16,766 25,50,883 67.3
8 Guntur 29,60,441 43,92,084 67.4
9 Nellore 18,32,189 26,59,248 68.9
10 East Godavari 32,88,577 46,32,242 71.0
11 Chittoor 26,67,878 37,29,492 71.5
12 Krishna 30,09,718 40,81,514 73.7
13 West Godavari 26,52,389 35,54,079 74.6
Andhra Pradesh 2,97,72,532 4,41,64,415 67.4
S.No. DistrictMale
Literates
Male
Population >
6years
Male Literacy
Rate
1 Vizianagaram 7,07,503 10,38,177 68.1
2 Kurnool 12,46,369 17,78,010 70.1
3 Srikakulam 8,57,824 11,97,903 71.6
4 Prakasham 11,07,686 15,19,011 72.9
5 Anantapur 13,38,474 18,33,126 73.0
6 East Godavari 17,16,933 23,04,444 74.5
7 Visakhapatnam 14,22,878 19,08,280 74.6
8 Guntur 16,34,726 21,85,688 74.8
9 Nellore 10,11,922 13,36,067 75.7
10 Cuddapah 9,94,699 12,78,875 77.8
11 West Godavari 13,79,223 17,69,958 77.9
12 Krishna 15,98,959 20,42,155 78.3
13 Chittoor 14,84,794 18,59,921 79.8
Andhra Pradesh 1,65,01,990 2,20,51,615 74.8
S.No. DistrictFemale
Literates
Female
Population >
6years
Female
Literacy Rate
1 Kurnool 8,80,792 17,69,214 49.8
2 Vizianagaram 5,30,885 10,64,640 49.9
3 Srikakulam 6,37,557 12,24,174 52.1
4 Prakasham 7,96,749 15,00,176 53.1
5 Anantapur 9,72,486 18,02,066 54.0
6 Cuddapah 7,22,067 12,72,008 56.8
7 Visakhapatnam 11,45,371 19,30,096 59.3
8 Guntur 13,25,715 22,06,396 60.1
9 Nellore 8,20,267 13,23,181 62.0
10 Chittoor 11,83,084 18,69,571 63.3
11 East Godavari 15,71,644 23,27,798 67.5
12 Krishna 14,10,759 20,39,359 69.2
13 West Godavari 12,73,166 17,84,121 71.4
Andhra Pradesh 1,32,70,542 2,21,12,800 60.0
44
Andhra Pradesh
MAY2014
Source: Population Census (2011)
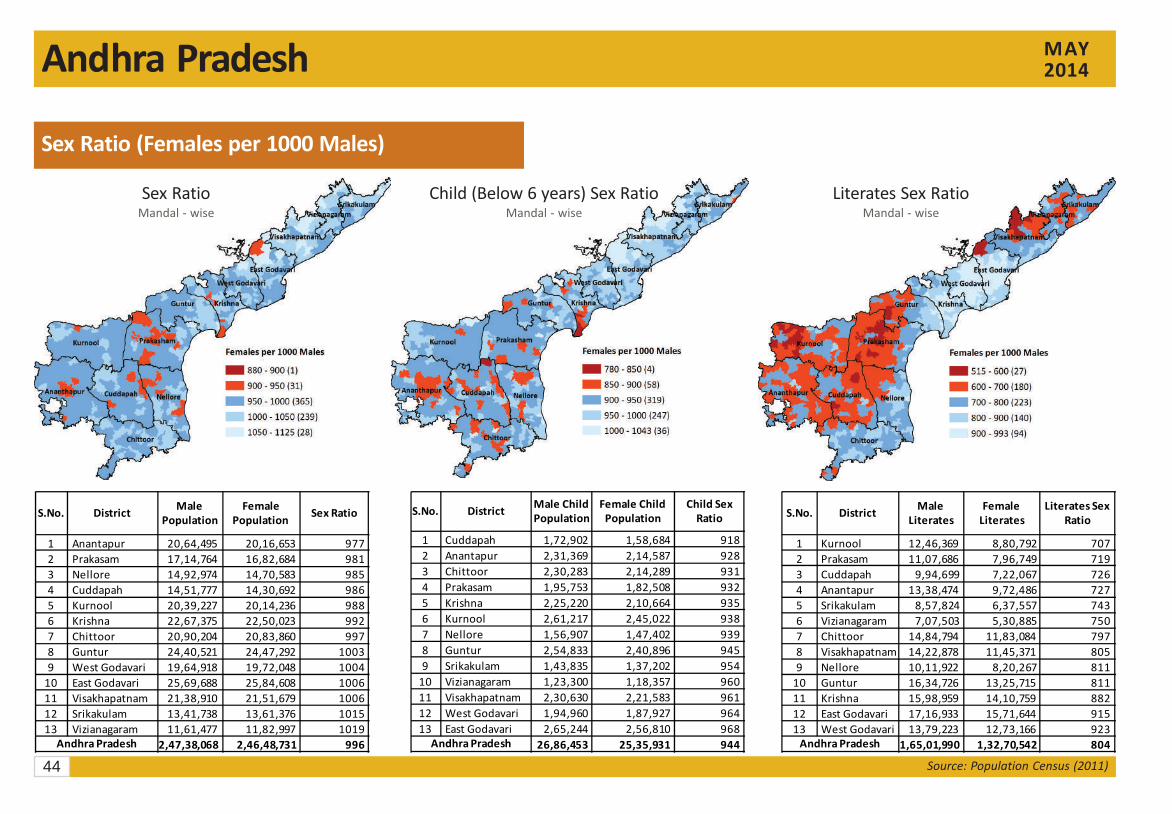
Sex Ratio (Females per 1000 Males)
Sex RatioMandal - wise
Child (Below 6 years) Sex RatioMandal - wise
Literates Sex RatioMandal - wise
S.No. DistrictMale
Population
Female
PopulationSex Ratio
1 Anantapur 20,64,495 20,16,653 977
2 Prakasam 17,14,764 16,82,684 981
3 Nellore 14,92,974 14,70,583 985
4 Cuddapah 14,51,777 14,30,692 986
5 Kurnool 20,39,227 20,14,236 988
6 Krishna 22,67,375 22,50,023 992
7 Chittoor 20,90,204 20,83,860 997
8 Guntur 24,40,521 24,47,292 1003
9 West Godavari 19,64,918 19,72,048 1004
10 East Godavari 25,69,688 25,84,608 1006
11 Visakhapatnam 21,38,910 21,51,679 1006
12 Srikakulam 13,41,738 13,61,376 1015
13 Vizianagaram 11,61,477 11,82,997 1019
Andhra Pradesh 2,47,38,068 2,46,48,731 996
S.No. DistrictMale Child
Population
Female Child
Population
Child Sex
Ratio
1 Cuddapah 1,72,902 1,58,684 918
2 Anantapur 2,31,369 2,14,587 928
3 Chittoor 2,30,283 2,14,289 931
4 Prakasam 1,95,753 1,82,508 932
5 Krishna 2,25,220 2,10,664 935
6 Kurnool 2,61,217 2,45,022 938
7 Nellore 1,56,907 1,47,402 939
8 Guntur 2,54,833 2,40,896 945
9 Srikakulam 1,43,835 1,37,202 954
10 Vizianagaram 1,23,300 1,18,357 960
11 Visakhapatnam 2,30,630 2,21,583 961
12 West Godavari 1,94,960 1,87,927 964
13 East Godavari 2,65,244 2,56,810 968
Andhra Pradesh 26,86,453 25,35,931 944
S.No. DistrictMale
Literates
Female
Literates
Literates Sex
Ratio
1 Kurnool 12,46,369 8,80,792 707
2 Prakasam 11,07,686 7,96,749 719
3 Cuddapah 9,94,699 7,22,067 726
4 Anantapur 13,38,474 9,72,486 727
5 Srikakulam 8,57,824 6,37,557 743
6 Vizianagaram 7,07,503 5,30,885 750
7 Chittoor 14,84,794 11,83,084 797
8 Visakhapatnam 14,22,878 11,45,371 805
9 Nellore 10,11,922 8,20,267 811
10 Guntur 16,34,726 13,25,715 811
11 Krishna 15,98,959 14,10,759 882
12 East Godavari 17,16,933 15,71,644 915
13 West Godavari 13,79,223 12,73,166 923
Andhra Pradesh 1,65,01,990 1,32,70,542 804
45
Andhra Pradesh MAY2014
Source: Population Census (2011)
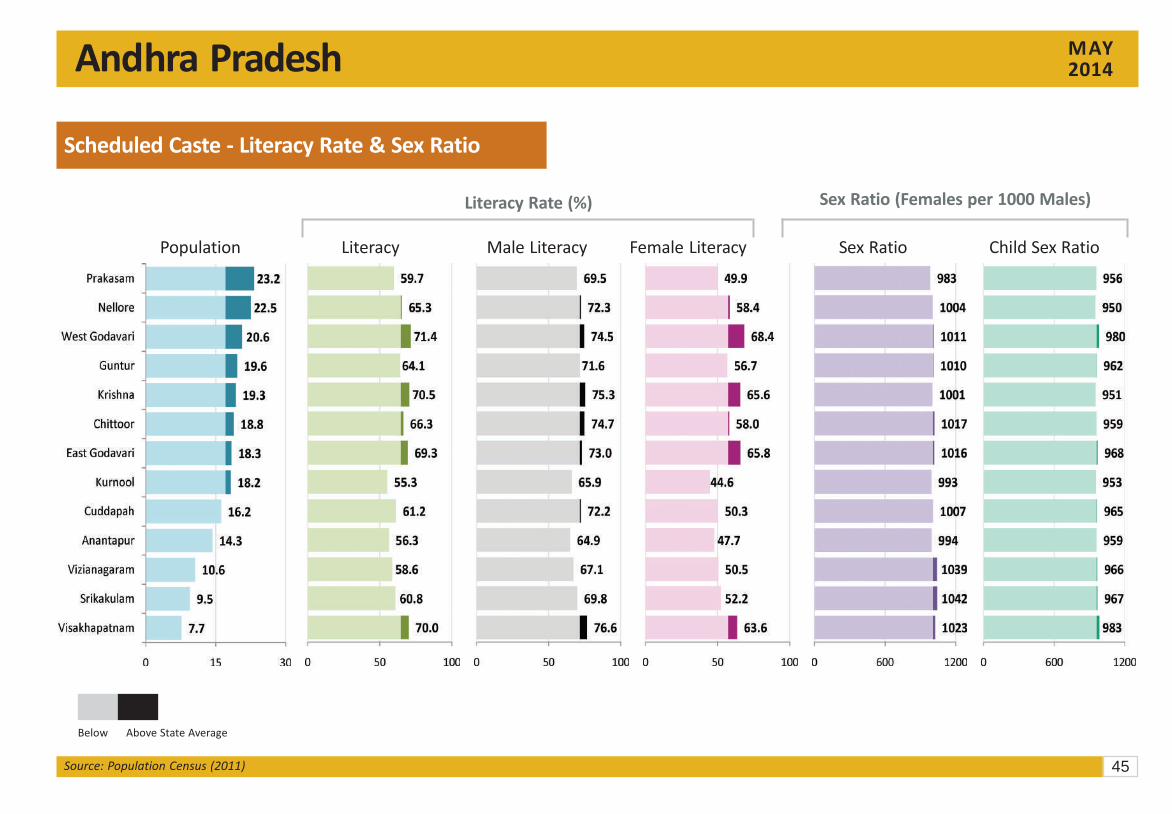
Scheduled Caste - Literacy Rate & Sex Ratio
Literacy Rate (%) Sex Ratio (Females per 1000 Males)
Male Literacy Sex Ratio Child Sex RatioLiteracyPopulation Female Literacy
Below Above State Average
46
Andhra Pradesh
MAY2014
Source: Population Census (2011)
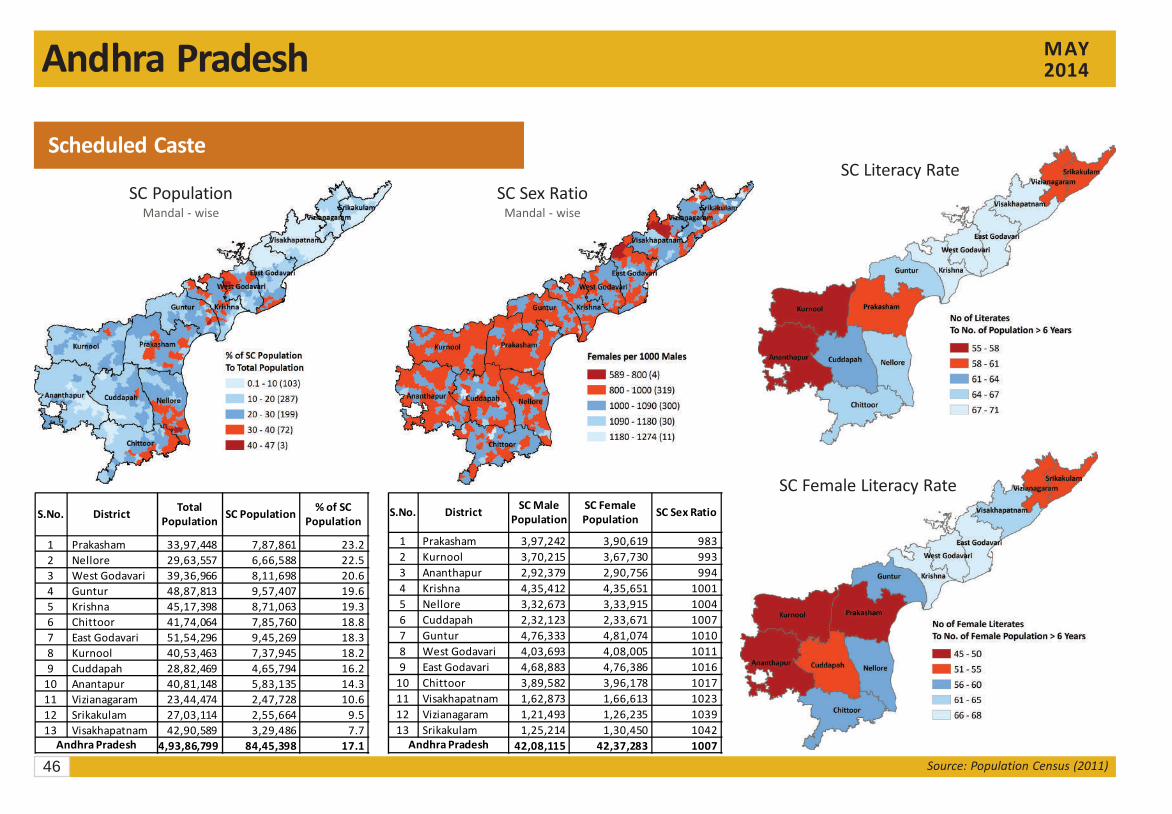
Scheduled Caste
SC PopulationMandal - wise
SC Sex RatioMandal - wise
SC Literacy Rate
SC Female Literacy Rate
S.No. DistrictTotal
PopulationSC Population
% of SC
Population
1 Prakasham 33,97,448 7,87,861 23.2
2 Nellore 29,63,557 6,66,588 22.5
3 West Godavari 39,36,966 8,11,698 20.6
4 Guntur 48,87,813 9,57,407 19.6
5 Krishna 45,17,398 8,71,063 19.3
6 Chittoor 41,74,064 7,85,760 18.8
7 East Godavari 51,54,296 9,45,269 18.3
8 Kurnool 40,53,463 7,37,945 18.2
9 Cuddapah 28,82,469 4,65,794 16.2
10 Anantapur 40,81,148 5,83,135 14.3
11 Vizianagaram 23,44,474 2,47,728 10.6
12 Srikakulam 27,03,114 2,55,664 9.5
13 Visakhapatnam 42,90,589 3,29,486 7.7
Andhra Pradesh 4,93,86,799 84,45,398 17.1
S.No. DistrictSC Male
Population
SC Female
PopulationSC Sex Ratio
1 Prakasham 3,97,242 3,90,619 983
2 Kurnool 3,70,215 3,67,730 993
3 Ananthapur 2,92,379 2,90,756 994
4 Krishna 4,35,412 4,35,651 1001
5 Nellore 3,32,673 3,33,915 1004
6 Cuddapah 2,32,123 2,33,671 1007
7 Guntur 4,76,333 4,81,074 1010
8 West Godavari 4,03,693 4,08,005 1011
9 East Godavari 4,68,883 4,76,386 1016
10 Chittoor 3,89,582 3,96,178 1017
11 Visakhapatnam 1,62,873 1,66,613 1023
12 Vizianagaram 1,21,493 1,26,235 1039
13 Srikakulam 1,25,214 1,30,450 1042
Andhra Pradesh 42,08,115 42,37,283 1007
47
Andhra Pradesh MAY2014
Source: Population Census (2011)
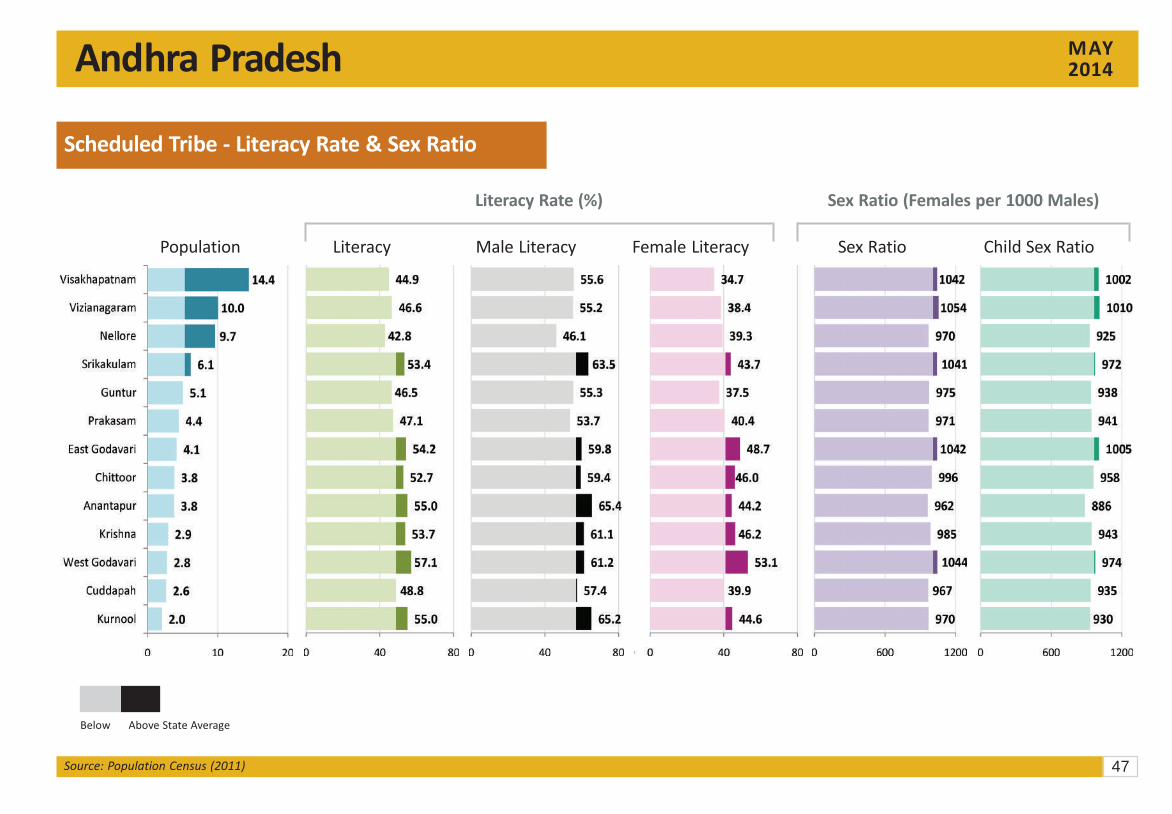
Scheduled Tribe - Literacy Rate & Sex Ratio
Literacy Rate (%) Sex Ratio (Females per 1000 Males)
Population Literacy Male Literacy Female Literacy Sex Ratio Child Sex Ratio
Below Above State Average
48
Andhra Pradesh
MAY2014
Source: Population Census (2011)
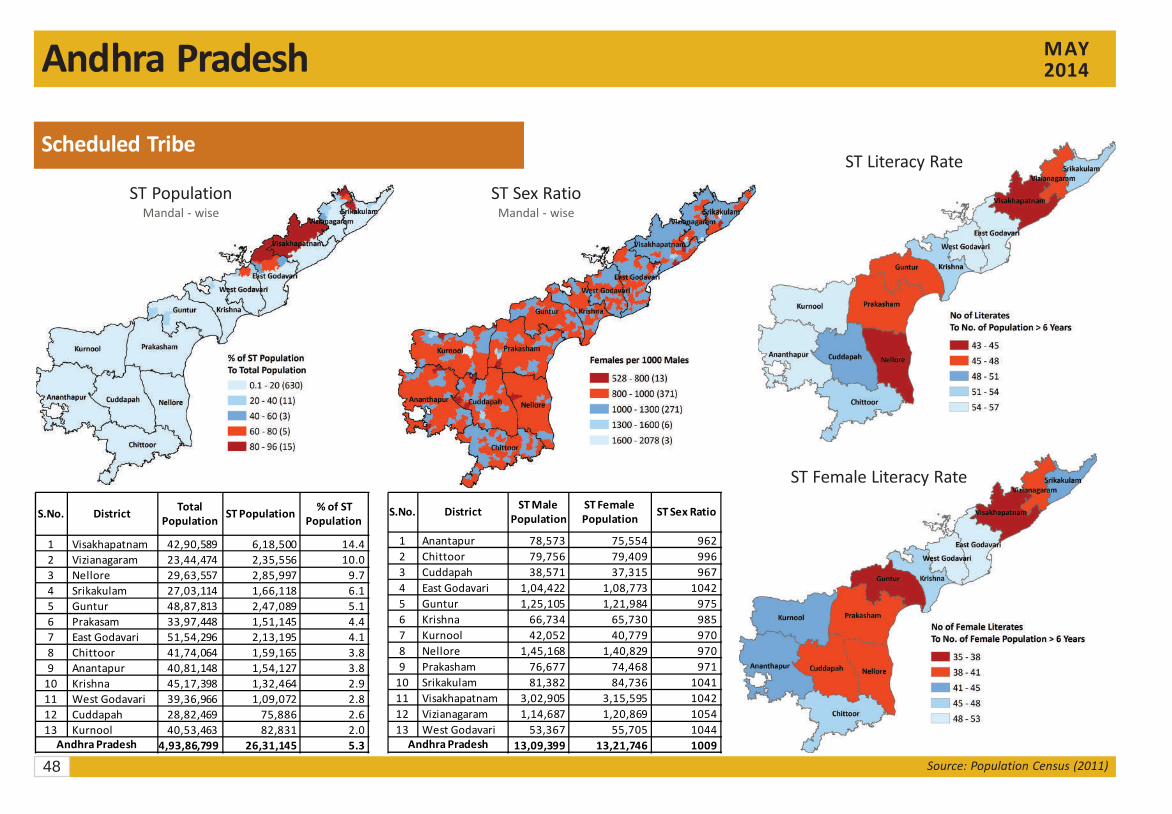
Scheduled Tribe
ST PopulationMandal - wise
ST Sex RatioMandal - wise
ST Literacy Rate
ST Female Literacy Rate
S.No. DistrictTotal
PopulationST Population
% of ST
Population
1 Visakhapatnam 42,90,589 6,18,500 14.4
2 Vizianagaram 23,44,474 2,35,556 10.0
3 Nellore 29,63,557 2,85,997 9.7
4 Srikakulam 27,03,114 1,66,118 6.1
5 Guntur 48,87,813 2,47,089 5.1
6 Prakasam 33,97,448 1,51,145 4.4
7 East Godavari 51,54,296 2,13,195 4.1
8 Chittoor 41,74,064 1,59,165 3.8
9 Anantapur 40,81,148 1,54,127 3.8
10 Krishna 45,17,398 1,32,464 2.9
11 West Godavari 39,36,966 1,09,072 2.8
12 Cuddapah 28,82,469 75,886 2.6
13 Kurnool 40,53,463 82,831 2.0
Andhra Pradesh 4,93,86,799 26,31,145 5.3
S.No. DistrictST Male
Population
ST Female
PopulationST Sex Ratio
1 Anantapur 78,573 75,554 962
2 Chittoor 79,756 79,409 996
3 Cuddapah 38,571 37,315 967
4 East Godavari 1,04,422 1,08,773 1042
5 Guntur 1,25,105 1,21,984 975
6 Krishna 66,734 65,730 985
7 Kurnool 42,052 40,779 970
8 Nellore 1,45,168 1,40,829 970
9 Prakasham 76,677 74,468 971
10 Srikakulam 81,382 84,736 1041
11 Visakhapatnam 3,02,905 3,15,595 1042
12 Vizianagaram 1,14,687 1,20,869 1054
13 West Godavari 53,367 55,705 1044
Andhra Pradesh 13,09,399 13,21,746 1009
49
Andhra Pradesh MAY2014
Source: Population Census (2011)
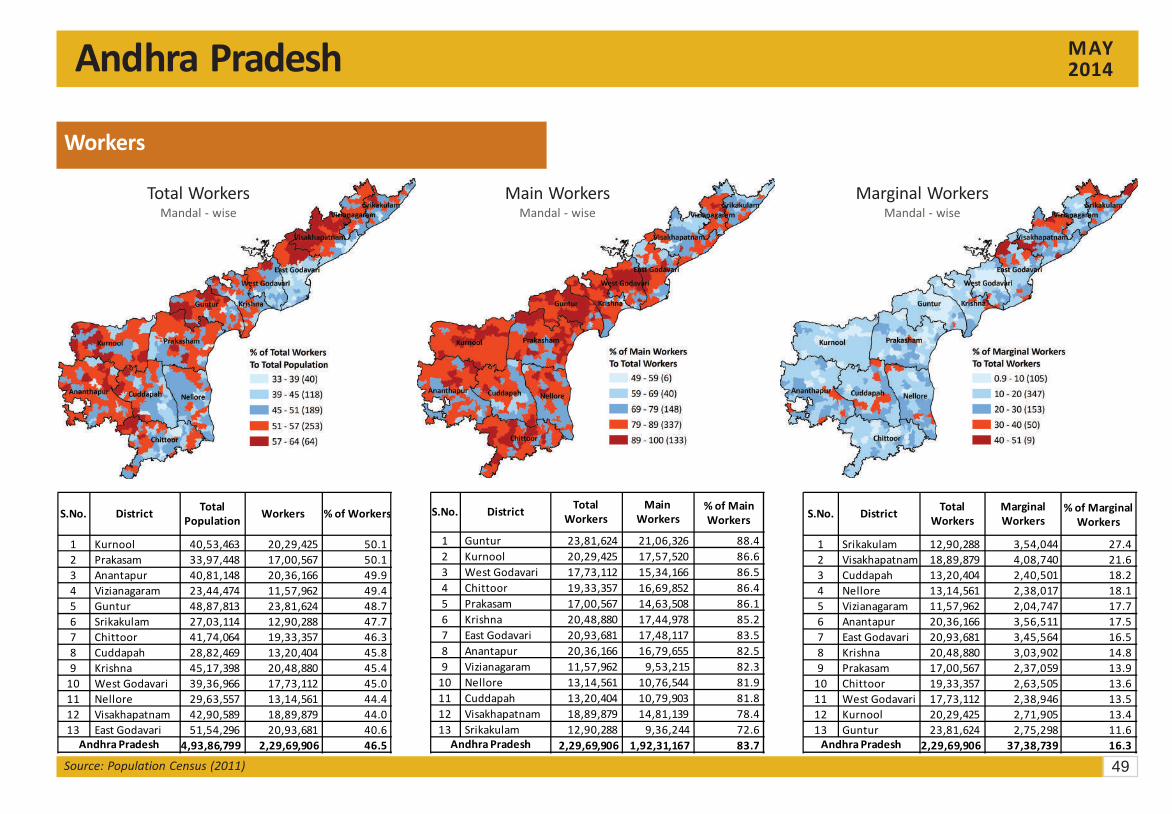
Workers
Total WorkersMandal - wise
Main WorkersMandal - wise
Marginal WorkersMandal - wise
S.No. DistrictTotal
PopulationWorkers % of Workers
1 Kurnool 40,53,463 20,29,425 50.1
2 Prakasam 33,97,448 17,00,567 50.1
3 Anantapur 40,81,148 20,36,166 49.9
4 Vizianagaram 23,44,474 11,57,962 49.4
5 Guntur 48,87,813 23,81,624 48.7
6 Srikakulam 27,03,114 12,90,288 47.7
7 Chittoor 41,74,064 19,33,357 46.3
8 Cuddapah 28,82,469 13,20,404 45.8
9 Krishna 45,17,398 20,48,880 45.4
10 West Godavari 39,36,966 17,73,112 45.0
11 Nellore 29,63,557 13,14,561 44.4
12 Visakhapatnam 42,90,589 18,89,879 44.0
13 East Godavari 51,54,296 20,93,681 40.6
Andhra Pradesh 4,93,86,799 2,29,69,906 46.5
S.No. District Total
Workers
Main
Workers
% of Main
Workers
1 Guntur 23,81,624 21,06,326 88.4
2 Kurnool 20,29,425 17,57,520 86.6
3 West Godavari 17,73,112 15,34,166 86.5
4 Chittoor 19,33,357 16,69,852 86.4
5 Prakasam 17,00,567 14,63,508 86.1
6 Krishna 20,48,880 17,44,978 85.2
7 East Godavari 20,93,681 17,48,117 83.5
8 Anantapur 20,36,166 16,79,655 82.5
9 Vizianagaram 11,57,962 9,53,215 82.3
10 Nellore 13,14,561 10,76,544 81.9
11 Cuddapah 13,20,404 10,79,903 81.8
12 Visakhapatnam 18,89,879 14,81,139 78.4
13 Srikakulam 12,90,288 9,36,244 72.6
Andhra Pradesh 2,29,69,906 1,92,31,167 83.7
S.No. District Total
Workers
Marginal
Workers
% of Marginal
Workers
1 Srikakulam 12,90,288 3,54,044 27.4
2 Visakhapatnam 18,89,879 4,08,740 21.6
3 Cuddapah 13,20,404 2,40,501 18.2
4 Nellore 13,14,561 2,38,017 18.1
5 Vizianagaram 11,57,962 2,04,747 17.7
6 Anantapur 20,36,166 3,56,511 17.5
7 East Godavari 20,93,681 3,45,564 16.5
8 Krishna 20,48,880 3,03,902 14.8
9 Prakasam 17,00,567 2,37,059 13.9
10 Chittoor 19,33,357 2,63,505 13.6
11 West Godavari 17,73,112 2,38,946 13.5
12 Kurnool 20,29,425 2,71,905 13.4
13 Guntur 23,81,624 2,75,298 11.6
Andhra Pradesh 2,29,69,906 37,38,739 16.3
50
Andhra Pradesh
MAY2014
Source: Population Census (2011)
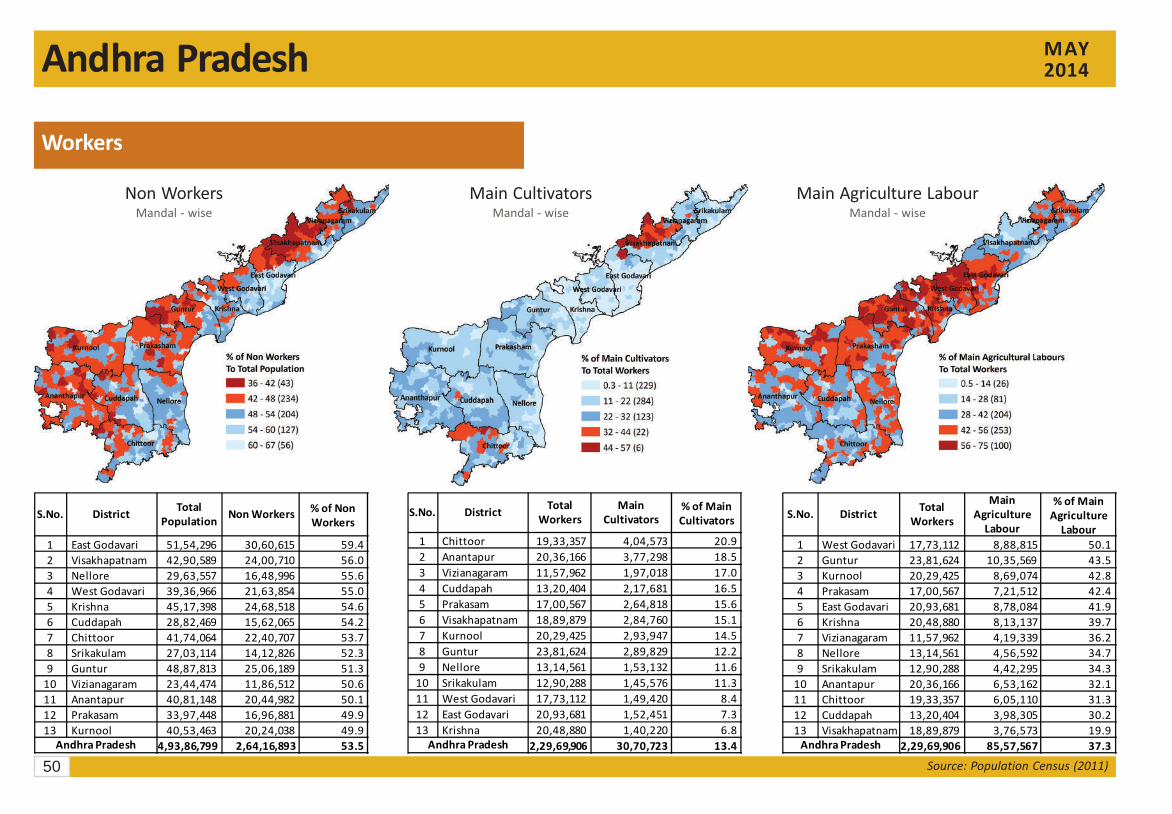
Non WorkersMandal - wise
Main CultivatorsMandal - wise
Main Agriculture LabourMandal - wise
Workers
S.No. District Total
PopulationNon Workers
% of Non
Workers
1 East Godavari 51,54,296 30,60,615 59.4
2 Visakhapatnam 42,90,589 24,00,710 56.0
3 Nellore 29,63,557 16,48,996 55.6
4 West Godavari 39,36,966 21,63,854 55.0
5 Krishna 45,17,398 24,68,518 54.6
6 Cuddapah 28,82,469 15,62,065 54.2
7 Chittoor 41,74,064 22,40,707 53.7
8 Srikakulam 27,03,114 14,12,826 52.3
9 Guntur 48,87,813 25,06,189 51.3
10 Vizianagaram 23,44,474 11,86,512 50.6
11 Anantapur 40,81,148 20,44,982 50.1
12 Prakasam 33,97,448 16,96,881 49.9
13 Kurnool 40,53,463 20,24,038 49.9
Andhra Pradesh 4,93,86,799 2,64,16,893 53.5
S.No. District Total
Workers
Main
Cultivators
% of Main
Cultivators
1 Chittoor 19,33,357 4,04,573 20.9
2 Anantapur 20,36,166 3,77,298 18.5
3 Vizianagaram 11,57,962 1,97,018 17.0
4 Cuddapah 13,20,404 2,17,681 16.5
5 Prakasam 17,00,567 2,64,818 15.6
6 Visakhapatnam 18,89,879 2,84,760 15.1
7 Kurnool 20,29,425 2,93,947 14.5
8 Guntur 23,81,624 2,89,829 12.2
9 Nellore 13,14,561 1,53,132 11.6
10 Srikakulam 12,90,288 1,45,576 11.3
11 West Godavari 17,73,112 1,49,420 8.4
12 East Godavari 20,93,681 1,52,451 7.3
13 Krishna 20,48,880 1,40,220 6.8
Andhra Pradesh 2,29,69,906 30,70,723 13.4
S.No. District Total
Workers
Main
Agriculture
Labour
% of Main
Agriculture
Labour
1 West Godavari 17,73,112 8,88,815 50.1
2 Guntur 23,81,624 10,35,569 43.5
3 Kurnool 20,29,425 8,69,074 42.8
4 Prakasam 17,00,567 7,21,512 42.4
5 East Godavari 20,93,681 8,78,084 41.9
6 Krishna 20,48,880 8,13,137 39.7
7 Vizianagaram 11,57,962 4,19,339 36.2
8 Nellore 13,14,561 4,56,592 34.7
9 Srikakulam 12,90,288 4,42,295 34.3
10 Anantapur 20,36,166 6,53,162 32.1
11 Chittoor 19,33,357 6,05,110 31.3
12 Cuddapah 13,20,404 3,98,305 30.2
13 Visakhapatnam 18,89,879 3,76,573 19.9
Andhra Pradesh 2,29,69,906 85,57,567 37.3