analysis of trends in sex ratio - unimondo.org of... · 3 summary increasing masculinity child sex...
TRANSCRIPT

ANALYSIS OF TRENDS IN SEX RATIO AT BIRTH OF HOSPITALISED DELIVERIES IN THE STATE OF DELHI
Joe Varghese Vijay Aruldas
Panniyammakal Jeemon
July, 2005
Christian Medical Association of India A-3, Janakpuri, New Delhi 110 058, India

2
Acknowledgement
This study has been undertaken with the help of
Office of the Registrar General of India The authors have benefited immensely from the discussions with Dr. Jayant Kumar
Banthiya [Former Registrar General and Census Commissioner] and Mr. Narayanan
Unni [Deputy Registrar General, Census].

3
Summary Increasing masculinity child sex ratio in different parts of India has been an important
aspect noted in the last few census reports of India. The misuse of medical technology
for the identification of the sex of the child before birth and selective abortion of female
fetuses is considered as the major reason for that. The State of Delhi is one of the
affected areas in the country with severe demographic imbalance in child sex ratio.
The study is an attempt to identify the emerging pattern of sex ratio at birth [SRB] of
hospitalised deliveries in the state of Delhi and various demographic and socio-
economic factors affecting it based on certain available hospital data.
In the first stage of the study, SRB of eight large hospitals for ten-year period from 1993
to 2002 is calculated to examine any emerging trend. In the next stage, certain socio-
economic and demographic variables are correlated with the SRB estimates from about
11,268 birth information of the year 2000 and 2001 available with one of the hospital.
Births are taken as the unit of analysis and SRB is used as the indicator for sex selective
abortions.
Ten-year study of SRB of hospitalised deliveries shows sharp increasing trends in
masculinity from the beginning of the study period 1993/94 till 1997/98 period and
thereafter stopped further worsening. Existence of intensive son preference is evident
from the estimation of SRB according to the order of birth and sex composition of the
previous children. Most of the sex selective abortions are occurring for the second or
higher order of birth when the previous children are females. SRB is as high as 4.56
(219 girls per 1000 boys) for the 3rd order of birth when both the earlier children are
females. Contrary to the popular perception, education status of parents does not
produce any desired result on family’s decisions to go for sex selective abortions. Result
also indicates the positive influence of women’s employment status in bringing down the
severity of son preferences.
In the background of intense son preference, any vigorous measures for control of
population growth in India will be disastrous for the SRB, which is already highly skewed
against females. The families that are already having girl children should be given a
major attention for actions for preventing sex selective abortions. Interventions focusing
far-reaching social changes in improving value of girl child, increasing female autonomy
and women’s opportunity in employment etc are likely to change the current scenario.

4
Introduction Sex Ratio At Birth [SRB] refers to the ratio of male to female children born in a
specific period or all the children ever born to a cohorts of women. In all human
populations, there is a fairly stable Sex Ratio At Birth observed in countries with
good vital registration which is approximately 104 to 106 boys per hundred girls
[Census of India, 2001]. This advantage is because of the conception more boys
than the girls even though there is increased male foetal loss than female fetuses
during gestation period. Evidences suggest that unless there is conscious effort
at intervention by humans, the sex ratio at birth will not change even over a
century [Visaria L, 2002]. However in some regions of the world especially in the
south and East Asia the strong preference for sons have distorted the SRB. The
abnormal SRB have been found to be due to widely prevalent sex selective
practices.
The strong patriarchal values in certain societies are reflected in their practices.
Son preference has been one of the most evident manifestations of patriarchal
society which depict the powerlessness of women within such societies. 1980
onwards, in countries like China where there is strong population control
programmes, the fertility decline intensified the manifestation of son preference
[Zhao 2000]. In India too with the declining fertility combining with the persistence
of strong preference for sons, parents are taking steps to ensure the birth and
survival of the sons compared with the females.
Over the years, the son preference in India had worked against the female sex
particularly in their infancy and early childhood. She is discriminated against in
many ways – ranging from abandonment of girl children, fewer months of breast
feeding, less of nurturing and play, lesser medical treatment if falls ill etc- all
working against the very existence of girl children. The level of discrimination
comparatively reduces the chances of survival girl children is clearly evident by
the differential child mortality among boys and girls [Agnihotri, 2001, Miller 1989,
Das Gupta,1987]. Dreze and Sen [1995] have pointed out that the persistence of
gender inequality and female deprivation are among India’s serious social
failures. Today, with the technological advancement in medical diagnosis this

5
discrimination begins even before her birth. Various medical technologies have
been put into practice to identify the sex of the child before the birth and selective
abortion, if found female. Of the various medical technologies, ultra sound
machines are the most misused one in the sex selective practices [Ganathra,
2001]. Evidences shows growing incidence of pre-birth elimination of the girl
children in India [Sabu George,1998].
Trends in juvenile sex ratio in India The data on child sex ratio provides a broad indicator of the ground realities as
they exist in the fabric of our society in its attitude and outlook towards the girl
child.[Census of India, 2001] The Juvenile sex ratio in India as published by the
last few census reports show enormous masculinity. According to the 2001
census report, while the overall sex ratio has increased from 927 females per
1000 males to 933 females per 1000 males, the Child Sex Ratio of 0 – 6 has
reduced from 945 to 927girl children per 1000 male children. The child sex ratio
at birth of 927 for the country as a whole is less than the universal sex ratio at
birth. Of the total of 577 districts in the country, 48 districts showed inordinately
low levels of child sex ratio of below 850. In the 1991 census report not a single
district showed child sex ratio below 800. It is shocking to note that in next 10
years, 16 districts fell under this category. There were as many as forty eight
districts where child sex ratio is under 850 during 2001, while there was only one
districts in 1991. It is difficult to comprehend that as many as 456 districts
constituting 79 per cent of all districts in the country have registered a decline of
child sex ratio between 1991-2001. Of these, in seventy districts the decline is in
the order of over fifty points.
The State of Delhi is one of the severely affected areas with severe demographic
imbalance in child sex ratio. The over all child sex ratio in Delhi is 865 with 6 out
9 of its districts showing a drastic drop [more than 50 points] over the past one
decade.
Factors determining the son preference Son preference is deeply entrenched and has its social and economic basis.
Various earlier studies and the census figures are suggestive to a certain extent

6
the association of son preference to various socio-cultural, economic and certain
demographic factors. In south Asian countries such as India, South Korea and
China not only do sons have important roles in rituals, they may be the only
source of support for the parents for the old age [Zhao,2000; Chen et al, 1981;
Dasgupta, 1987].
One anticipated correlation was that between the rising women’s status in terms
of entry into education and employment and reduced son preference or
dependence. However a number of demographic researches show that daughter
discrimination continues to occur in populations where women enjoy education
and employment [Croll, 2002]. A study on the impact of son preference among
north Vietnamese community suggests ‘more empowered female adults are
more likely to resort to modern strategies in order to have a son, such as sex
selective abortions’ [Belenger, 2002]. The national census data shows that most
regions characterized by the adverse child sex ratio are the advanced regions of
India in terms of per capita income as well as literacy level [Census of India,
2001]. The data also shows more adverse child sex ratio in urban areas, though
the urban areas are characterized by higher literacy level especially among the
females, more employment opportunities for women etc.
A study of the sex ratio at birth [estimated indirectly from SRS data] of select six
states in India indicates its association with the socio-economic conditions, total
fertility rate and mother’s mean age at fertility [Dutta P, 2001]. The examination of
the patriarchal societies of Asia noted that the combination of fertility decline and
son preference triggers the incentive for sex selective abortion [Zhao,2000,
Bairagi, 2001]. The effect of the sex composition of previous children on
subsequent fertility reveals the intensity of son preference in the Chinese society
[Wen 1992]. Various studies looking at the India context are also showing that
when the fertility declines and the preference for male children remains strong,
parents still take the steps to ensure the birth and survival of male children
[Sudha and Irudaya Rajan: 1998, Clark and Shelly, 2000]. A study of female
foeticide in rural Haryana by Sabu and Dahiya [1998] had pointed at the linkages
between sex of the living children with the family organising strategies. The

7
assessment of sexual preferences of women in NFHS 2 also reveals the same. It
shows among women with two living children, the proportion wanting more
children is far greater among those with two daughters [53%] than those with two
sons [17%] [Remez L, 2001]. Another assessment of NFHS 2 data reveals the
association of high sex ratio at birth with geographic region, child’s birth order
and mothers number of living sons and two socio economic characters –
mother’s education and mother’s media exposure [Retherford, 2003]. A
community based study of the reasons of induced abortions shows that
husbands of the women undergoing sex selective abortions were less educated
than the husbands of other abortion seekers [Ganathra et all, 2001].
The study is an attempt to identify the emerging pattern of sex ratio at birth of
hospitalised deliveries in the state of Delhi and various demographic and socio-
economic factors affecting it based on certain available hospital based data. The
study is to evaluate the impact of son preference under conditions of social and
economic development, changes in fertility etc on sex ratio at birth.
Objectives of the study 1. To understand the trends in sex ratio at birth of last 10 years among hospital
deliveries in Delhi
2. To identify the effect of different demographic and socio-economic factors on
the sex ratio at birth.
Justification of the study
The widespread misuse of medical technologies for the selective elimination of
the female foetuses had evoked the civil society response for long in India.
Unfortunately, a law enacted in 1996 to regulate pre-natal diagnostic techniques
and prevent sex selection was very laxly implemented resulting in the rampant
malpractice. Very recently, for the last three years, the country had witnessed an
intensification of campaign against sex selection by the civil society with the
judicial intervention following a public interest litigation by Cehat, Masum and
Sabu George and also with the alarming revelation of demographic profile [0-6
sex ratio] brought out by the national census 2001. The Law implementation
machinery was also revamped as evident by the increase in the registration of

8
the ultra-sound machines though out the country. In the state of Delhi, both the
civil society action and the government law enforcement mechanisms were on an
upsurge over this period. Whether this has changed the ground realities in terms
of reduction in the elimination of female fetuses need to be further probed.
Studying the trend in the sex ratio at birth from different hospitals over the last 10
years is expected to provide this information.
Much of the evidence on the spread of sex selective abortion in India is
anecdotal. There is no reliable statistics on the practice at either state or national
level [Retherford, Roy 2003]. The main determinants in the child sex ratio are sex
selective mortality, sex selective migration and sex selective omission on
enumeration and sex ratio at birth. The first three reasons can confuse in drawing
conclusions on the actual severity of sex selective abortions. In a state like Delhi
selective migration of families coming only with the male children are often sited
as one reason for the skewed child sex ratio [Times of India, 2002]. Visaria
[2002] opinions that the contribution of sex selective abortion on the sex ratio at
birth requires a careful analysis of data from various sources, such as SRS,
census and birth records from hospitals or institutions. It was further stressed that
more data is needed on the extent of female foeticide, the demographic and
socioeconomic status of women who undergoes sex selective abortions.
Information on sex ratio at birth is likely to reflect more light in to the actual
scenario. According to Sudha and Raja [1998], in India available data help us to
understand the juvenile sex ratio rather than sex ratio at birth. They too emphasis
the need to have future research examining the demographic behaviors in India
from a gendered perspective that scrutinises the nexus between cultural and
economic factors and household organisation and strategies. Vina Mazundar in
comparison of studies on sex selection practices using foeticide and infanticide
have pointed out the lack of information on cast, culture and life styles of those
who practice foeticide practices.
Data and Methods The study is based on the data available with the birth records of select large
hospitals in Delhi. Births are the unit of analysis and sex ratio at birth [SRB]

9
based on the hospital birth is the indicator for sex selective abortions. The study
is designed in two stages. In the first stage of the study each year’s SRB of eight
hospitals for the previous 10 years will be calculated and plotted on a graph to
examine any emerging trend. The birth data was collected from three public
sector hospitals and five private hospitals belonging to various geographical
areas of the state. The state of Delhi, being well connected with roads and public
transport system, it is assumed that people do not have geographical preference
in accessing any of these large hospitals.
In the next stage of the study, socio-economic and demographic variables were
correlated with the SRB estimates from about 12,000 birth information of the year
2000 and 2001 available with one of the hospital. The hospital is purposely
selected for the study because of the availability and accessibility of the data.
Based on the existing evidences and data availability the study conceptualises
the relationship between sex ratio at birth with the following predictor variables.
In the analysis of the data, births are the unit of analysis. SRB for various
categories were calculated as number of boys born divided by number of girls
born based on the indexed birth of hospital records during the year 2000 and
2001. SRB is used as an indirect indicator for sex selective abortions. Each of
the variables is correlated with the SRB to identify the relation between them.
Socio-economic factors
• Occupation of father • Occupation of mother • Education of mother • Education of father
Demographic factors • sex of the living
children • order of birth • Age of the mother • Age of father
Sex of the child

10
Education of parents is taken as a continuous variable and is calculated as the
minimum number of years of study required in reaching the reported educational
qualification. Religion is categorised into three as Hindu, Muslim and other
religions that include Sikh, Christian and others. The occupation of mother is
categorised into following three-
1. high-end professional job which are comparatively high salaried and require
professional education [doctor, engineer, advocate, teacher, nurse],
2. all other employed as employed and
3. those who are reported as housewife as ‘not employed outside home’
Occupation of father is categorised into five
1. ‘high end professional job’ as defined in the case of mother
2. business
3. ‘working in unorganised sector’ as those who are likely to have
comparatively minimal daily wages [servant, auto driver, carpenter, sweeper,
coolie, milkman, gardener, helper, tailor, driver, hawker, security guard,
labourer] and
4. all other employed as ‘employed’
Results Part 1 Trends in the Sex Ratio at Birth of Hospitalised deliveries of Delhi The trend is calculated from the data of hospitalised deliveries of eight large
hospitals of Delhi for ten year period between the year1993 and 2002. These
hospitals belong to various geographical locations in the state of Delhi. Analysis
is pertaining to a total of 375499 births in ten years of which 249964 are from the
government hospitals and 125535 are from the private hospitals. The SRB of
total births of the study hospitals in ten year is 115, that of the government
hospitals is 113 and private hospitals is 120 boys per 100 girls. The total number
of births in each year is as given in the table no. 1. On an average, the data is
pertaining to about 37550 births per year. As per the SRS data [2002], the birth
rate for the state of Delhi is 20.3 for the year 1996-1998. Applying the same

11
crude birth rate to the population of Delhi according to the 2001 census
[13,782,976], it can be estimated that 279794 births are taking place in Delhi
every year. Since only 59% of births are taking place in health facilities [NFHS–
2] the sample is roughly about 23% of hospitalised deliveries of Delhi.
Table No. 1 Total Number of births in the study hospitals each year Year Number of births
1993 34707
1994 36064
1995 37262
1996 36512
1997 37701
1998 35317
1999 39852
2000 40039
2001 39229
2002 38816
The trend in SRB over the ten year period is verified by calculating the floating
average of three years and plotted on the graph as given below [Figure 1]. Figure 1 Three-year floating average SRB of hospitalised deliveries of Delhi [ between 1993- 2002]
S e x R a tio A t B irth
1 0 61 0 81 1 01 1 21 1 41 1 61 1 81 2 0
1 9 9 3 -9 4 -9 5
1 9 9 4 -9 4 -9 6
1 9 9 5 -9 6 -9 7
1 9 9 6 -9 7 -9 8
1 9 9 7 -9 8 -9 9
1 9 9 8 -9 9 -0 0
1 9 9 9 -0 0 -0 1
0 0 -0 1 -
2 0 0 2

12
The above figure shows increasing SRB trend from 1993-95 period [111 boys per
100 girls] onwards up to the period of 1996-98 where it reached 117 boys per
1000 girls. There after SRB shows slight reversal of the trend. The data shows
that for the next few years it remains between 116 to 118 boys per 100 girls.
Part 2 Correlates of Sex Ratio at Birth of hospitalised deliveries The results are pertaining to the detailed birth information for the year 2000 and
2001 that was collected from one of the study hospital. There were 11267 births
occurred in the hospital in the two-year study period, SRB of which is 1.24. The
SRB for the year 2001 is 1.18 and that of the year 2000 is 1.30. All the following
analysis are done for both the years together. The birth information are taken
from the labour room records which are entered in the just before and after the
delivery as reported by the mother.
SRB by birth order and sex of previous children The study population comprises of 56.2% first order births, 36.8% are second
birth order and 10.6% as third or higher order of birth. Sex Ratio at Birth by
number of existing children indicates the intensity of sex selection in the higher
order of births. It can be seen from the figure 3 that the SRB for the first order of
birth is 107, which falls slightly above the normal range showing that only minimal
sex selection happening for the first child. However for the 3rd and above order of
birth, SRB is significantly masculine at 247 boys per 100 girls. This in other
words explains that there are only about 30 percent chance for a girl to be born in
3+ birth orders. The Chi-squire trend analysis has also produced the same
results as presented in the table No.2. Trend is statistically significant (∝ 2 P
value < 0.000) Figure 2 SRB by Birth Order
Se x R atio At B irth
10 7 1 3 824 7
01 002 003 00
1 2 3+
Birth Orde r
SRB

13
Table 2 Sex selection at higher birth order; chi-squire trend analysis Birth Order Present child
male Present child female
Mental Haenzel Odds Ratio
(∝2 P value)
1 3085 2853 1 2 2412 1763 1.27 3+ 855 348 2.27
< 0.000
SRB by birth order may conceal the intensity of the sex selective abortions, if the
sex selective abortions are happening to eliminate both boys and girls to achieve
ideal sex composition of children. Therefore to capture the realistic picture of sex
selective abortions that are occurring, it is necessary to examine SRB by both
birth order and sex composition of the previous children. Table 3 shows that, as
expected, the sex composition of the existing children is an important
determinant for the sex of the next child. The difference is very conspicuous for
the second child depending on whether the first child is a boy or a girl. The SRB
for the second order birth for those who have already one male child is 1.04 [959
girls per 1000 boys], which is within the range of normally occurring SRB.
However when the first child is a girl, the SRB for the second order of birth is as
high as 1.85 [542 girls per 1000 boys]. Similarly, SRB is as high as 4.56 [219
girls per 1000 boys] for the 3rd order birth when both the earlier children are girls. Table 3 SRB by sex of the previous children
Birth Order
Sex composition of previous
Children
N
Number of female birth per 1000
male birth
SRB Hospitalised Deliveries
One male child 2091 959 1.04 2nd order One female child 2075 542 1.85
One male child and one female
child
391 558 1.79
Two male children
161 894 1.12
3rd
Order
Two female children
474 219 4.56
Irrespective of order of birth the number of previous children had a significant
impact on the sex of the present child. Conversely, there is a ‘dose response’
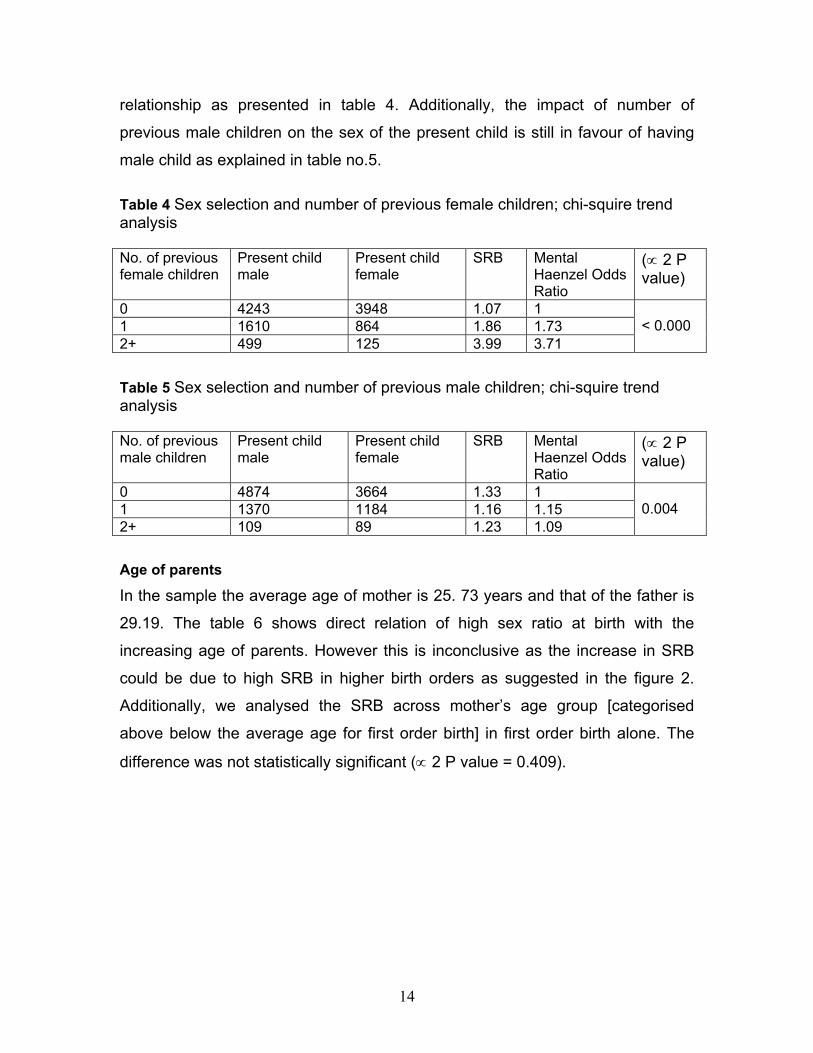
14
relationship as presented in table 4. Additionally, the impact of number of
previous male children on the sex of the present child is still in favour of having
male child as explained in table no.5. Table 4 Sex selection and number of previous female children; chi-squire trend analysis No. of previous female children
Present child male
Present child female
SRB Mental Haenzel Odds Ratio
(∝ 2 P value)
0 4243 3948 1.07 1 1 1610 864 1.86 1.73 2+ 499 125 3.99 3.71
< 0.000
Table 5 Sex selection and number of previous male children; chi-squire trend analysis No. of previous male children
Present child male
Present child female
SRB Mental Haenzel Odds Ratio
(∝ 2 P value)
0 4874 3664 1.33 1 1 1370 1184 1.16 1.15 2+ 109 89 1.23 1.09
0.004
Age of parents
In the sample the average age of mother is 25. 73 years and that of the father is
29.19. The table 6 shows direct relation of high sex ratio at birth with the
increasing age of parents. However this is inconclusive as the increase in SRB
could be due to high SRB in higher birth orders as suggested in the figure 2.
Additionally, we analysed the SRB across mother’s age group [categorised
above below the average age for first order birth] in first order birth alone. The
difference was not statistically significant (∝ 2 P value = 0.409).

15
Table 6 Age of parents
Age of mother
[Number of birth]
SRB
Number of female birth
per 1000 male birth
Age of father
[Number of birth]
SRB
Number of female
birth per 1000 male
birth Less than 24 years [3371]
1.11 902 Less than 27 years 1.16 860
Between 24 and 28
[ 5631]
1.26 792 Between 27 and 32 1.23 814
More than 28 [2325]
1.58 634 More than 32 1.6 627
Education of Parents The sample shows the average years of education of the mother is 12.59 years
and that of father is 13.26 years.
SRB of current births of those parents who have more than high school
education is 1.24 [806 female birth per 1000 male birth]. At the same time SRB of
parents with less than 10 years of education is 1.35 [739 female birth per 1000
male births]. A separate detailed examination SRB by education of father, mother
and both parents together [Table 8]shows similar trends as the level of education
goes up. It is interesting to note that the only category that has normal SRB is
when both the parents have minimal education. It also shows that SRB is highest
among those with medium levels of education [high school education].
Analysis of SRB of hospital deliveries shows that among parents who are
educated [more than 10 years of education] SRB is increasing with increase in
education. While SRB of the graduate parents is 1.23 [813 girls per 1000 boys]
for parents with postgraduate qualification it is 1.31 [769 girls per 1000 boys].
However the distribution of male and female children across various educational
categories (both parents) were not statistically significant at 5% ∝ level.

16
Table 8 SRB by education of parents Mother Father Both Parents
N
SRB
No. of female birth per
1000 male births
N
SRB
No. of female birth per
1000 male births
N
SRB
No. of female birth per
1000 male births
0 to 7years of schooling [up to middle school complete]
880
1.31
763
409
1.19
840
265
1.07
934
8 to 10 years of schooling [<middle school to high school complete]
2365
1.35
741
2051
1.45
690
1050
1.45
690
11 to 15 years of schooling [<high school to graduate]
6135
1.26
794
6995
1.24
807
4762
1.23
813
More than 15 years of education [higher than graduate education]
1887
1.30
769
1811
1.31
763
943
1.31
769
Occupation of Parents The table 9 shows different pattern of SRB for father and mother according to
their different occupational status. Mother’s better employment status has a
positive impact on SRB [as reflected by the declining masculinity of SRB] as it
moves from mothers who are not working outside home to those are employed in
high end job professional job.
Table 9 SRB by Occupation of Mother
Employment status of
mother
N
SRB
Number of female birth per 1000 male birth
High-end professional job 469 1.19 839 Employed 981 1.24 809
Not working outside home 9904 1.28 783

17
Further analysis of SRB among educated mothers [higher secondary complete
and above] categorised according their employment status is also showing
association of SRB with mothers’ employment status [Figure 3]. SRB for mothers
who are employed is 1.21 [827 girls per 1000 boys] compared to those who are
not working outside home [787 girls per 1000 boys]. Figure 3 Sex ratio at birth among Educated mothers [12 years or above of education]
Father’s employment status, the SRB value does not show any such trends, as
seen in the case of mothers [table 7]. In contrast to low SRB among mothers with
high-end professional jobs, SRB is relatively high when father is having high-end
professional employment. Table 7 SRB by Occupation of Father Employment status of Father
N
SRB Number of female birth
per 1000 male birth High end professional job 645 1.29 777
Employed 6930 1.26 793 Business 2896 1.26 796
Employed in the unorganised sector
644
1.36
736
Analysis of SRB according to both the parent’s occupation reinstate the fact that
SRB is consistently masculine when mother are not employed outside home.
Sex Ratio At Birth
1.21
1.27
1.181.2
1.221.241.261.28
Employed Not working outside home

18
Table 8 Occupation of Parents Occupation of father Occupation of
Mother
N
SRB Number of female birth per 1000 male birth
High-end professional job
Employed 197 1.17 859
High-end professional job
Domestic Work 448 1.35 743
Business + Farmer Employed 196 1.25 847 Business + Farmer Domestic work 2815 1.26 800 Employed Employed 1050 1.22 823 Employed Domestic work 6524 1.28 783
Discussion and Conclusions
In our analysis of ten-year hospital birth data of Delhi shows increasing trends in
SRB from 1993-94 period and then stabilises after 1997-98 period. The
information assumes importance when we relate this data with another set of
birth data of hospitalised deliveries of Delhi collected by Registrar General’s
office for five-year period of 1987 –92 [Raju and Premi, 1992]. The study, based
on about 35000 hospitalised births noted an increase in SRB from 1.06 in the
initial year to 1.09 in the last year. The present study also shows the continuation
of such trend up to the year 1997/98. The SRB of overall births of Delhi
estimated from the NFHS 1 [for the period 1978-92] and NFHS 2 [for the period
1984-98] also shows an increase from 1.11 to 1.12 [Retherford, Roy 2003]
From 1997-98 period onwards the sex ratio is hovering around 860 female birth
per 1000 male birth. This is slightly worse than the child sex ratio of 865
according to 2001 census for the state of Delhi. Even at this level the SRB is at a
dangerous point to produce serious social consequences in the coming future.
However it should be kept in mind that our estimate of hospital data has been

19
from large hospitals of Delhi, which may tend to differ from that of smaller nursing
homes, though we argue otherwise.
It is unclear that whether the stabilization of sex ratio from 1997-98 period has
any relation to the PNDT Act 1994, which came in to existence from 1996
onwards. If at all we attribute the stabilization factor to the 1994 Act, it could only
able to arrest further spread of misuse of technology and could not reduce the
level of malpractice that had been already happening.
Existence of intensive son preference is evident from the estimation of SRB
according to the order of birth and sex composition of the previous children. Most
of the sex selective abortions are occurring for the second or higher order of birth
when the previous children are females. There is also evidence that some
amount of sex selective abortions of girls are taking place for the third order birth
even while the families have existing children of both the sexes. NFHS-2 survey
[2000] has reported that women in Delhi wanted more number of sons than the
daughters. It shows that for an average ideal family size of 2.4 children, the
desired number of sons is 1.2 and daughters is 0.9 and 0.3 of either sex. It also
reports that the proportion of women expressing desire for a son increases with
the number of living children. Among women with two living children, 71 percent
want their next child to be a son, 10 percent want a daughter, and only 19
percent say that the sex of the child is up to God or does not matter.
Pressure on families to have male children is clearly evident from table 1
showing SRB by order of birth and sex of previous children. It also helps us to
visualize the picture of the probable nature of India’s population under any
coercive population control policies. Experience of China shows that coercive
population control policies did reduce couple’s demand for children, but did not
change their attitude towards having male children [Wen 1992, Zhirong [2000].
Any vigorous measures for control of population growth in India will be disastrous
for the SRB, which will be highly skewed against females.
The impact of parent’s education on SRB appears to be rather inconclusive.
Analysis shows a better SRB values for parents who are educated more than 10
years compared to those who are less educated. In the NFHS 2 report [2000] for

20
the state of Delhi has also noted that the son preference [as indicated by the
percentage who want more sons than daughters] is relatively week among
mothers with high school or more of education and also for women whose
husbands had completed higher secondary school. However study data hint that
there is no difference in the son preference among parents with different levels of
education.
This finding contradicts the popular belief that education helps to bring down the
gender disparities. The probable explanation for this unexpected finding is the
decreasing levels of fertility among the educated women forcing families to resort
to sex selective abortions to have their desired number of sons in a small family.
SRB according to employment status of mothers suggest the influence of
women’s economic empowerment in shaping the family organization strategies.
Women who are not working outside home show worse SRB figures compared to
those who are employed. Comparison of SRB figures according to the women’s
employment status and number of years of education strengthens the argument
that even improvements in women’s education unless resulted in employment
and therefore economic empowerment, may not alter the status of women in the
society. A community based study of sex selective abortions in the state of
Maharashtra also noted that women who seek abortions for sex selective
reasons appear to be differ from other abortion seekers; they have lesser
autonomy, weaker decision making power within the households and therefore
more vulnerable to produce male heirs [Ganatra,2001].
References 1. Agnihotri Satish, declining infant and child mortality in India, How do girl
children fare? Economic and Political Weekly, January 20, 2001
2. Bairagi Radheshyam; Effects of sex preference on contraceptive use,
abortion and fertility in Matlab, Bangladesh, International Family Planning
Perspectives, 2001, 27(3); 137-143
3. Belanger Daniele [2002], Son preference in rural village in north Vietnam,
Studies in Family Planning 2002; 33[4]; 321-334

21
4. Clark, Shelly; 2000; Son Preference and Sex Composition of Children:
Evidence from India; Demography 37(1): 95-108
5. Census of India 2001: Provisional Population Totals, Series 1; Registrar
General and Census Commissioner, India
6. Chen LC, Huq E, D’Souza: 1998, Sex bias in the family allocation of food and
health care in rural Bangladesh; Population and Development Review 7, No.
1, pp 55-70
7. Croll Elisabeth J, 2002, Fertility decline, family size and female discrimination;
A study of reproductive management in east and south Asia, Asia-Pacific
Population Journal, Vol. 17, No. 2, PP 11-37
8. Das Gupta M; 1987; Selective Discrimination against female children in rural
Punjab, India; Population and Development Review (13), No. 1 P 77 - 100
9. Dreze, J, Sen, A, [1996]; India: Economic Development and Social
Opportunity, Oxford University Press, Delhi
10. Dutta Paramita: Factors associated with sex ratio at birth: a case study based
on six selected states in India: IIPS; 2001
11. Ganatra Bela, Hirve Siddhi, Rao VN, Sex selective abortion: Evidence from a
community based study in western India, Asia-Pacific Population Journal,
2001, Vol.16, No. 2, pp 109- 123.
12. Miller DB 1989; Changing patterns of Juvenile sex ratios in rural India, 1961
to 1971; Economic and Political Weekly; June 3. 1989; P 1229 - 1236
13. Mutharayappa R, Choe MK, Arnold F and Roy TK ;1997, Effect of son
preference on fertility in India; NFHS subject report No. 3
14. National Family Health Survey [NFHS –2], India 2000; IIPS and ORC Macro:
International Institute for Population Sciences.
15. Raju S, Premi MK; Decline in sex ratio: Alternative explanation re-examined.
Economic and Political weekly, 1992; 27; 911-12.
16. Retherford D R, Roy TK [2003]; Factors affecting sex selective abortions in
India; National Family health Survey; Bulletin; No. 17
17. Retherford D R, Roy TK [2003]; Factors affecting sex selective abortions in
India;National Family health Survey, Subject Reports Number 21

22
18. Remez L [2001], Prevention of unwanted births in India would result in
replacement fertility; Digests; International Family Planning Perspectives; 27;
no. 2; pp 104-105
19. Sabu M george, Ranbir S Dahiya: Female foeticide in Rural Haryana:
Economic and Political Weekly 33(32): August 8-14, 1998: 2191-2198
20. Sudha S. Irudaya Rajan: Intensifying Masculinity of Sex ratio in India: New
Evidence 1981-1991: Centre for development studies, Thiruvananthapuram;
1998
21. Visaria Leela, 2002, Deficit of women in India: Magnitude, trends, regional
variations and determinants; The National Medical Journal of India; vol 15,
supplement 1; pp 19-25
22. Wen Xingyan [1992], ‘The effect of sex preference on subsequent fertility in
two provinces of China; Asia-Pacific Population Journal; Vol. 7, No. 4, PP 25-
40.
23. Zhao Zhirong [2000]; Controlling theskewed sec ratio at birth in China: An
implementation perspective; http://www.wiapp.org/spapers/zhaozr01.html,
Website in Institutional Analysis and Public Policy