analysis of substrate specificity and kinetics of cyclic ... · nucleotide phosphodiesterases with...
TRANSCRIPT
Analysis of Substrate Specificity and Kinetics of CyclicNucleotide Phosphodiesterases withN’-Methylanthraniloyl-Substituted Purine and Pyrimidine39,59-Cyclic Nucleotides by Fluorescence SpectrometryDaniel Reinecke1, Frank Schwede2, Hans-Gottfried Genieser2, Roland Seifert1*
1 Institute of Pharmacology, Hannover Medical School, Hannover, Germany, 2 Biolog Life Science Institute, Bremen, Germany
Abstract
As second messengers, the cyclic purine nucleotides adenosine 39,59-cyclic monophosphate (cAMP) and guanosine 39,59-cyclic monophosphate (cGMP) play an essential role in intracellular signaling. Recent data suggest that the cyclic pyrimidinenucleotides cytidine 39,59-cyclic monophosphate (cCMP) and uridine 39,59-cyclic monophosphate (cUMP) also act as secondmessengers. Hydrolysis by phosphodiesterases (PDEs) is the most important degradation mechanism for cAMP and cGMP.Elimination of cUMP and cCMP is not completely understood, though. We have shown that human PDEs hydrolyze not onlycAMP and cGMP but also cyclic pyrimidine nucleotides, indicating that these enzymes may be important for termination ofcCMP- and cUMP effects as well. However, these findings were acquired using a rather expensive HPLC/mass spectrometryassay, the technical requirements of which are available only to few laboratories. N’-Methylanthraniloyl-(MANT-)labelednucleotides are endogenously fluorescent and suitable tools to study diverse protein/nucleotide interactions. In the presentstudy, we report the synthesis of new MANT-substituted cyclic purine- and pyrimidine nucleotides that are appropriate toanalyze substrate specificity and kinetics of PDEs with more moderate technical requirements. MANT-labeled nucleoside39,59-cyclic monophosphates (MANT-cNMPs) are shown to be substrates of various human PDEs and to undergo asignificant change in fluorescence upon cleavage, thus allowing direct, quantitative and continuous determination ofhydrolysis via fluorescence detection. As substrates of several PDEs, MANT-cNMPs show similar kinetics to nativenucleotides, with some exceptions. Finally, they are shown to be also appropriate tools for PDE inhibitor studies.
Citation: Reinecke D, Schwede F, Genieser H-G, Seifert R (2013) Analysis of Substrate Specificity and Kinetics of Cyclic Nucleotide Phosphodiesterases withN’-Methylanthraniloyl-Substituted Purine and Pyrimidine 39,59-Cyclic Nucleotides by Fluorescence Spectrometry. PLoS ONE 8(1): e54158. doi:10.1371/journal.pone.0054158
Editor: Paolo Carloni, German Research School for Simulation Science, Germany
Received September 15, 2012; Accepted December 10, 2012; Published January 14, 2013
Copyright: � 2013 Reinecke et al. This is an open-access article distributed under the terms of the Creative Commons Attribution License, which permitsunrestricted use, distribution, and reproduction in any medium, provided the original author and source are credited.
Funding: This work was supported by Deutsche Forschungsgemeinschaft grant 529/5-2 to RS. The funders had no role in study design, data collection andanalysis, decision to publish, or preparation of the manuscript.
Competing Interests: The corresponding author Roland Seifert serves as Academic Editor for PLOS ONE. This does not alter the authors’ adherence to all thePLOS ONE policies on sharing data and materials.
* E-mail: [email protected]
Introduction
The cyclic purine nucleotides cAMP and cGMP are established
second messengers known to regulate numerous cellular functions
[1,2,3,4]. The role of cyclic pyrimidine nucleotides has been
discussed controversially in terms of natural occurrence [5,6,7,8],
generation [5,6], degradation [9,10,11] and function [12,13,14].
Recent studies have shown that the cyclic pyrimidine nucleotides
cUMP and cCMP are present in mammalian cells at levels similar
to cAMP and cGMP [15], that they are generated by soluble
guanylyl cyclase in presence of Mn2+ [16,17] and that their
production is regulated by nitric oxide and bicarbonate [16,18].
Various effector proteins for cCMP and cUMP have been
identified [17,19,20,21,22]. cCMP mediates vasodilatation and
inhibits platelet aggregation via cGMP kinase I [23]. Furthermore,
bacterial ‘‘adenylyl’’ Cyclase toxins act as cytidylyl- and uridylyl
cyclases [24]. Taken together, cCMP and cUMP possess several
properties that are characteristic for second messengers.
However, the assumed second messenger role of cCMP and
cUMP requires the existence of effective mechanisms of elimina-
tion for cCMP and cUMP. Referring to cAMP and cGMP, PDEs
limit their signals in terms of time and space [25,26,27].
Concerning pyrimidine nucleotides, two cCMP-degrading PDEs
were postulated [9,10]. A cUMP-cleaving PDE was found by
Hardman and Sutherland in homogenates of bovine and canine
hearts [28], but the molecular identities of cCMP- and cUMP-
degrading PDEs have remained elusive. Recently, we have shown
that several enzymes belonging to the eleven classes of well
characterized human PDEs [25] are capable of hydrolyzing not
only cAMP or cGMP but also cUMP, whereas PDE1B, PDE2A,
PDE3A, PDE4B, PDE5A, PDE8A and PDE9A were not able to
cleave cCMP [29]. These findings were obtained using a highly
sensitive and specific but extensive HPLC-MS method that is
available only to few laboratories.
The use of fluorescence-labeled substrates is very common in
the examination of enzymatic reactions. MANT as fluorescent
probe is a suitable tool to label various nucleotides for enzymatic
studies, as it is rather small and attached to the nucleotide’s ribose,
rendering steric inhibition of enzymatic reactions more unlikely
than modifications at the base or the phosphoryl moiety [30,31].
PLOS ONE | www.plosone.org 1 January 2013 | Volume 8 | Issue 1 | e54158
However, MANT-substituted nucleoside 59-triphosphates
(MANT-NTPs) act as inhibitors of mammalian and bacterial
nucleotidyl cyclases [32,33,34,35]. In contrast, Escherichia coli
GTPase Era hydrolyzes MANT-GTP [36]. MANT-substituted
nucleotides have been used to analyze various nucleotide/protein
interactions e.g. with wheatgerm cap binding proteins [30],
catalytic subunits of membranous adenylyl cyclase [37] and
eukaryotic release factor 3 [38]. MANT has been attached to the
bacterial second messenger cyclic di-guanosine monophosphate (c-
di-GMP), being a substrate for a PDE from Mycobacterium smegmatis
[39]. The more lipophilic di-MANT-c-diGMP is meanwhile
commercially available. Hiratsuka used MANT- and ANT-
substituted cAMP and cGMP as substrates of bovine heart PDE
[40], and Johnson et al. detected activity of rabbit brain PDE on
29-O-(N’-methylanthraniloyl)-cGMP (MANT-cGMP) [41], but
there is a lack of comprehensive data on the interaction of purine
and particularly pyrimidine MANT-cNMPs with human PDEs,
and ideal fluorescence detection conditions for MANT-cNMPs are
controversial in the literature.
In the present study, we describe the synthesis of various new
MANT-substituted purine and pyrimidine 39,59-cyclic nucleotides.
We show that MANT-cNMPs are substrates of different human
PDEs - with 29-O-(N’-methylanthraniloyl)-cCMP (MANT-cCMP)
being a remarkable exception - and that their turnover can be
quantified by direct fluorescence detection, thus rendering them
appropriate tools to study the substrate specificity of PDEs.
Materials and methods
MaterialsPurified recombinant human PDEs 1B (purity .50%), 3A
(purity .50%), 5A (purity .70%) and 9A (purity .80%)
expressed in Spodoptera frugiperda Sf9 cells were obtained from
BPS Bioscience (San Diego, CA). MANT-cGMP, 29-O-(N’-
Methylanthraniloyl)-cAMP (MANT-cAMP), MANT-cCMP, 29/
39-O-(N’-Methylanthraniloyl)-GMP (MANT-GMP) (purity .99%
each, determined by analytical HPLC at lmax), cCMP, inosine
39,59-cyclic monophosphate (cIMP), cUMP, cytidine 59-mono-
phosphate (CMP), inosine 59-monophosphate (IMP) and uridine
59-monophosphate (UMP) were provided as sodium salts by Biolog
Life Science Institute (Bremen, Germany). 29/39-O-(N’-Methylan-
thraniloyl)-AMP (MANT-AMP) was obtained from Jena Biosci-
ence (Jena, Germany). Structures of the MANT-cNMPs and 29/
39-O-(N’-methylanthraniloyl)-NMPs (MANT-NMPs) that were
used in this study are shown in figure 1. N-methylisatoic anhydride
and cAMP were purchased from Sigma (Taufkirchen, Germany).
Calmodulin was purified from calf brain as described [42]. All
other reagents were of analytical grade or the best grade available
from commercial suppliers.
Synthesis of MANT-nucleotides: General ProceduresAnalytical HPLC was performed with a LaChrom Elite system
with EZ ChromElite software version 3.3.1 SP1 and consisted of a
L-2200 autosampler, a L-2130 pump, a L-2455 UV/Vis diode
array detector, a L-2350 column oven, and a D 7500 chromato-
integrator (all VWR/Hitachi, Hannover, Germany). The station-
ary phase was ODS-A 12 nm, S-11 mm (YMC, Dinslaken,
Germany) in a 25064.6 mm stainless steel column. Preparative
MPLC was accomplished with a C-605 pump (Buchi, Essen,
Germany), a preparative K 2001 UV-detector (Knauer, Berlin,
Germany) and a L200E analog recorder (Linseis, Selb, Germany).
Merck LiChroprep RP-18 6 nm, 15–25 mm (Merck-Hitachi) in a
410650 mm glass column (Kronlab, Dinslaken, Germany) was
used for isolation, desalting and preparation the sodium salts of the
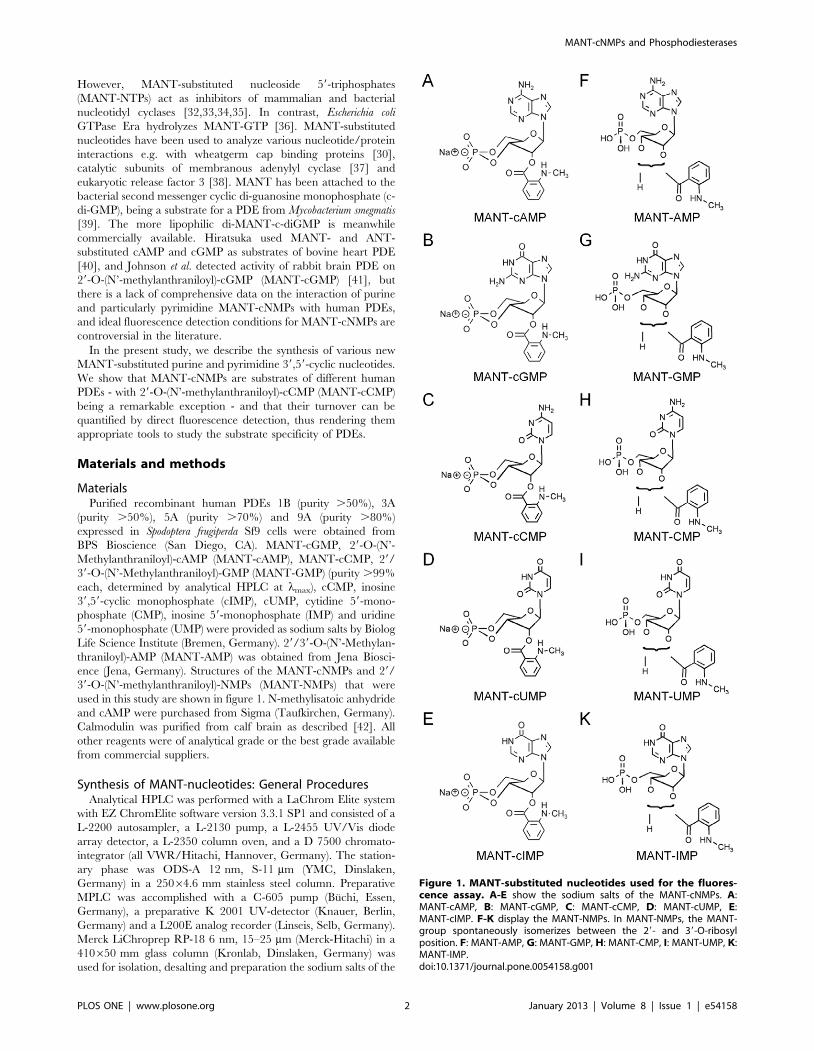
Figure 1. MANT-substituted nucleotides used for the fluores-cence assay. A-E show the sodium salts of the MANT-cNMPs. A:MANT-cAMP, B: MANT-cGMP, C: MANT-cCMP, D: MANT-cUMP, E:MANT-cIMP. F-K display the MANT-NMPs. In MANT-NMPs, the MANT-group spontaneously isomerizes between the 29- and 39-O-ribosylposition. F: MANT-AMP, G: MANT-GMP, H: MANT-CMP, I: MANT-UMP, K:MANT-IMP.doi:10.1371/journal.pone.0054158.g001
MANT-cNMPs and Phosphodiesterases
PLOS ONE | www.plosone.org 2 January 2013 | Volume 8 | Issue 1 | e54158
nucleotides. Mass spectra were recorded with an Esquire LC 6000
spectrometer (Bruker Daltonics, Bremen, Germany) in the ESI-
MS mode with 50% propanol-2/49.9% water/0.1% formic acid
(v/v/v) as matrix. UV-spectra were recorded with a Helios bspectrometer (Spectronic Unicam, Leeds, UK) in aqueous
phosphate buffer, pH 8. Nucleotides were quantified and aliquot-
ed using the extinction coefficient of the N’-methylanthraniloyl
group in MANT-guanosine and MANT-GTP at 355 nm [43].
General Protocol of MANT-NMP Synthesis3,500 mmol nucleoside 59-monophosphate (NMP) was dissolved
in 34 mL H2O and 17 mL acetonitrile in a 100 mL two-necked
flask equipped with pH-electrode and reflux condenser and heated
to 35uC. 8.750 mmol (2.5 eq.). N-methylisatoic anhydride was
added in one portion and the resulting brown suspension was
stirred and maintained at pH 9 by addition of 2.5 N NaOH. The
progress of reaction was monitored by analytical HPLC (11%
acetonitrile, 20 mM triethyl ammonium formate (TEAF) buffer,
pH 6.9, 1.5 mL/min). After completion of the reaction (1–2 h) the
raw mixture was extracted with CHCl3 (3 x 100 mL), concentrat-
ed under reduced pressure to remove residual acetonitrile and
filtered through a 5 cm membrane of regenerated cellulose,
0.45 mm pore size (Sartorius, Gottingen, Germany). The resulting
filtrate was purified by MPLC. After pre-equilibration with
100 mM NaH2PO4, pH 6.5 and desalting with 100% water, the
particular MANT-NMP, sodium salt, was eluted as mixture of
diastereomers with a gradient from 0% to 10% (v/v) isopropanol.
Product-containing fractions with purities .99% (HPLC) were
pooled, evaporated under reduced pressure to produce the
MANT-NMP.
29/39-O-(N’-Methylanthraniloyl)-CMP (MANT-
CMP). Yield: 355 mmol, 10.1%; purity: 99.7% (HPLC). UV/
Vis pH 8 (lmax/e): 254 nm/15,400; 355 nm/5,700. Empirical
formula: C17H19N4O9P?Na2 (MW: 500.31), C17H21N4O9P (MW:
456.36, free acid). ESI/MS (isopropanol/water) pos. mode: m/
z = 501 [M+2Na-H]+, 100%; m/z = 523 [M+3Na-2H]+, 25%;
neg. mode: m/z = 455 [M-H]-, 100%; m/z = 477 [M+Na-2H]-,
10%.
29/39-O-(N’-Methylanthraniloyl)-UMP (MANT-
UMP). Yield: 2,141 mmol, 61.2%; purity: 99.9% (HPLC).
UV/Vis pH 8 (lmax/e): 256 nm/17,800; 355 nm/5,700. Empir-
ical formula: C17H18N3O10P?Na2 (MW: 501.30), C17H20N3O10P
(MW: 457.33, free acid). ESI/MS (isopropanol/water) pos. mode:
m/z = 502 [M+2Na-H]+, 100%; neg. mode: m/z = 456 [M-H]-,
100%; m/z = 478 [M+Na-2H]-, 10%.
29/39-O-(N’-Methylanthraniloyl)-IMP (MANT-
IMP). Yield: 1,941 mmol, 55.5%; purity: 99.0% (HPLC). UV/
Vis pH 8 (lmax/e): 250 nm/20,800; 355 nm/5,700. Empirical
formula: C18H18N5O9P?Na2 (MW: 525.32), C18H20N5O9P (MW:
481.36, free acid). ESI/MS (isopropanol/water) pos. mode: m/
z = 526 [M+2Na-H]+, 100%; m/z = 548 [M+3Na-2H]+, 25%;
neg. mode: m/z = 480 [M-H]-, 100%; m/z = 502 [M+Na-2H]-,
10%.
Synthesis of 29-O-(N’-Methylanthraniloyl)-cUMP (MANT-
cUMP). 555 mmol cUMP, sodium salt and 16,500 mmol (,30
eq.) N-methylisatoic anhydride were suspended in 10 mL H2O in
a 100 mL two-necked flask and processed according to the general
protocol for MANT-NMP analogs as outlined above. Analytical
HPLC for reaction control (15% isopropanol, 20 mM TEAF-
buffer, pH 6.9, 1.0 mL/min, UV 262 nm). Yield: 449 mmol,
80.9%; purity: 99.5% (HPLC). UV/Vis pH 8 (lmax/e): 255 nm/
18,900; 355 nm/5,700. Empirical formula: C17H17N3O9P?Na
(MW: 461.30), C17H18N3O9P (MW: 439.32, free acid). ESI/MS
(isopropanol/water) pos. mode: m/z = 462 [M+2Na-H]+, 100%;
m/z = 440 [M+H]+, 90%;m/z = 484 [M+3Na-2H]+, 60%; neg.
mode: m/z = 438 [M-H]-, 100%.
Synthesis of 29-O-(N’-Methylanthraniloyl)-cIMP (MANT-
cIMP). 1,400 mmol cIMP, sodium salt and 21,000 mmol (,15
eq.) N-methylisatoic anhydride were suspended in 15 mL H2O
and 7.5 mL acetonitrile in a 100 mL two-necked flask and
processed according to the general protocol for MANT-NMP
analogs. Analytical HPLC for reaction control (24% acetonitrile,
20 mM TEAF-buffer, pH 6.9, 1.0 mL/min, UV 250 nm). Yield:
808 mmol, 57.7%; purity: 99.6% (HPLC). UV/Vis pH 8 (lmax/e):250 nm/20,500; 355 nm/5,700. Empirical formula:
C18H17N5O8P?Na (MW: 485.33), C18H18N5O8P (MW: 463.34,
free acid). ESI/MS (isopropanol/water) pos. mode: m/z = 508
[M+2Na-H]+, 100%; neg. mode: m/z = 462 [M-H]-, 100%.
End Point Assay for PDE Activity Analysis via DirectFluorescence Detection
Using human PDEs 3A, 5A and 9A, the experiments were
carried out in a reaction buffer containing final concentrations of
50 mM Tris/HCl pH 7.5, 8.3 mM MgCl2 and 1.7 mM EDTA.
Assaying PDE 1B, further ingredients to the buffer were 100 nM
calmodulin and 100 mM CaCl2, constituting concentrations
known to provide a sufficient activation of PDE1 [29,44,45]. To
buffer the concentration of free calcium ions, 100 mM EGTA was
added to the buffer as described in [45] Concentration of free Ca2+
ions was calculated as 2.9 mM using Ca-Mg-ATP-EGTA calcu-
lator v1.0 (http://www.stanford.edu/cpatton/CaMgATPEGTA-
NIST.htm) which is about 30-fold the basal calcium concentration
in most cell types [46]. The EC50 for activation by calcium varies
from 0.27 to 3.02 mM for various PDE1 isoforms [25]. Each
MANT-cNMP was added to the buffer at a final concentration of
10 mM unless otherwise noted. The reaction was started by adding
a PDE to each sample at final concentrations of 0.5 mg/ml
(PDE1B), 0.7 mg/ml (PDE3A), 0.4 mg/ml (PDE5A) or 1 mg/ml
(PDE9A). Each combination of available MANT-cNMP and PDE
was studied. A 10 mM solution of each MANT-cNMP and
MANT-NMP in reaction buffer was used as control, being
substrate and product standard for the subsequent fluorescence
analysis and calculations. Final sample volume was 200 ml.
Incubation was performed at a temperature of 25uC for various
reaction times between 10 to 60 minutes. The reaction was
terminated by heating the samples to 58uC for 3 minutes, as
heating at higher temperatures caused a depression of MANT-
cNMP fluorescence in the consecutive fluorescence detection (data
not shown). Precipitates were sedimented via centrifugation at 4uCand 20,000 g for 10 minutes. 100 ml of the supernatant were
transferred to an UV-permeable synthetic quartz glass 96 well
microtiter plate type 730.009B-QG by Hellma (Mullheim,
Germany). 200 ml of dimethyl sulfoxide (DMSO) were added to
these samples in some cases to improve fluorescence intensity.
Fluorescence detection was performed using a Synergy 4
fluorimeter from BioTek (Bad Friedrichshall, Germany). Excita-
tion wavelengths from 280 nm up to 350 nm were used to detect
emission spectra of substrate standard, product standard and
samples containing the respective PDE preparation in triplicates.
Continuous Fluorescence Detection AssaySamples containing reaction buffer and MANT-substituted
cyclic nucleotides at a final concentration of 10 mM (unless
otherwise noted) were transferred to an UV-permeable synthetic
quartz glass 96 well microtiter plate along with the substrate
standards of 10 mM MANT-cNMP and the product standards of
10 mM MANT-NMP. To start the reaction process, the respective
PDE preparations was added to the samples. As in the end point
MANT-cNMPs and Phosphodiesterases
PLOS ONE | www.plosone.org 3 January 2013 | Volume 8 | Issue 1 | e54158
assay, each combination of MANT-cNMP and PDE was
examined. Final sample volume was 100 ml. Fluorescence mea-
surements were started immediately after initiation of the reaction
with excitation at 280 nm and emission detection at 450 nm and
repeated every 20 to 30 seconds during the reaction process,
plotting the fluorescence intensity against time. Km and Vmax
values were calculated exemplary from the resulting graphs.
Thin Layer Chromatography50 ml of samples gained with the end point analysis method
described above were applied to a silica gel glass plate for thin
layer chromatography (TLC), type 60, item no. 105721, obtained
from Merck (Darmstadt, Germany). For this assay, only DMSO-
free samples were used. A solution containing 60% (v/v) of
isopropanol, 30% (v/v) of a 25% (m/v) ammonium hydroxide
solution and 10% (v/v) of water were used as mobile phase.
Chromatography was carried out for 105 minutes. Plates were
dried and spots were visualized using a 366 nm UV-lamp. The
spots were marked and their respective retardation factors (Rf-
values) were determined. Each spot was scraped off the plate and
eluted with 200 ml Tris/HCl 0.5 mol/l pH 8.0. Insoluble particles
were sedimented via centrifugation at 4uC and 20,000 g for 10
minutes. To 100 ml of the supernatant 200 ml of DMSO were
added, followed by fluorescence spectrum detection with excita-
tion at 280 nm.
Results
Evaluating Fluorescence Detection ConditionsThe fluorescence properties of each MANT-cNMP were tested
in comparison to the corresponding MANT-NMP. Excitation
spectra were recorded from 260 to 410 nm detecting emission at
440 nm (figure S1). Whereas every MANT-substituted nucleotide
showed a fluorescence maximum at 440 nm when excited with
360 to 370 nm, the difference in fluorescence of each couple of
MANT-cNMP and MANT-NMP was rather small in this range.
MANT-cIMP/MANT-IMP turned out to be an exception.
However, MANT-cGMP and to lesser extent MANT-CMP
showed a shoulder in the curve progression when excited at 280
to 290 nm, where their fluorescence was clearly distinct from their
corresponding nucleotides. MANT-cIMP and MANT-IMP ex-
hibited a very low fluorescence in this range.
Adding increasing DMSO concentrations to the samples
amplified the fluorescence of each tested MANT nucleotide
substantially and led to a shift of maximum emission to shorter
wavelengths. This is shown for MANT-cAMP exemplary in figure
S2. Although adding DMSO did not alter the curve progression of
the excitation spectra fundamentally for any MANT-substituted
nucleotide (figure S1), it increased the discriminatory power
between cNMP- and NMP-analogs in some cases. This was
especially true for MANT-cAMP/MANT-AMP and MANT-
cUMP/MANT-UMP. Detection of emission spectra was then
been performed (figure S3) using various excitation wavelengths
that were promising based on the analysis of the respective
excitation spectra shown in figure S1 to investigate detection
parameters providing ideal discriminatory power (calculated as
ratio of MANT-cAMP/MANT-AMP fluorescence intensity). In
conclusion, these studies led to the emission detection parameters
displayed in table 1 providing the best discriminatory power for
each MANT-cNMP/MANT-NMP couple respectively.
End Point Assay for PDE Activity Analysis via DirectFluorescence Detection and Calculation of TurnoverRates
Using the parameters specified above for fluorescence detection,
the end point assay described in the methods section was
performed for each combination of MANT-cNMP and PDE
available to us. Emission spectra were detected to analyze the
respective PDE activity. Figure 2 shows the results of the reaction
of PDE5A with MANT-cGMP (a) and MANT-cIMP (b). Whereas
fluorescence was decreased during degradation of MANT-cGMP,
MANT-IMP showed a higher fluorescence than MANT-cIMP as
anticipated from the previous experiments. MANT-cGMP was
hydrolyzed by PDE5A until a nearly complete conversion was
accomplished after 60 minutes. MANT-cIMP was completely
degraded within 60 minutes as well. When performing the
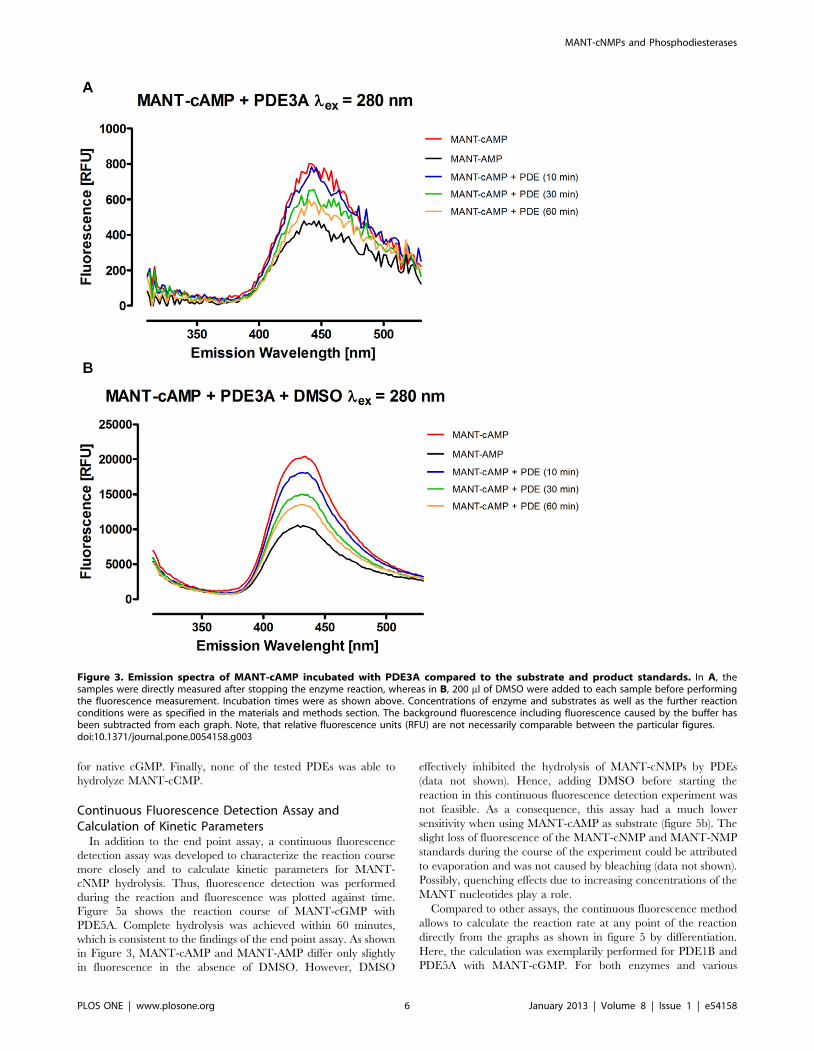
experiment with MANT-cAMP and PDE3A for reaction times
of 10 to 60 minutes, an incomplete hydrolysis was observed
(figure 3). Most notably, comparing figure 3a to 3b clearly
emphasizes the advantage of DMSO as a fluorescence amplifier
for MANT-cAMP/MANT-AMP, as DMSO did not only lead to a
much smoother curve but also improved the methods’ discrimi-
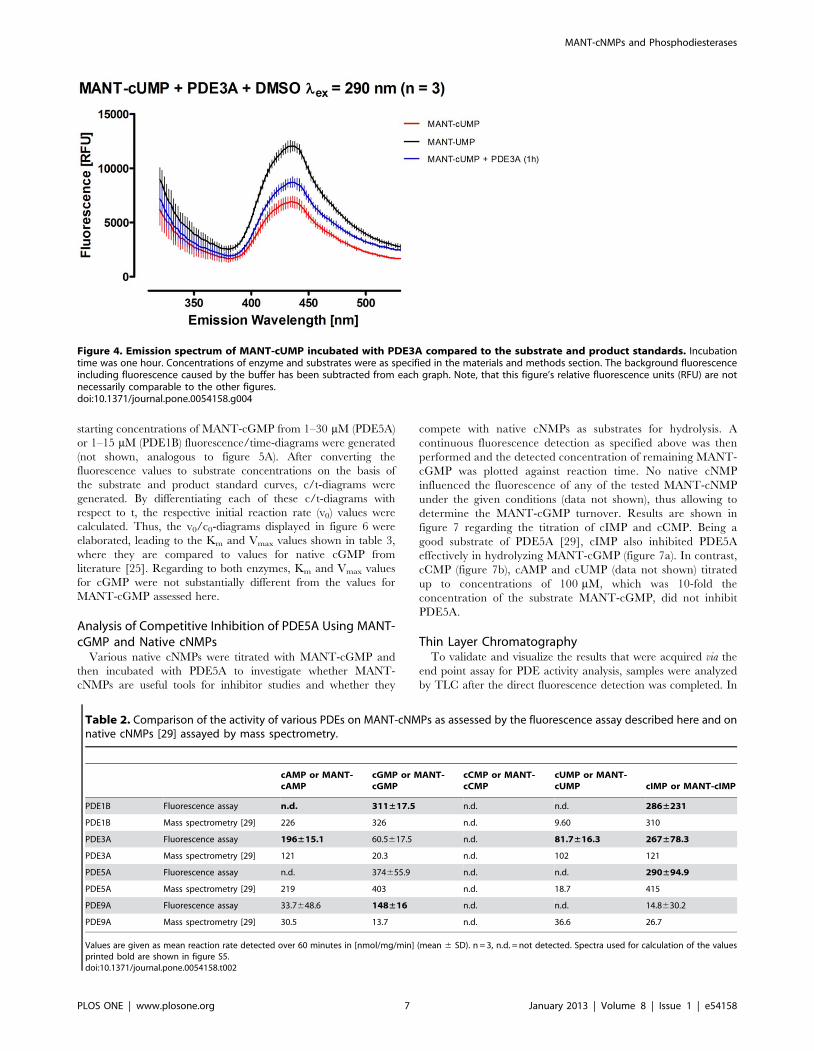
natory power. Similar to MANT-cIMP, MANT-cUMP cleavage
by PDEs produced increased fluorescence as shown for PDE3A
(figure 4).
The emission spectra from each combination of PDE and
MANT-cNMP were used to calculate respective turnover rates.
For this purpose, the emission of each sample after 60 minutes of
incubation was compared with the respective standards. The
substrate standard of 10 mM MANT-cNMP and the product
standard of 10 mM MANT-NMP were defined as 0% turnover
and 100%, respectively. The PDEs themselves did not have any
impact on the endogenous fluorescence of MANT-substituted
nucleotides, which is imperative for this approach (data not
shown). Moreover, due to the high specific activity and purity of
the enzymes used, the total amount of protein in the samples could
be kept rather small. The data acquired by this calculation are
compared with data from the literature [29], obtained by high
performance liquid chromatography/mass spectrometry-analytics
using native cNMPs (table 2). Reaction conditions, buffers, and the
concentrations of the cofactors of PDE1, Ca2+ and calmodulin,
used in the present assay with MANT-cNMPs were identical to
those used with cNMPs [29] to ensure direct comparability.
Turnover was calculated as mean reaction rate in nmol/mg/min
determined after a reaction time of 60 minutes for better
comparison to previous data on native cNMPs [29], the values
are, therefore, not necessarily comparable with initial reaction
rates stated elsewhere [25,26] and do not exactly reflect in vivo
hydrolysis. All turnover rates were validated semi-quantitatively by
means of TLC.
We found similar turnover rates for native and MANT-
substituted cNMPs for most PDEs with some remarkable
exceptions. PDE1B hydrolyzed cAMP very well, but did not
hydrolyze MANT-cAMP at all. Whereas the turnover of MANT-
cGMP and cGMP as well as MANT-cIMP and IMP were similar,
the low cUMP hydrolysis could not be confirmed with MANT-
cUMP. PDE3A was able to hydrolyze any of the tested MANT-
cNMPs except MANT-cCMP with reaction rates being slightly
different between native and MANT-labeled nucleotides. PDE5A
showed similar behavior as PDE1B, not being able to cleave
MANT-cAMP and MANT-cUMP while a turnover for the
respective native nucleotides is specified in literature [29]. PDE9A
cleaved cUMP, but did not cleave MANT-cUMP and the
turnover of MANT-cGMP was significantly higher than stated
MANT-cNMPs and Phosphodiesterases
PLOS ONE | www.plosone.org 4 January 2013 | Volume 8 | Issue 1 | e54158
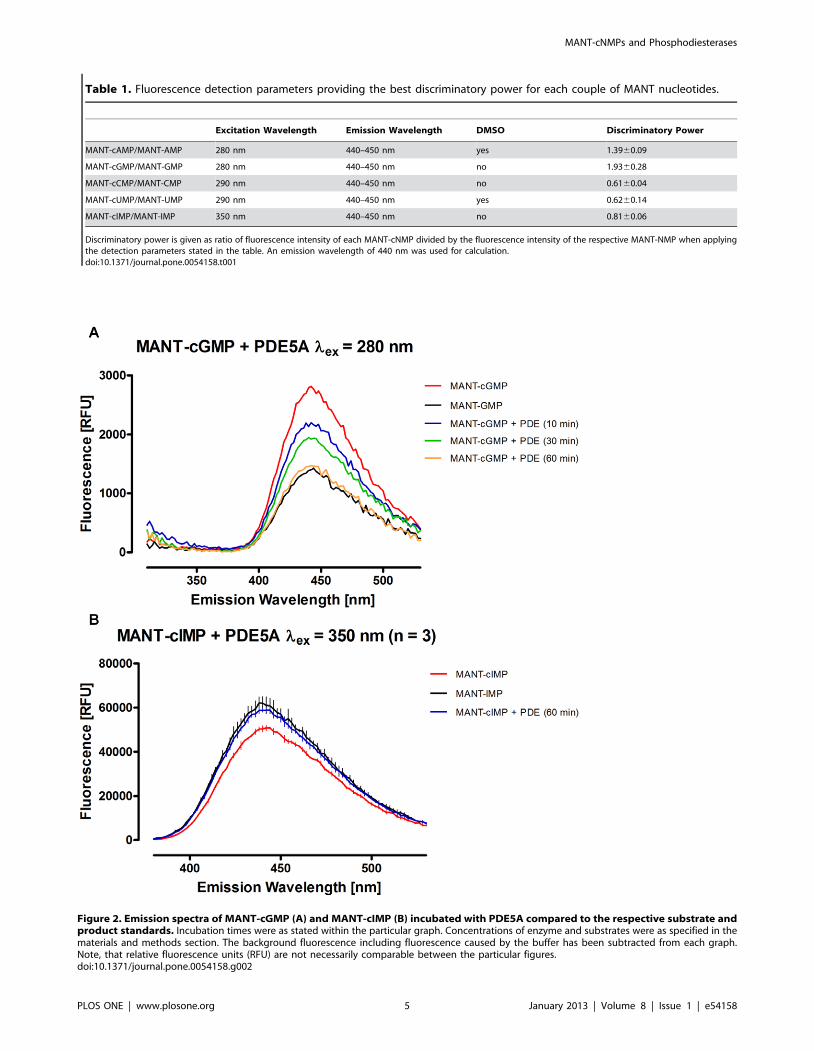
Table 1. Fluorescence detection parameters providing the best discriminatory power for each couple of MANT nucleotides.
Excitation Wavelength Emission Wavelength DMSO Discriminatory Power
MANT-cAMP/MANT-AMP 280 nm 440–450 nm yes 1.3960.09
MANT-cGMP/MANT-GMP 280 nm 440–450 nm no 1.9360.28
MANT-cCMP/MANT-CMP 290 nm 440–450 nm no 0.6160.04
MANT-cUMP/MANT-UMP 290 nm 440–450 nm yes 0.6260.14
MANT-cIMP/MANT-IMP 350 nm 440–450 nm no 0.8160.06
Discriminatory power is given as ratio of fluorescence intensity of each MANT-cNMP divided by the fluorescence intensity of the respective MANT-NMP when applyingthe detection parameters stated in the table. An emission wavelength of 440 nm was used for calculation.doi:10.1371/journal.pone.0054158.t001
Figure 2. Emission spectra of MANT-cGMP (A) and MANT-cIMP (B) incubated with PDE5A compared to the respective substrate andproduct standards. Incubation times were as stated within the particular graph. Concentrations of enzyme and substrates were as specified in thematerials and methods section. The background fluorescence including fluorescence caused by the buffer has been subtracted from each graph.Note, that relative fluorescence units (RFU) are not necessarily comparable between the particular figures.doi:10.1371/journal.pone.0054158.g002
MANT-cNMPs and Phosphodiesterases
PLOS ONE | www.plosone.org 5 January 2013 | Volume 8 | Issue 1 | e54158
for native cGMP. Finally, none of the tested PDEs was able to
hydrolyze MANT-cCMP.
Continuous Fluorescence Detection Assay andCalculation of Kinetic Parameters
In addition to the end point assay, a continuous fluorescence
detection assay was developed to characterize the reaction course
more closely and to calculate kinetic parameters for MANT-
cNMP hydrolysis. Thus, fluorescence detection was performed
during the reaction and fluorescence was plotted against time.
Figure 5a shows the reaction course of MANT-cGMP with
PDE5A. Complete hydrolysis was achieved within 60 minutes,
which is consistent to the findings of the end point assay. As shown
in Figure 3, MANT-cAMP and MANT-AMP differ only slightly
in fluorescence in the absence of DMSO. However, DMSO
effectively inhibited the hydrolysis of MANT-cNMPs by PDEs
(data not shown). Hence, adding DMSO before starting the
reaction in this continuous fluorescence detection experiment was
not feasible. As a consequence, this assay had a much lower
sensitivity when using MANT-cAMP as substrate (figure 5b). The
slight loss of fluorescence of the MANT-cNMP and MANT-NMP
standards during the course of the experiment could be attributed
to evaporation and was not caused by bleaching (data not shown).
Possibly, quenching effects due to increasing concentrations of the
MANT nucleotides play a role.
Compared to other assays, the continuous fluorescence method
allows to calculate the reaction rate at any point of the reaction
directly from the graphs as shown in figure 5 by differentiation.
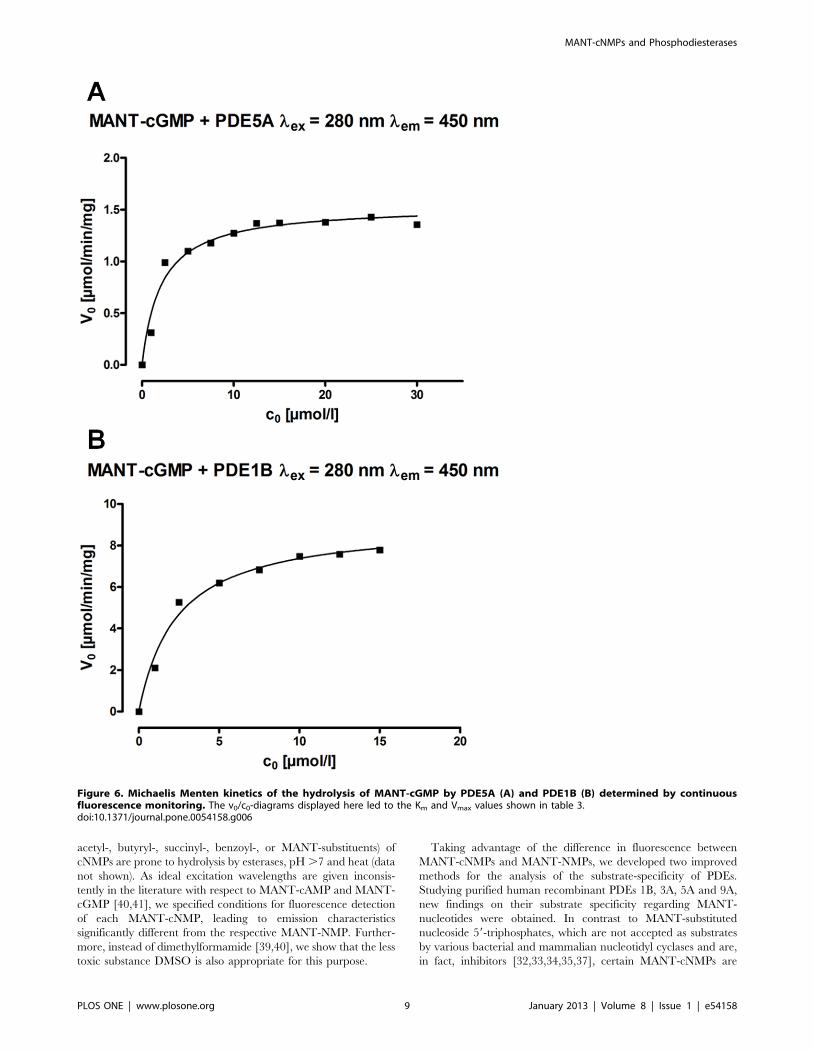
Here, the calculation was exemplarily performed for PDE1B and
PDE5A with MANT-cGMP. For both enzymes and various
Figure 3. Emission spectra of MANT-cAMP incubated with PDE3A compared to the substrate and product standards. In A, thesamples were directly measured after stopping the enzyme reaction, whereas in B, 200 ml of DMSO were added to each sample before performingthe fluorescence measurement. Incubation times were as shown above. Concentrations of enzyme and substrates as well as the further reactionconditions were as specified in the materials and methods section. The background fluorescence including fluorescence caused by the buffer hasbeen subtracted from each graph. Note, that relative fluorescence units (RFU) are not necessarily comparable between the particular figures.doi:10.1371/journal.pone.0054158.g003
MANT-cNMPs and Phosphodiesterases
PLOS ONE | www.plosone.org 6 January 2013 | Volume 8 | Issue 1 | e54158
starting concentrations of MANT-cGMP from 1–30 mM (PDE5A)
or 1–15 mM (PDE1B) fluorescence/time-diagrams were generated
(not shown, analogous to figure 5A). After converting the
fluorescence values to substrate concentrations on the basis of
the substrate and product standard curves, c/t-diagrams were
generated. By differentiating each of these c/t-diagrams with
respect to t, the respective initial reaction rate (v0) values were
calculated. Thus, the v0/c0-diagrams displayed in figure 6 were
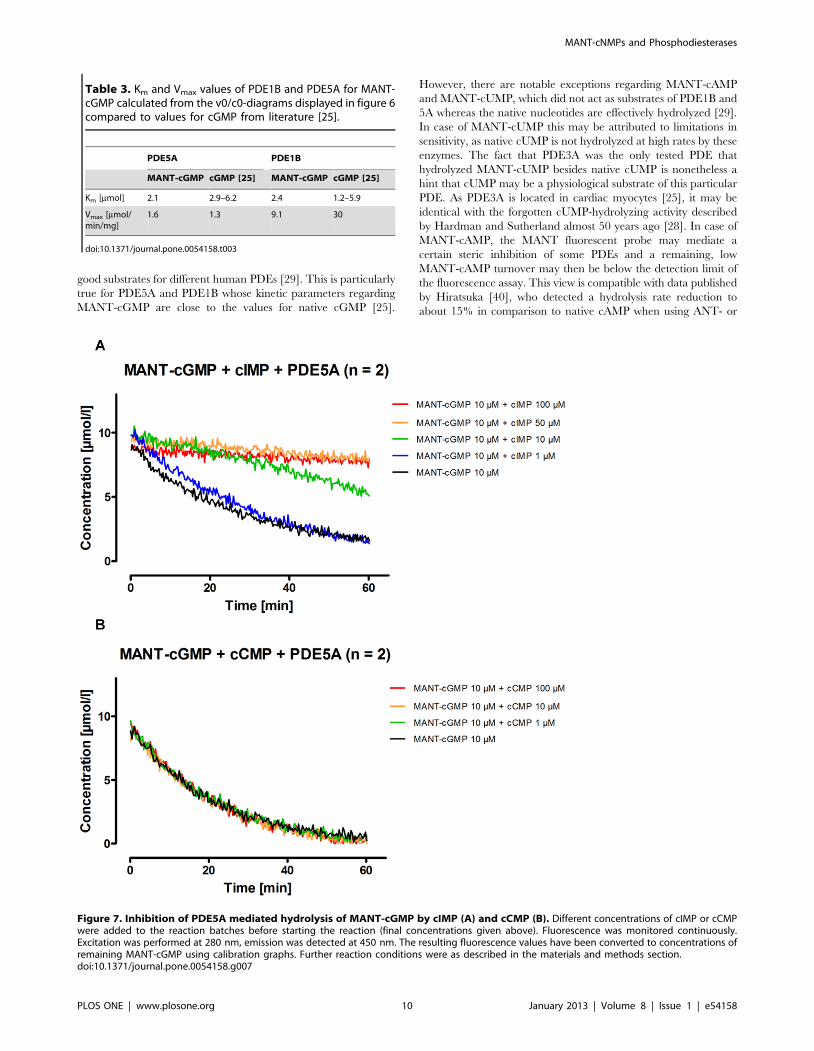
elaborated, leading to the Km and Vmax values shown in table 3,
where they are compared to values for native cGMP from
literature [25]. Regarding to both enzymes, Km and Vmax values
for cGMP were not substantially different from the values for
MANT-cGMP assessed here.
Analysis of Competitive Inhibition of PDE5A Using MANT-cGMP and Native cNMPs
Various native cNMPs were titrated with MANT-cGMP and
then incubated with PDE5A to investigate whether MANT-
cNMPs are useful tools for inhibitor studies and whether they
compete with native cNMPs as substrates for hydrolysis. A
continuous fluorescence detection as specified above was then
performed and the detected concentration of remaining MANT-
cGMP was plotted against reaction time. No native cNMP
influenced the fluorescence of any of the tested MANT-cNMP
under the given conditions (data not shown), thus allowing to
determine the MANT-cGMP turnover. Results are shown in
figure 7 regarding the titration of cIMP and cCMP. Being a
good substrate of PDE5A [29], cIMP also inhibited PDE5A
effectively in hydrolyzing MANT-cGMP (figure 7a). In contrast,
cCMP (figure 7b), cAMP and cUMP (data not shown) titrated
up to concentrations of 100 mM, which was 10-fold the
concentration of the substrate MANT-cGMP, did not inhibit
PDE5A.
Thin Layer ChromatographyTo validate and visualize the results that were acquired via the
end point assay for PDE activity analysis, samples were analyzed
by TLC after the direct fluorescence detection was completed. In
Figure 4. Emission spectrum of MANT-cUMP incubated with PDE3A compared to the substrate and product standards. Incubationtime was one hour. Concentrations of enzyme and substrates were as specified in the materials and methods section. The background fluorescenceincluding fluorescence caused by the buffer has been subtracted from each graph. Note, that this figure’s relative fluorescence units (RFU) are notnecessarily comparable to the other figures.doi:10.1371/journal.pone.0054158.g004
Table 2. Comparison of the activity of various PDEs on MANT-cNMPs as assessed by the fluorescence assay described here and onnative cNMPs [29] assayed by mass spectrometry.
cAMP or MANT-cAMP
cGMP or MANT-cGMP
cCMP or MANT-cCMP
cUMP or MANT-cUMP cIMP or MANT-cIMP
PDE1B Fluorescence assay n.d. 311±17.5 n.d. n.d. 286±231
PDE1B Mass spectrometry [29] 226 326 n.d. 9.60 310
PDE3A Fluorescence assay 196±15.1 60.5617.5 n.d. 81.7±16.3 267±78.3
PDE3A Mass spectrometry [29] 121 20.3 n.d. 102 121
PDE5A Fluorescence assay n.d. 374655.9 n.d. n.d. 290±94.9
PDE5A Mass spectrometry [29] 219 403 n.d. 18.7 415
PDE9A Fluorescence assay 33.7648.6 148±16 n.d. n.d. 14.8630.2
PDE9A Mass spectrometry [29] 30.5 13.7 n.d. 36.6 26.7
Values are given as mean reaction rate detected over 60 minutes in [nmol/mg/min] (mean 6 SD). n = 3, n.d. = not detected. Spectra used for calculation of the valuesprinted bold are shown in figure S5.doi:10.1371/journal.pone.0054158.t002
MANT-cNMPs and Phosphodiesterases
PLOS ONE | www.plosone.org 7 January 2013 | Volume 8 | Issue 1 | e54158
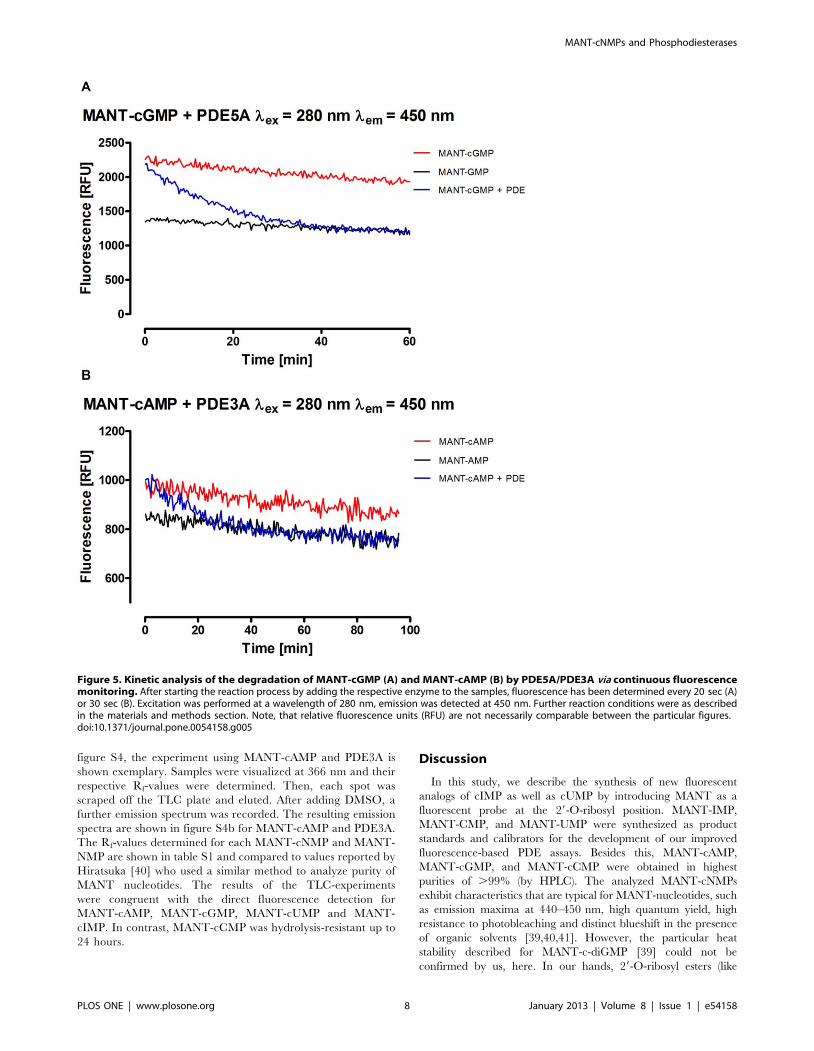
figure S4, the experiment using MANT-cAMP and PDE3A is
shown exemplary. Samples were visualized at 366 nm and their
respective Rf-values were determined. Then, each spot was
scraped off the TLC plate and eluted. After adding DMSO, a
further emission spectrum was recorded. The resulting emission
spectra are shown in figure S4b for MANT-cAMP and PDE3A.
The Rf-values determined for each MANT-cNMP and MANT-
NMP are shown in table S1 and compared to values reported by
Hiratsuka [40] who used a similar method to analyze purity of
MANT nucleotides. The results of the TLC-experiments
were congruent with the direct fluorescence detection for
MANT-cAMP, MANT-cGMP, MANT-cUMP and MANT-
cIMP. In contrast, MANT-cCMP was hydrolysis-resistant up to
24 hours.
Discussion
In this study, we describe the synthesis of new fluorescent
analogs of cIMP as well as cUMP by introducing MANT as a
fluorescent probe at the 29-O-ribosyl position. MANT-IMP,
MANT-CMP, and MANT-UMP were synthesized as product
standards and calibrators for the development of our improved
fluorescence-based PDE assays. Besides this, MANT-cAMP,
MANT-cGMP, and MANT-cCMP were obtained in highest
purities of .99% (by HPLC). The analyzed MANT-cNMPs
exhibit characteristics that are typical for MANT-nucleotides, such
as emission maxima at 440–450 nm, high quantum yield, high
resistance to photobleaching and distinct blueshift in the presence
of organic solvents [39,40,41]. However, the particular heat
stability described for MANT-c-diGMP [39] could not be
confirmed by us, here. In our hands, 29-O-ribosyl esters (like
Figure 5. Kinetic analysis of the degradation of MANT-cGMP (A) and MANT-cAMP (B) by PDE5A/PDE3A via continuous fluorescencemonitoring. After starting the reaction process by adding the respective enzyme to the samples, fluorescence has been determined every 20 sec (A)or 30 sec (B). Excitation was performed at a wavelength of 280 nm, emission was detected at 450 nm. Further reaction conditions were as describedin the materials and methods section. Note, that relative fluorescence units (RFU) are not necessarily comparable between the particular figures.doi:10.1371/journal.pone.0054158.g005
MANT-cNMPs and Phosphodiesterases
PLOS ONE | www.plosone.org 8 January 2013 | Volume 8 | Issue 1 | e54158
acetyl-, butyryl-, succinyl-, benzoyl-, or MANT-substituents) of
cNMPs are prone to hydrolysis by esterases, pH .7 and heat (data
not shown). As ideal excitation wavelengths are given inconsis-
tently in the literature with respect to MANT-cAMP and MANT-
cGMP [40,41], we specified conditions for fluorescence detection
of each MANT-cNMP, leading to emission characteristics
significantly different from the respective MANT-NMP. Further-
more, instead of dimethylformamide [39,40], we show that the less
toxic substance DMSO is also appropriate for this purpose.
Taking advantage of the difference in fluorescence between
MANT-cNMPs and MANT-NMPs, we developed two improved
methods for the analysis of the substrate-specificity of PDEs.
Studying purified human recombinant PDEs 1B, 3A, 5A and 9A,
new findings on their substrate specificity regarding MANT-
nucleotides were obtained. In contrast to MANT-substituted
nucleoside 59-triphosphates, which are not accepted as substrates
by various bacterial and mammalian nucleotidyl cyclases and are,
in fact, inhibitors [32,33,34,35,37], certain MANT-cNMPs are
Figure 6. Michaelis Menten kinetics of the hydrolysis of MANT-cGMP by PDE5A (A) and PDE1B (B) determined by continuousfluorescence monitoring. The v0/c0-diagrams displayed here led to the Km and Vmax values shown in table 3.doi:10.1371/journal.pone.0054158.g006
MANT-cNMPs and Phosphodiesterases
PLOS ONE | www.plosone.org 9 January 2013 | Volume 8 | Issue 1 | e54158
good substrates for different human PDEs [29]. This is particularly
true for PDE5A and PDE1B whose kinetic parameters regarding
MANT-cGMP are close to the values for native cGMP [25].
However, there are notable exceptions regarding MANT-cAMP
and MANT-cUMP, which did not act as substrates of PDE1B and
5A whereas the native nucleotides are effectively hydrolyzed [29].
In case of MANT-cUMP this may be attributed to limitations in
sensitivity, as native cUMP is not hydrolyzed at high rates by these
enzymes. The fact that PDE3A was the only tested PDE that
hydrolyzed MANT-cUMP besides native cUMP is nonetheless a
hint that cUMP may be a physiological substrate of this particular
PDE. As PDE3A is located in cardiac myocytes [25], it may be
identical with the forgotten cUMP-hydrolyzing activity described
by Hardman and Sutherland almost 50 years ago [28]. In case of
MANT-cAMP, the MANT fluorescent probe may mediate a
certain steric inhibition of some PDEs and a remaining, low
MANT-cAMP turnover may then be below the detection limit of
the fluorescence assay. This view is compatible with data published
by Hiratsuka [40], who detected a hydrolysis rate reduction to
about 15% in comparison to native cAMP when using ANT- or
Table 3. Km and Vmax values of PDE1B and PDE5A for MANT-cGMP calculated from the v0/c0-diagrams displayed in figure 6compared to values for cGMP from literature [25].
PDE5A PDE1B
MANT-cGMP cGMP [25] MANT-cGMP cGMP [25]
Km [mmol] 2.1 2.9–6.2 2.4 1.2–5.9
Vmax [mmol/min/mg]
1.6 1.3 9.1 30
doi:10.1371/journal.pone.0054158.t003
Figure 7. Inhibition of PDE5A mediated hydrolysis of MANT-cGMP by cIMP (A) and cCMP (B). Different concentrations of cIMP or cCMPwere added to the reaction batches before starting the reaction (final concentrations given above). Fluorescence was monitored continuously.Excitation was performed at 280 nm, emission was detected at 450 nm. The resulting fluorescence values have been converted to concentrations ofremaining MANT-cGMP using calibration graphs. Further reaction conditions were as described in the materials and methods section.doi:10.1371/journal.pone.0054158.g007
MANT-cNMPs and Phosphodiesterases
PLOS ONE | www.plosone.org 10 January 2013 | Volume 8 | Issue 1 | e54158
MANT-cAMP as substrate of a bovine PDE. It is remarkable that
none of the tested PDEs is capable of hydrolyzing MANT-cCMP.
This finding is consistent with literature on native cCMP [29] and
may point to the existence of other elimination mechanisms for
cCMP. As multidrug resistance proteins 4 and 5 are known to
transport cAMP and cGMP effectively [47,48,49], export from the
cell by organic anion transporters or multidrug resistance proteins
may play a role for cCMP elimination as well.
The fluorescence of any studied MANT-cNMP did not interfere
with any native cNMP tested here, rendering MANT-cNMPs
excellent tools not only to study ortho- or allosteric inhibition of
PDEs but also to examine regulatory domains as well as crosstalk
and competition between the particular nucleotides. Regarding
PDE2, a stimulatory, cGMP-binding GAF domain is described
that plays an indispensable role in the regulation of this enzyme
[25]. As crosstalk between cAMP and cGMP is well established
[25,26,27], this may be also of interest regarding the emerging
second messengers cCMP and cUMP.
The assay introduced here offers various advantages compared
to the HPLC-MS method described in the literature [29]. It does
not require highly sensitive mass spectrometry equipment as
detection can be performed with a standard fluorimeter.
Furthermore, large numbers of samples can be analyzed within
a substantially shorter period of time. Moreover, the continuous
fluorescence monitoring method allows evaluation of the reaction
rate at any given time during the course of the reaction, which
renders it also advantageous in comparison to radiometric assays.
This is especially helpful to perform inhibitor studies or carry out
regulatory experiments, as time-delayed titration of putative
inhibitors or regulatory molecules is possible and their effects
can be directly observed. Finally, the results obtained via direct
fluorescence detection may be validated by TLC.
We also need to clearly emphasize the limitations of our
methods described here. In addition to the fact that some MANT-
cNMPs do not behave exactly like the respective native cNMPs in
terms of substrate specificity of several PDEs, there are also relevant
limitations in terms of sensitivity. The lower detection limit is
reached at substrate concentrations of about 1 mM in reference to
MANT-GMP using the equipment available to us. When lower
concentrations were used, distinction between MANT-cGMP and
MANT-GMP was not reliable anymore. Concerning MANT-
cAMP and MANT-AMP with an endogenously smaller difference
in fluorescence, sensitivity is even lower. Although sensitivity can be
markedly improved by addition of DMSO, this is only feasible for
the endpoint assay, but not for continuous fluorescence monitoring
and not for all MANT-cNMPs. This limitation of sensitivity,
especially when nucleotides that provide lesser discriminatory
power such as MANT-cIMP are used, causes the deviations of
the reaction rates being spread rather widely (table 2). As some
human PDEs possess Km values below substrate concentrations of
1 mM [25], kinetic analysis of such enzymes will be difficult using the
methods described here. It must be stated that although the
fluorescence assay is suitable to analyze purified recombinant
enzymes, application on tissues or cell preparations will be impeded
by the low sensitivity compared to our HPLC-MS method and
conventional radiometric methods. Nonetheless, as mechanisms of
elimination are neither completely understood for cCMP nor for
cUMP, the present assay provides a method for the analysis of
numerous PDEs with moderate technical requirements.
Our present work has a technical focus, and we have discussed
the advantages and disadvantages of the fluorescence method
compared to HPLC-MS and, to a very limited extent, radiometric
methods. Beyond the technical aspect, our work has also broad
biological implications for future studies. It is now clear that future
studies on cNMP-degrading PDEs must include substrates beyond
the ‘‘standard’’ cNMPs cAMP and cGMP and their corresponding
MANT-derivatives. cIMP and cyclic pyrimidine nucleotides may
constitute important physiological substrates and/or regulators of
PDEs. As a result of our recent study [29] and our present study, a
systematic kinetic re-analysis of cNMP-degrading PDEs is required.
Evidently, this is a substantial amount of work that cannot be
accomplished very rapidly and by a single laboratory, specifically if
one keeps in mind that cCMP and cUMP may also constitute
hitherto unrecognized positive and/or negative allosteric PDE
regulators. Our negative data on allosteric regulation of selected
PDEs by cUMP and cCMP does not exclude the possibility that
such regulation exists for some PDEs. This re-analysis of PDEs may
also result in a refinement of current PDE classification [25–27].
Considering the fact that PDEs are differentially expressed in
cells and tissues, the substrate-specificity of these enzymes will also
provide important information on the potential biological func-
tions of cCMP and cUMP. It will be particularly important to
study the biological role of cUMP in the heart, where the cUMP-
degrading PDE3A is expressed [25–28]. Moreover, a systematic
search for the elusive cCMP-degrading PDE [9,10] is warranted
because our negative data on selected PDEs do not exclude the
existence of a cCMP-degrading PDE. At the time being, we can
only speculate about the potential nature of a cCMP-degrading
PDE. Such an enzyme may constitute a known PDE not yet
studied by us at the time being. Alternatively, it may constitute a
novel PDE. It is also possible that a known PDE exhibits cCMP-
PDE activity only in the presence of as yet unknown protein
regulators. The search for the putative cCMP-degrading PDE is
not trivial because it is furthermore possible that catalytic activity
of such a PDE requires the presence of other regulatory cNMPs.
Thus, future research on PDEs will become truly pluridimensional
and much more complex in terms of combining various cNMPs at
various concentrations with each other.
A sensitive and generally applicable fluorescence-based assay
would be most useful for such systematic and pluridimensional
PDE studies, and our present study constitutes the first step
towards this ambitious goal. Chemical modification of the MANT
group or the introduction of different fluorophores may yield
fluorescent PDE substrates with better properties than the ones
presently available. Docking of fluorescent cNMPs into available
PDE crystal structures is important in this regard [25–27]. We
predict that biochemical and medicinal-chemical research on
cNMP-degrading PDEs will substantially increase as a result of our
recent studies and yield many surprising results.
Supporting Information
Figure S1 Representative excitation spectra of MANT-cNMPs and MANT-NMPs. Concentration of each nucleotide
was 10 mM. Emission was detected at 440 nm. A-E show the spectra
without DMSO whereas in F-K 200 ml of DMSO were added to
each 100 ml sample before the spectra were recorded. Final DMSO
concentration was 67% (v/v). Note that relative fluorescence units
(RFU) are not necessarily comparable between the particular figures.
Data shown are the means 6 SD of 3 experiments. Note that in
some instances, SD values are too small to be seen.
(TIF)
Figure S2 Emission spectra of MANT-cAMP in variousconcentrations of DMSO. A solution of MANT-cAMP
(10 mM final concentration) was diluted in 100 ml solvent
containing different concentrations of DMSO from 5% to 90%
(v/v) in water. Higher concentrations of DMSO led to an increase
in fluorescence and a shift of the emission maximum to shorter
MANT-cNMPs and Phosphodiesterases
PLOS ONE | www.plosone.org 11 January 2013 | Volume 8 | Issue 1 | e54158
wavelengths. All other tested MANT-cNMPs and MANT-NMPs
showed similar behavior (data not shown).
(TIF)
Figure S3 Representative emission spectra of MANT-cNMPs and MANT-NMPs. Concentration of each nucleotide
was 10 mM. For each MANT-cNMP/MANT-NMP couple the
excitation wavelength providing the best discriminatory power
(table 1) was selected. A-E show the spectra without DMSO
whereas in F-K 200 ml of DMSO was added to each 100 ml
sample before the spectra were detected. Final DMSO concen-
tration was 67% (v/v). Note that relative fluorescence units (RFU)
are not necessarily comparable between the particular figures.
Data shown are the means 6 SD of 3 experiments. Note that in
some instances, SD values are too small to be seen.
(TIF)
Figure S4 Thin layer chromatography validation exper-iment with MANT-cAMP and PDE3A. Incubation times of 10
to 60 minutes are shown. 10 mM MANT-cAMP and 10 mM
MANT-AMP were used as standards. After visualizing the samples
at 366 nm (A), they were scraped off the chromatography plate,
eluted and DMSO was added. B shows the resulting emission
spectra for the respective reaction times. A nonfluorescing spot was
used as control. The Rf values for each MANT-cNMP and
MANT-NMP tested are displayed in table S1. In A, only the blue
color channel of the original image is shown and the contrast of
the entire image was enhanced via post processing.
(TIF)
Figure S5 Representative emission spectra of selectedMANT-cNMPs and PDEs used for calculation of thereaction rates displayed in table 2. Incubation time was 60
minutes, excitation wavelengths were varied to provide ideal
discriminatory power for each MANT-cNMP/MANT-NMP
couple as stated in table 1. DMSO was added to samples
containing MANT-cAMP or MANT-cUMP before recording the
emission spectra. Concentrations and further reaction conditions
were as described in the materials and methods section. Note, that
relative fluorescence units (RFU) are not necessarily comparable
between the particular graphs.
(TIF)
Table S1 Rf-values determined by thin layer chromatography
(figure S4) compared to values from literature [40]. (n = 5–8).
(DOC)
Acknowledgments
We thank Mrs. Marina Golombek, Mrs. Undine Manzau and Mrs. Ursula
Havemann for expert technical assistance. Thanks are also due to the
reviewers for their most helpful suggestions.
Author Contributions
Conceived and designed the experiments: DR RS. Performed the
experiments: DR. Analyzed the data: DR RS. Contributed reagents/
materials/analysis tools: FS HGG. Wrote the paper: DR FS HGG RS.
References
1. Kots AY, Martin E, Sharina IG, Murad F (2009) A short history of cGMP,
guanylyl cyclases, and cGMP-dependent protein kinases. Hand. Ep. Pharmacol
191: 1–14.
2. Rehmann H, Wittinghofer A, Bos JL (2007) Capturing cyclic nucleotides in
action: snapshots from crystallographic studies. Nat Rev Mol Cell Biol 8: 63–73.
3. Hofmann F, Bernhard D, Lukowski R, Weinmeister P (2009) cGMP regulated
protein kinases (cGK). Handb Exp Pharmacol 191: 137–162.
4. Dessauer CW (2009) Adenylyl cyclase-A-kinase anchoring protein complexes:the next dimension in cAMP signaling. Mol Pharmacol 76: 935–941.
5. Cech SY, Ignarro LJ (1977) Cytidine 39,59-monophosphate (cyclic CMP)
formation in mammalian tissues. Science 198: 1063–1065.
6. Gaion RM, Krishna G (1979) Cytidylate cyclase: the product isolated by themethod of Cech and Ignarro is not cytidine 39,59-monophosphate. Biochem
Biophys Res Commun 86: 105–111.
7. Newton RP, Salih SG, Salvage BJ, Kingston EE (1984) Extraction, purificationand identification of cytidine 39,59-cyclic monophosphate from rat tissues.
Biochem J 221: 665–673.
8. Newton RP, Kingston EE, Hakeem NA, Salih SG, Beynon JH, et al. (1986)Extraction, purification, identification and metabolism of 39,59-cyclic UMP,
39,59-cyclic IMP and 39,59-cyclic dTMP from rat tissues. Biochem J 236: 431–
439.
9. Helfman DM, Katoh N, Kuo JF (1984) Purification and properties of cyclicCMP phosphodiesterase. Adv Cyclic Nucleotide Protein Phosphorylation Res
16: 403–416.
10. Newton RP, Bayliss MA, Khan JA, Bastani A, Wilkins AC, et al. (1999) Kineticanalysis of cyclic CMP-specific and multifunctional phosphodiesterases by
quantitative positive-ion fast atom bombardment mass spectrometry. RapidCommun Mass Spectrom 13: 574–584.
11. Klotz U, Stock K (1971) Evidence for a cyclic nucleotide-phosphodiesterase with
high specificity for cyclic uridine-39,59-monophosphate in rat adipose tissue.
Naunyn-Schmiedebergs Arch Pharmacol 269: 117–120.
12. Anderson TR (1982) Cyclic cytidine 39,59-monophosphate (cCMP) in cell
regulation. Mol Cell Endocrinol 28: 373–385.
13. Ervens J, Seifert R (1991) Differential modulation by N4,29-O-dibutyryl cytidine
39:59-cyclic monophosphate of neutrophil activation. Biochem Biophys ResCommun 174: 258–267.
14. Bloch A, Dutschman G, Maue R (1974) Cytidine 39,59-monophosphate (cyclic
CMP). II. Initiation of leukemia L-1210 cell growth in vitro. Biochem BiophysRes Commun 59: 955–959.
15. Burhenne H, Beste KY, Spangler CM, Voigt U, Kaever V, et al. (2011)
Determination of cytidine 39,59-cyclic monophosphate and uridine 39,59-cyclicmonophosphate in mammalian cell systems and in human urine by high-
performance liquid chromatography/mass spectrometry Naunyn-Schmiede-
bergs Arch Pharmacol 383 (Suppl.), P096.
16. Beste KY, Burhenne H, Kaever V, Stasch JP, Seifert R (2011) Nucleotidyl
cyclase activity of soluble guanylyl cyclase a1b1. Biochemistry 51: 194–204.
17. Beste KY, Seifert R (2012) Do cCMP, cUMP, cTMP, cIMP and cXMP play a
role as second messengers? Development of a hypothesis based on studies with
soluble guanylyl cyclase a1b1. Biol Chem 2012 Oct 17. pii:/j/bchm.just-
accepted/hsz-2012–0282/hsz-2012–0282.xml. doi: 10.1515/hsz-2012–0282.
[Epub ahead of print.
18. Beste K, Hinz C, Kaever V, Seifert R (2012) Regulation of intracellular cCMP
and cUMP concentrations by bicarbonate. Naunyn-Schmiedebergs Arch
Pharmacol 385 (Suppl 1), S10.
19. Wolter S, Golombek M, Seifert R (2011) Differential activation of cAMP- and
cGMP-dependent protein kinases by cyclic purine and pyrimidine nucleotides.
Biochem. Biophys Res Commun 415: 563–566.
20. Hammerschmidt A, Chatterji B, Zeiser J, Schroder A, Genieser HG, et al. (2012)
Binding of regulatory subunits of cyclic AMP-dependent protein kinase to cyclic
CMP agarose. PLoS One 7: e39848.
21. Ding S, Bond AE, Lemiere F, Tuytten R, Esmans EL, et al. (2008) Online
immobilized metal affinity chromatography/mass spectrometric analysis of
changes elicited by cCMP in the murine brain phosphoproteome. Rapid
Commun Mass Spectrom 22: 4129–4138.
22. Zong X, Krause S, Chen CC, Krueger J, Gruner C, et al. (2012) Regulation of
hyperpolarization-activated cyclic nucleotide-gated (HCN) channel activity by
cCMP. J Biol Chem 287: 26506–26512.
23. Desch M, Schinner E, Kees F, Hofmann F, Seifert R, et al. (2010). Cyclic
cytidine 39,59-monophosphate (cCMP) signals via cGMP kinase I. FEBS Lett
584: 3979–3984.
24. Gottle M, Dove S, Kees F, Schlossmann J, Geduhn J, et al. (2010) Cytidylyl and
uridylyl cyclase activity of Bacillus anthracis edema factor and Bordetella pertussis
CyaA. Biochemistry 49: 5494–5503.
25. Bender AT, Beavo JA (2006) Cyclic nucleotide phosphodiesterases: molecular
regulation to clinical use. Pharmacol Rev 58: 488–520.
26. Francis SH, Corbin JD, Bischoff E (2009) Cyclic GMP-hydrolyzing phospho-
diesterases. Handb Exp Pharmacol 191: 367–408.
27. Conti M, Beavo J (2007) Biochemistry and physiology of cyclic nucleotide
phosphodiesterases: essential components in cyclic nucleotide signaling. Annu
Rev Biochem 76: 481–511.
28. Hardman JG, Sutherland EW (1965) A cyclic 39,59-nucleotide phosphodiester-
ase from heart with specificity for uridine 39,59-phosphate. J Biol Chem 240:
3704–3705.
29. Reinecke D, Burhenne H, Sandner P, Kaever V, Seifert R (2011) Human cyclic
nucleotide phosphodiesterases possess a much broader substrate-specificity than
previously appreciated. FEBS Lett 585: 3259–3262.
MANT-cNMPs and Phosphodiesterases
PLOS ONE | www.plosone.org 12 January 2013 | Volume 8 | Issue 1 | e54158
30. Ren J, Goss DJ (1996) Synthesis of a fluorescent 7-methylguanosine analog and a
fluorescence spectroscopic study of its reaction with wheatgerm cap bindingproteins. Nucleic Acid Res 24: 3629–3634.
31. Rensland H, John J, Linke R, Simon I, Schlichting I, et al. (1995) Substrate and
product structural requirements for binding of nucleotides to H-ras p21: themechanism of discrimination between guanosine and adenosine nucleotides.
Biochemistry 34: 593–599.32. Mou TC, Gille A, Fancy DA, Seifert R, Sprang SR (2005) Structural basis for
the inhibition of mammalian membrane adenylyl cyclase by 29(39)-O-(N-
methylanthraniloyl)-guanosine 59-triphosphate. J Biol Chem 280: 7253–7261.33. Taha HM, Schmidt J, Gottle M, Suryanarayana S, Shen Y, et al. (2009)
Molecular analysis of the interaction of anthrax adenylyl cyclase toxin, edemafactor, with 29(39)-O-(N-(methyl)anthraniloyl)-substituted purine and pyrimidine
nucleotides. Mol Pharmacol 75: 693–703.34. Gottle M, Dove S, Steindel P, Shen Y, Tang WJ, et al. (2007) Molecular analysis
of the interaction of Bordetella pertussis adenylyl cyclase with fluorescent
nucleotides. Mol Pharmacol 72: 526–535.35. Geduhn J, Dove S, Shen Y, Tang WJ, Konig B, et al. (2011) Bis-halogen-
anthraniloyl-substituted nucleoside 59-triphosphates as potent and selectiveinhibitors of Bordetella pertussis adenylyl cyclase toxin. J Pharmacol Exp Ther 336:
104–15.
36. Sullivan SM, Mishra R, Neubig RR, Maddock JR (2000) Analysis of guaninenucleotide binding and exchange kinetics of the Escherichia coli GTPase Era.
J Bacteriol 182: 3460–3466.37. Pinto C, Lushington GH, Richter M, Gille A, Geduhn J, et al. (2011) Structure-
activity relationships fort he interactions of 29- and 39-O-(N-methyl)anthraniloyl-substituted purine and pyrimidine nucleotides with mammalian adenylyl
cyclases. Biochem Pharmacol 82: 358–370.
38. Pisareva VP, Pisarev AV, Hellen CU, Rodnina MV, Pestova TV (2006) Kineticanalysis of interaction of eukaryotic release factor 3 with guanine nucleotides.
J Biol Chem 281: 40224–40235.
39. Sharma IM, Dhanaraman T, Mathew R, Chatterji D (2012) Synthesis and
characterization of a fluorescent analogue of cyclic di-GMP. Biochemistry 51:
5443–5453.
40. Hiratsuka T (1982) New fluorescent analogs of cAMP and cGMP available as
substrates for cyclic nucleotide phosphodiesterase. J Biol Chem 257: 13354–
13358.
41. Johnson JD, Walters JD, Mills JS (1987) A continuous fluorescence assay for
cyclic nucleotide phosphodiesterase hydrolysis of cyclic GMP. Anal Biochem
162: 291–295.
42. Gopalakrishna R, Anderson WB (1982) Ca2+-induced hydrophobic site on
calmodulin: application for purification of calmodulin by phenyl-sepharose
affinity chromatography. Biochem Biophys Res Commun 29: 830–836.
43. Hiratsuka T (1983) New ribose-modified fluorescent analogs of adenine and
guanine nucleotides available as substrates for various enzymes. Biochim
Biophys Acta 742: 496–508.
44. Kincaid RL, Stith-Coleman IE, Vaughan M (1985) Proteolytic activation of
calmodulin-dependent cyclic nucleotide phosphodiesterase. J Biol Chem 260:
9009–9015.
45. Chaudhry PS, Casillas ER (1988) Calmodulin-stimulated cyclic nucleotide
phosphodiesterases in plasma membranes of bovine epididymal spermatozoa.
Arch Biochem Biophys 262: 439–444.
46. Berridge MJ, Lipp P, Bootman MD (2000) The versatility and universality of
calcium signalling. Nat Rev Mol Cell Biol 1: 11–12.
47. Sager G (2004) Cyclic GMP transporters. Neurochem Int 45: 865–873.
48. Borgognone A, Pulcinelli FM (2012) Reduction of cAMP and cGMP inhibitory
effects in human platelets by MRP4-mediated transport. Thromb. Haemost. 108
PMID: 23014861.
49. Wielinga PR, van der Heijden I, Reid G, Beijnen JH, Wijnholds J, et al. (2003)
Characterization of the MRP4- and MRP5-mediated transport of cyclic
nucleotides from intact cells. J Biol Chem 278: 17664–17671.
MANT-cNMPs and Phosphodiesterases
PLOS ONE | www.plosone.org 13 January 2013 | Volume 8 | Issue 1 | e54158