an economic assessment and feasibility study of how the uk ... · an economic assessment and...
TRANSCRIPT
An economic assessment and feasibility study of how the UK could meet the Circular Economy Package recycling targets
___________________________________________________
Report for the Environmental Services Association
An economic assessment and feasibility study of how the UK could meet the Circular Economy Package recycling targets
Ricardo Energy & Environment
Customer: Contact:
Environmental Service Association Sarahjane Widdowson Ricardo Energy & Environment Gemini Building, Harwell, Didcot, OX11 0QR, United Kingdom
t: +44 (0) 1235 75 3260
Ricardo-AEA Ltd is certificated to ISO9001 and ISO14001
Customer reference:
ESA
Confidentiality, copyright & reproduction:
This report is the Copyright of Ricardo Energy & Environment, a trading name of Ricardo-AEA Ltd and has been prepared by Ricardo Energy & Environment under contract to the Environmental Services Association for Waste Policy Review, Jan 2018. The contents of this report may not be reproduced in whole or in part, nor passed to any organisation or person without the specific prior written permission of the Commercial Manager at Ricardo Energy & Environment. Ricardo Energy & Environment accepts no liability whatsoever to any third party for any loss or damage arising from any interpretation or use of the information contained in this report, or reliance on any views expressed therein, other than the liability that is agreed in the said contract
Author:
Simone Aplin, John Woodruff, Jamie Warmington, Josephine Brown
Approved By:
Sarahjane Widdowson
Date:
09 May 2018
Ricardo Energy & Environment reference:
Ref: ED11115101- Issue Number 5
An economic assessment and feasibility study of how the UK could meet the Circular Economy Package recycling targets
Ricardo Energy & Environment
Foreword The UK is struggling to meet the EU’s existing targets for 50% household recycling. This is largely due
to a historic lack of funding and policy support in England – particularly on end-markets for recyclates
– essential to driving recycling rates higher.
Current policy delivers current outcomes. If we want higher recycling rates then we will need fresh
interventions and additional funding. This report investigates what additional costs and interventions
would be required to meet the higher weight-based recycling targets contained in the forthcoming EU
Circular Economy Package. Moving from our current municipal recycling rate of around 50% to the
target figure of 65% would of course necessitate performance to jump by one third. Both household and
commercial recycling would need to be radically improved.
Local Authorities could in theory reduce their residual waste collection frequencies to free up cash to
be reinvested in the introduction of new services to boost collection rates, such as separate food waste
collections where these are not already in place. Ricardo’s research finds that this might push up the
blended municipal recycling rate by a few percentage points, but nowhere near enough to get close to
the much higher targets envisaged by the EU.
To do that would require both the addition of more costly services to household collections, and a large
boost to commercial recycling rates. The former requirement opens up the obvious question: where will
the money come from? Under chronic financial pressure, Councils are already doing everything they
can to save money and are ill-placed to bear additional costs. Instead, we could ask producers to pay
more into the system, and indeed ESA hopes the government’s forthcoming Resources & Waste
Strategy will include precisely these measures. The second requirement of higher commercial recycling
rates will simply not happen without much stronger intervention on end-markets to ‘pull’ recycled
materials through the system.
Brexit opens up the opportunity for the UK to do something different and move away from the EU’s
target regime. ESA believes that this should be seriously explored as part of Defra’s strategy and has
commissioned Ricardo to complete a follow-up report investigating what alternatives to blunt weight-
based instruments the UK could adopt in a post-Brexit world.
The current weight-based approach doesn’t accurately reflect environmental outcomes and distorts
behaviour in the sector by incentivising the collection of heavy, low value materials. Higher weight-
based targets would distort behaviour even more. There must be a smarter way, which targets value
and is more closely aligned with environmental objectives, including the UK’s carbon budgets. ESA
would support a bold and radical approach.
Jacob Hayler
Executive Director
An economic assessment and feasibility study of how the UK could meet the Circular Economy Package recycling targets
Ricardo Energy & Environment
Executive summary Following the publication of the Environmental Services Association (ESA) commissioned UK Residual
Waste: 2030 Market Review1 report in January a number of waste policy related issues were brought
into focus that warranted further investigation, these included two key questions:
- What policies would be required to deliver different recycling scenarios and at what cost?
- What could replace weight based targets in a post-Brexit world
The focus on policy is very timely. Work is being undertaken to influence and develop policies that will
potentially impact on the arisings, composition, management, recycling and disposal of waste in
England. At the same time, the European Union (EU), including the British Government, have recently
finished debating the implementation of the EU’s Circular Economy Package. This could result in
significant new policy impacts on fundamental aspects of waste management including new recycling
and recovery targets for municipal and similar commercial and industrial (C&I) wastes – these need to
be fully understood.
A healthy, productive resource economy requires action across the supply chain including:
products that are placed onto the market that are ultimately easy to recycle
a supportive policy and regulatory framework that makes it easy for residents and businesses
to display the right behaviours and, that can address the wrong behaviours
available and economically viable end markets so that quality materials can be recycled and
the materials produced used again, maximising material productivity.
Without a coherent strategy across all elements which both pushes and pulls materials through the
supply chain recycling levels can stagnate and end markets collapse.
Weight based targets for recycling have been in place for a number of years and have been successful
in driving recycling rates - to a point. Weight has been used as a proxy for recycling performance but it
does have limitations. Our current weight based system can distort behaviour, incentivising the
collection of heavy, low-value materials such as garden waste and not prioritising the best
environmental outcome for individual material streams.
The recycling targets required under the Circular Economy Package are weight based and this report
looks at what England would need to do to meet the 60% recycling target by 2030 including what
changes in operations would be required for our Local Authorities and Businesses to increase recycling
and how much it might cost. It focusses on the areas that ESA members can control – end of life and
end of use.
The second report in this series considers whether alternative measures or metrics to our current weight
based system might be better in terms of driving environmental performance and value recovered from
our resources.
England needs a balanced approach which delivers increased recycling and greater levels of recovery.
Taking a step back to review the whole system will allow better metrics to be developed, which in turn
will support better decisions.
1 http://www.esauk.org/esa_reports/UK_Residual_Waste_Capacity_Gap_Analysis.pdf
An economic assessment and feasibility study of how the UK could meet the Circular Economy Package recycling targets
Ricardo Energy & Environment
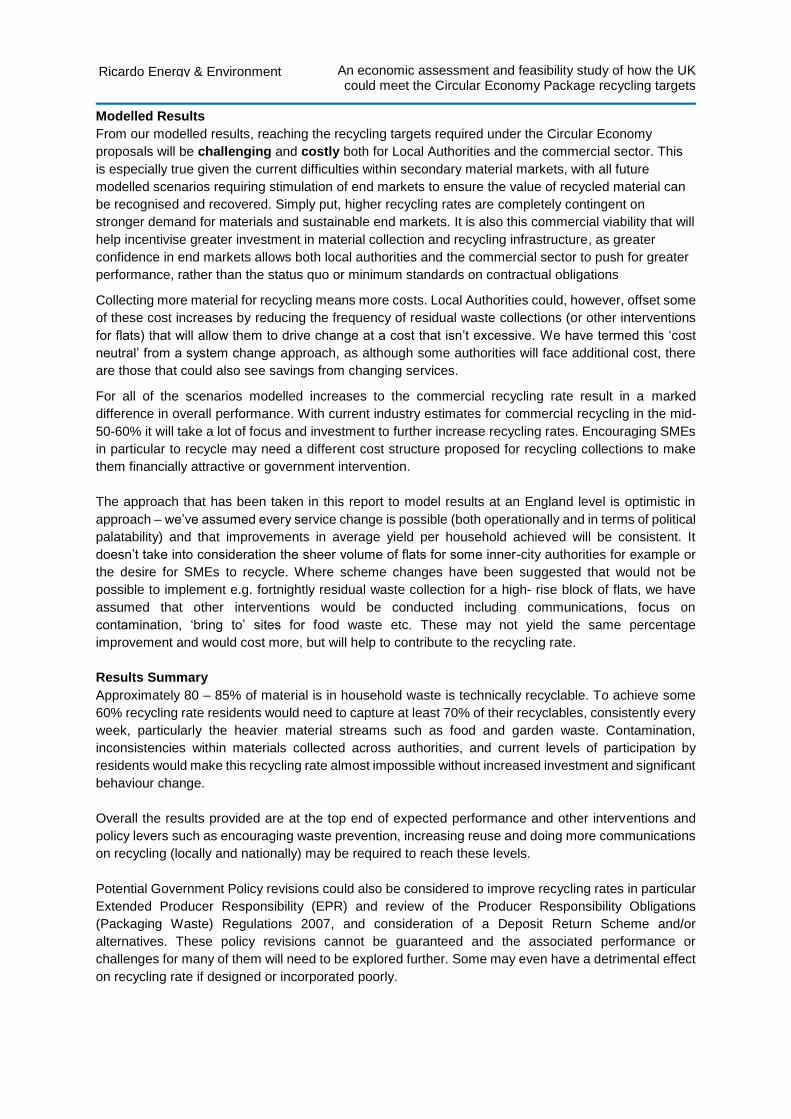
Modelled Results
From our modelled results, reaching the recycling targets required under the Circular Economy
proposals will be challenging and costly both for Local Authorities and the commercial sector. This
is especially true given the current difficulties within secondary material markets, with all future
modelled scenarios requiring stimulation of end markets to ensure the value of recycled material can
be recognised and recovered. Simply put, higher recycling rates are completely contingent on
stronger demand for materials and sustainable end markets. It is also this commercial viability that will
help incentivise greater investment in material collection and recycling infrastructure, as greater
confidence in end markets allows both local authorities and the commercial sector to push for greater
performance, rather than the status quo or minimum standards on contractual obligations
Collecting more material for recycling means more costs. Local Authorities could, however, offset some
of these cost increases by reducing the frequency of residual waste collections (or other interventions
for flats) that will allow them to drive change at a cost that isn’t excessive. We have termed this ‘cost
neutral’ from a system change approach, as although some authorities will face additional cost, there
are those that could also see savings from changing services.
For all of the scenarios modelled increases to the commercial recycling rate result in a marked
difference in overall performance. With current industry estimates for commercial recycling in the mid-
50-60% it will take a lot of focus and investment to further increase recycling rates. Encouraging SMEs
in particular to recycle may need a different cost structure proposed for recycling collections to make
them financially attractive or government intervention.
The approach that has been taken in this report to model results at an England level is optimistic in
approach – we’ve assumed every service change is possible (both operationally and in terms of political
palatability) and that improvements in average yield per household achieved will be consistent. It
doesn’t take into consideration the sheer volume of flats for some inner-city authorities for example or
the desire for SMEs to recycle. Where scheme changes have been suggested that would not be
possible to implement e.g. fortnightly residual waste collection for a high- rise block of flats, we have
assumed that other interventions would be conducted including communications, focus on
contamination, ‘bring to’ sites for food waste etc. These may not yield the same percentage
improvement and would cost more, but will help to contribute to the recycling rate.
Results Summary
Approximately 80 – 85% of material is in household waste is technically recyclable. To achieve some
60% recycling rate residents would need to capture at least 70% of their recyclables, consistently every
week, particularly the heavier material streams such as food and garden waste. Contamination,
inconsistencies within materials collected across authorities, and current levels of participation by
residents would make this recycling rate almost impossible without increased investment and significant
behaviour change.
Overall the results provided are at the top end of expected performance and other interventions and
policy levers such as encouraging waste prevention, increasing reuse and doing more communications
on recycling (locally and nationally) may be required to reach these levels.
Potential Government Policy revisions could also be considered to improve recycling rates in particular
Extended Producer Responsibility (EPR) and review of the Producer Responsibility Obligations
(Packaging Waste) Regulations 2007, and consideration of a Deposit Return Scheme and/or
alternatives. These policy revisions cannot be guaranteed and the associated performance or
challenges for many of them will need to be explored further. Some may even have a detrimental effect
on recycling rate if designed or incorporated poorly.
An economic assessment and feasibility study of how the UK could meet the Circular Economy Package recycling targets
Ricardo Energy & Environment
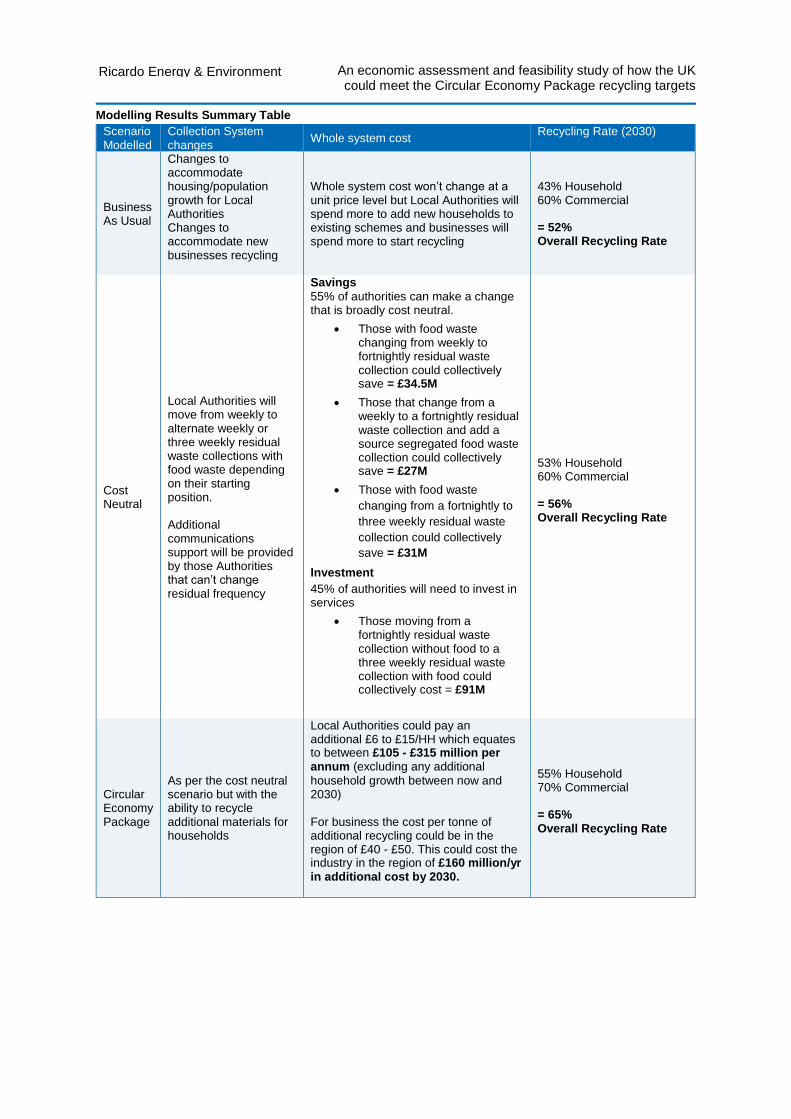
Modelling Results Summary Table
Scenario Modelled
Collection System changes
Whole system cost Recycling Rate (2030)
Business As Usual
Changes to accommodate housing/population growth for Local Authorities Changes to accommodate new businesses recycling
Whole system cost won’t change at a unit price level but Local Authorities will spend more to add new households to existing schemes and businesses will spend more to start recycling
43% Household 60% Commercial = 52% Overall Recycling Rate
Cost Neutral
Local Authorities will move from weekly to alternate weekly or three weekly residual waste collections with food waste depending on their starting position. Additional communications support will be provided by those Authorities that can’t change residual frequency
Savings
55% of authorities can make a change that is broadly cost neutral.
Those with food waste changing from weekly to fortnightly residual waste collection could collectively save = £34.5M
Those that change from a weekly to a fortnightly residual waste collection and add a source segregated food waste collection could collectively save = £27M
Those with food waste
changing from a fortnightly to
three weekly residual waste
collection could collectively
save = £31M
Investment
45% of authorities will need to invest in services
Those moving from a fortnightly residual waste collection without food to a three weekly residual waste collection with food could collectively cost = £91M
53% Household 60% Commercial = 56% Overall Recycling Rate
Circular Economy Package
As per the cost neutral scenario but with the ability to recycle additional materials for households
Local Authorities could pay an additional £6 to £15/HH which equates to between £105 - £315 million per annum (excluding any additional
household growth between now and 2030) For business the cost per tonne of additional recycling could be in the region of £40 - £50. This could cost the industry in the region of £160 million/yr in additional cost by 2030.
55% Household 70% Commercial = 65% Overall Recycling Rate
An economic assessment and feasibility study of how the UK could meet the Circular Economy Package recycling targets
Ricardo Energy & Environment
In summary – by 2030
A business as usual scenario will allow England to achieve an overall recycling rate of 52%,
increasing levels of commercial recycling will be needed to move to higher rates
If Local Authorities move towards reduced frequency of residual waste collections with food
waste and if commercial recycling reaches 60% we are likely to achieve an overall recycling
rate of 56%
This will be broadly cost neutral for the majority of authorities. Political (residents may
not want reduced frequencies) and practical (Local Authorities need all savings and
therefore don’t reinvest in separate food collections) constraints may however reduce
the likelihood of some authorities adopting the required changes, which would result
in a lower recycling rate.
With additional measures we could get to an overall recycling rate of 65% but it will be difficult
and could cost significantly more to deliver
Additional cost to Local Authorities = £105 – 315M per annum
Additional cost to commercial sector = £160m p.a.
All scenarios are only possible in the event that the Government introduces policy to
strengthen end markets for the use of recycled materials. One such solution could be reform
of EPR
Alternative metrics to weight should be considered as part of the forthcoming Defra strategy
to help identify the optimal balance between recycling and recovery to enable England to
maximise the value from its resources. The forthcoming second report will identify options for
aligning recycling metrics with environmental outcomes and value.
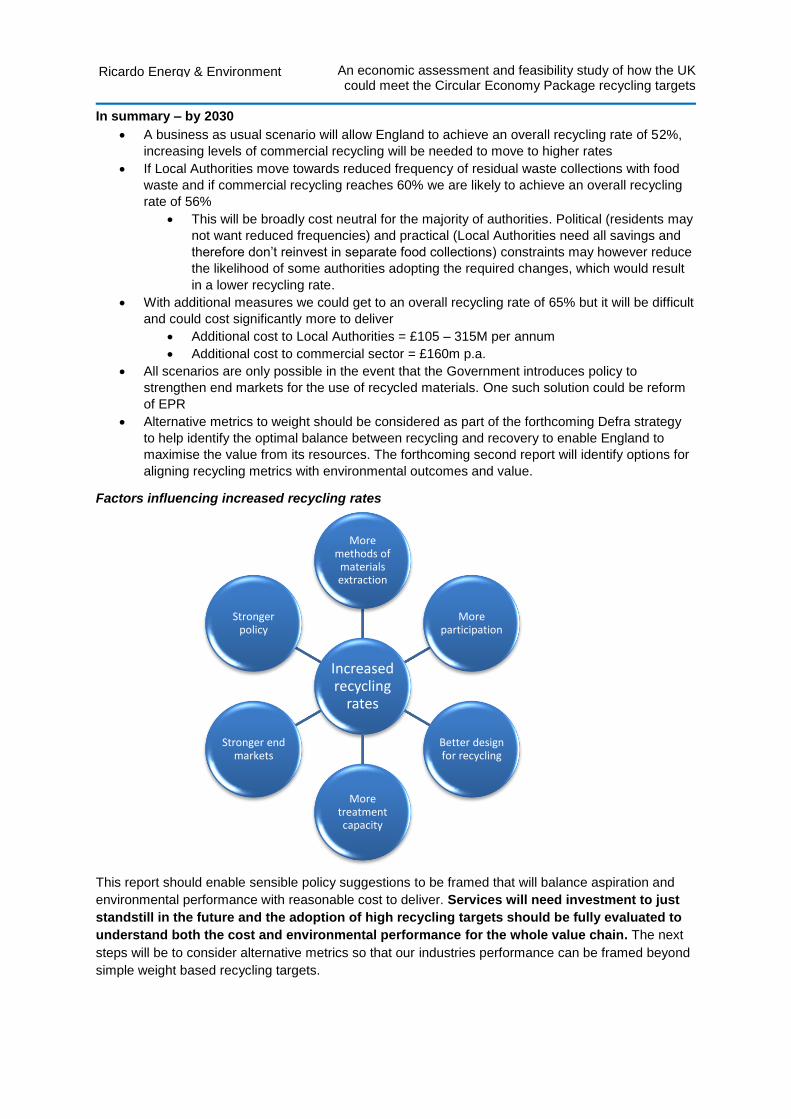
Factors influencing increased recycling rates
This report should enable sensible policy suggestions to be framed that will balance aspiration and
environmental performance with reasonable cost to deliver. Services will need investment to just
standstill in the future and the adoption of high recycling targets should be fully evaluated to
understand both the cost and environmental performance for the whole value chain. The next
steps will be to consider alternative metrics so that our industries performance can be framed beyond
simple weight based recycling targets.
Increased recycling
rates
More methods of
materials extraction
More participation
Better design for recycling
More treatment capacity
Stronger end markets
Stronger policy
An economic assessment and feasibility study of how the UK could meet the Circular Economy Package recycling targets
Ricardo Energy & Environment
Table of contents 1 Introduction ................................................................................................................ 1
1.1 Project Methodology .......................................................................................................... 2 1.2 The Current Policy Context ............................................................................................... 3
1.2.1 A Green Future: Our 25 year Plan to Improve the Environment .............................. 4 1.2.2 Clean growth Strategy .............................................................................................. 6 1.2.3 Industrial Strategy .................................................................................................... 6 1.2.4 Potential effects of the EU Circular Economy Package ........................................... 7 1.2.5 Potential impacts from Brexit ................................................................................... 8
1.3 Current progress towards the recycling targets ................................................................ 9
2 Our Modelling Approach ......................................................................................... 11 2.1 Policy context for modelled outcomes ............................................................................. 11
2.1.1 Integrations with existing drivers in the market ...................................................... 11 2.1.2 Stimulation of end markets ..................................................................................... 12
2.1.2.1 EPR and review of PRN ............................................................................... 13 2.1.2.2 DRS and Alternatives ................................................................................... 14
2.2 Local Authority modelling ................................................................................................ 16 2.3 Commercial Waste .......................................................................................................... 18 2.4 Recycling Scenarios ........................................................................................................ 19
2.4.1 Timescales ............................................................................................................. 19 2.4.2 Business as usual .................................................................................................. 19
2.4.2.1 Mix of Household and Non-household ......................................................... 19 2.4.2.2 Local Authority requirement ......................................................................... 19 2.4.2.3 Commercial requirement .............................................................................. 19 2.4.2.4 Residual Waste Treatment .......................................................................... 20
2.4.3 Relatively cost neutral ............................................................................................ 20 2.4.3.1 Mix of Household and Non-household ......................................................... 20 2.4.3.2 Local Authority requirement ......................................................................... 20 2.4.3.3 Commercial requirement .............................................................................. 21 2.4.3.4 Residual Treatment ...................................................................................... 21
2.4.4 CE package ............................................................................................................ 21 2.4.4.1 Mix of Household and Non-household ......................................................... 21 2.4.4.2 Local Authority requirement ......................................................................... 21 2.4.4.3 Commercial requirement .............................................................................. 22 2.4.4.4 Residual Treatment ...................................................................................... 22
3 Methodology and Data Sources .............................................................................. 22 3.1 Data Sources ................................................................................................................... 22 3.2 Business as usual ........................................................................................................... 22
3.2.1 Mix of Household and Non-household ................................................................... 22 3.2.2 Local Authority requirement ................................................................................... 22
3.2.2.1 Baseline Profile ............................................................................................ 22 3.2.3 Commercial requirement ........................................................................................ 23 3.2.4 Residual Treatment ................................................................................................ 23
3.3 Relatively cost neutral ..................................................................................................... 23 3.3.1 Mix of Household and Non-household ................................................................... 23 3.3.2 Local Authority requirement ................................................................................... 23
3.3.2.1 Fortnightly residual collections and recycling uplift ...................................... 23 3.3.2.2 Waste minimisation ...................................................................................... 24 3.3.2.3 Food ............................................................................................................. 24
An economic assessment and feasibility study of how the UK could meet the Circular Economy Package recycling targets
Ricardo Energy & Environment
3.3.2.4 3 Weekly residual collections and waste minimisation ................................ 25 3.3.2.5 Food ............................................................................................................. 25
3.3.3 Commercial requirement ........................................................................................ 25 3.3.3.1 Cost .............................................................................................................. 25 3.3.3.2 Local procurement arrangements ................................................................ 25 3.3.3.3 Greater awareness of social responsibility .................................................. 26 3.3.3.4 Increased take up of local authority collections ........................................... 26
3.3.4 Residual treatment ................................................................................................. 26 3.4 CE package ..................................................................................................................... 26
3.4.1 Mix of Household and Non-household ................................................................... 26 3.4.2 Local Authority requirement ................................................................................... 26
3.4.2.1 Alternative Materials..................................................................................... 26 3.4.3 Commercial requirement ........................................................................................ 27
3.4.3.1 Mandatory segregation of food and dry recycling ........................................ 27 3.4.4 Residual Treatment ................................................................................................ 28
4 Modelling Results .................................................................................................... 29 4.1 Business As Usual Scenario ........................................................................................... 29
4.1.1 Recycling rate ......................................................................................................... 29 4.1.2 Treatment Capacity gap ......................................................................................... 30 4.1.3 Cost ........................................................................................................................ 31
4.2 Cost Neutral ..................................................................................................................... 32 4.2.1 Recycling rate ......................................................................................................... 32 4.2.2 Cost ........................................................................................................................ 33 4.2.3 Treatment Capacity gap ......................................................................................... 36
4.3 CE Package ..................................................................................................................... 36 4.3.1 Recycling rate ......................................................................................................... 36 4.3.2 Cost ........................................................................................................................ 37
4.3.2.2 Commercial costs ......................................................................................... 38 4.3.3 Treatment Capacity gap ......................................................................................... 38
4.4 Sensitivities ...................................................................................................................... 39 4.4.1 Rurality 1 & 2 authorities - no residual collection frequency change ..................... 39 4.4.2 No residual collection frequency change for all authorities .................................... 40
5 Other potential levers .............................................................................................. 41 5.1 Improvements to current operational activities. ............................................................... 42
5.1.1 Improvement 1 - Fly-tipped waste .......................................................................... 42 5.1.2 Improvement 2 – Co-collection of Commercial waste with Bulk collections from
HMO’s ................................................................................................................................ 42 5.1.3 Improvement 3 – Street Sweeping recycling.......................................................... 42 5.1.4 Improvement 4 – Re-use ........................................................................................ 43
5.2 Communications .............................................................................................................. 44 5.3 Government Policy Revisions ......................................................................................... 44
5.3.1 Policy 1 – Incinerator Bottom Ash .......................................................................... 44 5.3.2 Policy 2 – Leaves ................................................................................................... 45
5.4 Policy 3 – Review of Deregulation Act ............................................................................ 46 5.5 Policy 4 – Pay As You Throw (PAYT) ............................................................................. 46 5.6 Policy 5 – Green Garden Waste...................................................................................... 49
6 Summary .................................................................................................................. 50
6.1 Alternative Metrics ........................................................................................................... 52
An economic assessment and feasibility study of how the UK
could meet the Circular Economy Package recycling targets
1
Ricardo Energy & Environment
1 Introduction Following the publication of the Environmental Services Association (ESA) commissioned UK Residual
Waste: 2030 Market Review2 report in January a number of waste policy related issues were brought
into focus that warranted further investigation, these included two key questions:
- What policies would be required to deliver different recycling scenarios and at what cost?
- What could replace weight based targets in a post-Brexit world?
The focus on policy is very timely. Following a long period of stagnation, work is being undertaken to
influence and develop policies that will potentially impact on the arisings, composition, management,
recycling and disposal of waste in England. At the same time, the European Union (EU), including the
British Government, have recently finished debating the implementation of the EU’s Circular Economy
Package. This could result in significant new policy impacts on fundamental aspects of waste
management including new recycling and recovery targets for municipal and similar commercial and
industrial (C&I) wastes.
The alignment of the 25 Year Environment Plan, BEIS’s Clean Growth Strategy and Industrial Strategy,
the National Infrastructure Commission’s Waste Infrastructure analysis for 2020-2050 and Defra’s
Resources & Waste Strategy offers the potential for a clear framework and substantial opportunity for
our sector.
A healthy resource economy requires action across the value chain including:
products that are placed onto the market that are ultimately easy to recycle
a supportive policy and regulatory framework that makes it easy for residents and businesses
to display the right behaviours and can address the wrong behaviours
available and economically viable end markets so that quality materials can be recycled and
the materials produced used again.
Without a coherent strategy across all elements which both pushes and pulls materials through the
respective supply chains failure is likely and recycling levels will stagnate and end markets will collapse.
The value and supply chains must work together to achieve a sustainable resource economy which in
turn stimulates higher recycling rates (Figure 1)
This makes it critical for the ESA to review policy options for the sector and identify the positions that
would most benefit its members, the sector and the environment. Without policy certainly, there is a
risk that the UK could continue to feel the impact of a loss of confidence by investors and that ultimately,
the infrastructure required to address current and future waste management is not delivered.
This report addresses the first question – what policies would be required to deliver different recycling
scenarios and at what cost (and therefore will there continue to be a capacity gap in the future)?
2 http://www.esauk.org/esa_reports/UK_Residual_Waste_Capacity_Gap_Analysis.pdf
An economic assessment and feasibility study of how the UK
could meet the Circular Economy Package recycling targets
2
Ricardo Energy & Environment
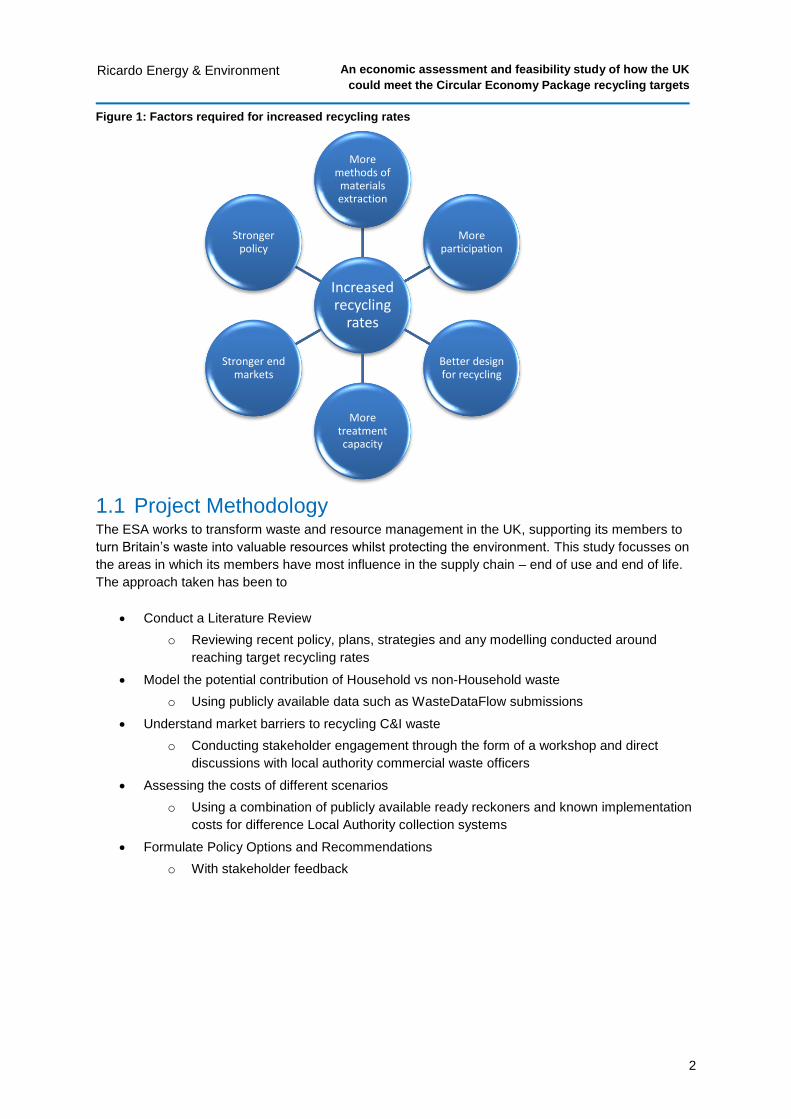
Figure 1: Factors required for increased recycling rates
1.1 Project Methodology The ESA works to transform waste and resource management in the UK, supporting its members to
turn Britain’s waste into valuable resources whilst protecting the environment. This study focusses on
the areas in which its members have most influence in the supply chain – end of use and end of life.
The approach taken has been to
Conduct a Literature Review
o Reviewing recent policy, plans, strategies and any modelling conducted around
reaching target recycling rates
Model the potential contribution of Household vs non-Household waste
o Using publicly available data such as WasteDataFlow submissions
Understand market barriers to recycling C&I waste
o Conducting stakeholder engagement through the form of a workshop and direct
discussions with local authority commercial waste officers
Assessing the costs of different scenarios
o Using a combination of publicly available ready reckoners and known implementation
costs for difference Local Authority collection systems
Formulate Policy Options and Recommendations
o With stakeholder feedback
Increased recycling
rates
More methods of
materials extraction
More participation
Better design for recycling
More treatment capacity
Stronger end markets
Stronger policy
An economic assessment and feasibility study of how the UK
could meet the Circular Economy Package recycling targets
3
Ricardo Energy & Environment
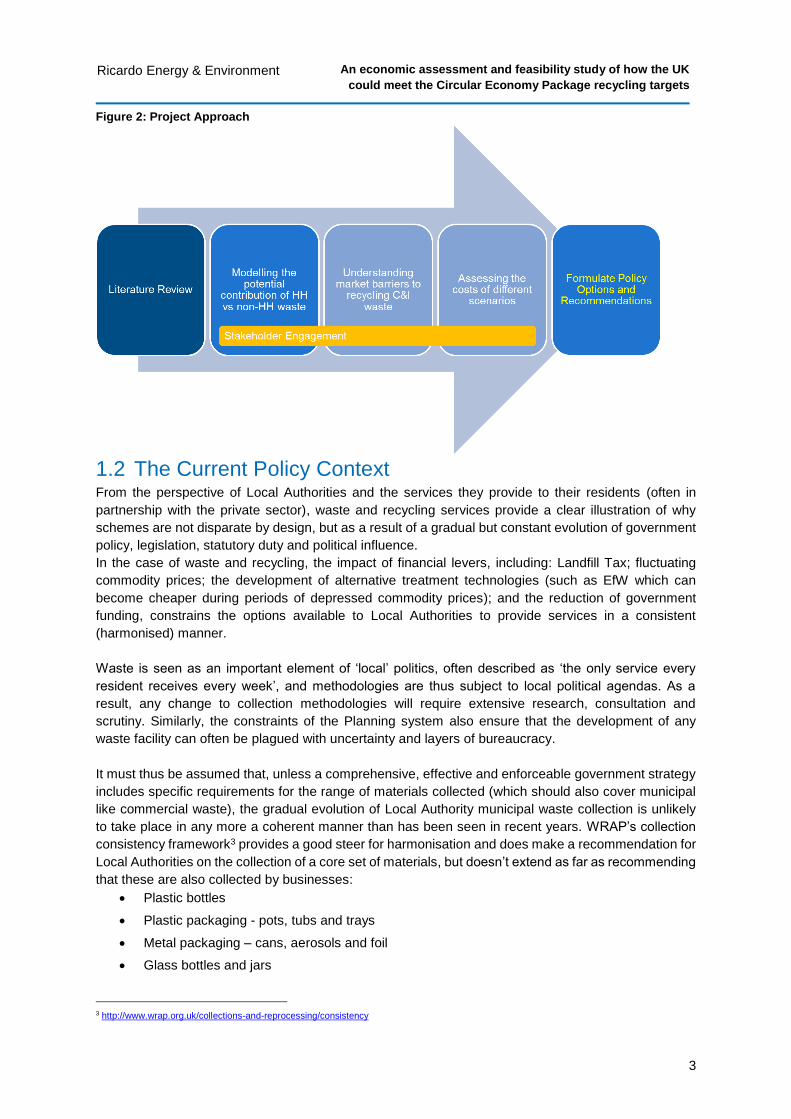
Figure 2: Project Approach
1.2 The Current Policy Context From the perspective of Local Authorities and the services they provide to their residents (often in
partnership with the private sector), waste and recycling services provide a clear illustration of why
schemes are not disparate by design, but as a result of a gradual but constant evolution of government
policy, legislation, statutory duty and political influence.
In the case of waste and recycling, the impact of financial levers, including: Landfill Tax; fluctuating
commodity prices; the development of alternative treatment technologies (such as EfW which can
become cheaper during periods of depressed commodity prices); and the reduction of government
funding, constrains the options available to Local Authorities to provide services in a consistent
(harmonised) manner.
Waste is seen as an important element of ‘local’ politics, often described as ‘the only service every
resident receives every week’, and methodologies are thus subject to local political agendas. As a
result, any change to collection methodologies will require extensive research, consultation and
scrutiny. Similarly, the constraints of the Planning system also ensure that the development of any
waste facility can often be plagued with uncertainty and layers of bureaucracy.
It must thus be assumed that, unless a comprehensive, effective and enforceable government strategy
includes specific requirements for the range of materials collected (which should also cover municipal
like commercial waste), the gradual evolution of Local Authority municipal waste collection is unlikely
to take place in any more a coherent manner than has been seen in recent years. WRAP’s collection
consistency framework3 provides a good steer for harmonisation and does make a recommendation for
Local Authorities on the collection of a core set of materials, but doesn’t extend as far as recommending
that these are also collected by businesses:
Plastic bottles
Plastic packaging - pots, tubs and trays
Metal packaging – cans, aerosols and foil
Glass bottles and jars
3 http://www.wrap.org.uk/collections-and-reprocessing/consistency
An economic assessment and feasibility study of how the UK
could meet the Circular Economy Package recycling targets
4
Ricardo Energy & Environment
Paper
Card
Food and drink cartons
Food waste.
The framework is a long-term strategy (to 2025) but has not been widely adopted to date. With almost
60 Local Authorities going to the market for new collection contracts in the next three years it should be
at the heart of the requirements but hasn’t been for many of the authorities that have gone to OJEU
within the last year. There are a number of reasons for its slow adoption, of which cost is the greatest:
Austerity - Local Authorities are still expected to deliver savings. Reducing residual frequency
can have the benefit of driving savings. Unfortunately for those 45% of authorities that have
taken the savings associated with reducing residual collection frequency (or providing residents
with a smaller capacity residual waste bin) without introducing a source segregated food waste
collection system at the same time the cost per household will be an additional £6 - £15.
Timing – collection changes often happen in line with vehicle procurement cycles over a 7-10
year basis. Any changes brought in earlier must either result in no significant changes to
operational fleet or be an addition to existing fleet such as a dedicated food waste vehicle (this
however can be costly)
Material requirements – some authorities are still not collecting the full range of recyclates at
the kerbside. This can be because there aren’t suitable local outlets for the material (e.g. food
waste in central London). For some authorities their local situation dictates that the
environmentally best option is to encourage residents to prevent food waste but for any
collected to be treated via Energy from Waste with, or for the quality requirements for materials
to require separation (glass is collected via bring banks rather than at the kerbside), or there
are no local outlets for the materials due to a lack of end markets (pots, tubs and trays, and
tetrapaks and other cartons for instance).
This limits the ability of local government to achieve the statutory and financial targets imposed by
central government, demonstrating that whilst central government is comfortable to utilise its financial
leverage to enforce behavioural change on local government, its unwillingness to utilise its power to
require a coherent approach to achieve the necessary outcomes creates a fragmented system.
The same reluctance to take responsibility informs the government’s approach to industry. This
approach, and its limitations, are clear in the policy direction statements it has released over the last
few months.
1.2.1 A Green Future: Our 25 year Plan to Improve the Environment The Governments recently launched plan for the environment (A Green Future: Our 25 year Plan to
Improve the Environment4) contains ambitious aims, but refrains from setting targets, preferring to ‘plan’
to achieve outcomes, which are often ambiguously described.
Pledging to ‘eliminate avoidable waste by 2050’ and planning to ‘eliminate avoidable plastic waste by
2042’ hinge on defining ‘avoidable’, and are sufficiently distant not to impact on current investment
decisions.
Similarly, no specific policies are outlined to address the current stalling of recycling rates. Pledging to
‘Meeting all existing waste targets – including those on landfill, reuse and recycling – and developing
ambitious new future targets and milestones’ is a positive ambition, but undermined by the lack of detail
regarding how to achieve or even address the performance gap in the short term.
Similarly, ambitions to:
minimise waste;
reuse materials as much as we can;
4 https://www.gov.uk/government/publications/25-year-environment-plan
An economic assessment and feasibility study of how the UK
could meet the Circular Economy Package recycling targets
5
Ricardo Energy & Environment
manage materials at the end of their life to minimise the impact on the environment;
work with waste management services and producers to support policies that deliver high-
quality and quantity recycling, minimise environmental impact and ensure well-functioning
secondary material markets (the use of recycled material in preference to virgin raw materials);
encourage producers to take more responsibility for the environmental impacts of their products
and rationalise the number of different types of plastic in use;
work with industry to rationalise packaging formats and material formats to make sure that more
plastics can be easily recycled and the quality of collected recycled plastics is improved;
reform our producer responsibility systems (including packaging waste regulations) to
incentivise producer to take greater responsibility for the environmental impacts of their
products;
explore extending producer responsibility requirements to plastic products not currently
covered by our existing regimes to create a better market for recycled plastics;
work in partnership with industry to explore the possibility of developing additional tools that
support businesses to identify sustainable supply chains; and
work with partners to consider whether benchmarking of environmental products and supply
chain certification schemes could make consumers more aware of them, and drive higher
standards are all entirely laudable, but rather light on detail. The industry now awaits Defra’s
forthcoming Resource and Waste Strategy, which may concern itself more with the details of
how these ambitions are to be achieved.
It should be noted, however, that governments since 2010 have chosen to introduce voluntary schemes
for labelling and recycled content. This reluctance to use their legislative power has led to a fragmented
adoption by business, undermining the potential impact on recycling performance.
This approach also negates any option for the consumer to exercise their buying power, since the lack
of coherent information compromises their ability to make informed choices.
The overall result is that consumers/householders are relatively powerless in the hierarchy of the current
drive to improve environmental performance.
Supranational (i.e. EU) targets are delegated to national governments, within a governance framework
which incorporates financial and reputational penalties for non-performance or non-compliance;
substantial EU fines await should the UK fail to achieve the recycling target – unless we have exited
the EU before the target date. A reporting system is incorporated which enables levels of compliance
to be recorded, audited and reported.
The government has then passported these requirements to local authorities, using a network of
legislative requirements, incorporating statutory duties, financial drivers, and again, reporting systems
which enable levels of compliance to be recorded, audited and reported.
To achieve the required outcomes, local government thus amends the services provided to
householders. The methodologies for the collection, separation and disposal of waste have been
redesigned to facilitate the separate collection of recyclables, thus increasing the recycling rate, whilst
minimising the volume of residual waste, reducing landfill requirements and thus cost.
This approach ignores the evidence of basic research, which demonstrates that not all recycling is
necessarily environmentally efficient. Arguably, the most appropriate single measure of environmental
benefit is carbon analysis (although analysing a number of metrics can provide a more holistic view).
Carbon analysis looks at the entire lifecycle of products, looking at the carbon generated by all elements
of the lifecycle – extraction of raw materials, processing, transport, manufacture, distribution, collection
post-use and disposal.
An economic assessment and feasibility study of how the UK
could meet the Circular Economy Package recycling targets
6
Ricardo Energy & Environment
For some materials (aluminium, glass), this type of analysis confidently demonstrates the carbon benefit
of recycling. For others, such as paper, the analysis is less absolute, but other environmental impacts
are relevant (managed forests for paper production are ecologically limited, and thus less beneficial
than natural growth).
For other materials, such as plastic containers (low grade, mixed composition or multi polymer), the
situation is more complex. Currently, the carbon used by refuse collection vehicles collecting a material
which is difficult to recycle, has limited markets and requires a high degree of processing, may be on
the wrong side of the environmental balance.
Householders are provided with information by their local authorities, but this usually focusses on how
the materials are recycled, where they go, and the financial benefits of recycling instead of landfilling.
But, without sufficient information on the whole product lifecycle or the carbon impact of the material,
negligible information from the material producers regarding the recycled content or recyclability of
products and limited information from their local authority on the full carbon impact of recycling vs
disposal, householders are not sufficiently informed to make an empowered decision on how to deal
with their waste.
The new Strategies described above indicate that the government is beginning to appreciate the
quandaries implicit in the current approach to wastes management.
However, the re-engineering of a service methodology which has evolved in a piecemeal, reactive
manner since 1846, without benefit at any stage of a coherent, evidence-based strategy, will require a
degree of change which government, national and local, and their agents, will find challenging.
1.2.2 Clean growth Strategy It is encouraging that the government’s Clean Growth Strategy recognises the role of the waste industry
in the transition to a clean growth, low carbon, circular economy approach to increasing the productivity
and competitiveness of the UK economy.
It notes the 73% reduction in emissions from the sector (since 1990), the quadrupling of recycling rates
since 2001 (albeit a low base), and the expansion of waste-derived renewable energy to a level where
this source powers the equivalent of 9% of domestic properties.
However, the strategy’s extensive ambitions are hampered by the lack of tangible policies or legislative
proposals to facilitate the achievement of the provisional targets described.
1.2.3 Industrial Strategy Again, an extensive document sets out a range of proposals with a coherent aim of driving change
through the development of policies in pursuit of higher investment and productivity. These proposals
cover five key areas:
• ideas (R&D and innovation)
• people (education and skills)
• infrastructure
• business environment (finance, business support, inward investment)
• places (regional growth).
For each area, new policies are proposed (although not explicitly described in terms of detail), and
potential funding streams are ‘committed’.
Whilst it is interesting to note the acceptance that the government has a role in steering the county’s
economic direction, and that the aim of closing Britain’s current productivity gap with competitor nations
is prominently addressed, the focus is more towards ‘co-ordination’ than direct action.
An economic assessment and feasibility study of how the UK
could meet the Circular Economy Package recycling targets
7
Ricardo Energy & Environment
For those awaiting tangible drivers to drive investment and reward resource efficiency, further direction
remains a requirement.
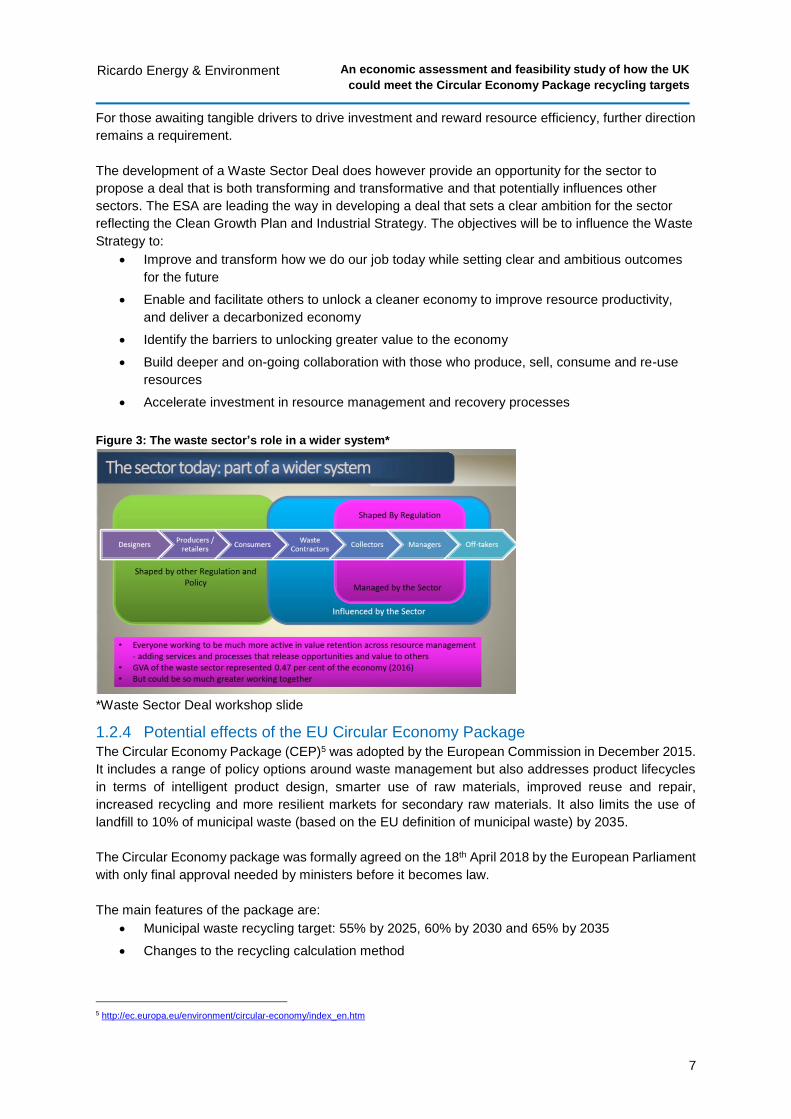
The development of a Waste Sector Deal does however provide an opportunity for the sector to
propose a deal that is both transforming and transformative and that potentially influences other
sectors. The ESA are leading the way in developing a deal that sets a clear ambition for the sector
reflecting the Clean Growth Plan and Industrial Strategy. The objectives will be to influence the Waste
Strategy to:
Improve and transform how we do our job today while setting clear and ambitious outcomes
for the future
Enable and facilitate others to unlock a cleaner economy to improve resource productivity,
and deliver a decarbonized economy
Identify the barriers to unlocking greater value to the economy
Build deeper and on-going collaboration with those who produce, sell, consume and re-use
resources
Accelerate investment in resource management and recovery processes
Figure 3: The waste sector’s role in a wider system*
*Waste Sector Deal workshop slide
1.2.4 Potential effects of the EU Circular Economy Package The Circular Economy Package (CEP)5 was adopted by the European Commission in December 2015.
It includes a range of policy options around waste management but also addresses product lifecycles
in terms of intelligent product design, smarter use of raw materials, improved reuse and repair,
increased recycling and more resilient markets for secondary raw materials. It also limits the use of
landfill to 10% of municipal waste (based on the EU definition of municipal waste) by 2035.
The Circular Economy package was formally agreed on the 18th April 2018 by the European Parliament
with only final approval needed by ministers before it becomes law.
The main features of the package are:
Municipal waste recycling target: 55% by 2025, 60% by 2030 and 65% by 2035
Changes to the recycling calculation method
5 http://ec.europa.eu/environment/circular-economy/index_en.htm
An economic assessment and feasibility study of how the UK
could meet the Circular Economy Package recycling targets
8
Ricardo Energy & Environment
Broader definition of municipal waste which includes commercial waste that is similar to
household waste
Metals in Incinerator Bottom Ash (IBA) which are recycled could be counted towards recycling
targets
Separate collection requirements for dry recyclables will be extended to:
o Biowaste by Dec 2023; and
o Textiles by Jan 2025 subject to TEEP.
o Household hazardous waste by Jan 2025 with no exception on the grounds of TEEP
Packaging waste recycling targets: 65% by 2025, 70% by 2030
It is anticipated that the Package will be adopted into formal EU law before the end of the two-year
Brexit process, and is thus expected to be among the environmental legislation brought into UK law via
the ‘European Union (Withdrawal) Bill’.
Whilst Local Authorities will be expected to reflect the principles of the Circular Economy, the primary
challenges will be the increased recycling rate target, the further minimisation of allowable waste to
landfill, and EPR. The latter, by making producers responsible for the full cost of recycling or disposing
of products they bring to the market (including those costs currently incurred by local Authorities) should
incentivise them to reduce the overall environmental impact of their products and packaging, reducing
overall costs whilst minimising environmental impact. The CEP provides detailed changes aimed at
strengthening EPR, with producers having to bear at least 80% of the costs of meeting waste and
recycling targets and any new national ones, and at least 50% of the cost of meeting existing national
targets.
Proposals on how the EPR would be introduced in contrast to the current PRN methodology are
currently the subject of consultation.
1.2.5 Potential impacts from Brexit
The Department for Exiting the European Union (DEXEU)’s White Paper setting out the terms of the
government’s ‘European Union (Withdrawal) Bill’ confirms that the ‘whole body’ of existing
environmental laws derived from EU legislation will be safeguarded in UK law prior to Brexit. Thus, all
EU legislation which has not already been transposed into UK law will be transferred to UK statute,
including current regulations governing waste, packaging, waste electrical and electronic equipment
(WEEE) and landfill.
However, DEXEU has also stated that ‘Following integration into UK law upon departure, all EU
environmental laws will be open to being “amended, repealed or improved’. The UK is thus free to
decide the future of its waste policy and laws.
This freedom has given rise to uncertainty over the future of environmental legislation and policy post-
Brexit (but also opportunity). This is due to the methodology which will be utilised to “amend, repeal or
improve” the current Regulations, with Ministers, utilising secondary legislation to amend or repeal
primary legislation without parliamentary scrutiny. This may limit the ability of the wider waste sector to
influence policy decisions, and may also lead to politically motivated policies being introduced which
impact on local authorities’ municipal waste activities.
A further concern is that at present, the UK is reliant on enforcement from both the European
Commission and the European Court of Justice (through the threat of heavy fines) to ensure that
environmental standards and targets are met.
The Government will thus need to consider the means by which environmental commitments are given
effect in domestic law, and the scope and scale of the regulatory and accountability systems by which
An economic assessment and feasibility study of how the UK
could meet the Circular Economy Package recycling targets
9
Ricardo Energy & Environment
the UK is held to adhere to the standards set. Will this involve an enhanced role for the EA, or will a
new regulatory department be created?
Environment Secretary Michael Gove has recently announced plans to consult on a new, independent
body for environmental standards. The proposed consultation regarding this suggest this will be a new,
independent body that will hold Government to account for upholding environmental standards post-
Brexit. Further details have not yet been announced.
A further key impact of Brexit is the issue of exporting waste and recyclate to foreign markets. Currently,
the adverse impact on the value of the pound has increased the cost of exporting Refuse Derived Fuel
(RDF), whilst reducing the income received for recyclate.
Although the ‘unknown’ elements of Brexit do present concerns for the sector it should also be
considered an opportunity to revisit the status quo and reflect on what England wants to achieve in the
future in terms of environmental performance.
1.3 Current progress towards the recycling targets The setting of recycling targets is currently the key way in which the waste management sector is guided
and held to account in relation to its environmental credentials. In order to meet these targets, the sector
must continuously evolve and innovate to ensure that steady progression can be sustained, with the
understanding that targets will continue to be extended to ensure the sustainability of the sector and
that its contribution to wider circular economy ambitions are met.
In the UK this began with Best value performance indicators for each local authority allocated between
2001 and 2008 setting mandatory weight based targets for household recycling. This and the
subsequent introduction of the waste framework directive in 2008 maintained pressure on the industry
to take account for their activity and role in the vision of a circular economy, with maximisation of
recovery, recycling and reuse activities, with minimisation of waste generation and disposal. This clear
centrally driven message focusing on the concept of moving material away from waste and up the waste
hierarchy has since led to significant changes in local authority service delivery and subsequently a
significant increase the recycling rates.
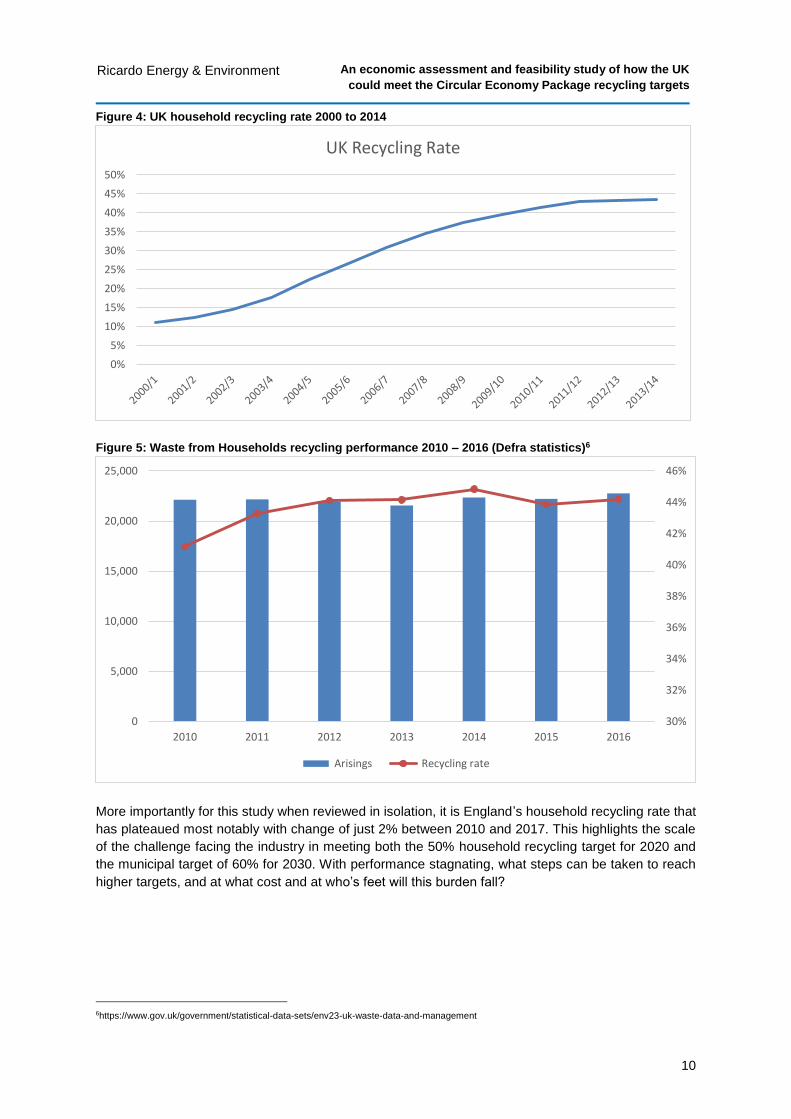
In the UK waste data reporting via waste data flow from 2001 to 2014 has demonstrated that since the
introduction of weight based measures, household recycling has risen from 12% in 2001 to 44% in
2014. What this illustrates is the effectiveness of central leadership in driving recycling rates to a point,
but also that in recent years, most notably from 2011 onwards this target led approach not just in the
UK, but now shared by all EU member states has varied in its effectiveness with differing economic,
political and social and demographic challenges including:
Central leadership and statutory targets;
The pressure to reduce public sector spending following the global economic recession
(austerity agenda); and
The demographics of the population which play a role in the amount of recycling (and
contamination) that can occur.
An economic assessment and feasibility study of how the UK
could meet the Circular Economy Package recycling targets
10
Ricardo Energy & Environment
Figure 4: UK household recycling rate 2000 to 2014
Figure 5: Waste from Households recycling performance 2010 – 2016 (Defra statistics)6
More importantly for this study when reviewed in isolation, it is England’s household recycling rate that
has plateaued most notably with change of just 2% between 2010 and 2017. This highlights the scale
of the challenge facing the industry in meeting both the 50% household recycling target for 2020 and
the municipal target of 60% for 2030. With performance stagnating, what steps can be taken to reach
higher targets, and at what cost and at who’s feet will this burden fall?
6https://www.gov.uk/government/statistical-data-sets/env23-uk-waste-data-and-management
0%
5%
10%
15%
20%
25%
30%
35%
40%
45%
50%
UK Recycling Rate
30%
32%
34%
36%
38%
40%
42%
44%
46%
0
5,000
10,000
15,000
20,000
25,000
2010 2011 2012 2013 2014 2015 2016
Arisings Recycling rate
An economic assessment and feasibility study of how the UK
could meet the Circular Economy Package recycling targets
11
Ricardo Energy & Environment
2 Our Modelling Approach The first step of the project has been to model different scenarios for reaching the municipal waste
targets that we need to achieve in the (very) near future. Utilising publicly available data a ‘stepwise’
approach has been used to build on the existing performance baseline (business as usual). We have
modelled Local Authority Collected Waste (LACW) and the commercial element of Commercial and
Industrial Waste (C&I) collections separately to understand both the different challenges that apply to
the two waste streams, but also the interplay between them and how the burden of improvement split
between them.
Importantly, in doing this modelling we have made some assumptions around policy requirements which
are considered integral to overcoming current weaknesses in the market place, particularly around the
material quality and strength and depth of material markets. This has been brought into to stark reality
with the onset of China’s national sword policy and the significant turbulence felt as a result in all key
recyclate markets. Therefore, albeit there are changes that can be made to help support greater
collection of recyclable materials, the strength of end markets is what will define to what extent these
materials are commercially viable to recycle. It is also this commercial viability that will help incentivise
greater investment in material collection and recycling infrastructure, as greater confidence in end
markets allows both local authorities and service providers to push for greater performance, rather than
the status quo or minimum standards on contractual obligations.
2.1 Policy context for modelled outcomes
In modelling the various scenarios for improvement of recycling performance for both local authority
and commercial we have consulted the ESA members on which policy / drivers the modelling will need
to integrate with, but also what additional is required to enable the scenario’s to be achievable.
2.1.1 Integrations with existing drivers in the market WRAP’s consistency of collections - The ‘Harmonisation’ agenda7 stems from a political assumption
that if collection services across the country become more consistent, the public would have a clearer
idea about what can and can’t be recycled, and as a result, improve the quantity and quality of the
recyclate they present for collection. It would become far easier to promote and communicate recycling
services on a national scale, and the collection of a standard set of materials would increase the
confidence of the major corporations and brands. It is also assumed that by standardising the
methodology and frequency of collections, economies of scale may be achievable, certainly in terms of
containers but also for vehicles, should a common collection methodology be adopted.
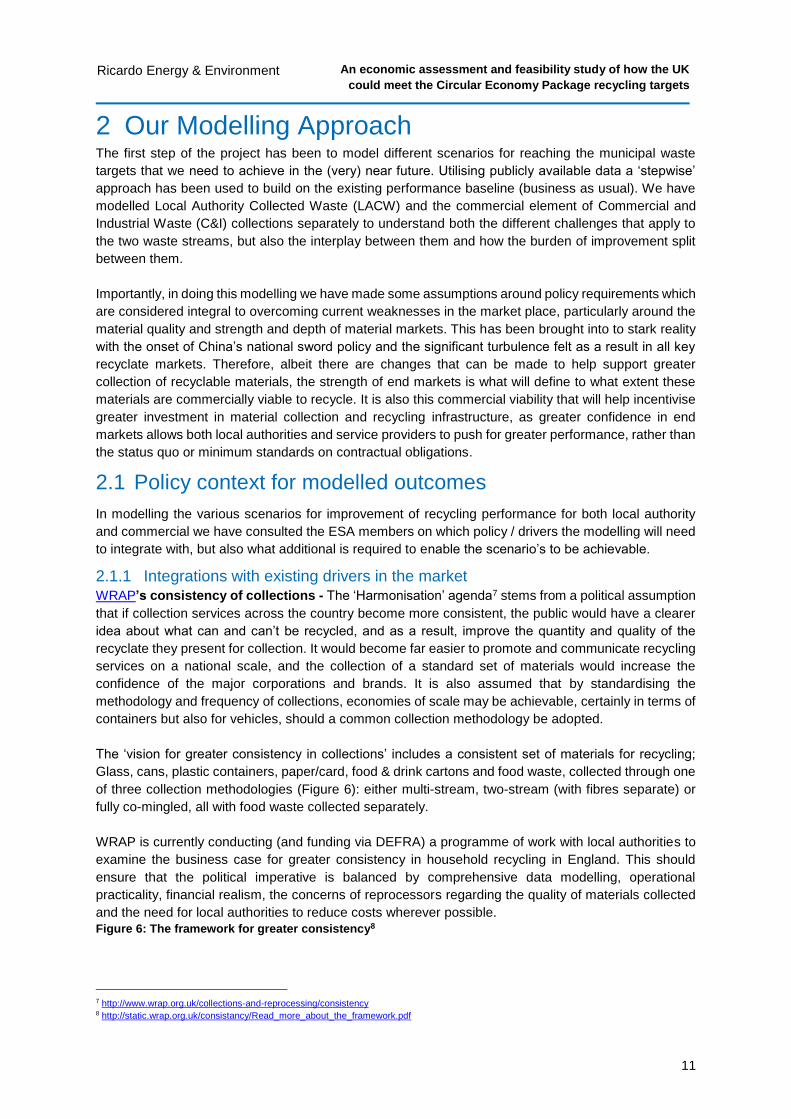
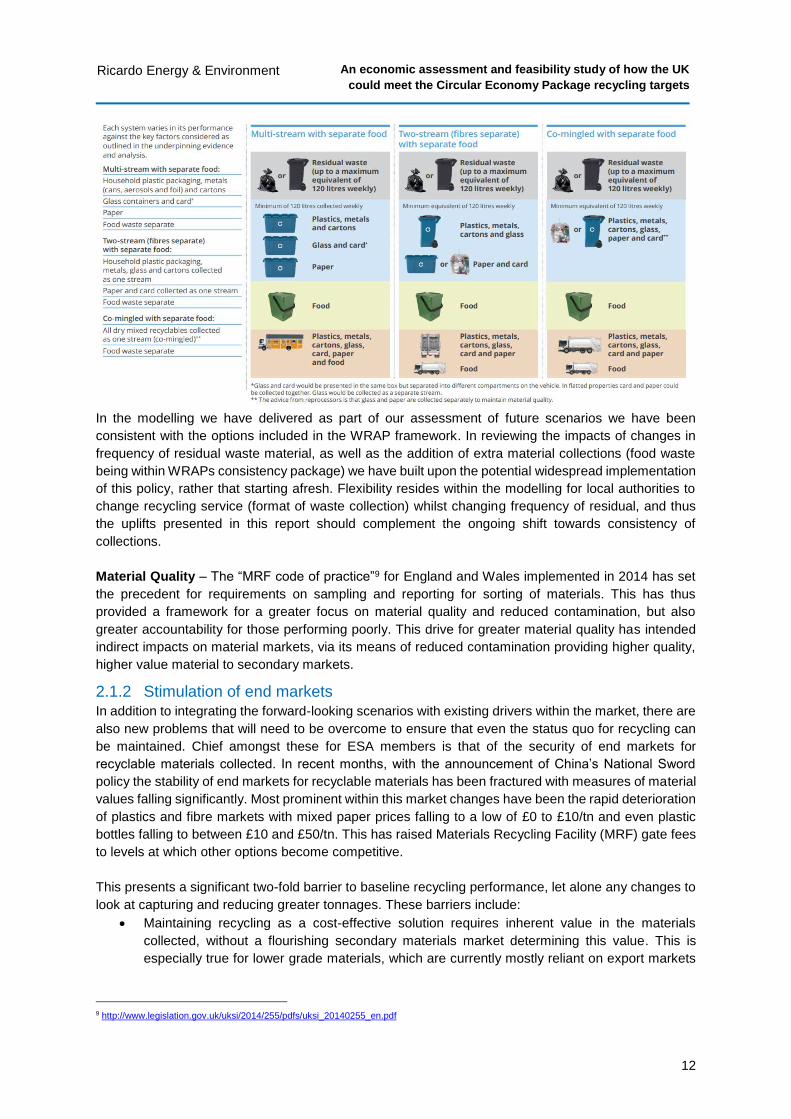
The ‘vision for greater consistency in collections’ includes a consistent set of materials for recycling;
Glass, cans, plastic containers, paper/card, food & drink cartons and food waste, collected through one
of three collection methodologies (Figure 6): either multi-stream, two-stream (with fibres separate) or
fully co-mingled, all with food waste collected separately.
WRAP is currently conducting (and funding via DEFRA) a programme of work with local authorities to
examine the business case for greater consistency in household recycling in England. This should
ensure that the political imperative is balanced by comprehensive data modelling, operational
practicality, financial realism, the concerns of reprocessors regarding the quality of materials collected
and the need for local authorities to reduce costs wherever possible.
Figure 6: The framework for greater consistency8
7 http://www.wrap.org.uk/collections-and-reprocessing/consistency 8 http://static.wrap.org.uk/consistancy/Read_more_about_the_framework.pdf
An economic assessment and feasibility study of how the UK
could meet the Circular Economy Package recycling targets
12
Ricardo Energy & Environment
In the modelling we have delivered as part of our assessment of future scenarios we have been
consistent with the options included in the WRAP framework. In reviewing the impacts of changes in
frequency of residual waste material, as well as the addition of extra material collections (food waste
being within WRAPs consistency package) we have built upon the potential widespread implementation
of this policy, rather that starting afresh. Flexibility resides within the modelling for local authorities to
change recycling service (format of waste collection) whilst changing frequency of residual, and thus
the uplifts presented in this report should complement the ongoing shift towards consistency of
collections.
Material Quality – The “MRF code of practice”9 for England and Wales implemented in 2014 has set
the precedent for requirements on sampling and reporting for sorting of materials. This has thus
provided a framework for a greater focus on material quality and reduced contamination, but also
greater accountability for those performing poorly. This drive for greater material quality has intended
indirect impacts on material markets, via its means of reduced contamination providing higher quality,
higher value material to secondary markets.
2.1.2 Stimulation of end markets In addition to integrating the forward-looking scenarios with existing drivers within the market, there are
also new problems that will need to be overcome to ensure that even the status quo for recycling can
be maintained. Chief amongst these for ESA members is that of the security of end markets for
recyclable materials collected. In recent months, with the announcement of China’s National Sword
policy the stability of end markets for recyclable materials has been fractured with measures of material
values falling significantly. Most prominent within this market changes have been the rapid deterioration
of plastics and fibre markets with mixed paper prices falling to a low of £0 to £10/tn and even plastic
bottles falling to between £10 and £50/tn. This has raised Materials Recycling Facility (MRF) gate fees
to levels at which other options become competitive.
This presents a significant two-fold barrier to baseline recycling performance, let alone any changes to
look at capturing and reducing greater tonnages. These barriers include:
Maintaining recycling as a cost-effective solution requires inherent value in the materials
collected, without a flourishing secondary materials market determining this value. This is
especially true for lower grade materials, which are currently mostly reliant on export markets
9 http://www.legislation.gov.uk/uksi/2014/255/pdfs/uksi_20140255_en.pdf
An economic assessment and feasibility study of how the UK
could meet the Circular Economy Package recycling targets
13
Ricardo Energy & Environment
for recycling. Without these outlets, recycling these materials quickly becomes a less viable
solution.
Having capacity to treat and recycle material without access to the largest market for materials
in China will require significant additional investment
As such with consultation with ESA members, it has been considered that in all of the forward-looking
scenario’s measures will need to be implemented to support secondary material markets. This will
require policy decisions, to reduce use of low quality material and increase demand in secondary
material markets. In discussion with ESA members it is believed that review and reform of producer
responsibility, packaging returns and the possibility of deposit return schemes, could all be potential
ways to help support these end markets. In this respect, it is considered these types of policy are a
requirement to enable the modelled scenario’s rather than be simply complementary. The types of
policy levers that should be considered are set out below.
2.1.2.1 EPR and review of PRN
The Producer Responsibility Obligations (Packaging Waste) (Amendment) Regulations (2016), which
transpose The EU Packaging Waste Directive (94/62/EC) into UK law, are the latest version of the
packaging recovery obligations which were first introduced in 1997 as the first producer responsibility
legislation in the UK.
The Regulations work on the principle of Collective Producer Responsibility, requiring obligated
producers to pay a proportion of the cost of the recovery and recycling of their packaging. Currently in
the UK this obligation is achieved through Packaging Recovery Notes (PRNs) which are issued by
accredited reprocessors when they have recovered and recycled a tonne of packaging material. The
accredited reprocessor can sell the PRNs to obligated companies or Compliance Schemes who use
the Packaging Recovery Note to prove that a tonne of packaging material has been recycled on their
behalf. This in turn has led to the development of PRN trading markets.
Local Authorities are unhappy with this system; the utilisation of the PRN income (in their opinion) is
not transparent, and the costs of collecting and recycling the waste packaging from households fall on
the Local Authorities, not the packaging producers.
The Circular Economy Package proposed by the EU addresses this by proposing the extension of
producer responsibility to ensure they are responsible for the full costs of recycling or disposing of their
products. By ensuring that producer responsibility encompasses the entire lifecycle of the product, from
manufacture to disposal, including the costs currently incurred by Local Authorities, producers will be
incentivised to reduce the overall environmental impact of their products, reducing overall costs whilst
minimising environmental impact.
Designing products with recycling incorporated into the cost base would incentivise the use of more
easily recycled/reused materials, helping create a more stable market for secondary materials.
Local authorities and their private sector contractors come into contact with products at the end of their
life. If products can be better designed, to last longer (increased durability), contain less environmentally
damaging materials and also be designed for repair, disassembly or reprocessing it would be easier to
keep those products and their material constituents circulating within the economy for longer. This
reflects the issue that the composition of municipal waste will change over time should CE principles
become fully adopted. These impacts can already be seen in the light-weighting of glass, the
replacement of glass containers with plastics and reduced paper tonnages due to the impact of digital
reading replacing traditional printed media. Conversely, cardboard tonnages are slowly increasing with
the increase in internet shopping.
An economic assessment and feasibility study of how the UK
could meet the Circular Economy Package recycling targets
14
Ricardo Energy & Environment
Better design of packaging and light-weighting will impact on both the volume and composition of
municipal waste; there may also be a beneficial impact on contamination levels, and a reduction in non-
target materials where ‘more easily recycled’ materials are utilised for packaging.
Summary:
Levers Revision of Government policy in light of CEP
targets
Impacts
Unclear without further research, but would
support the stimulation of end markets for
recyclable material and drive better design of
products
Risks Unclear without further research
Barriers Government policy
Cost Unclear without further research
2.1.2.2 DRS and Alternatives
In March 2018 the Government announced that it will be introducing a deposit return scheme in England
to increase recycling rates and slash the amount of waste polluting our land and seas subject to
consultation.10 The scheme will cover single use drinks containers, whether plastic, glass or metal. The
consultation will look at the details of how such a scheme would work, alongside other measures to
increase recycling rates.
The logic of this approach is the perceived failure of current collection schemes. Estimates about the
amount of containers being successfully recycled varies11.:
plastic bottles – between 58% and 74%
Glass containers and bottles – 67% and 70%
Aluminium and steel drinks cans – 70%
Supporters of DRS schemes point to its success in other countries and that well-designed and well-run
deposit return schemes can deliver an estimated increase of around 20% in the reported amount of
beverage containers collected for recycling, and deliver a better quality of captured material (i.e., less
contamination) than is currently estimated as happening in the UK for beverage packaging. But the
potential benefits for the UK are less clear, largely due to the level of infrastructure required, along with
the potential for adverse effects on existing LA collection schemes. This could mean that a UK system
would be best focused on containers consumed “on-the-go” which do not enter they household stream.
A report commissioned by Keep Britain Tidy (KBT)12, estimated that a DRS for drinks containers could
save local authorities up to £35m pa, from reduced collection costs, reduced gate fees for the sorting
of mixed recyclables and a reduction in the spend associated with clearing litter. However, LARAC
disputed this estimate (claiming it to be based on only four authorities), suggesting that the DRS
infrastructure costs would be “better spent on existing collection systems and give a better increase in
the overall recycling rate”.
To further add to this confusion, there is no certainty regarding the exact volume of drinks containers in
the current residual waste stream; current estimates rely on an assessment of the volume of bottles
placed on the market compared to those recorded as successfully recycled. With this degree of
uncertainty regarding current and potential volumes, along with the lack of an accurate projection of
10 https://www.gov.uk/government/news/deposit-return-scheme-in-fight-against-plastic 11 https://assets.publishing.service.gov.uk/government/uploads/system/uploads/attachment_data/file/694916/voluntary-economic-incentives-
working-group-report-drinks-containers-final.pdf 12 http://www.keepbritaintidy.org/sites/default/files/resource/11%20October%202017%20-%20New%20DRS%20report%20published.pdf
An economic assessment and feasibility study of how the UK
could meet the Circular Economy Package recycling targets
15
Ricardo Energy & Environment
public participation in any scheme introduced, focussing on the practicalities may provide a degree of
clarity.
From the perspective of Local Authorities and their private sector partners, it is difficult to project any
accurate cost savings from the introduction of a DRS. Recently published analysis commissioned by
SUEZ13 and developed by Oakdene Hollins highlights that DRS could provide new revenue streams for
Local Authorities, such as operating redemption points or the operation of local consolidation points.
The following activities are also highlighted as opportunities to compensate any loss of revenue:
Reduction in residual waste requiring treatment
Reduction in material recovery facility and collection costs; and
Reduction in street cleansing costs.
Analysis conducted in 2017 by Eunomia14 estimates a potential saving of £56M from the introduction of
a DRS scheme (with potential savings of between £60K and £500K for the eight authorities analysed
as part of the study).
A proportion of qualifying recyclate will move from kerbside schemes to the DRS; the success of any
DRS will, however, be dependent on its success in attracting recyclate from householders who currently
don’t recycle this material at all at present. If the introduction of a DRS is successful in increasing the
participation in recycling, it is possible that other recycling activities may also benefit, which may lead
to an increase in overall recycling rates; however, this cannot be accurately projected.
The situation is complicated by concerns regarding the level of provision of DRS facilities. From the
perspective of small retailers, the Association of Convenience Stores have raised a number of practical
concerns15 regarding the space available in-store for reverse vending machines, the cost of
implementation and the impact on staff resources. Their view is that “The UK has a far more developed
kerbside recycling infrastructure than some European countries that have introduced DRS, and we
believe that the Government should focus its efforts on working with local councils to maximise the
effectiveness of kerbside recycling and not place extra burdens on retailers.”
LARAC’s view is that “LARAC would not want to see deposits introduced for plastic bottles that removed
them from the council collection schemes. This would have the effect of making the council schemes
less efficient and require a new set of collection infrastructure to be introduced. LARAC believes that
the UK is better served by providing more funds for the existing council kerbside collection scheme for
plastic bottles”.16
If the introduction of any DRS is limited to major retailers due to the concerns outlined by the ACS,
effectively limiting the scheme to an enhanced bring bank scheme (albeit with a cash-back incentive),
it is difficult to see how this can be more efficient that an appropriately funded universal kerbside
collection service.
Ultimately, this issue reverts to the question of whether ‘extended producer responsibility’ should require
producers to bear the full end of life costs for the collection and management of the waste their activities
generate. If the government is to implement this approach, a more coherent view of the benefits of
introducing DRS options may emerge.
13 http://www.sita.co.uk/news/tag/drs/ 14 http://www.eunomia.co.uk/reports-tools/impacts-of-a-deposit-refund-system-for-one-way-beverage-packaging-on-local-authority-waste-
services/ 15 https://www.acs.org.uk/sites/default/files/lobbying/acs_submission_-_defra_deposit_return_scheme.pdf 16 https://www.parliament.uk/business/committees/committees-a-z/commons-select/environmental-audit-committee/news-parliament-
2017/disposable-packaging-coffee-cups-and-plastic-bottles-17-19/
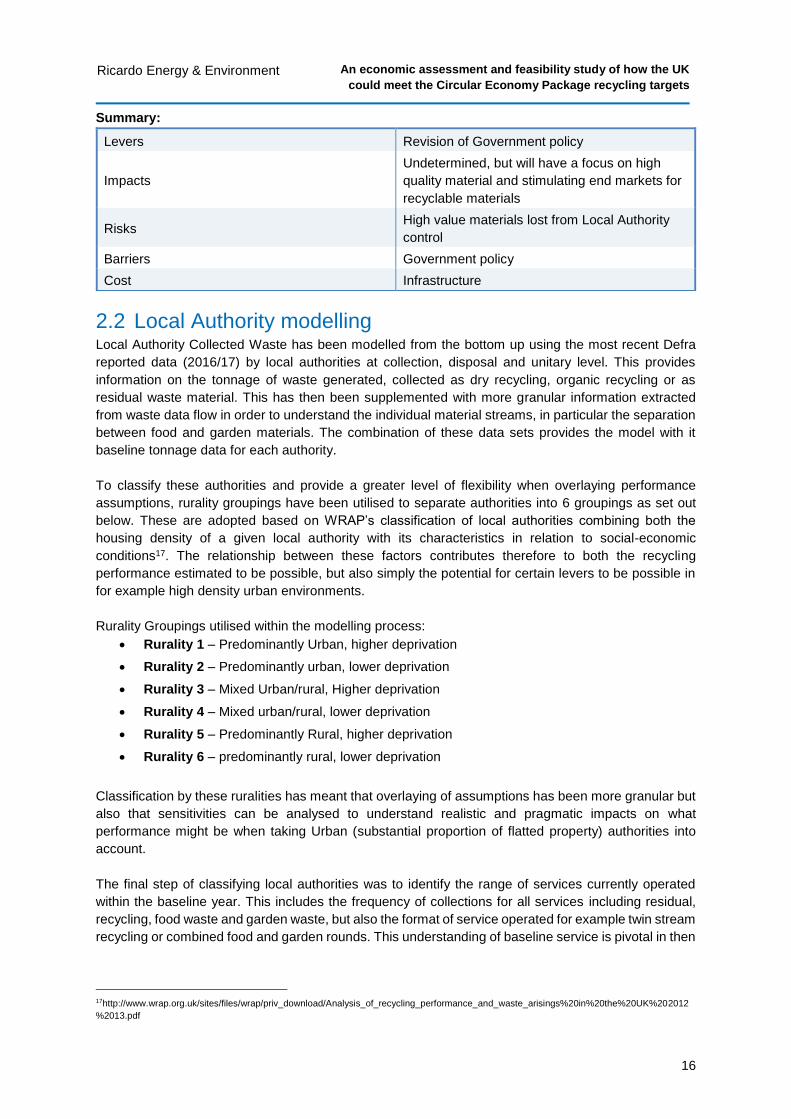
An economic assessment and feasibility study of how the UK
could meet the Circular Economy Package recycling targets
16
Ricardo Energy & Environment
Summary:
Levers Revision of Government policy
Impacts
Undetermined, but will have a focus on high
quality material and stimulating end markets for
recyclable materials
Risks High value materials lost from Local Authority
control
Barriers Government policy
Cost Infrastructure
2.2 Local Authority modelling Local Authority Collected Waste has been modelled from the bottom up using the most recent Defra
reported data (2016/17) by local authorities at collection, disposal and unitary level. This provides
information on the tonnage of waste generated, collected as dry recycling, organic recycling or as
residual waste material. This has then been supplemented with more granular information extracted
from waste data flow in order to understand the individual material streams, in particular the separation
between food and garden materials. The combination of these data sets provides the model with it
baseline tonnage data for each authority.
To classify these authorities and provide a greater level of flexibility when overlaying performance
assumptions, rurality groupings have been utilised to separate authorities into 6 groupings as set out
below. These are adopted based on WRAP’s classification of local authorities combining both the
housing density of a given local authority with its characteristics in relation to social-economic
conditions17. The relationship between these factors contributes therefore to both the recycling
performance estimated to be possible, but also simply the potential for certain levers to be possible in
for example high density urban environments.
Rurality Groupings utilised within the modelling process:
Rurality 1 – Predominantly Urban, higher deprivation
Rurality 2 – Predominantly urban, lower deprivation
Rurality 3 – Mixed Urban/rural, Higher deprivation
Rurality 4 – Mixed urban/rural, lower deprivation
Rurality 5 – Predominantly Rural, higher deprivation
Rurality 6 – predominantly rural, lower deprivation
Classification by these ruralities has meant that overlaying of assumptions has been more granular but
also that sensitivities can be analysed to understand realistic and pragmatic impacts on what
performance might be when taking Urban (substantial proportion of flatted property) authorities into
account.
The final step of classifying local authorities was to identify the range of services currently operated
within the baseline year. This includes the frequency of collections for all services including residual,
recycling, food waste and garden waste, but also the format of service operated for example twin stream
recycling or combined food and garden rounds. This understanding of baseline service is pivotal in then
17http://www.wrap.org.uk/sites/files/wrap/priv_download/Analysis_of_recycling_performance_and_waste_arisings%20in%20the%20UK%202012
%2013.pdf
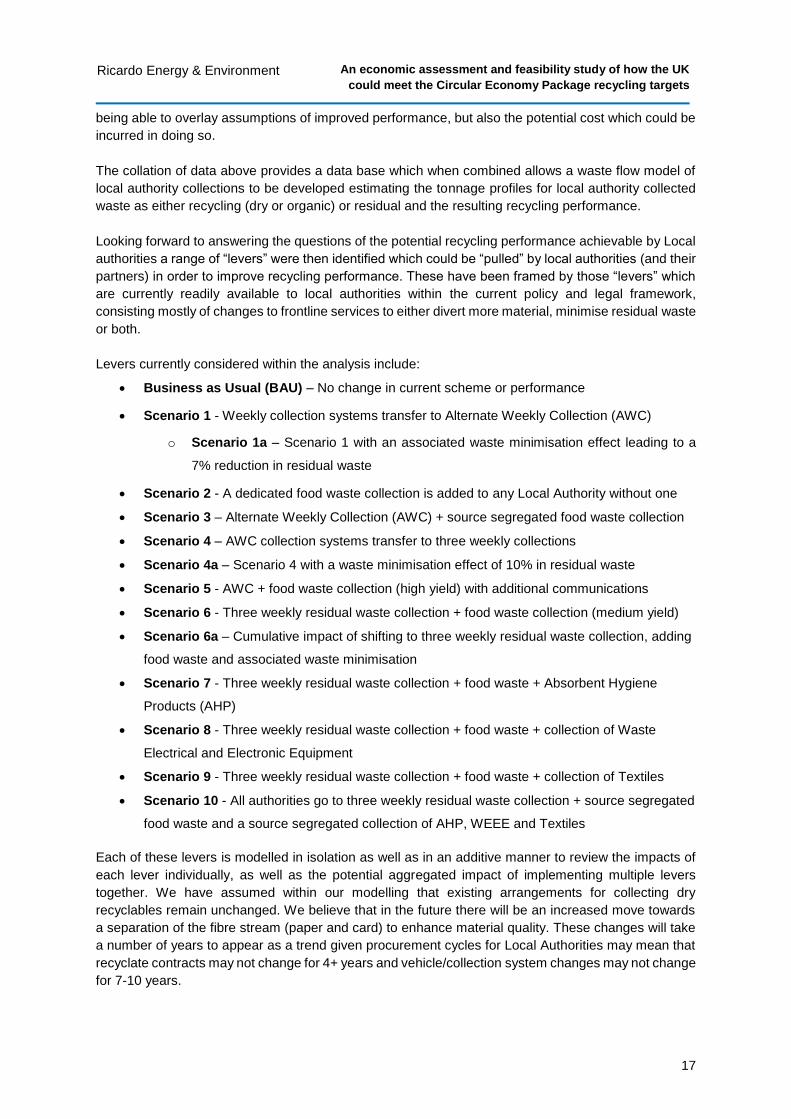
An economic assessment and feasibility study of how the UK
could meet the Circular Economy Package recycling targets
17
Ricardo Energy & Environment
being able to overlay assumptions of improved performance, but also the potential cost which could be
incurred in doing so.
The collation of data above provides a data base which when combined allows a waste flow model of
local authority collections to be developed estimating the tonnage profiles for local authority collected
waste as either recycling (dry or organic) or residual and the resulting recycling performance.
Looking forward to answering the questions of the potential recycling performance achievable by Local
authorities a range of “levers” were then identified which could be “pulled” by local authorities (and their
partners) in order to improve recycling performance. These have been framed by those “levers” which
are currently readily available to local authorities within the current policy and legal framework,
consisting mostly of changes to frontline services to either divert more material, minimise residual waste
or both.
Levers currently considered within the analysis include:
Business as Usual (BAU) – No change in current scheme or performance
Scenario 1 - Weekly collection systems transfer to Alternate Weekly Collection (AWC)
o Scenario 1a – Scenario 1 with an associated waste minimisation effect leading to a
7% reduction in residual waste
Scenario 2 - A dedicated food waste collection is added to any Local Authority without one
Scenario 3 – Alternate Weekly Collection (AWC) + source segregated food waste collection
Scenario 4 – AWC collection systems transfer to three weekly collections
Scenario 4a – Scenario 4 with a waste minimisation effect of 10% in residual waste
Scenario 5 - AWC + food waste collection (high yield) with additional communications
Scenario 6 - Three weekly residual waste collection + food waste collection (medium yield)
Scenario 6a – Cumulative impact of shifting to three weekly residual waste collection, adding
food waste and associated waste minimisation
Scenario 7 - Three weekly residual waste collection + food waste + Absorbent Hygiene
Products (AHP)
Scenario 8 - Three weekly residual waste collection + food waste + collection of Waste
Electrical and Electronic Equipment
Scenario 9 - Three weekly residual waste collection + food waste + collection of Textiles
Scenario 10 - All authorities go to three weekly residual waste collection + source segregated
food waste and a source segregated collection of AHP, WEEE and Textiles
Each of these levers is modelled in isolation as well as in an additive manner to review the impacts of
each lever individually, as well as the potential aggregated impact of implementing multiple levers
together. We have assumed within our modelling that existing arrangements for collecting dry
recyclables remain unchanged. We believe that in the future there will be an increased move towards
a separation of the fibre stream (paper and card) to enhance material quality. These changes will take
a number of years to appear as a trend given procurement cycles for Local Authorities may mean that
recyclate contracts may not change for 4+ years and vehicle/collection system changes may not change
for 7-10 years.
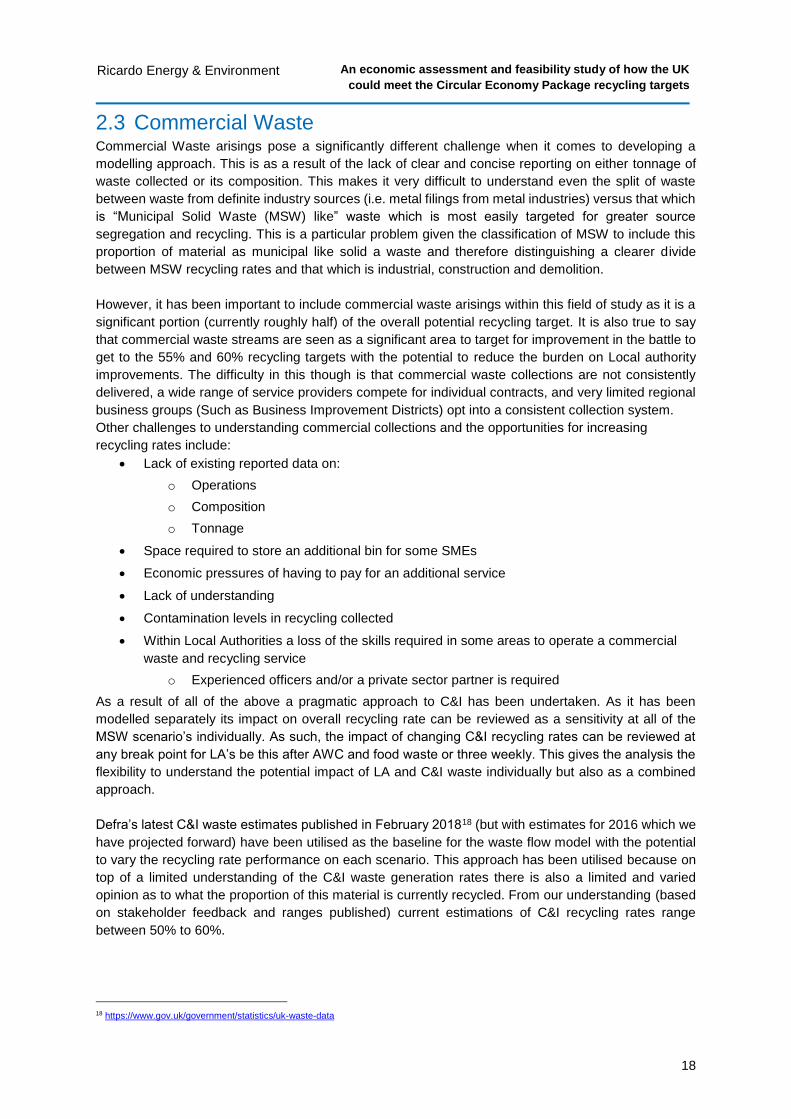
An economic assessment and feasibility study of how the UK
could meet the Circular Economy Package recycling targets
18
Ricardo Energy & Environment
2.3 Commercial Waste Commercial Waste arisings pose a significantly different challenge when it comes to developing a
modelling approach. This is as a result of the lack of clear and concise reporting on either tonnage of
waste collected or its composition. This makes it very difficult to understand even the split of waste
between waste from definite industry sources (i.e. metal filings from metal industries) versus that which
is “Municipal Solid Waste (MSW) like” waste which is most easily targeted for greater source
segregation and recycling. This is a particular problem given the classification of MSW to include this
proportion of material as municipal like solid a waste and therefore distinguishing a clearer divide
between MSW recycling rates and that which is industrial, construction and demolition.
However, it has been important to include commercial waste arisings within this field of study as it is a
significant portion (currently roughly half) of the overall potential recycling target. It is also true to say
that commercial waste streams are seen as a significant area to target for improvement in the battle to
get to the 55% and 60% recycling targets with the potential to reduce the burden on Local authority
improvements. The difficulty in this though is that commercial waste collections are not consistently
delivered, a wide range of service providers compete for individual contracts, and very limited regional
business groups (Such as Business Improvement Districts) opt into a consistent collection system.
Other challenges to understanding commercial collections and the opportunities for increasing
recycling rates include:
Lack of existing reported data on:
o Operations
o Composition
o Tonnage
Space required to store an additional bin for some SMEs
Economic pressures of having to pay for an additional service
Lack of understanding
Contamination levels in recycling collected
Within Local Authorities a loss of the skills required in some areas to operate a commercial
waste and recycling service
o Experienced officers and/or a private sector partner is required
As a result of all of the above a pragmatic approach to C&I has been undertaken. As it has been
modelled separately its impact on overall recycling rate can be reviewed as a sensitivity at all of the
MSW scenario’s individually. As such, the impact of changing C&I recycling rates can be reviewed at
any break point for LA’s be this after AWC and food waste or three weekly. This gives the analysis the
flexibility to understand the potential impact of LA and C&I waste individually but also as a combined
approach.
Defra’s latest C&I waste estimates published in February 201818 (but with estimates for 2016 which we
have projected forward) have been utilised as the baseline for the waste flow model with the potential
to vary the recycling rate performance on each scenario. This approach has been utilised because on
top of a limited understanding of the C&I waste generation rates there is also a limited and varied
opinion as to what the proportion of this material is currently recycled. From our understanding (based
on stakeholder feedback and ranges published) current estimations of C&I recycling rates range
between 50% to 60%.
18 https://www.gov.uk/government/statistics/uk-waste-data
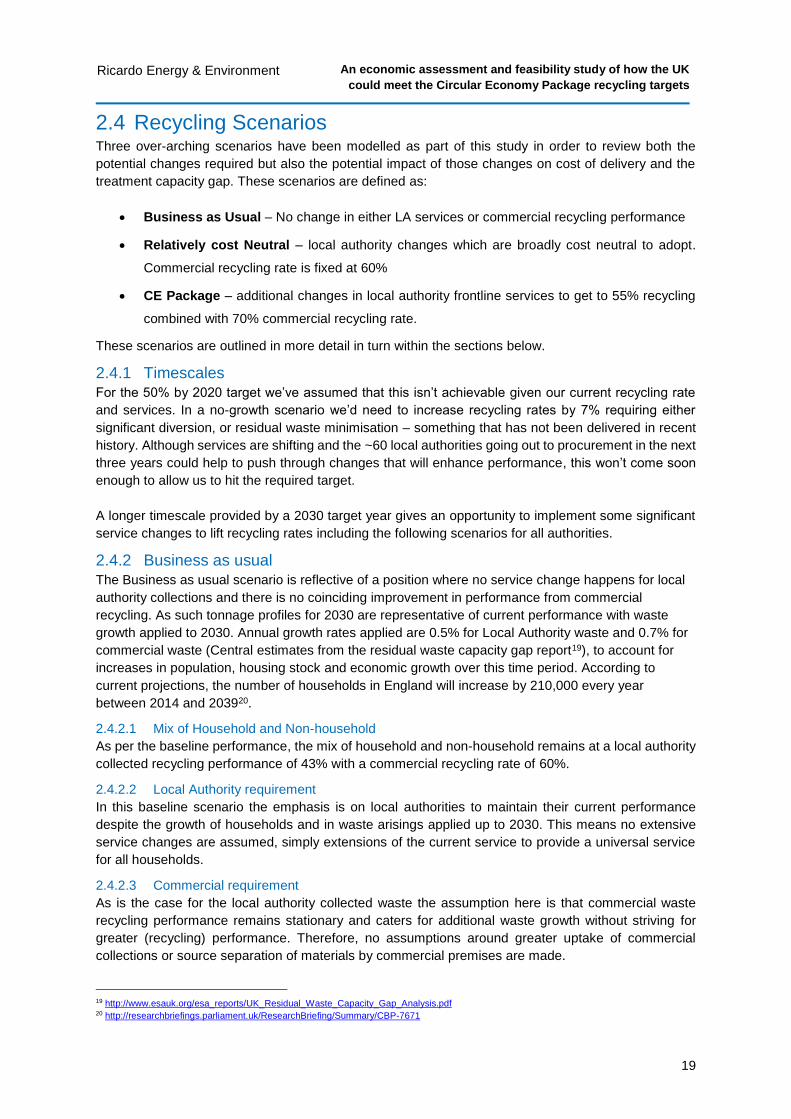
An economic assessment and feasibility study of how the UK
could meet the Circular Economy Package recycling targets
19
Ricardo Energy & Environment
2.4 Recycling Scenarios Three over-arching scenarios have been modelled as part of this study in order to review both the
potential changes required but also the potential impact of those changes on cost of delivery and the
treatment capacity gap. These scenarios are defined as:
Business as Usual – No change in either LA services or commercial recycling performance
Relatively cost Neutral – local authority changes which are broadly cost neutral to adopt.
Commercial recycling rate is fixed at 60%
CE Package – additional changes in local authority frontline services to get to 55% recycling
combined with 70% commercial recycling rate.
These scenarios are outlined in more detail in turn within the sections below.
2.4.1 Timescales For the 50% by 2020 target we’ve assumed that this isn’t achievable given our current recycling rate
and services. In a no-growth scenario we’d need to increase recycling rates by 7% requiring either
significant diversion, or residual waste minimisation – something that has not been delivered in recent
history. Although services are shifting and the ~60 local authorities going out to procurement in the next
three years could help to push through changes that will enhance performance, this won’t come soon
enough to allow us to hit the required target.
A longer timescale provided by a 2030 target year gives an opportunity to implement some significant
service changes to lift recycling rates including the following scenarios for all authorities.
2.4.2 Business as usual The Business as usual scenario is reflective of a position where no service change happens for local
authority collections and there is no coinciding improvement in performance from commercial
recycling. As such tonnage profiles for 2030 are representative of current performance with waste
growth applied to 2030. Annual growth rates applied are 0.5% for Local Authority waste and 0.7% for
commercial waste (Central estimates from the residual waste capacity gap report19), to account for
increases in population, housing stock and economic growth over this time period. According to
current projections, the number of households in England will increase by 210,000 every year
between 2014 and 203920.
2.4.2.1 Mix of Household and Non-household
As per the baseline performance, the mix of household and non-household remains at a local authority
collected recycling performance of 43% with a commercial recycling rate of 60%.
2.4.2.2 Local Authority requirement
In this baseline scenario the emphasis is on local authorities to maintain their current performance
despite the growth of households and in waste arisings applied up to 2030. This means no extensive
service changes are assumed, simply extensions of the current service to provide a universal service
for all households.
2.4.2.3 Commercial requirement
As is the case for the local authority collected waste the assumption here is that commercial waste
recycling performance remains stationary and caters for additional waste growth without striving for
greater (recycling) performance. Therefore, no assumptions around greater uptake of commercial
collections or source separation of materials by commercial premises are made.
19 http://www.esauk.org/esa_reports/UK_Residual_Waste_Capacity_Gap_Analysis.pdf 20 http://researchbriefings.parliament.uk/ResearchBriefing/Summary/CBP-7671
An economic assessment and feasibility study of how the UK
could meet the Circular Economy Package recycling targets
20
Ricardo Energy & Environment
2.4.2.4 Residual Waste Treatment
Residual waste treatment capacity is defined by the upper, middle and lower treatment capacity
estimates as reviewed within the residual waste capacity gap report21. These are taken to include
both the additional capacity from ongoing development of EFW facilities and potential changes to
future RDF capacity.
2.4.3 Relatively cost neutral The second scenario modelled is that of a relatively cost neutral solution, taking into account a range
of Local Authority collection levers alongside an uplift in commercial recycling. This scenario broadly
aligns with the 50% Local Authority recycling rate and a 60% commercial recycling rate presented within
the UK Residual Waste: 2020 Market review report22. It is assumed to be relatively cost neutral resulting
from the additional costly services of source segregated food waste collections being paid for by savings
gained from reduced residual frequency (e.g. implementing a food waste collection at the same time as
moving to AWC). The important factor in this is that a whole system saving has been assumed, as such
would only be cost neutral if savings (Disposal Credits) on treatment and disposal of waste are shared
with collection authorities within two tier arrangements.
2.4.3.1 Mix of Household and Non-household
The combination of household and non-household waste for this scenario has been set out as a
balanced approach with local authority recycling rates reaching 53% and commercial waste reaching
60% by 2030. The combination of these two provides a scenario where England’s recycling
performance reaches 56% just missing the 60% 2030 target under the CE package.
2.4.3.2 Local Authority requirement
In order to get to this 48.4% kerbside collected recycling rate for Local authority collected material
(which contributes to the overall rate), it has been assumed that there is a significant combined effort,
with all collection authorities making strides towards scheme improvement. This includes shifting either
to fortnightly residual waste collections (rurality’s 1 and 2) and three weekly residual waste collections
for rurality’s 3, 4, 5, and 6. In doing so however it is assumed that savings gained from reduced
frequency can be re-invested in the addition of source segregated food waste collections resulting in a
net cost neutral improvement in recycling rates. In this instance it is clear there will be a difference in
the burdens paid by local authorities, with those starting from a weekly position gaining more with
potential savings from the combined shift of both reduced residual waste collection and implementation
of weekly food waste.
To help address budgetary pressures many authorities have changed from a free to a chargeable
garden waste service in the past few years (45% of Local Authorities operated a chargeable service in
2015/16). This can provide revenue for an authority which can be reinvested in services. Not everyone
using the free service will be willing to pay for a service and broadly the tonnage collected at the kerbside
reduces by 30-35%. Some of this tonnage migrates to HWRCs, some is diverted to the residual waste
stream (although this can be limited if there is a capacity restriction) and some to home composting.
Depending on the starting point for the local authority this can reduce their individual recycling rate
between 1% and 9%. Garden waste is a heavy low value material stream that is better treated in-situ
by home composting if possible. Within the modelling we have assumed that although there will be
more authorities (particularly rurality 3 and above) moving to a chargeable system that the overall
recycling rate will stand still. Any losses in percentage points will be offset by those authorities that have
implemented other interventions.
It is also pertinent to note that when “cost neutral” has been considered this is based on a whole system
costing approach thus savings from the frontline resourcing are supplemented by additional savings on
21 http://www.esauk.org/esa_reports/UK_Residual_Waste_Capacity_Gap_Analysis.pdf 22 http://www.esauk.org/esa_reports/UK_Residual_Waste_Capacity_Gap_Analysis.pdf
An economic assessment and feasibility study of how the UK
could meet the Circular Economy Package recycling targets
21
Ricardo Energy & Environment
treatment and disposal. In order for this to happen new deals and approaches to partnership working
and disposal credits will need to be considered to ensure the full incentive of reduced frequency can be
brought into account for collection authorities. Without this re-imbursement of treatment and disposal
savings, it is likely to be a far less palatable service change for collection authorities to consider.
It's recognised that not every Local Authority in England will be able to make a shift towards reduced
frequency collections particularly urban authorities with high levels of flats and multi occupancy
accommodation such as those in central and east London. Provision of a universal service for all
residents, regular communications, a focus on contamination, introduction of bring to food waste sites,
the ability to reduce the capacity (e.g. slimming the wheeled bin from a 240l to a 180l bin) of the
residual waste bin, and adequate provision for waste and recycling within new builds are part of a
portfolio of different interventions that could be utilised. The percentage uplift in recycling that this
might provide will not be as great as a shift to AWC but should support the journey to higher overall
recycling rates for England.
2.4.3.3 Commercial requirement
In the relatively cost neutral scenario it is assumed that the commercial recycling rate will remain at
60%. Without significant intervention the recycling rate will not increase. An increase in would only be
achieved by the commercial sector and local authorities increasing commercial waste collections, and
offering an appropriate service which where possible is consistent to that of their household collection
service.
2.4.3.4 Residual Treatment
As in the baseline, residual waste treatment capacity is defined by the upper, middle and lower
treatment capacity estimates as reviewed within the residual waste capacity gap report23. These are
taken to include both the additional capacity from ongoing development of EFW facilities and uptake of
additional RDF capacity.
2.4.4 CE package The CE package scenario is reflective of the additional measures required to maximise Local authority
waste collections, with additional expectations of commercial waste rising to a 70% recycling rate with
mandatory source segregation of dry recycling, organics and residual material.
Approximately 80 – 85% of material is in household waste is recyclable. To achieve some 60% recycling
rate residents would need to capture at least 70% of their recyclables, consistently, every week
particularly the heavier material streams such as food and garden waste. Contamination,
inconsistencies within materials collected across authorities, and current levels of participation by
residents would make this recycling rate almost impossible without increased investment and significant
behaviour change.
2.4.4.1 Mix of Household and Non-household
The combination of household and non-household waste for this scenario has been set out as a
balanced approach with Local authority recycling rates reaching 55% and commercial waste reaching
70% by 2030. The combination of these two provides a scenario where England’s recycling
performance reaches 65% exceeding the 60% target for 2030 under the CE package, and almost
reaching the 65% target which has now been deferred until 2035 under the legislation.
2.4.4.2 Local Authority requirement
In order to get to a 55% recycling performance, it is assumed that all collection authorities can make
transitions to reducing residual collections to three weekly with the addition of source segregated food
waste collections. In addition to these core services additional materials are targeted in the form of
AHP’s, WEEE and textiles. These additional materials are assumed to be kerbside collected at a
frequency of between once a month and once per quarter collections capturing 25-30% of the target
23 http://www.esauk.org/esa_reports/UK_Residual_Waste_Capacity_Gap_Analysis.pdf
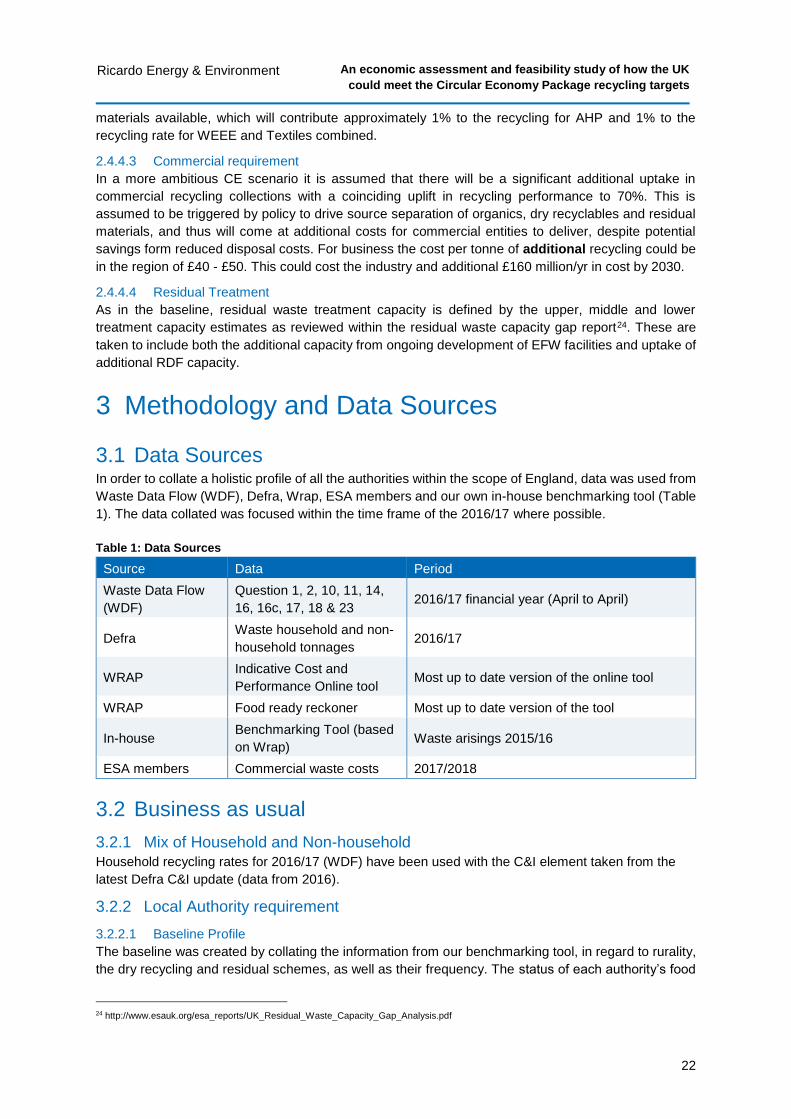
An economic assessment and feasibility study of how the UK
could meet the Circular Economy Package recycling targets
22
Ricardo Energy & Environment
materials available, which will contribute approximately 1% to the recycling for AHP and 1% to the
recycling rate for WEEE and Textiles combined.
2.4.4.3 Commercial requirement
In a more ambitious CE scenario it is assumed that there will be a significant additional uptake in
commercial recycling collections with a coinciding uplift in recycling performance to 70%. This is
assumed to be triggered by policy to drive source separation of organics, dry recyclables and residual
materials, and thus will come at additional costs for commercial entities to deliver, despite potential
savings form reduced disposal costs. For business the cost per tonne of additional recycling could be
in the region of £40 - £50. This could cost the industry and additional £160 million/yr in cost by 2030.
2.4.4.4 Residual Treatment
As in the baseline, residual waste treatment capacity is defined by the upper, middle and lower
treatment capacity estimates as reviewed within the residual waste capacity gap report24. These are
taken to include both the additional capacity from ongoing development of EFW facilities and uptake of
additional RDF capacity.
3 Methodology and Data Sources
3.1 Data Sources In order to collate a holistic profile of all the authorities within the scope of England, data was used from
Waste Data Flow (WDF), Defra, Wrap, ESA members and our own in-house benchmarking tool (Table
1). The data collated was focused within the time frame of the 2016/17 where possible.
Table 1: Data Sources
Source Data Period
Waste Data Flow
(WDF)
Question 1, 2, 10, 11, 14,
16, 16c, 17, 18 & 23 2016/17 financial year (April to April)
Defra Waste household and non-
household tonnages 2016/17
WRAP Indicative Cost and
Performance Online tool Most up to date version of the online tool
WRAP Food ready reckoner Most up to date version of the tool
In-house Benchmarking Tool (based
on Wrap) Waste arisings 2015/16
ESA members Commercial waste costs 2017/2018
3.2 Business as usual
3.2.1 Mix of Household and Non-household Household recycling rates for 2016/17 (WDF) have been used with the C&I element taken from the
latest Defra C&I update (data from 2016).
3.2.2 Local Authority requirement
3.2.2.1 Baseline Profile
The baseline was created by collating the information from our benchmarking tool, in regard to rurality,
the dry recycling and residual schemes, as well as their frequency. The status of each authority’s food
24 http://www.esauk.org/esa_reports/UK_Residual_Waste_Capacity_Gap_Analysis.pdf
An economic assessment and feasibility study of how the UK
could meet the Circular Economy Package recycling targets
23
Ricardo Energy & Environment
and garden scheme was also identified. WDF information from question 2 provided the household
numbers and both household and non-household tonnage data from Defra’s annual report was used to
show the 2016/17 residual, dry recycling and green recycling tonnages. Similarly, figures from question
10 of WDF were used to cross reference with the Defra data. The same data for non-household waste
was collected using the Defra annual report and question 11 of WDF. In addition to this, the information
from the Defra annual report was used to inform the recycling rates for kerbside, non-households, local
authority and local authority excluding contamination.
No change in growth rate (0.5%) until 2030 was used.
3.2.3 Commercial requirement No change in growth rate (0.7%) until 2030 was used, which is the central estimate in the residual
waste capacity gap report25
3.2.4 Residual Treatment As in the baseline residual waste treatment capacity is defined by the upper, middle and lower treatment
capacity estimates as reviewed within the residual waste capacity gap report26. These are taken to
include both the additional capacity from ongoing development of EFW facilities and uptake of additional
RDF capacity.
3.3 Relatively cost neutral
3.3.1 Mix of Household and Non-household The relatively cost neutral approach to modelling has been modelled based on those authorities that
are rurality 1 and 2 reach fortnightly collections of residual waste with a source separate food waste
collection and those authorities that are rurality’s 3, 4, 5 and 6 reaching a 3-weekly residual collection
with source segregated food waste. This entails a Local authority recycling rate shift from 43% up to
50% kerbside recycling rate and 53% Local Authority overall rate - a shift of 7%.
Commercial and Industrial waste is modelled as remaining at 60% but with greater Local authority
facilitation of commercial collections. This could include the facilitation with local commerce groups
(BIDs) to joint procure standardised service providers for commercial waste collections. Providing this
service will ensure the availability of commercial service with those who see the financial benefit of
participating in can do so making savings on their existing disposal expenditure resulting in greater
participation in commercial recycling. This will be supplemented by the jointly procured providers
offering economies of scale for larger contracts, again further incentivising participation in commercial
collection schemes.
Overall the provision of the additional changes in Local Authority service the commercial recycling
performance offers a 56% overall England recycling rate.
3.3.2 Local Authority requirement
3.3.2.1 Fortnightly residual collections and recycling uplift
The information from the indicative cost and performance tool produced by WRAP, provided a basis of
modelled costs and yields for differing recycling schemes based on rurality. The tool was used to inform
the standard percentage change expected when shifting from a weekly residual collection service to
fortnightly, with variance for each rurality and service type. The outcome of this was a new potential dry
recycling tonnage. A new residual tonnage was also calculated based on the dry recycling now
captured.
25 http://www.esauk.org/esa_reports/UK_Residual_Waste_Capacity_Gap_Analysis.pdf 26 http://www.esauk.org/esa_reports/UK_Residual_Waste_Capacity_Gap_Analysis.pdf
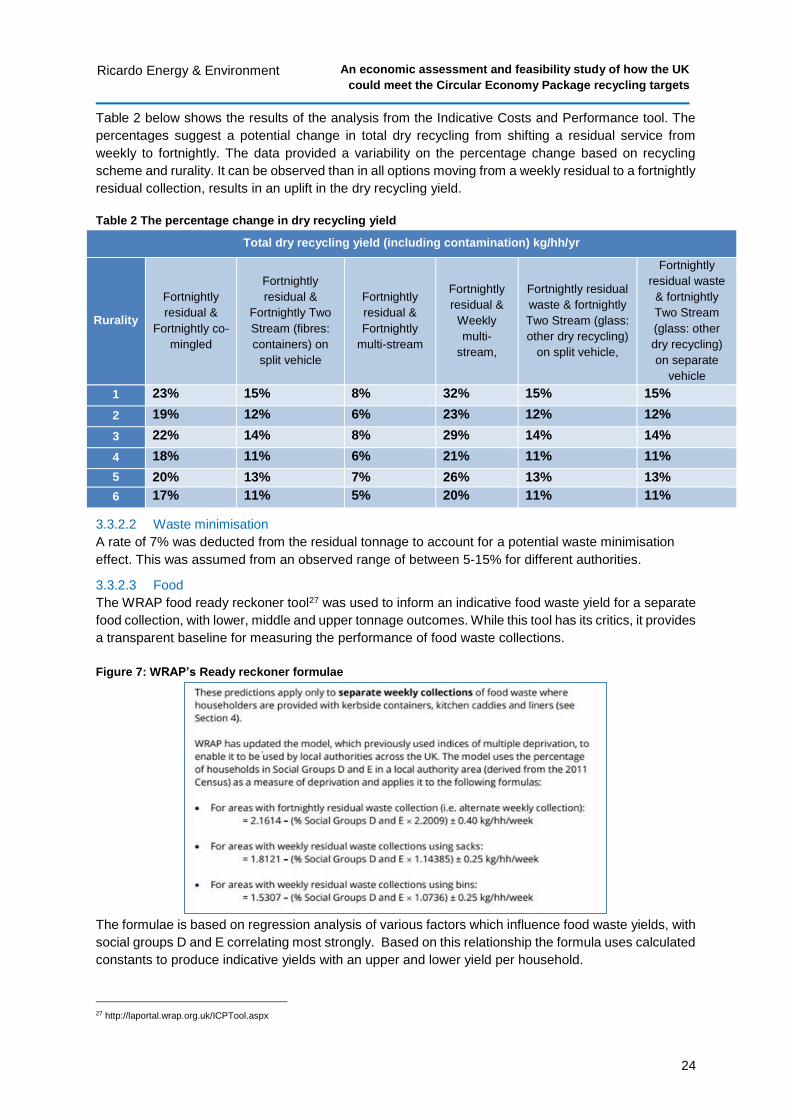
An economic assessment and feasibility study of how the UK
could meet the Circular Economy Package recycling targets
24
Ricardo Energy & Environment
Table 2 below shows the results of the analysis from the Indicative Costs and Performance tool. The
percentages suggest a potential change in total dry recycling from shifting a residual service from
weekly to fortnightly. The data provided a variability on the percentage change based on recycling
scheme and rurality. It can be observed than in all options moving from a weekly residual to a fortnightly
residual collection, results in an uplift in the dry recycling yield.
Table 2 The percentage change in dry recycling yield
Total dry recycling yield (including contamination) kg/hh/yr
Rurality
Fortnightly
residual &
Fortnightly co-
mingled
Fortnightly
residual &
Fortnightly Two
Stream (fibres:
containers) on
split vehicle
Fortnightly
residual &
Fortnightly
multi-stream
Fortnightly
residual &
Weekly
multi-
stream,
Fortnightly residual
waste & fortnightly
Two Stream (glass:
other dry recycling)
on split vehicle,
Fortnightly
residual waste
& fortnightly
Two Stream
(glass: other
dry recycling)
on separate
vehicle
1 23% 15% 8% 32% 15% 15%
2 19% 12% 6% 23% 12% 12%
3 22% 14% 8% 29% 14% 14%
4 18% 11% 6% 21% 11% 11%
5 20% 13% 7% 26% 13% 13%
6 17% 11% 5% 20% 11% 11%
3.3.2.2 Waste minimisation
A rate of 7% was deducted from the residual tonnage to account for a potential waste minimisation
effect. This was assumed from an observed range of between 5-15% for different authorities.
3.3.2.3 Food
The WRAP food ready reckoner tool27 was used to inform an indicative food waste yield for a separate
food collection, with lower, middle and upper tonnage outcomes. While this tool has its critics, it provides
a transparent baseline for measuring the performance of food waste collections.
Figure 7: WRAP’s Ready reckoner formulae
The formulae is based on regression analysis of various factors which influence food waste yields, with
social groups D and E correlating most strongly. Based on this relationship the formula uses calculated
constants to produce indicative yields with an upper and lower yield per household.
27 http://laportal.wrap.org.uk/ICPTool.aspx
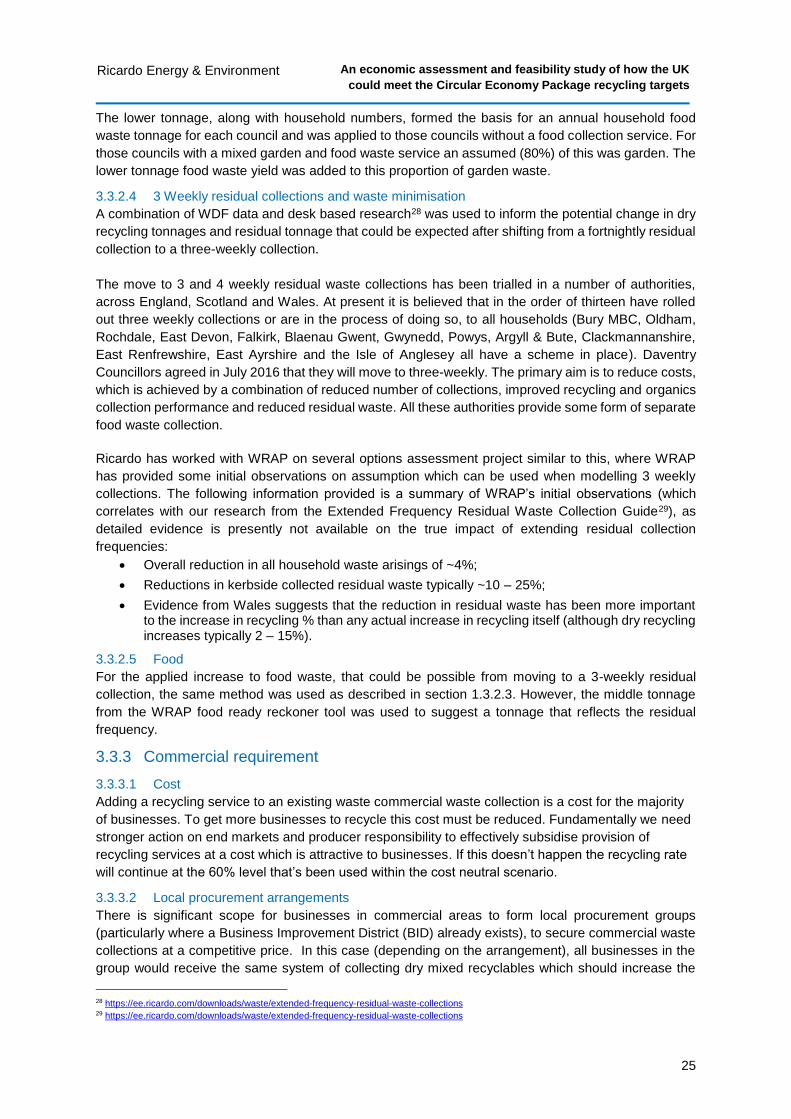
An economic assessment and feasibility study of how the UK
could meet the Circular Economy Package recycling targets
25
Ricardo Energy & Environment
The lower tonnage, along with household numbers, formed the basis for an annual household food
waste tonnage for each council and was applied to those councils without a food collection service. For
those councils with a mixed garden and food waste service an assumed (80%) of this was garden. The
lower tonnage food waste yield was added to this proportion of garden waste.
3.3.2.4 3 Weekly residual collections and waste minimisation
A combination of WDF data and desk based research28 was used to inform the potential change in dry
recycling tonnages and residual tonnage that could be expected after shifting from a fortnightly residual
collection to a three-weekly collection.
The move to 3 and 4 weekly residual waste collections has been trialled in a number of authorities,
across England, Scotland and Wales. At present it is believed that in the order of thirteen have rolled
out three weekly collections or are in the process of doing so, to all households (Bury MBC, Oldham,
Rochdale, East Devon, Falkirk, Blaenau Gwent, Gwynedd, Powys, Argyll & Bute, Clackmannanshire,
East Renfrewshire, East Ayrshire and the Isle of Anglesey all have a scheme in place). Daventry
Councillors agreed in July 2016 that they will move to three-weekly. The primary aim is to reduce costs,
which is achieved by a combination of reduced number of collections, improved recycling and organics
collection performance and reduced residual waste. All these authorities provide some form of separate
food waste collection.
Ricardo has worked with WRAP on several options assessment project similar to this, where WRAP
has provided some initial observations on assumption which can be used when modelling 3 weekly
collections. The following information provided is a summary of WRAP’s initial observations (which
correlates with our research from the Extended Frequency Residual Waste Collection Guide29), as
detailed evidence is presently not available on the true impact of extending residual collection
frequencies:
Overall reduction in all household waste arisings of ~4%;
Reductions in kerbside collected residual waste typically ~10 – 25%;
Evidence from Wales suggests that the reduction in residual waste has been more important to the increase in recycling % than any actual increase in recycling itself (although dry recycling increases typically 2 – 15%).
3.3.2.5 Food
For the applied increase to food waste, that could be possible from moving to a 3-weekly residual
collection, the same method was used as described in section 1.3.2.3. However, the middle tonnage
from the WRAP food ready reckoner tool was used to suggest a tonnage that reflects the residual
frequency.
3.3.3 Commercial requirement
3.3.3.1 Cost
Adding a recycling service to an existing waste commercial waste collection is a cost for the majority
of businesses. To get more businesses to recycle this cost must be reduced. Fundamentally we need
stronger action on end markets and producer responsibility to effectively subsidise provision of
recycling services at a cost which is attractive to businesses. If this doesn’t happen the recycling rate
will continue at the 60% level that’s been used within the cost neutral scenario.
3.3.3.2 Local procurement arrangements
There is significant scope for businesses in commercial areas to form local procurement groups
(particularly where a Business Improvement District (BID) already exists), to secure commercial waste
collections at a competitive price. In this case (depending on the arrangement), all businesses in the
group would receive the same system of collecting dry mixed recyclables which should increase the
28 https://ee.ricardo.com/downloads/waste/extended-frequency-residual-waste-collections 29 https://ee.ricardo.com/downloads/waste/extended-frequency-residual-waste-collections
An economic assessment and feasibility study of how the UK
could meet the Circular Economy Package recycling targets
26
Ricardo Energy & Environment
tonnage collected as it becomes more economic for the contractor to collect smaller volumes of
recyclables from a greater number of customers in an area and increase quality through greater
segregation and a reduction in contamination. This also has the benefit of reducing vehicle movements
and consequently air pollution as one service provide visits the area rather than multiple.
3.3.3.3 Greater awareness of social responsibility
As business and individuals become increasingly aware of their social responsibility with regard to
waste, it is likely that more will provide facilities to segregate recyclable waste at their premises which
will increase the tonnage of material available for collection. This will require a behaviour change
element with pressure from staff and customers. There is an increased current focus on the environment
and particularly on plastics and single use plastics. For many SMEs the challenge of cost still remains
and until collections move away from a volume based system where recycling is an additional cost
rather than an overall saving progress will be slow. Regulation (as in Scotland) may help to drive
increased recycling but it will still result in an overall cost to business.
3.3.3.4 Increased take up of local authority collections
In the past, many local authorities reduced or ceased their commercial waste collection services as
collecting the additional tonnage added to the challenge of meeting Landfill Allowances and competition
from the private sector was strong. This trend is reversing (particularly where authorities are supported
by the skills and experience of a private sector contractor) and the collection of dry mixed recyclables
from commercial and industrial sources (where services don’t already exist such as rural areas) is being
considered by many as the next growth area to increase recycling rates. This scenario includes an
increase in the uptake of local authority collections, based on the consistent collection methods applied
to the collection of dry mixed recyclables from households.
One of the potential options that local authorities could adopt to increase the collection of recyclables
from C&I sources is to introduce a levy on commercial premises in urban areas. This could be facilitated
through a restructure of business rates. This levy would fund the collection of dry mixed recyclates and
residual waste from each business in the area. The fact that this service is paid for ‘up front’ is likely to
increase the number of businesses that participate in the collections and this combined with the benefits
of consistent collection systems is likely to increase the tonnage and quality of Dry mixed recyclable
collections and reduce residual waste.
3.3.4 Residual treatment As in the baseline residual waste treatment capacity is defined by the upper, middle and lower treatment
capacity estimates as reviewed within the residual waste capacity gap report30. These are taken to
include both the additional capacity from ongoing development of EFW facilities and uptake of additional
RDF capacity.
3.4 CE package
3.4.1 Mix of Household and Non-household For the CE package an overall recycling rate of 53% LACW and C&I at a 70% recycling rate was
modelled.
3.4.2 Local Authority requirement
3.4.2.1 Alternative Materials
As part of the proposed CE package, the addition of AHP, WEEE and Textiles has been considered.
The collection of any additional materials should only be introduced if there are suitable end markets
for reprocessing. Currently there are no facilities available for AHP within England, there is however
interest in this market from organisations such as Proctor and Gamble. In order to calculate what
proportion of these materials may currently be available to capture in the residual waste, suggestive
30 http://www.esauk.org/esa_reports/UK_Residual_Waste_Capacity_Gap_Analysis.pdf
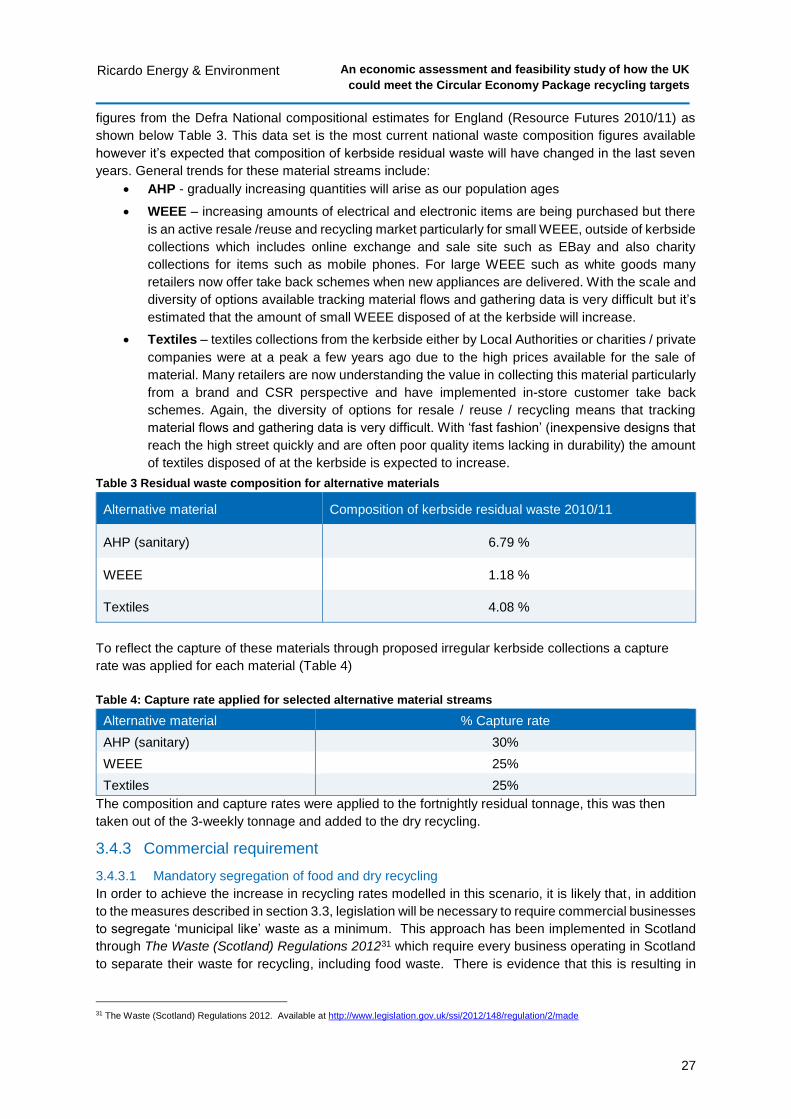
An economic assessment and feasibility study of how the UK
could meet the Circular Economy Package recycling targets
27
Ricardo Energy & Environment
figures from the Defra National compositional estimates for England (Resource Futures 2010/11) as
shown below Table 3. This data set is the most current national waste composition figures available
however it’s expected that composition of kerbside residual waste will have changed in the last seven
years. General trends for these material streams include:
AHP - gradually increasing quantities will arise as our population ages
WEEE – increasing amounts of electrical and electronic items are being purchased but there
is an active resale /reuse and recycling market particularly for small WEEE, outside of kerbside
collections which includes online exchange and sale site such as EBay and also charity
collections for items such as mobile phones. For large WEEE such as white goods many
retailers now offer take back schemes when new appliances are delivered. With the scale and
diversity of options available tracking material flows and gathering data is very difficult but it’s
estimated that the amount of small WEEE disposed of at the kerbside will increase.
Textiles – textiles collections from the kerbside either by Local Authorities or charities / private
companies were at a peak a few years ago due to the high prices available for the sale of
material. Many retailers are now understanding the value in collecting this material particularly
from a brand and CSR perspective and have implemented in-store customer take back
schemes. Again, the diversity of options for resale / reuse / recycling means that tracking
material flows and gathering data is very difficult. With ‘fast fashion’ (inexpensive designs that
reach the high street quickly and are often poor quality items lacking in durability) the amount
of textiles disposed of at the kerbside is expected to increase.
Table 3 Residual waste composition for alternative materials
Alternative material Composition of kerbside residual waste 2010/11
AHP (sanitary) 6.79 %
WEEE 1.18 %
Textiles 4.08 %
To reflect the capture of these materials through proposed irregular kerbside collections a capture
rate was applied for each material (Table 4)
Table 4: Capture rate applied for selected alternative material streams
Alternative material % Capture rate
AHP (sanitary) 30%
WEEE 25%
Textiles 25%
The composition and capture rates were applied to the fortnightly residual tonnage, this was then
taken out of the 3-weekly tonnage and added to the dry recycling.
3.4.3 Commercial requirement
3.4.3.1 Mandatory segregation of food and dry recycling
In order to achieve the increase in recycling rates modelled in this scenario, it is likely that, in addition
to the measures described in section 3.3, legislation will be necessary to require commercial businesses
to segregate ‘municipal like’ waste as a minimum. This approach has been implemented in Scotland
through The Waste (Scotland) Regulations 201231 which require every business operating in Scotland
to separate their waste for recycling, including food waste. There is evidence that this is resulting in
31 The Waste (Scotland) Regulations 2012. Available at http://www.legislation.gov.uk/ssi/2012/148/regulation/2/made
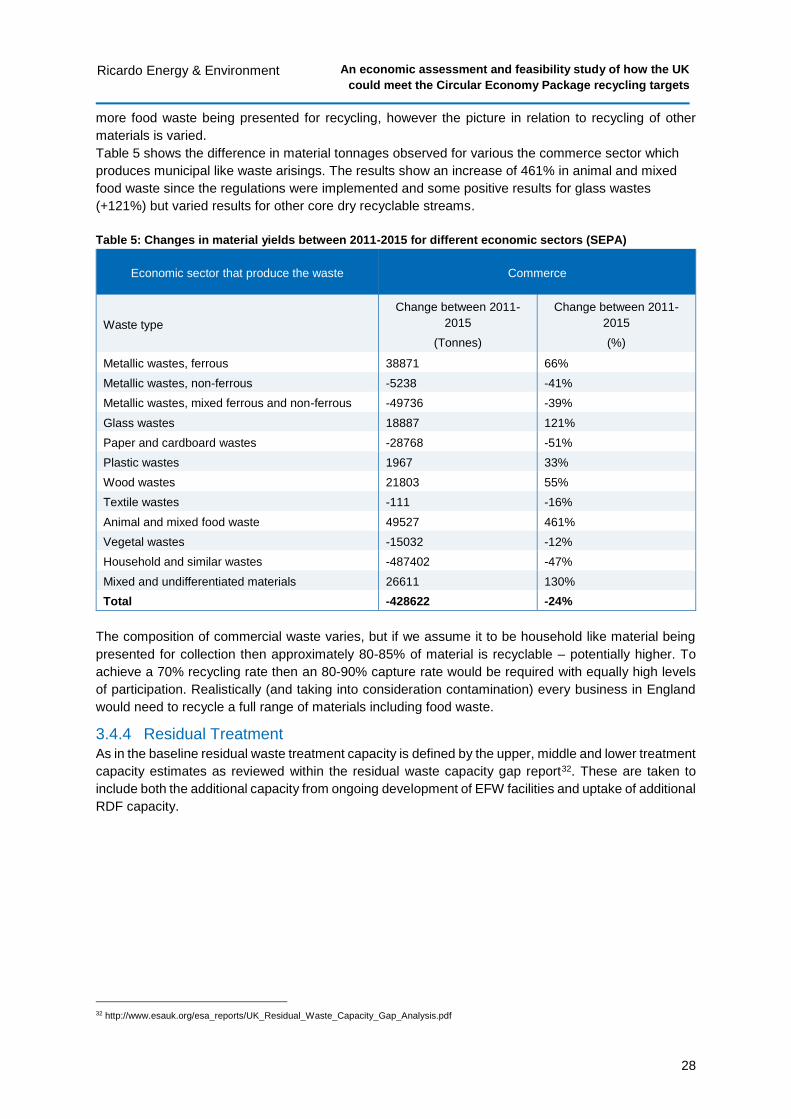
An economic assessment and feasibility study of how the UK
could meet the Circular Economy Package recycling targets
28
Ricardo Energy & Environment
more food waste being presented for recycling, however the picture in relation to recycling of other
materials is varied.
Table 5 shows the difference in material tonnages observed for various the commerce sector which
produces municipal like waste arisings. The results show an increase of 461% in animal and mixed
food waste since the regulations were implemented and some positive results for glass wastes
(+121%) but varied results for other core dry recyclable streams.
Table 5: Changes in material yields between 2011-2015 for different economic sectors (SEPA)
Economic sector that produce the waste Commerce
Waste type
Change between 2011-
2015
(Tonnes)
Change between 2011-
2015
(%)
Metallic wastes, ferrous 38871 66%
Metallic wastes, non-ferrous -5238 -41%
Metallic wastes, mixed ferrous and non-ferrous -49736 -39%
Glass wastes 18887 121%
Paper and cardboard wastes -28768 -51%
Plastic wastes 1967 33%
Wood wastes 21803 55%
Textile wastes -111 -16%
Animal and mixed food waste 49527 461%
Vegetal wastes -15032 -12%
Household and similar wastes -487402 -47%
Mixed and undifferentiated materials 26611 130%
Total -428622 -24%
The composition of commercial waste varies, but if we assume it to be household like material being
presented for collection then approximately 80-85% of material is recyclable – potentially higher. To
achieve a 70% recycling rate then an 80-90% capture rate would be required with equally high levels
of participation. Realistically (and taking into consideration contamination) every business in England
would need to recycle a full range of materials including food waste.
3.4.4 Residual Treatment
As in the baseline residual waste treatment capacity is defined by the upper, middle and lower treatment
capacity estimates as reviewed within the residual waste capacity gap report32. These are taken to
include both the additional capacity from ongoing development of EFW facilities and uptake of additional
RDF capacity.
32 http://www.esauk.org/esa_reports/UK_Residual_Waste_Capacity_Gap_Analysis.pdf
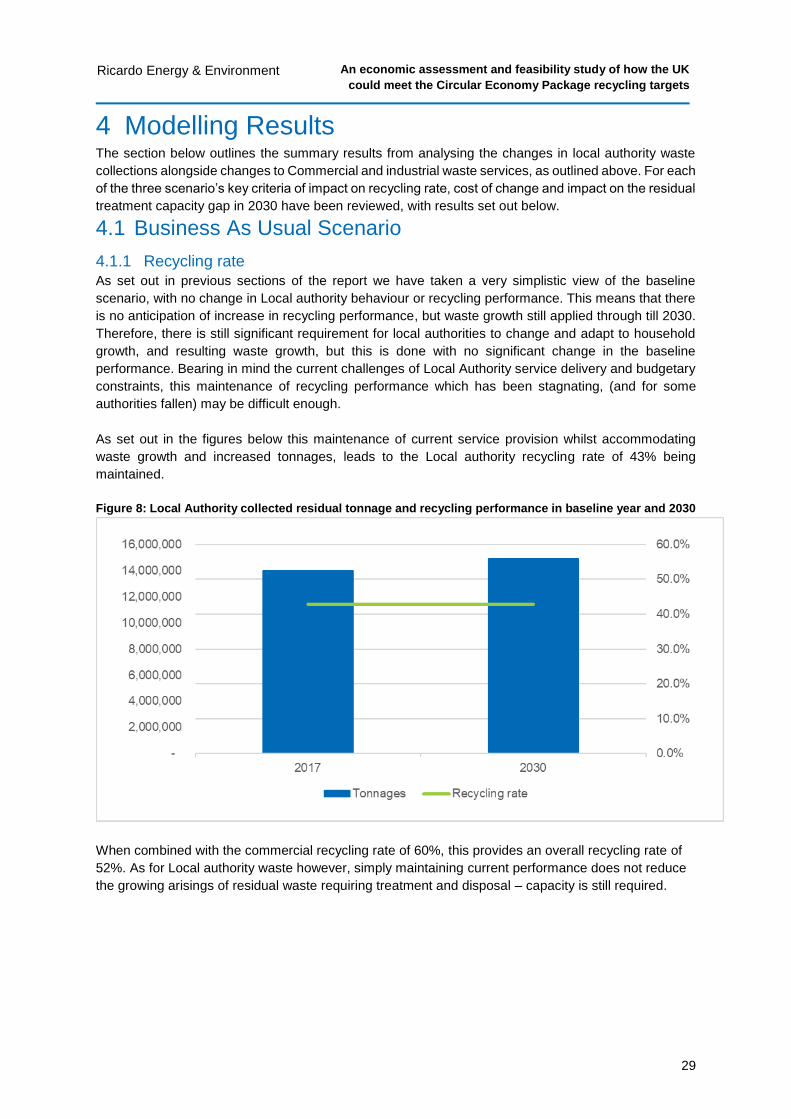
An economic assessment and feasibility study of how the UK
could meet the Circular Economy Package recycling targets
29
Ricardo Energy & Environment
4 Modelling Results The section below outlines the summary results from analysing the changes in local authority waste
collections alongside changes to Commercial and industrial waste services, as outlined above. For each
of the three scenario’s key criteria of impact on recycling rate, cost of change and impact on the residual
treatment capacity gap in 2030 have been reviewed, with results set out below.
4.1 Business As Usual Scenario
4.1.1 Recycling rate As set out in previous sections of the report we have taken a very simplistic view of the baseline
scenario, with no change in Local authority behaviour or recycling performance. This means that there
is no anticipation of increase in recycling performance, but waste growth still applied through till 2030.
Therefore, there is still significant requirement for local authorities to change and adapt to household
growth, and resulting waste growth, but this is done with no significant change in the baseline
performance. Bearing in mind the current challenges of Local Authority service delivery and budgetary
constraints, this maintenance of recycling performance which has been stagnating, (and for some
authorities fallen) may be difficult enough.
As set out in the figures below this maintenance of current service provision whilst accommodating
waste growth and increased tonnages, leads to the Local authority recycling rate of 43% being
maintained.
Figure 8: Local Authority collected residual tonnage and recycling performance in baseline year and 2030
When combined with the commercial recycling rate of 60%, this provides an overall recycling rate of
52%. As for Local authority waste however, simply maintaining current performance does not reduce
the growing arisings of residual waste requiring treatment and disposal – capacity is still required.
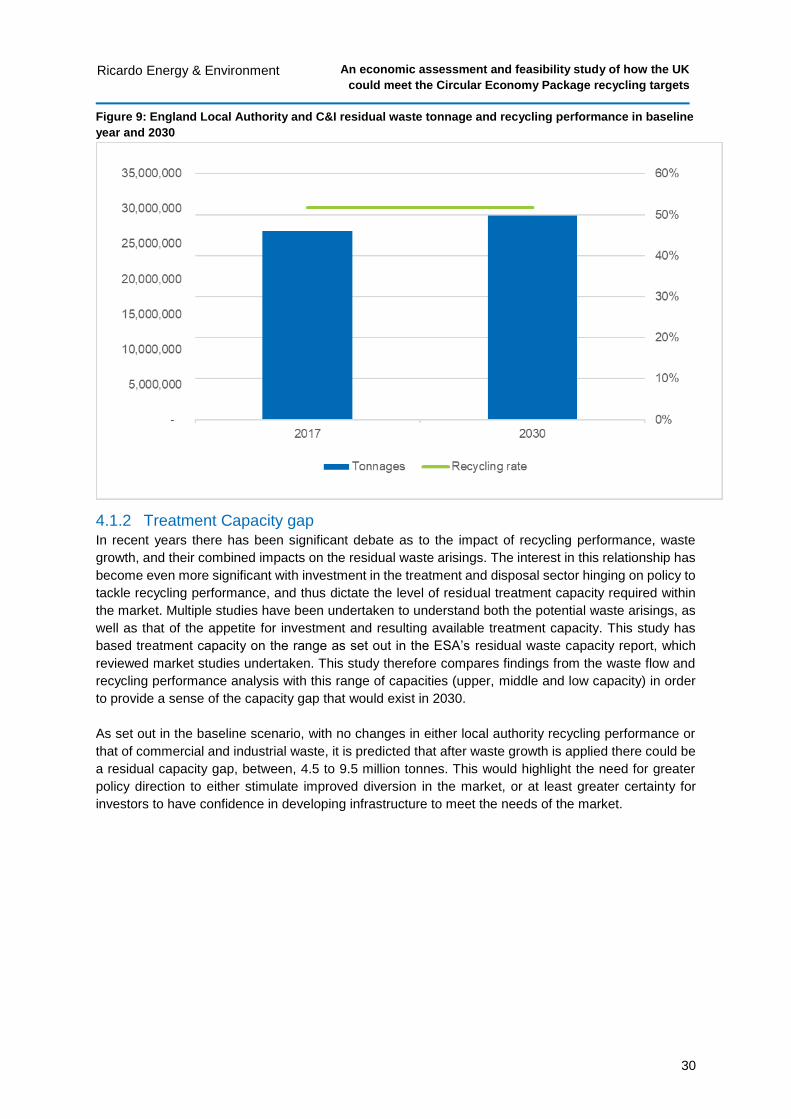
An economic assessment and feasibility study of how the UK
could meet the Circular Economy Package recycling targets
30
Ricardo Energy & Environment
Figure 9: England Local Authority and C&I residual waste tonnage and recycling performance in baseline
year and 2030
4.1.2 Treatment Capacity gap In recent years there has been significant debate as to the impact of recycling performance, waste
growth, and their combined impacts on the residual waste arisings. The interest in this relationship has
become even more significant with investment in the treatment and disposal sector hinging on policy to
tackle recycling performance, and thus dictate the level of residual treatment capacity required within
the market. Multiple studies have been undertaken to understand both the potential waste arisings, as
well as that of the appetite for investment and resulting available treatment capacity. This study has
based treatment capacity on the range as set out in the ESA’s residual waste capacity report, which
reviewed market studies undertaken. This study therefore compares findings from the waste flow and
recycling performance analysis with this range of capacities (upper, middle and low capacity) in order
to provide a sense of the capacity gap that would exist in 2030.
As set out in the baseline scenario, with no changes in either local authority recycling performance or
that of commercial and industrial waste, it is predicted that after waste growth is applied there could be
a residual capacity gap, between, 4.5 to 9.5 million tonnes. This would highlight the need for greater
policy direction to either stimulate improved diversion in the market, or at least greater certainty for
investors to have confidence in developing infrastructure to meet the needs of the market.
An economic assessment and feasibility study of how the UK
could meet the Circular Economy Package recycling targets
31
Ricardo Energy & Environment
Figure 10: Residual treatment capacity gap in baseline year and 2030 for BAU scenario (upper middle and
lower ranges refer to residual treatment capacity)
4.1.3 Cost
In the baseline scenario although there is anticipated to be significant extra cost for local authorities
burdened with the need for growing services to accommodate additional household growth, there is
anticipated to be no change in cost of service provision as a result of changes to core services. In this
respect, although local authorities may not be looking to change services and therefore the cost of
services on a per household basis, they will still require expanding budgets to provide the service to a
growing householder base. Table 6 below outlines a range of indicative costs for collection regimes,
split for rurality groupings. This evidence shows most starkly the scale of the potential issue for local
authority service providers. For example, if a rurality 3 authority with 60,000 properties on a
fortnightly collection had housing growth of 1.5% per annum they would be looking at annual
uplifts in budget of between £55,000 - £68,000 just to extend the baseline service provision to
new properties. When placed in the context of reducing budgets this - even in the baseline
business as usual scenario - demonstrates a significant challenge for local authorities and their
partners to consider.
According to current projections, the number of households in England will increase by 210,000 every
year between 2014 and 203933.This means additional costs of between £18.3M and £25.2M per
annum for Local Authorities just to provide a waste and recycling service.
33 http://researchbriefings.parliament.uk/ResearchBriefing/Summary/CBP-7671
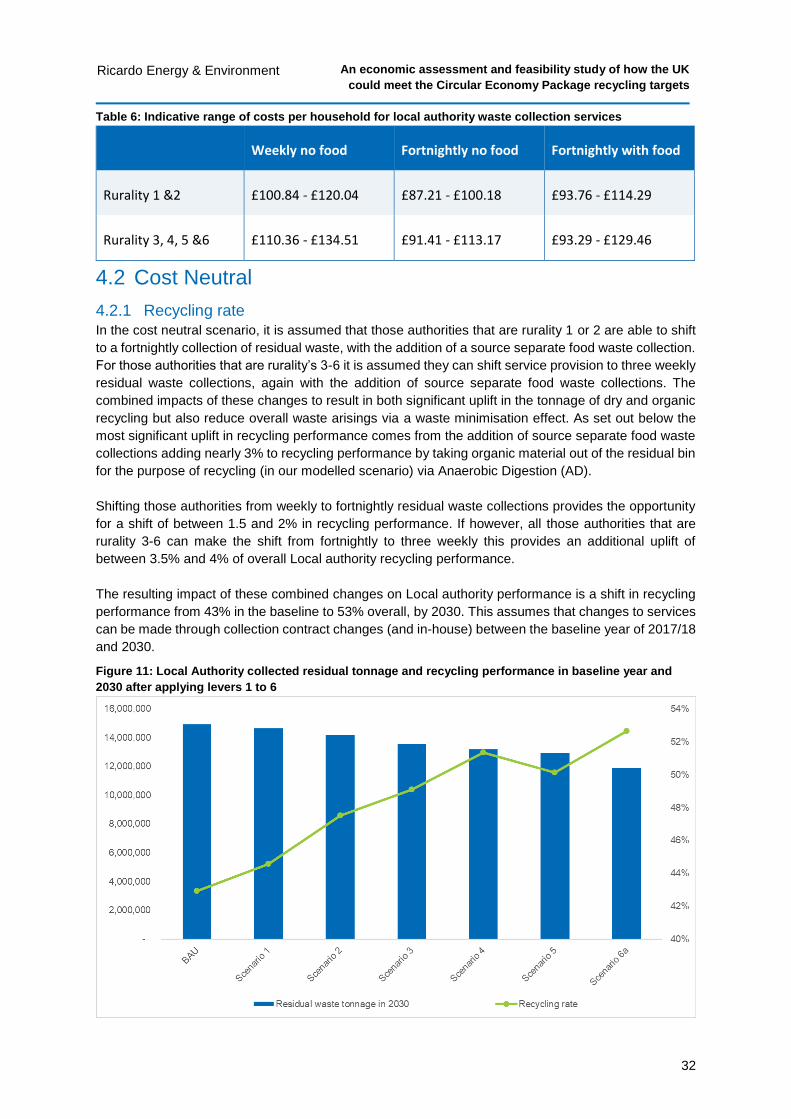
An economic assessment and feasibility study of how the UK
could meet the Circular Economy Package recycling targets
32
Ricardo Energy & Environment
Table 6: Indicative range of costs per household for local authority waste collection services
Weekly no food Fortnightly no food Fortnightly with food
Rurality 1 &2 £100.84 - £120.04 £87.21 - £100.18 £93.76 - £114.29
Rurality 3, 4, 5 &6 £110.36 - £134.51 £91.41 - £113.17 £93.29 - £129.46
4.2 Cost Neutral
4.2.1 Recycling rate
In the cost neutral scenario, it is assumed that those authorities that are rurality 1 or 2 are able to shift
to a fortnightly collection of residual waste, with the addition of a source separate food waste collection.
For those authorities that are rurality’s 3-6 it is assumed they can shift service provision to three weekly
residual waste collections, again with the addition of source separate food waste collections. The
combined impacts of these changes to result in both significant uplift in the tonnage of dry and organic
recycling but also reduce overall waste arisings via a waste minimisation effect. As set out below the
most significant uplift in recycling performance comes from the addition of source separate food waste
collections adding nearly 3% to recycling performance by taking organic material out of the residual bin
for the purpose of recycling (in our modelled scenario) via Anaerobic Digestion (AD).
Shifting those authorities from weekly to fortnightly residual waste collections provides the opportunity
for a shift of between 1.5 and 2% in recycling performance. If however, all those authorities that are
rurality 3-6 can make the shift from fortnightly to three weekly this provides an additional uplift of
between 3.5% and 4% of overall Local authority recycling performance.
The resulting impact of these combined changes on Local authority performance is a shift in recycling
performance from 43% in the baseline to 53% overall, by 2030. This assumes that changes to services
can be made through collection contract changes (and in-house) between the baseline year of 2017/18
and 2030.
Figure 11: Local Authority collected residual tonnage and recycling performance in baseline year and
2030 after applying levers 1 to 6
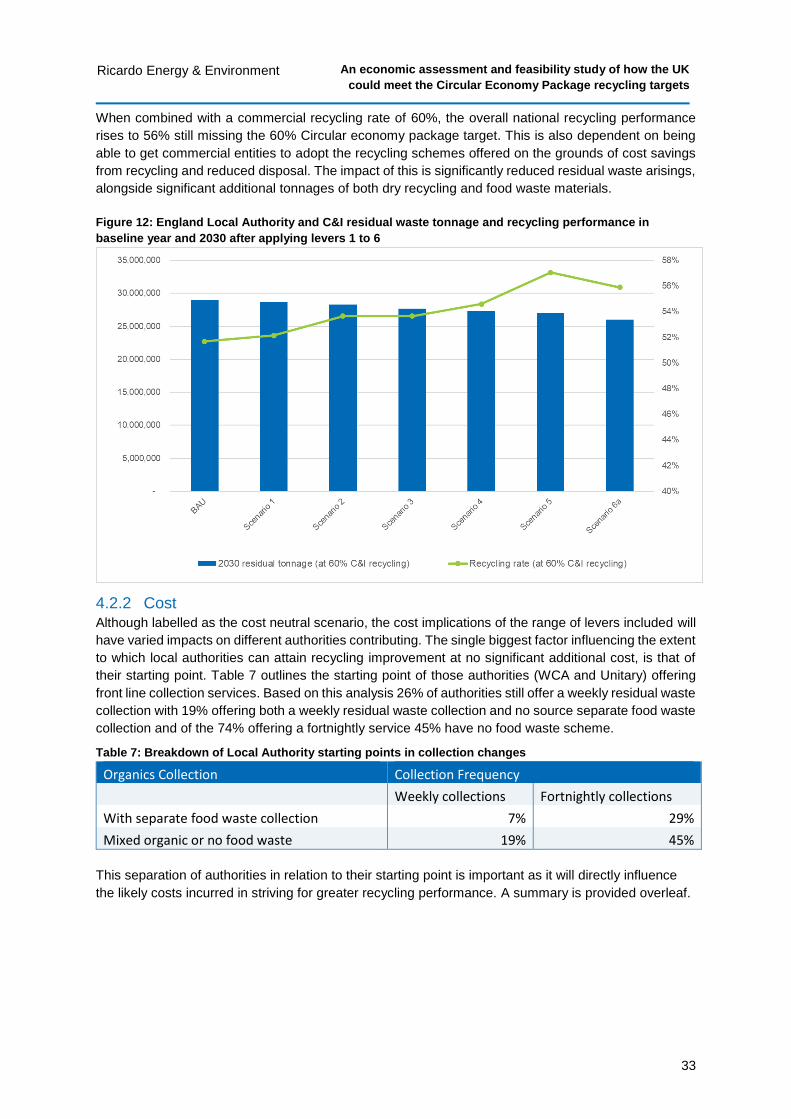
An economic assessment and feasibility study of how the UK
could meet the Circular Economy Package recycling targets
33
Ricardo Energy & Environment
When combined with a commercial recycling rate of 60%, the overall national recycling performance
rises to 56% still missing the 60% Circular economy package target. This is also dependent on being
able to get commercial entities to adopt the recycling schemes offered on the grounds of cost savings
from recycling and reduced disposal. The impact of this is significantly reduced residual waste arisings,
alongside significant additional tonnages of both dry recycling and food waste materials.
Figure 12: England Local Authority and C&I residual waste tonnage and recycling performance in
baseline year and 2030 after applying levers 1 to 6
4.2.2 Cost Although labelled as the cost neutral scenario, the cost implications of the range of levers included will
have varied impacts on different authorities contributing. The single biggest factor influencing the extent
to which local authorities can attain recycling improvement at no significant additional cost, is that of
their starting point. Table 7 outlines the starting point of those authorities (WCA and Unitary) offering
front line collection services. Based on this analysis 26% of authorities still offer a weekly residual waste
collection with 19% offering both a weekly residual waste collection and no source separate food waste
collection and of the 74% offering a fortnightly service 45% have no food waste scheme.
Table 7: Breakdown of Local Authority starting points in collection changes
Organics Collection Collection Frequency Weekly collections Fortnightly collections
With separate food waste collection 7% 29%
Mixed organic or no food waste 19% 45%
This separation of authorities in relation to their starting point is important as it will directly influence
the likely costs incurred in striving for greater recycling performance. A summary is provided overleaf.
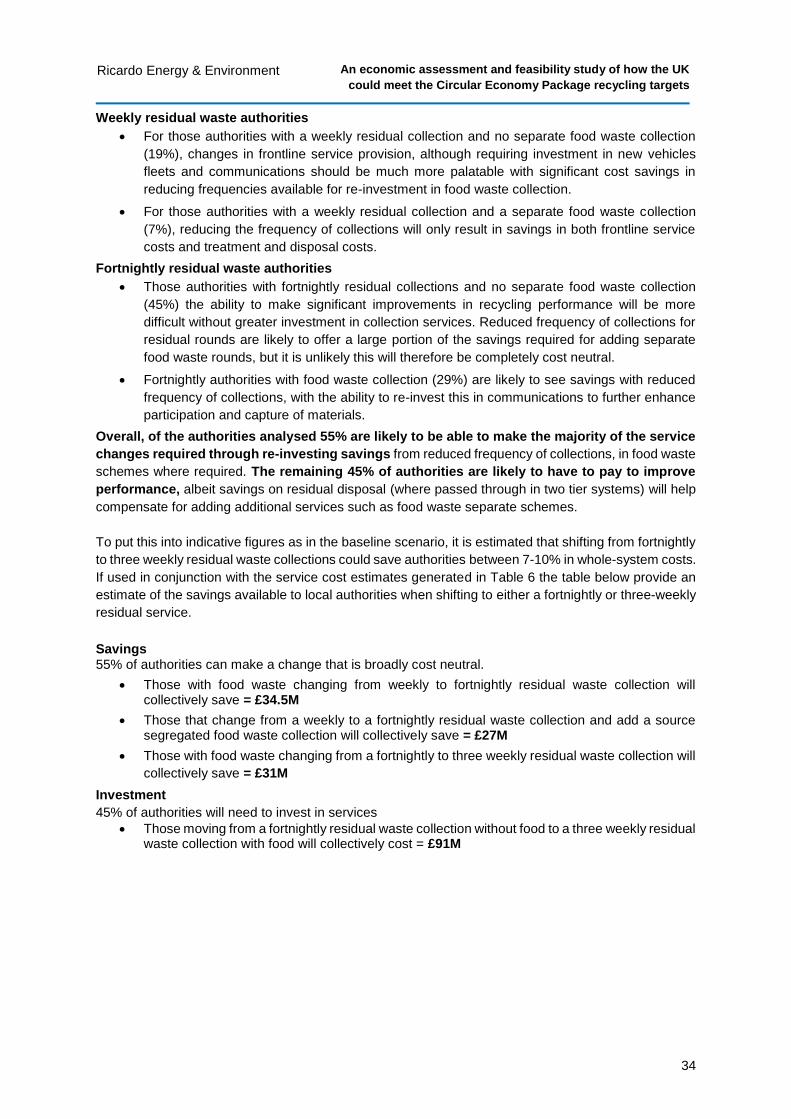
An economic assessment and feasibility study of how the UK
could meet the Circular Economy Package recycling targets
34
Ricardo Energy & Environment
Weekly residual waste authorities
For those authorities with a weekly residual collection and no separate food waste collection
(19%), changes in frontline service provision, although requiring investment in new vehicles
fleets and communications should be much more palatable with significant cost savings in
reducing frequencies available for re-investment in food waste collection.
For those authorities with a weekly residual collection and a separate food waste collection
(7%), reducing the frequency of collections will only result in savings in both frontline service
costs and treatment and disposal costs.
Fortnightly residual waste authorities
Those authorities with fortnightly residual collections and no separate food waste collection
(45%) the ability to make significant improvements in recycling performance will be more
difficult without greater investment in collection services. Reduced frequency of collections for
residual rounds are likely to offer a large portion of the savings required for adding separate
food waste rounds, but it is unlikely this will therefore be completely cost neutral.
Fortnightly authorities with food waste collection (29%) are likely to see savings with reduced
frequency of collections, with the ability to re-invest this in communications to further enhance
participation and capture of materials.
Overall, of the authorities analysed 55% are likely to be able to make the majority of the service
changes required through re-investing savings from reduced frequency of collections, in food waste
schemes where required. The remaining 45% of authorities are likely to have to pay to improve
performance, albeit savings on residual disposal (where passed through in two tier systems) will help
compensate for adding additional services such as food waste separate schemes.
To put this into indicative figures as in the baseline scenario, it is estimated that shifting from fortnightly
to three weekly residual waste collections could save authorities between 7-10% in whole-system costs.
If used in conjunction with the service cost estimates generated in Table 6 the table below provide an
estimate of the savings available to local authorities when shifting to either a fortnightly or three-weekly
residual service.
Savings 55% of authorities can make a change that is broadly cost neutral.
Those with food waste changing from weekly to fortnightly residual waste collection will collectively save = £34.5M
Those that change from a weekly to a fortnightly residual waste collection and add a source segregated food waste collection will collectively save = £27M
Those with food waste changing from a fortnightly to three weekly residual waste collection will
collectively save = £31M
Investment
45% of authorities will need to invest in services
Those moving from a fortnightly residual waste collection without food to a three weekly residual waste collection with food will collectively cost = £91M
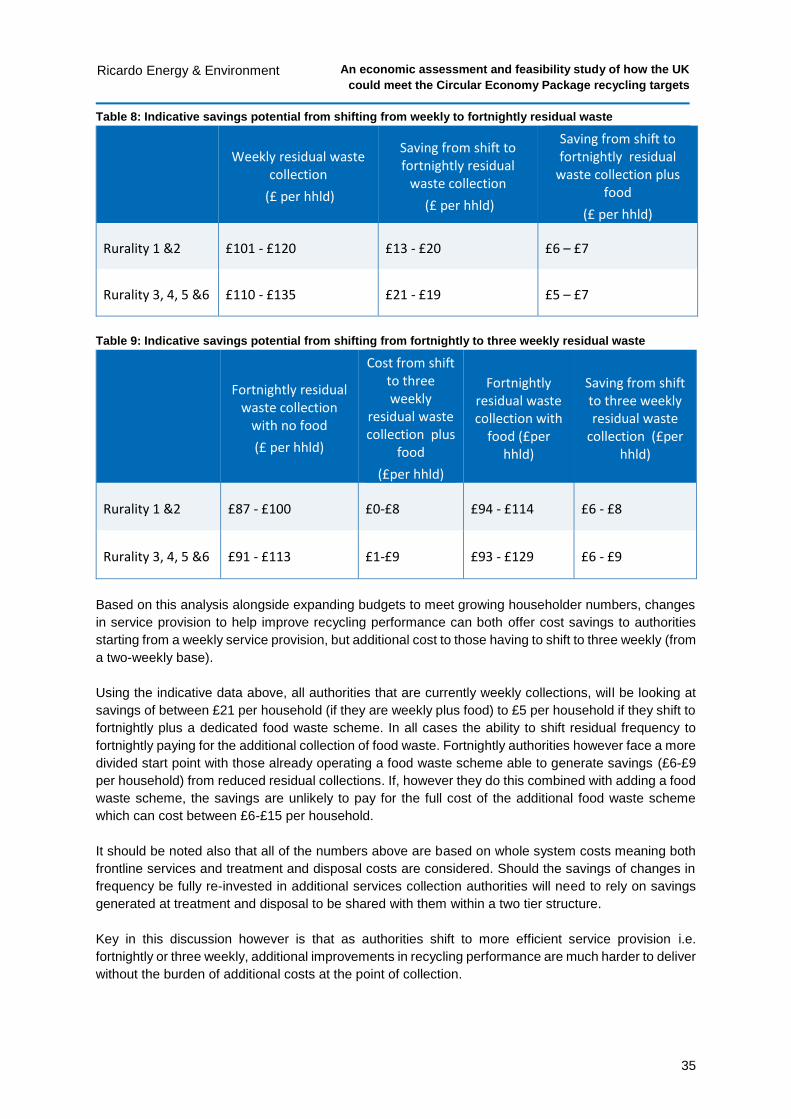
An economic assessment and feasibility study of how the UK
could meet the Circular Economy Package recycling targets
35
Ricardo Energy & Environment
Table 8: Indicative savings potential from shifting from weekly to fortnightly residual waste
Weekly residual waste
collection
(£ per hhld)
Saving from shift to fortnightly residual
waste collection
(£ per hhld)
Saving from shift to fortnightly residual
waste collection plus food
(£ per hhld)
Rurality 1 &2 £101 - £120 £13 - £20 £6 – £7
Rurality 3, 4, 5 &6 £110 - £135 £21 - £19 £5 – £7
Table 9: Indicative savings potential from shifting from fortnightly to three weekly residual waste
Fortnightly residual waste collection
with no food
(£ per hhld)
Cost from shift to three weekly
residual waste collection plus
food
(£per hhld)
Fortnightly residual waste collection with
food (£per hhld)
Saving from shift to three weekly residual waste
collection (£per hhld)
Rurality 1 &2 £87 - £100 £0-£8 £94 - £114 £6 - £8
Rurality 3, 4, 5 &6 £91 - £113 £1-£9 £93 - £129 £6 - £9
Based on this analysis alongside expanding budgets to meet growing householder numbers, changes
in service provision to help improve recycling performance can both offer cost savings to authorities
starting from a weekly service provision, but additional cost to those having to shift to three weekly (from
a two-weekly base).
Using the indicative data above, all authorities that are currently weekly collections, will be looking at
savings of between £21 per household (if they are weekly plus food) to £5 per household if they shift to
fortnightly plus a dedicated food waste scheme. In all cases the ability to shift residual frequency to
fortnightly paying for the additional collection of food waste. Fortnightly authorities however face a more
divided start point with those already operating a food waste scheme able to generate savings (£6-£9
per household) from reduced residual collections. If, however they do this combined with adding a food
waste scheme, the savings are unlikely to pay for the full cost of the additional food waste scheme
which can cost between £6-£15 per household.
It should be noted also that all of the numbers above are based on whole system costs meaning both
frontline services and treatment and disposal costs are considered. Should the savings of changes in
frequency be fully re-invested in additional services collection authorities will need to rely on savings
generated at treatment and disposal to be shared with them within a two tier structure.
Key in this discussion however is that as authorities shift to more efficient service provision i.e.
fortnightly or three weekly, additional improvements in recycling performance are much harder to deliver
without the burden of additional costs at the point of collection.
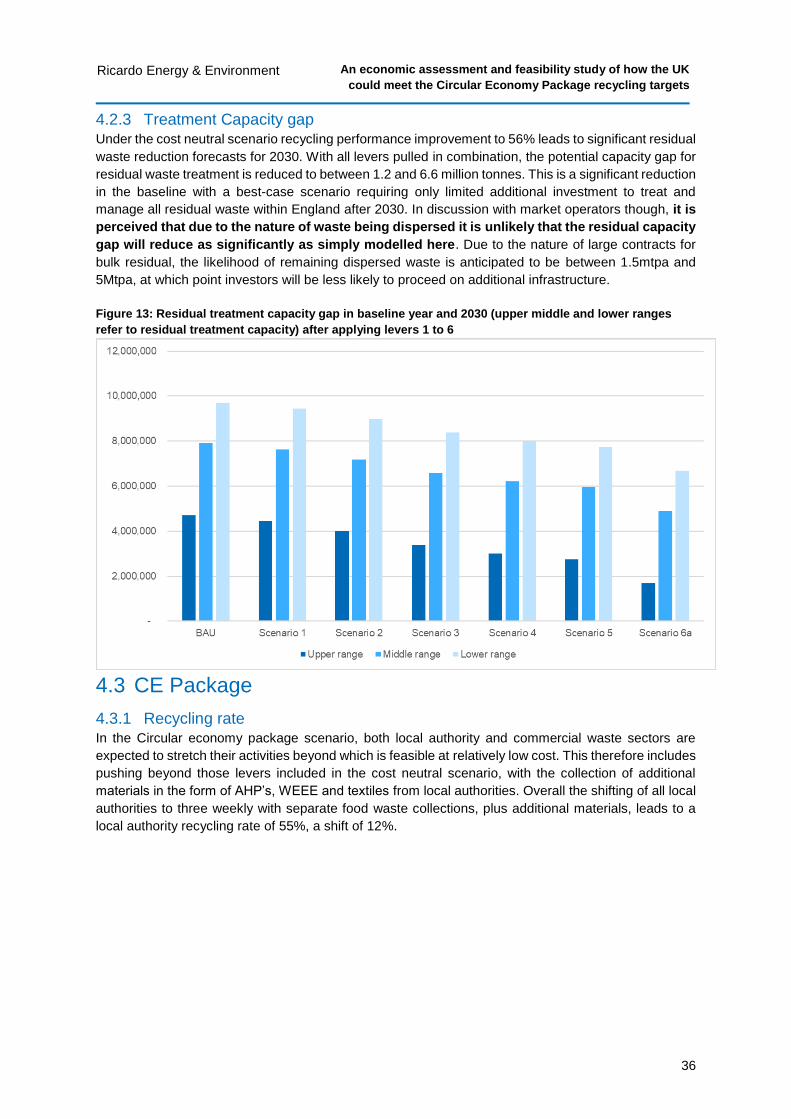
An economic assessment and feasibility study of how the UK
could meet the Circular Economy Package recycling targets
36
Ricardo Energy & Environment
4.2.3 Treatment Capacity gap Under the cost neutral scenario recycling performance improvement to 56% leads to significant residual
waste reduction forecasts for 2030. With all levers pulled in combination, the potential capacity gap for
residual waste treatment is reduced to between 1.2 and 6.6 million tonnes. This is a significant reduction
in the baseline with a best-case scenario requiring only limited additional investment to treat and
manage all residual waste within England after 2030. In discussion with market operators though, it is
perceived that due to the nature of waste being dispersed it is unlikely that the residual capacity
gap will reduce as significantly as simply modelled here. Due to the nature of large contracts for
bulk residual, the likelihood of remaining dispersed waste is anticipated to be between 1.5mtpa and
5Mtpa, at which point investors will be less likely to proceed on additional infrastructure.
Figure 13: Residual treatment capacity gap in baseline year and 2030 (upper middle and lower ranges
refer to residual treatment capacity) after applying levers 1 to 6
4.3 CE Package
4.3.1 Recycling rate In the Circular economy package scenario, both local authority and commercial waste sectors are
expected to stretch their activities beyond which is feasible at relatively low cost. This therefore includes
pushing beyond those levers included in the cost neutral scenario, with the collection of additional
materials in the form of AHP’s, WEEE and textiles from local authorities. Overall the shifting of all local
authorities to three weekly with separate food waste collections, plus additional materials, leads to a
local authority recycling rate of 55%, a shift of 12%.
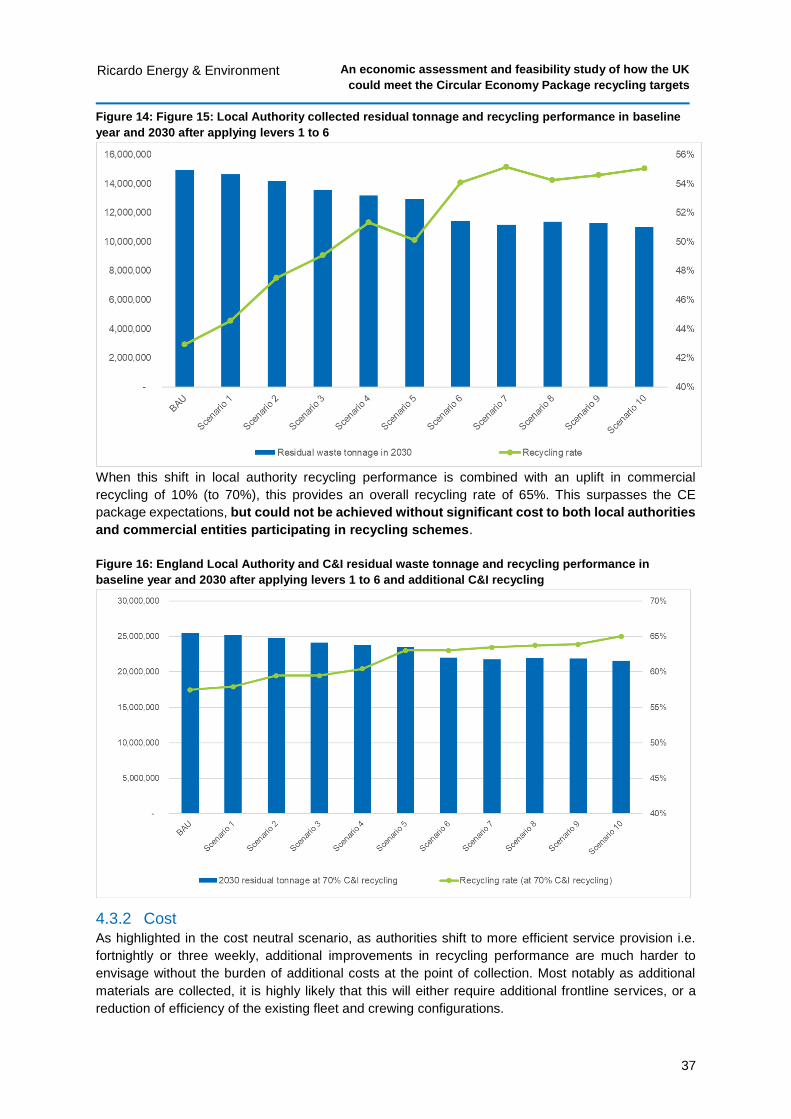
An economic assessment and feasibility study of how the UK
could meet the Circular Economy Package recycling targets
37
Ricardo Energy & Environment
Figure 14: Figure 15: Local Authority collected residual tonnage and recycling performance in baseline
year and 2030 after applying levers 1 to 6
When this shift in local authority recycling performance is combined with an uplift in commercial
recycling of 10% (to 70%), this provides an overall recycling rate of 65%. This surpasses the CE
package expectations, but could not be achieved without significant cost to both local authorities
and commercial entities participating in recycling schemes.
Figure 16: England Local Authority and C&I residual waste tonnage and recycling performance in
baseline year and 2030 after applying levers 1 to 6 and additional C&I recycling
4.3.2 Cost As highlighted in the cost neutral scenario, as authorities shift to more efficient service provision i.e.
fortnightly or three weekly, additional improvements in recycling performance are much harder to
envisage without the burden of additional costs at the point of collection. Most notably as additional
materials are collected, it is highly likely that this will either require additional frontline services, or a
reduction of efficiency of the existing fleet and crewing configurations.
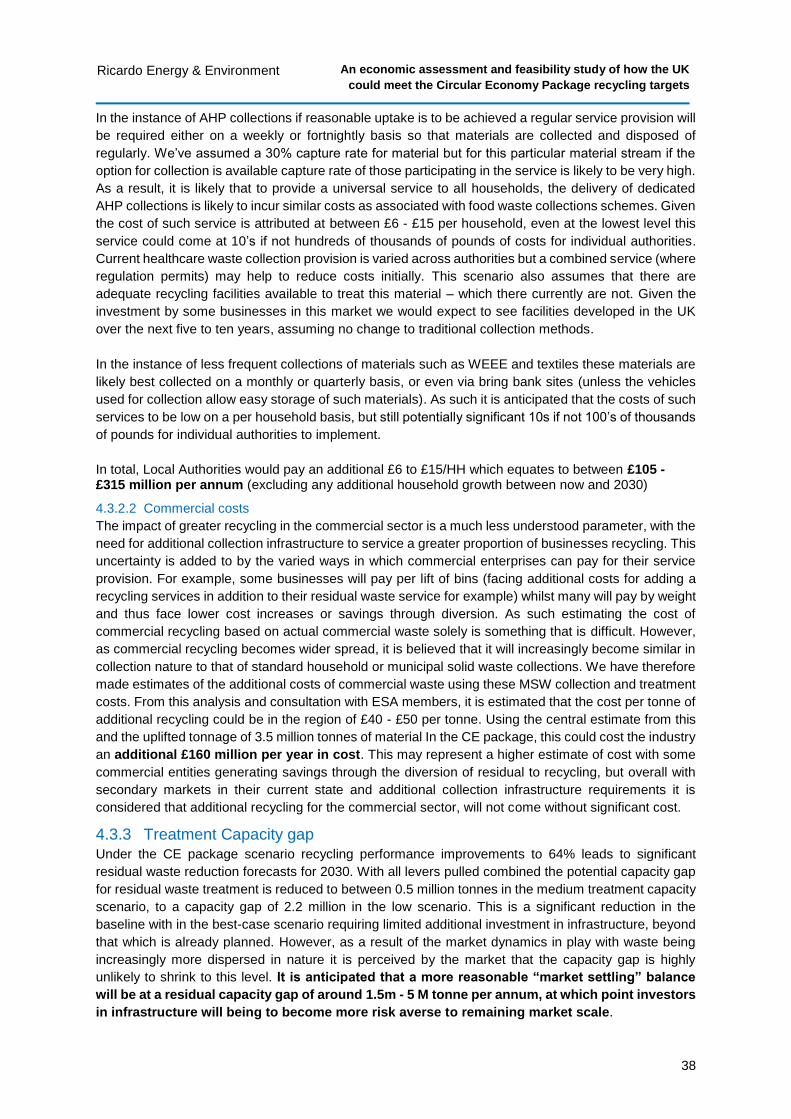
An economic assessment and feasibility study of how the UK
could meet the Circular Economy Package recycling targets
38
Ricardo Energy & Environment
In the instance of AHP collections if reasonable uptake is to be achieved a regular service provision will
be required either on a weekly or fortnightly basis so that materials are collected and disposed of
regularly. We’ve assumed a 30% capture rate for material but for this particular material stream if the
option for collection is available capture rate of those participating in the service is likely to be very high.
As a result, it is likely that to provide a universal service to all households, the delivery of dedicated
AHP collections is likely to incur similar costs as associated with food waste collections schemes. Given
the cost of such service is attributed at between £6 - £15 per household, even at the lowest level this
service could come at 10’s if not hundreds of thousands of pounds of costs for individual authorities.
Current healthcare waste collection provision is varied across authorities but a combined service (where
regulation permits) may help to reduce costs initially. This scenario also assumes that there are
adequate recycling facilities available to treat this material – which there currently are not. Given the
investment by some businesses in this market we would expect to see facilities developed in the UK
over the next five to ten years, assuming no change to traditional collection methods.
In the instance of less frequent collections of materials such as WEEE and textiles these materials are
likely best collected on a monthly or quarterly basis, or even via bring bank sites (unless the vehicles
used for collection allow easy storage of such materials). As such it is anticipated that the costs of such
services to be low on a per household basis, but still potentially significant 10s if not 100’s of thousands
of pounds for individual authorities to implement.
In total, Local Authorities would pay an additional £6 to £15/HH which equates to between £105 - £315 million per annum (excluding any additional household growth between now and 2030)
4.3.2.2 Commercial costs
The impact of greater recycling in the commercial sector is a much less understood parameter, with the
need for additional collection infrastructure to service a greater proportion of businesses recycling. This
uncertainty is added to by the varied ways in which commercial enterprises can pay for their service
provision. For example, some businesses will pay per lift of bins (facing additional costs for adding a
recycling services in addition to their residual waste service for example) whilst many will pay by weight
and thus face lower cost increases or savings through diversion. As such estimating the cost of
commercial recycling based on actual commercial waste solely is something that is difficult. However,
as commercial recycling becomes wider spread, it is believed that it will increasingly become similar in
collection nature to that of standard household or municipal solid waste collections. We have therefore
made estimates of the additional costs of commercial waste using these MSW collection and treatment
costs. From this analysis and consultation with ESA members, it is estimated that the cost per tonne of
additional recycling could be in the region of £40 - £50 per tonne. Using the central estimate from this
and the uplifted tonnage of 3.5 million tonnes of material In the CE package, this could cost the industry
an additional £160 million per year in cost. This may represent a higher estimate of cost with some
commercial entities generating savings through the diversion of residual to recycling, but overall with
secondary markets in their current state and additional collection infrastructure requirements it is
considered that additional recycling for the commercial sector, will not come without significant cost.
4.3.3 Treatment Capacity gap
Under the CE package scenario recycling performance improvements to 64% leads to significant
residual waste reduction forecasts for 2030. With all levers pulled combined the potential capacity gap
for residual waste treatment is reduced to between 0.5 million tonnes in the medium treatment capacity
scenario, to a capacity gap of 2.2 million in the low scenario. This is a significant reduction in the
baseline with in the best-case scenario requiring limited additional investment in infrastructure, beyond
that which is already planned. However, as a result of the market dynamics in play with waste being
increasingly more dispersed in nature it is perceived by the market that the capacity gap is highly
unlikely to shrink to this level. It is anticipated that a more reasonable “market settling” balance
will be at a residual capacity gap of around 1.5m - 5 M tonne per annum, at which point investors
in infrastructure will being to become more risk averse to remaining market scale.
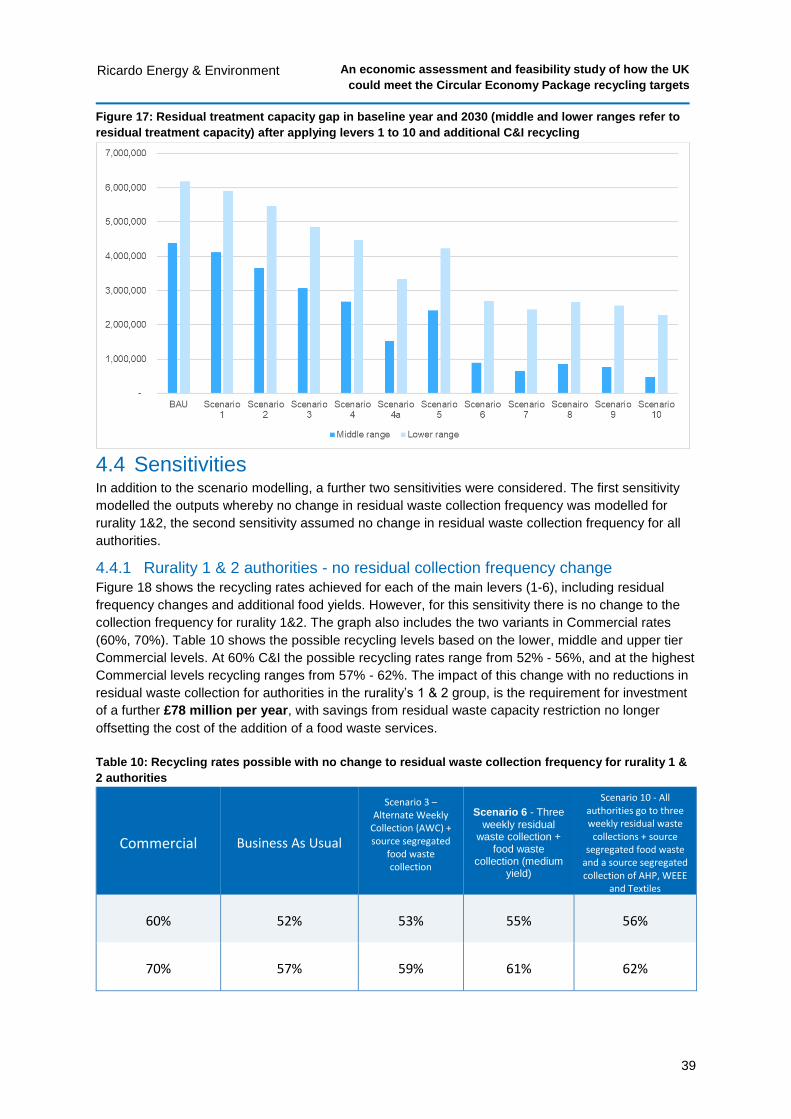
An economic assessment and feasibility study of how the UK
could meet the Circular Economy Package recycling targets
39
Ricardo Energy & Environment
Figure 17: Residual treatment capacity gap in baseline year and 2030 (middle and lower ranges refer to
residual treatment capacity) after applying levers 1 to 10 and additional C&I recycling
4.4 Sensitivities In addition to the scenario modelling, a further two sensitivities were considered. The first sensitivity
modelled the outputs whereby no change in residual waste collection frequency was modelled for
rurality 1&2, the second sensitivity assumed no change in residual waste collection frequency for all
authorities.
4.4.1 Rurality 1 & 2 authorities - no residual collection frequency change Figure 18 shows the recycling rates achieved for each of the main levers (1-6), including residual
frequency changes and additional food yields. However, for this sensitivity there is no change to the
collection frequency for rurality 1&2. The graph also includes the two variants in Commercial rates
(60%, 70%). Table 10 shows the possible recycling levels based on the lower, middle and upper tier
Commercial levels. At 60% C&I the possible recycling rates range from 52% - 56%, and at the highest
Commercial levels recycling ranges from 57% - 62%. The impact of this change with no reductions in
residual waste collection for authorities in the rurality’s 1 & 2 group, is the requirement for investment
of a further £78 million per year, with savings from residual waste capacity restriction no longer
offsetting the cost of the addition of a food waste services.
Table 10: Recycling rates possible with no change to residual waste collection frequency for rurality 1 &
2 authorities
Commercial Business As Usual
Scenario 3 – Alternate Weekly
Collection (AWC) + source segregated
food waste collection
Scenario 6 - Three weekly residual
waste collection + food waste
collection (medium yield)
Scenario 10 - All authorities go to three weekly residual waste
collections + source segregated food waste
and a source segregated collection of AHP, WEEE
and Textiles
60% 52% 53% 55% 56%
70% 57% 59% 61% 62%
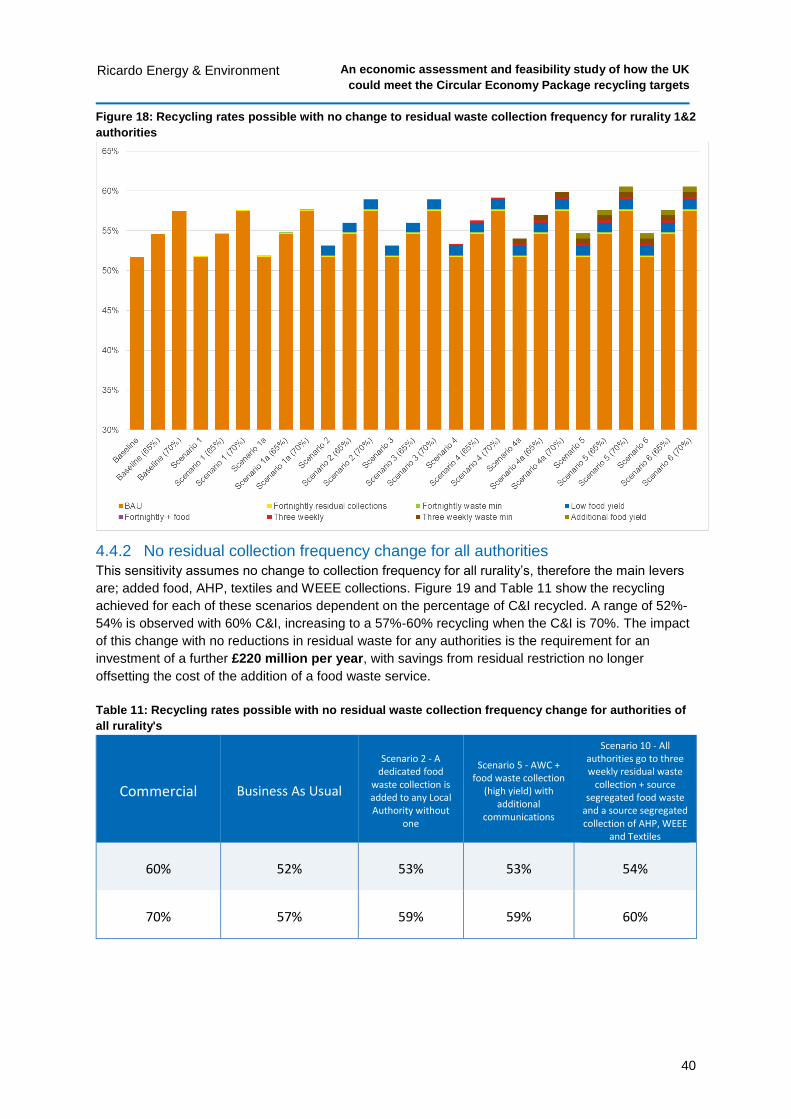
An economic assessment and feasibility study of how the UK
could meet the Circular Economy Package recycling targets
40
Ricardo Energy & Environment
Figure 18: Recycling rates possible with no change to residual waste collection frequency for rurality 1&2
authorities
4.4.2 No residual collection frequency change for all authorities
This sensitivity assumes no change to collection frequency for all rurality’s, therefore the main levers
are; added food, AHP, textiles and WEEE collections. Figure 19 and Table 11 show the recycling
achieved for each of these scenarios dependent on the percentage of C&I recycled. A range of 52%-
54% is observed with 60% C&I, increasing to a 57%-60% recycling when the C&I is 70%. The impact
of this change with no reductions in residual waste for any authorities is the requirement for an
investment of a further £220 million per year, with savings from residual restriction no longer
offsetting the cost of the addition of a food waste service.
Table 11: Recycling rates possible with no residual waste collection frequency change for authorities of
all rurality's
Commercial Business As Usual
Scenario 2 - A dedicated food
waste collection is added to any Local Authority without
one
Scenario 5 - AWC + food waste collection
(high yield) with additional
communications
Scenario 10 - All authorities go to three weekly residual waste
collection + source segregated food waste
and a source segregated collection of AHP, WEEE
and Textiles
60% 52% 53% 53% 54%
70% 57% 59% 59% 60%
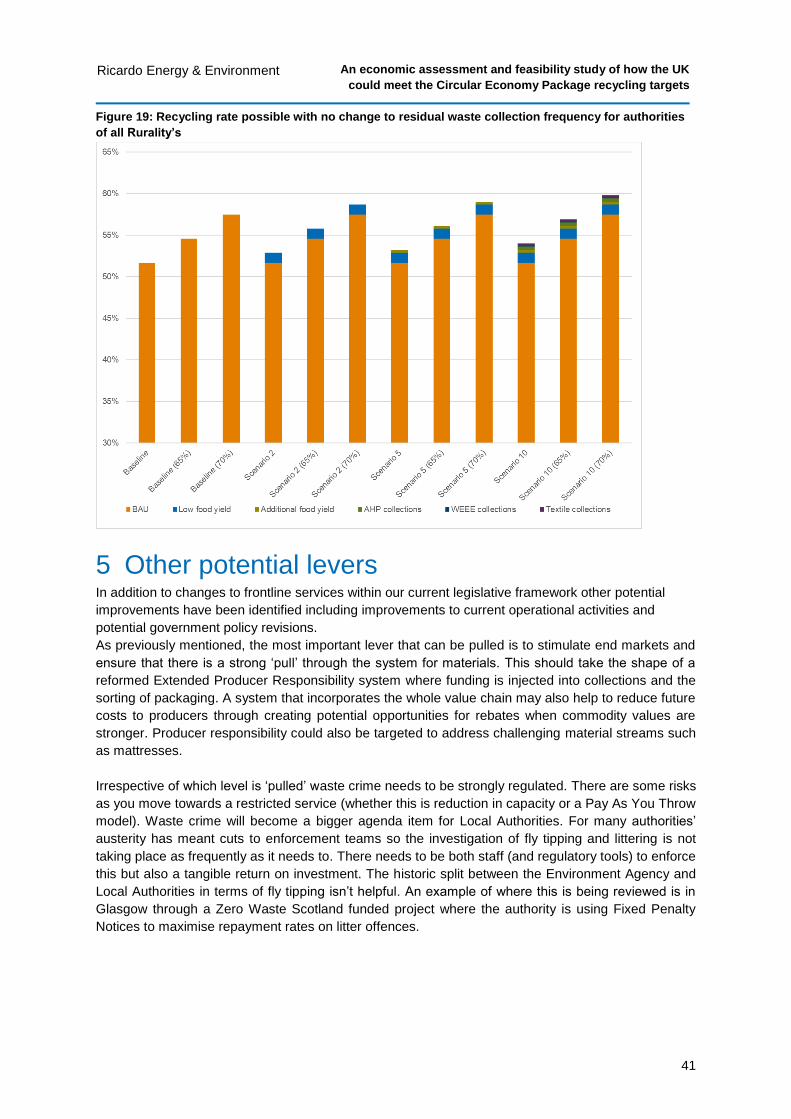
An economic assessment and feasibility study of how the UK
could meet the Circular Economy Package recycling targets
41
Ricardo Energy & Environment
Figure 19: Recycling rate possible with no change to residual waste collection frequency for authorities
of all Rurality’s
5 Other potential levers In addition to changes to frontline services within our current legislative framework other potential
improvements have been identified including improvements to current operational activities and
potential government policy revisions.
As previously mentioned, the most important lever that can be pulled is to stimulate end markets and
ensure that there is a strong ‘pull’ through the system for materials. This should take the shape of a
reformed Extended Producer Responsibility system where funding is injected into collections and the
sorting of packaging. A system that incorporates the whole value chain may also help to reduce future
costs to producers through creating potential opportunities for rebates when commodity values are
stronger. Producer responsibility could also be targeted to address challenging material streams such
as mattresses.
Irrespective of which level is ‘pulled’ waste crime needs to be strongly regulated. There are some risks
as you move towards a restricted service (whether this is reduction in capacity or a Pay As You Throw
model). Waste crime will become a bigger agenda item for Local Authorities. For many authorities’
austerity has meant cuts to enforcement teams so the investigation of fly tipping and littering is not
taking place as frequently as it needs to. There needs to be both staff (and regulatory tools) to enforce
this but also a tangible return on investment. The historic split between the Environment Agency and
Local Authorities in terms of fly tipping isn’t helpful. An example of where this is being reviewed is in
Glasgow through a Zero Waste Scotland funded project where the authority is using Fixed Penalty
Notices to maximise repayment rates on litter offences.
An economic assessment and feasibility study of how the UK
could meet the Circular Economy Package recycling targets
42
Ricardo Energy & Environment
5.1 Improvements to current operational activities.
5.1.1 Improvement 1 - Fly-tipped waste Fly-tipped waste tonnages should be separately recorded, as they do not count as household waste;
they are thus not to be included in the total waste arisings denominator.
Where dedicated fly-tipping collections are carried out and are separately recorded, this process can
be easily followed. However, for many Local Authorities, small fly-tips (black sacks, carrier bags,
household residual presented on the wrong day, small items) are co-collected as part of the Street
Cleansing service. If this tonnage isn’t separately recorded, it will be included in the denominator and
suppress the recycling rate.
Where co-collection makes direct tonnage measurement impractical, trial weighing can be utilised to
develop an auditable average tonnage which can be deducted from the Street Cleansing tonnage
arisings. The quantification of implementing this approach will vary by authority, but direct experience
suggests a 0.5% increase in the recycling rate can be achieved.
Summary:
Levers Collection methodology
Impacts Minor increase in recycling rate (0.5%)
Risks None
Barriers Revision to tonnage recording methodology
Cost None (increased staff time)
5.1.2 Improvement 2 – Co-collection of Commercial waste with Bulk collections
from HMO’s
For efficiency, commercial collections from bulk bins are often co-collected on ‘flats’ collection rounds,
making the most efficient use of bulky collection rounds. The commercial waste tonnages are not
household waste, and should thus not be included in the denominator. Where co-collection makes direct
tonnage measurement impractical, trial weighing or average bin weights can be utilised to develop an
auditable average tonnage which can be deducted from the bulky waste tonnage arisings (HH – Non-
HH split). It should be noted that average commercial waste bin weights differ from household average
weights.
Summary:
Levers Collection Methodology
Impacts Minor increase in recycling rate
Risks None
Barriers Revision to tonnage recording methodology
Cost None (increased initial staff time)
5.1.3 Improvement 3 – Street Sweeping recycling Several organisations have invested in dedicated facilities to enable the dewatering and recycling of
street sweeping arisings.
At a benchmark gate fee of £35 per tonne, facilities for the recycling of this material are becoming more
available. By segregating the collected material to produce sand, stones, aggregates, organic material
and metals, this material stream can be successfully diverted from the residual stream.
Since this material is defined as household waste for the purposes of measuring recycling performance,
utilising an appropriate facility would increase a Local Authorities recycling rate by approximately 1.5%.
An economic assessment and feasibility study of how the UK
could meet the Circular Economy Package recycling targets
43
Ricardo Energy & Environment
Additionally, this would represent a cost saving compared to current disposal costs (without potential
transport costs considered).
WasteDataFlow defines a process for the recording of such waste, predominantly utilising the ‘other
materials’ categories, including the recording of organic waste from street sweepings as ‘Other
compostable waste’.
The adoption of this approach requires no changes to street cleansing methodologies, represents a
cost saving to Local Authorities and diverts waste from residual to recycling utilising an existing process.
With sustainable tonnages available from all authorities, this represents a reasonable investment risk
for reprocessors.
Summary:
Levers Re-processing facilities
Impacts Increase in recycling rate (1.5%)
Risks Investment return
Barriers None
Cost Capital investment in reprocessing facilities,
planning constraints. Transport costs
5.1.4 Improvement 4 – Re-use
In relation to meeting the Waste Framework Directive recycling targets, Commission Decision
2011/753/EU allows a choice of four options and calculation methods. Each Member State must use
the calculation method that corresponds to the re-use and recycling option that it has chosen to apply
the target to. The UK currently applies the target to the third option: “the preparation for reuse and the
recycling of household waste”. This means that the UK must use calculation method 3 set out in the
Decision and use national data to report on the recycled amount of household waste.
The municipal recycling rate is defined as ‘the percentage of local authority waste prepared for reuse,
recycling or composting’.
The Defra recycling statistics demonstrate that ‘reuse’ is neglected as a component of the target, and
that capacity thus exists within LA services to take advantage of reuse activities not currently recorded
or maximised.
At the same time, the Social Value Act, which came into force in January 2013 requires all public
authorities in England and Wales to obtain ‘social value’ in addition to value for money through their
procurement of services. A common definition of Social Value is “‘the additional benefit to the
community from a commissioning/procurement process over and above the direct purchasing of goods,
services and outcomes”.
As a result, LA procurements often incorporate a requirement for service providers to explore options
for community based innovations.
Examples of this approach include:
Community re-paint programmes
HWRC or community ‘Recycling Centres’ operated by the third sector, facilitating the
refurbishment, repair, reuse and re-sale of a wide range of items, from WEEE, white goods and
furniture to bric-a-brac and clothing. This involves the use of waste as a resource for social
change, providing training and employment opportunities and selling the refurbished goods to
people on low incomes.
An economic assessment and feasibility study of how the UK
could meet the Circular Economy Package recycling targets
44
Ricardo Energy & Environment
This can be expanded to utilise third sector organisations to collect bulky waste, offering a
variety of social benefits and cost savings whilst maximising the reparability/reusability of
materials through appropriate collection methodologies.
The diversion of this waste will reduce disposal costs, and may ultimately be self-financing. However,
appropriate recording of tonnages diverted to re-use will conform with the requirements for the materials
to be under the control of the Local Authority, and can thus be incorporated into the ‘recycling’ rate.
Summary:
Levers Use of Social Value Act to engage with Third
Sector
Impacts Incorporation of reuse to increase in recycling
rate
Risks Investment return
Barriers Organisational challenges
Cost Capital investment in facilities, Planning space
constraints
5.2 Communications Underpinning any intervention should be regular communications with residents and businesses.
When budgets are tight communications campaigns can be the first thing that’s cut however it’s
important that investment in communications is ongoing. Critical currently is the need to reduce
contamination and collect only good quality materials. With England moving towards a consistent
approach to the core materials that can be collected it may be a suitable point to reconsider a national
recycling campaign which is supported by local activity.
5.3 Government Policy Revisions
5.3.1 Policy 1 – Incinerator Bottom Ash To quote WasteDataFlow guidance, ‘Incinerator residues such as incineration bottom ash and metals
are not included in recycling tonnages. The Government’s aim is to encourage a movement up the
waste hierarchy with a view to achieving a more sustainable approach to waste management, including
encouraging the segregation and collection of the various components of household waste for recovery.
The recovery of materials from incinerator residues is not consistent with these aims.’ (ref
WasteDataFlow Guidance Notes )
This approach, whilst impacting negatively on England’s recycling rate, is inconsistent with the approach
taken with respect to other material streams which, whilst not collected in a segregated manner, are
included in the reported recycling rate. Examples of this inconsistency range from the recyclable and
compostable outputs from MBT plants and the recycling of street cleansing litter, to the acceptance of
sorting glass which has not been colour-segregated or the multi-stage requirements to segregate post-
consumer plastics to an acceptable level of usability.
Were it possible to separately collect the components of IBA, a more sustainable approach might justify
discounting this material stream. However, its production is part of a recovery process, meaning that
segregated collection is not an option.
The recently agreed CEP states that metals within IBA which are recycled can be counted towards
recycling targets, which may mean that the issue of IBA recycling is revisited.
An economic assessment and feasibility study of how the UK
could meet the Circular Economy Package recycling targets
45
Ricardo Energy & Environment
Summary:
Levers Revision of EA guidance
Impacts Increase in recycling rate ~1-2%
Risks None
Barriers Government policy
Cost None
5.3.2 Policy 2 – Leaves In August 2013 the Environment Agency released a briefing regarding the management of seasonal,
street leaf-sweeping waste and presented the main finding from local authority trials. These identified
the issue that contamination levels in street leaf sweepings are too high to produce ‘quality compost’
marketed as non-waste, or compost that can be spread to agricultural land under waste controls. This
is due to the high and variable levels of polycyclic aromatic hydrocarbons (PAHs) found in the trials
conducted by the EA, both in the street leaf sweepings and in their composted outputs.
As a result, the composting of street leaf sweepings is no longer classed as a recycling activity; however,
none of these findings affects leaf litter collected from parks and gardens, which can continue to be
used to produce compost or ‘quality compost’.
This decision was based on the absorption of contaminants from the road surface through contact, and
to a lesser (unquantified) extent, from exhaust fumes. The redefinition of this waste stream was
estimated by the National Association of Waste Disposal Officers (NAWDO) to reduce the recycling
rate by 2% across England. Despite frequent requests, the EA have proved unwilling to explore options
to enable leaf-fall from specified location types to be classified as recyclable.
Whilst leaves cleared from road surfaces after any period of time will be potentially contaminated, this
issue may not affect leaf-fall from wide verges, pedestrian areas or other surfaces where traffic residues
are not a factor. The time the leaves remain on the ground will also be a factor.
Leaf clearance methodologies are carried out in an increasingly sophisticated manner. Leaf clearance
programmes are necessarily dependant on varying weather factors, making efficient clearance difficult
and necessitating repeat visits. However, where records of tree species are available, scheduling can
be informed by the leaf-fall patterns associated with different tree species, including periods of leaf-drop
and the volumes expected to fall. Whilst commencement dates will still vary, utilising or developing such
data will improve clearance efficiency. This would also facilitate segregation of leaf-fall to enable non-
road-sourced leafing to be sent to composting.
By thus splitting out the non-road collected leaf-fall, and allowing this element of the material, where
separately collected, to class as recycled material, a proportion of leaf-fall could be returned to the
recycling rate.
Summary:
Levers Revision of EA guidance (with appropriate
additional research)
Impacts Increase in recycling (composting) rate ~1%
Risks Poor compliance with revised requirements by
Local Authorities
Barriers Requirement for further research and analysis
Cost none
An economic assessment and feasibility study of how the UK
could meet the Circular Economy Package recycling targets
46
Ricardo Energy & Environment
5.4 Policy 3 – Review of Deregulation Act In England and Wales, the Waste Collection Authorities (and Unitaries) are obliged by law to provide a
domestic waste collection service to households. These duties are laid out in the Environmental
Protection Act (EPA) 1990 (EPA).
Councils can require occupiers of premises to present their household waste for collection in a specified
way under the EPA. However, their powers to enforce this, along with being able to require residents
to recycle through the specification of what can be placed in each container and where containers
should be placed were substantially curtailed by Section 58 of the Deregulation Act 2015 Act which
downgrades failure to comply with any notice from a criminal to a civil offence whilst tightening the
definition of an offence to “causing a nuisance or likely to be, detrimental to any amenities of the locality”
This makes enforcement extremely difficult, undermining Local Authorities’ abilities to enforce their
policies.
The statutory duty to provide a collection service constrains Local Authorities’ ability to ensure that
residents’ participation in recycling services is maximised; if material isn’t set out for recycling, it will be
collected as residual. The removal of powers for LAs to specify the container to be used for specific
materials thus effectively removes the ability to ‘require’ residents to recycle.
The Deregulation Act also makes any form of enforcement activity regarding contamination of recyclate
effectively impotent. The practical requirements of bringing a civil case against individual residents has
yet to be fully tested, but the disproportionate effort and expenditure required acts as a significant
disincentive to LAs.
As a result, the growing issue of contamination in the kerbside recycling stream will be difficult to
address. From a Local Authority perspective, the lack of enforcement options limits any addressing of
this issue to communications aimed at transgressing residents with no power to take further action.
This will lead to a continuing increase in the proportion of contamination and non-target material
delivered to MRFs from co-mingled kerbside collection schemes, and ongoing issues with source-
segregated materials.
Conversely, a repeal or revision of this Act would provide LAs with a methodology to address
contamination, encourage participation in recycling streams and engage with residents to improve the
quality and quantity of recyclate.
Summary:
Levers Revision of Government policy
Impacts Increase in recycling rate dependent on
authority recycling participation rates
Risks None
Barriers Government policy
Cost None
5.5 Policy 4 – Pay As You Throw (PAYT) The increasing introduction of in-cab technology represents a major step in the potential for introducing schemes whereby residents are required to pay directly for the waste they wish to have collected.
Whilst on-board systems are now highly cost-effective, they still represent a significant investment for operators. However, by providing a combination of interactive real-time information and comprehensive performance analysis, they represent options for significant operational efficiencies.
An economic assessment and feasibility study of how the UK
could meet the Circular Economy Package recycling targets
47
Ricardo Energy & Environment
Loaded with appropriate LLPG data, the in-cab system should be integrated with the back office CRM system, to enable information to flow in real-time. This will allow service requests/updates (bin orders, bulky waste bookings, missed bin enquiries, assisted collection queries, additional trade waste lifts) to be executed rapidly.
Crew reporting of collections, bins not out, contaminated recycling or delayed operations can be communicated to supervisors, alternate vehicles and residents with sufficient promptness to allow rapid problem resolution.
The combined in-cab system and CRM system should also be capable of integration with hand-held devices. This enables supervisors, ancillary service vehicles, contract monitoring staff (and potentially community monitoring volunteers) to provide and react to issues in real time.
The inclusion of 360 degree cameras provides the crews with the ability to record collection issues, providing proof of bins not out, contaminated recycling, correct replacement of bins and blocked access.
On-board weighing systems are now available for use on most vehicle and lift types including split bin and bulk lifts. Each bin-lift can be installed with a weighing load-cell enabling two or more different household bins to be weighed independently and simultaneously. This functionality removes many of the impracticalities of the work process, and enables the weight of all bins to be recorded without compromising the efficiencies of the collection round.
These technical advances facilitate the introduction of three options for PAYT collections, which between them provide a methodology covering the range of current LA collection services:
Fixed rate: residents are charged a flat rate, based on an agreed collection frequency. The
capacity is not necessarily factored in to this equation, meaning all properties pay the same
rate. This has the advantage of simplicity, and could be included on annual Council Tax bills as
a separately quantified item. This methodology would be particularly appropriate for authorities
utilising sack collections. However, it doesn’t include any facility to vary the cost to the
householder dependant on the volume of waste generated.
Unit pricing: this represents a similar scheme to the fixed rate, but is varied by the size/number
of containers provided to each household, effectively varying the charge dependant on the
volume of capacity provided. This allows larger households to choose bigger bins, but also
provides an incentive for residents to minimise the size of container utilised. In-cab technology
can be utilised to confirm bin emptying to avoid ‘missed bin refund’ issues. Billing arrangements
would be subject to change where bin-size is changed. This methodology could also be used
for sack collections, but would require an agreed number of specified, clearly identifiable sacks
to be provided to each household.
Pay-by-weight (PBW): in this methodology, the weight collected from each property would be
recorded, and the charging system would be directly related to the weight of the material.
Charging would be variable, with the option of a set annual payment, with
discounts/supplements charged at an agreed frequency for variance from the assumed
standard weight.
In all cases, the options of additional bags or containers, to be paid for on purchase, are available
should the user exceed the specified volume, should council policy prefer to allow this degree of
flexibility.
Similarly, Local Authorities can decide whether to instigate a scheme that charges for residual waste
only, recompenses for recyclate only, or prefers a combination of both elements.
Government is currently opposed to PAYT for household waste. This is influenced/reflected in media
reports, with common use of terms such as ‘new tax on waste collection’, ‘tax on recycling’ and ‘bin tax’
commonly used.
Patently, the methodology utilised to introduce such schemes would require clear communication of the
separation of the ‘waste management charge’ from the remaining Council tax and its replacement by a
variable charge in a manner which residents can buy in to. This approach would need to emphasise
that, under a PAYT scheme, some or all of the costs of waste management can be completely removed
from non-variable Council Tax bills, providing residents with flexibility in terms of how much they use,
and thus pay for, waste management services.
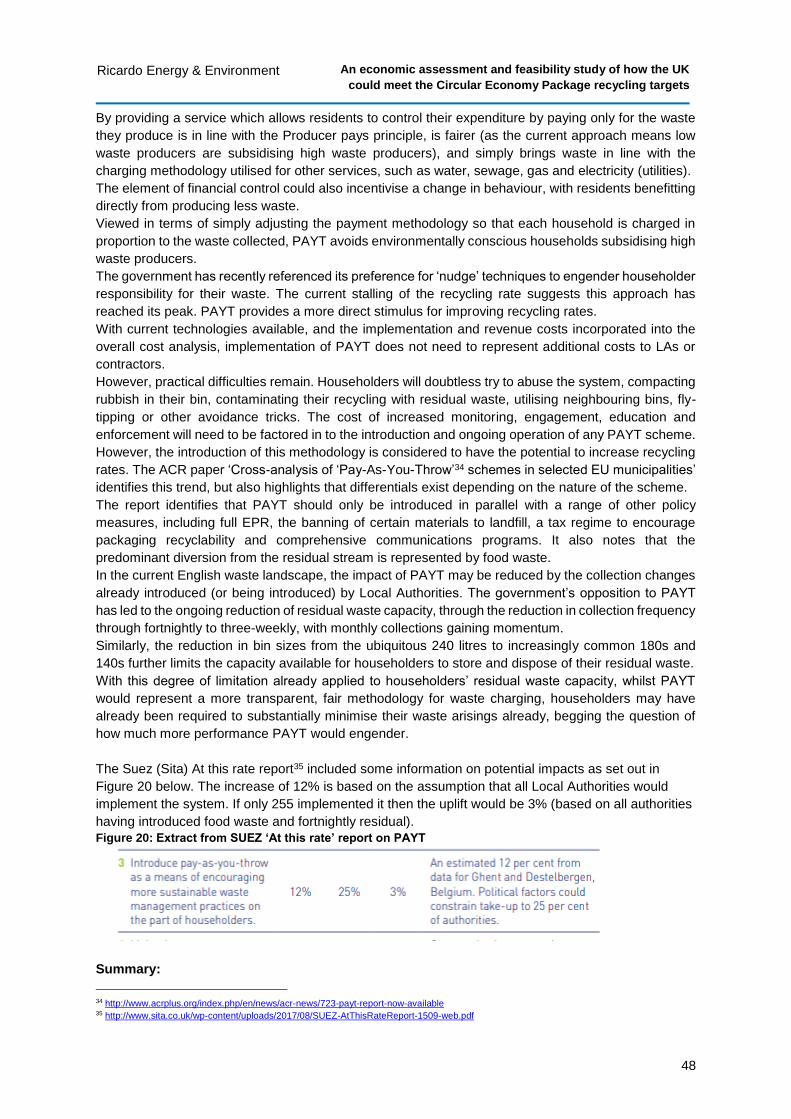
An economic assessment and feasibility study of how the UK
could meet the Circular Economy Package recycling targets
48
Ricardo Energy & Environment
By providing a service which allows residents to control their expenditure by paying only for the waste
they produce is in line with the Producer pays principle, is fairer (as the current approach means low
waste producers are subsidising high waste producers), and simply brings waste in line with the
charging methodology utilised for other services, such as water, sewage, gas and electricity (utilities).
The element of financial control could also incentivise a change in behaviour, with residents benefitting
directly from producing less waste.
Viewed in terms of simply adjusting the payment methodology so that each household is charged in
proportion to the waste collected, PAYT avoids environmentally conscious households subsidising high
waste producers.
The government has recently referenced its preference for ‘nudge’ techniques to engender householder
responsibility for their waste. The current stalling of the recycling rate suggests this approach has
reached its peak. PAYT provides a more direct stimulus for improving recycling rates.
With current technologies available, and the implementation and revenue costs incorporated into the
overall cost analysis, implementation of PAYT does not need to represent additional costs to LAs or
contractors.
However, practical difficulties remain. Householders will doubtless try to abuse the system, compacting
rubbish in their bin, contaminating their recycling with residual waste, utilising neighbouring bins, fly-
tipping or other avoidance tricks. The cost of increased monitoring, engagement, education and
enforcement will need to be factored in to the introduction and ongoing operation of any PAYT scheme.
However, the introduction of this methodology is considered to have the potential to increase recycling
rates. The ACR paper ‘Cross-analysis of ‘Pay-As-You-Throw’34 schemes in selected EU municipalities’
identifies this trend, but also highlights that differentials exist depending on the nature of the scheme.
The report identifies that PAYT should only be introduced in parallel with a range of other policy
measures, including full EPR, the banning of certain materials to landfill, a tax regime to encourage
packaging recyclability and comprehensive communications programs. It also notes that the
predominant diversion from the residual stream is represented by food waste.
In the current English waste landscape, the impact of PAYT may be reduced by the collection changes
already introduced (or being introduced) by Local Authorities. The government’s opposition to PAYT
has led to the ongoing reduction of residual waste capacity, through the reduction in collection frequency
through fortnightly to three-weekly, with monthly collections gaining momentum.
Similarly, the reduction in bin sizes from the ubiquitous 240 litres to increasingly common 180s and
140s further limits the capacity available for householders to store and dispose of their residual waste.
With this degree of limitation already applied to householders’ residual waste capacity, whilst PAYT
would represent a more transparent, fair methodology for waste charging, householders may have
already been required to substantially minimise their waste arisings already, begging the question of
how much more performance PAYT would engender.
The Suez (Sita) At this rate report35 included some information on potential impacts as set out in
Figure 20 below. The increase of 12% is based on the assumption that all Local Authorities would
implement the system. If only 255 implemented it then the uplift would be 3% (based on all authorities
having introduced food waste and fortnightly residual).
Figure 20: Extract from SUEZ ‘At this rate’ report on PAYT
Summary:
34 http://www.acrplus.org/index.php/en/news/acr-news/723-payt-report-now-available 35 http://www.sita.co.uk/wp-content/uploads/2017/08/SUEZ-AtThisRateReport-1509-web.pdf
An economic assessment and feasibility study of how the UK
could meet the Circular Economy Package recycling targets
49
Ricardo Energy & Environment
Levers Revision of Government policy
Impacts Potential 3% uplift
Risks Potentially unpopular
Barriers Government policy
Cost Infrastructure and technology to monitor,
provision of receptacles and sacks
5.6 Policy 5 – Green Garden Waste In certain circumstances, depending on the type of waste and/or the premises it is collected from, LAs
can charge for the collection and/or the disposal of waste. The conditions governing this are set out in
The Controlled Waste (England and Wales) Regulations (2012). This covers areas such as garden
waste, bulky waste, C&I waste and defines the nature of the waste in terms of its origin and nature. The
regulations are also known as the Schedule 2 Regulations.
LAs have utilised the ability to instigate charges for the collection of green garden waste (GGW)
extensively since the austerity agenda was introduced, and the growth of chargeable garden waste
collection services has provided a substantial income stream, with an estimated 42% of LAs levying a
charge in 2016.
The move from a free garden waste service to a chargeable one reduces the tonnage collected, and
thus reduces the recycling rate.
Research from WRAP has quantified the average impact of introducing a chargeable service to replace
a universal free collection service. If a chargeable garden scheme is introduced it is assumed that the
participation in the scheme will fall; the subsequent level of participation will be dependent on the price
charged for the new service. However, reduction in green waste yields of 25% is not unusual when
charging for services is introduced.
A quantity of waste no longer collected at the kerbside will instead be delivered to local HWRC sites.
WRAP’s modelling assumes that 30% of the garden waste NOT collected goes to HWRC sites.
Depending on the size of each district’s residual container provision, either 5% or 10% of the GGW not
collected by the new scheme will revert to the residual bin. The remaining 60-65% of non-collected
tonnage will be either not created or home composted.
The overall impact of a chargeable GGW scheme is thus a reduction in recycling tonnage collected,
combined with an increase in residual tonnages. This impact is already incorporated in recycling figures
for 42% of LAs, with LARAC surmising that all LAs will have introduced such schemes by 2022.
Summary:
Levers Additional income for LAs
Impacts Reduction in Recycling rate
Risks Further reductions in recycling rates
Barriers Reduction in LA funding by Government
Cost
Increasing shift to charging for garden waste will
only generate revenues that can be used to
administer that service
An economic assessment and feasibility study of how the UK
could meet the Circular Economy Package recycling targets
50
Ricardo Energy & Environment
6 Summary A healthy, productive resource economy requires action across the supply chain including:
products that are placed onto the market that are ultimately easy to recycle
a supportive policy and regulatory framework that makes it easy for residents and businesses
to display the right behaviours and that can address the wrong behaviours
available and economically viable end markets so that quality materials can be recycled and
the materials produced used again, maximising material productivity.
Without a coherent strategy across all elements which both pushes and pulls materials through the
supply chain recycling levels can stagnate and end markets collapse.
Weight based targets for recycling have been in place for a number of years and have been successful
in driving recycling rates - to a point. Weight has been used as a proxy for recycling performance but it
does have limitations. Our current weight based system can distort behaviour, incentivising the
collection of heavy, low-value materials such as garden waste and not prioritising the best
environmental outcome for individual material streams. The recycling targets required under the
Circular Economy Package are weight based and this report looks at what England would need to do
to meet the 60% recycling target by 2030 including what changes in operations would be required for
our Local Authorities and Businesses to increase recycling and how much it might cost.
The second report in this series considers whether alternative measures or metrics to our current weight
based system might be better in terms of driving environmental performance and value recovered from
our resources.
England needs a balanced approach which delivers increased recycling and greater levels of recovery.
Taking a step back to review the whole system will allow better metrics to be developed, which in turn
will support better decisions.
This report has presented the results of analysis undertaken to understand what recycling performance
could be achieved, at what cost and how this would influence predicted capacity gaps in 2030. It has
focussed on the areas that ESA members can control – end of life and end of use.
Modelled Results
From our modelled results reaching the recycling targets required under the Circular Economy
proposals will be challenging and costly both for Local Authorities and the commercial sector. This
is especially true given the current difficulties within secondary material markets, with all future
modelled scenarios requiring stimulation of end markets to ensure the value of recycled material can
be recognised and recovered. Simply put, higher recycling rates are completely contingent on
stronger demand for materials and sustainable end markets. It is also this commercial viability that will
help incentivise greater investment in material collection and recycling infrastructure, as greater
confidence in end markets allows both local authorities and the commercial sector to push for greater
performance, rather than the status quo or minimum standards on contractual obligations
Collecting more material for recycling means more costs. Local Authorities could, however, offset some
of these cost increases by reducing the frequency of residual waste collections (or other interventions
for flats) that will allow them to drive change at a cost that isn’t excessive. We have termed this ‘cost
neutral’ from a system change approach, as although some authorities will face additional cost, there
are those that could also see savings from changing services.
For all of the scenarios modelled increases to the commercial recycling rate result in a marked
difference in overall performance. With current industry estimates for commercial recycling in the mid-
50-60% it will take a lot of focus and investment to increase recycling rates. Encouraging SMEs in
particular to recycle may need a different cost structure proposed for recycling collections to make them
financially attractive or government intervention.
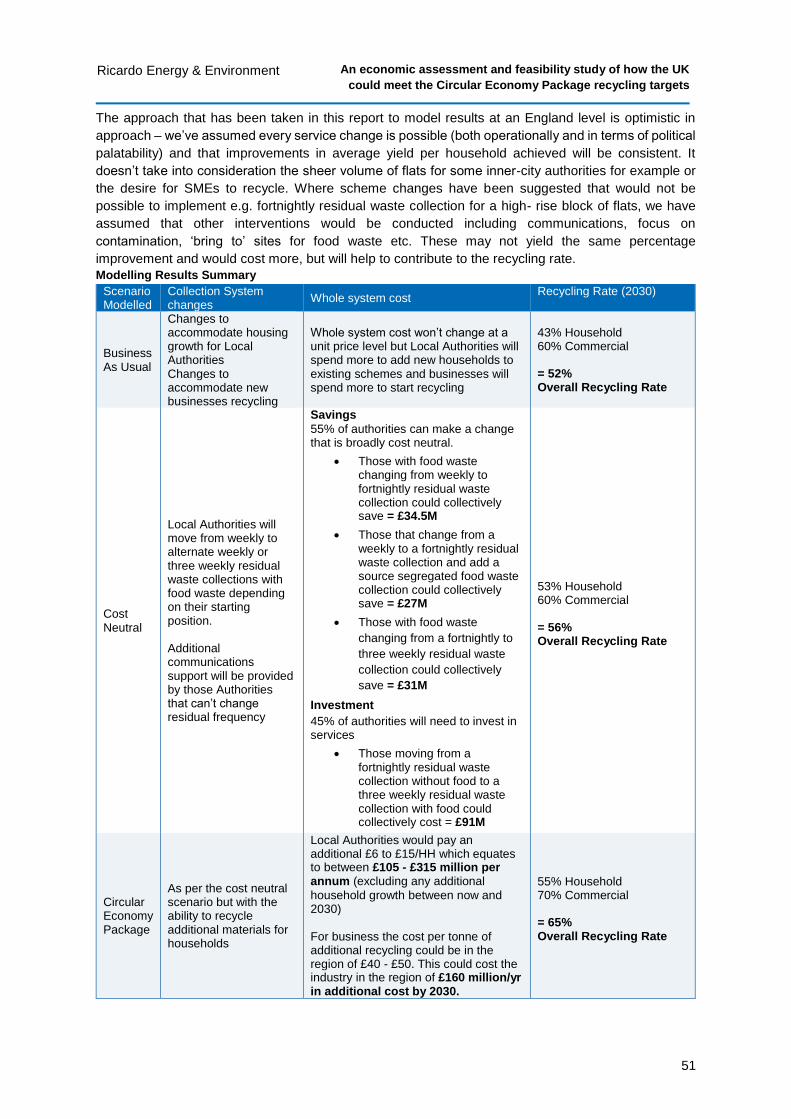
An economic assessment and feasibility study of how the UK
could meet the Circular Economy Package recycling targets
51
Ricardo Energy & Environment
The approach that has been taken in this report to model results at an England level is optimistic in
approach – we’ve assumed every service change is possible (both operationally and in terms of political
palatability) and that improvements in average yield per household achieved will be consistent. It
doesn’t take into consideration the sheer volume of flats for some inner-city authorities for example or
the desire for SMEs to recycle. Where scheme changes have been suggested that would not be
possible to implement e.g. fortnightly residual waste collection for a high- rise block of flats, we have
assumed that other interventions would be conducted including communications, focus on
contamination, ‘bring to’ sites for food waste etc. These may not yield the same percentage
improvement and would cost more, but will help to contribute to the recycling rate.
Modelling Results Summary
Scenario Modelled
Collection System changes
Whole system cost Recycling Rate (2030)
Business As Usual
Changes to accommodate housing growth for Local Authorities Changes to accommodate new businesses recycling
Whole system cost won’t change at a unit price level but Local Authorities will spend more to add new households to existing schemes and businesses will spend more to start recycling
43% Household 60% Commercial = 52% Overall Recycling Rate
Cost Neutral
Local Authorities will move from weekly to alternate weekly or three weekly residual waste collections with food waste depending on their starting position. Additional communications support will be provided by those Authorities that can’t change residual frequency
Savings
55% of authorities can make a change that is broadly cost neutral.
Those with food waste changing from weekly to fortnightly residual waste collection could collectively save = £34.5M
Those that change from a weekly to a fortnightly residual waste collection and add a source segregated food waste collection could collectively save = £27M
Those with food waste
changing from a fortnightly to
three weekly residual waste
collection could collectively
save = £31M
Investment
45% of authorities will need to invest in services
Those moving from a fortnightly residual waste collection without food to a three weekly residual waste collection with food could collectively cost = £91M
53% Household 60% Commercial = 56% Overall Recycling Rate
Circular Economy Package
As per the cost neutral scenario but with the ability to recycle additional materials for households
Local Authorities would pay an additional £6 to £15/HH which equates to between £105 - £315 million per annum (excluding any additional
household growth between now and 2030) For business the cost per tonne of additional recycling could be in the region of £40 - £50. This could cost the industry in the region of £160 million/yr in additional cost by 2030.
55% Household 70% Commercial = 65% Overall Recycling Rate
An economic assessment and feasibility study of how the UK
could meet the Circular Economy Package recycling targets
52
Ricardo Energy & Environment
Approximately 80 – 85% of material is in household waste is recyclable. To achieve some 60% recycling
rate residents would need to capture at least 70% of their recyclables, consistently, every week
particularly the heavier material streams such as food and garden waste. Contamination,
inconsistencies within materials collected across authorities, and current levels of participation by
residents would make this recycling rate almost impossible without increased investment and significant
behaviour change.
Overall the results provided are at the top end of expected performance and other interventions and
policy levers such as encouraging waste prevention, increasing reuse and doing more communications
on recycling (locally and nationally) may be required to reach these levels.
Potential Government Policy revisions could also be considered to improve recycling rates in particular
Extended Producer Responsibility (EPR) and review of the Producer Responsibility Obligations
(Packaging Waste) Regulations 2007, and consideration of a Deposit Return Scheme and/or
alternatives. These policy revisions cannot be guaranteed and the associated performance or
challenges for many of them will need to be explored further. Some may even have a detrimental effect
on recycling rate.
In summary – by 2030
A business as usual scenario will allow England to achieve an overall recycling rate of 52%,
increasing levels of commercial recycling will be needed to move to higher rates
If Local Authorities move towards reduced frequency of residual waste collections with food
waste and commercial recycling reaches 60% we will achieve an overall recycling rate of 56%
This will be broadly cost neutral for the majority of authorities. Political (residents may
not want reduced frequencies) and practical (Local Authorities need all savings and
therefore don’t reinvest in separate food collections) constraints may however reduce
the likelihood of some authorities adopting the required changes, which would result
in a lower recycling rate.
With additional measures we could get to an overall recycling rate of 65% but it will be difficult
and could cost a lot more
Additional cost to Local Authorities = £105 – 315M per annum
Additional cost to commercial sector = £160m p.a.
All scenarios are only possible in the event that the Government introduces policy to
strengthen end markets for the use of recycled materials. One such solution could be reform
of EPR
This report should enable sensible policy suggestions to be framed that will balance aspiration and
environmental performance with reasonable cost to deliver. Services will need investment to just
standstill in the future and the adoption of high recycling targets should be fully evaluated to
understand both the cost and environmental performance.
6.1 Alternative Metrics The next steps will be to consider alternative metrics so that the performance of our sector can be
framed beyond simple recycling targets. The second report in this series considers the shift from
weight based targets to the use of a ‘dashboard’ of metrics against which performance can be
evaluated. It considers what environmental performance we want to achieve and therefore what
metrics will be useful in measuring progress. There will always be a place for weight based metrics
particularly as our current systems function using this metric, but as we start to focus on the lighter
materials within our waste stream the performance gains (from a weigh based perspective) are small.
Using a broader approach may allow the best environmental option per material stream to be
considered. The introduction of any new metrics will take time and the transition needs to be carefully
reviewed to make sure that they’re fit for purpose and do not drive the wrong behaviour.
The report will be published June 2018.

The Gemini Building
Fermi Avenue
Harwell
Didcot
Oxfordshire
OX11 0QR
United Kingdom
t: +44 (0)1235 753000
ee.ricardo.com