altice fy 2016 results presentation -...
TRANSCRIPT

1
March 9, 2017
2016 Results

2
NOT AN OFFER TO SELL OR SOLICITATION OF AN OFFERTO PURCHASE SECURITIESThis presentation does not constitute or form part of, and should not be construed as,an offer or invitation to sell securities of Altice N.V. or any of its affiliates (collectivelythe “Altice Group”) or the solicitation of an offer to subscribe for or purchase securitiesof the Altice Group, and nothing contained herein shall form the basis of or be relied onin connection with any contract or commitment whatsoever. Any decision to purchaseany securities of the Altice Group should be made solely on the basis of the final termsand conditions of the securities and the information to be contained in the offeringmemorandum produced in connection with the offering of such securities. Prospectiveinvestors are required to make their own independent investigations and appraisals ofthe business and financial condition of the Altice Group and the nature of the securitiesbefore taking any investment decision with respect to securities of the Altice Group.Any such offering memorandum may contain information different from the informationcontained herein.
FORWARD-LOOKING STATEMENTSCertain statements in this presentation constitute forward-looking statements within themeaning of the Private Securities Litigation Reform Act of 1995. These forward-lookingstatements include, but are not limited to, all statements other than statements ofhistorical facts contained in this presentation, including, without limitation, thoseregarding our intentions, beliefs or current expectations concerning, among otherthings: our future financial conditions and performance, results of operations andliquidity; our strategy, plans, objectives, prospects, growth, goals and targets; andfuture developments in the markets in which we participate or are seeking toparticipate. These forward-looking statements can be identified by the use of forward-looking terminology, including the terms “believe”, “could”, “estimate”, “expect”,“forecast”, “intend”, “may”, “plan”, “project” or “will” or, in each case, their negative, orother variations or comparable terminology. Where, in any forward-looking statement,we express an expectation or belief as to future results or events, such expectation orbelief is expressed in good faith and believed to have a reasonable basis, but therecan be no assurance that the expectation or belief will result or be achieved oraccomplished. To the extent that statements in this press release are not recitations ofhistorical fact, such statements constitute forward-looking statements, which, bydefinition, involve risks and uncertainties that could cause actual results to differmaterially from those expressed or implied by such statements.
FINANCIAL MEASURESThis presentation contains measures and ratios (the “Non-IFRS Measures”), includingEBITDA and Operating Free Cash Flow that are not required by, or presented inaccordance with, IFRS or any other generally accepted accounting standards. Wepresent Non-IFRS or any other generally accepted accounting standards. We presentNon-IFRS measures because we believe that they are of interest for the investors andsimilar measures are widely used by certain investors, securities analysts and otherinterested parties as supplemental measures of performance and liquidity. The Non-IFRS measures may not be comparable to similarly titled measures of othercompanies, have limitations as analytical tools and should not be considered inisolation or as a substitute for analysis of our, or any of our subsidiaries’, operatingresults as reported under IFRS or other generally accepted accounting standards.Non-IFRS measures such as EBITDA are not measurements of our, or any of oursubsidiaries’, performance or liquidity under IFRS or any other generally acceptedaccounting principles. In particular, you should not consider EBITDA as an alternativeto (a) operating profit or profit for the period (as determined in accordance with IFRS)as a measure of our, or any of our operating entities’, operating performance, (b) cashflows from operating, investing and financing activities as a measure of our, or any ofour subsidiaries’, ability to meet its cash needs or (c) any other measures ofperformance under IFRS or other generally accepted accounting standards. Inaddition, these measures may also be defined and calculated differently than thecorresponding or similar terms under the terms governing our existing debt.
EBITDA and similar measures are used by different companies for differing purposesand are often calculated in ways that reflect the circumstances of those companies.You should exercise caution in comparing EBITDA as reported by us to EBITDA ofother companies. EBITDA as presented herein differs from the definition of“Consolidated Combined EBITDA” for purposes of any the indebtedness of the AlticeGroup. The information presented as EBITDA is unaudited. In addition, thepresentation of these measures is not intended to and does not comply with thereporting requirements of the U.S. Securities and Exchange Commission (the “SEC”)and will not be subject to review by the SEC; compliance with its requirements wouldrequire us to make changes to the presentation of this information.
DISCLAIMER

3
Group Highlights

4
2016 SUCCESSFUL YEAR OF EXECUTIONALL BUILDING BLOCKS IN PLACE FOR CONTINUED PROFITABLE GROWTH
Successful integration of US businesses and transformation into leading transatlantic operator
Validation of Altice Model: advanced turnaround in Europe, stronger US performance
Clear strategy: best talent, best customer experience, best infrastructure, best content
Completed internal reorganization to leverage scale, expertise and innovation
All 2016 financial objectives achieved; rapid deleverage and extension of more than €21bn of debt
Exploring possibility of IPO of a minority interest in Altice USA
1
2
3
4
6
5

5
Q4 2016 KEY TAKEAWAYSACCELERATING MOMENTUM – ALL MAJOR MARKETS DRIVING GROWTH
Altice Group: accelerating revenue growth +2.7% YoY1, expanding margins and cash conversion
France: return to revenue growth, market leading investment in 4G+ / fiber networks and content
Altice USA: acceleration in revenue growth and margin improvement, FTTH upgrade announced
Portugal: positive top-line and accelerated nationwide FTTH rollout
Robust, long-term capital structure with rapid de-leveraging and continued refinancing benefits
1
2
3
4
5
1 Reported revenue growth, 2.2% growth in constant currency

6
Revenue Growth (YoY)Group Adj. EBITDA
Margin
-3.3%
+0.6%
Q4-15 Q4-16
ALL MAJOR MARKETS BACK TO GROWTHALTICE MODEL VALIDATED
37.6%
Q4-16
33.3%
Q4-15
Note: Segments presented on a standalone reporting basis and in local currency. SFR shown including media assets for Q4-16 (i.e. including NextRadioTV and Altice Media Group France) and ex-media for Q4-15. SFR revenue grew 0.6% YoY ex-media assets in Q4-16; “Optimum” financials shown in this release refer to total company earnings from the business previously known as Cablevision Systems Corporation (e.g. including Lightpath), not just from the “Cable” segment, excluding Newsday Media Group (75% stake disposed on 7 July, 2016)
(%)
5.4x
Q4-16
5.9x1
Q4-15
Net Debt / L2QA Adj. EBITDA
1 Pro forma for Cablevision (Optimum) acquisition
Group Leverage+1.2%
+5.1%
-8.7%
+0.5%
-2.7%
+4.1%

7
37.6%
15.9%
+4.2 pp
+15.1%
POSITIVE MARGIN EVOLUTION BY MAIN MARKETSDRIVING MARGINS HIGHER ACROSS THE GROUP
Note: Segments presented on a standalone reporting basis. SFR Adj. EBITDA and OpFCF shown including media assets on a pro forma basis (i.e. including NextRadioTV and Altice Media Group France)1 Adj. EBITDA growth rate shown in constant currency for Altice USA and Altice Group2 Financials excluding Newsday
Q4-16Adj. EBITDAMargin
Q4-16OpFCFMargin
YoY Q4-16 Adj. EBITDA margin
Q4-16Adj. EBITDAGrowthYoY1
33.0%
6.2%
+3.4 pp
+12.1%
45.6%
23.8%
+3.1 pp
+7.8%
40.7%
26.7%
+8.3 pp
+32.0%
Continuous optimization and investments to drive further growth Peak capex in France for accelerated network investments
2
8
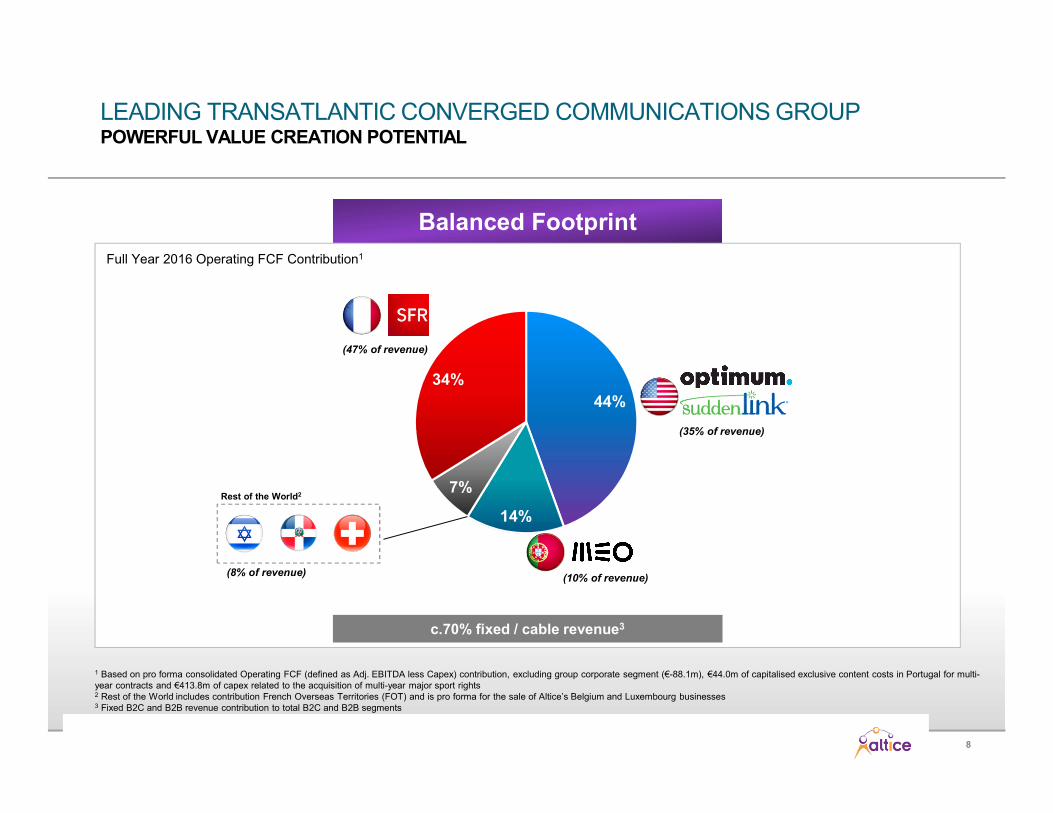
Balanced Footprint
44%
14%
7%
34%
LEADING TRANSATLANTIC CONVERGED COMMUNICATIONS GROUPPOWERFUL VALUE CREATION POTENTIAL
Full Year 2016 Operating FCF Contribution1
Rest of the World2
1 Based on pro forma consolidated Operating FCF (defined as Adj. EBITDA less Capex) contribution, excluding group corporate segment (€-88.1m), €44.0m of capitalised exclusive content costs in Portugal for multi-year contracts and €413.8m of capex related to the acquisition of multi-year major sport rights2 Rest of the World includes contribution French Overseas Territories (FOT) and is pro forma for the sale of Altice’s Belgium and Luxembourg businesses3 Fixed B2C and B2B revenue contribution to total B2C and B2B segments
(47% of revenue)
(35% of revenue)
(10% of revenue)(8% of revenue)
c.70% fixed / cable revenue3

9
LEADING GLOBAL COMMITMENT TO FIBERSIGNIFICANT AND RAPID FIBER DEPLOYMENTS ACROSS ALTICE GROUP
1 Q3-15 for Suddenlink and Q1-16 for Optimum2 Up to 350 Mbps for B2B (commercial) customers, 300 Mbps for B2C (residential) customers
Altice Labs: Global R&D Center
Pioneering fiber GPON technology including state-of-the-art CPE and 5G
Pre-Altice2006
Q4-162022 FTTB/FTTH
target
9.3m 22m0
Fiber (FTTB / FTTH) homes
Pre-AlticeQ1-15
Q4-16 2020 FTTH target
Fiber FTTH homes
3.0m 5.3m1.8m
Dominican RepublicTotal Fiber
(HFC) homesPre-Altice1 Q4-16 2021 FTTH Targets
3.0m
101Mbps
150Mbps>50%
1Gbps58%
Up to 10Gbps
5.1m 350Mbps2
“Generation GigaSpeed” Fiber HFC FTTH
c.9 million homes upgraded across Altice Group in 2016
Altice Technical Services
In-house global network deployment, upgrade and maintenance. Additional external revenue opportunity selling to 3rd parties

10
GLOBAL TARGETED CONTENT AND MEDIA INVESTMENTSSCALE BENEFITS IN DRIVING GROUP CONVERGENT STRATEGY
ACCESS
+ Very high speed fiber broadband+ Altice Labs producing state-of-the-art
fixed / mobile technologies and CPE+ Multi-screen addressable market
ADVERTISING
+ Synergies+ Strong standalone financial
prospects+ Additional capabilities, expertise and
entrepreneurs Altice USA data analytics, Audience Partners SFR Régie
+ Hyper local news+ Altice Channel Factory
CONTENT
+ Major sports, family, fiction, entertainment+ Original programming+ Premium bundle upselling+ Product enhancement La Box S-VOD platforms
PLAY
Best Connectivity
Best Content
Best Analytics
Differentiate Offers
Improve Brand
Perception
Diversify services / Increase ARPU
Best-In-Class Efficiency
11
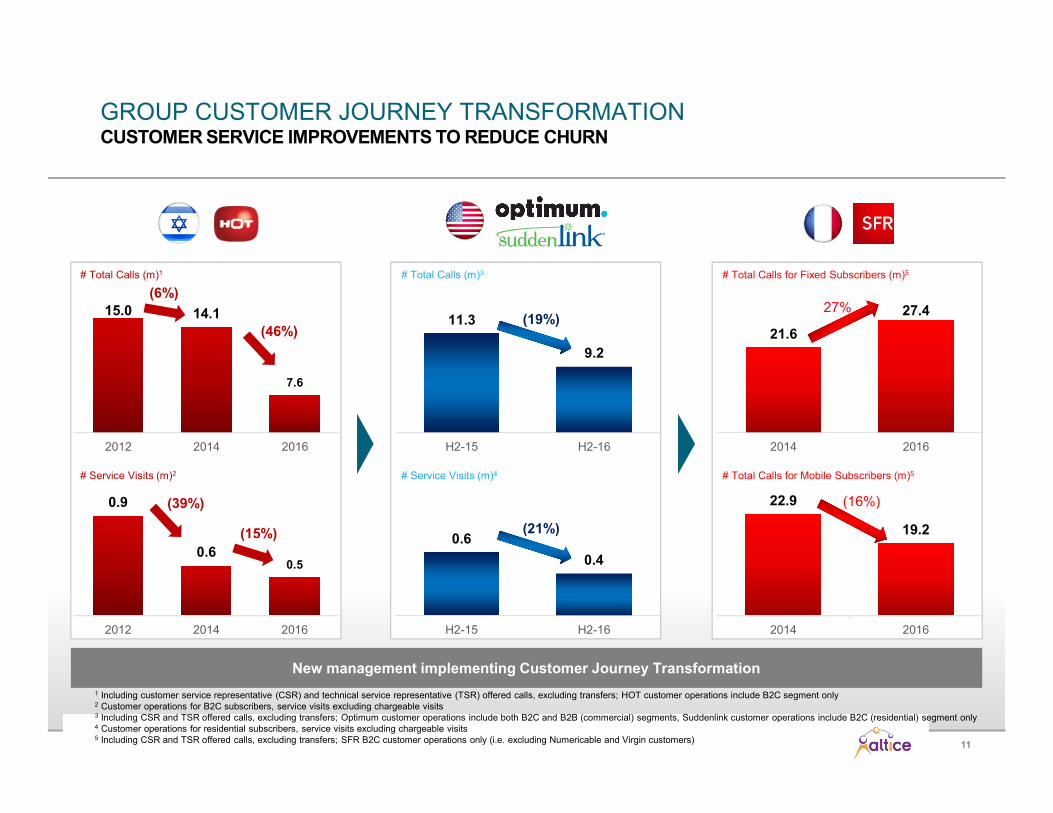
GROUP CUSTOMER JOURNEY TRANSFORMATIONCUSTOMER SERVICE IMPROVEMENTS TO REDUCE CHURN
# Total Calls (m)1
# Service Visits (m)2
# Total Calls (m)3
# Service Visits (m)4
# Total Calls for Fixed Subscribers (m)5
# Total Calls for Mobile Subscribers (m)5
New management implementing Customer Journey Transformation
15.0 14.1
7.6
2012 2014 2016
0.9
0.60.5
2012 2014 2016
21.6
27.4
2014 2016
22.9
19.2
2014 2016
11.3
9.2
H2-15 H2-16
0.6
0.4
H2-15 H2-16
(19%)
(21%)
1 Including customer service representative (CSR) and technical service representative (TSR) offered calls, excluding transfers; HOT customer operations include B2C segment only2 Customer operations for B2C subscribers, service visits excluding chargeable visits 3 Including CSR and TSR offered calls, excluding transfers; Optimum customer operations include both B2C and B2B (commercial) segments, Suddenlink customer operations include B2C (residential) segment only4 Customer operations for residential subscribers, service visits excluding chargeable visits5 Including CSR and TSR offered calls, excluding transfers; SFR B2C customer operations only (i.e. excluding Numericable and Virgin customers)
(46%)
(15%)
27%
(16%)
(6%)
(39%)

12
Business Review

13
0.6%
(4.6%)
(2.4%)
(3.5%) (3.3%)
(5.5%)
(4.3%)
(2.3%)
0.8%
Q115
Q215
Q315
Q415
Q116
Q216
Q316
Q416
ALTICE FRANCE BUSINESS DYNAMICSSFR RETURN TO GROWTH
+ Organic revenue stabilization in 2017
+ Mobile customer base stabilized
+ Focus on reducing churn and improving customer experience
+ Expansion of fiber footprint to support accelerationin fiber customer growth
+ Adding new content to convergent offers
+ Company transformation
+ Improve brand perception
Back to growth after 24 quarters of decline, of which only 7 after Altice control
Revenue YoY (%)1
FY 2015: (3.5%)
1 Revenue growth rates presented on a standalone reporting basis 2 SFR revenue growth rate including media assets (i.e. NextRadioTV, and Altice Media Group France) for FY 2016. Revenue growth rates for FY 2015 excluding media assets. SFR revenue declined by 3.2% YoY excluding media assets in FY 2016; SFR revenue excluding media assets (for comparability with prior quarters) declined by 6.1%, 4.6% and 2.6% YoY in Q1 16, Q2 16 and Q3 16 respectively and grew by 0.6% in Q4 16 3 Excluding retail roaming EU tariffs impacts in May 2016, revenue grew 0.8% YoY in Q4 2016, and declined by 2.6% YoY in FY 2016
Excluding regulatory impact2
FY 2016: (2.9%)2
3

14
ALTICE FRANCE B2C REVENUE TRENDSSUSTAINED FIXED GROWTH AND IMPROVING MOBILE TRENDS
1 The figures shown in the section for France are SFR standalone financials.
(1.7%) (1.5%)
(0.5%)
(2.9%)
(5.2%)
(2.0%)
1.3% 1.3%
(8.7%)
(2.8%) (3.3%) (3.3%)
(4.8%)
(7.1%)
(4.2%)
(1.5%)
(6.1%)
(2.3%) (2.3%)(3.2%)
(4.9%) (5.2%)
(2.2%)
(0.5%)
Q1-15 Q2-15 Q3-15 Q4-15 Q1-16 Q2-16 Q3-16 Q4-16Fixed Mobile Total B2C
Revenue YoY (%)1
Fixed growing for the second quarter in a row, driven by ARPU uplift;
Significantly improved mobile trends with customer base stabilization
B2C

15
ALTICE FRANCE B2C FIXED LINE BUSINESSFOCUS ON CHURN REDUCTION AND RE-ACCELERATING FIBER GROWTH
Fiber ('000)
Fiber vs. DSL Net Adds1
DSL ('000)
(114)(83)
(127)(102) (119) (115)
Fiber ARPU(€/Month)
DSL ARPU (€/Month)
1 Unique subscriber net additions2 Includes 4k fiber net additions from new La Poste TV revenue sharing contract (total of 19k La Poste TV customers included within the B2C fixed based from Q4 2016)
72 7866
44 4454
Q3-15 Q4-15 Q1-16 Q2-16 Q3-16 Q4-16
Total Subscriber Net Adds(Fiber + DSL)
41.240.840.3 39.3 38.7
(75)(42) (5) (61) (58)
35.633.434.1 33.3 32.0
40.0
(61)
35.5
ARPU growth supporting fixed B2C revenue trends
2
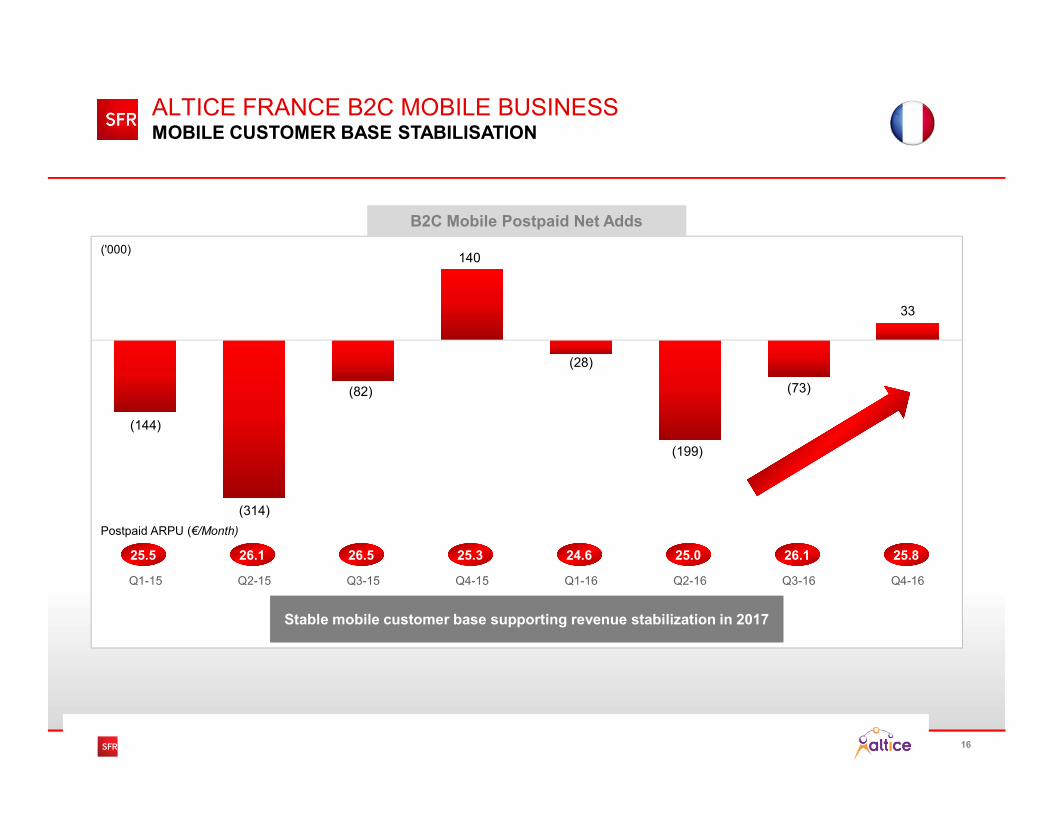
16
(144)
(314)
(82)
140
(28)
(199)
(73)
33
Q1-15 Q2-15 Q3-15 Q4-15 Q1-16 Q2-16 Q3-16 Q4-16
ALTICE FRANCE B2C MOBILE BUSINESSMOBILE CUSTOMER BASE STABILISATION
B2C Mobile Postpaid Net Adds
('000)
Postpaid ARPU (€/Month)
26.126.1 25.026.5 25.3 24.625.5 25.8
Stable mobile customer base supporting revenue stabilization in 2017

17
(1.5%) (2.3%)(3.4%)
(1.5%)(3.0%) (2.5%) (2.4%) (2.2%)
(6.5%)(6.8%)
(13.9%)
(18.6%)
(16.0%)
(8.4%)
(6.6%)(5.6%)
(3.3%) (3.9%)
(7.1%)(7.6%)
(7.6%)
(4.5%)(3.8%) (3.3%)
Q1-15 Q2-15 Q3-15 Q4-15 Q1-16 Q2-16 Q3-16 Q4-16Fixed Mobile Total B2B
Revenue YoY (%)1
Impact from prior mobile customer losses reducing; Legacy fixed voice decline partly offset by ICT growth
B2B
ALTICE FRANCE B2B REVENUE TRENDSIMPROVING TRENDS INCLUDING MOBILE BASE STABILIZATION
1 The figures shown in the section for France are SFR standalone financials2 Ex-M2M
(155)
(59)(41) (59) (51) (46)
(21) (1)
Q1-15 Q2-15 Q3-15 Q4-15 Q1-16 Q2-16 Q3-16 Q4-16
B2B Mobile Postpaid Net Adds2
('000)
Sustained reduction in churn;
Customer base and ARPU stabilized
+2.9%
ARPU (€) per unique customer YoY

18
7.7m
8.1m
8.5m
8.9m
9.3m
Q4-15 Q1-16 Q2-16 Q3-16 Q4-16
ALTICE FRANCE ACCELERATED NETWORK INVESTMENTSFASTEST 4G MOBILE COVERAGE EXPANSION AND FASTEST 4G+ NETWORK
Fastest Fiber Network Buildout
# Fiber Homes Passed N°1
+1.6m
+341k
+420k
+419k
+386k
22mFiber coverage 2022 target
33%
81%
71%
88%
70%
85%
33%
76%
Q3-14 Q4-14 Q1-15 Q2-15 Q3-15 Q4-15 Q1-16 Q2-16 Q3-16 Q4-16 …. Q4-18
99%
On Track Building Leading 4G Network
FY-164G sites roll-out
4G Population Coverage (%)
Mobile Data Speeds Increasing
+5,248 +1,690+1,932+3,456 28
38
48
4G+UHD Launch
Sept. 16 Oct. 16 Nov. 16 Dec. 16
Nantes Average 4G+ up to 300Mbps Technology Download Speeds in Mb/s 2
1 As per 4GMARK2 As per Speedtest 4G
Fastest 4G+ up to 300Mbps Network
10
20
30
Sept. 16 Oct. 16 Nov. 16 Dec. 16 Jan. 17
National Average Download Speeds in Mb/s 1SFR 4G coverage 2018 target

19
7.7m
8.1m
8.5m
8.9m
9.3m
Q4-15 Q1-16 Q2-16 Q3-16 Q4-16
ALTICE FRANCE ACCELERATED NETWORK INVESTMENTSLEADING FIBER OPERATOR
Fastest Fiber Network Buildout
# Fiber Homes Passed
+1.6m
+341k
+420k
+419k
+386k
22mFiber coverage 2022 target
+381k
Fastest Fixed Broadband Speeds
N°1
Building the best, fastest and most widely available fiber network in France
+ Fastest fiber speeds1
Up to 1 Gbps download speeds FTTH / FTTB
+ Fastest DSL speeds2
+ Most reliable connections for fiber and DSL3
+ Rapidly expanding FTTH footprint in less dense areas (ZMD)
1 ISP Speed Index as of December 20162 Data from nPerf as of Q4 2016 3 ARCEP, Quality of access to fixed services as of November 2016 – Tests carried out during H1 2016
20
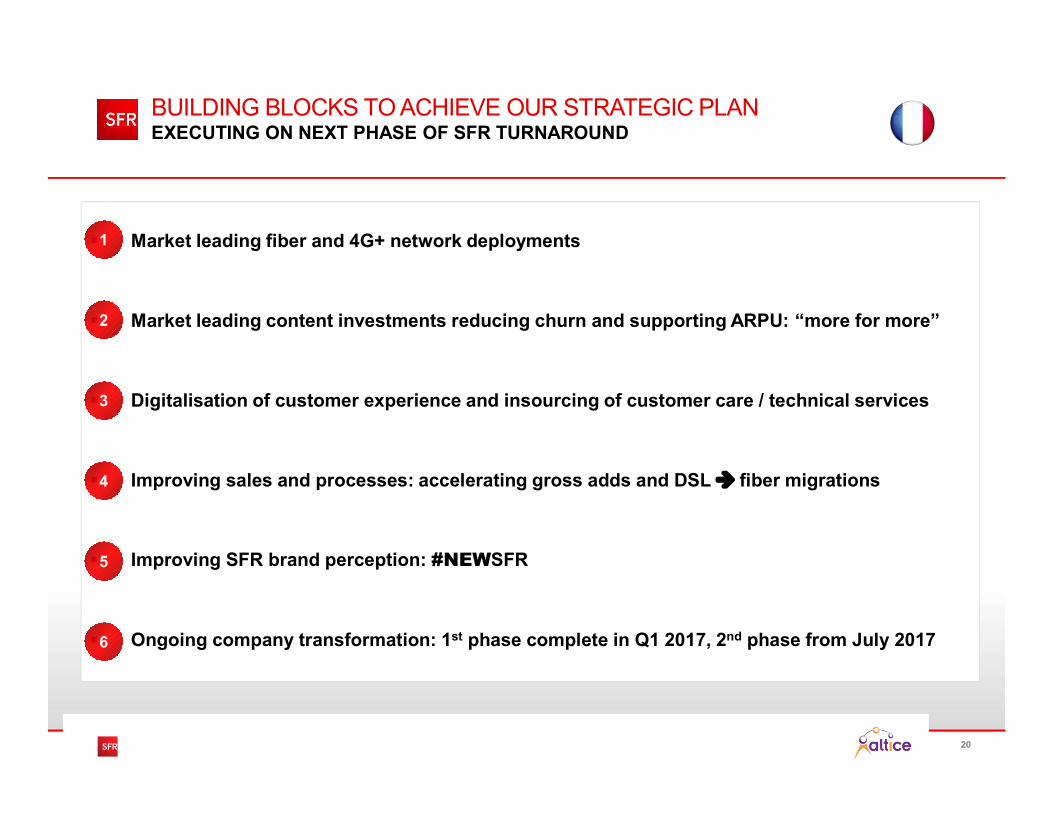
BUILDING BLOCKS TO ACHIEVE OUR STRATEGIC PLAN EXECUTING ON NEXT PHASE OF SFR TURNAROUND
Market leading fiber and 4G+ network deployments
Market leading content investments reducing churn and supporting ARPU: “more for more”
Digitalisation of customer experience and insourcing of customer care / technical services
Improving sales and processes: accelerating gross adds and DSL fiber migrations
Improving SFR brand perception: #NEWSFR
Ongoing company transformation: 1st phase complete in Q1 2017, 2nd phase from July 2017
1
2
3
4
6
5

21
(5.4%)
(6.6%)
(8.6%) (8.7%)
(3.5%)(3.0%)
(0.0%)
1.3%
Q115
Q215
Q315
Q415
Q116
Q216
Q316
Q416
ALTICE PORTUGAL BUSINESS DYNAMICSRETURN TO GROWTH
+ B2C – Focus on reducing customer losses:
Fiber growth still accelerating and fixed churn reducing as a result of faster network build out
Content bundling supporting ARPU
Saturation of 4P and postpaid mobile market
+ B2B – Stabilized mobile base and ARPU, ICT and data growth partly offsetting legacy voice declines
1 Revenue growth rates presented on a standalone reporting basis 2 Excluding impact from SMS termination fee reduction of 35% in April 16 and retail roaming EU tariffs impacts in May 2016
Revenue YoY (%)1
Back to growth after 32 quarters of decline, of which only 4 after Altice control
FY 2015: (7.3%)
Excluding regulatory impact2
FY 2016: (1.5%)
+0.5%

22
2.2m
3.0m
c.4.0m
2015 2016 2017 Target
+85k
+714k
>900k
ALTICE PORTUGAL ACCELERATED NETWORK INVESTMENTSRAPID FIBER NETWORK EXPANSION TO STABILISE FIXED CUSTOMER BASE
1 Additional homes passed shown excluding Vodafone sharing agreement
Fiber Network Buildout
5.3mFiber coverage 2020 target
(‘000)
B2C Mobile Customers Net Adds
48 3514 9
(12)(31)
(140)
(36)
68
(21)
+18
(104)
(22)
+77
(33)
Q4-15 Q1-16 Q2-16 Q3-16 Q4-16
Postpaid Prepaid
(‘000)
Fiber Net Adds
(5.3%)1
+8k +8k
+16k
+21k
+29k
Q4-15 Q1-16 Q2-16 Q3-16 Q4-16
Fiber ARPU
(€/Month)39.740.1
N°1# Fiber Homes Passed1

23
1.7% 2.2%
2.5% 2.4%
0.4%
1.2%
3.1% 3.0%
3.8%
5.1%
Q115
Q215
Q315
Q415
Q116
Q216
Q316
Q416
ALTICE USA BUSINESS DYNAMICSACCELERATED REVENUE GROWTH SINCE ALTICE CONTROL
Strong revenue momentum
+ Revenue and subscriber growth ahead of expectations
+ Increase in broadband speeds driving upselling
+ Substantially improved margins and cash flow
+ Significantly improved customer service metrics
+ Development and rollout of new home entertainment hub expected in Q2 2017
+ “Generation Gigaspeed" 5-year FTTH deployment
FY 2016: 3.6%3
FY 2015: 1.6%3
Revenue YoY (%)1
Impact from excluding PPV event
2
2
1 Revenue growth rates presented on a standalone reporting basis and in local currency, all Optimum’s revenues excluding Newsday2 Revenue growth excluding PPV event revenue in Q2 15: 1.7% and 3.0% for Altice USA in Q2 15 and Q2 16 respectively 3 Revenue growth including PPV event revenue in Q2 15

24
2.6%
0.7%
(0.7%)
(0.1%)
1.8%
2.7%
4.4%
1.9%1.6%
1.1%
Q115
Q215
Q315
Q415
Q116
Q216
Q316
Q416
Accelerated revenue growth again
1 Revenue growth rates presented on a standalone reporting basis and in local currency 2 All company’s revenues excluding Newsday3 Revenue growth excluding PPV event revenue in Q2 15: 0.7% and 1.9% for Optimum in Q2 15 and Q2 16 respectively4 Revenue growth excluding PPV event revenue in Q2 15: 4.2% and 5.7% for Suddenlink in Q2 15 and Q2 16 respectively5 Revenue growth including PPV event revenue in Q2 15
Sustaining accelerated revenue growth
Impact from excluding PPV event
Q4-16 OpFCFGrowth YoY in cc
29.6%Q4-16 OpFCFGrowth YoY in cc
93.8% Revenue YoY (%)1,2
FY 2015: 0.8%5
3
3
2.2% 4.2%
3.6%
4.5%
6.7%
5.7%
6.7% 6.7%
4.7% 5.2%
Q115
Q215
Q315
Q415
Q116
Q216
Q316
Q416
4
Impact from excluding PPV event
FY 2015: 3.7%5
4
ALTICE USA BUSINESS DYNAMICSSTRONGER GROWTH
Revenue YoY (%)1
FY 2016: 6.3%5FY 2016: 2.5%5

25
B2C Customer Relationships (‘000)1
3P
2,855 2,8582,846
2,8582,866
2,8822,873 2,879
Q1-15 Q2-15 Q3-15 Q4-15 Q1-16 Q2-16 Q3-16 Q4-16
ARPU ($) per unique customer
150.6 154.5
(‘000)+0.8%
+2.6%
Total revenue growth2: 4.4% YoY (cc)
ALTICE USA B2C FIXED LINE BUSINESSPOSITIVE CUSTOMER AND ARPU TRENDS
1 The 2015 unique customer base for Optimum has been reduced by 4k compared to prior disclosure to eliminate certain free accounts; Optimum’s B2C (residential) ARPU as shown has been recalculated to exclude advertising revenue, as well as B2B revenue and unique B2B subscribers compared to prior disclosure of total ARPU (including advertising, B2C and B2B)2 Total revenue includes B2C, B2B, wholesale and other revenue for both Optimum and Suddenlink. Both Optimum and Suddenlink customer relationships include B2C (residential) customer relationships and exclude B2B (consistent with Suddenlink prior disclosure, but not with Optimum prior disclosure that used to include B2C and B2B)
B2C Customer Relationships (‘000)
3P
(‘000)
ARPU ($) per unique B2C customer
Total revenue growth2: 6.7% YoY (cc)
1,4521,439
1,4541,467
1,4891,481
1,4911,505
Q1-15 Q2-15 Q3-15 Q4-15 Q1-16 Q2-16 Q3-16 Q4-16
+2.6%
111.8 117.0
+4.7%

26
2% 5%10%
20%
34%34%
52% 56%59%
1% 1% 3%
8%
16% 20%
26%32%
37%
Q4 14 Q1 15 Q2 15 Q3 15 Q4 15 Q1 16 Q2 16 Q3 16 Q4 16
% of customer gross adds taking plans ≥ 100Mbps
% of customer base taking ≥ 100Mbps
ALTICE USA B2C BROADBANDFOCUS ON HIGH SPEED BROADBAND GROWTH
Suddenlink B2C BroadbandOptimum B2C Broadband
1% 1% 2% 1% 1%
12%13%
42%
62%
7% 6% 6% 6% 5%5%
6%8%
13%
Q4 14 Q1 15 Q2 15 Q3 15 Q4 15 Q1 16 Q2 16 Q3 16 Q4 16
% of customer gross adds taking plans ≥ 100Mbps
% of customer base taking ≥ 100Mbps
Successful broadband upselling following upgrade of entire network to 300Mbps since Altice ownership
5140
AlticeOwnership
Successful broadband upselling following “Operation GigaSpeed” network upgrade
9060
Average Speed Delivered (Mbps)
AlticeOwnership
3339
Average Speed Delivered (Mbps)
Note: Network statistics as of the end of the period

27
$79
$59
$48$43
$54 $52
31.7%32.9%
31.3%32.4%
33.9%36.5%
38.8%40.7%
13.5%
16.1% 16.4%15.7%
10.4%12.3%
9.8%
14.0%
Q115
Q215
Q315
Q415
Q116
Q216
Q316
Q416
Opex Rationalization Opportunity Expanded Cash Flow Generation
ALTICE USA MARGIN PROGRESSION SUBSTANTIALLY IMPROVED MARGINS AND CASH FLOW
25.9%
FY 2016
16.7%
FY 2015
OpFCF4
Margin
Opex ex-programming costs per customer / month 1
Altice USA Capex to Sales
Altice USA Adj. EBITDA Margin
1 Calculated as operating costs excluding programming costs, divided by average total subscribers (B2C and B2B) over the period; total opex has not been adjusted from publicly reported figures to reflect immaterial differences in calculation methodologies between all of the operators shown. 2015 historical figures for Optimum include Newsday which has subsequently been de-consolidated following the disposal of a 75% stake in July 20162 Optimum total programming costs of $1.8bn in FY 2015 and $464m in Q4-16; Suddenlink total programming costs of $558m in FY 2015 (recalculated from $612m previously reported to align with Optimum disclosure excluding franchise and copyright fees) and $147m in Q4-16 3 Comcast Total Cable Communications Opex excluding programming costs per average total customer relationship. Charter Total Pro Forma Group Opex excluding programming costs per average total customer relationship
4 Defined as Adj. EBITDA-capex
FY 2016 US Peers
2015 Q4-16 2015 Q4-16
32 2
Synergies between Optimum and Suddenlink just started

28
0.3
0.2
H2-15 H2-16
ALTICE USA CUSTOMER JOURNEY TRANSFORMATIONSIGNIFICANT CUSTOMER SERVICE IMPROVEMENTS
# Total Calls (m) 2# Total Calls (m) 1
New management implementing Customer Journey Transformation best practice
# Service Visits (m) 1 # Service Visits (m) 2
(24%)0.3
0.2
H2-15 H2-16
(19%)
3.5
3.0
H2-15 H2-16
(15%)7.8
6.2
H2-15 H2-16
(20%)
1 Including CSR and TSR offered calls; Optimum customer operations include both B2C and B2B (commercial) segments, Suddenlink customer operations include B2C (residential) segment only2 Customer operations for residential subscribers, service visits excluding chargeable visits

29
Financial Review

30
ALTICE N.V.PRO FORMA CONSOLIDATED FINANCIALS1
1 Financials shown in this presentation are pro forma defined here as results of the Altice N.V. Group as if all acquisitions had occurred on 1/1/15, including PT Portugal (MEO), Suddenlink, Cablevision (Optimum), NextRadioTV and Altice Media Group France (and excluding Belgium and Luxembourg, Newsday Media Group, Cabovisao, ONI, La Reunion and Mayotte mobile activities as if the disposals occurred on 1/1/15). Segments shown on a pro forma standalone reporting basis, Group figures shown on a pro forma consolidated basis. Financials include only one month of contribution from the insourcing of Parilis and no impact from the insourcing of Intelcia, as the impacts were not material2 Including corporate revenue of €170.9m in FY 2016 and €20.4m in FY 20153 Excluding spectrum capex of €477m in France in FY 20154 Excluding €44.0m of capitalised exclusive content costs in Portugal for multi-year contracts and €413.8m of capex related to the acquisition of multi-year major sport rights in FY 20165 Corporate costs after intersegment adjustments on a consolidated basis were €89.2m in FY 2016 and €28.8m in FY 2015, which includes €41.3m of costs related to annual strategic services and brand license agreement established in Q4 2016 with an affiliate of Next Alt S.a.r.l.
€m FY 15 FY 16YoY Reported
GrowthYoY Constant
Currency Growth
Revenue
France (SFR) 11,503 11,170 (2.9%) (2.9%)
Altice International 4,254 4,405 3.5% 3.6%
US (Optimum) 5,686 5,842 2.7% 2.5%
US (Suddenlink) 2,181 2,325 6.6% 6.3%
Intersegment Adjustments2 (50) (219) - -
Altice N.V. Consolidated 23,574 23,522 (0.2%) (0.3%)
AdjustedEBITDA
France (SFR) 3,895 3,857 (1.0%) (1.0%)
Margin (%) 33.9% 34.5%
Altice International 1,885 2,094 11.1% 11.2%
Margin (%) 44.3% 47.5%
US (Optimum) 1,636 2,005 22.5% 22.2%
Margin (%) 28.8% 34.3%
US (Suddenlink) 889 1,058 19.0% 18.7%
Margin (%) 40.7% 45.5%
Corporate5 (11) (115) - -
Altice N.V. Consolidated 8,294 8,899 7.3% 7.2%
OpFCF
France (SFR)3 2,039 1,534 (24.8%) (24.8%)
Altice International4 1,062 1,136 7.0% 7.3%
US (Optimum) 853 1,378 61.6% 61.2%
US (Suddenlink) 457 735 60.6% 60.2%
Corporate5 (11) (92) - -
Altice N.V. Consolidated 4,400 4,690 6.6% 6.5%

31
OVERVIEW OF ALTICE GROUP DEBTDIVERSIFIED SILOS
Altice Luxembourg S.A. (HoldCo)
Suddenlink Cablevision (Optimum)
Altice Lux (Europe) silo
Altice InternationalAltice France
(SFR)
Suddenlink silo Cablevision siloAI siloSFR silo
84.0% 100%
68.8%
Gross Debt €15,248m
Net Debt €14,796m
LTM Adj. EBITDA €3,857m
Gross Leverage 4.0x
Net leverage 3.8x
Undrawn RCF5 €1,125m
Gross Debt €8,450m
Net Debt €8,165m
LTM Adj. EBITDA4 €2,142m
Gross Leverage 3.9x
Net leverage 3.8x
Undrawn RCF5 €677m
Gross Debt €6,437m
Net Debt €6,256m
LTM Adj. EBITDA €1,058m
Gross Leverage 6.1x
Net Leverage 5.9x
Undrawn RCF5 €316m
Gross Debt €13,908m
Net Debt €13,687m
LTM Adj. EBITDA €2,005m
Gross Leverage 6.9x
Net Leverage 6.8x
Undrawn RCF5 €1,930m
100%
Altice NV (Top Co)
ANV / Altice Corporate Financing S.A
Gross Debt3 €1,403m
Net Debt3 €1,233m
Notes: LTM financial information as of Q4-16 for Altice Group and excluding pension liabilities for Portugal Telecom. CMCSA collar loan at Cablevision (CVC) not included in debt and leverage figures 1 Total group cash of €1,311m minus €110m of restricted cash and total undrawn RCF of €4,248m (total RCF of €4,826m net of €102m LOCs and €476m RCF drawn)2 Altice USA debt figures shown do not include a $232m loan that refinanced a vendor note from existing sponsors with interest on the loan payable in kind. It also does not include a $525m shareholder loan from existing sponsors to fund their portion of the equity funding of the acquisition of CVC (Optimum)3 Total size of facility (fully drawn). €170m cash includes €76m of restricted cash4 Altice Europe (Consolidated) LTM Adj. EBITDA includes (€71m) corporate costs / consolidation adj. to standalone Adj. EBITDA figures. Altice US (Consolidated) LTM Adj. EBITDA includes €3m corporate costs / consolidation adj. to standalone Adj. EBITDA figures. Altice Group (Consolidated) includes additional (€47m) corporate costs / consolidation adj. LTM Adj. EBITDA incudes SA Belgium and Luxembourg Adj. EBITDA of €48m and €1m consolidation adjustment5 France RCF of €1,125m, AI RCF of €987m minus €310m drawn and ALUX RCF of €200m. Suddenlink RCF of €332m net of €16m LOCs. CVC RCF of €2,182m net of €86m LOCs and €166m drawn
Altice USA2
BC Partners / CPPIB / Mngt.
31.2%
Free Float
16.0%
Altice Lux (Europe) silo
Altice France (SFR)
Altice International silo
Suddenlink silo
Cablevision silo
Target Leverage
• Altice Europe: c. 4.0x
• Altice US: c. 5.0-5.5x
Gross Debt 29,929 51,677Net Debt 29,189 50,365LTM Adj. EBITDA 4 5,928 8,947PF Cash Int. 1,715 3,187
Gross Leverage 5.0x 5.8xNet Leverage 4.9x 5.6xUndrawn RCF5 2,002 4,248
Credit Metrics
Altice Group (Consolidated) Available Liquidity
• Altice Group1: €5.4 bn
Altice Europe (Consolidated)
100%Gross debt €6,231mNet debt €6,229mUndrawn RCF5 €200m

32
7.0x
6.5x 6.6x
6.0x5.8x
5.6x
5.3x
7.1x
6.7x
6.2x
Q2-15 Q3-15 Q4-15 Q1-16 Q2-16 Q3-16 Q4-16
ALTICE USA LEVERAGE EVOLUTIONRAPID DE-LEVERAGING TOWARDS TARGET
Net Debt / L2QA Adj. EBITDA1
1 Net debt and Adj. EBITDA figures as per Altice reported financials in euros on an IFRS basis2 Pre-Suddenlink dividend for vendor note repayment in Q4 2016: 5.6x L2QA Adj. EBITDA post-dividend (5.9x LTM Adj. EBITDA)
5.0-5.5x
Target
Suddenlink Optimum
2

33
96211 413 320
1,166
2,990
379 340
2,42668
6953
52 56
3,920 1,031
3,198
2,206
4,194
4,172
2,058
8 8 8
1,431 1,1948
1,0518
1,300 1,423878
1,494 523
498 1,139
639
1,731
2,917
2,846
1,2431,403
Alt Int SFR Alt Lux SL CVC Altice Corp. Fin
(2)
OVERVIEW OF ALTICE GROUP MATURITY PROFILE€21BN REFINANCED DURING 2016
Altice Maturity Profile (€m)
Note: Maturity profile excluding leases/other debt (c.€512m), includes RCFs drawn of €166m for CVC and €310m for AI shown at their maturity date. WAL and WACD stats exclude finance leases/other debt (c.€512m) and France media debt of €55m1 CVC revolver can be drawn to term out these amortisations
Long-term capital structure with limited near-term maturities
Debt maturity summary:
Altice Group
WAL life of 6.6 years (including RCF drawn)
WACD of 6.2%
1,049 1,782 1,985 2,393 2,708 8,751 8,0436,502
9,906
6,803
2017 2018 2020 202220212019 2023 2024 2025 2026
Altice Europe silo Altice USA
11
2027
1,243
1
34
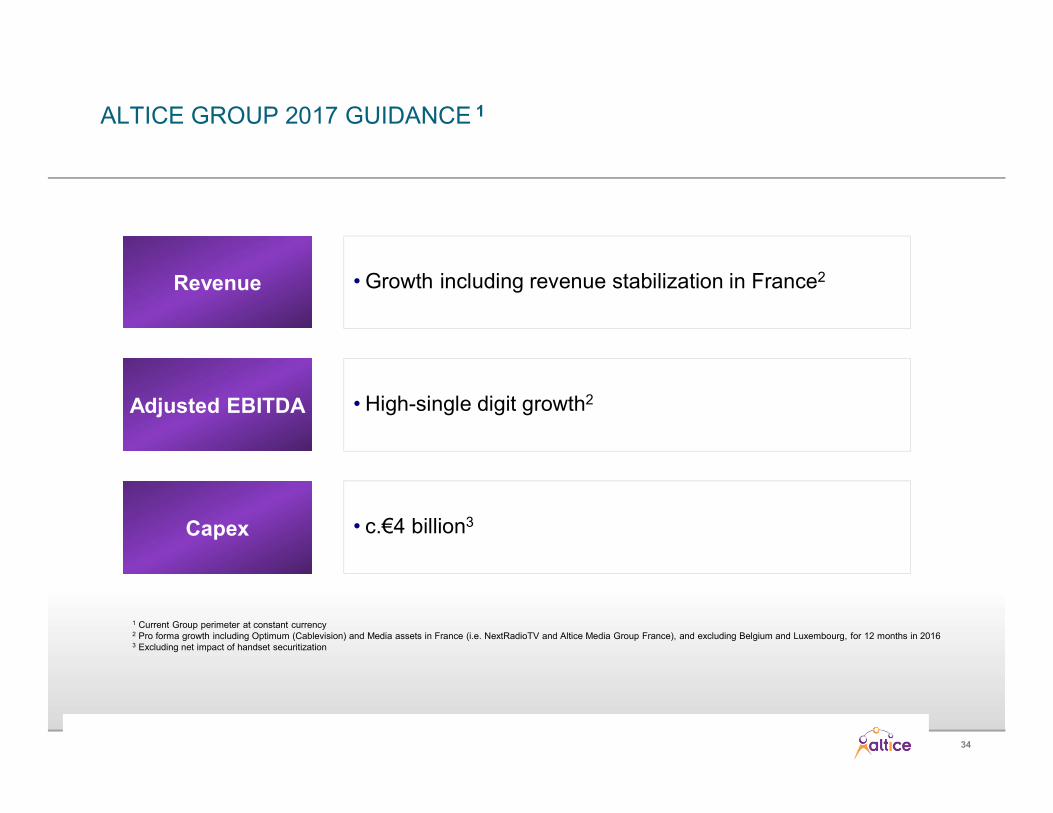
ALTICE GROUP 2017 GUIDANCE 1
1 Current Group perimeter at constant currency2 Pro forma growth including Optimum (Cablevision) and Media assets in France (i.e. NextRadioTV and Altice Media Group France), and excluding Belgium and Luxembourg, for 12 months in 20163 Excluding net impact of handset securitization
• Growth including revenue stabilization in France2Revenue
• High-single digit growth2Adjusted EBITDA
• c.€4 billion3Capex

35

36
Appendix

37
€m Q4-15 Q4-16YoY Reported
GrowthYoY Constant
Currency Growth
France 2,875 2,892 0.6% 0.6%
US (Optimum) 1,439 1,522 5.8% 4.4%
US (Suddenlink) 565 611 8.1% 6.7%
Portugal 577 580 0.5% 0.5%
Israel 232 248 7.0% 4.1%
Dominican Republic 178 189 6.0% 6.8%
French Overseas Territories 48 58 20.5% 20.5%
Others and Intersegment Adjustments2 10 (14) nm nm
Total Altice N.V. Group Consolidated 5,925 6,087 2.7% 2.2%
ALTICE N.V.PRO FORMA CONSOLIDATED REVENUE1
1 Financials shown in this presentation and throughout this appendix are pro forma defined here as results of the Altice N.V. Group as if all acquisitions had occurred on 1/1/15, including PT Portugal (MEO), Suddenlink, Cablevision (Optimum), NextRadioTV and Altice Media Group France (and excluding Belgium and Luxembourg, Newsday Media Group, Cabovisao, ONI, La Reunion and Mayotte mobile activities as if the disposals occurred on 1/1/15). Segments shown on a pro forma standalone reporting basis, Group figures shown on a pro forma consolidated basis. Financials include only one month of contribution from the insourcing of Parilis and no impact from the insourcing of Intelcia, as the impacts were not material. SFR figures shown including media assets on a pro forma basis (i.e. NextRadioTV and Altice Media Group) 2 “Others” include Green Switzerland, our datacentre operations in France, our content and distribution business, and the non-material, one month contribution of Parilis for the year ended December 31, 2016 (not adjusted in 2015); including corporate revenue of €89.6m in Q4-2016 and €8.4m in Q4-2015

38
€m Q4-15 Q4-16YoY Reported
GrowthYoY Constant
Currency Growth
France 851 954 12.1% 12.1%
US (Optimum) 406 579 42.5% 40.6%
US (Suddenlink) 243 289 19.0% 17.4%
Portugal 245 265 7.8% 7.8%
Israel 107 108 0.8% (1.9%)
Dominican Republic 93 97 4.4% 5.2%
French Overseas Territories 23 26 10.7% 10.7%
Others and Corporate Costs1 6 (32) nm nm
Total Altice N.V. Group Consolidated 1,975 2,286 15.7% 15.1%
ALTICE N.V.PRO FORMA CONSOLIDATED ADJUSTED EBITDA
1 “Others” include Green Switzerland, our datacentre operations in France, our content and distribution business, and the non-material, one month contribution of Parilis for the year ended December 31, 2016 (not adjusted in 2015); corporate costs after intersegment adjustments on a consolidated basis were €52.9m in Q4-2016 and €9.5m in Q4-2015, which includes €41.3m of costs related to strategic services and brand license agreement with Next established in Q4 2016

39
€m Q4-15 Q4-16Q4-16
% Capex to Sales
France1 633 775 26.8%
US (Optimum) 209 191 12.5%
US (Suddenlink) 105 108 17.7%
Portugal 97 126 21.8%
Israel 64 79 32.0%
Dominican Republic 36 28 14.8%
French Overseas Territories 19 17 29.6%
Others and eliminations2 8 (7) nm
Total Altice N.V. Group Consolidated 1,171 1,318 21.6%
ALTICE N.V.PRO FORMA CONSOLIDATED CAPEX
1 Excluding spectrum capex of €477m in France in Q4-20152 “Others” include Green Switzerland, our datacentre operations in France, our content and distribution business, and the non-material, one month contribution of Parilis for the year ended December 31, 2016 (not adjusted in 2015)

40
€m FY 15 FY 16YoY Reported
GrowthYoY Constant
Currency Growth
France 11,503 11,170 (2.9%) (2.9%)
US (Optimum) 5,686 5,842 2.7% 2.5%
US (Suddenlink) 2,181 2,325 6.6% 6.3%
Portugal 2,347 2,312 (1.5%) (1.5%)
Israel 923 955 3.5% 2.0%
Dominican Republic 695 718 3.3% 5.2%
French Overseas Territories 196 216 10.2% 10.2%
Others and Intersegment Adjustments1 42 (15) nm nm
Total Altice N.V. Group Consolidated 23,574 23,522 (0.2%) (0.3%)
ALTICE N.V.PRO FORMA CONSOLIDATED REVENUE
1 “Others” include Green Switzerland, our datacentre operations in France, our content and distribution business, and the non-material, one month contribution of Parilis for the year ended December 31, 2016 (not adjusted in 2015); including corporate revenue of €170.9m in FY 2016 and €20.4m in FY 2015

41
€m FY 15 FY 16YoY Reported
GrowthYoY Constant
Currency Growth
France 3,895 3,857 (1.0%) (1.0%)
US (Optimum) 1,636 2,005 22.5% 22.2%
US (Suddenlink) 889 1,058 19.0% 18.7%
Portugal 968 1,089 12.5% 12.5%
Israel 431 431 0.1% (1.4%)
Dominican Republic 360 376 4.4% 6.3%
French Overseas Territories 87 93 7.5% 7.5%
Others and Corporate Costs1 28 (10) nm nm
Total Altice N.V. Group Consolidated 8,294 8,899 7.3% 7.2%
ALTICE N.V.PRO FORMA CONSOLIDATED ADJUSTED EBITDA
1 “Others” include Green Switzerland, our datacentre operations in France, our content and distribution business, and the non-material, one month contribution of Parilis for the year ended December 31, 2016 (not adjusted in 2015); corporate costs after intersegment adjustments on a consolidated basis were €89.2m in FY 2016 and €28.8m in FY 2015, which includes €41.3m of costs related to strategic services and brand license agreement with Next established in Q4 2016

42
€m FY 15 FY 16FY 16
% Capex to Sales
France1 1,857 2,324 20.8%
US (Optimum) 784 627 10.7%
US (Suddenlink) 431 323 13.9%
Portugal 331 399 17.3%
Israel 285 314 32.9%
Dominican Republic 124 123 17.2%
French Overseas Territories 51 57 26.4%
Others and eliminations2 31 41 nm
Total Altice N.V. Group Consolidated 3,894 4,208 17.9%
ALTICE N.V.PRO FORMA CONSOLIDATED CAPEX
1 Excluding spectrum capex of €477m in France in FY 20152 “Others” include Green Switzerland, our datacentre operations in France, our content and distribution business, and the non-material, one month contribution of Parilis for the year ended December 31, 2016 (not adjusted in 2015); excluding €44.0m of capitalised exclusive content costs in Portugal for multi-year contracts and €413.8m of capex related to the acquisition of multi-year major sport rights