active pharmacist participation in practice optimization ... · active pharmacist participation in...
TRANSCRIPT

©2014 MFMER | slide-1
Active Pharmacist Participation in Practice Optimization to Decrease Length of Stay:
Enhanced Recovery Pathway
Presented by Jenna K Lovely, PharmD, RPh, BCPS

©2014 MFMER | slide-2
Learning Objectives• Apply the main principles of Enhanced
Recovery Pathway to any area you work• Outline phases of Implementation Science• Characterize how active pharmacist
participation in Practice Optimization leads to achieved improvements in patient care

©2014 MFMER | slide-3
• No disclosures

©2014 MFMER | slide-4
System Thinking and Organizational Learning for Practice Optimization
• Medication Safety• Optimal Medication Management• Efficiency in work• Data
Knowledge Actionable ImprovementsContinuous Learning

©2014 MFMER | slide-5
Discharge Criteria for Colorectal Surgery
• Pain controlled with oral medications• Tolerating solids and no IV fluid needs • Independently ambulatory
(or back to baseline)• Patient has had stool• No suspicion of complications

©2014 MFMER | slide-6
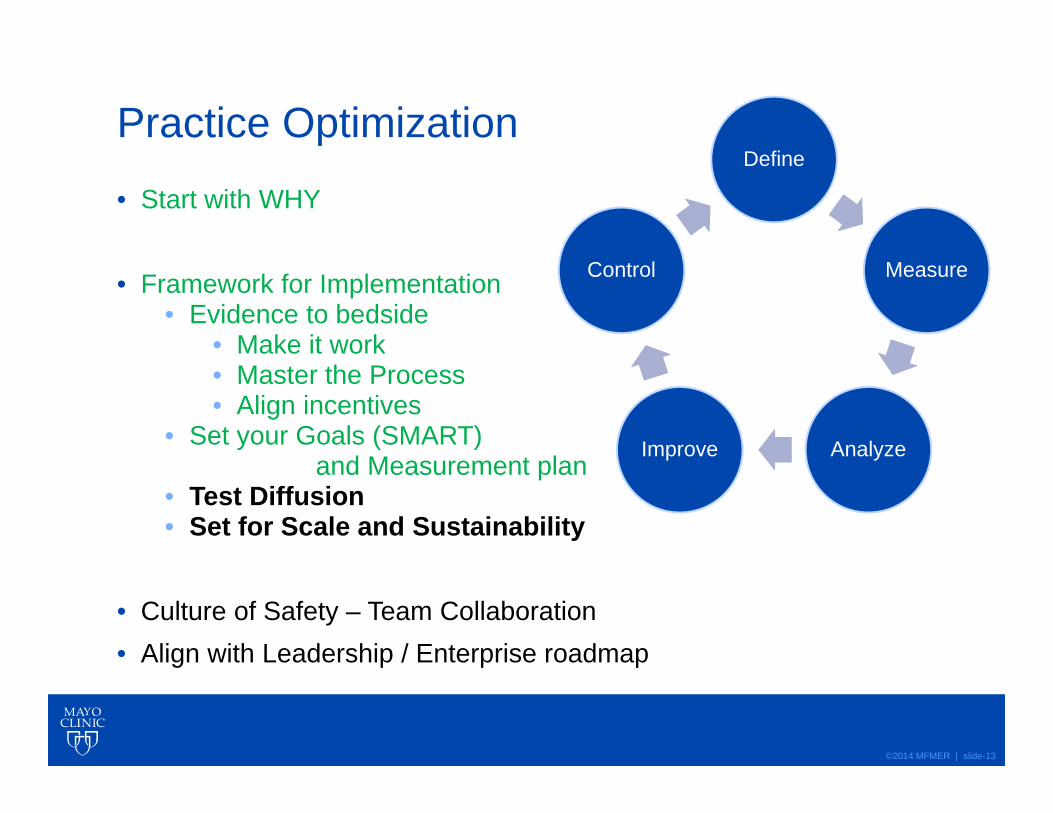
Practice Optimization
• Start with WHY
• Framework for Implementation• Evidence to bedside
• Make it work• Master the Process• Align incentives
• Set your Goals (SMART)and Measurement plan
• Test Diffusion• Set for Scale and Sustainability
• Culture of Safety – Team Collaboration• Align with Leadership / Enterprise roadmap
Define
Measure
AnalyzeImprove
Control

©2014 MFMER | slide-7
Principles of Enhanced Recovery Pathway• Patient (and team) expectations• Multimodal Pain Management• Minimal NPO; Early oral feeding• Euvolemia• Ambulation (early goals back to baseline)• Overall optimization of streamlined standards

©2014 MFMER | slide-8
Accelerated Pathway differences

©2014 MFMER | slide-9
Initial Colorectal Surgery Outcomes
• Decreased LOS• Decreased cost• Same or equivalent complications• Decreased post operative opioid requirements

©2014 MFMER | slide-10
Fluid management under ERP
• Fluid Management ERP FTP• Mean OR volume 2404 3780• Mean PACU volume 396 716• Mean Unit volume 975 3245
All significantly different p<0.001

©2014 MFMER | slide-11
Length of Stay (LOS) ResultsVariable ERP (n=66) FT (n = 66) P valueDischarge on second day after surgery
NumberRate
20(43.9 %)
5(7.6 %) < 0.001
Hospital length of stay (days)
Mean (SD)Median (IQR)
3.26 (1.63)3 (2-10)
4.52 (3.00)4 (2-2.3) < 0.001

©2014 MFMER | slide-12
Results of Case Match ERP vs. FT• Patients achieved two day LOS (44% ERP vs. 8%
FT p<0.001)• Average LOS statistically shorter in ERP group • 30 day complications were not statistically different
between groups• Readmissions were not statistically different
between groups• Opioid requirements were less in the ERP without
increased pain scores
©2014 MFMER | slide-13
Practice Optimization
• Start with WHY
• Framework for Implementation• Evidence to bedside
• Make it work• Master the Process• Align incentives
• Set your Goals (SMART)and Measurement plan
• Test Diffusion• Set for Scale and Sustainability
• Culture of Safety – Team Collaboration• Align with Leadership / Enterprise roadmap
Define
Measure
AnalyzeImprove
Control

©2014 MFMER | slide-14
Measurements after Diffusion:
• November of 2009-Feb 2010 all MIS patient on 2 surgeon services were enrolled in ERP
• 66 ERP case matched to 66 FTP patients• Case matched:
• Surgeon, operation, age
• January through July 2011 all MIS surgery at Mayo• Prospective monthly reviewed data base• 396 ERP compared to 177 FTP

©2014 MFMER | slide-15
Enhanced recovery pathway (ERP)
• Data included all ERP colorectal surgery patients in 2011 with research authorization (n=535)
• Minimally invasive surgery• ERP elements
• Pre-op (analgesia)• Intra-op (analgesia, fluid balance) • Post-op (analgesia, diet and fluid
management, optimal pain control, ambulation)

©2014 MFMER | slide-16
Compliance in 2011,Minimally Invasive Surgery (MIS)
ERP pathway elementsCompliance; overall % (range across surgical
teams)Gabapentin (n=420) 92.9 (87-96)Celecoxib (n=349) 82.5 (69-87)Intrathecal 83.9 (76-93)NSAIDS 87.1 (79-93)Acetaminophen 99.3(98-100)Diet management 85.6 (78-93)Postoperative fluid management 82.4 (71-95)
Compliance with individual ERP pathway elementsNSAIDs, Non-Steroidal Anti-inflammatory Drugs
Submitted for publication Larson and colleagues 2013

©2014 MFMER | slide-17
Patient ComplexityComorbidities
0.0%
5.0%
10.0%
15.0%
20.0%
25.0%
30.0%
35.0%
40.0%

©2014 MFMER | slide-18
GI recovery and LOS: ERP vs. FTInitial: 66 vs 66 pts• Return of Bowel function 1 vs. 2 days p<0.001• LOS Median (days) 3 vs. 3 p<0.001• LOS Mean (days) 3.1 vs. 4.4 p<0.001• DC on day 2 44% vs. 8% p<0.001
Larger Trial: 396 vs 177 pts• Return of Bowel function 2.1 vs. 2.5 p<0.04• LOS Median 3 vs. 4 p<0.01• LOS Mean 3.8 vs. 4.75 p<0.01• DC on day 2 38% vs. 5% p<0.001

©2014 MFMER | slide-19
Complications: ERP vs. FT• Initial: 66 vs 66 pts• All complications 36% vs. 45% P=NS• ARF 1% vs. 1% P=NS• Ileus 9% vs. 12% P=NS• Leak/abscess 2.3% vs. 1.9% P=NS• Re-admission 15% vs.7.6% P=NS
• Larger Trial: 396 vs 177 pts• All complications 30% vs. 40% P<0.05• ARF 1% vs. 1% P=NS• Ileus 13% vs. 13% P=NS• Leak/abscess 3% vs. 1.9% P=NS• Re-admission 10.8% vs.12.3% P=NS

©2014 MFMER | slide-20
Pain control with ERP• First study
• ERP achieved Goal Pain Score• 80 vs 60% of the time
• 38 OME/day vs 182 OME/day
• Larger study in 2011• ERP achieved Goal Pain Score
• 80 vs 55% of the time• 161 OME/Day vs 301 OME Day
All statistically significant p<0.01, <10% of patient required a PCA

©2014 MFMER | slide-21
Colorectal Surgery Length of Stay
Observed Rate: 17.74%Expected Rate: 17.63%
O/E Ratio: 1.01Status: As Expected

©2014 MFMER | slide-22
Colorectal Surgery Length of Stay
Observed Rate: 14.67%Pred. Obs. Rate:16.46%Expected Rate:20.99%Odds Ratio: 0.71Status: Non-Outlier
©2014 MFMER | slide-23
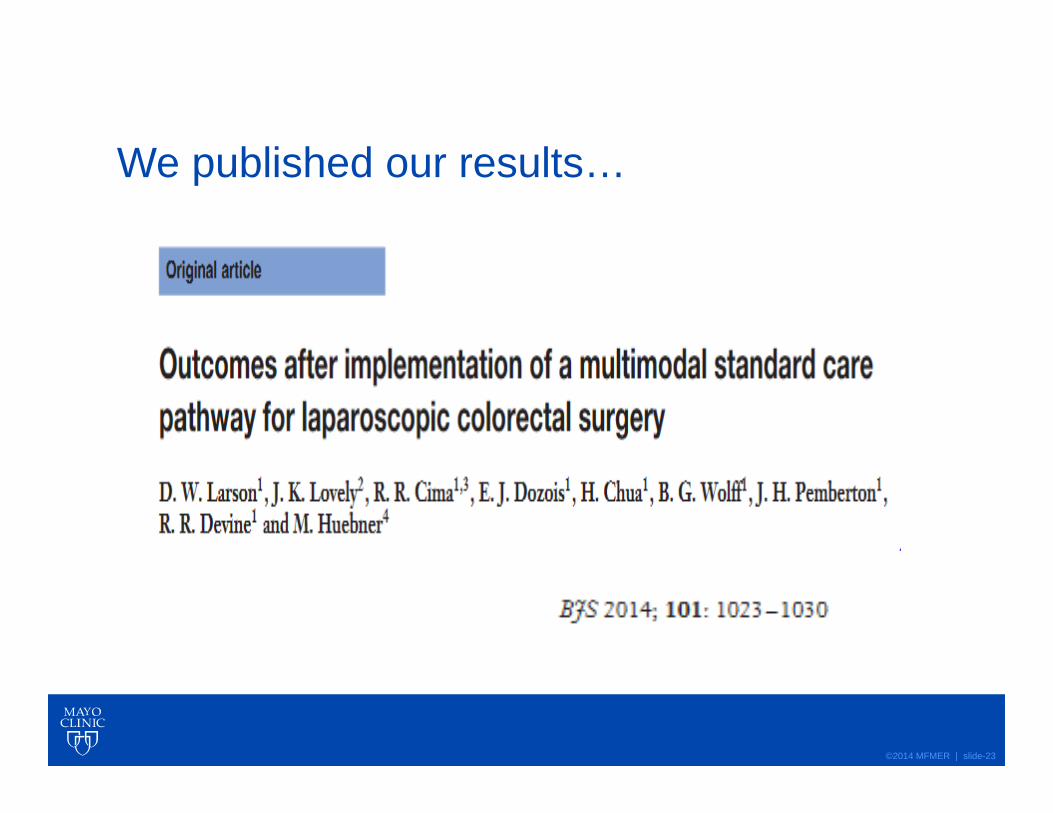
We published our results…

©2014 MFMER | slide-24
Which is NOT a key principle of Enhanced Recovery Pathway?a. Multimodal Pain Managementb. Early feedingc. Dehydratione. Ambulation (early goals back to baseline)

©2014 MFMER | slide-25
Answer:c. Dehydration is NOT a principle of Enhanced Recovery Pathway
EUVOLEMIA is the key principle related to fluid management.

©2014 MFMER | slide-26
Practice Optimization
• Start with WHY
• Framework for Implementation• Evidence to bedside
• Make it work• Master the Process• Align incentives
• Set your Goals (SMART)and Measurement plan
• Test Diffusion• Set for Scale and Sustainability
• Culture of Safety – Team Collaboration• Align with Leadership / Enterprise roadmap
Define
Measure
AnalyzeImprove
Control

©2014 MFMER | slide-27
Improvements continued

©2014 MFMER | slide-28
Enhanced Recovery Pathway 2013

©2014 MFMER | slide-29
Multiple PDSAs used in Team Huddles where Opportunities exist• Data reviewed for timeframe• Areas for Improvement agreed to by team• Expectations set or reset for team members• Coaching and Case based learning examples
shared.• Examples: Diet, Fluid overload, Scheduled
meds omitted

©2014 MFMER | slide-30
Optimal pain management – Lessons learned• Patients with optimal pain management recover
better• LOS lower• Opioid requirements lower• Complications lower and/or recognized
sooner• Comfort goal for every patient helpful • If the ERP standards are not meeting the patients
needs• Re-assessment by team• Follow through needs to occur until either
new diagnosis and/or patient satisfaction needs met

©2014 MFMER | slide-31
Example of Ongoing Expectation Setting• Within Enhanced Recovery Pathway
• 60 % of patients will only require 30 mg oral morphine equivalents in first two days
• 50 % of MIS patients are candidates for dismissal on Day 2 (30% for open)
• 90 % of MIS patients are candidates for dismissal by Day 3 (65 % for open)
• When patients seem ‘off’ pathway, investigate

©2014 MFMER | slide-32
Three days and beyond…• Reassessment
• Dismissal issues and/or what Issue/Complication ?
• Logistics?• Examples…

©2014 MFMER | slide-33
Minimizing Variation led to…• Tracking of issues to look for actionable patterns• Prioritized by using Impact Grid for assessment

©2014 MFMER | slide-34
Goals of Practice Optimization – ERP is one• Minimize unnecessary variation
• Minimize delays• Minimize waste• Improve clear, concise communication
• Minimize ‘surprise’ and ‘chaos’ by maximizing collective knowledge
• Teach and Train so that every time is not the ‘first time’
• Teach and Train probabilities• Be prepared and/or avoid next• Once one complication, likelihood for another

©2014 MFMER | slide-35
Further Diffusion: Scale and Sustainability• GYN• Plastics • Other Surgical and Medical Practice Initiatives• Provider Network CRS 2015-2016; 8 hospitals
• Consistent results… lower LOS, lower opioid use…same or fewer complications
• Provider Network GYN 2016-2017; TBD• Reassessment with CRS Mayo ongoing…

©2014 MFMER | slide-36
Practice Optimization
• Start with WHY
• Framework for Implementation• Evidence to bedside
• Make it work• Master the Process• Align incentives
• Set your Goals (SMART) and Measurement plan• Test Diffusion• Set for Scale and Sustainability
• Culture of Safety – Team Collaboration• Align with Leadership / Enterprise roadmap
Define
Measure
AnalyzeImprove
Control

©2014 MFMER | slide-37
Framework for Implementation: Make it work• Refinement of the process in one area
• Document the methodology• Vet it over and over until 1 patient error free and no do overs or
prompts required
• Teach others • Five people can get to error free with the above methodology
without do overs or prompts required
• Audit process for 12 patients at a time• Refine until > 95 % accuracy without do overs/prompts
Preoperative Intraoperative Postoperative Postoperative Review
Dismissal or New
Diagnosis?

©2014 MFMER | slide-38
Framework for Implementation: Goal setting• All workflow actions supported and transparent
to the team• Awareness of patients that need attention• Status of the Enhanced Recovery Pathway
and Patient Outcomes• Documentation of the principled variation
• Aligned with institutional priorities and roll out plan
• SMART goals with transparent measures

©2014 MFMER | slide-39
SMART goals as one method
S• SPECIFIC: state exactly what you want to accomplish (who,
what, when, where, why)
M• MEASURABLE: how will you measure, evaluate and describe
to what extent each goal will be met?
A• ACHIEVABLE: is it possible as a stretch goal? do we have
control/influence over it?
R• REALISTIC/RELEVANT: is this goal recorded and relevant to
the business right now? Can we do it? Link it to overall goals
T• TIME – BASED: what is a reasonable timeframe to achieve?

©2014 MFMER | slide-40
Framework for Implementation: Test Diffusion• Prove it works for more than one group• Test all aspects of Diffusion
• Process• Training Method• Metric / Audit plan• Feedback loops
Trust but verify… R. Reagan

©2014 MFMER | slide-41
Framework for Implementation: Sustainability• Build for Scale, Support and Sustainability
• Business Plan for Diffusion• Business Plan for ‘Sustaining the Gains’• Systems thinking Build
• ‘hard wiring’, ‘systematizing’, making it ‘the way we work’
• Continuous Feedback/Learning System• Performance Feedback/Audits for quality• Metrics and Monitoring (Control plan)• Meaningful action steps from leaders• Reassessment plan for Refine/Improve

©2014 MFMER | slide-42
Scale and Sustainability• Business plan
• Expected ROI from lower LOS, reduced med costs, improved outcomes…
• Pharmacist FTE and corresponding workload stats and changes in Staffing process for ability to be present for rounds
• Process commitment culturally and technically• Timelines Set• Ongoing assessments

©2014 MFMER | slide-43
Do what you can, with what you have, where you are… T. Roosevelt

©2014 MFMER | slide-44
What are key phases of Implementation Science?a. Making it work… culture, processes people for taking evidence to bedsideb. Setting your Goals (SMART) and Measurement planc. Testing Diffusiond. Setting for Scale and Sustainabilitye. All of the above

©2014 MFMER | slide-45
Answer:e. All of the above

©2014 MFMER | slide-46
Active Pharmacist participation in Practice Optimization achieves improvements in Patient Care
• Decreases in Length of Stay• Optimizing multimodal pain management and
reducing opioid requirements• Increases transparency on system issues for
further improvement• Increases opportunities for multidisciplinary
research, quality improvement publications that further advance the science

©2014 MFMER | slide-47
Taking this back to your Work Unit
• Start with WHY
• Framework for Implementation• Evidence to bedside
• Make it work• Master the Process• Align incentives
• Set your Goals (SMART) and Measurement plan• Test Diffusion• Set for Scale and Sustainability
• Culture of Safety – Team Collaboration• Align with Leadership / Enterprise roadmap
Define
Measure
AnalyzeImprove
Control

©2014 MFMER | slide-48
Questions & DiscussionThank you for your interest.
Jenna K Lovely, PharmD, RPh, [email protected]

©2014 MFMER | slide-49

©2014 MFMER | slide-50
What we are still working on… • Innovation to automate• Innovation to improve efficiency and outcomes• Culture around practice optimization and
transparency of data• Coaching and Mentoring for excellence• Understanding and improving feedback
loops• Research for next best practices and other
areas of improvements