a model for prioritization of public health programs · appendix 10a. amenability to improve risk...
TRANSCRIPT
A Model for Prioritization of Public Health Programs
Eduardo Simoes, M.D., M.Sc., M.P.HAli Mokdad, PhD
5th International BRFSS Conference
October 24-26, 2007

A Model for Prioritization of Public Health Programs
With Applications to the Missouri Department of Health, Division of Chronic Disease Prevention and
Health Promotion

Public Health Prioritization
• Allocation of Constrained Resources– What are the health priorities?– What are the risk or preventive factors?– What interventions are available?– Which are the most cost-effective?– How do critically evaluate these questions
using scientific evidence?
Public Health PrioritizationHow has public health resource allocation
been performed in the past?1. It is the status quo-funding is available;2. Emotionally driven - policy maker suffer from
conditions3. Funding becomes available – vertical programs4. Expected burden based on population size – best
scenario
Can we do Better?
Previous decision-making models and indicators
• Multiple Criteria Models (Mosley, et al)– Burden of disease, Cost-effectiveness,
Health System Strengths• Comprehensive Model (Vilnius and
Dandoy, 1990)• DALY’s (Murray, et al)• QALY’s (Stone, et al)
Public Health Prioritization
A comprehensive model (Vilnius and Dandoy, 1990)
• Size of the problem• Seriousness of the problem• Effectiveness of potential interventions• “P.E.A.R.L”
The Future of Public Health, IOM 1988
“…every public health agency (to) exercise its responsibility to serve the public interest in the development of comprehensive public health policies by promoting use of the scientific knowledge base in decision-making about public health.”

Public Health Prioritization
• Need a systematic and objective approach to public health resource prioritization.
• Much like clinical and preventive medicine, Public Health prioritization should move towards more evidence-based practice.

Possible Models• Three Possible Models
– Model 1—Ranks All Diseases *– Model 2—Ranks Eleven Major Chronic Diseases– Model 3—Ranks Sixteen Risk Factors
• Presenting Model 3 – BRFSS Prioritization Model
• * Simoes EJ et al. J Public Health Management Practice, 2006, 12(2), 161–168
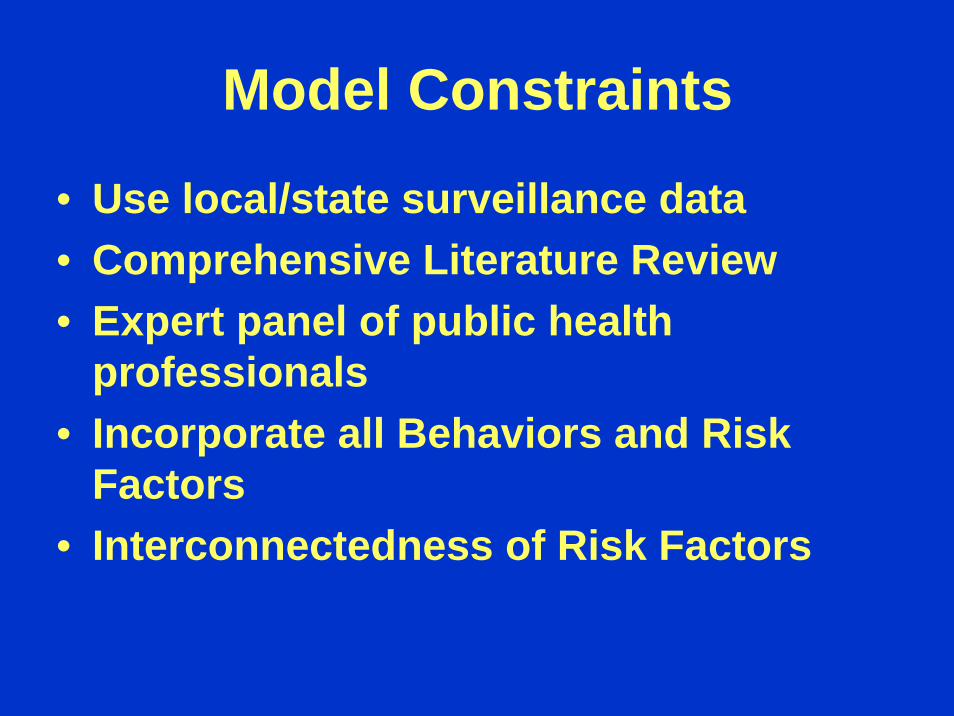
Model Constraints
• Use local/state surveillance data• Comprehensive Literature Review• Expert panel of public health
professionals• Incorporate all Behaviors and Risk
Factors• Interconnectedness of Risk Factors
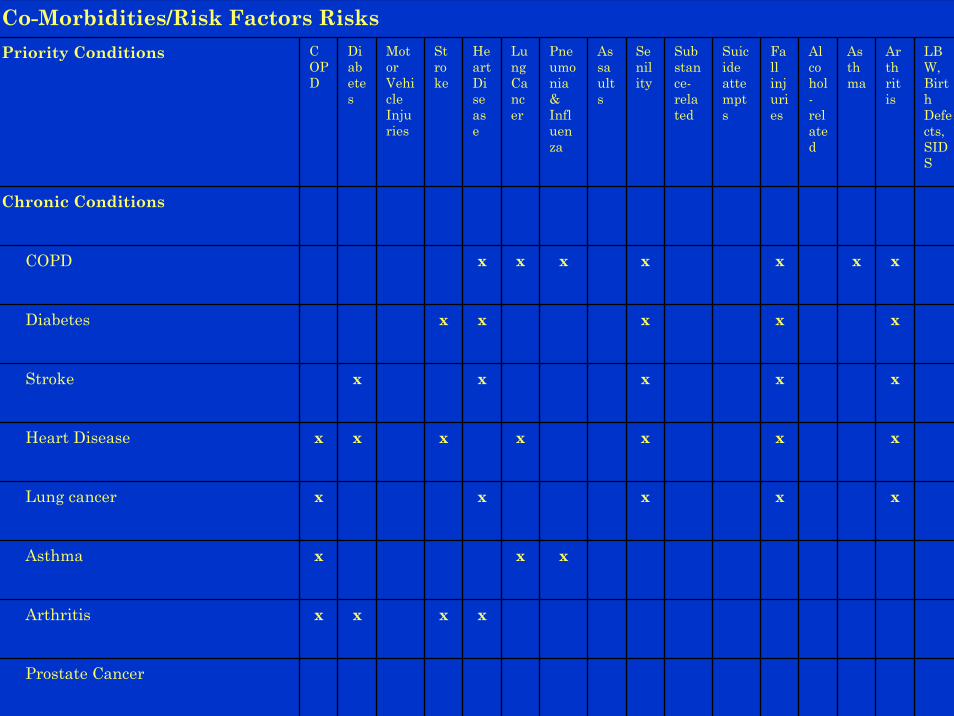
Co-Morbidities/Risk Factors RisksPriority Conditions C
OPD
Diabetes
Motor Vehicle Injuries
Stroke
Heart Disease
Lung Cancer
Pneumonia & Influenza
Assaults
Senility
Substance-related
Suicide attempts
Fall injuries
Alcohol-related
Asthma
Arthritis
LBW, Birth Defects, SIDS
Chronic Conditions
COPD x x x x x x x
Diabetes x x x x x
Stroke x x x x x
Heart Disease x x x x x x x
Lung cancer x x x x x
Asthma x x x
Arthritis x x x x
Prostate Cancer

Health Risk Factors in Missouri
Priority Disease/Condition
Smoking ExcessiveAlcoholIntake
NutritionImbalance
Obesity SedentaryLifestyle
Environmental
Pollutants
Chronic Diseases/ConditionsCOPDDiabetesStrokeHeart diseaseLung cancerAsthmaArthritisProstate Cancer
Mental Health Diseases/ConditionsSubstance-related conditionsSuicide attemptsSenilityAlcohol-related conditions
InjuriesMotor-vehicle injuriesAssaultsFall injuries
Infant Health ConditionsInfectious Diseases
Pneumonia & Influenza

The BRFSS Prioritization Model:Sixteen Risk Factors
• Smoking• Physical Activity• Obesity• < 5 a Day
Fruits/Vegetables• No Pap Smear• No Mammogram• No CBE• No
Rectosigmoidoscopy
• No FOBT• No BP Screening• No Cholesterol
Screening• Hypertension• High cholesterol• Diabetes• Dietary Fat• Low Education (<12)
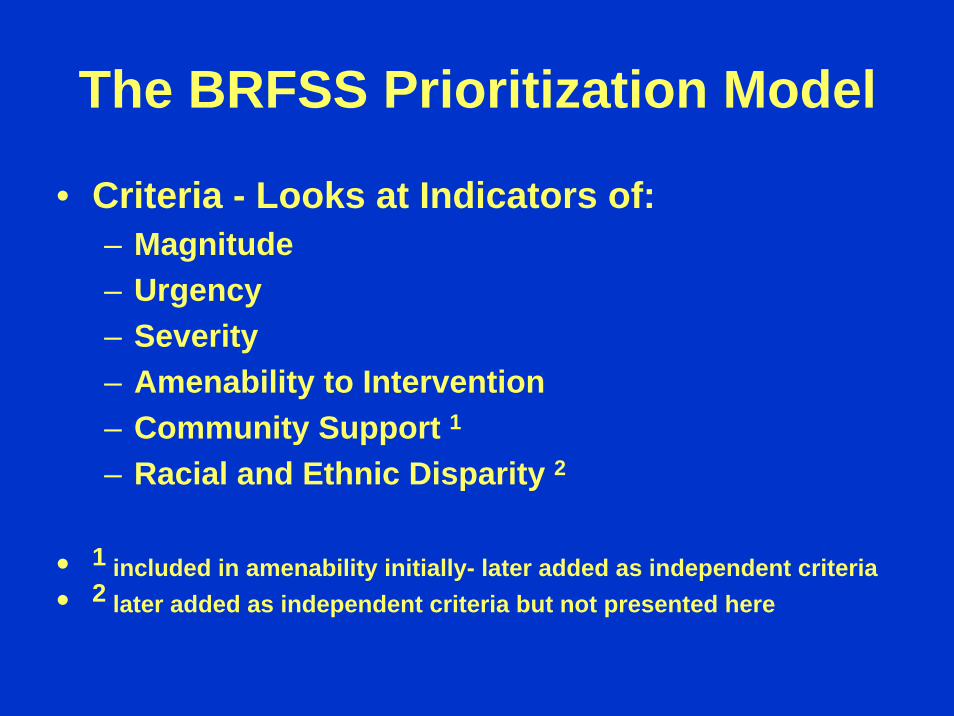
The BRFSS Prioritization Model
• Criteria - Looks at Indicators of:– Magnitude– Urgency– Severity– Amenability to Intervention– Community Support 1– Racial and Ethnic Disparity 2
• 1 included in amenability initially- later added as independent criteria• 2 later added as independent criteria but not presented here
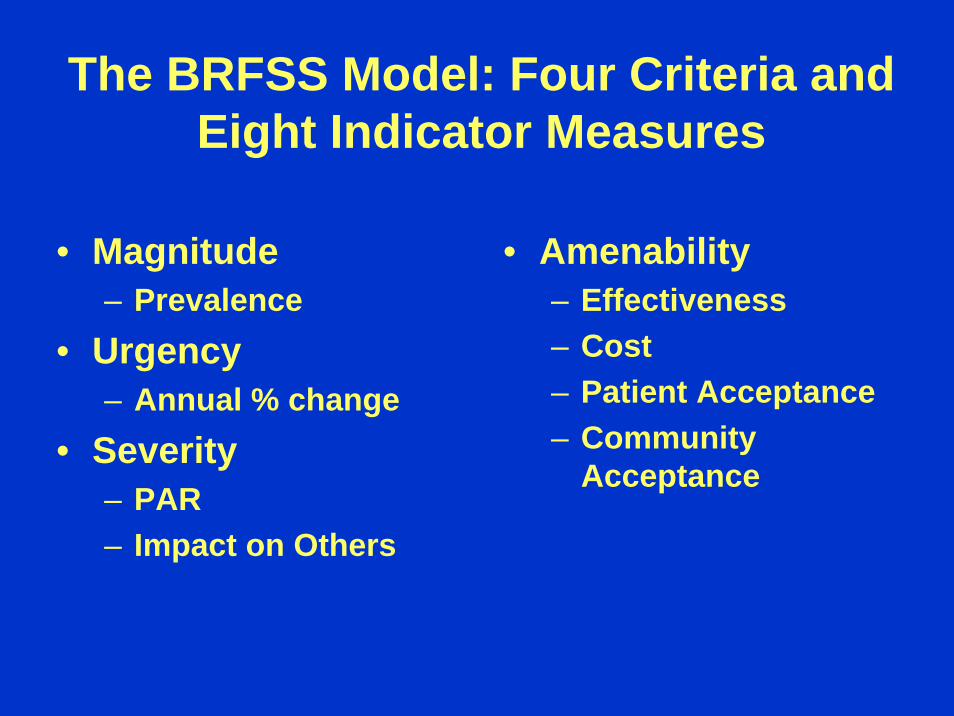
The BRFSS Model: Four Criteria and Eight Indicator Measures
• Magnitude– Prevalence
• Urgency– Annual % change
• Severity– PAR– Impact on Others
• Amenability– Effectiveness– Cost– Patient Acceptance– Community
Acceptance

Methods to our Madness: Missouri 1999
Criteria Magnitude Urgency Severity Amenability
Indicators • Mortality rate • Prevalence rate • Incidence rate • YPLL • Proportion of
mortality in population <65
• Incidence rate • Percent change
in Mortality • Percent
change in Prevalence
• Percent change in Incidence
• Case Fatality Rate
• Ratio of Mortality by Incidence
• Ratio of Mortality by Prevalence
• PAR • Potential to
Impact Others
• Availability • Effectiveness• Cost • Patient
Acceptance • Community
Acceptance
Source • BRFSS • DDM1 • MO Annual
Cancer Report • DISMOD • CDC Wonder
• DDM1 • CDC Wonder • BRFSS • MO Obesity
Red Surv • MO Nutr Surv
• Combining Magnitude and Urgency
• Lit Review • Expert Panel
• Lit Review • Expert Panel• Focus Group

Appendix 7. Magnitude of Risk Factor Risk Factor Prevalence Rank
Didn’t consume at least 5 fruits/vegetables a day
80 1
No FOBT (50+/2 years) 75 2 No Rectosigmoidoscopy (50+) 62 3
Obesity (by BMI) 35.5 4 Hypercholesterolemia (Ever told
cholesterol was high) 30.2 5
No Cholesterol Screening (Never had a cholesterol check)
29.7 6
Physical Activity (No LTPA) 27.9 7 Smoking (Current smoker) 27.1 8
No CBE (50+/2 years) 26.5 9 No Mammogram (50+/2 years) 25.7 10
Hypertension (Ever told BP was high)
24.6 11
Hypertension (Ever told BP was high)
22 12
No Pap smear in last 3 years 15.4 13 Dietary Fat 12 14
Diabetes (Ever told had diabetes) 6.1 15 No Blood Pressure Screening (In
last two years) 4.9 16

Appendix 8. Urgency of Risk Factor Risk Factor Annual Percent
Change (DDM2) Rank
Smoking (Current smoker) -0.3 11 Physical Activity 0.1 14
Obesity 5.1 16 Didn’t consume at least 5 fruits/vegetables a
day -2.1 6
No Pap smear in last 3 years -2.4 5 No Mammogram (50+/2 years) -3.8 2
No CBE (50+/2 years) -0.2 12 No Rectosigmoidoscopy (50+) -3.5 3
No FOBT (50+/2 years) 0 13 No Blood Pressure Screening (In last two
years) -0.4 10
No Cholesterol Screening (Never had a cholesterol check)
-2.0 7
Hypertension (Ever told BP was high) 1.6 15 Hypercholesterolemia (Ever told cholesterol
was high) -0.3 12
Diabetes (Ever told had diabetes) -1.9 8 Dietary Fat -3.2 4
Low Education (<12 years) -0.62 9
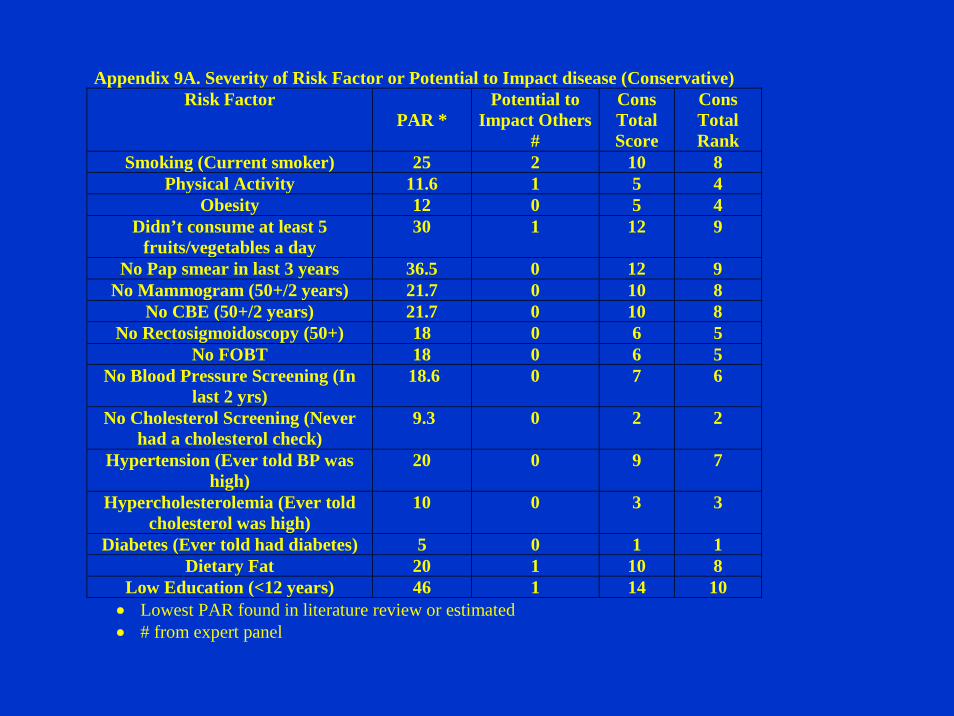
Appendix 9A. Severity of Risk Factor or Potential to Impact disease (Conservative) Risk Factor
PAR * Potential to
Impact Others #
Cons Total Score
Cons Total Rank
Smoking (Current smoker) 25 2 10 8 Physical Activity 11.6 1 5 4
Obesity 12 0 5 4 Didn’t consume at least 5
fruits/vegetables a day 30 1 12 9
No Pap smear in last 3 years 36.5 0 12 9 No Mammogram (50+/2 years) 21.7 0 10 8
No CBE (50+/2 years) 21.7 0 10 8 No Rectosigmoidoscopy (50+) 18 0 6 5
No FOBT 18 0 6 5 No Blood Pressure Screening (In
last 2 yrs) 18.6 0 7 6
No Cholesterol Screening (Never had a cholesterol check)
9.3 0 2 2
Hypertension (Ever told BP was high)
20 0 9 7
Hypercholesterolemia (Ever told cholesterol was high)
10 0 3 3
Diabetes (Ever told had diabetes) 5 0 1 1 Dietary Fat 20 1 10 8
Low Education (<12 years) 46 1 14 10 • Lowest PAR found in literature review or estimated • # from expert panel

Appendix 11. Population Attributable Risk (PAR) Risk Factor PAR and Related Disease Smoking (Current smoker) 87% Lung Cancer
90% COPD 45.5 IHD
25% Stroke 32%Cervical Cancer 26% Diabetes
Physical Activity 43% Stroke
23.5% Colon Ca 24.5% IHD 11.6% Breast Ca 24% Diabetes
Obesity 49% Diabetes 12% Breast Ca 23% IHD 46% Stroke 23% Hypertension 32.5% Colon 22.5% OA
Didn't consume at least 5 fruits/vegetables a day
30% Colon Ca
No Pap smear in last 3 years 36.5% Cervical Ca No Mammogram (50+/2 years) 21.7% Breast Ca

Appendix 10A. Amenability to Improve Risk Factor (Using Conservative values for
Effectiveness and Unit Cost)
Risk Factor Effectiveness of Improving Risk Factor
Unit Cost
Patient Acceptance
Community Acceptance
Amenability Total Score
Amenability Final Rank
Smoking (Current smoker)
5-25% $6-30 1 2 12 3
Physical Activity
14.3-50% $10-400
1 3 17 7
Obesity 14.3% $30 1 2 14 5
Didn’t consume at
least 5 fruits/vegetabl
es a day
9.6% $6-17 2 3 16 6
No Pap smear in last 3 years
30% $30-47 3 3 20 9
No Mammogram (50+/2 years)
47% $50-125
2 3 19 8

Table 3A. Summary Ranking of Criteria by Risk Factor (Conservative)-selected factors
Risk FactorMagnit
ude Score
Urgency Score
Conservative
Severity Score
Conservative Amenability
Score
Summary Score
Smoking (Current smoker)
9 11 8 3 31
Physical Activity 10 14 4 7 35
Obesity 13 16 4 5 38

Table 4A: Final Ranking of Risk Factors (Conservative)- 1999
Ranking from Highest to Lowest Priority
Risk Factor
1 No FOBT
2 Obesity & No CBE
3 <5 Fruits/Vegetables
4 Physical Activity
5 Hypertension & Smoking
6 Hypercholesterolemia
7 No PAP
8 Low Education & No Mammogram
9 No Rectosigmoidoscopy & Dietary Fat
10 No Cholesterol Screening
11 No BP Screening
12 Diabetes
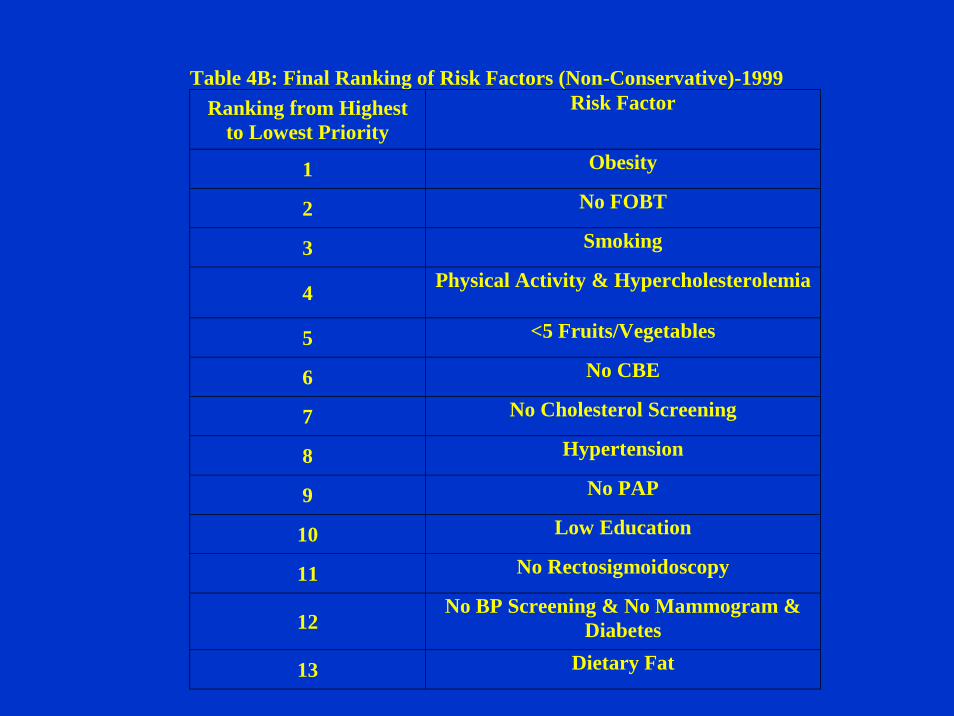
Table 4B: Final Ranking of Risk Factors (Non-Conservative)-1999 Ranking from Highest
to Lowest Priority Risk Factor
1 Obesity
2 No FOBT
3 Smoking
4 Physical Activity & Hypercholesterolemia
5 <5 Fruits/Vegetables
6 No CBE
7 No Cholesterol Screening
8 Hypertension
9 No PAP
10 Low Education
11 No Rectosigmoidoscopy
12 No BP Screening & No Mammogram &
Diabetes
13 Dietary Fat

Table 4C: Final Ranking of Risk Factors (Weighed Conservative and Non-Conservative)- 1999
Ranking from Highest to Lowest Priority
Risk Factor
1 No FOBT, Obesity
2 Smoking & <5 Fruits/Vegetables & No CBE
& Physical Activity
3 Hypercholesterolemia
4 Hypertension
5 No PAP
6 No Cholesterol Screen
7 Low Education
8 No Mammogram & No Rectosigmoidoscopy
9 Dietary Fat
10 No BP Screening
11 Diabetes

Budget Summary, Missouri State Fiscal Year 1999
Breast and Cervical Cancer 2,330,453
CVD 1,303,662
Tobacco Use Prevention 1,113,392
Cancer Surveillance 666,050
Arthritis 376,370
Diabetes 252,523
Nutrition 155,330
CVD Surveillance 74,669
Other Cancer Activities 33,388
Prostate Cancer 30,341
Total Administration 989,070
Total 7,169,918
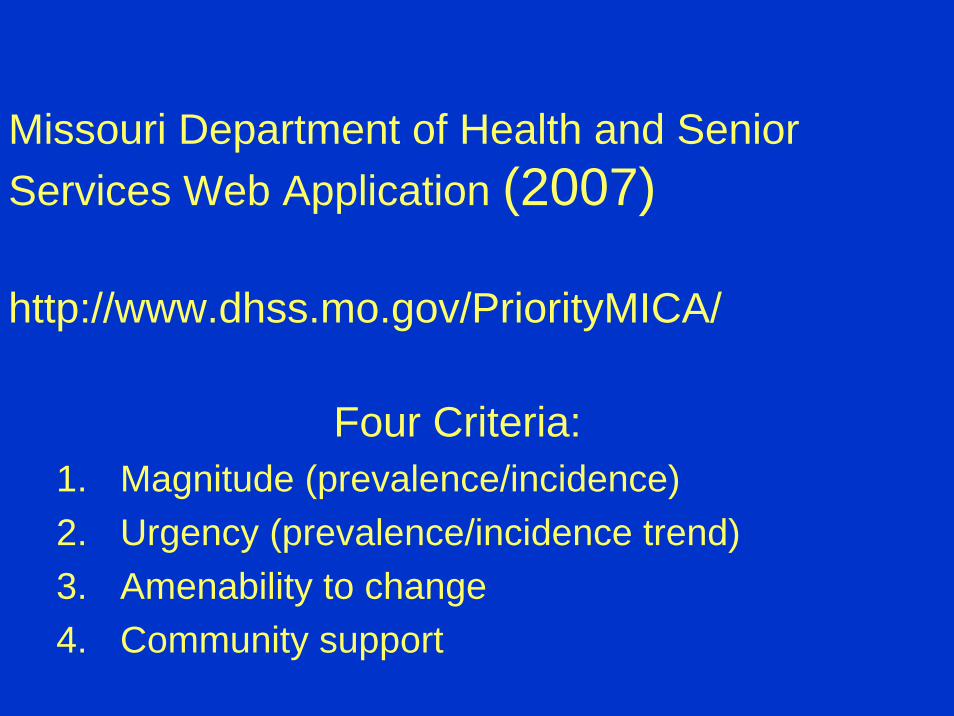
Missouri Department of Health and Senior Services Web Application (2007)
http://www.dhss.mo.gov/PriorityMICA/
Four Criteria:1. Magnitude (prevalence/incidence)2. Urgency (prevalence/incidence trend)3. Amenability to change4. Community support

Prioritization of Selected Risk Factors in Missouri
Sex: Both Sexes, Race: All Races, Age Group: All Ages
Risk Factor Rank Total WeightNo Exercise 1 65.5
Obesity 2 63.5Mother Overweight 3 58.5No Mammography 4 56.0No Cervical Cancer Screening 5 53.0
Smoking 6 50.5Out-of-Wedlock Births 7 48.5High Blood Pressure 8 47.0High Cholesterol 9 46.0
Smoking During Pregnancy 10 42.5Low Birth Weight 11 41.5
Very Low Birth Weight 12 37.5No Health Insurance for ER Visits 13 37.5VLBW Infants Not Delivered in Level III Centers 14 33.0
Mother Underweight 15 30.5Prenatal Care Inadequate 16 30.5
Limitations
• Use only epidemiological measures available in the surveillance system
• Infectious disease condition will always rank low because risk factors not available
• Economic burden not included• Limited knowledge on intervention effectiveness• Community support measure is arbitrary

30
Prevention Center Program Web Site
www.cdc.gov/prc