reactive power compensation in a steel industrial plant with several operating electric arc furnaces...
TRANSCRIPT
EUROPEAN TRANSACTIONS ON ELECTRICAL POWEREuro. Trans. Electr. Power 2011; 21:824–838Published online 21 July 2010 in Wiley Online Library (wileyonlinelibrary.com). DOI: 10.1002/etep.479
Reactive power compensation in a steel industrial plant withseveral operating electric arc furnaces utilizing open-loop
controlled TCR/FC compensators
*C
UnyE-
Co
Arash Dehestani Kolagar*,y, Arash Kiyoumarsi,Mohhamad Ataei and Rahmat Allah Hooshmand
Department of Electrical Engineering, Faculty of Engineering, University of Isfahan, Isfahan, Iran
SUMMARY
Electric arc furnaces (EAFs) produce voltage fluctuations and flicker because of the reactive powersevere variations. Furthermore, these loads absorb a large amount of reactive power. The static VArcompensators (SVCs) have been widely used by the industrial customers with arc furnaces tocompensate the reactive power due to the quick response of the power electronic devices. In thispaper, reactive power compensation in the steel industrial plant with several EAFs by utilizing open-loopcontrolled thyristor controlled reactor/fixed capacitor (TCR/FC) compensator is performed. The TCR/FC compensator is usually applied in conventional steel making plants; one is in Mobarakeh/ Isfahan,Iran which is considered as the case study in this paper. Simulation results show that, although open-loopcontrolled TCR/FC is effective for compensating reactive power, it cannot efficiently compensatethe fluctuations of the reactive power and reduce the flicker intensity. Copyright # 2010 John Wiley &Sons, Ltd.
key words: electric arc furnace; open-loop controlled TCR/FC; flicker intensity
1. INTRODUCTION
The electric arc furnace (EAF) is considered as a nonlinear and erratic load; it creates a series of
adverse effects to the power grid such as three-phase unbalance of the power grid, negative sequence
current, high order harmonics, severe voltage distortion, serious flicker, and low power factor. EAF
compensation is usually performed using static VAr compensators (SVCs). Though, these devices
are effective in mitigating flicker whenever controlled properly, their performance is limited due to
inherent delays and their harmonics generation.
A control method for the thyristor controlled reactor/fixed capacitor (TCR/FC) was presented to
improve the dynamic response using a fast detection method [1]. This method is based on the
substitution of conventional filtering by an efficient, faster, and simpler process with a lower
computational burden and it guarantees that the compensation process will perform within 1=4 cycle ofthe fundamental period of the line voltage.
On the other hand, a solution of obtaining an optimum flicker reduction at a comparatively
low compensator power rating by an anti-windup extension of the controller is presented in
Reference [2]. The dimensioning of a SVC for a steel plant grid with several operating EAF,
taking the economic dimensioning of the compensator into account, is also demonstrated in
this paper.
orrespondence to: Arash Dehestani Kolagar, Department of Electrical Engineering, Faculty of Engineering,
iversity of Isfahan, Isfahan, Iran.
mail: [email protected]
pyright # 2010 John Wiley & Sons, Ltd.
REACTIVE POWER COMPENSATION IN A STEEL INDUSTRIAL PLANT 825
Some researches proposed a hybrid control and compensation system that allows an
optimal tradeoff in performance and system cost, while providing high efficiency and
reliability [3]. The solution is a thyristor-based series controller coupled with a high performance
shunt compensator.
The voltage fluctuation problem of a large steel plant in Taiwan was investigated in Reference [4]
and the mitigation strategy by applying the SVC and cogenerator was presented. In the mentioned
paper, it is understood that the dynamic load behavior of the EAF in the isolated industrial power
system can well be compensated by the cogenerator with adaptive control of exciter and governor to
generate proper reactive power and real power according to the fluctuation of the bus voltage and the
system frequency, respectively.
In this paper, an industrial steel-making plant with several operating arc furnaces, which
was previously installed in Mobarakeh, Isfahan, Iran, is considered for study. This plant has eight
three-phase EAFs supplied via four three-winding three-phase, core-typed transformers. In this
study, for simplicity and software capability limitations, four single-phase EAFs are considered
at the point of common coupling (PCC). The system characteristics, such as cable impedances,
system layout, the style of compensator connections to the PCC, are modeled similar to that of
existing plant. According to the prescribed plant, open-loop controlled TCR/FC is applied for
reactive power compensation. In order to evaluate its effects, the system was simulated by means
of power system analyzer software. Simulation results indicate that although reactive power of
the EAF is almost compensated, open-loop controlling of the SVC cannot effectively suppress the
flicker phenomenon.
At a detailed glance, Section 2 commences to explain the modeling of the steel-making plant.
Different operating stages of EAFs, such as scrap, melting, and refining, can be considered via this
model in simulations. At a glimpse, the open-loop control of the TCR/FC compensator, which is
connected to the PCC and uses reactive power demand of the whole load, is presented in Section 3. The
design procedure of the parameters of the RLC harmonic filters, by which the fundamental component
of the reactive power demand of the load is produced, is comprehensively illustrated in Section 4.
Section 5 explains the main performance of the TCR/FC as a static compensator. In this section, the
idea of the reactive power compensation using switched inductances is briefly brought. Section 6
introduces the description of the flicker, the flicker-meter and the results of instantaneous flicker
sensation curves, and their corresponding cumulative probability function (CPF) curves for several
time instances. The results of instantaneous flicker level (IFL) and CPF for the open-loop control of the
TCR/FC compensator are compared with the one obtained before compensation at PCC. Based on the
Sections 5 and 6, it can be judged that although reactive power at the PCC is more or less compensated,
the flicker problem still exists and the open-loop compensation cannot completely suppress the flicker
phenomenon. It needs to consider closed-loop control method with predictions. The paper ends in
Section 7 with a few conclusions and several suggestions to commence to the new researches based
on these methods.
2. THE ELECTRIC ARC FURNACE MODELING
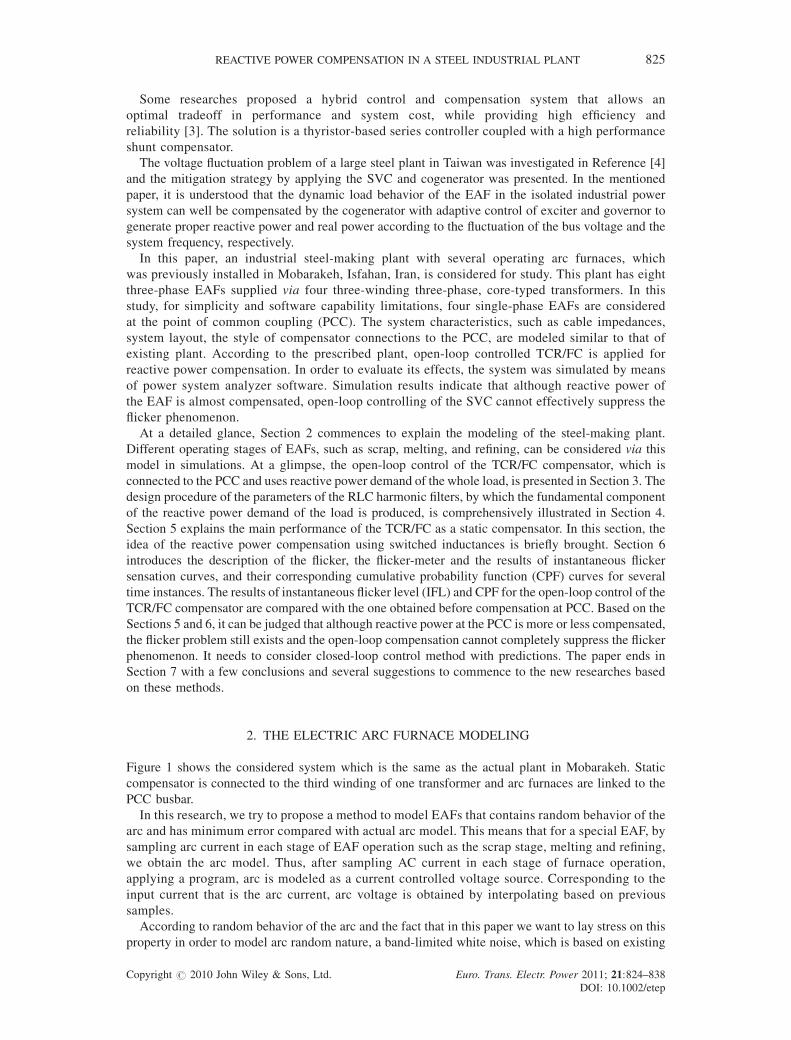
Figure 1 shows the considered system which is the same as the actual plant in Mobarakeh. Static
compensator is connected to the third winding of one transformer and arc furnaces are linked to the
PCC busbar.
In this research, we try to propose a method to model EAFs that contains random behavior of the
arc and has minimum error compared with actual arc model. This means that for a special EAF, by
sampling arc current in each stage of EAF operation such as the scrap stage, melting and refining,
we obtain the arc model. Thus, after sampling AC current in each stage of furnace operation,
applying a program, arc is modeled as a current controlled voltage source. Corresponding to the
input current that is the arc current, arc voltage is obtained by interpolating based on previous
samples.
According to random behavior of the arc and the fact that in this paper we want to lay stress on this
property in order to model arc random nature, a band-limited white noise, which is based on existing
Copyright # 2010 John Wiley & Sons, Ltd. Euro. Trans. Electr. Power 2011; 21:824–838DOI: 10.1002/etep
-200 -100 0 100 200
-300
-200
-100
0
100
200
300
Arc Current (kA)
Arc
Voltage (
Volt)
Figure 2. Voltage–current (V–I) characteristic of the electric arc, considering flicker.
Electric Arc
Furnace (1)
Electric Arc
Furnace (2)
Electric Arc
Furnace (3)
Electric Arc
Furnace (4)
Static VAr
Compensator
400 Kv Busbar
63 Kv Busbar
Electric Arc
Furnace (1)
Electric Arc
Furnace (2)
Electric Arc
Furnace (3)
Electric Arc
Furnace (4)
Static VAr
Compensator
400 Kv Busbar
63 Kv Busbar
Figure 1. Considered Steel-Making Plant layout.
826 A. D. KOLAGAR ET AL.
frequency band in flicker, is generated and obtained voltage is modulated by the white noise [5]. The
preference of this model to the others is that this model is based on actual samples obtained from EAF.
Therefore, this model has a behavior close to the actual arc. Simulation results for arc model, including
flicker noise, are shown in Figure 2.
3. MEASUREMENT OF LOAD REACTIVE POWER CONSUMPTION
In reactive power measurement process, a signal, which introduces the newest value of the reactive
power, is required. This signal, which stands on an average-based method, is given in the following
equation [6]:
q tð Þ ¼ 1
T
Z t
t�T
v tð Þi t � T
4
� �dt (1)
where q(t) represents the reactive power at the period that ends at instant t. This equation has been
implemented utilizing a designed accounting circuit in the software. Utilizing the mentioned
accounting circuit, the average reactive power is calculated during each cycle and resulted value is
used for the next cycle. It should be noted that above equation is applied for single-phase systems.
Copyright # 2010 John Wiley & Sons, Ltd. Euro. Trans. Electr. Power 2011; 21:824–838DOI: 10.1002/etep
0 1 2 3 4 5945
950
955
960
Time (Sec)
Qp
cc (
MV
Ar)
Reactive Power at PCC, without TCR/FC
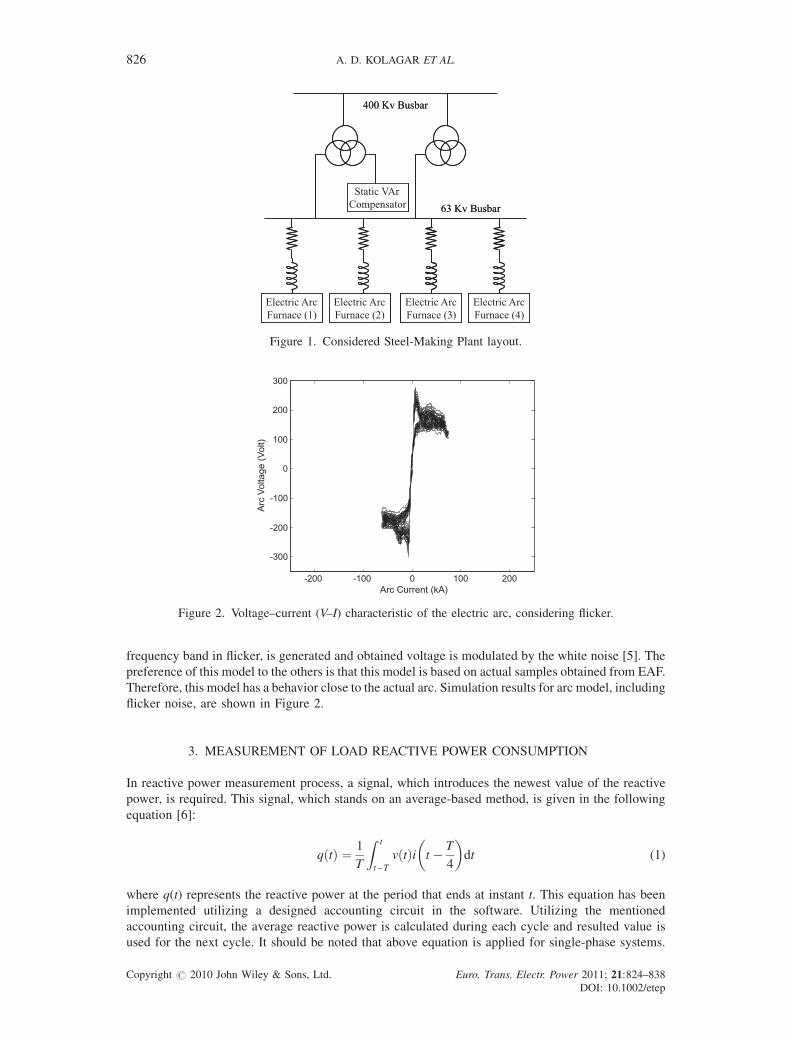
Figure 3. Simulated reactive power at 400 kV busbar without TCR/FC.
REACTIVE POWER COMPENSATION IN A STEEL INDUSTRIAL PLANT 827
For three-phase systems, the related equation is more complicated. Figure 3 shows the simulated
reactive power at 400 kV busbar. This curve is obtained from simulation and represents the whole
reactive power consumption by furnaces, transformer windings, and cables. Harmonic filters, which
provide required reactive power in addition to absorbing harmonic components, are designed based on
the fundamental reactive power that is some percentage more than the measured reactive power.
Excessive reactive power is then absorbed by TCR.
4. HARMONIC FILTER DESIGN
The main aim of the passive filter design is to eliminate or attenuate of some harmonic components.
In fact, these filters provide low impedance paths for the harmonic components to pass through
them, and avoid their penetration into the other areas in local network. Regarding the literatures and
existing statistical information, the amounts of created harmonics are determined and then
compared with the allowed quantity of such harmonics. Consequently, the harmonic order, which
should be filtered, and the power of the filters are determined. In this case study, according to the
existing conditions, harmonic filters were again designed for 2nd, 3rd, 5th, and 7th harmonics. Each
filter has two tasks: the first one is to suppress the corresponding harmonic component and another
one is to act as a capacitive impedance in order to provide the expected reactive power at
fundamental frequency.
4.1. Harmonic filter design steps
Co
(a) D
pyrig
etermining the required reactive power to compensate the load
(b) D
istributing the determined reactive power between filters properly, i.e., proportional to the eachharmonic power
(c) D
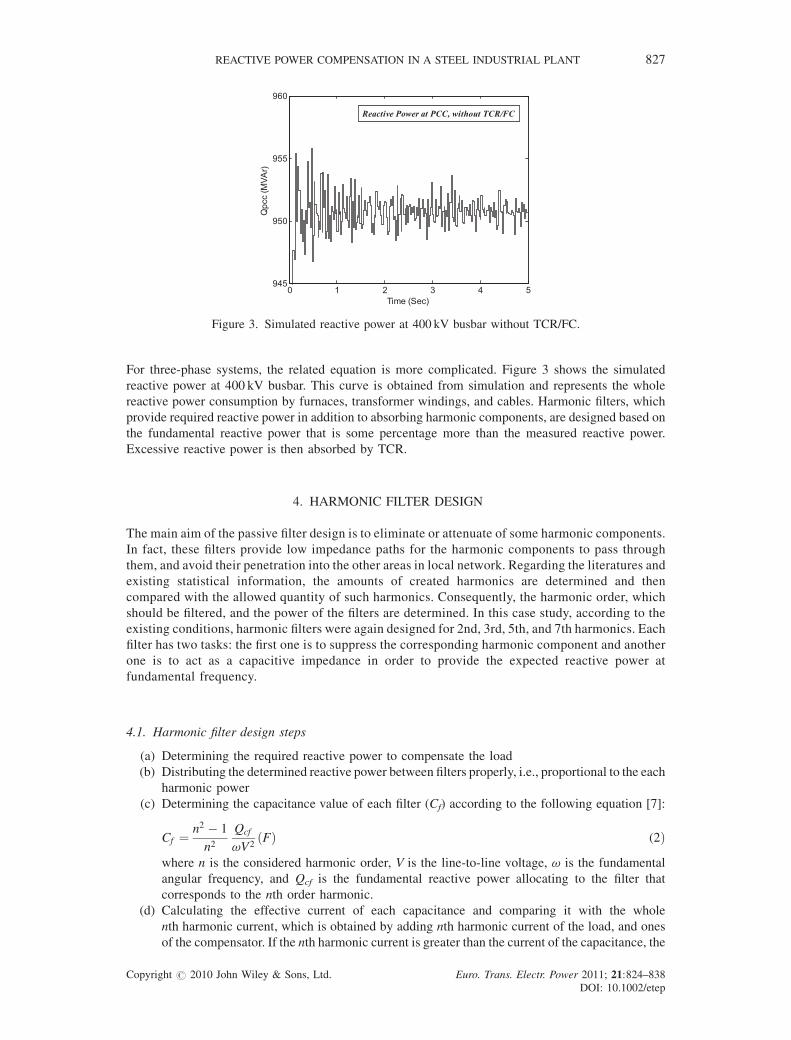
etermining the capacitance value of each filter (Cf) according to the following equation [7]:Cf ¼n2 � 1
n2Qcf
vV2Fð Þ (2Þ
where n is the considered harmonic order, V is the line-to-line voltage, v is the fundamental
angular frequency, and Qcf is the fundamental reactive power allocating to the filter that
corresponds to the nth order harmonic.
(d) C
alculating the effective current of each capacitance and comparing it with the wholenth harmonic current, which is obtained by adding nth harmonic current of the load, and ones
of the compensator. If the nth harmonic current is greater than the current of the capacitance, the
ht # 2010 John Wiley & Sons, Ltd. Euro. Trans. Electr. Power 2011; 21:824–838DOI: 10.1002/etep
Harmo
2nd3rd5th7th
Figure
Copyrig
828 A. D. KOLAGAR ET AL.
whole fundamental reactive power should be distributed between the filters again and more
reactive power should be allocated to this filter
(e) C
alculating the value of the series inductance of each filter (Lf) using the following equation [7]:Lf ¼1
n2v2Cf
(3Þ
(f) E
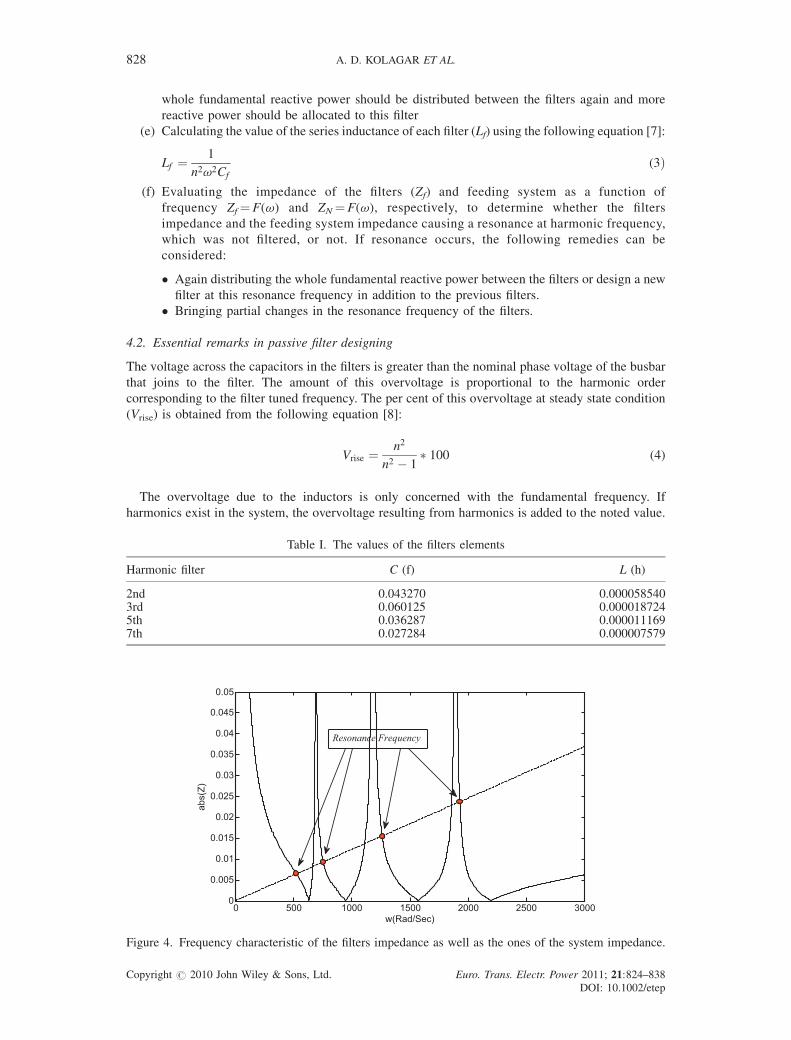
valuating the impedance of the filters (Zf) and feeding system as a function offrequency Zf¼F(v) and ZN¼F(v), respectively, to determine whether the filters
impedance and the feeding system impedance causing a resonance at harmonic frequency,
which was not filtered, or not. If resonance occurs, the following remedies can be
considered:
� Again distributing the whole fundamental reactive power between the filters or design a new
filter at this resonance frequency in addition to the previous filters.
� Bringing partial changes in the resonance frequency of the filters.
nic
4.
ht
4.2. Essential remarks in passive filter designing
The voltage across the capacitors in the filters is greater than the nominal phase voltage of the busbar
that joins to the filter. The amount of this overvoltage is proportional to the harmonic order
corresponding to the filter tuned frequency. The per cent of this overvoltage at steady state condition
(Vrise) is obtained from the following equation [8]:
Vrise ¼n2
n2 � 1� 100 (4)
The overvoltage due to the inductors is only concerned with the fundamental frequency. If
harmonics exist in the system, the overvoltage resulting from harmonics is added to the noted value.
Table I. The values of the filters elements
filter C (f) L (h)
0.043270 0.0000585400.060125 0.0000187240.036287 0.0000111690.027284 0.000007579
0 500 1000 1500 2000 2500 30000
0.005
0.01
0.015
0.02
0.025
0.03
0.035
0.04
0.045
0.05
w(Rad/Sec)
ab
s(Z
)
Resonance Frequency
Frequency characteristic of the filters impedance as well as the ones of the system impedance.
# 2010 John Wiley & Sons, Ltd. Euro. Trans. Electr. Power 2011; 21:824–838DOI: 10.1002/etep
0 1 2 3 4 5-15
-10
-5
0
5
Time (Sec)
Qp
cc (
MV
Ar)
Reactive Power at PCC, with FC but not TCR
Figure 5. Simulated reactive power at 400 kV busbar after applying the harmonic filters.
L/2
SW1 SW2
L/2
Figure 6. The thyristor controlled reactor configuration.
REACTIVE POWER COMPENSATION IN A STEEL INDUSTRIAL PLANT 829
If the system impedance at a special harmonic is low, the corresponding filter to that harmonic does
not operate well and vice versa, i.e., if both the system and filter impedance have large values, it causes
very high harmonic voltages in the system. Ordinarily, a series resistor is inserted at each phase of the
harmonic filter whose value is obtained from the following equation [9]:
R ¼ Xn
Q(5)
0 1 2 3 4 5-5
0
5
10
Time (Sec)
Qp
cc (
MV
Ar)
Reactive Power at PCC, with TCR/FC
Figure 7. Simulated reactive power at 400 kV busbar after applying TCR/FC.
Copyright # 2010 John Wiley & Sons, Ltd. Euro. Trans. Electr. Power 2011; 21:824–838DOI: 10.1002/etep
0.2 0.21 0.22 0.23 0.24 0.25-300
-200
-100
0
100
200
300
Time (Sec)
TC
R V
olta
ge
(V)
an
d C
urr
en
t(kA
)
TCR Current (kA)
TCR Voltage(V)*30
Figure 8. TCR voltage and current from t¼ 0.2 second to t¼ 0.25 second.
0.2 0.21 0.22 0.23 0.24 0.25 0.26 0.27 0.28-4
-3
-2
-1
0
1
2
3
4
Time (Sec)
Voltages a
t P
CC
(kV
)
Before Compensation After Applying TCR/FC
0.2 0.21 0.22 0.23 0.24 0.25 0.26 0.27 0.28-4
-3
-2
-1
0
1
2
3
4
Time (Sec)
Voltages a
t P
CC
(kV
)
Before Compensation After Applying TCR/FC
Figure 9. Voltages at PCC from t¼ 0.2 second to t¼ 0.28 second.
0.2 0.21 0.22 0.23 0.24 0.25 0.26 0.27 0.281.5
1.6
1.7
1.8
1.9
2
2.1
2.2
2.3
Time (Sec)
RM
S V
oltages a
t P
CC
(kV
)
Before Compensation
After Applying TCR/FC
Figure 10. RMS voltages at PCC from t¼ 0.2 second to t¼ 0.28 second.
Copyright # 2010 John Wiley & Sons, Ltd. Euro. Trans. Electr. Power 2011; 21:824–838DOI: 10.1002/etep
830 A. D. KOLAGAR ET AL.
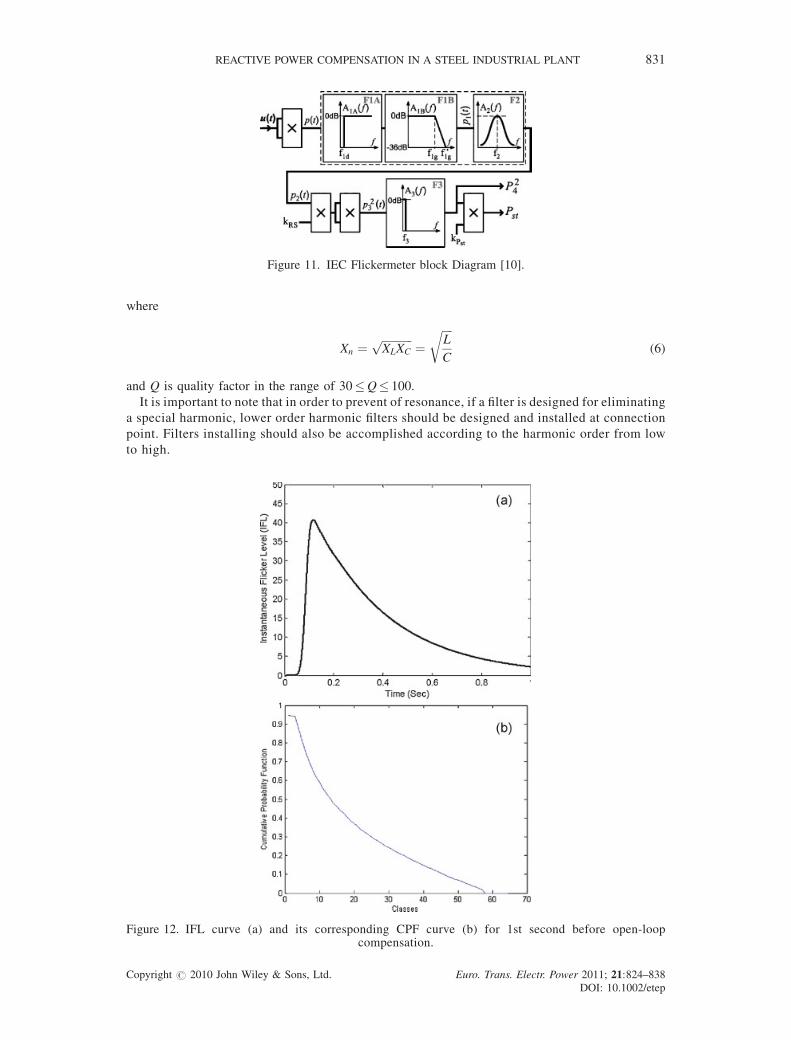
Figure 11. IEC Flickermeter block Diagram [10].
REACTIVE POWER COMPENSATION IN A STEEL INDUSTRIAL PLANT 831
where
Xn ¼ffiffiffiffiffiffiffiffiffiffiffiXLXC
p¼
ffiffiffiffiL
C
r(6)
and Q is quality factor in the range of 30�Q� 100.
It is important to note that in order to prevent of resonance, if a filter is designed for eliminating
a special harmonic, lower order harmonic filters should be designed and installed at connection
point. Filters installing should also be accomplished according to the harmonic order from low
to high.
Figure 12. IFL curve (a) and its corresponding CPF curve (b) for 1st second before open-loopcompensation.
Copyright # 2010 John Wiley & Sons, Ltd. Euro. Trans. Electr. Power 2011; 21:824–838DOI: 10.1002/etep
832 A. D. KOLAGAR ET AL.
By considering the fundamental reactive power, which is some percentage more than the
measured one, 2nd, 3rd, 5th and 7th harmonic filters have been designed. Table I shows the
values of the filters elements, that are obtained through the explained process in previous
section.
Figure 4 shows the frequency characteristic of the filters’ impedance as well as the ones of the system
impedance.
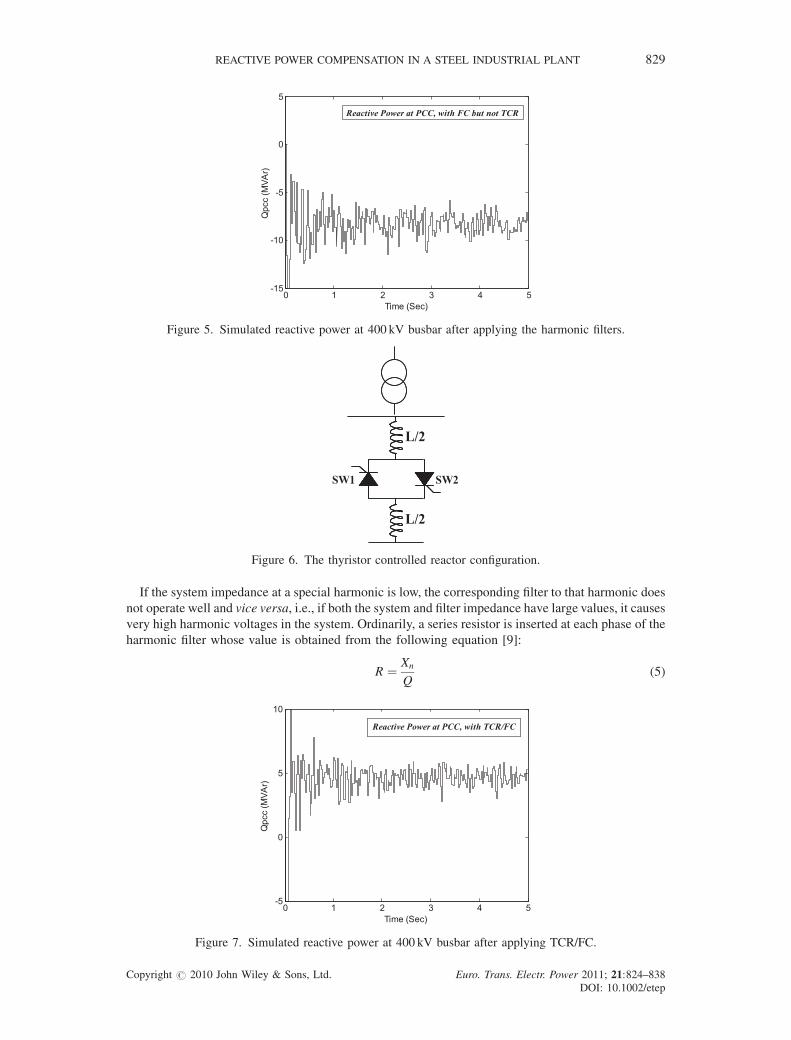
Figure 5 shows the measured reactive power at 400 kV busbar (QPCC) after applying the
harmonic filters. As seen in this figure, the injected reactive power by harmonic filters provides the
required reactive power for load compensation. The remnant reactive power should be absorbed
by TCR. By comparing Figures 3 and 5, it can be seen that the total measured reactive power at
PCC busbar before and after applying harmonic filters are approximately 951 and �8MVAr,
respectively.
5. FINAL COMPENSATION BY APPLYING THYRISTOR CONTROLLED REACTOR
Figure 6 shows the scheme of a static compensator of the thyristor controlled reactor (TCR) type.
By increasing the thyristor firing angle, the magnitude of the component of the current reactor
is reduced. This is equivalent to the increase in the effective inductance, or reduction in the
reactive power absorbed by the reactor. However, it should be pointed out that the change in the
reactor current may take place only at discrete points of time. It means that adjustments cannot
be made more frequently than once per half-cycle. Static compensators of the TCR type are
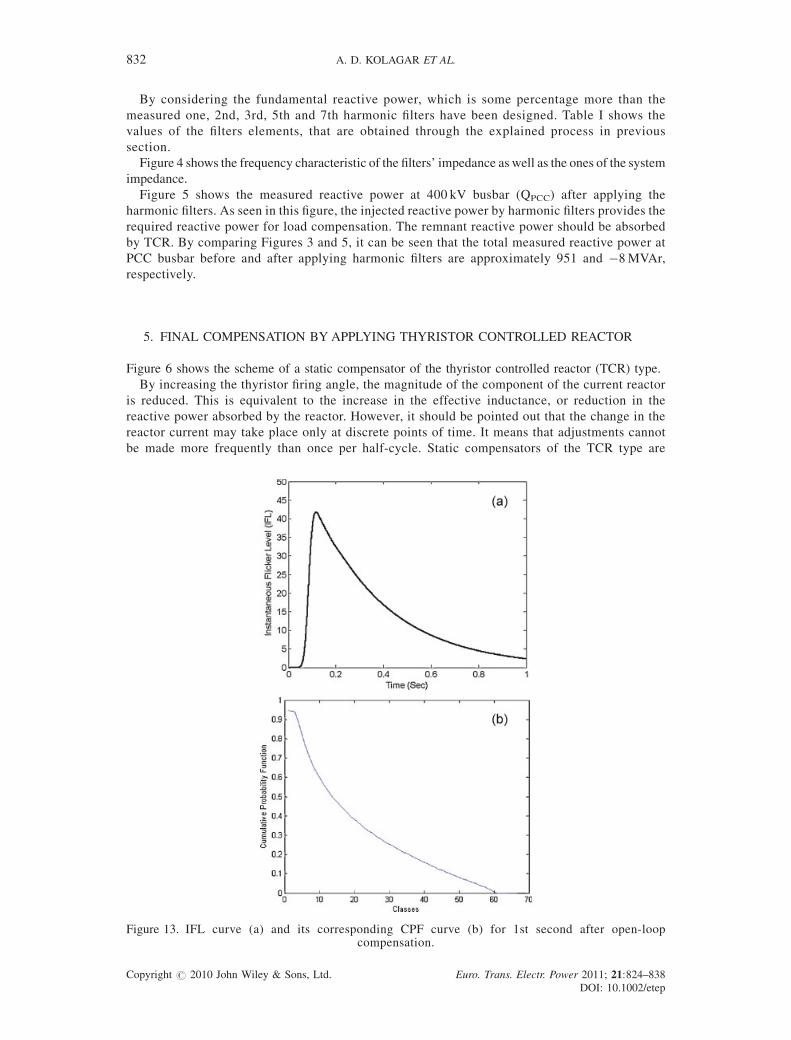
Figure 13. IFL curve (a) and its corresponding CPF curve (b) for 1st second after open-loopcompensation.
Copyright # 2010 John Wiley & Sons, Ltd. Euro. Trans. Electr. Power 2011; 21:824–838DOI: 10.1002/etep
REACTIVE POWER COMPENSATION IN A STEEL INDUSTRIAL PLANT 833
characterized by the ability to perform continuous control, maximum delay of one half cycle and
practically no transients. The principal disadvantages of this configuration are the generation of
low frequency harmonic current components, and higher losses when working in the inductive
region [10].
By installing the TCR at PCC busbar, remnant reactive power is absorbed by TCR. The TCR
operation causes harmonic creation. In fact, when the furnaces are in their operating stage, i.e., special
scraping and melting stages, different harmonics are generated and the thyristors of the TCR are turned
off because of the high reactive power consumption of the furnaces. Moreover, when the charge of the
furnaces is alleviated, specially in refining stage, the generated harmonics from furnaces are reduced
and TCR turns on in order to absorb the surplus reactive power. Therefore, some harmonics resulting
from TCR operation are generated. Consequently, existing harmonics should be eliminated by
harmonic filters.
After determining the reactive power, which should be absorbed by TCR, the TCR desired
susceptance (B) is obtained by [6]
B ¼ qTCR
V2(7)
where V is the root mean square (rms) voltage along the TCR.
Then, the conduction angle of the TCR thyristors (s) can be found from Equation (8) [6]:
B ¼ s � Sins
pXL
(8)
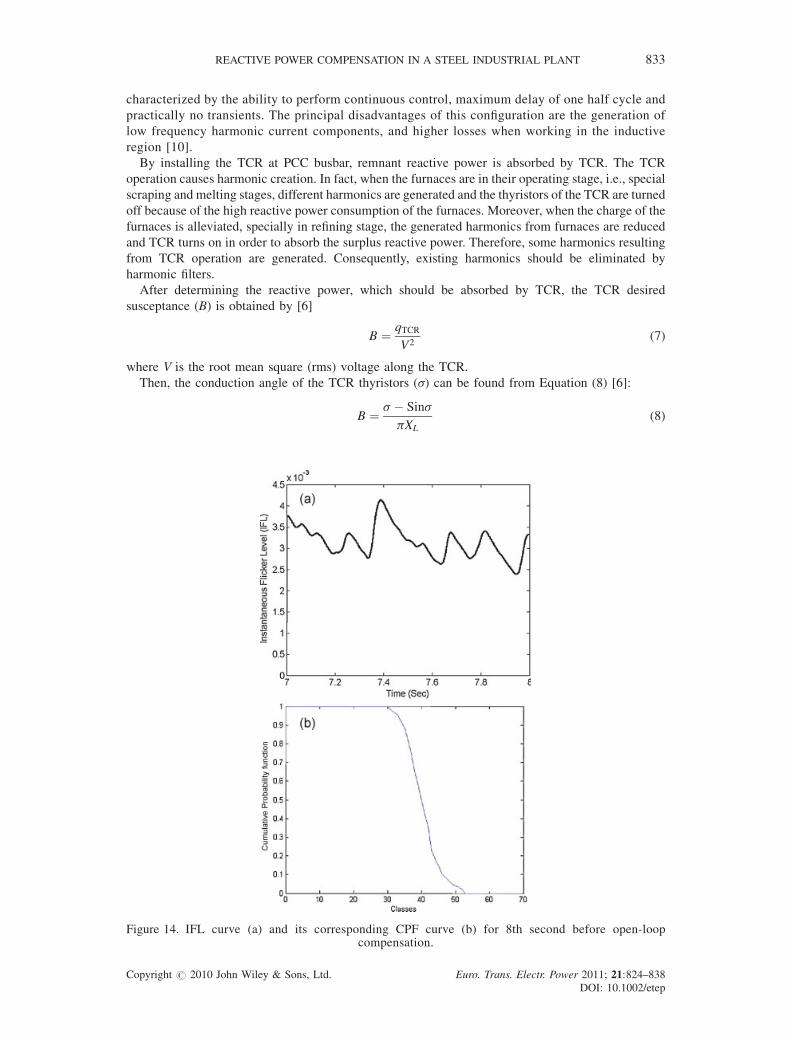
Figure 14. IFL curve (a) and its corresponding CPF curve (b) for 8th second before open-loopcompensation.
Copyright # 2010 John Wiley & Sons, Ltd. Euro. Trans. Electr. Power 2011; 21:824–838DOI: 10.1002/etep
834 A. D. KOLAGAR ET AL.
The firing angle (a) of the TCR thyristors can then be obtained from the following equation [6]:
aþ s
2¼ p (9)
It should be noted that, in practice, after obtaining TCR desired susceptance in each cycle, thyristors
conduction and firing angles are generally determined by means of an off-line computed look-up table.
Figure 7 shows the measured reactive power at 400 kV busbar after applying TCR/FC compensator.
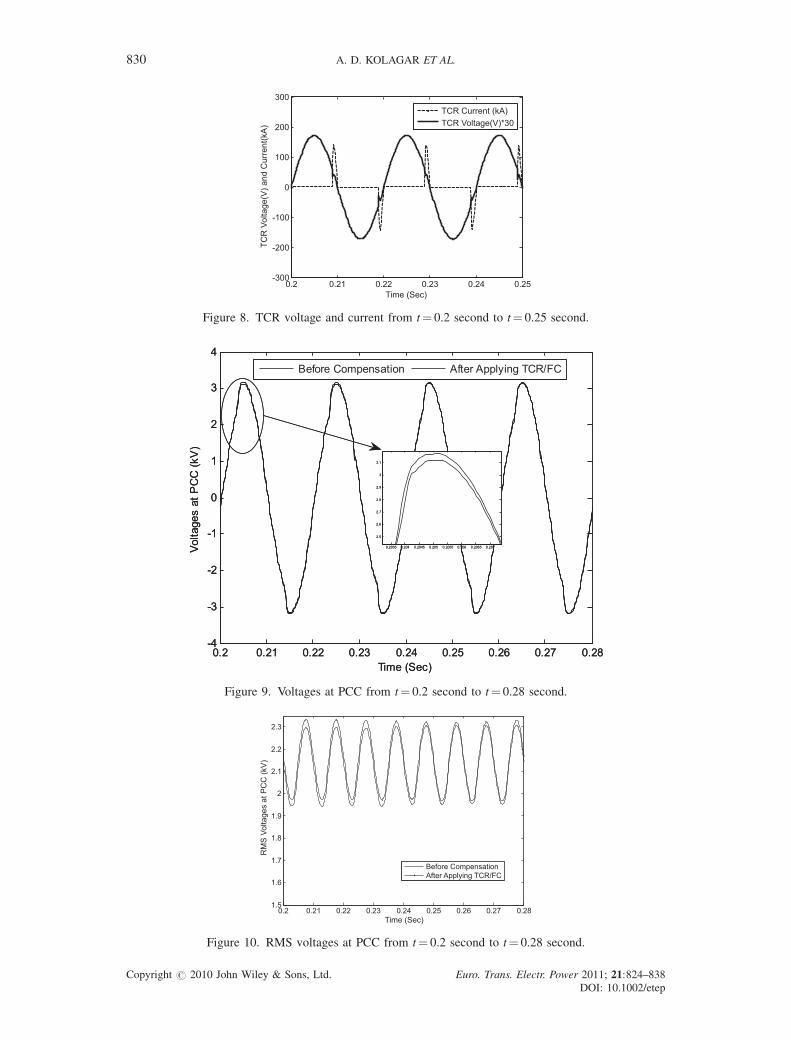
As seen in this figure, the TCR can balance the reactive power at PCC busbar properly. Figure 8
demonstrates TCR voltage and current from t¼ 0.2 second to t¼ 0.25 second.
Figures 9 and 10 also display the voltages and the RMS voltages at PCC before and after
compensation from t¼ 0.2 second to t¼ 0.28 second, respectively.
6. APPLYING IEC FLICKERMETER BEFORE AND AFTER OPEN-LOOP COMPENSATION
The international electrotechnical commission (IEC) flicker meter simulates spectator reaction
independent of flicker source. In fact, as the flicker meter operates based on flicker distinction feeling,
measurement of flicker is more or less relative. The basis of flicker calculation by IEC flicker meter is
that flicker intensity in input waveform is considered according to the quantity proper to the flicker
intensity. In this manner, the value of the corresponding quantity shows the indication level of the
flicker at each moment in input signal and also is an indication of the intensity and weakness of the
flicker. The name of this quantity is IFL. The IFL variable is an indication of instantaneous flicker
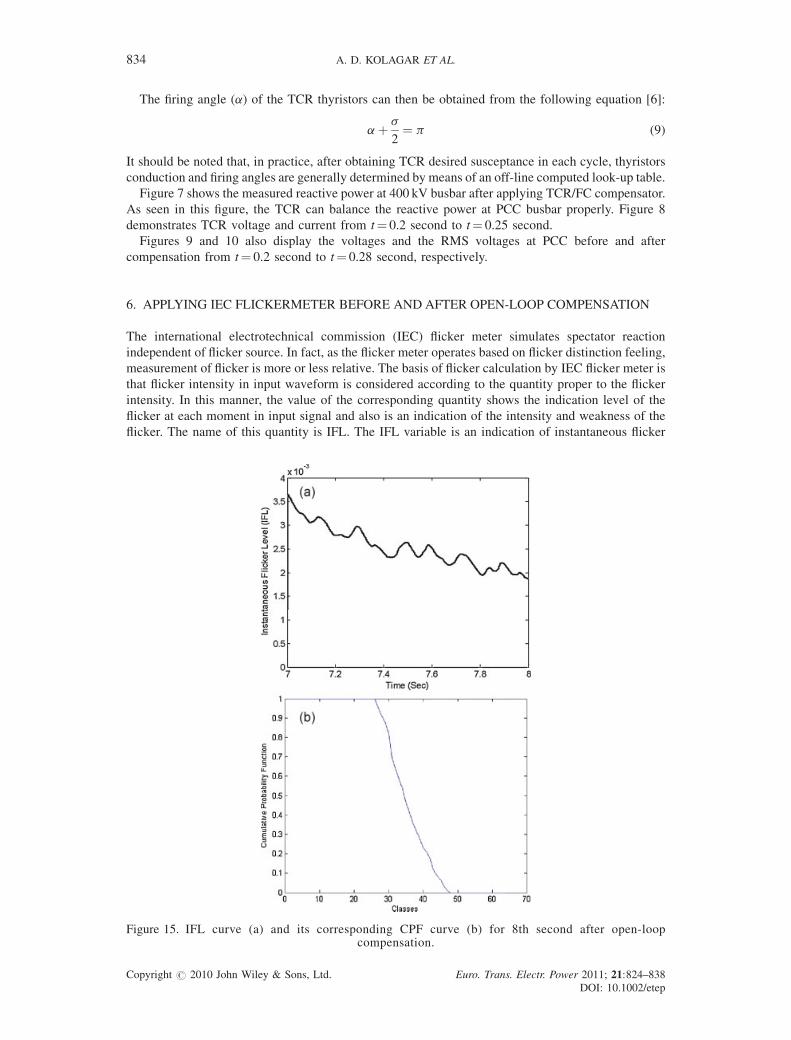
Figure 15. IFL curve (a) and its corresponding CPF curve (b) for 8th second after open-loopcompensation.
Copyright # 2010 John Wiley & Sons, Ltd. Euro. Trans. Electr. Power 2011; 21:824–838DOI: 10.1002/etep
REACTIVE POWER COMPENSATION IN A STEEL INDUSTRIAL PLANT 835
value in each moment [11–15]. Figure 11 shows the block diagram of the IEC flicker meter that was
simulated for flicker measurements [11].
For obtaining the instantaneous flicker sensation curve or short-term flicker severity curve (Pst), IFL
curves were evaluated for 15-second intervals, so that Pst value in each second is obtained by
considering the IFL curve in the same instant. Finally, after having 15 points, instantaneous flicker
sensation curve is estimated. Figures 12 and 13 show the IFL curve and its corresponding CPF curve for
1st second before and after open-loop compensation, respectively.
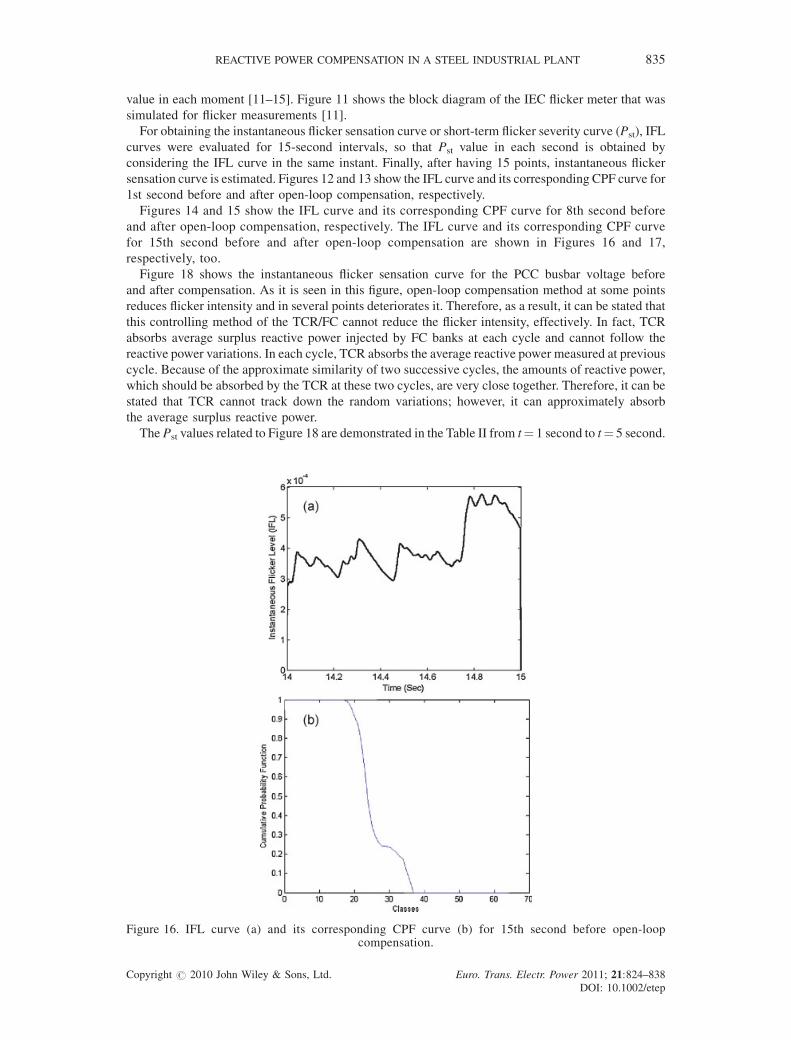
Figures 14 and 15 show the IFL curve and its corresponding CPF curve for 8th second before
and after open-loop compensation, respectively. The IFL curve and its corresponding CPF curve
for 15th second before and after open-loop compensation are shown in Figures 16 and 17,
respectively, too.
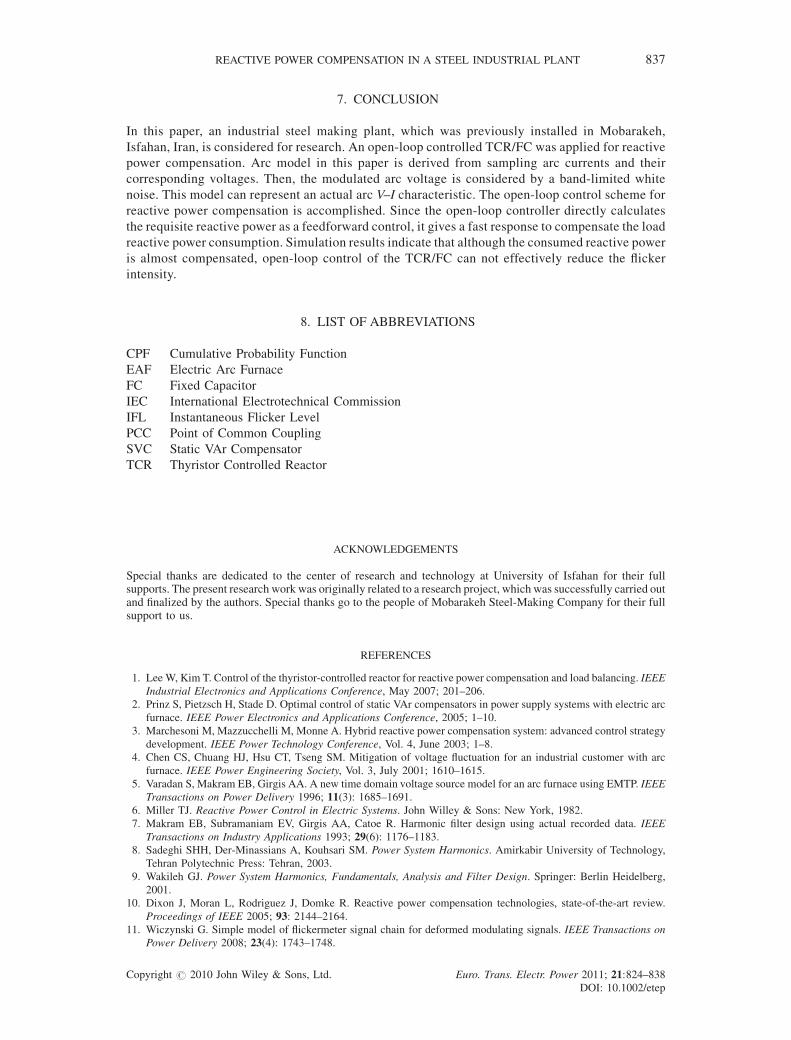
Figure 18 shows the instantaneous flicker sensation curve for the PCC busbar voltage before
and after compensation. As it is seen in this figure, open-loop compensation method at some points
reduces flicker intensity and in several points deteriorates it. Therefore, as a result, it can be stated that
this controlling method of the TCR/FC cannot reduce the flicker intensity, effectively. In fact, TCR
absorbs average surplus reactive power injected by FC banks at each cycle and cannot follow the
reactive power variations. In each cycle, TCR absorbs the average reactive power measured at previous
cycle. Because of the approximate similarity of two successive cycles, the amounts of reactive power,
which should be absorbed by the TCR at these two cycles, are very close together. Therefore, it can be
stated that TCR cannot track down the random variations; however, it can approximately absorb
the average surplus reactive power.
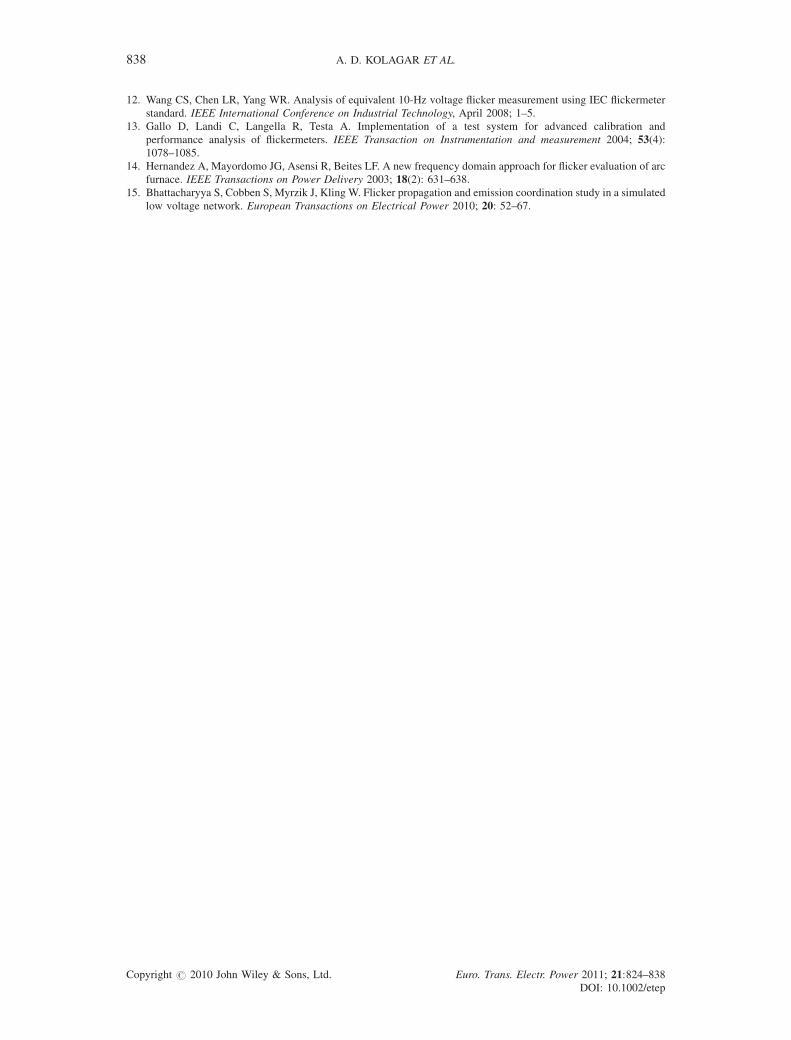
The Pst values related to Figure 18 are demonstrated in the Table II from t¼ 1 second to t¼ 5 second.
Figure 16. IFL curve (a) and its corresponding CPF curve (b) for 15th second before open-loopcompensation.
Copyright # 2010 John Wiley & Sons, Ltd. Euro. Trans. Electr. Power 2011; 21:824–838DOI: 10.1002/etep
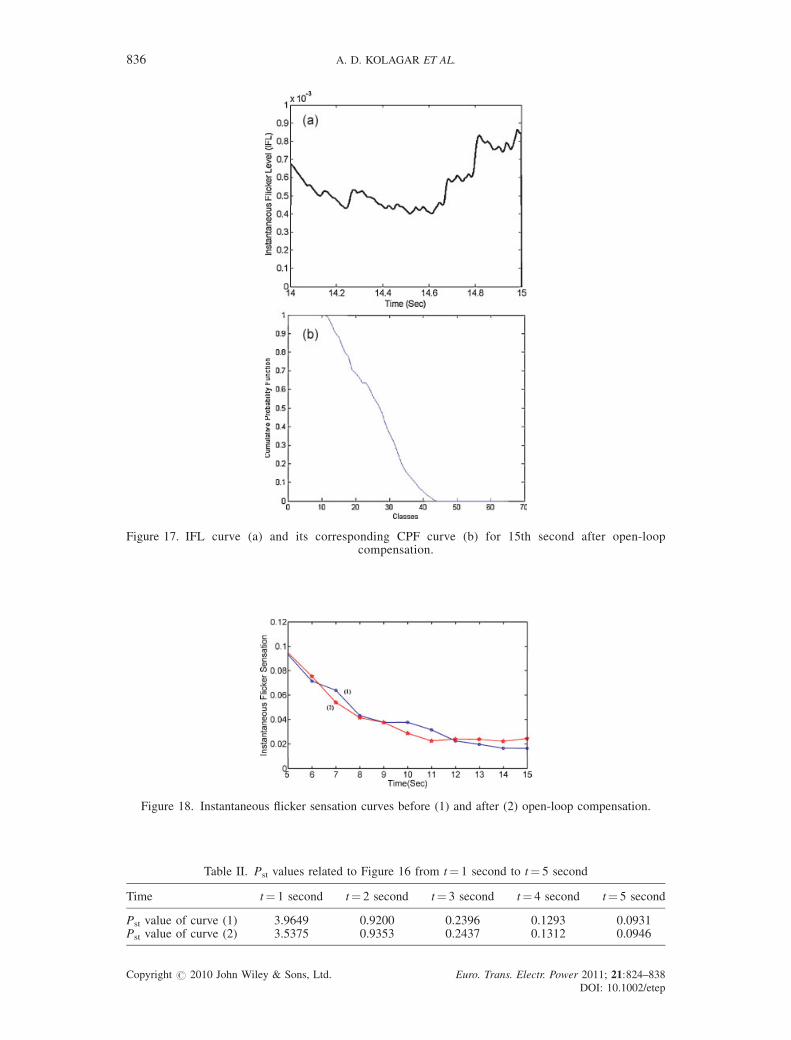
Figure 17. IFL curve (a) and its corresponding CPF curve (b) for 15th second after open-loopcompensation.
Figure 18. Instantaneous flicker sensation curves before (1) and after (2) open-loop compensation.
Table II. Pst values related to Figure 16 from t¼ 1 second to t¼ 5 second
Time t¼ 1 second t¼ 2 second t¼ 3 second t¼ 4 second t¼ 5 second
Pst value of curve (1) 3.9649 0.9200 0.2396 0.1293 0.0931Pst value of curve (2) 3.5375 0.9353 0.2437 0.1312 0.0946
Copyright # 2010 John Wiley & Sons, Ltd. Euro. Trans. Electr. Power 2011; 21:824–838DOI: 10.1002/etep
836 A. D. KOLAGAR ET AL.
REACTIVE POWER COMPENSATION IN A STEEL INDUSTRIAL PLANT 837
7. CONCLUSION
In this paper, an industrial steel making plant, which was previously installed in Mobarakeh,
Isfahan, Iran, is considered for research. An open-loop controlled TCR/FC was applied for reactive
power compensation. Arc model in this paper is derived from sampling arc currents and their
corresponding voltages. Then, the modulated arc voltage is considered by a band-limited white
noise. This model can represent an actual arc V–I characteristic. The open-loop control scheme for
reactive power compensation is accomplished. Since the open-loop controller directly calculates
the requisite reactive power as a feedforward control, it gives a fast response to compensate the load
reactive power consumption. Simulation results indicate that although the consumed reactive power
is almost compensated, open-loop control of the TCR/FC can not effectively reduce the flicker
intensity.
8. LIST OF ABBREVIATIONS
CPF C
Copyrigh
umulative Probability Function
EAF E
lectric Arc FurnaceFC F
ixed CapacitorIEC I
nternational Electrotechnical CommissionIFL I
nstantaneous Flicker LevelPCC P
oint of Common CouplingSVC S
tatic VAr CompensatorTCR T
hyristor Controlled ReactorACKNOWLEDGEMENTS
Special thanks are dedicated to the center of research and technology at University of Isfahan for their fullsupports. The present research work was originally related to a research project, which was successfully carried outand finalized by the authors. Special thanks go to the people of Mobarakeh Steel-Making Company for their fullsupport to us.
REFERENCES
1. Lee W, Kim T. Control of the thyristor-controlled reactor for reactive power compensation and load balancing. IEEE
Industrial Electronics and Applications Conference, May 2007; 201–206.
2. Prinz S, Pietzsch H, Stade D. Optimal control of static VAr compensators in power supply systems with electric arc
furnace. IEEE Power Electronics and Applications Conference, 2005; 1–10.
3. Marchesoni M, Mazzucchelli M, Monne A. Hybrid reactive power compensation system: advanced control strategy
development. IEEE Power Technology Conference, Vol. 4, June 2003; 1–8.
4. Chen CS, Chuang HJ, Hsu CT, Tseng SM. Mitigation of voltage fluctuation for an industrial customer with arc
furnace. IEEE Power Engineering Society, Vol. 3, July 2001; 1610–1615.
5. Varadan S, Makram EB, Girgis AA. A new time domain voltage source model for an arc furnace using EMTP. IEEE
Transactions on Power Delivery 1996; 11(3): 1685–1691.6. Miller TJ. Reactive Power Control in Electric Systems. John Willey & Sons: New York, 1982.
7. Makram EB, Subramaniam EV, Girgis AA, Catoe R. Harmonic filter design using actual recorded data. IEEE
Transactions on Industry Applications 1993; 29(6): 1176–1183.8. Sadeghi SHH, Der-Minassians A, Kouhsari SM. Power System Harmonics. Amirkabir University of Technology,
Tehran Polytechnic Press: Tehran, 2003.
9. Wakileh GJ. Power System Harmonics, Fundamentals, Analysis and Filter Design. Springer: Berlin Heidelberg,
2001.
10. Dixon J, Moran L, Rodriguez J, Domke R. Reactive power compensation technologies, state-of-the-art review.
Proceedings of IEEE 2005; 93: 2144–2164.11. Wiczynski G. Simple model of flickermeter signal chain for deformed modulating signals. IEEE Transactions on
Power Delivery 2008; 23(4): 1743–1748.
t # 2010 John Wiley & Sons, Ltd. Euro. Trans. Electr. Power 2011; 21:824–838DOI: 10.1002/etep
838 A. D. KOLAGAR ET AL.
12. Wang CS, Chen LR, Yang WR. Analysis of equivalent 10-Hz voltage flicker measurement using IEC flickermeter
standard. IEEE International Conference on Industrial Technology, April 2008; 1–5.
13. Gallo D, Landi C, Langella R, Testa A. Implementation of a test system for advanced calibration and
performance analysis of flickermeters. IEEE Transaction on Instrumentation and measurement 2004; 53(4):1078–1085.
14. Hernandez A, Mayordomo JG, Asensi R, Beites LF. A new frequency domain approach for flicker evaluation of arc
furnace. IEEE Transactions on Power Delivery 2003; 18(2): 631–638.15. Bhattacharyya S, Cobben S, Myrzik J, Kling W. Flicker propagation and emission coordination study in a simulated
low voltage network. European Transactions on Electrical Power 2010; 20: 52–67.
Copyright # 2010 John Wiley & Sons, Ltd. Euro. Trans. Electr. Power 2011; 21:824–838DOI: 10.1002/etep