re: jordan downs specific plan mobile source greenhouse...
TRANSCRIPT
T e r r y A . H a y e s A s s o c i a t e s L L C
8522 Nat ional Boulevard, Suite102
C u l v e r C i t y , C A 9 0 2 3 2
310.839.4200 fax 310.839.4201
w e b t a h a . c o m
taha 2010-012
June 22, 2010
Ms. Pria Hidisyan, Senior Regional Planner Southern California Association of Governments 818 West 7th Street, 12th Floor Los Angeles, CA 90017 RE: Jordan Downs Specific Plan Mobile Source Greenhouse Gas Emissions Analysis Dear Ms. Hidisyan: Terry A. Hayes Associates LLC (TAHA) completed a series of four technical memoranda detailing mobile source greenhouse gas (GHG) emissions associated with the proposed revitalization of Jordan Downs through the Jordan Downs Specific Plan. The funding to complete the analysis was provided by the Southern California Association of Governments’ (SCAG) Compass Blueprint Demonstration Project Program. The Compass Blueprint Program is a nationally-recognized regional planning effort led by SCAG to coordinate federal and State mandates with local plans. The Compass Blueprint growth vision and advisory land use policies have been incorporated into the 2004 and 2008 Regional Transportation Plans and are central to the region’s efforts to implement the California Senate Bill 375 GHG reduction law. The Compass Blueprint Program develops the partnerships necessary to make regional vision a local reality. Jordan Downs Master Plan The Housing Authority of the City of Los Angeles (HACLA) has engaged community stakeholders and residents of the Jordan Downs public housing complex in a master planning process to develop the Jordan Downs Master Plan (Master Plan). HACLA’s vision for the Master Plan is to create a vibrant urban village that incorporates a one-for-one replacement of public housing units and the development of an additional 900 to 1,100 affordable and market rate housing units. The Specific Plan provides the land use framework for the redevelopment of the Specific Plan Area (project site) to accommodate the development envisioned in the Master Plan. Implementation of the Specific Plan would include the demolition and reconstruction of the existing Jordan Downs public housing complex to include 1,600-1,800 new residential units built in a variety of residential building types, including townhouses and stacked flats in multiple and varied configurations. Implementation of the proposed project could also include up to 500,000 gross square feet (gsf) of new commercial, retail and light industrial space on approximately seven acres along Alameda Street, plus 20,000 gsf of community-serving retail and services in mixed-use buildings.
Pria Hidisyan June 22, 2010 Page 2
taha 2010-012
The Specific Plan allows development guidelines and rules to be tailored for the project site and modifies the existing land use and zoning designations to accommodate a mix of residential, retail, parks, schools, employment center, social service and civic uses. By establishing new zones and architectural design guidelines, the City of Los Angeles Department of City Planning is able to provide the regulatory controls and guidelines that would be used by architects and developers to guide the physical development of the land as envisioned in HACLA’s Master Plan. The Master Plan also includes a Human Capital Plan (HCP) intended to assist Jordan Downs residents increase their economic self sufficiency and live successfully in a new mixed income community. Furthermore, implementation of the proposed project is intended to serve as the catalyst for economic revitalization that could potentially improve the greater Watts community and de-concentrate poverty in and around the Jordan Downs public housing complex. The following discussion summarizes the four technical memorandums. The full memorandums are included for review at the end of the summary. Technical Memorandum 1 Technical Memorandum 1 establishes baseline trip characteristics for the existing Jordan Downs residences and summarizes trip generation by trip purpose, geographic distribution, and trip length. Vehicle trip information was obtained from the SCAG Transportation Demand Model. The Model utilizes assumptions on population, employment, income, roadway and transit networks and transportation costs to quantify regional trips. The analysis was based on three trip purposes: Home-to-Other, Home-to-Work, and Work-Based-Other combined with Other-Based-Other. These trip purposes typically represent the majority of trips within a residential area. According to the SCAG Model, Home-to-Other trip purpose accounts for 85 percent of total trips related to Jordan Downs, Work-Based-Other combined with Other-Based-Other accounts for 14 percent of trips, and Home-to-Work accounts for one percent of trips. Approximately 86 percent of trips travel less than five miles, no Home-to-Work trips travel farther than ten miles, and over half of the trips (56 percent) travel less than two miles. This data shows that the low-income Jordan Downs residents generally drive to local areas and do not commute long distances. The majority of trips are local Home-to-Other trips (e.g., grocery stores, schools, health clinics, etc.). Technical Memorandum 2 Technical Memorandum 2 estimates the vehicle miles traveled (VMT) and GHG emissions associated with retained residents. Retained residents are existing residents that would continue to live at Jordan Downs after the development of the Jordan Downs Specific Plan. The analysis assumed that the HCP would increase the annual median household income in Jordan Downs from $13,000 to the minimum wage annual income ($16,000). According to the SCAG Model, Home-to-Other trip purposes for areas with a $16,000 annual income account for 78 percent of total trips, Work-Based-Other combined with Other-Based-Other account for 5 percent of trips, and Home-to-Work account for 17 percent of trips. Based on this data and trip lengths obtained from the SCAG model, implementation of the HCP would result in additional 5,652 vehicle miles traveled over baseline conditions. Greenhouse gas emissions were calculated based on the VMT and emission factors obtained from the California Air Resources Board
Pria Hidisyan June 22, 2010 Page 3
taha 2010-012
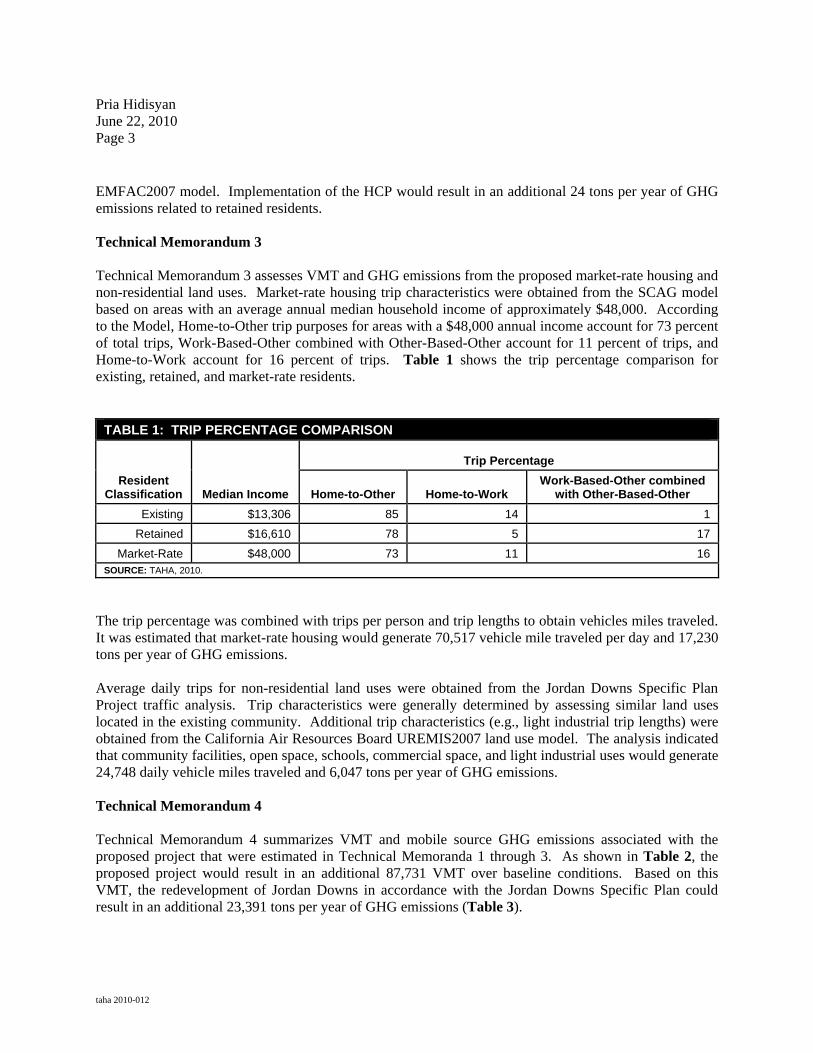
EMFAC2007 model. Implementation of the HCP would result in an additional 24 tons per year of GHG emissions related to retained residents. Technical Memorandum 3 Technical Memorandum 3 assesses VMT and GHG emissions from the proposed market-rate housing and non-residential land uses. Market-rate housing trip characteristics were obtained from the SCAG model based on areas with an average annual median household income of approximately $48,000. According to the Model, Home-to-Other trip purposes for areas with a $48,000 annual income account for 73 percent of total trips, Work-Based-Other combined with Other-Based-Other account for 11 percent of trips, and Home-to-Work account for 16 percent of trips. Table 1 shows the trip percentage comparison for existing, retained, and market-rate residents.
TABLE 1: TRIP PERCENTAGE COMPARISON
Resident Classification Median Income
Trip Percentage
Home-to-Other Home-to-Work Work-Based-Other combined
with Other-Based-Other
Existing $13,306 85 14 1
Retained $16,610 78 5 17
Market-Rate $48,000 73 11 16 SOURCE: TAHA, 2010.
The trip percentage was combined with trips per person and trip lengths to obtain vehicles miles traveled. It was estimated that market-rate housing would generate 70,517 vehicle mile traveled per day and 17,230 tons per year of GHG emissions. Average daily trips for non-residential land uses were obtained from the Jordan Downs Specific Plan Project traffic analysis. Trip characteristics were generally determined by assessing similar land uses located in the existing community. Additional trip characteristics (e.g., light industrial trip lengths) were obtained from the California Air Resources Board UREMIS2007 land use model. The analysis indicated that community facilities, open space, schools, commercial space, and light industrial uses would generate 24,748 daily vehicle miles traveled and 6,047 tons per year of GHG emissions. Technical Memorandum 4 Technical Memorandum 4 summarizes VMT and mobile source GHG emissions associated with the proposed project that were estimated in Technical Memoranda 1 through 3. As shown in Table 2, the proposed project would result in an additional 87,731 VMT over baseline conditions. Based on this VMT, the redevelopment of Jordan Downs in accordance with the Jordan Downs Specific Plan could result in an additional 23,391 tons per year of GHG emissions (Table 3).

Pria Hidisyan June 22, 2010 Page 4
taha 2010-012
TABLE 2: VEHICLE MILES TRAVELED COMPARISON
Scenario and Land Use Daily Vehicle Miles Traveled
Existing Conditions
Existing Residences 12,951
Future with Project Conditions
Retained Residences 20,186
Market-Rate Residences 78,022
Non-Residential Land Uses 24,748
Subtotal 100,682
Net VMT 87,731 SOURCE: TAHA, 2010.
TABLE 3: ESTIMATED GREENHOUSE GAS EMISSIONS
Land Use Greenhouse Gas Emissions
(Tons per year of CO2e)
Existing Conditions
Existing Residences 60
Future with Project Conditions
Retained Residences 84
Market-Rate Residents 17,320
Non-Residential Land Uses 6,047
Subtotal 23,451
TOTAL 23,391 SOURCE: TAHA, 2010.
Discussion The proposed redevelopment of the Jordan Downs Public Housing Project as a mixed-income environment with supporting open space, public services and shopping opportunities is an important benefit to the greater Watts and Southeast Los Angeles community. However, that benefit is not directly transferred into GHG emissions reductions. The assessment has shown that there is a strong correlation between increased incomes and increased VMT. Higher resident incomes, both as a result of the human capital program, as well as through the introduction of market-rate units, bring an increase in total trips and trip length. Human capital beneficiaries would be expected to travel to new job opportunities that become available as a result of increased education and training. The beneficiaries would have access to shopping opportunities in other communities throughout the region as a result of increased income. It is widely known throughout South Los Angeles that residents must travel significant distances to places of employment as well as access services like full service super markets, quality sit down restaurants and
Pria Hidisyan June 22, 2010 Page 5
taha 2010-012
quality schools. Increasing population density at the Jordan Downs location, at least in the short term, may exacerbate and reinforce this trip making patterns. Project-related GHG emissions could be reduced by lowering the daily passenger vehicle miles traveled and increasing ridership on local transit services. Ultimately, average trips and trip lengths can be reduced on a per capita basis through smart design at the regional and local level. Opportunities exist through the inclusion of Jordan Downs within the expanded Watts Redevelopment area through increase access to investment. Additional opportunities exist through coordinated efforts among the local transit agencies to maximize the existing connections to the Metro Blue Line and Green Line. Specific emphasis should be placed on expanding more frequent feeder bus service to the Blue and Green light rail lines, as well LADOT shuttle circulator services should be revisited ensure that there adequate transit to meet the needs of a wide range of non-work related discretionary trips.
This is a project of the City of Los Angeles (City) with funding provided by the Southern California Association of Governments’ (SCAG) Compass Blueprint Demonstration Project Program. Compass Blueprint assists Southern California cities and other organizations in evaluating planning options and stimulating development consistent with the region’s goals. The preparation of this report was funded, in part, through grants from the United States Department of Transportation (USDOT) – Federal Highway Administration and Federal Transit Administration, in accordance with the Metropolitan Planning Program, Section 104(f) of Title 12 of the U.S. Code. The contents of this report reflect the views of the author who is responsible for the facts and accuracy of the data presented herein. The contents do not necessarily reflect the official views or policies of SCAG, USDOT, or the State of California. This report does not constitute a standard, specification or regulation. SCAG shall not be responsible for the City’s future use or adaptation of the report.
T e r r y A . H a y e s A s s o c i a t e s L L C
8522 Nat ional Boulevard, Suite102
C u l v e r C i t y , C A 9 0 2 3 2
310.839.4200 fax 310.839.4201
w e b t a h a . c o mtaha 2010-012
Memorandum TO: Pria Hidisyan, Senior Regional Planner Southern California Association of Governments FROM: Sam Silverman, Senior Associate Terry A. Hayes Associates LLC DATE: March 31, 2010 RE: Jordan Downs Specific Plan Greenhouse Gas Emissions Analysis Technical
Memorandum 1 Terry A. Hayes Associates LLC (TAHA) is completing a mobile source greenhouse gas (GHG) emissions analysis for the Jordan Downs Specific Plan Project. The GHG analysis will be based on vehicle trip information obtained from the Southern California Association of Governments (SCAG) Transportation Demand Model. Two key components of this analysis are average daily trips and trip lengths. These variables are used to calculate vehicle miles traveled (VMT) data. The VMT is multiplied by grams of pollutant per mile of travel to obtain GHG emissions. The purpose of Technical Memorandum 1 is to establish a baseline for Jordan Downs and summarize trip generation by trip purpose, geographic distribution, and trip length from Jordan Downs to surrounding areas. Methodology The SCAG Transportation Demand Model is the regional tool for characterizing the transportation environment. The Model utilizes assumptions on population, employment, income, roadway and transit networks and transportation costs to quantify regional trips. The model uses this data to estimate: Traffic congestion (Highway level-of-service) Freight traffic (heavy-duty trucks) Passengers riding existing and future transit services Smog caused by automotive emissions
Pria Hidisyan March 31, 2010 Page 2
taha 2010-012
SCAG's Model divides the analysis into in four stages: 1. Trip Generation (How often to people travel? How many workers are drawn to any given
employment center?) 2. Trip Distribution (Where do persons travel to work, school or shopping?) 3. Mode Choice (How many persons drive alone, share a ride or take transit?) 4. Trip Assignment (What routes do travelers use, and how much congestion results?)
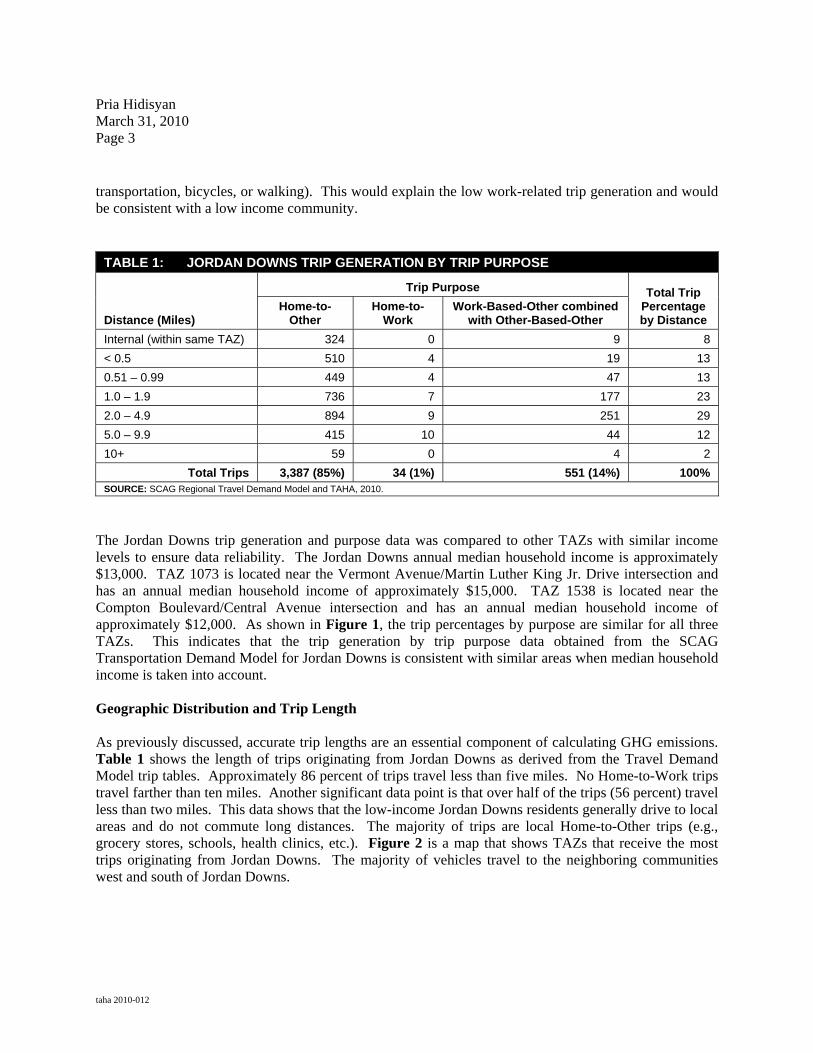
The trip generation component of the Travel Demand Model relies heavily on socioeconomic variables, such as residential population, households, household income, workers, and employment by type to estimate trip generation, distribution, mode choice, and trip assignment. The greater Los Angeles area is geographically divided into Transportation Analysis Zones (TAZs). The TAZs provide the spatial unit (or geographical area) within which travel behavior and traffic generation are estimated. Trip generation is the process of estimating daily person trips for an average weekday generated by households within each TAZ. The Model contains a series of smaller models to estimate trip productions and trip attractions by trip type. The trip production models estimate the number of person trips generated in each TAZ, and trip attraction models estimate the number of person trips attracted to each TAZ. Trip productions and attractions have been combined to create a simplified relationship of the origin and destination relationships between all TAZs in the geographic range of the Model. These relationships are commonly referred to as a trip table. The trip tables used in this analysis represent the cross referenced relationship between approximately 4,109 TAZs in the region. The trip tables have been developed to show detailed relationships between the TAZs in Los Angeles County and are summarized for outlying areas in Orange, San Bernardino and Riverside counties likely to be unaffected by travel activity at Jordan Downs. Our analysis was based on three trip purposes: Home-to-Other, Home-to-Work, and Work-Based-Other combined with Other-Based-Other. These trip purposes typically represent the majority of trips within a residential TAZ. Trip rates per household are developed for each trip purpose using 2001 SCAG Travel Survey data and United States Census. For example, trip rates for home-based work trip purpose are developed for households stratified by the number of workers, household size, and the age of household head. Trip productions in each zone are then calculated by applying trip rates to the number of households. Trip Generation by Trip Purpose Table 1 shows trip generation by purpose for trips originating in the Jordan Downs TAZ. According to the SCAG Model, Jordan Downs generates approximately 3,972 daily trips. The Home-to-Other purpose accounts for 85 percent of total trips. Work-Based-Other combined with Other-Based-Other accounts for 14 percent of trips and Home-to-Work accounts for one percent of trips. Work trips account for a relatively small percentage (15 percent) outgoing trips from Jordan Downs, which is consistent with the information provided in the Jordan Downs Human Capital Plan (HCP) prepared by EJP Consulting Group (November 2009). The HCP states that the Jordan Downs community includes 2,320 people. Less than half of these people are working age adults (46 percent) and 56 percent of these adults are unemployed. The result is a working population of 470 adults. Many of these adults likely travel to work using public transportation or by foot. According to the U.S. Census, approximately 30 percent of workers from Jordan Downs travel to work using a mode other than passenger vehicles (i.e., public
Pria Hidisyan March 31, 2010 Page 3
taha 2010-012
transportation, bicycles, or walking). This would explain the low work-related trip generation and would be consistent with a low income community.
TABLE 1: JORDAN DOWNS TRIP GENERATION BY TRIP PURPOSE
Distance (Miles)
Trip Purpose Total Trip Percentage by Distance
Home-to-Other
Home-to-Work
Work-Based-Other combined with Other-Based-Other
Internal (within same TAZ) 324 0 9 8
< 0.5 510 4 19 13
0.51 – 0.99 449 4 47 13
1.0 – 1.9 736 7 177 23
2.0 – 4.9 894 9 251 29
5.0 – 9.9 415 10 44 12
10+ 59 0 4 2
Total Trips 3,387 (85%) 34 (1%) 551 (14%) 100% SOURCE: SCAG Regional Travel Demand Model and TAHA, 2010.
The Jordan Downs trip generation and purpose data was compared to other TAZs with similar income levels to ensure data reliability. The Jordan Downs annual median household income is approximately $13,000. TAZ 1073 is located near the Vermont Avenue/Martin Luther King Jr. Drive intersection and has an annual median household income of approximately $15,000. TAZ 1538 is located near the Compton Boulevard/Central Avenue intersection and has an annual median household income of approximately $12,000. As shown in Figure 1, the trip percentages by purpose are similar for all three TAZs. This indicates that the trip generation by trip purpose data obtained from the SCAG Transportation Demand Model for Jordan Downs is consistent with similar areas when median household income is taken into account. Geographic Distribution and Trip Length As previously discussed, accurate trip lengths are an essential component of calculating GHG emissions. Table 1 shows the length of trips originating from Jordan Downs as derived from the Travel Demand Model trip tables. Approximately 86 percent of trips travel less than five miles. No Home-to-Work trips travel farther than ten miles. Another significant data point is that over half of the trips (56 percent) travel less than two miles. This data shows that the low-income Jordan Downs residents generally drive to local areas and do not commute long distances. The majority of trips are local Home-to-Other trips (e.g., grocery stores, schools, health clinics, etc.). Figure 2 is a map that shows TAZs that receive the most trips originating from Jordan Downs. The majority of vehicles travel to the neighboring communities west and south of Jordan Downs.
Pria Hidisyan March 31, 2010 Page 4
taha 2010-012
The Jordan Downs trip distances were also compared to TAZs 1073 and 1538 to ensure data reliability. As shown in Figure 3, the majority of trips from these two TAZs also occur within five miles of homes and few trips are greater than ten miles. Conclusion This technical memorandum includes a detailed analysis of trips originating from Jordan Downs. It shows that the trip purposes and characteristics are comparable to other areas of Los Angeles with similar socioeconomic factors. Technical Memorandum 2 will adjust the trips to account for human capital improvements (e.g., job and skill training and higher salaries) to Jordan Downs.
This is a project of the City of Los Angeles (City) with funding provided by the Southern California Association of Governments’ (SCAG) Compass Blueprint Demonstration Project Program. Compass Blueprint assists Southern California cities and other organizations in evaluating planning options and stimulating development consistent with the region’s goals. The preparation of this report was funded, in part, through grants from the United States Department of Transportation (USDOT) – Federal Highway Administration and Federal Transit Administration, in accordance with the Metropolitan Planning Program, Section 104(f) of Title 12 of the U.S. Code. The contents of this report reflect the views of the author who is responsible for the facts and accuracy of the data presented herein. The contents do not necessarily reflect the official views or policies of SCAG, USDOT, or the State of California. This report does not constitute a standard, specification or regulation. SCAG shall not be responsible for the City’s future use or adaptation of the report.
T e r r y A . H a y e s A s s o c i a t e s L L C
8522 Nat ional Boulevard, Suite102
C u l v e r C i t y , C A 9 0 2 3 2
310.839.4200 fax 310.839.4201
w e b t a h a . c o mtaha 2010-012
Memorandum TO: Pria Hidisyan, Senior Regional Planner Southern California Association of Governments FROM: Sam Silverman, Senior Associate Terry A. Hayes Associates LLC DATE: April 14, 2010 RE: Jordan Downs Specific Plan Greenhouse Gas Emissions Analysis Technical
Memorandum 2 Terry A. Hayes Associates LLC (TAHA) is completing a mobile source greenhouse gas (GHG) emissions analysis for the Jordan Downs Specific Plan Project. The methodology for the analysis is summarized in Technical Memorandum 1. The first memorandum also establishes a baseline for Jordan Downs and summarizes trip generation by trip purpose, geographic distribution, and trip length from Jordan Downs to surrounding areas. The purpose of the technical memorandum is to adjust the Jordan Downs trip tables based on application of the Jordan Downs Human Capital Plan (HCP) prepared by EJP Consulting Group (November 2009). The following analysis summarizes the geographic distribution and length of trips of retained Jordan Downs residents. This information is used to calculate residential vehicle miles traveled (VMT) and associated greenhouse gas (GHG) emissions. Trip Generation by Trip Purpose Trip generation by trip purpose was estimated using United States Census data on incomes and trip information from the Southern California Association of Governments Transportation Demand Model. The Jordan Downs annual median household income is approximately $13,000. A full-time employee in the State of California making minimum wage has an annual income of approximately $16,500. This analysis assumed that the HCP would increase the annual median household income in Jordan Downs to the minimum wage annual income. Four Transportation Analysis Zones (TAZs) were identified in south Los Angeles within a five-mile radius of Jordan Downs that have annual median household incomes between $16,000 and $17,000. Table 1 shows the average trip generation by trip purpose for these TAZs. Similar information was provided for residents of Jordan Downs in Technical Memorandum 1. The data shows that TAZs with higher annual median household incomes have a higher percentage of work trips.

Pria Hidisyan April 14, 2010 Page 2
taha 2010-012
TABLE 1: RETAINED RESIDENT TRIP GENERATION BY TRIP PURPOSE
Distance (Miles)
Trip Purpose Total Trip Percentage by Distance
Home-to-Other
Home-to-Work
Work-Based-Other combined with Other-Based-Other
Internal (within same TAZ) 482 4 18 9%
< 0.5 562 10 36 11%
0.51 – 0.99 717 24 108 15%
1.0 – 1.9 1,054 46 242 23%
2.0 – 4.9 1,155 116 463 30%
5.0 – 9.9 470 71 102 11%
10+ 77 8 11 2%
Total Trips 4,518 (78%) 279 (5%) 981 (17%) 100% SOURCE: SCAG Regional Travel Demand Model and TAHA, 2010.
Trip Length by Trip Purpose The data presented in Table 1 was used to calculate the average trip length by trip purpose for the TAZs with the higher annual median household income. Table 2 compares these trip lengths to the existing Jordan Downs trips lengths by trip purpose. The data indicates a correlation between higher income and increased trips per person. Retained residents of Jordan Downs that undergo workforce training would generate more trips per day and travel further distances than existing residents.
TABLE 2: TRIPS LENGTH COMPARISON
Resident Classification Median Income
Trips Per Person
Home-to-Other Home-to-Work Work-Based-Other combined
with Other-Based-Other
Existing $13,306 0.96 0.01 0.19
Retained $16,610 1.17 0.07 0.26 SOURCE: TAHA, 2010.
Vehicle Miles Traveled The data provided in Table 2 is for person trips, which includes pedestrian and transit trips. The Transportation Demand Model provides mode data for each trip purpose. According to the model, passenger vehicles are responsible for approximately 91 percent of home-to-other trips, 81 percent of home-to-work trips, and 90 percent of work-based-other combined with other-based-other trips. Table 3 shows the VMT for existing Jordan Downs and retained Jordan Downs residents. The VMT was calculated based on trip lengths and trips per person. It was assumed that there are 2,320 residents and
Pria Hidisyan April 14, 2010 Page 3
taha 2010-012
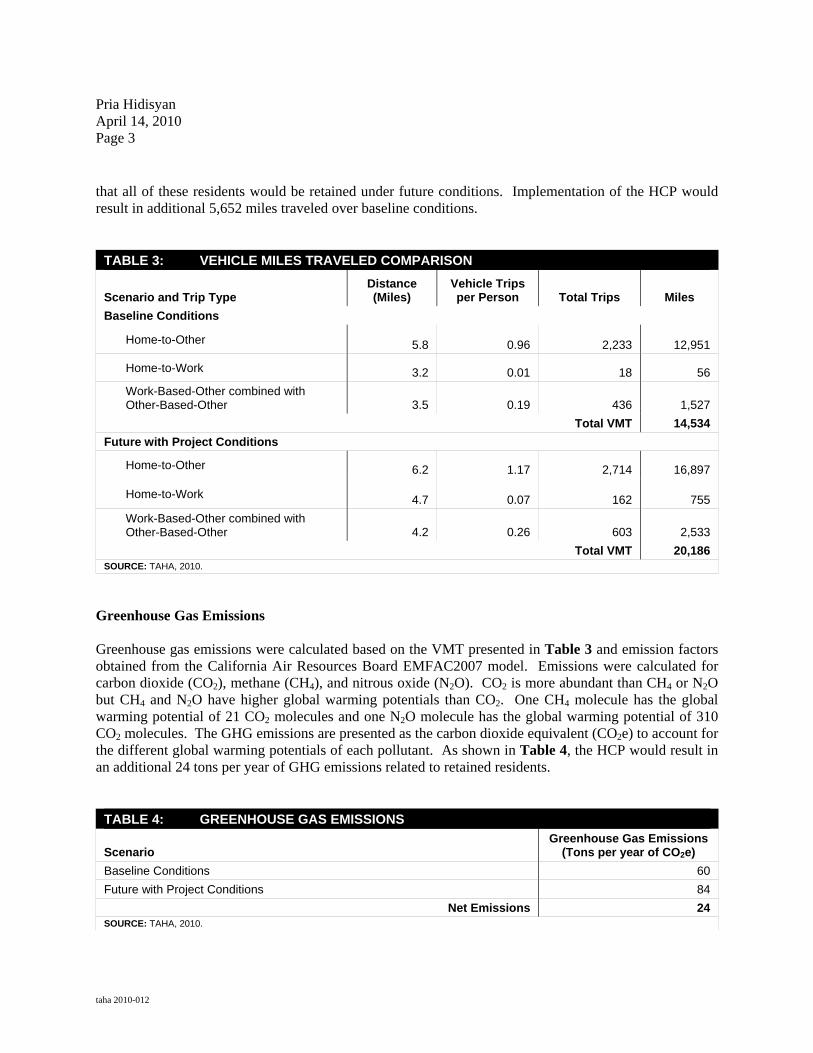
that all of these residents would be retained under future conditions. Implementation of the HCP would result in additional 5,652 miles traveled over baseline conditions.
TABLE 3: VEHICLE MILES TRAVELED COMPARISON
Scenario and Trip Type Distance (Miles)
Vehicle Trips per Person Total Trips Miles
Baseline Conditions
Home-to-Other 5.8 0.96 2,233 12,951
Home-to-Work 3.2 0.01 18 56
Work-Based-Other combined with Other-Based-Other 3.5 0.19 436 1,527
Total VMT 14,534
Future with Project Conditions
Home-to-Other 6.2 1.17 2,714 16,897
Home-to-Work 4.7 0.07 162 755
Work-Based-Other combined with Other-Based-Other 4.2 0.26 603 2,533
Total VMT 20,186 SOURCE: TAHA, 2010.
Greenhouse Gas Emissions Greenhouse gas emissions were calculated based on the VMT presented in Table 3 and emission factors obtained from the California Air Resources Board EMFAC2007 model. Emissions were calculated for carbon dioxide (CO2), methane (CH4), and nitrous oxide (N2O). CO2 is more abundant than CH4 or N2O but CH4 and N2O have higher global warming potentials than CO2. One CH4 molecule has the global warming potential of 21 CO2 molecules and one N2O molecule has the global warming potential of 310 CO2 molecules. The GHG emissions are presented as the carbon dioxide equivalent (CO2e) to account for the different global warming potentials of each pollutant. As shown in Table 4, the HCP would result in an additional 24 tons per year of GHG emissions related to retained residents.
TABLE 4: GREENHOUSE GAS EMISSIONS
Scenario Greenhouse Gas Emissions
(Tons per year of CO2e)
Baseline Conditions 60
Future with Project Conditions 84
Net Emissions 24 SOURCE: TAHA, 2010.
Pria Hidisyan April 14, 2010 Page 4
taha 2010-012
Conclusion This technical memorandum concludes that retaining the existing residents of Jordan Downs and implementing a workforce training program would increase GHG emissions by 24 tons per year. The increase in emissions is a result of a trained workforce traveling further for work and having more expendable income with related trips. Technical Memorandum 3 will estimate GHG emissions from market-rate housing and non-residential trips.
This is a project of the City of Los Angeles (City) with funding provided by the Southern California Association of Governments’ (SCAG) Compass Blueprint Demonstration Project Program. Compass Blueprint assists Southern California cities and other organizations in evaluating planning options and stimulating development consistent with the region’s goals. The preparation of this report was funded, in part, through grants from the United States Department of Transportation (USDOT) – Federal Highway Administration and Federal Transit Administration, in accordance with the Metropolitan Planning Program, Section 104(f) of Title 12 of the U.S. Code. The contents of this report reflect the views of the author who is responsible for the facts and accuracy of the data presented herein. The contents do not necessarily reflect the official views or policies of SCAG, USDOT, or the State of California. This report does not constitute a standard, specification or regulation. SCAG shall not be responsible for the City’s future use or adaptation of the report.
T e r r y A . H a y e s A s s o c i a t e s L L C
8522 Nat ional Boulevard, Suite102
C u l v e r C i t y , C A 9 0 2 3 2
310.839.4200 fax 310.839.4201
w e b t a h a . c o mtaha 2010-012
Memorandum TO: Pria Hidisyan, Senior Regional Planner Southern California Association of Governments FROM: Sam Silverman, Senior Associate Terry A. Hayes Associates LLC DATE: June 21, 2010 RE: Jordan Downs Specific Plan Greenhouse Gas Emissions Analysis Technical
Memorandum 3 Terry A. Hayes Associates LLC (TAHA) is completing a mobile source greenhouse gas (GHG) emissions analysis for the Jordan Downs Specific Plan Project. The methodology for the analysis was summarized in Technical Memorandum 1. The first memorandum also established a baseline for Jordan Downs and summarized trip generation by trip purpose, geographic distribution, and trip length from Jordan Downs to surrounding areas. The second memorandum summarized the geographic distribution and length of trips of retained residents at Jordan Downs. This information was used to calculate residential vehicle miles traveled (VMT) and associated greenhouse gas (GHG) emissions. The purpose of the third memorandum is to assess GHG emissions from market-rate housing and non-residential vehicle trips. The memorandum summarizes the geographic distribution and trip length associated with market-rate residents, light industrial workers, and commercial patrons. The VMT is calculated for three market-based housing scenarios and GHG emissions are estimated based on these scenarios. The following analysis presents the VMT and GHG emissions for each land use associated with the Jordan Downs Project. Market-Rate Housing The Jordan Downs Specific Plan Project would include 400 market-rate residential condominium units and 700 marker-rate rental units. The residents associated with market-rate housing would have higher incomes than the retained Jordan Downs residents. The two residential groups would have different travel patterns (e.g., longer work trip distances for market-rate residents). The following analysis assesses VMT associated with market-rate housing based on trip purpose.
Pria Hidisyan June 21, 2010 Page 2
taha 2010-012
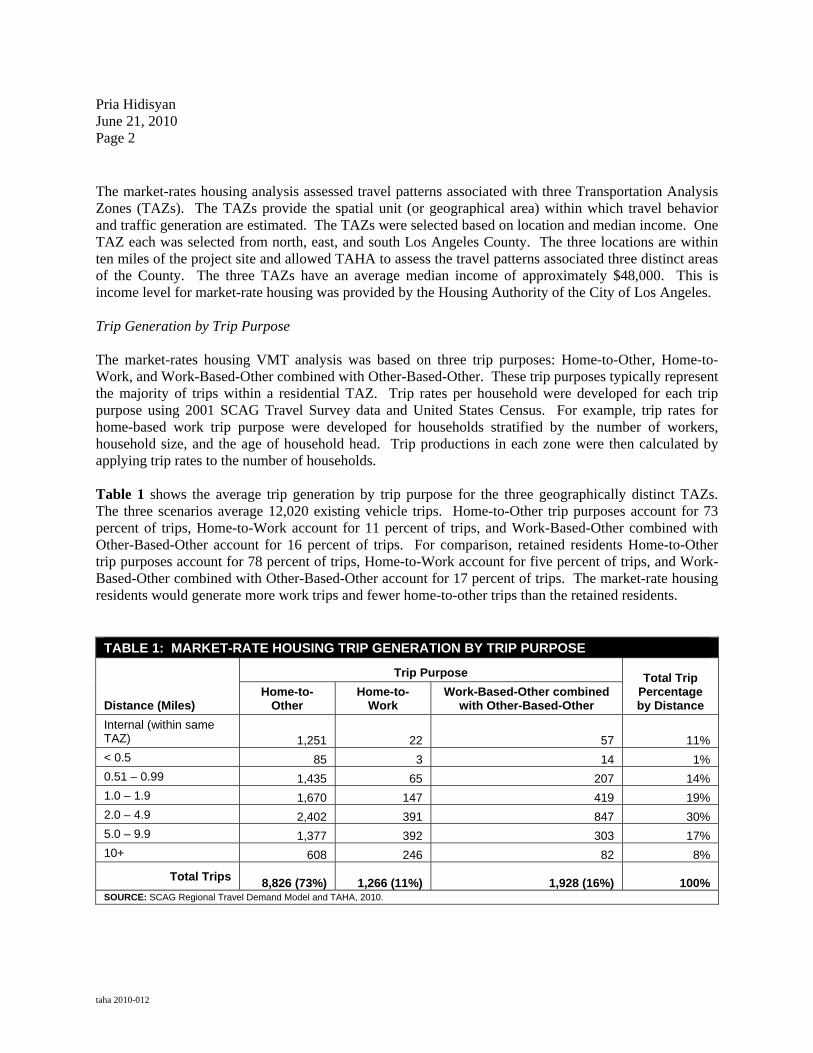
The market-rates housing analysis assessed travel patterns associated with three Transportation Analysis Zones (TAZs). The TAZs provide the spatial unit (or geographical area) within which travel behavior and traffic generation are estimated. The TAZs were selected based on location and median income. One TAZ each was selected from north, east, and south Los Angeles County. The three locations are within ten miles of the project site and allowed TAHA to assess the travel patterns associated three distinct areas of the County. The three TAZs have an average median income of approximately $48,000. This is income level for market-rate housing was provided by the Housing Authority of the City of Los Angeles. Trip Generation by Trip Purpose The market-rates housing VMT analysis was based on three trip purposes: Home-to-Other, Home-to-Work, and Work-Based-Other combined with Other-Based-Other. These trip purposes typically represent the majority of trips within a residential TAZ. Trip rates per household were developed for each trip purpose using 2001 SCAG Travel Survey data and United States Census. For example, trip rates for home-based work trip purpose were developed for households stratified by the number of workers, household size, and the age of household head. Trip productions in each zone were then calculated by applying trip rates to the number of households. Table 1 shows the average trip generation by trip purpose for the three geographically distinct TAZs. The three scenarios average 12,020 existing vehicle trips. Home-to-Other trip purposes account for 73 percent of trips, Home-to-Work account for 11 percent of trips, and Work-Based-Other combined with Other-Based-Other account for 16 percent of trips. For comparison, retained residents Home-to-Other trip purposes account for 78 percent of trips, Home-to-Work account for five percent of trips, and Work-Based-Other combined with Other-Based-Other account for 17 percent of trips. The market-rate housing residents would generate more work trips and fewer home-to-other trips than the retained residents.
TABLE 1: MARKET-RATE HOUSING TRIP GENERATION BY TRIP PURPOSE
Distance (Miles)
Trip Purpose Total Trip Percentage by Distance
Home-to-Other
Home-to-Work
Work-Based-Other combined with Other-Based-Other
Internal (within same TAZ) 1,251 22 57 11%
< 0.5 85 3 14 1%
0.51 – 0.99 1,435 65 207 14%
1.0 – 1.9 1,670 147 419 19%
2.0 – 4.9 2,402 391 847 30%
5.0 – 9.9 1,377 392 303 17%
10+ 608 246 82 8%
Total Trips
8,826 (73%)
1,266 (11%) 1,928 (16%) 100% SOURCE: SCAG Regional Travel Demand Model and TAHA, 2010.
Pria Hidisyan June 21, 2010 Page 3
taha 2010-012
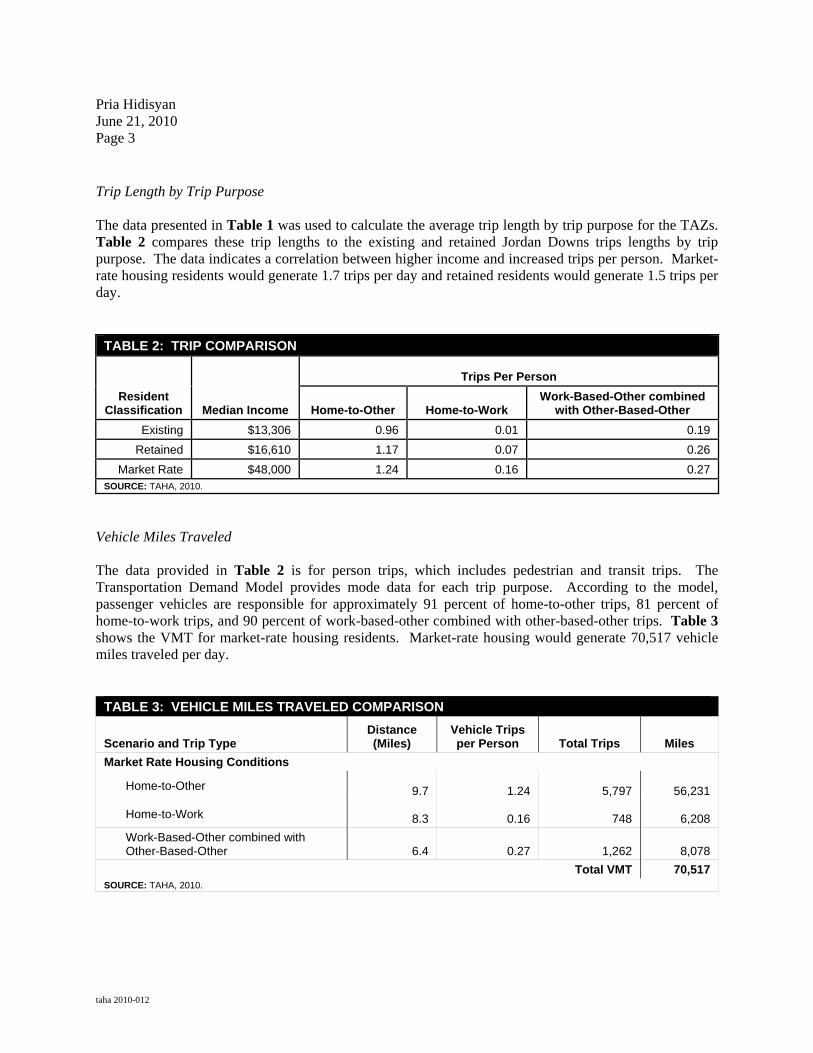
Trip Length by Trip Purpose The data presented in Table 1 was used to calculate the average trip length by trip purpose for the TAZs. Table 2 compares these trip lengths to the existing and retained Jordan Downs trips lengths by trip purpose. The data indicates a correlation between higher income and increased trips per person. Market-rate housing residents would generate 1.7 trips per day and retained residents would generate 1.5 trips per day.
TABLE 2: TRIP COMPARISON
Resident Classification Median Income
Trips Per Person
Home-to-Other Home-to-Work Work-Based-Other combined
with Other-Based-Other
Existing $13,306 0.96 0.01 0.19
Retained $16,610 1.17 0.07 0.26
Market Rate $48,000 1.24 0.16 0.27 SOURCE: TAHA, 2010.
Vehicle Miles Traveled The data provided in Table 2 is for person trips, which includes pedestrian and transit trips. The Transportation Demand Model provides mode data for each trip purpose. According to the model, passenger vehicles are responsible for approximately 91 percent of home-to-other trips, 81 percent of home-to-work trips, and 90 percent of work-based-other combined with other-based-other trips. Table 3 shows the VMT for market-rate housing residents. Market-rate housing would generate 70,517 vehicle miles traveled per day.
TABLE 3: VEHICLE MILES TRAVELED COMPARISON
Scenario and Trip Type Distance (Miles)
Vehicle Trips per Person Total Trips Miles
Market Rate Housing Conditions
Home-to-Other 9.7 1.24 5,797 56,231
Home-to-Work 8.3 0.16 748 6,208
Work-Based-Other combined with Other-Based-Other 6.4 0.27 1,262 8,078
Total VMT 70,517 SOURCE: TAHA, 2010.
Pria Hidisyan June 21, 2010 Page 4
taha 2010-012
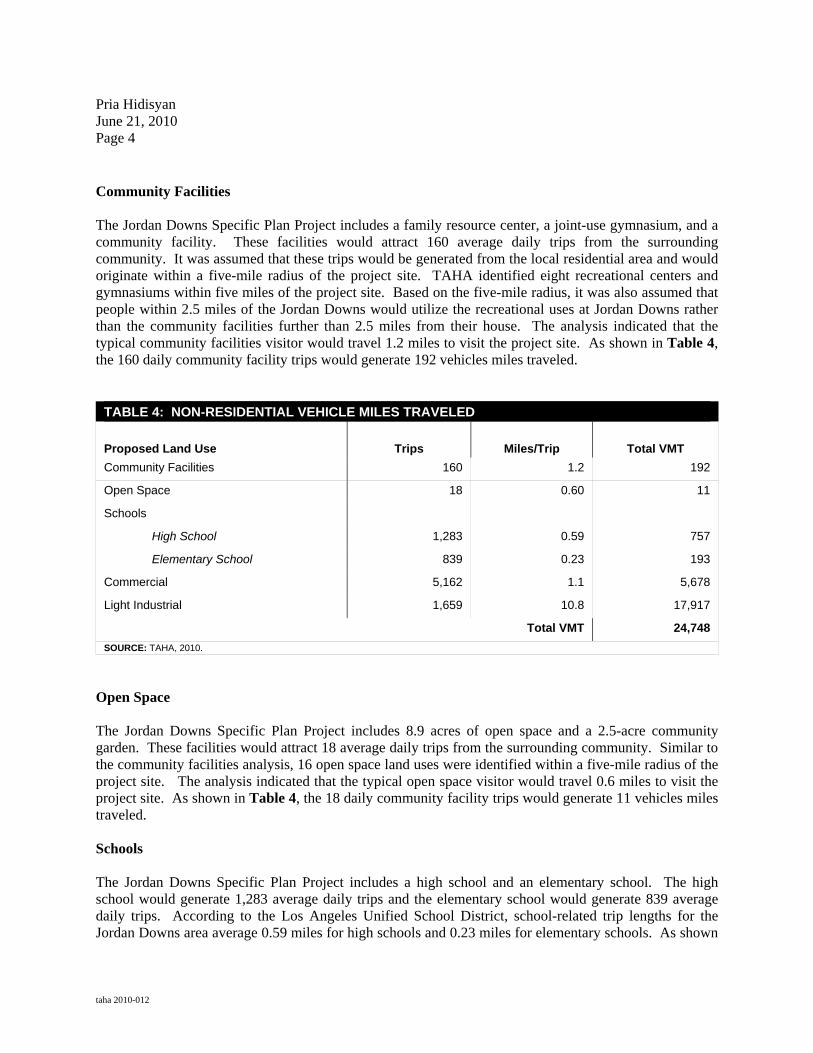
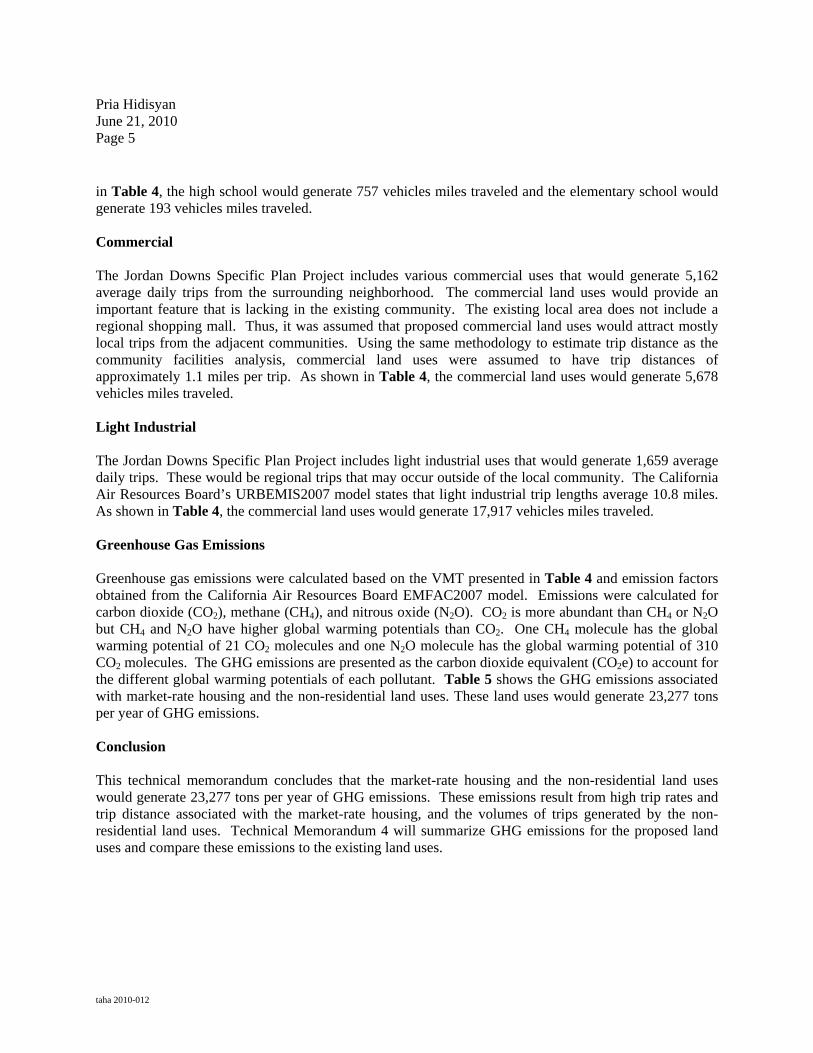
Community Facilities The Jordan Downs Specific Plan Project includes a family resource center, a joint-use gymnasium, and a community facility. These facilities would attract 160 average daily trips from the surrounding community. It was assumed that these trips would be generated from the local residential area and would originate within a five-mile radius of the project site. TAHA identified eight recreational centers and gymnasiums within five miles of the project site. Based on the five-mile radius, it was also assumed that people within 2.5 miles of the Jordan Downs would utilize the recreational uses at Jordan Downs rather than the community facilities further than 2.5 miles from their house. The analysis indicated that the typical community facilities visitor would travel 1.2 miles to visit the project site. As shown in Table 4, the 160 daily community facility trips would generate 192 vehicles miles traveled.
TABLE 4: NON-RESIDENTIAL VEHICLE MILES TRAVELED
Proposed Land Use Trips Miles/Trip Total VMT
Community Facilities 160 1.2 192
Open Space 18 0.60 11
Schools
High School 1,283 0.59 757
Elementary School 839 0.23 193
Commercial 5,162 1.1 5,678
Light Industrial 1,659 10.8 17,917
Total VMT 24,748
SOURCE: TAHA, 2010.
Open Space The Jordan Downs Specific Plan Project includes 8.9 acres of open space and a 2.5-acre community garden. These facilities would attract 18 average daily trips from the surrounding community. Similar to the community facilities analysis, 16 open space land uses were identified within a five-mile radius of the project site. The analysis indicated that the typical open space visitor would travel 0.6 miles to visit the project site. As shown in Table 4, the 18 daily community facility trips would generate 11 vehicles miles traveled. Schools The Jordan Downs Specific Plan Project includes a high school and an elementary school. The high school would generate 1,283 average daily trips and the elementary school would generate 839 average daily trips. According to the Los Angeles Unified School District, school-related trip lengths for the Jordan Downs area average 0.59 miles for high schools and 0.23 miles for elementary schools. As shown
Pria Hidisyan June 21, 2010 Page 5
taha 2010-012
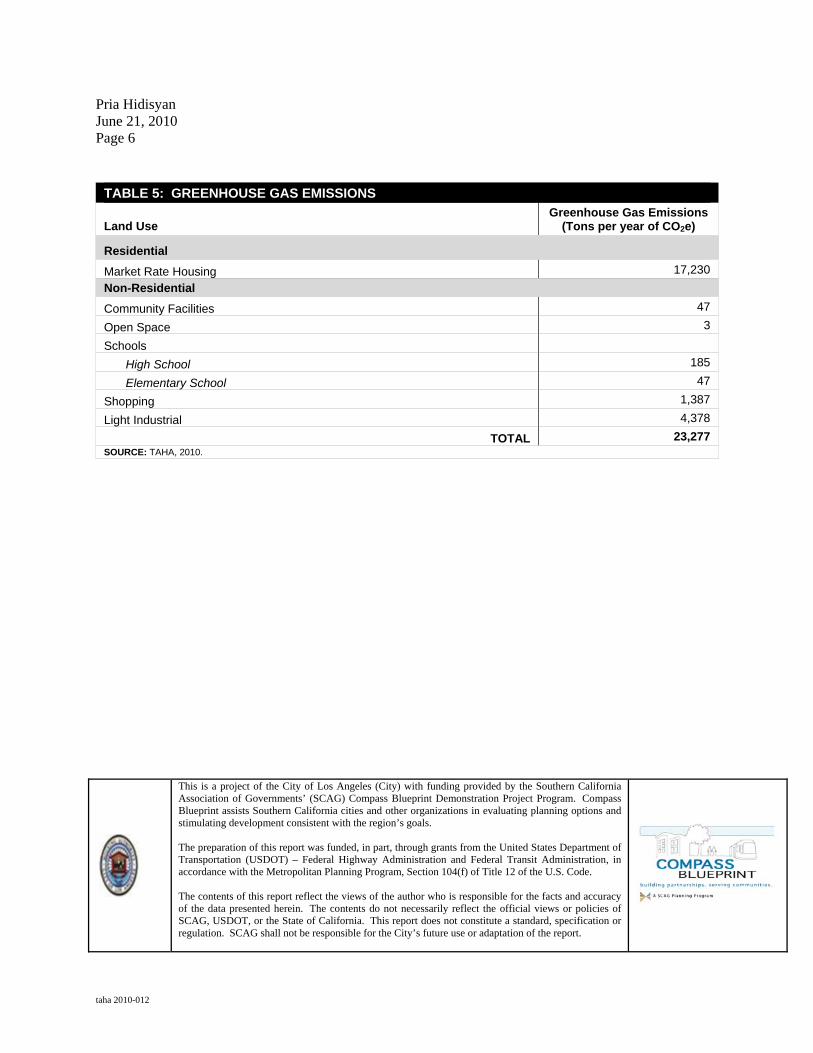
in Table 4, the high school would generate 757 vehicles miles traveled and the elementary school would generate 193 vehicles miles traveled. Commercial The Jordan Downs Specific Plan Project includes various commercial uses that would generate 5,162 average daily trips from the surrounding neighborhood. The commercial land uses would provide an important feature that is lacking in the existing community. The existing local area does not include a regional shopping mall. Thus, it was assumed that proposed commercial land uses would attract mostly local trips from the adjacent communities. Using the same methodology to estimate trip distance as the community facilities analysis, commercial land uses were assumed to have trip distances of approximately 1.1 miles per trip. As shown in Table 4, the commercial land uses would generate 5,678 vehicles miles traveled. Light Industrial The Jordan Downs Specific Plan Project includes light industrial uses that would generate 1,659 average daily trips. These would be regional trips that may occur outside of the local community. The California Air Resources Board’s URBEMIS2007 model states that light industrial trip lengths average 10.8 miles. As shown in Table 4, the commercial land uses would generate 17,917 vehicles miles traveled. Greenhouse Gas Emissions Greenhouse gas emissions were calculated based on the VMT presented in Table 4 and emission factors obtained from the California Air Resources Board EMFAC2007 model. Emissions were calculated for carbon dioxide (CO2), methane (CH4), and nitrous oxide (N2O). CO2 is more abundant than CH4 or N2O but CH4 and N2O have higher global warming potentials than CO2. One CH4 molecule has the global warming potential of 21 CO2 molecules and one N2O molecule has the global warming potential of 310 CO2 molecules. The GHG emissions are presented as the carbon dioxide equivalent (CO2e) to account for the different global warming potentials of each pollutant. Table 5 shows the GHG emissions associated with market-rate housing and the non-residential land uses. These land uses would generate 23,277 tons per year of GHG emissions. Conclusion This technical memorandum concludes that the market-rate housing and the non-residential land uses would generate 23,277 tons per year of GHG emissions. These emissions result from high trip rates and trip distance associated with the market-rate housing, and the volumes of trips generated by the non-residential land uses. Technical Memorandum 4 will summarize GHG emissions for the proposed land uses and compare these emissions to the existing land uses.
Pria Hidisyan June 21, 2010 Page 6
taha 2010-012
TABLE 5: GREENHOUSE GAS EMISSIONS
Land Use Greenhouse Gas Emissions
(Tons per year of CO2e)
Residential
Market Rate Housing 17,230
Non-Residential
Community Facilities 47
Open Space 3
Schools
High School 185
Elementary School 47
Shopping 1,387
Light Industrial 4,378
TOTAL 23,277 SOURCE: TAHA, 2010.
This is a project of the City of Los Angeles (City) with funding provided by the Southern California Association of Governments’ (SCAG) Compass Blueprint Demonstration Project Program. Compass Blueprint assists Southern California cities and other organizations in evaluating planning options and stimulating development consistent with the region’s goals. The preparation of this report was funded, in part, through grants from the United States Department of Transportation (USDOT) – Federal Highway Administration and Federal Transit Administration, in accordance with the Metropolitan Planning Program, Section 104(f) of Title 12 of the U.S. Code. The contents of this report reflect the views of the author who is responsible for the facts and accuracy of the data presented herein. The contents do not necessarily reflect the official views or policies of SCAG, USDOT, or the State of California. This report does not constitute a standard, specification or regulation. SCAG shall not be responsible for the City’s future use or adaptation of the report.

T e r r y A . H a y e s A s s o c i a t e s L L C
8522 Nat ional Boulevard, Suite102
C u l v e r C i t y , C A 9 0 2 3 2
310.839.4200 fax 310.839.4201
w e b t a h a . c o m
taha 2010-012
Memorandum TO: Pria Hidisyan, Senior Regional Planner Southern California Association of Governments FROM: Sam Silverman, Senior Associate Terry A. Hayes Associates LLC DATE: June 21, 2010 RE: Jordan Downs Specific Plan Greenhouse Gas Emissions Analysis Technical
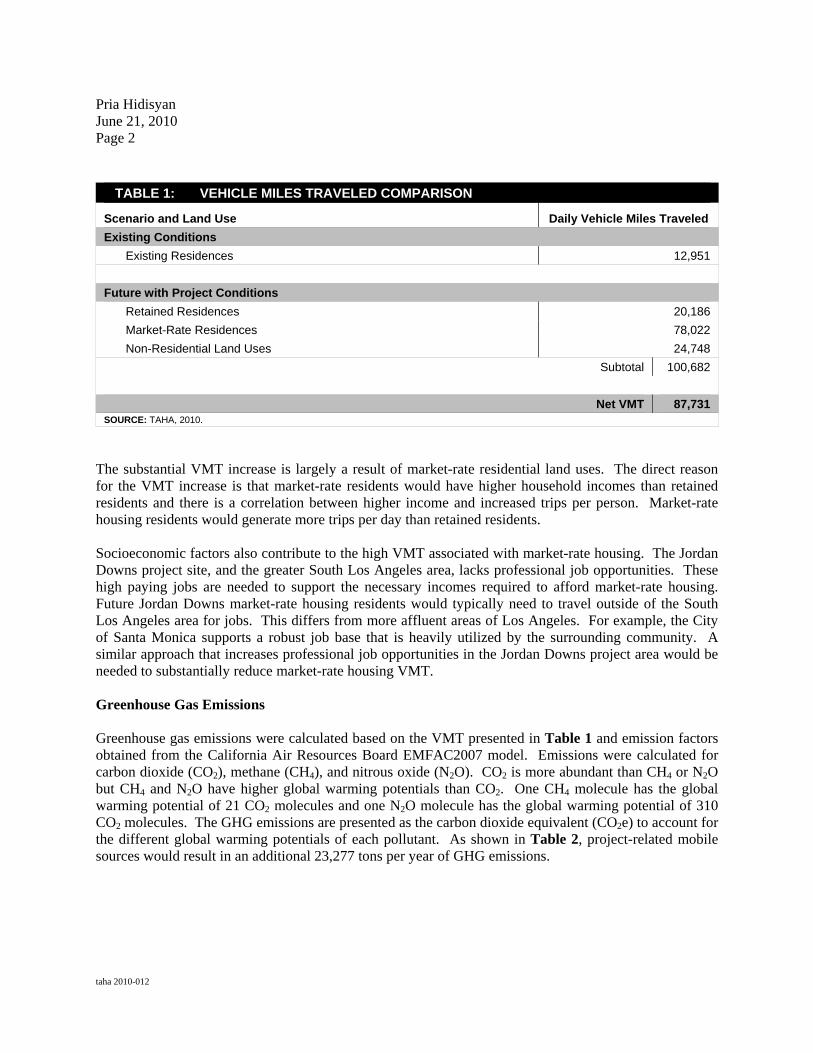
Memorandum 4 Terry A. Hayes Associates LLC (TAHA) is completing a mobile source greenhouse gas (GHG) emissions analysis for the Jordan Downs Specific Plan Project. The analysis is presented in a series of four technical memorandums. The methodology for the analysis was summarized in Technical Memorandum 1. The first memorandum also established a baseline for Jordan Downs and summarized trip generation by trip purpose, geographic distribution, and trip length from Jordan Downs to surrounding areas. The second memorandum summarized the geographic distribution and length of trips of retained residents at Jordan Downs. This information was used to calculate residential vehicle miles traveled (VMT) and associated greenhouse gas (GHG) emissions. The third memorandum assessed GHG emissions from market-rate housing and non-residential vehicle trips. The purpose of the fourth memorandum is to combine the first three memorandums to show how the proposed project would affect VMT and GHG emissions. The analysis includes a summary of the various land uses associated with the proposed project, including public housing, market rate housing, and commercial land uses. Vehicle Miles Traveled Vehicle miles traveled was estimated using United States Census data on incomes and trip information from the Southern California Association of Governments Transportation Demand Model. Detailed explanations of the methodologies used to calculate the VMT are presented in the first three technical memorandums. As shown in Table 1, the proposed project would result in an additional 87,731 VMT over baseline conditions.
Pria Hidisyan June 21, 2010 Page 2
taha 2010-012
TABLE 1: VEHICLE MILES TRAVELED COMPARISON
Scenario and Land Use Daily Vehicle Miles Traveled
Existing Conditions
Existing Residences 12,951
Future with Project Conditions
Retained Residences 20,186
Market-Rate Residences 78,022
Non-Residential Land Uses 24,748
Subtotal 100,682
Net VMT 87,731 SOURCE: TAHA, 2010.
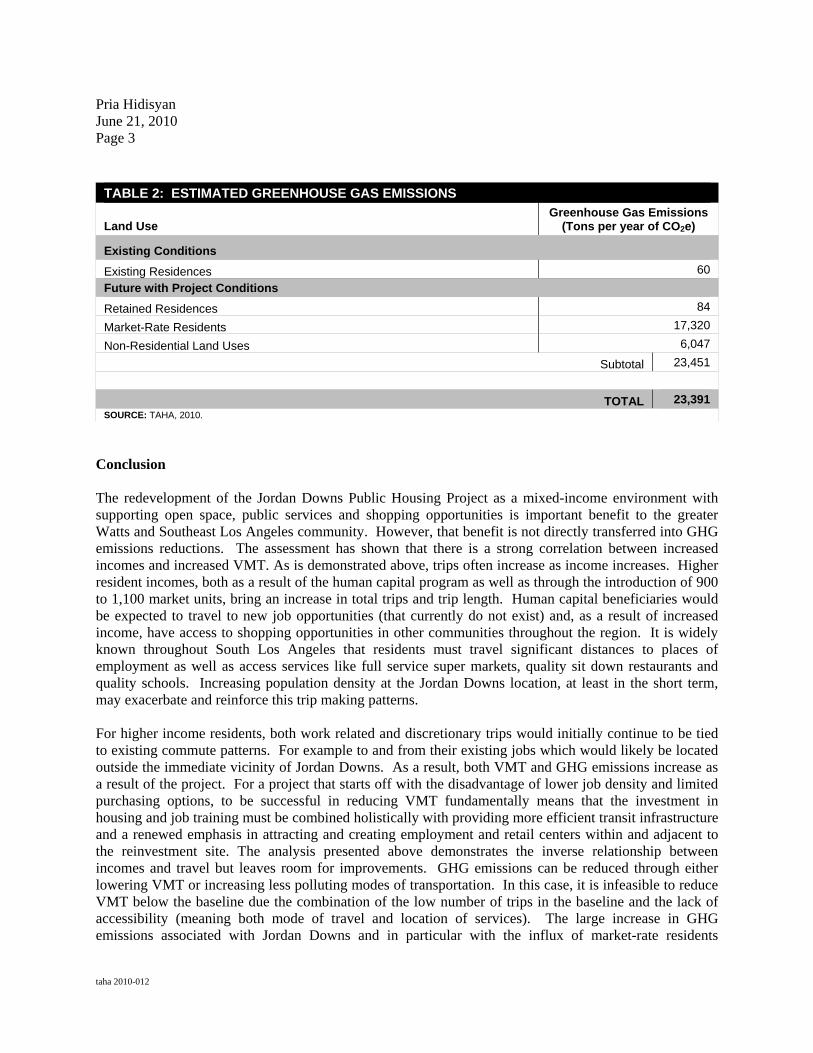
The substantial VMT increase is largely a result of market-rate residential land uses. The direct reason for the VMT increase is that market-rate residents would have higher household incomes than retained residents and there is a correlation between higher income and increased trips per person. Market-rate housing residents would generate more trips per day than retained residents. Socioeconomic factors also contribute to the high VMT associated with market-rate housing. The Jordan Downs project site, and the greater South Los Angeles area, lacks professional job opportunities. These high paying jobs are needed to support the necessary incomes required to afford market-rate housing. Future Jordan Downs market-rate housing residents would typically need to travel outside of the South Los Angeles area for jobs. This differs from more affluent areas of Los Angeles. For example, the City of Santa Monica supports a robust job base that is heavily utilized by the surrounding community. A similar approach that increases professional job opportunities in the Jordan Downs project area would be needed to substantially reduce market-rate housing VMT. Greenhouse Gas Emissions Greenhouse gas emissions were calculated based on the VMT presented in Table 1 and emission factors obtained from the California Air Resources Board EMFAC2007 model. Emissions were calculated for carbon dioxide (CO2), methane (CH4), and nitrous oxide (N2O). CO2 is more abundant than CH4 or N2O but CH4 and N2O have higher global warming potentials than CO2. One CH4 molecule has the global warming potential of 21 CO2 molecules and one N2O molecule has the global warming potential of 310 CO2 molecules. The GHG emissions are presented as the carbon dioxide equivalent (CO2e) to account for the different global warming potentials of each pollutant. As shown in Table 2, project-related mobile sources would result in an additional 23,277 tons per year of GHG emissions.
Pria Hidisyan June 21, 2010 Page 3
taha 2010-012
TABLE 2: ESTIMATED GREENHOUSE GAS EMISSIONS
Land Use Greenhouse Gas Emissions
(Tons per year of CO2e)
Existing Conditions
Existing Residences 60
Future with Project Conditions
Retained Residences 84
Market-Rate Residents 17,320
Non-Residential Land Uses 6,047
Subtotal 23,451
TOTAL 23,391 SOURCE: TAHA, 2010.
Conclusion The redevelopment of the Jordan Downs Public Housing Project as a mixed-income environment with supporting open space, public services and shopping opportunities is important benefit to the greater Watts and Southeast Los Angeles community. However, that benefit is not directly transferred into GHG emissions reductions. The assessment has shown that there is a strong correlation between increased incomes and increased VMT. As is demonstrated above, trips often increase as income increases. Higher resident incomes, both as a result of the human capital program as well as through the introduction of 900 to 1,100 market units, bring an increase in total trips and trip length. Human capital beneficiaries would be expected to travel to new job opportunities (that currently do not exist) and, as a result of increased income, have access to shopping opportunities in other communities throughout the region. It is widely known throughout South Los Angeles that residents must travel significant distances to places of employment as well as access services like full service super markets, quality sit down restaurants and quality schools. Increasing population density at the Jordan Downs location, at least in the short term, may exacerbate and reinforce this trip making patterns. For higher income residents, both work related and discretionary trips would initially continue to be tied to existing commute patterns. For example to and from their existing jobs which would likely be located outside the immediate vicinity of Jordan Downs. As a result, both VMT and GHG emissions increase as a result of the project. For a project that starts off with the disadvantage of lower job density and limited purchasing options, to be successful in reducing VMT fundamentally means that the investment in housing and job training must be combined holistically with providing more efficient transit infrastructure and a renewed emphasis in attracting and creating employment and retail centers within and adjacent to the reinvestment site. The analysis presented above demonstrates the inverse relationship between incomes and travel but leaves room for improvements. GHG emissions can be reduced through either lowering VMT or increasing less polluting modes of transportation. In this case, it is infeasible to reduce VMT below the baseline due the combination of the low number of trips in the baseline and the lack of accessibility (meaning both mode of travel and location of services). The large increase in GHG emissions associated with Jordan Downs and in particular with the influx of market-rate residents
Pria Hidisyan June 21, 2010 Page 4
taha 2010-012
underscores the importance of ensuring that historically underserved communities receive a fair share of the benefits of the transportation system. However, there are additional factors that cannot be easily quantified but emphasize the importance of coordinated planning efforts if Statewide GHG emissions targets are to be achieved. Ultimately, average trips and trip lengths can be reduced on a per capita basis through smart design at the regional and local level. Opportunities exist through the inclusion of Jordan Downs within the expanded Watts Redevelopment area through increase access to investment. Additional opportunities exist through coordinated efforts among the local transit agencies to maximize the existing connections to the Metro Blue Line and Green Line. Specific emphasis should be placed on expanding more frequent feeder bus service to the Blue and Green light rail lines, as well LADOT shuttle circulator services should be revisited ensure that there adequate transit to meet the needs of a wide range of non-work related discretionary trips.
This is a project of the City of Los Angeles (City) with funding provided by the Southern California Association of Governments’ (SCAG) Compass Blueprint Demonstration Project Program. Compass Blueprint assists Southern California cities and other organizations in evaluating planning options and stimulating development consistent with the region’s goals. The preparation of this report was funded, in part, through grants from the United States Department of Transportation (USDOT) – Federal Highway Administration and Federal Transit Administration, in accordance with the Metropolitan Planning Program, Section 104(f) of Title 12 of the U.S. Code. The contents of this report reflect the views of the author who is responsible for the facts and accuracy of the data presented herein. The contents do not necessarily reflect the official views or policies of SCAG, USDOT, or the State of California. This report does not constitute a standard, specification or regulation. SCAG shall not be responsible for the City’s future use or adaptation of the report.