rcesr discussion paper series - hitotsubashi...
TRANSCRIPT
No. DP15-4
RCESR Discussion Paper Series Estimating the shares of secondary- and tertiary-sector output in the age
of early modern growth:
the case of Japan, 1600-1874
May 2015
Osamu Saito, Hitotsubashi University
Masanori Takashima, Hitotsubashi University
The Research Center for Economic and Social Risks Institute of Economic Research
Hitotsubashi University
2-1 Naka, Kunitachi, Tokyo, 186-8603 JAPAN http://risk.ier.hit-u.ac.jp/
RCESR
1
Estimating the shares of secondary- and tertiary-sector output in the age of early modern growth:
the case of Japan, 1600-1874∗
Osamu Saito (Hitotsubashi University) and
Masanori Takashima (Hitotsubashi University)
This version: 26 May 2015
Abstract
This paper proposes a new methodology of estimating non-primary sector output shares in early
modern growth. By using data from proto-industrial Japan, the paper demonstrates, first, that not just
the rate of urbanisation but population density would also work as another predictor of the secondary
and tertiary sectoral shares when growth was rural-centred; and second, that regional panel data
should be constructed from earliest possible sets of modern data to estimate the coefficients of these
two variables on the sectoral shares. In order to apply the coefficients derived from modern data for
the calculation of pre-modern estimates, regional panel data are far superior to simple time-series
statistics. The paper presents new per-capita GDP estimates thus computed for Japan 1600-1874,
together with a brief comparison with previous estimates, especially those by Angus Maddison.
∗ An earlier version of this paper was presented at the Conference on Accounting for the Great Divergence, University of Warwick in Venice and the Socio-Economic History Society’s Annual Conference, both in May 2014. We are grateful to participants of these two sessions for comments, discussions and suggestions.
2
1. Introduction
It has long been recognised that even for countries whose historic series of population and farm
output may be estimated without much trouble, data on industrial goods and services are not readily
available for any country in early modern times. It is against this background that Paolo Malanima
(2003, 2011) has proposed a way in which this difficulty is circumvented. On the basis of the
observation that in pre-Unification Italy industry and trades exhibited a cycle of rise and decline over
the seven centuries, and also that ‘urbanisation rates reflect this trend’ (Malanima 2011, p. 181), his
suggestion is to estimate the shares of secondary- and tertiary-sector goods and services in the period
before Unification by multiplying a historic series of urbanisation rates by a parameter derived from
a statistical exploration of post-Unification data on the relationship between urbanisation and the
secondary- and tertiary-sector shares of output. This single-parameter model with the use of a
later-day time-series dataset for the estimation of the parameter is likely to attract the attention of
researchers working on any countries, European and non-European alike, where a series of
urbanisation measure is available (see Álvarez-Nogal and Prados de la Escosura 2007, p. 341, for
Spain, and Bassino et al. 2011, for Japan).1
However, there are a couple of difficulties we have to address before the application of this
estimation method. First, it is likely that the model may not fit with the proto-industrial age. In that
period, despite its naming, both industry and services grew in the countryside, as a result of which
the relationship between the share of non-primary sector output and the rate of urbanisation often
became less straightforward. Second, there is a drawback associated with the use of later-day data:
in any statistical examination of such data, variables involved are those influenced by changes that
took place during the later course of modern economic growth.
Given these two problems, we propose a two-parameter model for the estimation of secondary-
and tertiary-sector shares and also the use of regional panel data for the calculation of the parameters.
The parameters we are going to use are those reflecting the effect of population density as well as
that of urbanisation. In his analysis of Japan’s proto-industrialisation, Saito (1983) showed – based
on cross-sectional data for early Meiji Japan – that urbanisation was not the sole predictor of
population density while there was a significant correlation between population density and the
prevalence of rural industry. While the former is consistent with the urbanisation pattern identified
by de Vries (1984) for proto-industrial Europe, the latter finding implies that the density of
1 Note that they are two of the studies whose estimates are included in the first report of the newly launched Maddison Project. For this project, see Bolt and van Zanden (2014).
3
population can be regarded as a supply-side factor for proto-industrial activities. The implication of
this early-Meiji study for the estimation of non-agricultural shares in the age of early modern growth
is, therefore, that both population density and the rate of urbanisation may be used to obtain better
estimates of the share of secondary- or tertiary-sector output as long as the age of
proto-industrialisation is concerned.
In order to demonstrate that this methodology will work, therefore, the paper will explore an
updated set of Meiji statistical data. First, a Meiji-period regional panel database will be constructed
for the benchmark years of 1874, 1890 and 1909 from more diversified data sources at prefectural,
rather than regional levels in order to conduct regression analysis of the regional panel data with the
two explanatory variables (i.e. population density and the rate of urbanisation) plus several dummy
variables. With the estimated coefficients of the two variables, second, the shares of secondary- and
tertiary-sector output for the benchmark years before 1850 will be back-projected to Tokugawa
benchmark years. Finally, the results of this back-projection exercise will be evaluated against the
historiography of Tokugawa economic history.
2. Methodology
The underlying idea of Malanima’s is that the level of urbanisation was a proxy for the growth of
non-agricultural activities. Although this is to be fine-tuned by the changing non-agricultural share
in the labour force in a later stage of estimation, the first step is to explore if there was a correlation
between those two variables. With a regression coefficient derived from time-series analysis of the
two variables for modern Italy in the period between Unification and World War II, he has applied
the coefficient to pre-modern urbanisation estimates so as to obtain a series of the non-agricultural
share for the 1300-1861 period. According to his latest specification of the formula (Malanima 2011,
p. 183),
Yna(t)/Y(t) = 15.371 + 1.82U (1)
where Yna(t)/Y(t) Yna/Y(t) stands for the share of non-agricultural product and U for the rate of
urbanisation (both in percentages). This result suggests that in Italy one percentage-point rise in
urbanisation must have led to a 1.82 percentage-point increase in the share of the non-primary sector
in the total product.
Like pre-Unification Italy, Tokugawa Japan offers us reasonably robust estimates of population

4
and primary-sector output (see figure 1)2, but little is known about goods and services produced
outside the primary sector in this period of early modern growth. Malanima’s proposal is thus
attractive to Japan specialists too.
[Insert figures 1-2 here]
However, if applied to the early modern Japanese situation, his formula would produce a
long-run decline in the non-primary share during the latter half of the Tokugawa period since the
level of urbanisation, having reached a peak in the late sixteenth century, exhibited a downward
trend towards the end of the period in question. The phenomenon was brought to light first by
Thomas Smith in his seminal paper on pre-modern economic growth, who found that 24 out of 35
castle towns, for which he assembled population data for the period from c.1700 to 1850, lost its
commoner population considerably, seven saw its population neither increased nor decreased
markedly, and only four grew in size (Smith 1973). According to our own estimates of the rate of
urbanisation, defined as the proportion of people living in settlements with population of 10,000 or
over (figure 2), the national level of urbanisation increased from 6 % in 1600 to 12.6 % in 1721.
However, the eighteenth century saw the urban growth came to a standstill: in fact, the share of
people living in cities of at least 10,000 declined marginally to 12.3 % in 1846 and then more
perceptibly to 10 % in 1874. What we know about the period from c.1700 to 1850, however, is that
both rural industry and commerce grew during that period. There is evidence that in many cases,
while the provincial city declined, the population in the rest of the province increased, suggesting
that much of non-agricultural income must have been earned by peasants in the form of
by-employment. As a result of this change or “rural-centred growth” as Smith termed it, therefore,
the non-agricultural share must have reached a considerable level towards the end of the Tokugawa
period (Smith 1969). According to an input-output table constructed by Shunsaku Nishikawa for a
daimyo domain called Chōshū (a region whose per capita GDP level stood close to the median
according to prefectural-level income estimates for 1874), the non-agricultural share of income
estimated on a value added basis stood at 39 % in the 1840s, despite the fact that 75 % of the
2 The only exception for this could be population for 1600. Akira Hayami’s estimate of c. 12 million has long been accepted by many historians (see for example Miyamoto 2004, pp. 36-38). However, there are revisionists who believe that Hayami’s is too low. They include Angus Maddison and Osamu Saito. The former puts the estimate at 18.5 million (Maddison 2001, p. 237), while Saito’s is 17 million which is unpublished but quoted with other estimates in Farris (2006), p. 262. For evidence, see Saito (2015), pp. 221-23, and also Saito and Takashima (2015).

5
region’s households were agricultural (Nishikawa 1987).3 This effect of rural-centred growth in the
age of de-urbanisation would be missed out if the estimation of non-agricultural output be made only
on the basis of urbanisation trends.
As hinted earlier, however, Malanima did pay attention to this effect. In his 2011 article,
reference is made to the progress of the Italian silk industry, in which a number of peasant families
were involved, and its possible impact on the share of secondary- and tertiary-sector output. In order
to capture this aspect of the “progress”, he allows the non-agricultural share of the labour force to
change over time (Malanima 2011, pp. 184-85). Thus,
Yna(t)/Y(t) = (Yna(t0)/Y(t0)) × (Lna(t)/L na(t0)), (2)
where Lna stands for the share of the non-agricultural labour force with t0 being the base year and t
varying from t-50, t-100 and so on. However, this will not work for countries where peasant families
were also producers of non-agricultural goods and services: with farm family by-employment, it is
often hard to separate Lna from the peasant workforce. As for Japan in the period after 1874, Saito
and Settsu (2010) gives estimates for the sectoral shares of the labour force, which has been made
possible by the use of two prefectural-level matrix tables, for 1879 and 1825 respectively, of
principal and subsidiary occupations. In 1885, for example, it is revealed that the revised estimates
of the secondary- and tertiary-sector shares were both 18 %, 2 to 3 percentage points higher than the
previous estimates based only on information about principal occupations. Also revealed is that the
overall percentage by-employed of the labour force calculated from the 1879 data for a
silk-producing region was 19.5 % (with intra-sectoral by-employments excluded). For the pre-Meiji
period, however, this kind of information about subsidiary employments is virtually non-existent.
Given these difficulties, population density may be introduced as another proxy for the
non-primary share of the labour force, which represents supply-side factors in the thesis of
proto-industrialisation. For Tokugawa Japan, as figure 2 shows, urbanisation and population density
rose in tandem between 1600 and 1721, but since then the movements of the two diverged. While
the rate of urbanisation declined – marginally at first and then precipitously after the mid-century,
the level of population density did not: in fact, it began to rise towards the end of the period in
question. It is widely known, moreover, that population density could vary significantly across
districts even in a totally rural region, and more importantly that industrialised rural districts tend to
3 The non-agricultural share in the total product (including intermediate inputs) was 52%. Note, however, that Nishikawa’s “non-agricultural” category includes forestry, fishing and marine products.

6
show up as highly densely populated clusters on the population density map.4 It implies that
cross-sectional analysis may also prove useful in obtaining appropriate coefficients used for the
estimation. This consideration leads us to economic geography of proto-industrial Japan.
One of the drivers of Japan’s proto-industrialisation was, as in many other countries, textiles.
Cotton and silk were two of the most dynamic proto-industrial commodities in the period from the
late eighteenth to the early twentieth century, with cotton to the warmer west and silk to the east.
Cotton was cultivated and woven mostly in lowlands of central and western provinces while silk
reeling and weaving took root in upland districts of central and eastern provinces. As a result, the
relationship between food production (i.e. grain growing) and proto-industry varied with this
difference in economic geography, so did the relationship between proto-industry and population
density (Saito 1983). In addition to the textile industry, the size of non-textile proto-industrial
production should not be underestimated. Indeed, the largest single manufacturing industry in
Tokugawa times was brewing and the brewing of rice wine, soy sauce and miso (fermented
soybeans) were found in many areas on both sides of the boundary, together with other
manufacturing activities such as paper making and clothing (see Saito and Tanimoto 2004; Shimbo
and Saito 2004). All this suggests that the relationships between population density and urbanisation,
on the one hand, and the secondary- or tertiary-sector share, on the other, varied across the eastern as
well as the western half of the country.
It is therefore be worth exploring the relationships cross-sectionally: considering the nature of
the tasks mentioned above, probably the best strategy is to explore the same cross-sectional
distributions at several points in time. We will do this by making use of a regional panel database for
the Meiji period. In other words, just like Malanima who utilised post-Unification time-series data in
or der to regress the percentage of secondary- and tertiary-sector product on the rate of urbanisation,
we too base our estimation on a set of statistical relationships derived from a later-day Meiji material.
Our regional panel data are two-dimensional, however. The key difference with the Malanima
method is that our methodology also takes cross-sectional variations across 45 prefectures into
account.
The inherent drawback associated with the use of a later-day dataset is that variables involved
are those which are supposed to have absorbed, one way or another, influences of changes that took
place in the later periods. The employment of a two-dimensional panel analysis has a couple of 4 See, for example, early nineteenth-century district-level population density maps prepared by Eric Buyst (for Belgium) and Leigh Shaw-Taylor (for England and Wales) respectively, for O. Saito and L. Shaw-Taylor, eds., Occupational Structure and Industrialisation in a Comparative Perspective (forthcoming).
7
advantages for this question to be properly addressed. First, the number of observations on which
regression is conducted becomes much larger than a simple time-series analysis. It allows us to
include on the right-hand side of the regression equation year-dummy variables. As the benchmark
years chosen for our regional panel data are 1874, 1890 and 1909, we are thus going to include the
1890 and 1909 dummies in the regression equation. This will give us a better estimation of the
coefficients to be used for the period in which such influences were absent. Second, the regional
dimension of the panel data enables us to control for the existence of prefectures affected by Meiji
Japan’s uneven process of westernisation and industrialisation. Tokyo and, to a lesser extent, Osaka
had received from the very beginning of the new Meiji era the impact of the state-led modernisation
drive. Then Osaka started to undergo the transformation in the 1880s when the country’s ‘industrial
revolution’ took off: there, the number of joint stock companies more than tripled between 1887 and
1890. With the extension of railway mileage, its influence soon diffused to Fukuoka and then to
Aichi by the beginning of the twentieth century (Nakamura 2010, ch. 2). All this suggests that such
‘modern’ prefecture should be treated separately in the regression analysis. The inclusion of the
year-specific ‘modern’ prefectural dummy variable, together with the year dummies for 1890 and
1909, into our regression model will therefore go a substantial way towards a better estimation of the
sectoral shares to be used specifically for pre-Meiji Japan. The estimated coefficients can be
interpreted with greater confidence as reflecting the situation of most of the country’s regions in
1874, the year when the economy is said to have still more or less been early modern or
proto-industrial.
3. The Meiji-period database
The panel dataset we reconstructed includes prefectural output and population figures for the three
benchmark years, 1874, 1890 and 1909. For prefectural GDP we have adopted new estimates made
for Fukao et al. (2015).5 Since their estimates are sector-specific, our non-agricultural shares are
also sector-specific: the secondary-sector share and the tertiary-sector share can thus be separately
calculated for all the prefectures. For urban population, the prefectures’ 1874 totals are not readily
available, but a topographical book (Nihon chishi teiyō) gives population figures for cities with
10,000 or more for 1873. The 1874 urban population totals are extrapolated from 1873 by using the
5 For prefectural GDP and population, the new estimates will become available in August 2015 from the website of the Institute of Economic Research, Hitotsubashi University.

8
rate of regional population growth between 1850 and 1873 (calculated from Saito 1984).6 The data
for 1890 are from the Household and Population Statistics (Nihon Teikoku minseki kokōhyō), while
for 1909, interpolation is made on the basis of the Population Statistics of the Japanese Empire
(Nihon Teikoku jinkō seitai tōkei)’s 1908 and 1913 figures There were boundary changes for a
number of cities including six metropolitan cities, for which the corrected figures reported in
Umemura et al. (1983) are used. The total areas of prefectures are taken from the Population
Statistics, while the corresponding population totals are from the website for Fukao et al. (2015).
[Insert figures 3-4 here]
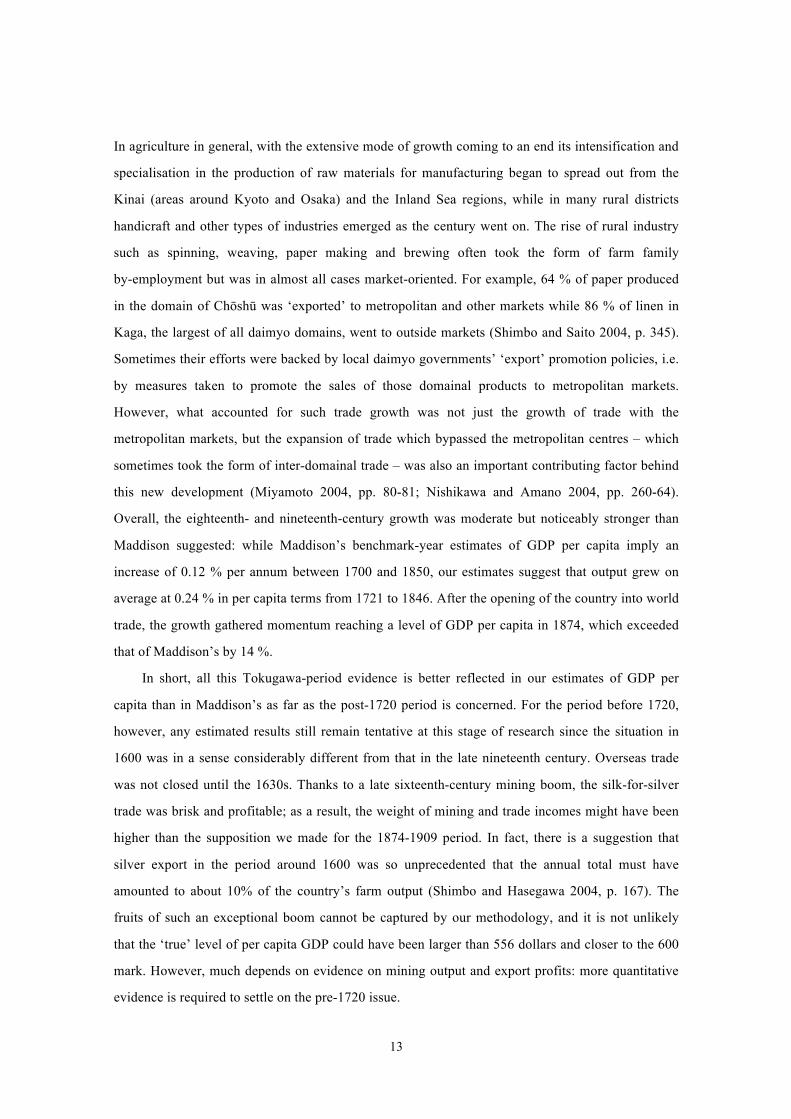
The key explanatory variables in the database are population density and the rate of
urbanisation. Both distributions are highly skewed. Figure 3 displays a scatter gram of population
density set against the level of urbanisation in 1874. Tokyo is in the upper-right corner of the graph
and Osaka on top in the middle, but all others cluster within the lower-left quarter. From the graph
two observations may be made. First, the patterns of the skewed distributions suggest that if
transformed logarithmically or logit transformed both will come closer to the normal, although this
should not be taken to mean that the correlation would also become closer (see figure 4). This in fact
leads us to the second point. There is no clear correlation between the two variables if Tokyo and
Osaka are excluded, indicating that in the early Meiji period urbanisation was still not the chief
determinant of population density. The finding lends support to our supposition that both population
density and urbanisation variables were at work separately in accounting for the non-agricultural
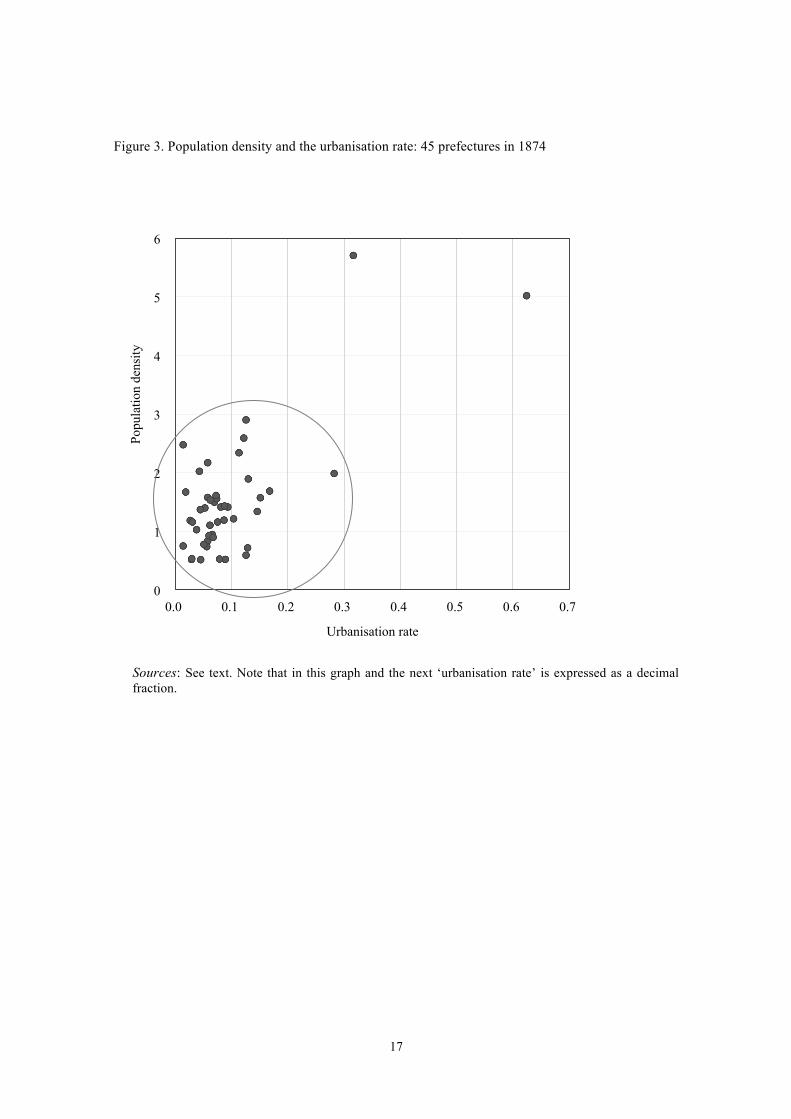
shares of output. Moreover, a pair of scatter grams – one displays population density (log
transformed) set against the secondary- and tertiary-sectoral shares (both logit transformed) and the
other showing the urbanisation rate (logit transformed) set against the same set of sectoral shares –
seems to indicate that in each case the sectoral share was positively correlated with both population
density and urbanisation (figures 5-6).
[Insert figures 5-6 here]
The number of prefectures that appeared in the 1874 statistics is 63 including three 6 In the topographical book of1873, however, there are cities whose population entries are dubious. In those cases, the population totals are interpolated by using the rate of population growth between 1850 and 1878 (the latter of which are a statistical report, Kyōbu seihyō, compiled by the Army’s General Staff Office.
9
metropolitan prefectures of Tokyo, Osaka and Kyoto, but the number of prefectures was reduced to
47 in the mid- and late-Meiji years of 1890 and 1909. Of the 63, Hokkaido and Okinawa are
excluded from the analysis because their economic conditions and development levels were vastly
different from other prefectures of the period in question; thus the remaining 60 are grouped into 45.
In the regression analysis ‘modern’ prefectures are identified and treated separately. They are
those which had already been affected by the uneven process of industrialisation and westernisation.
Given the account made at the end of the previous section, we give 1 to Tokyo and Osaka from 1874
onwards, and to Aichi and Fukuoka only for 1909, while all the other cases the dummy variable
takes 0.
When conducting regression analysis, we will also consider if there were any noticeable
regional, especially east-west differences. Decades ago Saito (1983) suggested that the ways in
which urbanisation or population density exerted an impact on proto-industrialisation in eastern
provinces differed from the forces at work in their western counterparts. Considering the general
tendency in the latter half of the Tokugawa period that the gravity of industrial production shifted
gradually from the west to the east, it is likely that the observed level of the secondary-sector share
or the tertiary-sector share, or both, were higher in the east than in the west if both urbanisation and
population density are controlled for. To see if it were really the case, we include in the regression
equation a shift dummy which takes 1 if the prefecture was in the eastern half of Japan.
4. Regression analysis
On the basis of this Meiji-period database, regression analysis is conducted for the secondary-sector
and the tertiary-sector shares separately. The same set of variables will be included on the right-hand
side of the equation, i.e. the two major variables of population density and the urbanisation rate plus
the prefectural and year dummy variables; but it is expected that while the two major variables will
turn out to be at work simultaneously in both cases, the two may behave somewhat differently.
Given the nature of the sectors, it is likely that while for secondary-sector output growth the
supply-side variable (population density) had a comparatively greater effect than the demand-side
variable (urbanisation), the other way round was the case for output growth in the tertiary sector.
The secondary-sector share variable (S-share) employed here is defined in relation to the size of
the primary sector whose estimates are less problematic for the Tokugawa period. S-share is,
therefore, measured as the proportion of secondary-sector output to the sum of primary- and
secondary-sector output. Thus, the basic regression equation is as follows:
10
𝐿𝑛 𝑆-‐𝑠ℎ𝑎𝑟𝑒
1 − 𝑆-‐𝑠ℎ𝑎𝑟𝑒= 𝛼! + 𝛼!𝑙𝑛𝐷 + 𝛼!𝑙𝑛
𝑈1 − 𝑈
+ 𝛼!𝐸 + 𝛼!𝑚 + 𝛼!𝑦𝑟1 + 𝛼!𝑦𝑟2 + 𝜀 (3)
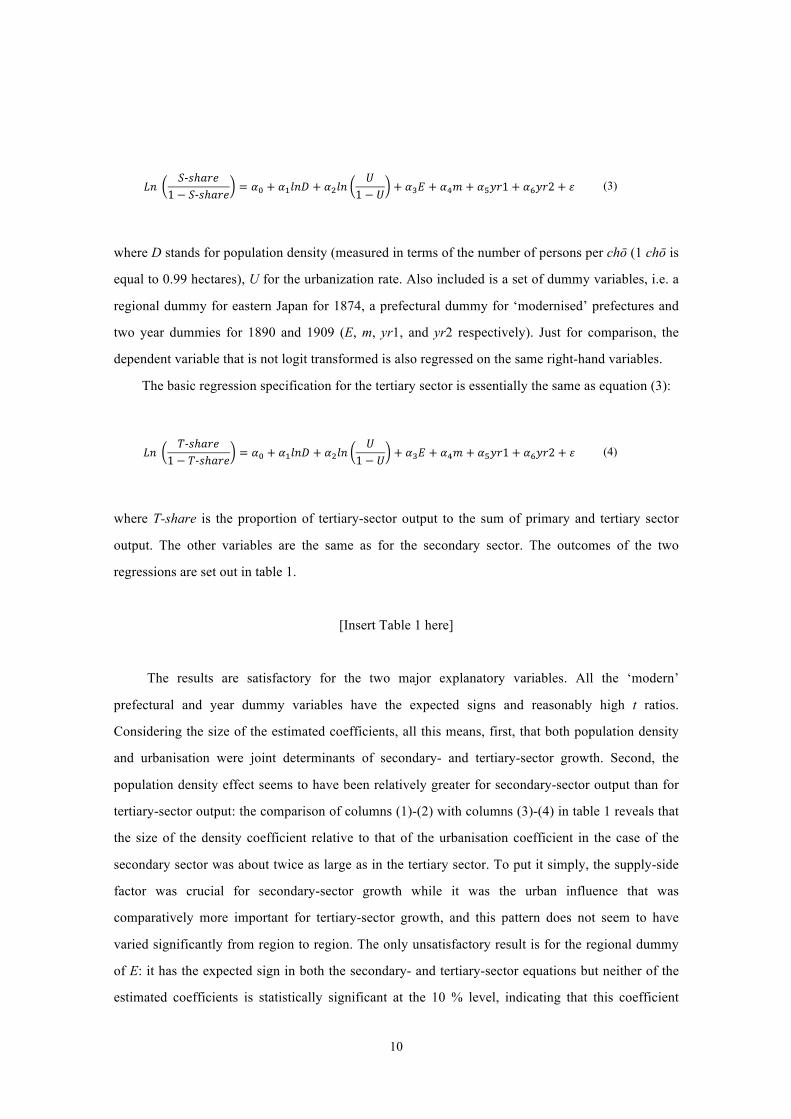
where D stands for population density (measured in terms of the number of persons per chō (1 chō is
equal to 0.99 hectares), U for the urbanization rate. Also included is a set of dummy variables, i.e. a
regional dummy for eastern Japan for 1874, a prefectural dummy for ‘modernised’ prefectures and
two year dummies for 1890 and 1909 (E, m, yr1, and yr2 respectively). Just for comparison, the
dependent variable that is not logit transformed is also regressed on the same right-hand variables.
The basic regression specification for the tertiary sector is essentially the same as equation (3):
𝐿𝑛 𝑇-‐𝑠ℎ𝑎𝑟𝑒
1 − 𝑇-‐𝑠ℎ𝑎𝑟𝑒= 𝛼! + 𝛼!𝑙𝑛𝐷 + 𝛼!𝑙𝑛
𝑈1 − 𝑈
+ 𝛼!𝐸 + 𝛼!𝑚 + 𝛼!𝑦𝑟1 + 𝛼!𝑦𝑟2 + 𝜀 (4)
where T-share is the proportion of tertiary-sector output to the sum of primary and tertiary sector
output. The other variables are the same as for the secondary sector. The outcomes of the two
regressions are set out in table 1.
[Insert Table 1 here]
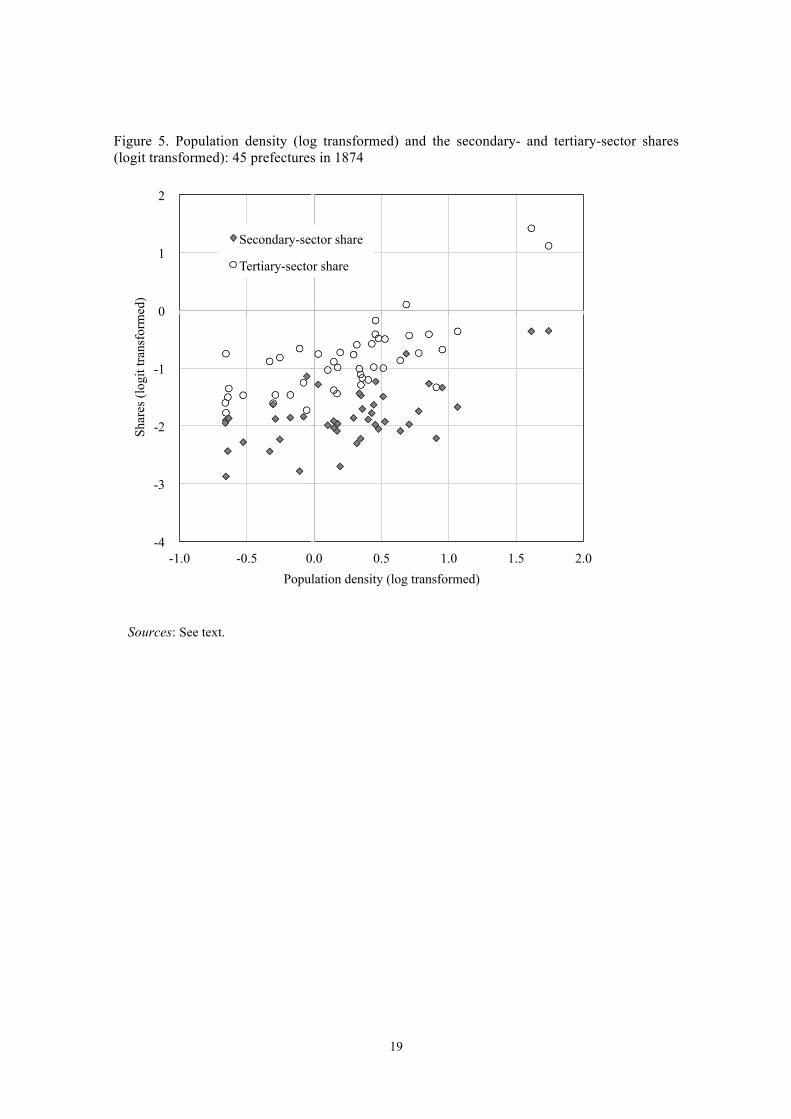
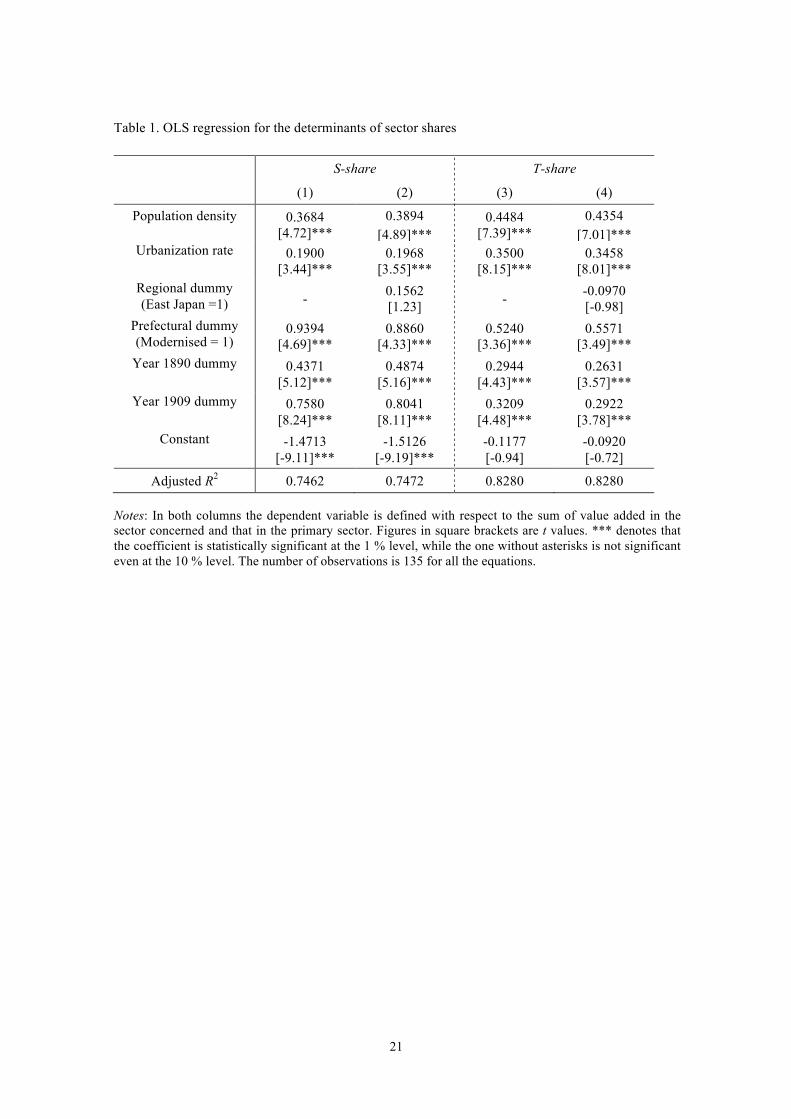
The results are satisfactory for the two major explanatory variables. All the ‘modern’
prefectural and year dummy variables have the expected signs and reasonably high t ratios.
Considering the size of the estimated coefficients, all this means, first, that both population density
and urbanisation were joint determinants of secondary- and tertiary-sector growth. Second, the
population density effect seems to have been relatively greater for secondary-sector output than for
tertiary-sector output: the comparison of columns (1)-(2) with columns (3)-(4) in table 1 reveals that
the size of the density coefficient relative to that of the urbanisation coefficient in the case of the
secondary sector was about twice as large as in the tertiary sector. To put it simply, the supply-side
factor was crucial for secondary-sector growth while it was the urban influence that was
comparatively more important for tertiary-sector growth, and this pattern does not seem to have
varied significantly from region to region. The only unsatisfactory result is for the regional dummy
of E: it has the expected sign in both the secondary- and tertiary-sector equations but neither of the
estimated coefficients is statistically significant at the 10 % level, indicating that this coefficient
11
cannot be used for the calculation of Tokugawa sectoral shares (although there still remains a
possibility that it would work with better data or in different countries under different
circumstances).
5. Back projection
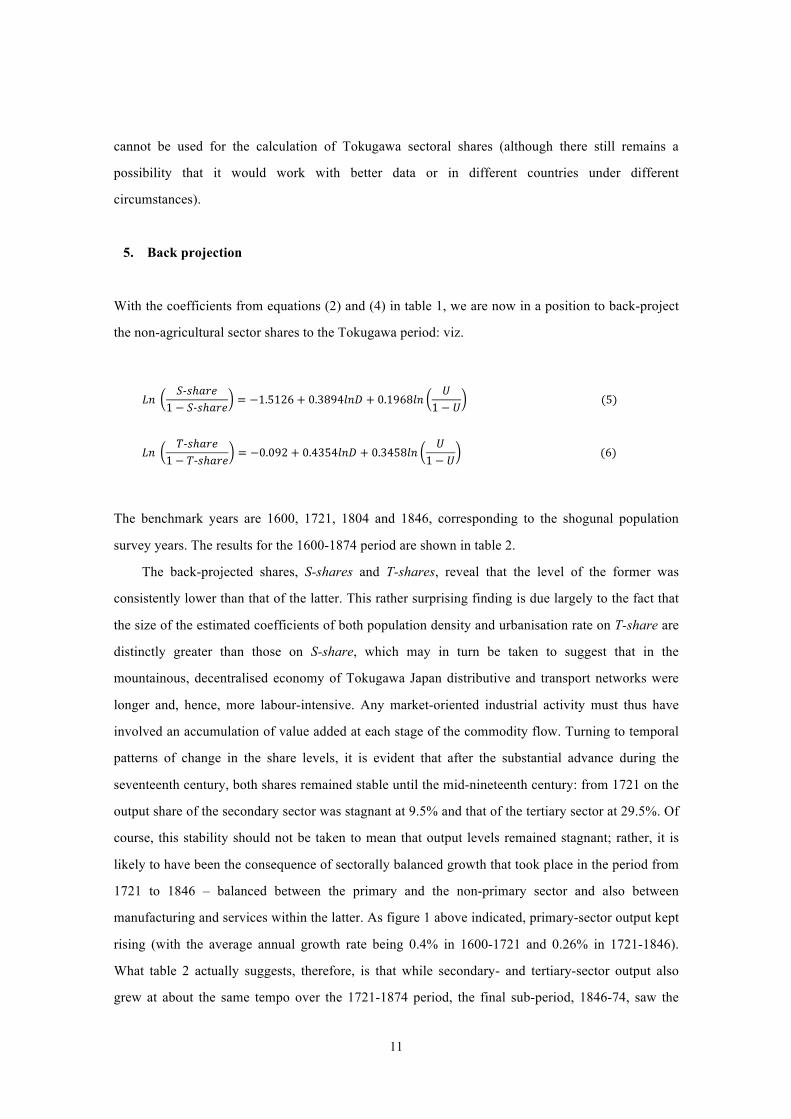
With the coefficients from equations (2) and (4) in table 1, we are now in a position to back-project
the non-agricultural sector shares to the Tokugawa period: viz.
𝐿𝑛 𝑆-‐𝑠ℎ𝑎𝑟𝑒
1 − 𝑆-‐𝑠ℎ𝑎𝑟𝑒= −1.5126 + 0.3894𝑙𝑛𝐷 + 0.1968𝑙𝑛
𝑈1 − 𝑈
(5)
𝐿𝑛 𝑇-‐𝑠ℎ𝑎𝑟𝑒
1 − 𝑇-‐𝑠ℎ𝑎𝑟𝑒= −0.092 + 0.4354𝑙𝑛𝐷 + 0.3458𝑙𝑛
𝑈1 − 𝑈
(6)
The benchmark years are 1600, 1721, 1804 and 1846, corresponding to the shogunal population
survey years. The results for the 1600-1874 period are shown in table 2.
The back-projected shares, S-shares and T-shares, reveal that the level of the former was
consistently lower than that of the latter. This rather surprising finding is due largely to the fact that
the size of the estimated coefficients of both population density and urbanisation rate on T-share are
distinctly greater than those on S-share, which may in turn be taken to suggest that in the
mountainous, decentralised economy of Tokugawa Japan distributive and transport networks were
longer and, hence, more labour-intensive. Any market-oriented industrial activity must thus have
involved an accumulation of value added at each stage of the commodity flow. Turning to temporal
patterns of change in the share levels, it is evident that after the substantial advance during the
seventeenth century, both shares remained stable until the mid-nineteenth century: from 1721 on the
output share of the secondary sector was stagnant at 9.5% and that of the tertiary sector at 29.5%. Of
course, this stability should not be taken to mean that output levels remained stagnant; rather, it is
likely to have been the consequence of sectorally balanced growth that took place in the period from
1721 to 1846 – balanced between the primary and the non-primary sector and also between
manufacturing and services within the latter. As figure 1 above indicated, primary-sector output kept
rising (with the average annual growth rate being 0.4% in 1600-1721 and 0.26% in 1721-1846).
What table 2 actually suggests, therefore, is that while secondary- and tertiary-sector output also
grew at about the same tempo over the 1721-1874 period, the final sub-period, 1846-74, saw the

12
secondary sector’s growth outpacing that of the other sectors, thanks to the country’s re-entry into
world trade. All these are reflected in the movements of the implied sectoral shares in table 2.
Since the per-capita GDP estimates are reported elsewhere with discussions of their
implications in a Eurasian comparative context (Saito forthcoming), just a few words about their
differences with Maddison’s estimates will suffice here (Maddison 2001, table B-21, p. 264).
The two estimates are not radically different as far as the levels are concerned: the GDP per
capita level in 1600 is 7 % higher than Maddison’s for the same year, the 1721 one 3 % larger than
the latter’s 1700 estimate, and the 1846 one 16 % greater than the latter’s 1850 estimate. But there
are non-negligible differences with respect to growth trends by sub-period. The Maddison estimates
were made by adopting an assumption that Japan’s non-agricultural output grew faster than
agricultural output over the entire period between 1500 and 1820 (Maddison 2001, pp. 256-58). This
implies that although the growth rate did not remain the same from sub-period to sub-period,
moderate growth performance persisted throughout the entire Tokugawa period. In contrast, the new
estimates are far more articulated. Between 1600 and 1721, the average annual rate of growth in the
per capita GDP level was as low as 0.04%: there took place no noticeable growth during the first 120
years under Tokugawa rule. The situation changed after the 1720s. Since then growth was more or
less sustained until about 1850, thanks to the emergence of rural-centred development. Indeed, there
is consensus that the eighteenth century saw the Tokugawa economy entering a new phase. The age
of proto-industrialisation and de-urbanisation began (Miyamoto 2004, pp. 45-56, 72-82; Shimbo and
Hasegawa 2004, pp. 179-91; Shimbo and Saito 2004, pp. 340-47). The eighth Shogun Yoshimune,
who was in that post from 1716 to 1745, is well known for his reform effort. One of the measures he
introduced was to encourage domestic production by lifting, in 1720, some of the restrictions on the
import of foreign books (one of the so-called ‘seclusion’ policy measures adopted in the 1630s). One
area he was particularly concerned with was horticulture, as a result of which many Chinese books
on botany and horticulture were imported. Since the list of imports in the early seventeenth century
had included raw silk, sugar and ginseng, the target was to ‘substitute domestic goods for imports’.
This import substitution effort is said to have been particularly successful for raw silk: ‘from the
1720s on, the silk output was sufficient to start driving down the price of imports’ (Totman 1993, p.
312).7 Although it is naive to link the shogunal government’s effort to this surge in domestic output
directly, silk reeling must have begun spreading over many regions, so did the raising of cocoons.
7 Quoting O. Ohba and R. P. Toby’s unpublished article on Yoshimune’s import substitution policy and Tashiro (1976) on Korean trade. For the decline in imports of raw silk from China, see also Tashiro (2004), pp. 109-11.
13
In agriculture in general, with the extensive mode of growth coming to an end its intensification and
specialisation in the production of raw materials for manufacturing began to spread out from the
Kinai (areas around Kyoto and Osaka) and the Inland Sea regions, while in many rural districts
handicraft and other types of industries emerged as the century went on. The rise of rural industry
such as spinning, weaving, paper making and brewing often took the form of farm family
by-employment but was in almost all cases market-oriented. For example, 64 % of paper produced
in the domain of Chōshū was ‘exported’ to metropolitan and other markets while 86 % of linen in
Kaga, the largest of all daimyo domains, went to outside markets (Shimbo and Saito 2004, p. 345).
Sometimes their efforts were backed by local daimyo governments’ ‘export’ promotion policies, i.e.
by measures taken to promote the sales of those domainal products to metropolitan markets.
However, what accounted for such trade growth was not just the growth of trade with the
metropolitan markets, but the expansion of trade which bypassed the metropolitan centres – which
sometimes took the form of inter-domainal trade – was also an important contributing factor behind
this new development (Miyamoto 2004, pp. 80-81; Nishikawa and Amano 2004, pp. 260-64).
Overall, the eighteenth- and nineteenth-century growth was moderate but noticeably stronger than
Maddison suggested: while Maddison’s benchmark-year estimates of GDP per capita imply an
increase of 0.12 % per annum between 1700 and 1850, our estimates suggest that output grew on
average at 0.24 % in per capita terms from 1721 to 1846. After the opening of the country into world
trade, the growth gathered momentum reaching a level of GDP per capita in 1874, which exceeded
that of Maddison’s by 14 %.
In short, all this Tokugawa-period evidence is better reflected in our estimates of GDP per
capita than in Maddison’s as far as the post-1720 period is concerned. For the period before 1720,
however, any estimated results still remain tentative at this stage of research since the situation in
1600 was in a sense considerably different from that in the late nineteenth century. Overseas trade
was not closed until the 1630s. Thanks to a late sixteenth-century mining boom, the silk-for-silver
trade was brisk and profitable; as a result, the weight of mining and trade incomes might have been
higher than the supposition we made for the 1874-1909 period. In fact, there is a suggestion that
silver export in the period around 1600 was so unprecedented that the annual total must have
amounted to about 10% of the country’s farm output (Shimbo and Hasegawa 2004, p. 167). The
fruits of such an exceptional boom cannot be captured by our methodology, and it is not unlikely
that the ‘true’ level of per capita GDP could have been larger than 556 dollars and closer to the 600
mark. However, much depends on evidence on mining output and export profits: more quantitative
evidence is required to settle on the pre-1720 issue.

14
[Insert Table 2 here]
6. Concluding remarks
In order to broaden the applicability of Malanima’s urbanisation-centred method of estimating
non-primary sector output shares in the pre-modern past, this paper has proposed that population
density may be added as another predictor of the sectoral shares, and also that for the estimation of
parameters, regional panel – rather than simple time-series – data should be utilised. It has been
demonstrated that this model does work for Japan’s age of early modern growth. With a successful
construction of the prefectural-level panel database for the 1874-1909 period, the parameters have
been estimated separately for the secondary and tertiary sectors, which in turn has enabled us to
compute the two sectoral shares and, hence, output series for the period before 1874. The results
derived from this exercise, especially its phase-specific findings, are consistent with the evidence
Tokugawa economic historians have so far accumulated for the period of rural advancement since
1720. It is therefore hoped that this methodology would go a substantial way towards a better
estimation of non-agricultural output shares in other countries or regions that underwent a similar
rural-centred phase of development before modern economic growth.

15
Tables and Figures
Figure 1. Primary-sector output and population, 1600-1874
Notes and sources: 1) For primary-sector output, we revised the oft-used Nakamura series, following the estimation
method proposed by Nakamura (1968), pp. 169-71 First, he made benchmark-year estimates based on cadastral-survey data in 1645 and the average of farm output calculated from Nōsanhyō (Nationwide Survey of Farm Products), taken by the new Meiji government in 1877-79 and supposed to have represented the situation at the end of the Tokugawa period, both of which are considered relatively reliable as data for Tokugawa Japan. Second, he estimated output for the remaining benchmark years (1600, 1700, and 1830) by using information on the number of engineering projects to improve arable land, on the one hand, and on the increase in kokudaka, on the other. Our modification of the Nakamura estimates is twofold: first, we extended the end year of the period covered from 1867 to the 1870s, for data of which a 1874 government survey (Meiji 7-nen fuken bussanhyō) is used; and second, we re-calculated the revised kokudaka series at each level of 14 regions rather than at the national level. This enabled us to make comparisons with the value added estimates derived from Fukao et al. (2015, app. 2) at each regional level, which in turn allowed us to apply a separate correction factor for under-recording to individual regions.
2) Population for 1600 is derived from O. Saito’s unpublished estimates quoted in Farris (2006), p. 262, for 1721, 1804 and 1846, from Kito (1996), pp. 74-77, and for 1874, from Fukao et al. (2015), app. 2.
3) For the details, see our discussion paper [http://risk.ier.hit-u.ac.jp/Japanese/pdf/dp15-3_rcesr. pdf].
10
20
30
40
20
40
60
80
1600 1650 1700 1750 1800 1850
Million Million koku
Primary-sector output (million koku) Population (million)

16
Figure 2. The rate of urbanisation and population density, 1600-1874
Notes and sources: 1) The definition of urbanisation is the number of people living in settlements of more than
10,000. Urban population totals are taken from the 1873 topographical book (Nihon chishi teiyō) and previous estimates for Tokugawa-period cities for which these are available (Saito 1984). For other 1870s cities with no estimates, the population totals are extrapolated from 1873 with the rate of regional population growth between 1850 and 1873. In some cases adjustment is made by using the growth rate between 1850 and 1878 (recorded in Kyōbu seihyō, a statistical report compiled by the Army’s General Staff Office. For other Tokugawa-period cities with no estimates, interpolation is made with the rate of regional population growth calculated from Saito (1984).
2) Population densities are calculated by dividing the national population totals shown in figure 1 by the area recorded in the first volume of the Statistical Yearbook.
3) For the details, see our discussion paper [http://risk.ier.hit-u.ac.jp/Japanese/pdf/dp15-3_rcesr. pdf].
0.0
0.5
1.0
1.5
0
5
10
15
1600 1650 1700 1750 1800 1850
Density per chō %
Urbanisation rate (%) Population density (density per chō)
17
Figure 3. Population density and the urbanisation rate: 45 prefectures in 1874
Sources: See text. Note that in this graph and the next ‘urbanisation rate’ is expressed as a decimal fraction.
0
1
2
3
4
5
6
0.0 0.1 0.2 0.3 0.4 0.5 0.6 0.7
Popu
latio
n de
nsity
Urbanisation rate

18
Figure 4. Population density (log transformed) and the urbanisation rate (logit transformed): 45 prefectures in 1874
Sources: See text.
-1.0
-0.5
0.0
0.5
1.0
1.5
2.0
-5.0 -4.0 -3.0 -2.0 -1.0 0.0 1.0
Popu
latio
n de
nsity
(log
tran
sfor
med
)
Urbanisation rate (logit transformed)
19
Figure 5. Population density (log transformed) and the secondary- and tertiary-sector shares (logit transformed): 45 prefectures in 1874
Sources: See text.
-4
-3
-2
-1
0
1
2
-1.0 -0.5 0.0 0.5 1.0 1.5 2.0
Shar
es (l
ogit
trans
form
ed)
Population density (log transformed)
Secondary-sector share
Tertiary-sector share

20
Figure 6. The rate of urbanisation (logit transformed) and the secondary- and tertiary-sector shares (logit transformed): 45 prefectures in 1874
Sources: See text.
-4
-3
-2
-1
0
1
2
-5 -4 -3 -2 -1 0 1
Shar
es (l
ogit
trans
form
ed)
Urbanisation rate (logit transformed)
Secondary-sector share
Tertiary-sector share
21
Table 1. OLS regression for the determinants of sector shares
S-share T-share
(1) (2) (3) (4)
Population density 0.3684 [4.72]***
0.3894 [4.89]***
0.4484 [7.39]***
0.4354 [7.01]***
Urbanization rate 0.1900 [3.44]***
0.1968 [3.55]***
0.3500 [8.15]***
0.3458 [8.01]***
Regional dummy (East Japan =1) - 0.1562
[1.23] - -0.0970 [-0.98]
Prefectural dummy (Modernised = 1)
0.9394 [4.69]***
0.8860 [4.33]***
0.5240 [3.36]***
0.5571 [3.49]***
Year 1890 dummy 0.4371 [5.12]***
0.4874 [5.16]***
0.2944 [4.43]***
0.2631 [3.57]***
Year 1909 dummy 0.7580 [8.24]***
0.8041 [8.11]***
0.3209 [4.48]***
0.2922 [3.78]***
Constant -1.4713 [-9.11]***
-1.5126 [-9.19]***
-0.1177 [-0.94]
-0.0920 [-0.72]
Adjusted R2 0.7462 0.7472 0.8280 0.8280
Notes: In both columns the dependent variable is defined with respect to the sum of value added in the sector concerned and that in the primary sector. Figures in square brackets are t values. *** denotes that the coefficient is statistically significant at the 1 % level, while the one without asterisks is not significant even at the 10 % level. The number of observations is 135 for all the equations.

22
Table 2. Estimated S- and T-shares and GDP per capita with implied sectoral shares: Japan,
1600-1874
GDP per capita
(1990 international dollars)
S-share T-share
Sectoral share (%)
Primary Secondary Tertiary
1600 556 0.095 0.291 72.2 7.6 20.3
1721 587 0.135 0.326 61.0 9.5 29.5
1804 729 0.134 0.326 61.1 9.5 29.5 1846 788 0.135 0.327 60.9 9.5 29.6
1874 860 0.157 0.341 58.7 10.9 30.4
Notes and sources: See text.

23
References Naikaku Tōkeikyoku (1911). Meiji 41 nen 12 gatsu 31 nichi, Nihon Teikoku jinkō seitai tōkei
[Population Statistics of the Japanese Empire, taken on 31 December 1908]. Tokyo: Naikaku Tōkeikyoku.
Naikaku Tōkeikyoku (1916). Taisho 2 nen 12 gatsu 31 nichi, Nihon Teikoku jinkō seitai tōkei
[Population Statistics of the Japanese Empire, taken on 31 December 1913]. Tokyo: Naikaku Tōkeikyoku.
Naimushō Kangyōryō (1875). Meiji 7 nen fuken bussanhyō [Survey of Prefectural Products, 1874].
Tokyo: Naimushō Kangyōryō. Naimushō Shōmukyoku (1891). Meiji 23 nen 12 gatsu 31 nichi Nihon Teikoku minseki kokōhyō
[Household and Population Statistics of the Japanese Empire, taken on 31 December 1890]. Tokyo: Naimushō.
Rikugun Sanbōkyoku (1879-81). Kyōbu seihyō [Munitions and Mobilisation Statistics]. Tokyo:
Rikugun Sanbōkyoku. Seiin Chishika (1874-79). Nihon chishi teiyō [Geographical Outlines of Japanese Regions]. Tokyo:
Nippōsha. Tokeiin (1882). Nihon Teikoku tōkei nenkan [Statistical Yearbook of the Japanese Empire]. Tokyo:
Tōkeiin. Other sources Álvarez-Nogal, C. and L. Prados de la Escosura (2007). ‘The decline of Spain (1500-1850):
conjectural estimates’, European Review of Economic History 11 (3), pp.319-366. Bolt, J and van Zanden, J.L. (2014). ‘The Maddison Project: collaborative research on historical
national accounts’, Economic History Review 67 (3), pp. 627-651. Bassino, J.P., S. Broadberry, K. Fukao, B. Gupta and M. Takashima (2011). ‘Japan and the Great
Divergence, 730-1870’, LSE Working paper: [http://www2.lse.ac.uk/economicHistory/pdf/Broadberry/JapanGreatDivergence.pdf].
De Vries, J. (1984). European Urbanization 1500-1800, London: Methuen. Farris, W. W. (2006). Japan’s Medieval Population: Famine, fertility, and warfare in a
transformative age, Honolulu: University of Hawaiʻi Press. Fukao, K., J.-P. Bassino, T. Makino, R. Paprzycki, T. Settsu, M. Takashima, and J. Tokui (2015).
Regional Inequality and Industrial Structure in Japan: 1874-2008, Tokyo: Maruzen. Hayami, A., O. Saito and R.P. Toby, eds. (2004). Emergence of Economic Society in Japan,
1600-1859, Oxford: Oxford University Press. Kito, H. (1996). ‘Meiji-izen Nihon no chiiki jinkō [Regional population totals in pre-Meiji Japan]’,
Jōchi Keizai Ronshū 41 (1-2), pp.65-79.

24
Maddison, A. (2001). The World Economy: A Millennial Perspective, Paris: Organisation for Economic Co-operation and Development.
Malanima, P. (2003). ‘Measuring the Italian Economy. 1300-1861’, Rivista di Storia Economica 19,
pp. 265-95. Malanima, P. (2011). ‘The long decline of a leading economy: GDP in central and northern Italy,
1300-1913’, European Review of Economic History 15 (2), pp.169-219. Meiji Bunken Shiryō Kankōkai (1964). Meiji 9 nen zenkoku nōsanhyō [Nationwide Survey of Farm
Products, 1876]. Meiji zenki sangyō hattatsuhi shiryō [Early-Meiji Materials on the Development of Industry], supplement 1, Tokyo: Meiji Bunken Shiryō Kankōkai.
Miyamoto, M. (2004). ‘Quantitative aspects of Tokugawa economy’, in Hayami, Saito and Toby
(2004), pp. 36-84. Nakamura, N. (2010). Chihō kara no sangyō kakumei: Nihon ni okeru kigyō bokkō no gendōryoku
[The Industrial Revolution in a Provincial Perspective: Surge in firms’ industrial activity and its driving forces in Japan], Nagoya: Nagoya University Press.
Nakamura, S. (1968). Meiji ishin no kiso kōzō [The Underlying Structure of the Meiji Restoration],
Tokyo: Miraisha. Nishikawa, S. (1987). ‘The economy of Chōshū on the eve of industrialization’, Economic Studies
Quarterly 38 (4), pp. 323-37. Nishikawa, S., and M. Amano (2004). ‘Domains and their economic policies’, in Hayami, Saito and
Toby (2004), pp. 247-67. Saito, O. (1983). ‘Population and the peasant family economy in proto-industrial Japan’, Journal of
Family History 8 (1), pp.30-54. Saito, O. (2015). ‘Climate, famine, and population in Japanese history: a very long-term perspective’,
B.L. Baten and P.C. Brown, eds., Environment and Society in the Japanese Islands, Corvallis, OR: Oregon State University Press, pp. 213-29.
Saito, O., and M. Tanimoto (2004). ‘The transformation of traditional industries’, in Hayami, Saito
and Toby (2004), pp. 268-300. Saito, O., and T. Settsu (2010). ‘Unveiling historical occupational structures and its implications for
sectoral labour productivity analysis in Japan’s economic growth’, manuscript for O. Saito and L. Shaw-Taylor, eds., Occupational Structure and Industrialisation in a Comparative Perspective (forthcoming). An earlier version is available as: Hitotsubashi University Global COE Hi-Stat Discussion Paper Series no. 143 [http://hdl.handle.net/10086/18575].
Saito, O., and M. Takashima (2015). ‘Population, urbanisation and farm output in early modern
Japan, 1600-1874: a review of data and benchmark estimates’, Hitotsubashi University RCESR Discussion Paper Series no. DP15-3. [http://risk.ier.hit-u.ac.jp/Japanese/pdf/dp15-3_rcesr.pdf].
Saito, S. (1984). ‘Edo jidai no toshi jinkō [Urban population totals in the Edo period]’, Chiiki
kaihatsu, no. 240, pp.48-63. Shimbo, H., and A. Hasegawa (2004). ‘The dynamics of market economy and production’, in

25
Hayami, Saito and Toby (2004), pp. 159-91. Shimbo, H., and O. Saito (2004). ‘The economy on the eve of industrialization’, in Hayami, Saito
and Toby (2004), pp. 337-68. Smith, T. C. (1969). ‘Farm family by-employments in preindustrial Japan’, Journal of Economic
History 29 (4), pp. 241-57; reprinted in Smith, T. C., Native sources of Japanese industrialization, 1750-1920, Berkeley: University of California Press, 1988, pp. 71-102.
Smith, T. C. (1973). ‘Pre-modern economic growth: Japan and the West’, Past and Present, 60, pp.
127-60; reprinted in Smith, T. C., Native sources of Japanese industrialization, 1750-1920, Berkeley: University of California Press, 1988, pp. 15-49.
Tashiro, K. (1976). ‘Tsushima han’s Korean trade, 1684-1710’, Acta Asiatica, no. 30, pp. 85-105. Tashiro, K. (2004). ‘Foreign trade in the Tokugawa period – particularly with Korea’, in Hayami,
Saito and Toby (2004), pp. 105-18. Totman, C. (1993). Early Modern Japan, Berkeley: University of California Press. Umemura, M., N. Takamatsu, and S. Ito (1983). Estimates of Long-term Economic Statistics of
Japan since 1868, volume 13: Regional Economic Statistics, Tokyo: Tōyō Keizai Shimpōsha.