rapana venosa as a bioindicator of environmental pollution
TRANSCRIPT
This article was downloaded by: [University of Guelph]On: 04 September 2012, At: 07:45Publisher: Taylor & FrancisInforma Ltd Registered in England and Wales Registered Number: 1072954 Registeredoffice: Mortimer House, 37-41 Mortimer Street, London W1T 3JH, UK
Chemistry and EcologyPublication details, including instructions for authors andsubscription information:http://www.tandfonline.com/loi/gche20
Rapana venosa as a bioindicator ofenvironmental pollutionSnejana Moncheva a , Jacek Namiesnik b , Resat Apak c , PatriciaArancibia-Avila d , Fernando Toledo d , Seong-Gook Kang e , Soon-Teck Jung e & Shela Gorinstein fa Institute of Oceanology, Bulgarian Academy of Sciences, Varna,Bulgariab Department of Analytical Chemistry, Gdansk University ofTechnology, Gdańsk, Polandc Department of Chemical Oceanography, Istanbul University,Istanbul, Turkeyd Department of Basic Sciences, Universidad del Bio-Bio, Chillan,Chilee Department of Food Engineering, Mokpo National University,Muan, South Koreaf The Institute of Drug Research, School of Pharmacy, The HebrewUniversity – Hadassah Medical School, Jerusalem, Israel
Version of record first published: 16 Feb 2011
To cite this article: Snejana Moncheva, Jacek Namiesnik, Resat Apak, Patricia Arancibia-Avila,Fernando Toledo, Seong-Gook Kang, Soon-Teck Jung & Shela Gorinstein (2011): Rapana venosa as abioindicator of environmental pollution, Chemistry and Ecology, 27:1, 31-41
To link to this article: http://dx.doi.org/10.1080/02757540.2010.522996
PLEASE SCROLL DOWN FOR ARTICLE
Full terms and conditions of use: http://www.tandfonline.com/page/terms-and-conditions
This article may be used for research, teaching, and private study purposes. Anysubstantial or systematic reproduction, redistribution, reselling, loan, sub-licensing,systematic supply, or distribution in any form to anyone is expressly forbidden.
The publisher does not give any warranty express or implied or make any representationthat the contents will be complete or accurate or up to date. The accuracy of any

instructions, formulae, and drug doses should be independently verified with primarysources. The publisher shall not be liable for any loss, actions, claims, proceedings,demand, or costs or damages whatsoever or howsoever caused arising directly orindirectly in connection with or arising out of the use of this material.
Dow
nloa
ded
by [
Uni
vers
ity o
f G
uelp
h] a
t 07:
45 0
4 Se
ptem
ber
2012

Chemistry and EcologyVol. 27, No. 1, February 2011, 31–41
Rapana venosa as a bioindicator of environmental pollution
Snejana Monchevaa, Jacek Namiesnikb, Resat Apakc, Patricia Arancibia-Avilad,Fernando Toledod, Seong-Gook Kange, Soon-Teck Junge and Shela Gorinsteinf*
aInstitute of Oceanology, Bulgarian Academy of Sciences, Varna, Bulgaria; bDepartment ofAnalytical Chemistry, Gdansk University of Technology, Gdansk, Poland; cDepartment of Chemical
Oceanography, Istanbul University, Istanbul, Turkey; dDepartment of Basic Sciences, Universidad delBio-Bio, Chillan, Chile; eDepartment of Food Engineering, Mokpo National University, Muan,
South Korea; f The Institute of Drug Research, School of Pharmacy, The Hebrew University – HadassahMedical School, Jerusalem, Israel
(Received 16 February 2010; final version received 20 July 2010 )
The aim of this investigation was to examine biochemical differences in the gastropod Rapana venosa(R. venosa) from polluted (RvP) and nonpolluted (RvN) sites of the Black Sea’s Bulgarian coast thatmay serve as bioindicators of environmental quality. Mussels Mytilus galloprovincialis (MMg) were col-lected from polluted (MMgP) and nonpolluted (MMgN) sites at the same time for comparison. Bioactivecompounds and the antioxidant activity of dry matter (DM) methanol extracts from RvP and RvN were deter-mined. Three-dimensional fluorometry (3D-FL) and Fourier transform infrared (FTIR) analyses were usedto evaluate polyphenols and proteins. DM methanol extracts from RvP, and to lesser extent RvN, showedhigh amounts of total phenolics (23.22 ± 2.9 and 15.60 ± 1.8 mg GAE · g−1 DW) and exhibited high levelsof antioxidant activity in some radical scavenging assays (μMTE · g−1 DW): 56.38 ± 5.2 and 33.79 ± 3.3by 2,2azino-bis (3-ethyl-benzothiazoline-6-sulfonic acid) diamonium salt (ABTS·+); 54.79 ± 5.6 and33.7 ± 2.6 by cupric reducing antioxidant capacity (CUPRAC); 62.34 ± 6.8 and 30.31 ± 3.9 by the 1-diphenyl-2-picrylhydrazyl method (DPPH).A correlation in the above indices was found between R. venosaand M. galloprovincialis, but all results were relatively higher for M. galloprovincialis than for R. venosa.The obtained indices of R. venosa may serve as a bioindicator of environmental ecological quality.
Keywords: Rapana venosa; mussels Mytilus galloprovincialis; biomonitoring; chemical indices; bio-indicators; Black Sea
1. Introduction
Study of the physiological behaviour of marine organisms has been shown to be a valuableapproach for the assessment of biological responses to environmental stress [1–4]. Differentanimals and their chemical components, or molecular, biochemical and/or physiological propertieshave been used as bioindicators of marine pollution [5–8].
In their environmental policy agenda, European maritime states have outlined the protectionof species and habitats and the need to maintain quality standards in coastal and offshore waters
*Corresponding author. Email: [email protected]
ISSN 0275-7540 print/ISSN 1029-0370 online© 2011 Taylor & FrancisDOI: 10.1080/02757540.2010.522996http://www.informaworld.com
Dow
nloa
ded
by [
Uni
vers
ity o
f G
uelp
h] a
t 07:
45 0
4 Se
ptem
ber
2012
32 S. Moncheva et al.
as a priority [2]. The Water Framework Directive and Marine Strategy Directive call for thedefinition and application of biological quality elements and the development of early-warningapproaches for environmental health assessment and monitoring.Although there have been numer-ous investigations in mussels, Mytilus galloprovincialis [3,4,8], there are few available studies ofRapana venosa, mainly due to its capacity to accumulate heavy metals and mass mortality relatedto toxic phytoplankton blooms [9–15].
R. venosa is a marine snail of high ecological fitness due to its high fertility, fast growth rateand tolerance to low salinity, high and low temperatures, water pollution and oxygen deficiency,which have a documented impact on both natural and cultivated populations of oysters, musselsand other molluscs, and significant negative changes in the ecosystem [1]. R. venosa is a veryvoracious predator; introduced into the Black Sea in the early 1940s, it is blamed for the declinein the native, edible bivalve fauna. Its populations have caused significant changes in the ecologyof bottom-dwelling organisms and serious deterioration of benthic communities [1]. Since the1980s, R. venosa has become a valuable commercial resource: its meat is exported to Japan forfood and it has recently also been included in the diet of those native to the Black Sea area.Extensive harvesting by trawling (although officially forbidden in the Black Sea) adds further tothe deterioration of the marine environment [10]. According to some recent reports, annual Rapawhelk catches from Turkey and Bulgaria exceed 13,000 t · year−1 [14].
In this study, chemical differences between R. venosa from polluted (RvP) and nonpol-luted (RvN) sites of the Bulgarian Black Sea were studied to establish whether the resultscould be used in the diagnosis of environmental contamination. Three-dimensional fluorome-try (3D-FL) and Fourier transform infrared (FTIR) analyses were used to evaluate polyphenolsand proteins [3,4,15,16]. In order to obtain reliable antioxidant activity data, four complemen-tary assays were used: cupric-reducing antioxidant capacity (CUPRAC), 2,2azino-bis(3-ethyl-benzothiazoline-6-sulphonic acid) diamonium salt (ABTS), ferric reducing antioxidant power(FRAP) and 1-diphenyl-2-picrylhydrazyl method (DPPH) [3,4,17–20]. Furthermore, the aim ofthis investigation was to analyse the antioxidant content of the test organisms as bioindicators inan attempt to optimise environment monitoring.
2. Materials and methods
2.1. Study area
Varna Bay, the second largest bay along the Bulgarian Black Sea coast, is subjected to multi-ple anthropogenic stresses (chemical industry, shipping, tourism, fishing, port activities, urbanpressures, etc.), resulting in severe deterioration of the ecological quality of the area [12,13,21].Stations for the collection of R. venosa and M. galloprovincialis samples (Figure 1) were selectedbased on data of the level of contamination and eutrophication. R. venosa and M. galloprovincialiswere collected in two regions of Bulgarian Black Sea: (i) a non-impacted area (Galata station,3 mile offshore Varna city) and (ii) polluted (Varna Bay) sites at a depth of 3–4 m.
2.2. Sample collection
Sampling was carried out in late July to early August 2006. The snails and mussels were collectedby divers, and R. venosa specimens 60–70 mm in length were selected for analysis. Mussels wereprocessed as previously described [3,4]. The size of R. venosa and M. galloprovincialis from bothpolluted and nonpolluted sites corresponded to 75–85% of the maximum size reached withineach population in the area. This approach guaranteed that the compared R. venosa and mussels
Dow
nloa
ded
by [
Uni
vers
ity o
f G
uelp
h] a
t 07:
45 0
4 Se
ptem
ber
2012

Chemistry and Ecology 33
G3n
VB2
VB3VB1
C5
C4
C3
Figure 1. Map of sampling area along the Bulgarian Black Sea coast: VB2, polluted site and G-3nm, relativelynonpolluted site.
had similar metabolic conditions, and the influence of physiological differences between the twopopulations was less pronounced [20].
After immediate transportation to the laboratory, the shells of the organisms were measuredfor appropriate size selection, then carefully removed and the whole of the soft tissue from 30specimens of each species was rapidly frozen in liquid nitrogen and stored at −80 ◦C [4,17].Samples were then freeze dried in glass flasks on Finn- Aqua, Lyovac GT-2 equipment for 36 h.
2.3. Determination of the contents of the studied bioactive compounds
The following chemicals were used in the applied methods: 6-hydroxy-2,5,7,8-tetramethylchro-man-2-carboxylic acid (Trolox), ABTS, DPPH, Folin–Ciocalteu reagent (FCR), lanthanum (III)chloride heptahydrate, FeCl3 · 6H2O, CuCl2 · 2H2O, 2,9-dimethyl-1,10-phenanthroline (neocu-proine) and butylated hydroxyanisole (BHA) all purchased from Sigma Chemical Co. (St.Louis, MO, USA). 2,4,6-Tripyridyl-s-triazine (TPTZ) was purchased from Fluka Chemie (Buchs,Switzerland).
Most of the bioactive compounds (polyphenols, tannins, flavonoids and flavanols) weredetermined as previously described [3,4,17].
The presence of polyphenol and protein compounds in the DM of the investigated R. venosa andmussel samples was studied using FTIR spectroscopy and 3D-FL. A Bruker Optic GMBH VectorFTIR spectrometer (Bruker Optic GMBH, Attingen, Germany) was used to record IR spectra.A potassium bromide microdisk was prepared from finely ground lyophilised R. venosa powder(2 mg) with 100 mg of KBr [16].
2.4. Fluorescence measurements
Fluorescence spectra of methanol extracts of R. venosa and M. galloprovincialis at a concentrationof 0.01 mg · mL−1 were recorded on a model FP-6500, Jasco spectrofluorometer (serial N261332,Japan), equipped with 1.0 cm quartz cells and a thermostat bath. The widths of the excitation and
Dow
nloa
ded
by [
Uni
vers
ity o
f G
uelp
h] a
t 07:
45 0
4 Se
ptem
ber
2012

34 S. Moncheva et al.
emission slits were set to 10.0 and 5.0 nm, respectively. Three-dimensional spectra were collectedwith subsequent scanning emission spectra from 330 to 740 nm in 1.0 nm increments by varyingthe excitation wavelength from 265 to 695 nm in 10 nm increments. The scanning speed was setat 1000 nm · min−1 for all measurements [22,23].
Unconjugated plus conjugated (total) polyphenols (TP) and tannins were extracted from drieddefatted samples (50 mg) with 5 mL of 1.2 M HCl in 50% methanol/water and heated at 90 ◦C for3 h. FCR was used to determine the total amount of polyphenols in the studied extracts and themeasurement was performed at 765 nm with gallic acid as the standard. Results were expressedas mg of gallic acid equivalent (GAE).
Spectrophotometric determination of flavonoids was carried out with 5% NaNO2, 10% AlCl3 ·6H2O and 1 M NaOH, and was measured at 510 nm. The extracts of condensed tannins (pro-cyanidins) with 4% methanol vanillin solution were measured at 500 nm. The total flavanols wereestimated using the p-dimethylaminocinnamaldehyde (DMACA) method, and the absorbance at640 nm was then read. (+)-Catechin served as a standard for flavonoids, flavanols and tannins,and the results were expressed as catechin equivalents (CE).
2.5. Determination of the antioxidant activity
The following radical scavenging tests were used: (i) 2,2-azino-bis (3-ethyl-benzothiazoline-6-sulfonic acid) diamonium salt (ABTS·+) was generated by interactingABTS (7 mmol · L−1) andK2S2O8 (2.45 mmol · L−1). This solution was diluted with methanol until the absorbance reached0.7 at 734 nm. (ii) CUPRAC assay, which is based on utilising the copper (II)-neocuproine [Cu(II)-Nc] reagent as the chromogenic oxidising agent. The absorbance at 450 nm was recorded againsta reagent blank. (iii) The FRAP assay measures the ability of the antioxidants in the investigatedsamples to reduce ferric-tripiridyltriazine (Fe3+TPTZ) to a ferrous form (Fe2+), which absorbslight at 593 nm. (iv) DPPH solution (3.9 mL, 25 mg · L−1) in methanol was mixed with the sampleextracts (0.1 mL). The progress of the reaction was monitored at 515 nm until the absorbance wasstable [3,17–19].
2.6. Statistical analyses
The results of this investigation are given as the means ± SD of three measurements. Differencesbetween groups were tested by two-way ANOVA. To assess the antioxidant activity, Spearman’scorrelation coefficient (R) was used. Linear regressions were also calculated. Values of p < 0.05were considered significant.
3. Results and discussion
As mentioned in the Introduction, mussels are recognised worldwide as pollution bioindicators,because they accumulate pollutants in their tissues at elevated levels in relation to the biologicalavailability of the pollutant in the marine environment. This study deals with the use of R. venosaand comparison with M. galloprovincialis as a local bioindicator of organic compounds. It is nec-essary to have bioindicators of ecological quality, in general, and of seas, in particular, and to findtheir chemical and biochemical responses. Therefore, in this investigation, chemical differencesbetween R. venosa from polluted (RvP) and nonpolluted (RvN) sites of the Bulgarian Black Seacoast were studied in order to use them as additional bioindicators of environmental ecologicalquality. The results were compared with data from mussels, M. galloprovincialis.
Dow
nloa
ded
by [
Uni
vers
ity o
f G
uelp
h] a
t 07:
45 0
4 Se
ptem
ber
2012
Chemistry and Ecology 35
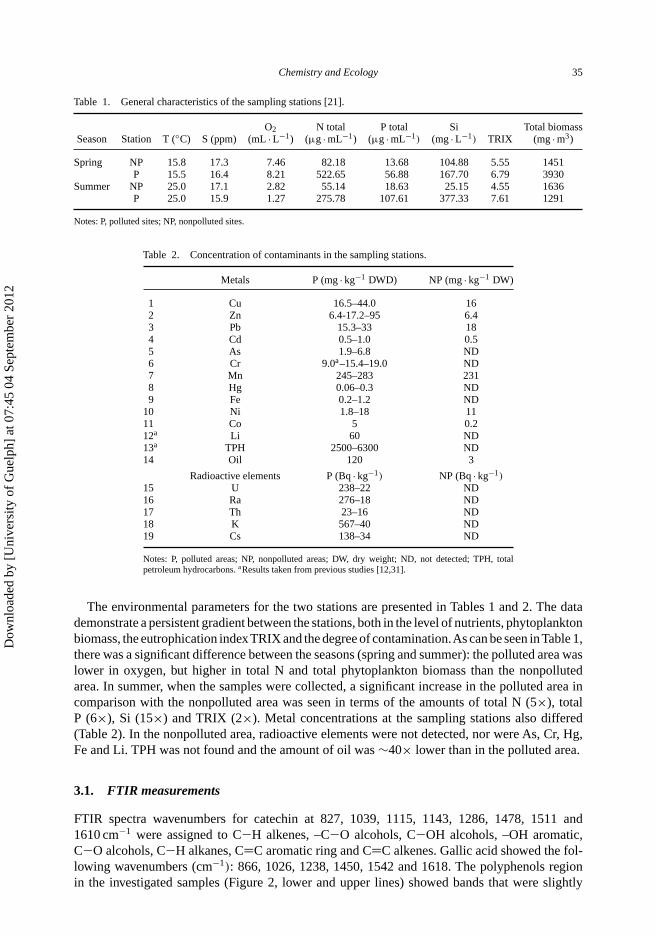
Table 1. General characteristics of the sampling stations [21].
O2 N total P total Si Total biomassSeason Station T (◦C) S (ppm) (mL · L−1) (μg · mL−1) (μg · mL−1) (mg · L−1) TRIX (mg · m3)
Spring NP 15.8 17.3 7.46 82.18 13.68 104.88 5.55 1451P 15.5 16.4 8.21 522.65 56.88 167.70 6.79 3930
Summer NP 25.0 17.1 2.82 55.14 18.63 25.15 4.55 1636P 25.0 15.9 1.27 275.78 107.61 377.33 7.61 1291
Notes: P, polluted sites; NP, nonpolluted sites.
Table 2. Concentration of contaminants in the sampling stations.
Metals P (mg · kg−1 DWD) NP (mg · kg−1 DW)
1 Cu 16.5–44.0 162 Zn 6.4-17.2–95 6.43 Pb 15.3–33 184 Cd 0.5–1.0 0.55 As 1.9–6.8 ND6 Cr 9.0a–15.4–19.0 ND7 Mn 245–283 2318 Hg 0.06–0.3 ND9 Fe 0.2–1.2 ND
10 Ni 1.8–18 1111 Co 5 0.212a Li 60 ND13a TPH 2500–6300 ND14 Oil 120 3
Radioactive elements P (Bq · kg−1) NP (Bq · kg−1)
15 U 238–22 ND16 Ra 276–18 ND17 Th 23–16 ND18 K 567–40 ND19 Cs 138–34 ND
Notes: P, polluted areas; NP, nonpolluted areas; DW, dry weight; ND, not detected; TPH, totalpetroleum hydrocarbons. aResults taken from previous studies [12,31].
The environmental parameters for the two stations are presented in Tables 1 and 2. The datademonstrate a persistent gradient between the stations, both in the level of nutrients, phytoplanktonbiomass, the eutrophication index TRIX and the degree of contamination.As can be seen in Table 1,there was a significant difference between the seasons (spring and summer): the polluted area waslower in oxygen, but higher in total N and total phytoplankton biomass than the nonpollutedarea. In summer, when the samples were collected, a significant increase in the polluted area incomparison with the nonpolluted area was seen in terms of the amounts of total N (5×), totalP (6×), Si (15×) and TRIX (2×). Metal concentrations at the sampling stations also differed(Table 2). In the nonpolluted area, radioactive elements were not detected, nor were As, Cr, Hg,Fe and Li. TPH was not found and the amount of oil was ∼40× lower than in the polluted area.
3.1. FTIR measurements
FTIR spectra wavenumbers for catechin at 827, 1039, 1115, 1143, 1286, 1478, 1511 and1610 cm−1 were assigned to C−H alkenes, –C−O alcohols, C−OH alcohols, –OH aromatic,C−O alcohols, C−H alkanes, C=C aromatic ring and C=C alkenes. Gallic acid showed the fol-lowing wavenumbers (cm−1): 866, 1026, 1238, 1450, 1542 and 1618. The polyphenols regionin the investigated samples (Figure 2, lower and upper lines) showed bands that were slightly
Dow
nloa
ded
by [
Uni
vers
ity o
f G
uelp
h] a
t 07:
45 0
4 Se
ptem
ber
2012
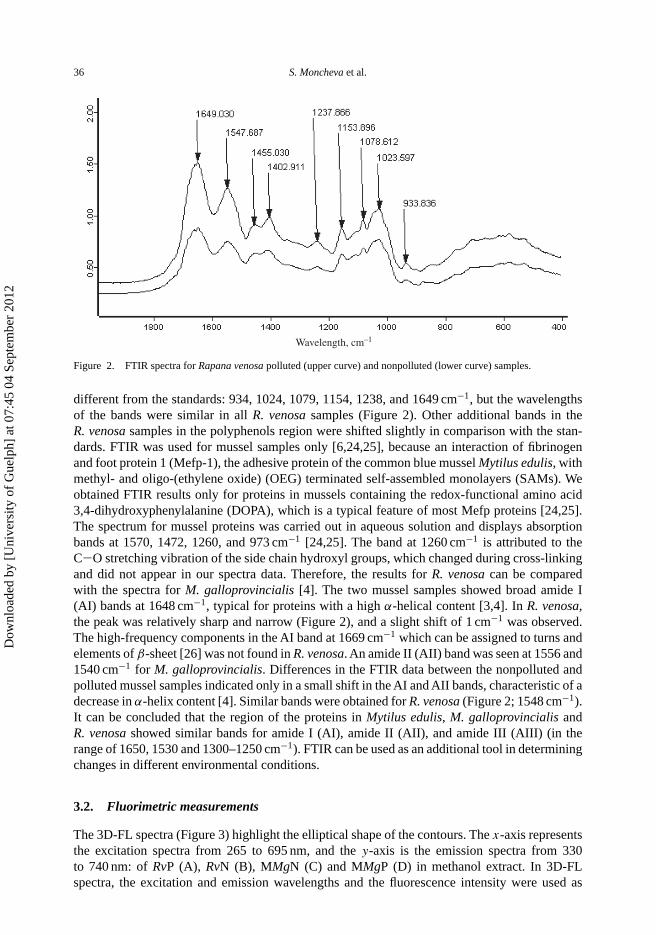
36 S. Moncheva et al.
Wavelength, cm–1
Figure 2. FTIR spectra for Rapana venosa polluted (upper curve) and nonpolluted (lower curve) samples.
different from the standards: 934, 1024, 1079, 1154, 1238, and 1649 cm−1, but the wavelengthsof the bands were similar in all R. venosa samples (Figure 2). Other additional bands in theR. venosa samples in the polyphenols region were shifted slightly in comparison with the stan-dards. FTIR was used for mussel samples only [6,24,25], because an interaction of fibrinogenand foot protein 1 (Mefp-1), the adhesive protein of the common blue mussel Mytilus edulis, withmethyl- and oligo-(ethylene oxide) (OEG) terminated self-assembled monolayers (SAMs). Weobtained FTIR results only for proteins in mussels containing the redox-functional amino acid3,4-dihydroxyphenylalanine (DOPA), which is a typical feature of most Mefp proteins [24,25].The spectrum for mussel proteins was carried out in aqueous solution and displays absorptionbands at 1570, 1472, 1260, and 973 cm−1 [24,25]. The band at 1260 cm−1 is attributed to theC−O stretching vibration of the side chain hydroxyl groups, which changed during cross-linkingand did not appear in our spectra data. Therefore, the results for R. venosa can be comparedwith the spectra for M. galloprovincialis [4]. The two mussel samples showed broad amide I(AI) bands at 1648 cm−1, typical for proteins with a high α-helical content [3,4]. In R. venosa,the peak was relatively sharp and narrow (Figure 2), and a slight shift of 1 cm−1 was observed.The high-frequency components in the AI band at 1669 cm−1 which can be assigned to turns andelements of β-sheet [26] was not found in R. venosa. An amide II (AII) band was seen at 1556 and1540 cm−1 for M. galloprovincialis. Differences in the FTIR data between the nonpolluted andpolluted mussel samples indicated only in a small shift in the AI and AII bands, characteristic of adecrease in α-helix content [4]. Similar bands were obtained for R. venosa (Figure 2; 1548 cm−1).It can be concluded that the region of the proteins in Mytilus edulis, M. galloprovincialis andR. venosa showed similar bands for amide I (AI), amide II (AII), and amide III (AIII) (in therange of 1650, 1530 and 1300–1250 cm−1). FTIR can be used as an additional tool in determiningchanges in different environmental conditions.
3.2. Fluorimetric measurements
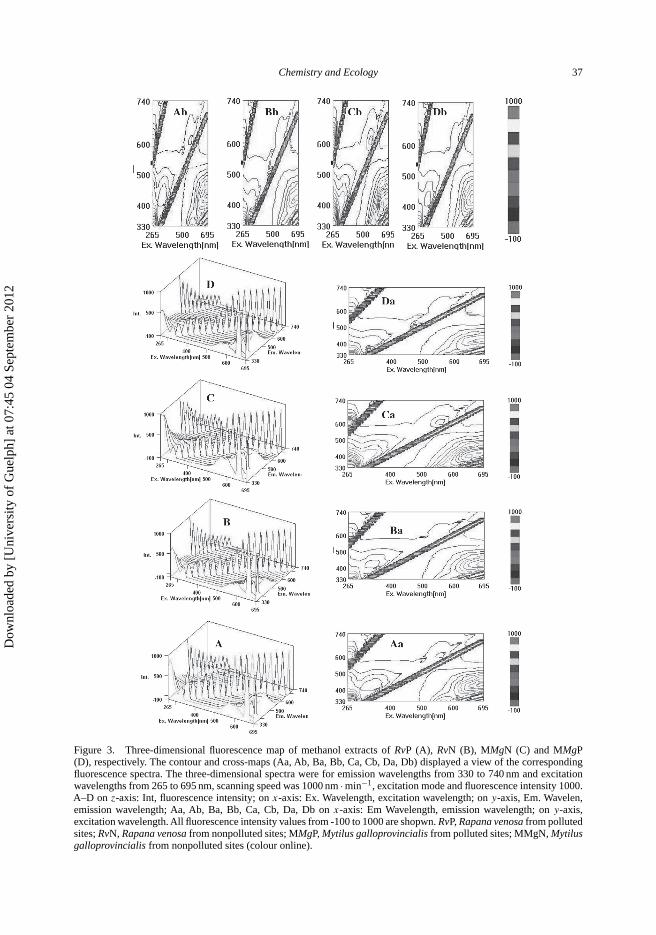
The 3D-FL spectra (Figure 3) highlight the elliptical shape of the contours. The x-axis representsthe excitation spectra from 265 to 695 nm, and the y-axis is the emission spectra from 330to 740 nm: of RvP (A), RvN (B), MMgN (C) and MMgP (D) in methanol extract. In 3D-FLspectra, the excitation and emission wavelengths and the fluorescence intensity were used as
Dow
nloa
ded
by [
Uni
vers
ity o
f G
uelp
h] a
t 07:
45 0
4 Se
ptem
ber
2012
Chemistry and Ecology 37
Figure 3. Three-dimensional fluorescence map of methanol extracts of RvP (A), RvN (B), MMgN (C) and MMgP(D), respectively. The contour and cross-maps (Aa, Ab, Ba, Bb, Ca, Cb, Da, Db) displayed a view of the correspondingfluorescence spectra. The three-dimensional spectra were for emission wavelengths from 330 to 740 nm and excitationwavelengths from 265 to 695 nm, scanning speed was 1000 nm · min−1, excitation mode and fluorescence intensity 1000.A–D on z-axis: Int, fluorescence intensity; on x-axis: Ex. Wavelength, excitation wavelength; on y-axis, Em. Wavelen,emission wavelength; Aa, Ab, Ba, Bb, Ca, Cb, Da, Db on x-axis: Em Wavelength, emission wavelength; on y-axis,excitation wavelength. All fluorescence intensity values from -100 to 1000 are shopwn. RvP, Rapana venosa from pollutedsites; RvN, Rapana venosa from nonpolluted sites; MMgP, Mytilus galloprovincialis from polluted sites; MMgN, Mytilusgalloprovincialis from nonpolluted sites (colour online).
Dow
nloa
ded
by [
Uni
vers
ity o
f G
uelp
h] a
t 07:
45 0
4 Se
ptem
ber
2012

38 S. Moncheva et al.
Table 3. Bioactivity of methanol extracts of Rapana venosa and Mytilus galloprovincialis.
Indices RvP RvN MMgN MMgP
POL, mg GAE · g−1 23.22 ± 2.9b 15.60 ± 1.8a 32.17 ± 3.7c 38.29 ± 4.1d
FRAP, μM TE · g−1 4.75 ± 0.5a 5.61 ± 0.5b 8.46 ± 0.8c 11.42 ± 1.3d
ABTS, μM TE · g−1 56.38 ± 5.2b 33.79 ± 3.3a 87.76 ± 8.2d 79.38 ± 7.9c
CUPRAC, μM TE · g−1 54.79 ± 5.6b 33.7 ± 2.6a 60.7 ± 6.9b 111.28 ± 10.9c
DPPH, μM TE · g−1 62.34 ± 6.8c 30.31 ± 3.9a 49.09 ± 4.7b 47.92 ± 4.5b
Tannins, mg CE · g−1 2.08 ± 0.2b 0.90 ± 0.1a 2.96 ± 0.3c 3.44 ± 0.3c
Flavonoids, mg CE · g−1 4.91 ± 0.4c 0.92 ± 0.1a 1.31 ± 0.1a 3.44 ± 0.3b
Flavanols, mg CE · 100 g−1 4.10 ± 0.4b 2.03 ± 0.2a ND ND
Notes:Values are means ± SD of five measurements.Values in rows with different superscript letters are significantly different (p < 0.05).RvP, Rapana venosa from polluted sites; RvN, Rapana venosa from nonpolluted sites; MMgN, Mytilus galloprovincialis from nonpollutedsites; MMgP, Mytilus galloprovincialis from polluted sites; FRAP, ferric-reducing/antioxidant power; ABTS, 2,2-azino-bis(3-ethyl-benzothiazoline-6-sulfonic acid) diamonium salt; CUPRAC, cupric reducing antioxidant capacity; DPPH, 1-diphenyl-2-picrylhydrazylmethod; GAE, gallic acid equivalent; CE, catechin equivalent; TE, trolox equivalent; ND, not detected.
axes to investigate the extracted bioactive compounds in the samples, and the contour spectraprovided more information about these samples. The appearance of main peaks can be displayedin two ways: contour maps (Aa, Ba, Ca and Da), which correspond to samples of R. venosa andM. galloprovincialis from polluted and nonpolluted sites and cross-maps (Ab, Bb, Cb and Db)corresponding to the same samples of R. venosa and M. galloprovincialis from polluted and nonpolluted sites.
The contour maps of the methanol extracts (Figure 3) showed one main peak for RvP and MMgPat λex/em 300/440 nm and a small peak at λex/em 550/600 nm. The main peaks were similar betweenR. venosa and M. galloprovincialis, but differ in fluorescence intensity in samples from pollutedand nonpolluted sites. The fluorescence intensity of the peaks for polluted areas was higher thanthat for nonpolluted areas for M. galloprovincialis, but lower for R. venosa. Our results can becompared only with the recent reports [22,23], in which protein-like fluorescence was composedof tyrosine-like fluorescence and tryptophan-like fluorescence. The main protein-like fluorescentpeak was at λex/em 270/290–310 nm. The data obtained in this study showed slightly differentpeak locations than those cited [22,23]. The three-dimesnional fluorescence results can be usedas an additional tool for studying changes in comparison of R. venosa and M. galloprovincialissamples.
3.3. Bioactive compounds
Methanol (1.2 M HCl in 50% methanol/water) was used for unconjugated plus conjugated(‘total’) polyphenol extraction and showed variation in the amounts of bioactive compounds,depending on the animals used and the collection site. Polyphenols (mg GAE · g−1 DW) andtannins (mg CE · g−1 DW) were lower in R. venosa samples than in mussels, flavonoids (mgCE · g−1 DW) were comparable and flavanols (mg CE · 100 g−1 DW) were found only in R. venosa(Table 3; p < 0.05). All bioactive compounds in mussels and R. venosa from polluted sites weresignificantly higher than in samples from nonpolluted sites (p < 0.05).
3.4. Antioxidant activity
Antioxidant activity, determined using several antioxidant scavenging methods in methanolextract, was significantly higher in mussel samples than in R. venosa (FRAP,ABTS and CUPRAC),showing approximately the same relationship as for bioactive compounds (polyphenols andtannins, p < 0.05). A direct relationship between polyphenols and antioxidant activity was
Dow
nloa
ded
by [
Uni
vers
ity o
f G
uelp
h] a
t 07:
45 0
4 Se
ptem
ber
2012
Chemistry and Ecology 39
obtained in mussel samples, with correlation coefficients (R2) determined using FRAP andCUPRAC radical scavenging assays of 0.87–0.96. A correlation was found between thepolyphenols and ABTS and CUPRAC radical scavenging results in R. venosa samples.
Antioxidant values for mussels from polluted area were significantly higher than for nonpollutedsamples, as found in a number of previous reports [3,4,17,20].
The same data were obtained for three molluscs species from the Black Sea: M. galloprovin-cialis, Mya arenaria and Rapana besoar. Studies found the highest catalase activity in themid-gland of Mya arenaria, probably because of their evolution in a very polluted environ-ment [27]. R. venosa samples react in the same way: the antioxidant characteristics in pollutedsamples (polyphenols, tannins, flavonoids, flavanols and overall antioxidant activities by ABTS,CUPRAC and DPPH) were significantly higher than in nonpolluted samples (p < 0.05). Com-parison of the changes seen in two animals from polluted and nonpolluted areas showed thatmussels were more sensitive to pollution.
Differences in the sensitivity of various organisms are expected because no single speciescould be the most suitable for detecting all possible pollutants [5]. Some organisms demonstratea range of compensatory mechanisms that may mask the expected biological response to expo-sure [11]. Our results are in agreement with other reports in which two green algae (Ulva rigidaand Cladophora coelothrix), the mussel, M. galloprovincialis, and the snail, R. venosa, from theBulgarian Black Sea shore were treated with diesel fuel [28]. Changes appeared to be greater in theevolutionary less-advanced species from both groups of marine organisms, algae and invertebrates(U. rigida and M. galloprovincialis, respectively) than in R. venosa. These results may be alsoexplained by differences in the feeding behaviour of the two types of marine animal (R. venosa isa carnivore, whereas Mytilus is a filtrator). According to others [11], soft tissue may not clearlyreflect environmental concentrations because the active excretion of metals prevents excessivebioaccumulation, and in some freshwater snails the shell demonstrates a higher affinity for metalaccumulation than the soft tissue. Our results can also be explained by the ability of R. venosa toavoid pollutants by retracting into their shell, which might act as a defence mechanism. Therefore,organisms may not give the expected biological response when exposed to chronically pollutedenvironments [29,30].
It has been reported that during a toxic bloom, R. venosa stopped feeding as dissolved oxygenand chlorophyll concentrations increased with development of the bloom. R. venosa mortalitywas preceded, over a period of 24–48 h, by external signs of stress including reduced ventilation,inability to attach to hard substrates, periodic pumping of the opercular plate and increased mucusproduction [13,14]. As properties of living organisms, bioindicators could be affected by periodicvariations in environmental factors (such as light, temperature, dissolved O2, and nutrient andcontaminant input) and by changes in biological functions (e.g. rate of metabolic processes or thereproductive cycles usually connected to environmental changes). The ecological plasticity of thedifferent organisms may also play a significant role.
In conclusion, dry matter extracts from polluted (RvP) and to a lesser degree nonpolluted(RvN) areas possess high amounts of total phenolics, and show high levels of antioxidantactivity. The highest significant content of the above-mentioned indices in RvP may serveas a bioindicator of environmental ecological quality. Although less sensitive, R. venosa andmussels can be used as bioindicators, representing an important tool for the biomonitor-ing of environmental pollution in coastal areas. Our results demonstrated that alterations inantioxidant enzymes reflected the gradient of contamination, confirming the rational use ofbiomarkers of oxidative stress in biomonitoring aquatic metal pollution. Despite its widespreaduse, the lack of detailed knowledge about variability in species-specific responses to dif-ferent pollutants is still a limitation of the biomarker approach. Standardisation of toxicol-ogy databases would assist with accurate toxicological prediction and its effective practicalimplementation.
Dow
nloa
ded
by [
Uni
vers
ity o
f G
uelp
h] a
t 07:
45 0
4 Se
ptem
ber
2012

40 S. Moncheva et al.
Acknowledgements
The authors are thankful to Dr Elena Katrich (Hebrew University of Jerusalem, School of Pharmacy) for her technicalassistance in the determination of antioxidant activity and 3D-FL, Dr Ivan Goshev and Mrs Boryana Mihaylova (Institute ofOrganic Chemistry with Centre of Phytochemistry, Bulgarian Academy of Sciences, Sofia, Bulgaria) for the transportationand lyophilisation of the samples. The study has been partly supported by SESAME FP6, EC Project, No. 036949.
References
[1] ICES. Alien Species Alert: Rapana venosa (veined whelk), R. Mann, A. Occhipinti, and J. M. Harding, eds., ICESCooperative Research Report, ISSN 1017-6195, 264 (2004), pp. 1–14.
[2] R.J. Orth, T.J.B. Carruthers, W.C. Dennison, C.M. Duarte, J.W. Fourqurean, K.L. Heck Jr, A.R. Hughes, G.A.Kendrick, W.J. Kenworthy, S. Olyarnik, F.T. Short, M. Waycott, L. Susan, and S.L. Williams, A global crisis forseagrass ecosystems, BioSci. 56 (2006), pp. 987–996.
[3] S. Gorinstein, P. Arancibia-Avila, S. Moncheva, F. Toledo, S. Trakhtenberg, A. Gorinstein, I. Goshev, and J. Namies-nik, Changes in mussel Mytilus galloprovincialis protein profile as a reaction of water pollution, Environ. Int. 32(2006), pp. 95–100.
[4] J. Namiesnik, S. Moncheva, Y.-S. Park, K.-S. Ham, B.-G. Heo, Z. Tashma, E. Katrich, and S. Gorinstein, Concen-tration of bioactive compounds in mussels Mytilus galloprovincialis as an indicator of pollution, Chemosphere 73(2008), pp. 938–944.
[5] Q. Zhou, J. Zhang, J. Fu, J. Shi, and G. Jiang, Biomonitoring: an appealing tool for assessment of metal pollutionin the aquatic ecosystem – a review, Anal. Chim. Acta 606 (2008), pp. 135–150.
[6] K.I. Lehtonen, D. Schiedek, A. Köhler, T. Lang, P.J. Vuorinen, L. Förlin, J. Baršiene, J. Pempkowiak, and J. Gercken,The BEEP project in the Baltic Sea: overview of results and outline for a regional biological effects monitoringstrategy, Mar. Pollut. Bull. 53 (2006), pp. 523–537.
[7] J.-C. Dauvin, T. Ruellet, N. Desroy, and A.-L. Janson, The ecological quality status of the Bay of Seine and the Seineestuary: use of biotic indices, Mar. Pollut. Bull. 55 (2007), pp. 241–257.
[8] B. Laffon, T. Rábade, E. Pásaro, and J. Méndez, Monitoring of the impact of Prestige oil spill on Mytilus gallo-provincialis from Galician coast, Environ. Int. 32 (2006), pp. 342–348.
[9] J.M. Harding, R. Mann, P. Moeller, and M.S. Hsia, Mortality of the veined rapa whelk, Rapana venosa, in relationto a bloom of Alexandrium monilatum in the York River, United States. J. Shellfish Res. 28 (2009), pp. 363–367.
[10] Ts. Konsulova, V. Tasev, V. Todorova, and A. Konsulov, The effect of bottom trawling on mussel beds along theBulgarian Black Sea coast, Proceedings of the Second International Conference Oceanography of the EasternMediterranean and Black Sea: Similarities and Differences of Two Interconnected Basins 14–18 October 2002,Tübitak, Turkey, Yilmaz, ed., 2003, pp. 888–896.
[11] K. Jamil, Bioindicators and Biomarkers of Environmental Pollution and Risk Assessment, Science Publishers, Enfield,NH, 2001, pp. 45–52.
[12] G.P. Shtereva, B.S. Dzhurova, and T.S. Nikolova, Contamination of sediments in Varna Lake and Varna Bay, WaterSci. Tech. 50 (2004), pp. 317–320.
[13] S. Moncheva, O. Gotsis-Skretas, K. Pagou, and A. Krastev, Phytoplankton blooms in Black Sea and Mediterraneancoastal ecosystems subjected to anthropogenic eutrophication: Similarities and differences, Estuar. Coast. Shelf Sci.53 (2001), pp. 281–295.
[14] C. Sahin, H. Emiral, I. Okumus, A.M. Gozler, F. Kalayci, and N. Hacimurtezaoglu, The Benthic exotic species of theBlack Sea: blood cockle (Anadara inaequivalvis, Bruguiere, 1789: Bivalve) and Rapa whelk (Rapana thomasiana,Crosse, 1861: Mollusc), J. Anim. Vet. Adv. 8 (2009), pp. 240–245.
[15] N. Balkis, A. Aksu, E. Okus, and R. Apak, Heavy metal concentrations in water, suspended matter, and sedimentfrom Gökova Bay, Turkey, Environ. Monit. Assess. doi 10.1007/s10661-009-1055-x (2010).
[16] A. Edelmann and B. Lendl, Toward the optical tongue: flow-through sensing of tannin-protein interactions basedon FTIR spectroscopy, J. Am. Chem. Soc. 24 (2002), pp. 14741–14747.
[17] S. Gorinstein, S. Moncheva, E. Katrich, F. Toledo, P. Arancibia, I. Goshev, and S. Trakhtenberg, Antioxidants in theblack mussel (Mytilus galloprovincialis) as an indicator of Black Sea costal pollution, Mar. Pollut. Bull. 46 (2003),pp. 1317–1325.
[18] R. Apak, K. Guclu, M. Ozyurek, and S.E. Karademir, Novel total antioxidant capacity index for dietary polyphenolsand vitamins C and E, using their cupric ion reducing capability in the presence of neocuproine: CUPRAC method,J. Agr. Food Chem. 52 (2004), pp. 7970–7981.
[19] M. Ozgen, R.N. Reese, A.Z. Tulio Jr, J.C. Scheerens, and A.R. Miller, Modified 2,2azino-bis-3-ethylbenzothiazoline-6-sulfonic acid (ABTS) method to measure antioxidant capacity of selected small fruits and comparison to ferricreducing antioxidant power (FRAP) and 2, 20diphenyl-1-picrylhydrazyl (DPPH) methods, J. Agr. Food Chem. 54(2006), pp. 1151–1157.
[20] F. Regoli, Total oxyradical scavenging capacity (TOSC) in polluted and translocated mussels: a predictive biomarkerof oxidative stress, Aquat. Toxicol. 50 (2000), pp. 351–361.
[21] S. Moncheva, V. Alexandrova, and N. Slabakova, On the application of phytoplankton body-size structure as ecolog-ical quality descriptor of transitional waters (Varna Lagoon–Black Sea), 38 CIESM Congress, 9–14 April, Istanbul,Turkey, 2007.
Dow
nloa
ded
by [
Uni
vers
ity o
f G
uelp
h] a
t 07:
45 0
4 Se
ptem
ber
2012

Chemistry and Ecology 41
[22] B.-w. Ren, W.-h. Zhao, J.-t. Wang, J.-z. Zou, X.-t Han, L. Wang, and Y.- l. Liu, Three-dimensional fluorescencecharacteristic of dissolved organic matter in marine mesocosm experiment in Jiaozhou Bay, China, Huanjing Kexue28 (2007), pp. 712–718.
[23] J. Chen, E.J. LeBoeuf, S. Dai, and B. Gu, Fluorescence spectroscopic studies of natural organic matter fractions,Chemosphere 50 (2003), pp. 639–647.
[24] P. Harder, M. Grunze, J.H. Waite, and J. Herbert, Interaction of the adhesive protein Mefp-1 and fibrino-gen with methyl and oligo (ethylene glycol)-terminated self-assembled monolayers, J. Adhesion 73 (2000),pp. 161–177.
[25] C. Fant, J. Hedlund, F. Hook, M. Berglin, E. Fridell, and H. Elwing, Investigation of adsorption and cross-linkingof a mussel adhesive protein using attenuated total internal reflection Fourier transform infrared spectroscopy(ATR-FTIR), J. Adhesion 86 (2010), pp. 25–38.
[26] M. Calero and M. Gasset, Fourier transform infrared and circular dichroism spectroscopies for amyloid studies,Methods Mol. Biol. 299 (2005), pp. 129–151.
[27] M. Bratu, L. Tofan, V. Coatu, and M. Crasmaru, Comparative study of catalase activity from mid gland of threemolluscs species from the Black Sea, J. Environ. Protect. Ecol. 5 (2004), pp. 341–346.
[28] J.T. Nechev, S.V. Khotimchenko, A.P. Ivanova, K.L. Stefanov, S.D. Dimitrova-Konaklieva, S. Andreev, and S.S.Popov, Effect of diesel fuel pollution on the lipid composition of some wide-spread Black Sea algae and invertebrates,Z. Naturforsch. C 57 (2002), pp. 339–343.
[29] S. Winter, Cadmium uptake kinetics by freshwater mollusk soft body under hard and soft water conditions,Chemosphere 32 (1996), pp. 1937–1948.
[30] D.J. Reid and G.R. Macfarlane, Potential biomarkers of crude oil exposure in the gastropod mollusk, Austro-cochlea porcata: laboratory and manipulative fiemld studies, Environ. Pollut. 126 (2003), pp. 147–155.
[31] B. Savov and V. Penchev, Reducing contaminanted sediments at dredging areas, in Proceedings of the InternationalConference on Port Development and Coastal Environment, 5–7 June 2000, Black Sea Coastal Association, Varna,pp. 93–102.
Dow
nloa
ded
by [
Uni
vers
ity o
f G
uelp
h] a
t 07:
45 0
4 Se
ptem
ber
2012