rap binder blending studyrap binder blending … binder blending studyrap binder blending study ......
TRANSCRIPT

U.S. Department of TransportationFederal Highway Administration
RAP Binder Blending StudyRAP Binder Blending Study
Audrey Copeland & Raj Dongre
RAP Expert Task Group MeetingDecember 17, 2009
Seattle WASeattle, WA
AcknowledgementsAcknowledgements
• Satish BelaguttiSatish Belagutti• David Heidler
D ll J k• Darnell Jackson• Eugeniu Morari• Scott Parobeck• Monty SimpsonMonty Simpson
U.S. Department of TransportationFederal Highway Administration

OutlineOutline
• Current Guidelines & RemainingCurrent Guidelines & Remaining Challenges
• Summary of current binder blending work• Summary of current binder blending work• Problem statement• FHWA mini experiment• Results Discussion & Implicationsp• Future Work
U.S. Department of TransportationFederal Highway Administration

Current Guidelines
•• AASHTO M 323AASHTO M 323 Standard Specification for SuperpaveStandard Specification for SuperpaveTMTM
Volumetric Mix DesignVolumetric Mix DesignVolumetric Mix DesignVolumetric Mix Design
Recommended Virgin Asphalt Binder GradeRecommended Virgin Asphalt Binder Grade Percent (%) RAPPercent (%) RAPNo change in binder selectionNo change in binder selection < 15< 15No change in binder selectionNo change in binder selection < 15< 15Select virgin binder grade one grade softer than normalSelect virgin binder grade one grade softer than normal 15 15 –– 2525Follow recommendations from blending chartsFollow recommendations from blending charts > 25> 25
• Based on significant blending between virgin and RAP binder• Based on limited aging data & climate variabilityBased on limited aging data & climate variability• Did not consider processing (i.e. fractionation) or plant
production effects• Softer binder grade requirements
U.S. Department of TransportationFederal Highway Administration 4
g q

Remaining ChallengesRemaining Challenges
• Blended virgin and RAP binder qualitiesBlended virgin and RAP binder qualities– High RAP
Polymer modified binders– Polymer-modified binders
• Stiffening of the mix from high RAP and cracking performance– Pre-mature & low temperature cracking
U.S. Department of TransportationFederal Highway Administration Source: Jones 2009 Survey

Blending thoughtsBlending thoughts…
• No procedure to determine blending thatNo procedure to determine blending that “actually” occurs in the mix.
• However do we need a method to• However, do we need a method to determine blending?O d j t d t• Or, do we just need to ensure we are getting required properties for
fperformance.
U.S. Department of TransportationFederal Highway Administration
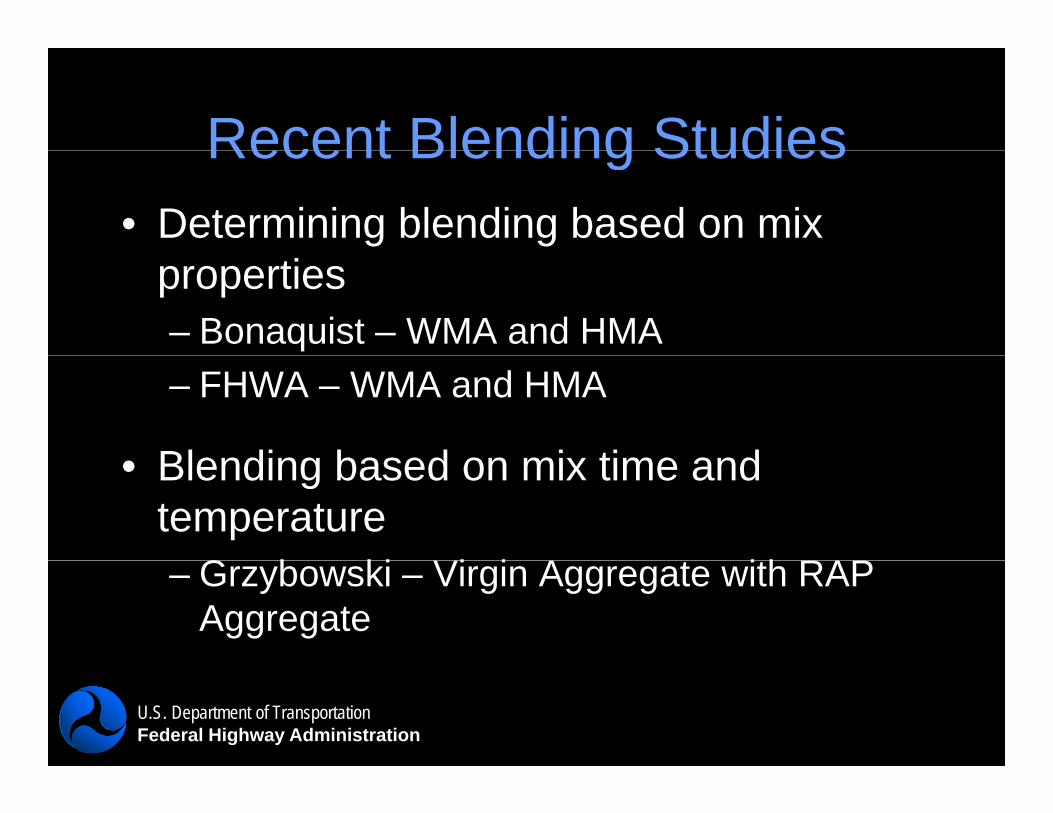
Recent Blending StudiesRecent Blending Studies• Determining blending based on mix
properties– Bonaquist – WMA and HMA– FHWA – WMA and HMA
Blending based on mi time and• Blending based on mix time and temperature
G b ki Vi i A t ith RAP– Grzybowski – Virgin Aggregate with RAP Aggregate
U.S. Department of TransportationFederal Highway Administration
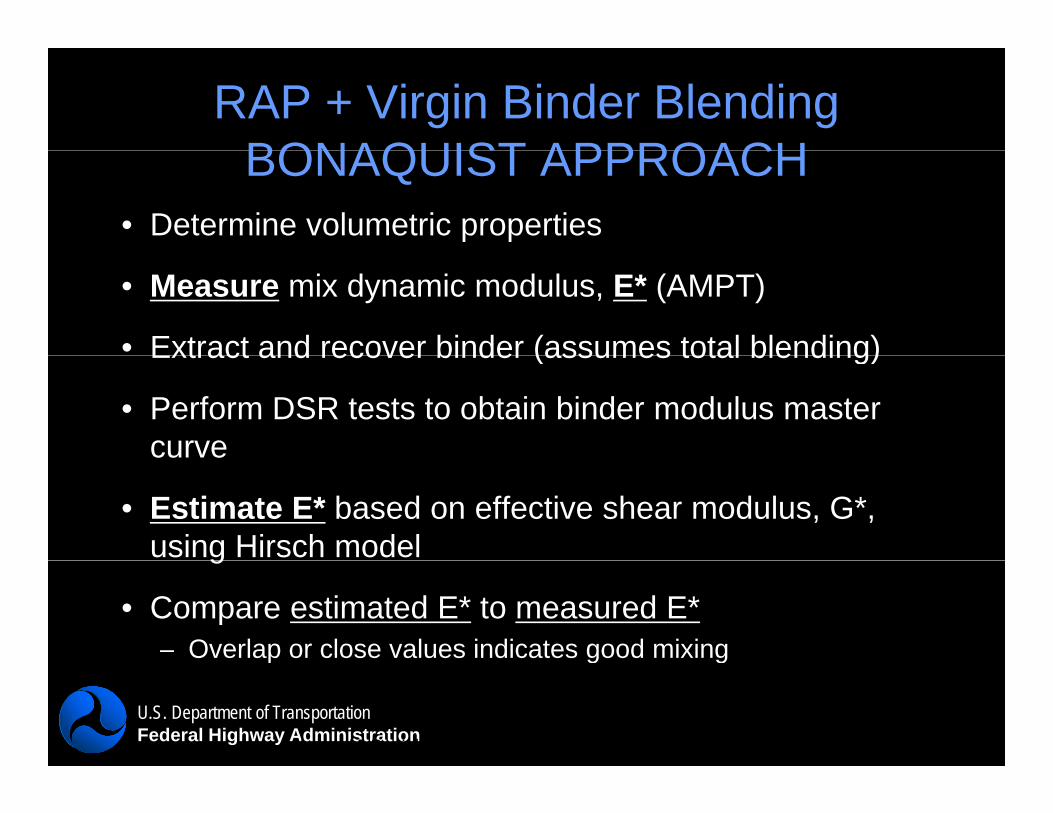
RAP + Virgin Binder Blending BONAQUIST APPROACHBONAQUIST APPROACH
• Determine volumetric properties
• Measure mix dynamic modulus, E* (AMPT)
• Extract and recover binder (assumes total blending)Extract and recover binder (assumes total blending)
• Perform DSR tests to obtain binder modulus master curve
• Estimate E* based on effective shear modulus, G*, using Hirsch modelg
• Compare estimated E* to measured E*– Overlap or close values indicates good mixing
U.S. Department of TransportationFederal Highway Administration
p g g
Rebecca McDaniel, North Central Superpave Center
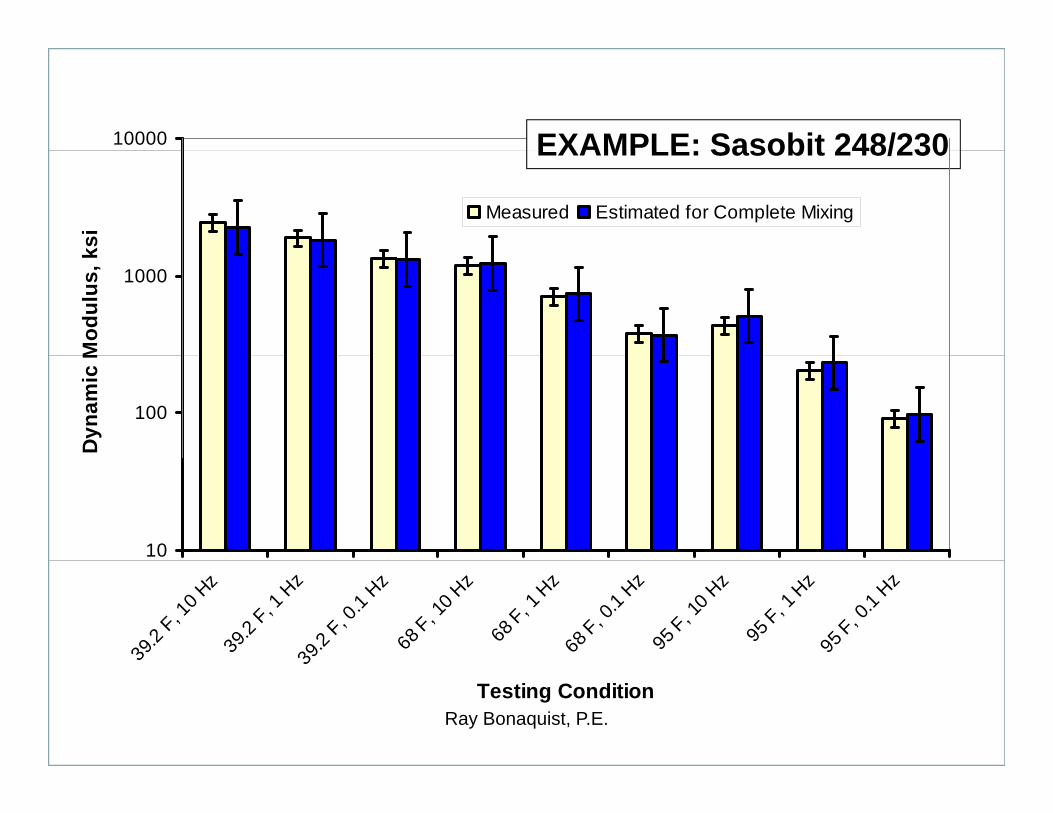
10000 EXAMPLE: Sasobit 248/230
ksi
Measured Estimated for Complete Mixing
EXAMPLE: Sasobit 248/230
1000
Mod
ulus
, k
100
Dyn
amic
M
10
39.2
F, 10 H
z39
.2 F, 1
Hz
39.2
F, 0.1
Hz68
F, 10 H
z68
F, 1 H
z68
F, 0.1
Hz95
F, 10 H
z95
F, 1 H
z95
F, 0.1
Hz
U.S. Department of TransportationFederal Highway Administration
3
Testing ConditionRay Bonaquist, P.E.

RAP + Virgin Binder Blending FHWA A l iFHWA Analysis
• Measure mix dynamic modulus, E* (AMPT)y , ( )
• Extract and recover binder (assumes total blending)
M d bi d h d l G* (DSR)• Measure recovered binder shear modulus, G* (DSR)
• Estimate Mix E* from recovered Binder G* using the Hirsch Model and Witczak ModelsHirsch Model and Witczak Models
• Compare Estimated E* to Measured E* for the hot-mixO l i di t d i i– Overlap indicates good mixing
U.S. Department of TransportationFederal Highway Administration

Florida Hi-RAP E* Comparison Hirsch Model at 21.1°CPredicted vs. Measured E* Values Predicted vs. Measured E* Values (Hirsch Model at 21.1(Hirsch Model at 21.1oo C)C)
1000000
07-2560B MixHigh RAP WMA Mix
750000
cted
)
07-5710-B MixHigh RAP Control Mix
500000
psi (
Pred
ic
250000
E*, p
00 250000 500000 750000 1000000
U.S. Department of TransportationFederal Highway Administration
11
0 250000 500000 750000 1000000E*, psi (Measured)
U.S. Department of TransportationFederal Highway Administration

Florida Hi-RAP E* Comparison Hirsch Model at 37.8°CPredicted vs. Measured E* Values Predicted vs. Measured E* Values (Hirsch Model at 37.8(Hirsch Model at 37.8oo C)C)
1000000
07-2560B MixHigh RAP WMA Mix
750000
cted
)
07-5710-B MixHigh RAP Control Mix
500000
psi (
Pred
ic
250000
E*, p
00 250000 500000 750000 1000000
U.S. Department of TransportationFederal Highway Administration
12
0 250000 500000 750000 1000000E*, psi (Measured)
U.S. Department of TransportationFederal Highway Administration

Florida Hi-RAP E* Comparison Witczak's Model at 21.1°CPredicted vs. Measured E* Values Predicted vs. Measured E* Values (Witczak Model at 21.1(Witczak Model at 21.1oo C)C)
1000000
07-2560B MixHigh RAP WMA Mix
750000
cted
)
07-5710-B MixHigh RAP Control Mix
500000
psi (
Pred
ic
250000
E*, p
00 250000 500000 750000 1000000
U.S. Department of TransportationFederal Highway Administration
13
0 250000 500000 750000 1000000E*, psi (Measured)
U.S. Department of TransportationFederal Highway Administration

Florida Hi-RAP E* Comparison Witczak's Model at 37.8°CPredicted vs. Measured E* Values Predicted vs. Measured E* Values (Witczak Model at 37.8(Witczak Model at 37.8oo C)C)
1000000
07-2560B MixHigh RAP WMA Mix
750000
cted
)
07-5710-B MixHigh RAP Control Mix
500000
psi (
Pred
ic
250000
E*, p
00 250000 500000 750000 1000000
U.S. Department of TransportationFederal Highway Administration
14
0 250000 500000 750000 1000000E*, psi (Measured)U.S. Department of Transportation
Federal Highway Administration

Take-awayTake away • The method for evaluating mix blending has
merit.
• Significant blending may not be happening with RAP & WMA at lower mix temperatures.
• For RAP & WMA, the measured values were hi h th di t d lhigher than predicted values– Is significant blending necessary?
U.S. Department of TransportationFederal Highway Administration

Grzybowski Summaryy y• Complete blending of RAP Binder and
Vi i Bi d R i V Hi hVirgin Binder Requires Very High Temperatures and Long Blend Times– Temperatures: 400 to 800 oF– Blending times: 1, 5, and 10 minutes
U.S. Department of TransportationFederal Highway Administration

U.S. Department of TransportationFederal Highway Administration

U.S. Department of TransportationFederal Highway Administration

U.S. Department of TransportationFederal Highway Administration
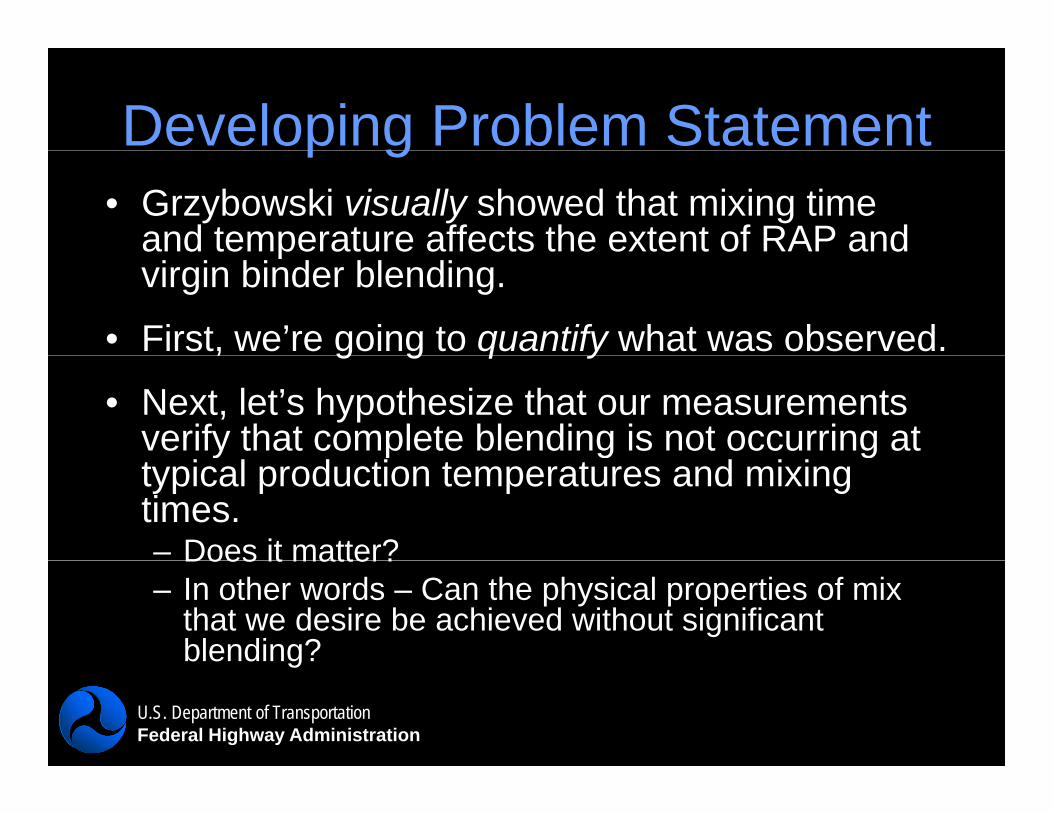
Developing Problem Statementp g• Grzybowski visually showed that mixing time
and temperature affects the extent of RAP and pvirgin binder blending.
• First, we’re going to quantify what was observed., g g q y
• Next, let’s hypothesize that our measurements verify that complete blending is not occurring at y g gtypical production temperatures and mixing times.– Does it matter?Does it matter?– In other words – Can the physical properties of mix
that we desire be achieved without significant blending?
U.S. Department of TransportationFederal Highway Administration
g

FHWA Exploratory ExperimentFHWA Exploratory Experiment
• Part I: Quantifying that mix time and temp havePart I: Quantifying that mix time and temp have an effect on blending– Laboratory Simulation of RAP Binder and Virgin
Binder Blending in RTFO• DSR
• Part II: Does blending matter for mix properties?– Laboratory Simulation of RAP Binder and Virgin
Binder Blending in Hot-Mix• E* and Flow Number from AMPT Device• Comparison with Plant Produced Hot-Mix
U.S. Department of TransportationFederal Highway Administration
Comparison with Plant Produced Hot Mix
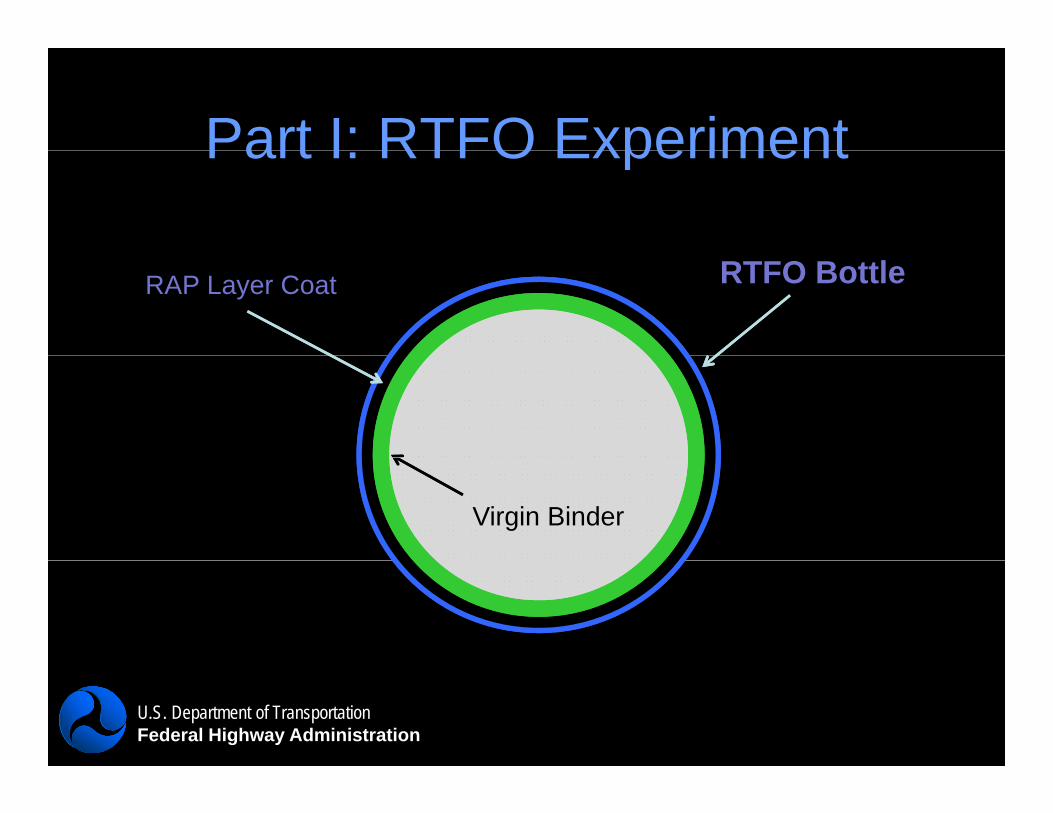
Part I: RTFO ExperimentPart I: RTFO Experiment
RTFO BottleRAP Layer Coat
Virgin Binder
U.S. Department of TransportationFederal Highway Administration

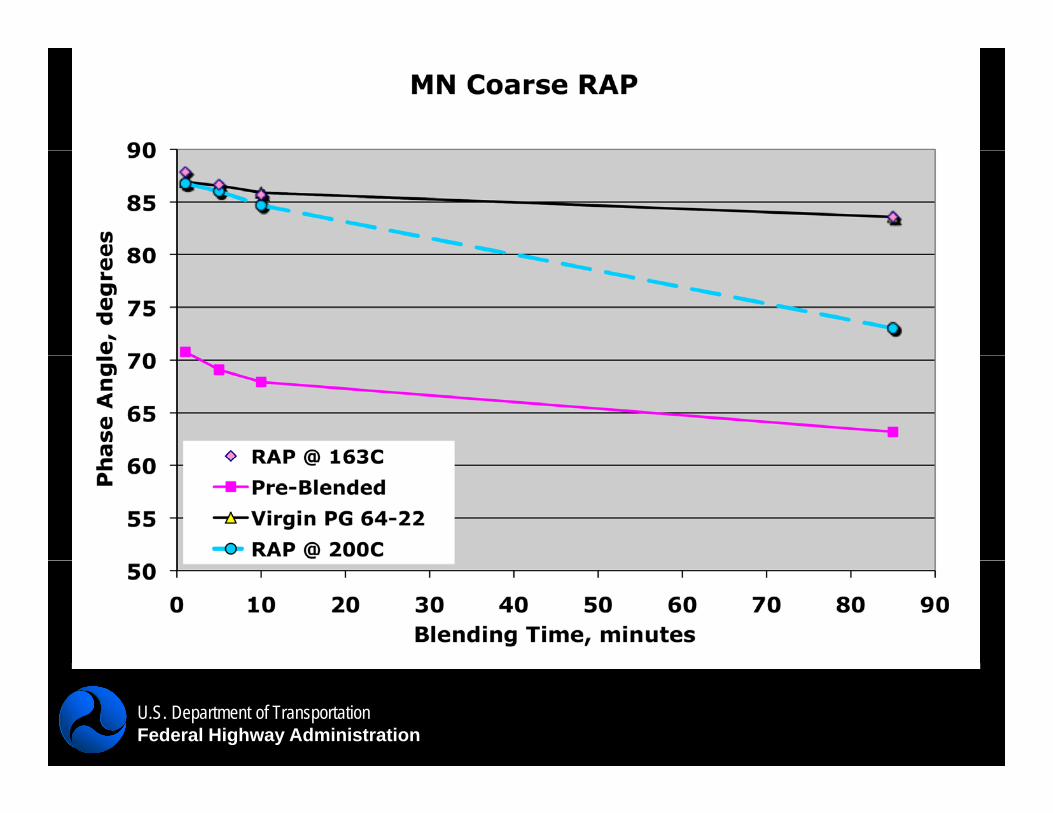
Part I: RTFO Experiment No 1Part I: RTFO Experiment No. 1• RAP Binder: MN Coarse Extracted RAP
Binder• Virgin Binder: PG 64-22 (AMRL 211)g ( )• RAP Binder Temperatures
– 163oC and 200oC163 C and 200 C• Virgin Binder Temperature
163oC d 200oC• 163oC and 200oC– Blending Times: 1, 5, 10, and 85 minutes
U.S. Department of TransportationFederal Highway Administration

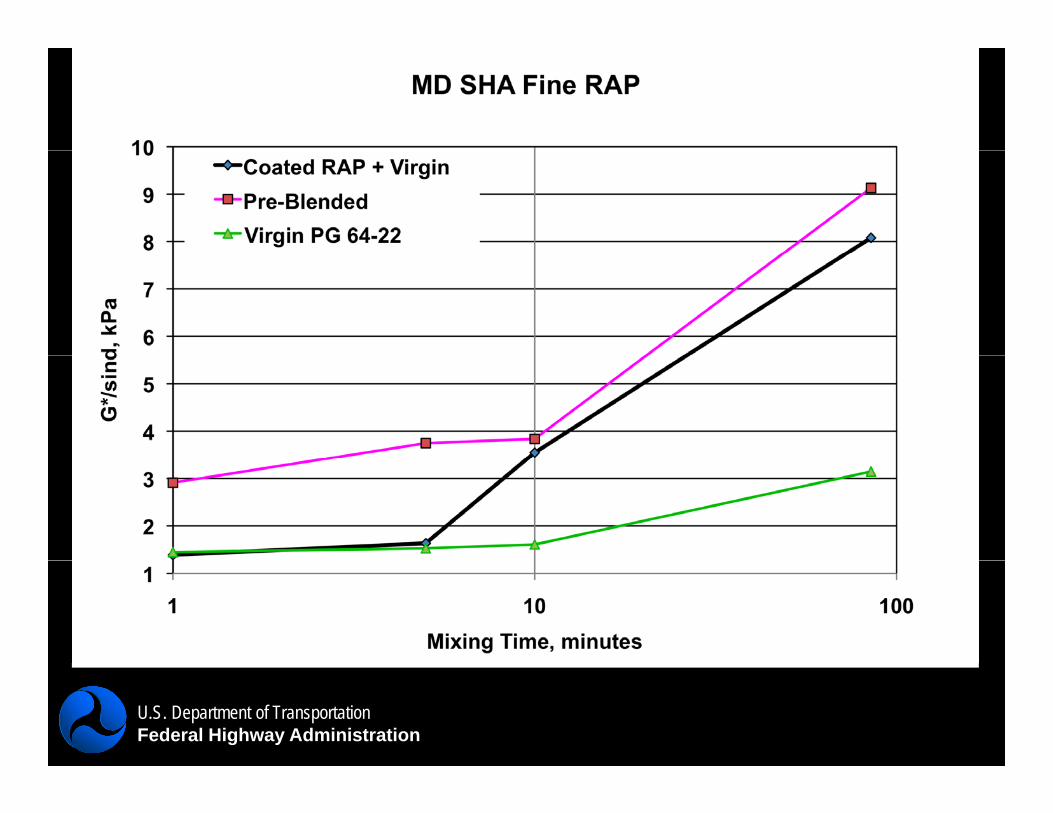
Part I: RTFO Experiment No 2Part I: RTFO Experiment No. 2• RAP Binder: MD SHA Extracted RAP
Binder• Virgin Binder: PG 64-22 (NuStar)g ( )• RAP Binder Temperatures
– 135oC135 C • Virgin Binder Temperature
163oC– 163oC – Blending Times: 1, 5, 10, and 85 minutes
U.S. Department of TransportationFederal Highway Administration

U.S. Department of TransportationFederal Highway Administration
U.S. Department of TransportationFederal Highway Administration
U.S. Department of TransportationFederal Highway Administration

Does Blending Matter?g• It is possible to produce RAP mix properties
without the virgin binder and RAP binder actually blending– Composite Effect
• How to Demonstrate?– Binder ExperimentBinder Experiment– Hot-mix Experiment
U.S. Department of TransportationFederal Highway Administration

Binder ExperimentComposite Effect
• Test in DSR at 76oCTest in DSR at 76 C• Virgin Binder layer on top of RAP binder layer
– 75% Virgin binder layer (0.375 g)– 25% RAP binder (0.125 g)
• Pre-blended RAP+Virgin binder in one layer – 0 500 g of pre-blended RAP+Virgin binder– 0.500 g of pre-blended RAP+Virgin binder
U.S. Department of TransportationFederal Highway Administration
Binder ExperimentComposite Effect
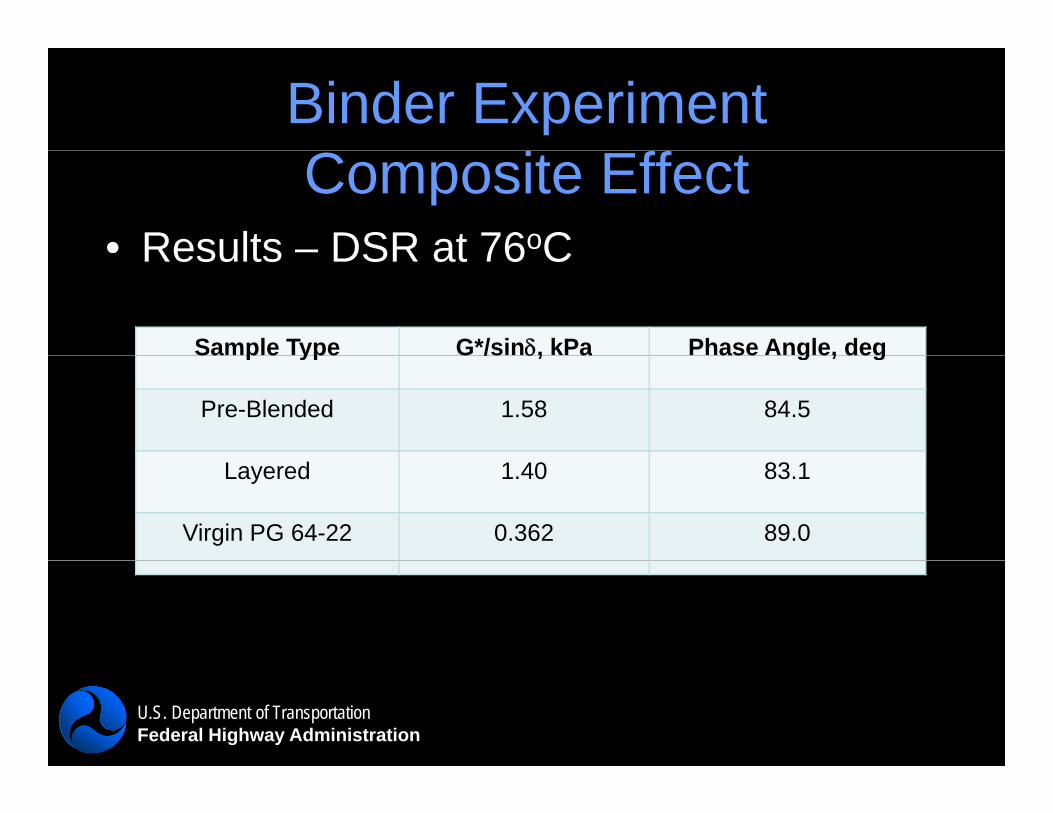
• Results – DSR at 76oCResults DSR at 76 C
Sample Type G*/sin, kPa Phase Angle, degSa p e ype G /s , a ase g e, deg
Pre-Blended 1.58 84.5
Layered 1.40 83.1
Virgin PG 64-22 0.362 89.0
U.S. Department of TransportationFederal Highway Administration

Binder ExperimentHow Composite Effect?
Strain virgin layerStrain virgin layer
Strain RAP layer
U.S. Department of TransportationFederal Highway Administration

Hot-Mix Experiment Composite Effect
MD SHA Approved 28% RAP Mix• MD SHA Approved 28% RAP Mix– Obtained RAP and Virgin Aggregate– PG 64-22 binder (NuStar)– Plant Produced Mix Samples
U.S. Department of TransportationFederal Highway Administration

FHWA Hot-Mix ExperimentFHWA Hot Mix Experiment• Laboratory Blending
– Virgin and RAP aggregates mixed using normal bucket mixer (pre-blended)
– Virgin and RAP aggregates mixed separately– Mixed together immediately before compaction
• Short Term Oven Aged for 4 hours• AMPT Testing
– 20oC E* at various frequencies– 58oC Flow Number unconfined
U.S. Department of TransportationFederal Highway Administration

MD SHA 28% RAP Mix
100,000Open Symbols -- Standard Lab Mixing 28%RAP Mix from MD SHARed Symbols -- 28% RAP Mixed Separately Before CompactionBlue Symbols Production Samples of 28% RAP MD SHA
10,000
Pa
Blue Symbols -- Production Samples of 28% RAP MD SHATest Temperature = 20oC
1 000
E*, M
P
1,000
1000.01 0.1 1 10
Loading Frequency, Hz
U.S. Department of TransportationFederal Highway Administration

61,000Black Curves -- Standard Lab Mixing 28% RAP MDSHA MixRed Curves -- 28% RAP Mixed Separately Before CompactionBlue Curves -- Production Samples
41,000
51,000
,
31,000
,
ulat
ed S
train
21,000Acc
umu
11,000
1,0001 10 100 1000 10000
Cycles, N
U.S. Department of TransportationFederal Highway Administration
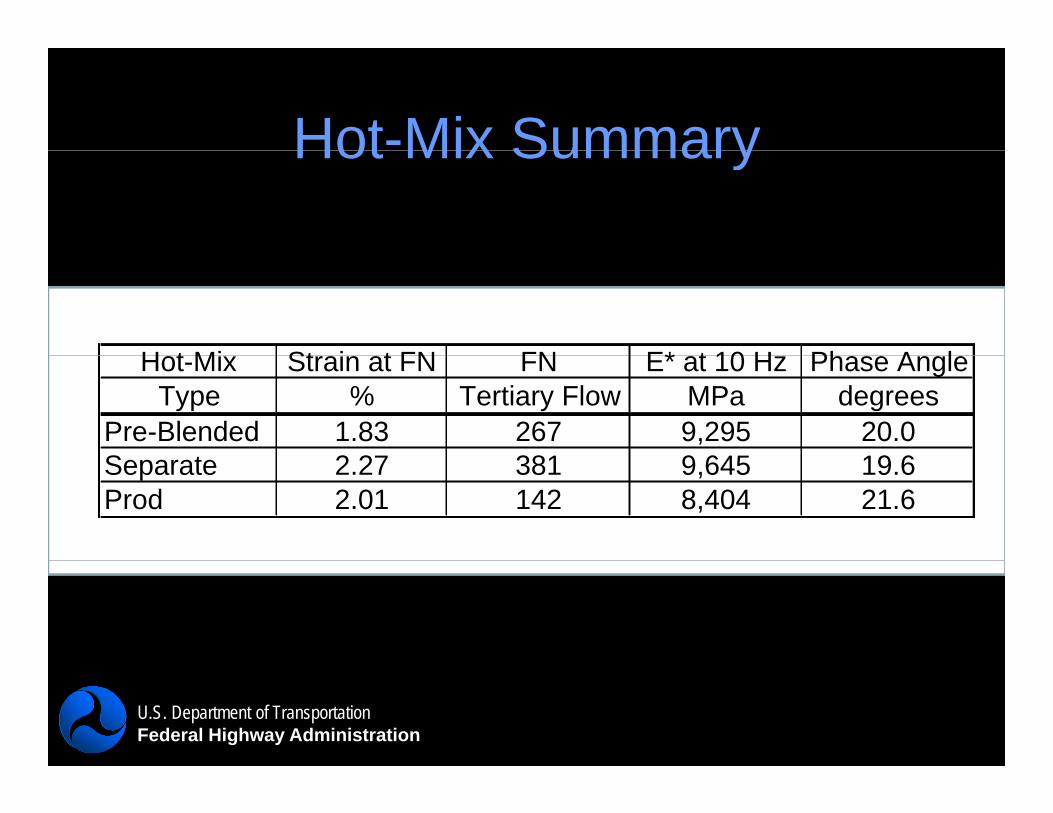
Hot-Mix SummaryHot Mix Summary
H t Mi St i t FN FN E* t 10 H Ph A lHot-Mix Strain at FN FN E* at 10 Hz Phase AngleType % Tertiary Flow MPa degrees
Pre-Blended 1.83 267 9,295 20.0S t 2 27 381 9 645 19 6Separate 2.27 381 9,645 19.6Prod 2.01 142 8,404 21.6
U.S. Department of TransportationFederal Highway Administration

What have we learned?• RAP binder and Virgin Binder Blending
N t 100% bl d d ith bl ti d– Not 100% blended with reasonable time and temperatureBlending ma not be necessar to prod ce– Blending may not be necessary to produce properties similar to blended binder because of composite effectof composite effect
• Hot-Mix blendingStandard lab mixing mixing separately and– Standard lab mixing, mixing separately, and plant produced mixes gave similar properties
U.S. Department of TransportationFederal Highway Administration

Implications• Blend charts – should they be used if they
assume 100% blending?g– Grade softening for high RAP mixes
Th l i b• The real issue may be proper homogenous mixing of RAP and Virgin
taggregate– Plant operation and parameters control that– Bonaquist procedure for plant mixing
homogeneity for high RAP mixes is neededBi d t ti b i l !
U.S. Department of TransportationFederal Highway Administration
• Binder extraction may be meaningless!

Future StepsFuture Steps
• Further verification of the binder and mixFurther verification of the binder and mix exploratory study
Include other RAP and virgin combinations– Include other RAP and virgin combinations– Evaluate different size RAPs
• Low temperature properties– Marasteanu BBR sliver test– Fracture – semi-circular bending test
U.S. Department of TransportationFederal Highway Administration

U.S. Department of TransportationFederal Highway Administration
Thank you!
Questions?