rainfall and cotton yields in the sudan gezira
TRANSCRIPT

Rainfall and Cotton Yields in the Sudan GeziraAuthor(s): Edward M. Crowther and Frank CrowtherSource: Proceedings of the Royal Society of London. Series B, Biological Sciences, Vol. 118, No.809 (Sep. 2, 1935), pp. 343-370Published by: The Royal SocietyStable URL: http://www.jstor.org/stable/81917 .
Accessed: 03/05/2014 12:18
Your use of the JSTOR archive indicates your acceptance of the Terms & Conditions of Use, available at .http://www.jstor.org/page/info/about/policies/terms.jsp
.JSTOR is a not-for-profit service that helps scholars, researchers, and students discover, use, and build upon a wide range ofcontent in a trusted digital archive. We use information technology and tools to increase productivity and facilitate new formsof scholarship. For more information about JSTOR, please contact [email protected].
.
The Royal Society is collaborating with JSTOR to digitize, preserve and extend access to Proceedings of theRoyal Society of London. Series B, Biological Sciences.
http://www.jstor.org
This content downloaded from 130.132.123.28 on Sat, 3 May 2014 12:18:54 PMAll use subject to JSTOR Terms and Conditions

343
633 5I: 55I ? 577
Rainfall and Cotton Yields in the Sudan Gezira
By EDWARD M. CROWTHER, D.Sc., F.I.C., Chemistry Department, Rothamsted Experimental Station, Harpenden, Herts, and FRANK CROWTHER, D.Sc., formerly Plant Physiologist, Gezira Agricultural Research Service, Sudan Government.
(Communicated by Sir John Russell, F.R.S.-Received June 3, 1935)
INTRODUCTION
Agricultural meteorology makes slow progress because it is rarely possible to study the correlation of weather and yield for crops grown in normal agricultural rotations over long periods. Both in commercial agriculture and at experiment stations, rotations and cultural methods change sufficiently frequently to destroy the homogeneity of the data, even when records are kept for specific fields or farms. In some of the newer agricultural areas, and especially in those under irrigation, the cropping is simpler, and the need for records and field experiments is more keenly appreciated. Research programmes and practical measures must be determined from experience over only a few decades; but erroneous conclusions may easily be drawn from trends over such short periods, memories of individual years, or simple correlations of yields and single weather variates. In the present paper, modern statistical methods of analysing small samples of data are used to examine the relationships between rainfall and cotton yields under irrigation in the Sudan Gezira for periods up to 23 years.
The mean yields from this large and semi-desert area fluctuate violently from year to year in such a way as to suggest the dominance of some climatic factor. It will be shown that the cotton yields are highly correlated with rainfall, and further, that seasonal fluctuations in rainfall, including certain cyclic changes, are sufficient to account for most of the decline in yield on some of the oldest areas. This conclusion has considerable practical importance, because a recent sequence of low yields led some critics (Balls, 1935, Vageler and Alten, 1932) of the scheme to conclude that irrigation without drainage had already produced serious soil deterioration. The significance of some of the rainfall effects established may direct attention to new methods of studying problems of soil fertility and the control of pests.
This content downloaded from 130.132.123.28 on Sat, 3 May 2014 12:18:54 PMAll use subject to JSTOR Terms and Conditions

E. M. Crowther and F. Crowther
EARLIER ANALYSES
In i925, E. M. Crowther (1926) found that the yields of cotton grown under irrigation in the normal three-course rotation of the Sudan Gezira appeared to be negatively correlated with the amount of rain in May and June, even though the greater part of the season's rainfall was in July and August, and the cotton was not sown until August. The evidence was admittedly scanty, but it included all the data then available for cotton grown under uniform crop rotations. At the time the suggested importance of early rains aroused little interest among the local workers, but more recently a run of several low yields in years with high early rains, broken by a very good year with unusually late rains, led to an exaggerated confidence in the importance of the effect, and to numerous ad hoc hypotheses to explain it.
In 1931 Hewison, who as Director of Agriculture in the Sudan Government was associated with the Gezira scheme from its inception, published a graphical analysis of the yields and total rainfall for the oldest centre-Taiyiba-from 1911 to 1931. He ignored the effects of early rains, but concluded that high total rainfall was a primary cause of low seasonal yields, and suggested some of the ways in which heavy rains might interfere with the cultivation and growth of the crop. Hewison also noticed an apparent increase in the total annual rainfall at Taiyiba over the period, without realizing, however, that this circumstance weakened the evidence for his conclusion. If irrigation caused some progressive deterioration of the soil or increase in weeds and pests during a period in which rainfall also increased, yields and rainfall would necessarily be correlated. In the period from 1911 to 1931 the yield was above the average in seven of the first nine years, and rainfall was below the average in eight of these nine years. It is not possible, there- fore, to decide whether the lower yields in the second half of the period were due to extra rainfall or to some other slow change in soil or environmental conditions. Clearly, progressive changes and annual fluctuations should be separated before testing correlations which it is hoped may reveal causal relationships. Hewison also noted that spells of a few wet or dry years tended to occur together.
In 1933 F. Crowther showed that the Taiyiba yields gave negative partial regressions on both early and total rainfall. In other words, atlhough rainfall as a whole was harmful, a given quantity of rain had a more deleterious effect early in the season than later on.
344
This content downloaded from 130.132.123.28 on Sat, 3 May 2014 12:18:54 PMAll use subject to JSTOR Terms and Conditions

Rainfall and Cotton Yields in the Sudan Gezira
THE SUDAN GEZIRA
The Sudan Gezira, fig. 1, may be defined as the roughly triangular area bounded by the Blue and the White Niles and the railway from the
320 33? 340 EE E
FIG. 1-Map of Sudan Gezira showing the earliest cotton areas, Taiyiba, Barakat, and the Gezira Research Farm the present canalization, the position of nine rain gauges, and the calculated isohyetes for mean annual rainfall
Sennar dam to Kosti. Cotton has been grown in the Eastern Gezira under irrigation since 1911, the water being lifted from the Blue Nile by pumps until 1925, and by the Sennar dam subsequently. Over most of
345
This content downloaded from 130.132.123.28 on Sat, 3 May 2014 12:18:54 PMAll use subject to JSTOR Terms and Conditions
E. M. Crowther and F. Crowther
the irrigated area the soil is a deep, heavy, alkaline clay overlying a deep but less heavy alluvial deposit. Little of the irrigation water penetrates beyond one metre, below which depth accumulations of sodium and calcium salts are common. The soil was fully described, with analytical data, by Greene (1928, a, b) and discussed more generally by Vageler and F. Alten.(1932). Throughout much of the season the cotton is liable to show temporary wilting of the leaves under the intense radiation and extremely low atmospheric humidity, but, in spite of this, all of the significant correlations established in this paper show that extra rainfall at any period is harmful.
Before irrigation was introduced, much of the land was heavily cropped with dura (Sorghum vulgare or caudatum, millet), rain-water being accumu- lated by means of light earth banks. A pump station for cotton irrigation was opened at Taiyiba in 1911, a second one at Barakat in 1914, and a few others from 1921 to 1924 to facilitate the change to large-scale irrigation in 1925. The Gezira Research Farm was set up in 1918 at the north of the Barakat Farm.
The analysis of yield records for these centres is complicated by the circumstance that, as the pioneers gained experience, they frequently brought in new land and changed the crop rotations and methods of cultivation without retaining experimental record areas under uniform treatment. The actual yields for individual tenancies (generally with 10 acres of cotton annually) were always carefully recorded and mapped, since they formed the basis of payment to the native cultivator. Through the courtesy of the Sudan Plantations Syndicate, Ltd., we have had access to these records from the first cultivation of the two oldest farms up to the 1931-32 season, and also to their rainfall records and confidential monthly reports. We have thus been able to prepare our data from the original sources, and to select areas and periods in which the cultural treatments of the crop were most nearly uniform. The mean yields from some of these areas are given in Table II, as they are not accessible elsewhere. Some detailed accounts of the areas selected for analysis will be given later, but at this stage it will be sufficient to outline the customary cultivation of the crop from about 1918 to 1931. Cotton was grown every third year, and was generally followed by either dura or lubia (Dolichos Lablab), grown with summer rains and minimal irrigations, and then by a year's fallow during which the land was cultivated by heavy power tackle and set up in ridges. Rainstorms increase in frequency and amount from occasional showers in May and June to a maximum in August. Rains are slight in September and October and rare later. As the cotton is sown about the middle of August after an irrigation, heavy rains in this month delay
346
This content downloaded from 130.132.123.28 on Sat, 3 May 2014 12:18:54 PMAll use subject to JSTOR Terms and Conditions

Rainfall and Cotton Yields in the Sudan Gezira
sowing, and may necessitate one or more resowings. Fortnightly irrigations are given from October to March.
Two of the more obvious causes of low seasonal yields are a bacterial disease-Blackarm*-and a virus disease-Leaf Curl. The important secondary infection by Blackarm is distributed from infected foci by the splash of rain. The virus disease, which became serious about 1928, is distributed by white fly from ratoon cotton and certain weeds. Formerly the plants were cut off at ground level for burning at the end of the picking season in April, but recently the plants with their tap roots have been pulled out to reduce the risk of a redistribution of diseases from ratoon cotton in the following season.
THE METHOD OF ANALYSIS
Since the yield data are limited to the period 1911 to 1933, it is impossible to secure independent groups of seasonal data ; separate parts of this run of years would be too short for satisfactory estimation of the errors of the regression equations. The only alternative is to take, first, the longest set of years and the largest areas, and, second, periods in which the agri- cultural factors and the actual soils were substantially constant. Although the different selections must be correlated by including many years in common, we have always used the whole of the relevant data available. It is, of course, important to avoid the spuriously high correlations which might be obtained by picking out a few selected weather variates found by trial and error to give promising results for the individual groups of data. Some high chance correlations would probably be found during the short period for which the Gezira has had a first-class meteorological equipment, provided a sufficient number of determined trials was made for different weather variates. Apart from the Gezira Research Farm, the meteoro- logical data have until recently been restricted to rainfalls at the two oldest cotton centres and nine other places in the Gezira.
In his classical analysis of " The Influence of Rainfall on the Yield of Wheat at Rothamsted," Fisher (1924) discussed the effects of paucity of crop data in the general problem of evaluating the effects of weather on crops. He laid down the following conditions for arriving at unpreju- diced results.
" 1-The meteorological variates to be employed must be chosen with- out reference to the actual crop record.
* Bacterium malvacearum, first called Pseudomonas malvacearum by E. F. Smith in 1901, but amended by him to Bacterium malvacearum in 1905.
VOL. CXVIII.-B.
347
2 B
This content downloaded from 130.132.123.28 on Sat, 3 May 2014 12:18:54 PMAll use subject to JSTOR Terms and Conditions
E. M. Crowther and F. Crowther
2-If multiple variates are to be used, allowance must be made for the positive bias of R2.
3-Relationships of a complicated character should be sought only when long series of crop data are available."
It would not, for example, be satisfactory to work on rainfalls before and after sowing, or to make an arbitrary selection of rainstorms with more than a prescribed rainfall. Again, it would be unwise to pick out for one group of yield data those weather variates which gave apparently signifi- cant effects and to use other weather variates for another group of yield data. The problem is not to discover which set of weather variates pro- vides the most efficient fitting of specified yield data, but the more general one of estimating the average effect of rainfall at different periods of the year.
It was not possible to use Fisher's elegant method of correlating residuals after eliminating slow changes by fitting high-order polynomials, but the precaution was taken of eliminating the effects of progressive (linear) changes with time from all multiple regressions of yield on weather variates. The multiple regression equations always included a term for the number of the year (t), which eliminated these linear changes and also pro- vided an estimate for the rate of change of yield with time for constant annual values of the rainfall variates considered.
Comparatively high standards of significance are required. Through- out the Tables, coefficients corresponding to P values of from 0 -05 to 0 -02 are shown by one asterisk, those from 0 02 to 0 01 by two, and those less than 0 01 by three.
THE RAINFALL DATA
Since 1906 rain-gauge readings have been taken at the nine stations given in Table I and shown in fig. 1. Through the courtesy of the Director of the Egyptian Irrigation Department, Khartoum, we have had access to the Official Records to the end of 1933. The mean monthly rainfall for the nine stations over 28 years was :-
April May June July August September October mm.. 2 9 26 92 118 47 8
Since the annual rainfall is distributed fairly symmetrically about a date early in August, we have used as the simplest adequate expressions of the season's rainfall the total amounts in the following periods: e. early, before July 1; m. middle, July 1 to August 31; i. late, after August 31.
348
This content downloaded from 130.132.123.28 on Sat, 3 May 2014 12:18:54 PMAll use subject to JSTOR Terms and Conditions

Rainfall and Cotton Yields in the Sudan Gezira
The total rainfall (p) in the year previous to sowing the cotton was also examined. All dates refer to the year in which the rain falls and the cotton is sown; the crop is picked early in the following year.
The rainfalls increase fairly regularly from N.W. to S.E. across the Gezira in the direction of the Abyssinian Mountains. The data* in the first part of Table I show how closely the 28-year means for early and total rainfall agree with values calculated from the regression of rainfall on latitude and longitude. Calculated lines for equal total rainfall are shown in fig. 1. It will be noticed from the regression coefficients that the relative rates of increase towards the south-east are greater for early and late rains than for mid-season rains.
Table I, a, also gives the standard deviation per annum of early and total rainfall for each of the nine stations. In spite of the range of mean rainfalls, the standard deviations for total rainfall are of similar order, about 100 mm, throughout the whole of the Gezira.
The general means and standard deviations per annum for rainfall in the three periods and the annual total are summarized separately for the whole of the nine stations, Table I, c, and for the first five central stations in or near the present irrigated area, Table I, b. The annual values for the means of these five central stations are given in Table II. The standard deviations of the means of five or nine stations, Table I, b and c, show the magnitude of seasonal variations for the area as a whole. The standard deviations per station measure the average variation at specified points, and are important in considering the scale of the effects of rainfall on yield, which are subsequently expressed as regression coefficients of cotton yield on unit amounts of extra rainfall. Relative to their mean values, early and late rainfalls are much more variable than mid-season or total rain- falls. In round values the standard deviations in the irrigated area may be taken as 30, 90, 50, and 100 mm per annum for early, middle, late, and total rainfall respectively. Finally, in an analysis of variance of rainfall for five or nine centres over 28 years, the mean effects of stations and of years may be eliminated and the interaction between years and stations used to give a standard deviation per station, which measures the vari- ability of rainfall between the stations in a single year. Although the effects of year and position are highly significant, rainfall variations within the Gezira are still sufficiently large to make it desirable to use local rain- fall data, wherever possible, in analysing yield data for individual areas.
* In analysing the rainfall records, we ignored changes in the position of two gauges. The Hasiheissa gauge was moved 11 miles from Messellemiya in February, 1913. Records were taken at Old Sennar from 1906 to 1928 and at Makwar (Sennar) since 1915; for the 14 years in common we used the means of the two gauges.
2B 2
349
This content downloaded from 130.132.123.28 on Sat, 3 May 2014 12:18:54 PMAll use subject to JSTOR Terms and Conditions

E. M. Crowther and F. Crowther
TABLE I--MEAN GEZIRA RAINFALLS, 1906-33 INCLUSIVE, IN MM PER
ANNUM
(a) Individual Stations. Actual means and means calculated from position
Early rainfall
Lat N.
o !
1-Wad Medani .. 14 24 2-Manaqil ...... 14 13 3-Rufaa ........ 14 48 4-Hasiheisa ...... 14 38 5-Kamlin ...... 15 4 6-Sennar ...... 13 33 7-Dueim ........ 13 59 8-Geteina ...... 14 52 9-Khartoum .... 15 40
Long E.
0 !
33 31 32 58 33 19 33 18 33 11 33 38 32 19 32 23 32 34
ra rai
Calcu- Actual lated Actua mean mean mean
47 51 386 44 43 362 34 38 323 34 41 292 28 29 241 82 72 456 30 34 302 16 16 196 11 2 160
?otal infall
Calcu- lI lated
mean
365 336 304 321 264 466 301 214 145
(b) Five Central Stations (1-5)
Early Middle Late
General Mean ...................... .......... 38 S.D.* of mean of 5 stations .................... 23 S.D. per station ...................... ........ 30 S.D. per station (eliminating seasonal mean)...... 20
(c) All Stations
General mean ................................ 36 S.D. of mean of 9 stations ...................... 18 S.D. per station .................... ........ 28 S.D. per station (eliminating seasonal mean) ...... 22
222 67 89 64
210 57 85 67
61 321 37 82 47 107 32 76
55 27 40 32
302 71
101 76
(d) Regression on Position (all Stations) mm per degree of latitude ........... ......... -22 mm per degree of longitude ...................... 22 As percentage of mean per degree of latitude ...... -60 As percentage of mean per degree of longitude...... 60
* Standard deviation.
-58 50
-28 24
-26 16
-47 30
-106 90
-37 30
350
Standard deviation
Early Total
32 105 32 116 28 109 27 118 28 81 43 87 22 99 17 97 12 94
Total
This content downloaded from 130.132.123.28 on Sat, 3 May 2014 12:18:54 PMAll use subject to JSTOR Terms and Conditions
Rainfall and Cotton Yields in the Sudan Gezira
Records from 1911 were supplied by the Physical Department, Cairo, for the original cotton area at Taiyiba; some corrections were made for the years 1915, 1916, 1917, and 1931 from the records and confidential monthly reports of Sudan Plantations Syndicate, Ltd. Mr. 0. W. Snow provided us with a carefully revised statement of the rainfall at the Gezira Research Farm. No records were taken at Barakat during the war years, and we have, therefore, used Wad Medani rainfalls from 1914 to 1918, and subsequently the mean of the rain gauges at the Barakat Headquarters and the Gezira Research Farm, which are at opposite ends of the Barakat area.
THE YIELD DATA
Table II gives the total area cropped and the mean yield of seed cotton in kantars per feddan in each year.* In the early years the irrigated land was concentrated round two pump stations at Taiyiba and Barakat. In 1921 a large extension occurred further south, and we have examined separately the mean yields of the whole of the cropped area since 1911 and, again, since 1921, so as to include a more representative area. The main expansions took place between 1925 and 1930, and most of the land now irrigated has carried only two or three cotton crops. The period since the scheme reached 100,000 feddans of cotton is too short for satisfactory analysis, and most of our discussion must therefore be limited to the older areas.
In order to minimize irregularities from changing rotations and expand- ing areas at these older farms, we have used the records for individual tenancies to build up mean yields for definite areas, and, in addition, have selected periods for which the cultural methods were most nearly uniform. Thus, we restricted the Old Taiyiba area to the 6000 feddans of land brought into cultivation by 1917, and ignored all subsequent additions to this farm. For this area we made two separate analyses, starting in 1911 and 1917 respectively, since by the latter date the crop rotation had been stabilized. Finally, we selected at Taiyiba a compact block of land, 1440 feddans in area, which was first brought into cultivation in 1917 and cropped in three-course rotation until 1931. This gave five crops on each of the thirds of the individual tenancies, the cotton being grown each year in four long regularly-spaced bands, each of 120 feddans. This set of
* Areas are given in feddans (1 f. 1 038 acres = 0-420 hectare). Cotton yields are expressed as kantars (315 rotls) of seed cotton per feddan (1 k/f -- 300 6 lbs per acre= 337 kg per hectare) and, using the conventional factor for ginning-outturn, may be equated to kantars (100 rotls) of lint cotton per feddan (1 k/f =95 4 lbs per acre = 107 kg per hectare).
351
This content downloaded from 130.132.123.28 on Sat, 3 May 2014 12:18:54 PMAll use subject to JSTOR Terms and Conditions

TABLE II COTTON YIELDS IN KANTARS PER FEDDAN AND RAINFALL IN MM IN THE EASTERN GEZIRA
Year Gezira Total Old of area in Gezira Old Taiyiba Old
sowing thousand mean Taiyiba 480 fed. Barakat feddans yield
1911. 0-25* 5-32 5-32 1912 0-6 5-62 5-62 1913 0-7 3-80 3-80 1914 30Ot 5-29 5-10 1915 3-4 3-32 3-10 1916 4-3 3-31 347 1917 3-9 3-29 4-10 1918 4-0 3-33 4-13 1919 3-8 5-26 5-60 1920 3-7 3-27 3-20 1921 98:1 3-92 3-52 1922 10-4 3-66 443 1923 22-5? 2-86 2-55 1924 21-6 221 2-34 1925 80-011 4-79 4-32 1926 100-1 4-77 4-07 1927 105-6 3-29 2-54 1928 131-4 355 3-74 1929 174-1 2-33 1-42 1930 196-0 1-34 1-27 1931 194-0 4-15 3-76 1932 195-0 1-92 1933 165 0 2-30
5 22 5-38 6-66 3-59 3 96 5 20 2-56 2-52 5 09 4-20 2-62 3-57 1-85 1 23 4-13
5-39 3 48 3 20 2-66 3 50 4 98 3-51 3 91 4-08 2-99 2-29 3-86 3-37 2-89 3 96 1 83 1-51 3 94
G.R.F. G.R.F. total miscel- /
Mean rainfall in dm at 5 Central stations
laneous Early Middle Late
3 25 2 59 3 05 3-35 3 15 1.81 2-45 3-86 2-99 3-13 2-03 1 83 3-12
3-17 2 34 2-60 3 54 2-86 1 48 2-30 4-08 2-74 2-94 2-21 1 27 3 46
0-65 0-24 0-05 0-42 0-48 0-67 0-92 0-59 0-13 0-28 0-17 0-23 0-50 0-23 0-38 0-16 0-17 0-55 0-67 0-43 0-10 0-53 0-77
1-42 1-67 1-67 2-61 2-26 2-14 1 69 1 96 1 76 3-13 2-42 3-43 3-45 2-00 1 52 1 14 2-29 1 53 3 70 2-88 1 95 2-86 2-19
0-34 0-41 0-44 0-39 0-44 0-68 0-73 0-04 0-48 0-68 0-44 0 38 0-45 0-77 0-29 0-53 1-21 0-21 0-63 0-30 0-52 0-63 0-80
* Taiyiba started. t Barakat, 2000 feddans of cotton, started. t Hosh, 6500 feddans of cotton, started. ? Wad el Nau, 10,000 feddans of cotton, started. 11 Land watered by gravitation water from Sennar Dam.
Total
2-42 2-32 2-17 3-42 3-17 3.49 3.35 2-58 e
2-36 4-09 3 02 4-04 4-40 3 00 2-20 1.84 C 3 67 q 2-30 :
5-00 C 3.61 2 53 4-02 3 76
This content downloaded from 130.132.123.28 on Sat, 3 May 2014 12:18:54 PMAll use subject to JSTOR Terms and Conditions

Rainfall and Cotton Yields in the Sudan Gezira
data for 480 feddans annually provides the only long run of uniform cropping of a constant area in the Gezira, and in it the effects of soil irregularity and changing agricultural practice should be reduced to the minimum.
The data for the second pump station at Barakat were limited to the original area of about 6000 feddans. The distribution of cotton within this area was almost uniform, except for two periods (1914-15 and 1919- 20) when the cotton was confined to relatively compact blocks. To obtain more uniform material, we have used, in addition to the full data from 1914 to 1931, a restricted period since 1921, during which the cropping was
substantially uniform. At the Gezira Research Farm the exigencies of experimental work on
different rotations prevent a simple division of the farm into thirds, cropped in regular rotation, and here, too, expansion brought in new land in the middle of the period considered. There is no single record area with a uniform record of uninterrupted three-course cropping over the whole period. As the best substitutes, we have taken the mean yield for the whole farm, the mean yield for the so-called " water-duty " plots (the continuity of which was broken by bringing in new land in 1925) and the mean yield for a number of miscellaneous plots irregularly distributed throughout the farm for experiments on varieties, sowing dates, and cultural treatments (omitting manuring). In addition, data were examined for two blocks of land which were cropped in alternate years with cotton and either dura, lubia, or fallow. Finally, there were data for one plot of continuous cotton. The Gezira Research Farm data are all for the period 1919 to 1931 inclusive, the first season (1918) being omitted in order that all rotation cotton might have received its appropriate preceding crop.
Table III gives the mean values of rainfall for each of the centres and
periods considered, together with the standard deviations for rainfalls in a
single season. For convenience of tabulation the rainfalls in Tables II and III and the regression coefficients on rainfall in Tables IV and V are
expressed in units of decimetres.
THE EFFECTS OF RAINFALL ON YIELD
Some indication of the relative importance of rainfall at the four main
periods considered in the present analysis is provided by calculating the
regression of yield on each of the four rainfall variates: early rain, middle rain, late rain, previous year's rain. These values are given in Table IV for each of the areas selected, together with the mean yield, the standard deviation of one season's yield and the mean annual change in yield. The
353
This content downloaded from 130.132.123.28 on Sat, 3 May 2014 12:18:54 PMAll use subject to JSTOR Terms and Conditions

TABLE III-MEAN VALUES OF RAINFALL IN DM FOR SELECTED AREAS
Standard deviations of rainfalls for a
Centre Period Early Middle Late Previous single season ,
year -- ., e m I p e m I p
1-Total Gezira (5 gauges) ........ 1911-33 0.41 2.25 0.51 3 15 0.24 0-71 0-24 0-83
2-Total Gezira (5 gauges) ........ 1921-33 0 38 2-41 055 3 36 0 22 0-81 0.27 096
3-Old Taivibal .................. 1911-31 0-56 2 67 0 60 3-82 0.48 0.98 0-44 1-20
4-Old Taiyiba .................. 1917-31 0-61 2 88 0 67 4.14 0-47 0.97 0.48 1-15
5-Old Barakat2 ...... . . .1. . . 914-31 0 57 2 75 0 71 4 05 033 076 0-36 1.01
6-Old Barakat .................. 1921-31 0-49 2-78 0-74 4-18 0-36 0-86 0-32 1-20
7-Gezira Research Farm3 ......... 1919-31 0-40 2.87 0-75 3.98 0.28 1-19 0.26 1.36
NOTES TO TABLES III, IV, V
I-The Old Tailviba area O
This commenced in 1911 with 250 feddans of cotton on Canals I and II and expanded fairly regularly by the incorporation of new land ?
to about 1700 feddans of cotton in 1917 (" Numbers" 1-39 on Canals I and II and "Numbers" 1-7 on Canals III and IV). The .
rotations were irregular with considerable areas of wheat, dura, and green crops from 1911 to 1917. From 1917 the rotation was
cotton-lubia-fallow until 1925, when half of the lubia was replaced by dura. The area of 1440 feddans, which was cultivated P
uniformly from 1917 to 1931, consisted of " Numbers " 28-39 on Canals I and II. C
2-Old Barakat The cotton was grown in a few compact blocks in 1914, 1915, 1919, and 1920, but in other years from 1914 to 1931 cotton was
distributed fairly evenly over the area of 6000 feddans. The rotation was cotton-fallow-fallow from 1914 to 1925. Lubia was
introduced in 1926, and from 1927 to 1931 the rotation was cotton-half dura, half lubia-fallow.
3-Gezira Research Farm A considerable fraction of the three-course cotton at the Gezira Research Farm up to 1931 was in the series of " water-duty" plots :
Plots 16-22 - 1921 1924 1927 1930
31-37 1919 1922 1926 1929
24-30 1920 1923 62-66 - - 1925 1928 1931
The sequence of cropping was broken in 1925, when the yield on the new plots was quite abnormally low. The previous cotton crop
on this land in 1922 yielded more than the average of the Barakat farm of which it then formed part. In 1925, it gave less than one-half
of the mean Barakat yield, and even less than the exhausted continuous cotton plots at the Gezira Research Farm. In 1931 the "water-
duty " plots were discontinued and, for this season, we took the yields from other experiments on the same plots. The yield of continuous
cotton for 1931 was estimated, since the plants were removed deliberately as a precaution against the spread of Blackarm. The
approximate areas of cotton per annum were: total farm, 80 to 140 feddans;" water-duty " plots, 25 to 35 feddans; miscellaneous plots,
10 to 50 feddans; cotton in two-course rotation, 2.5 feddans; and continuous cotton, 5 feddans.
This content downloaded from 130.132.123.28 on Sat, 3 May 2014 12:18:54 PMAll use subject to JSTOR Terms and Conditions

TABLE IV-MEAN YIELDS IN KANTARS PER FEDDAN AND REGRESSIONS ON RAINFALL FOR SELECTED AREAS
Area
1-Total Gezira .................. 2-Total Gezira..................
3-Old Taiyibal .................. 4-Old Taiyiba .................. 4a-0ld Taiyiba ................
(480 feddans annually)
5-Old Barakat2 ............... 6-Old Barakat ..................
7-Gezira Research Farm3 ........
Three-course rotation. 7a-Total farm ................. 7b-Water duty plots ............ 7c--Miscellaneous plots ..........
Two-course rotation. (Old experiments.)
7d-Cotton-lubia ................ 7e-Cotton-fallow ............... 7f-Cotton-dura ................
Continuous cotton. 7g..............................
Standard Mean deviation annual
Period Mean of change yield season's in
yield yield 1911-33 3-60 1-17 -0-102*** 1921-33 3-16 1.10 -0-116
1911-31 1917-31 1917-31
3-69 1.20 -0.121*** 3 40 1.18 -0 144*** 3 85 1-51 -0-205**
1914-31 3-41 0-98 -0 081* 1921-31 3-15 0-92 -0-102
Regression coefficients of yield in kantars per feddan on rainfall in dm
Early -1-66 -2-79*
-1 26* -1-10 -1 06
Middle -0.89*** -0-77*
-0-57* -0-49 -0-63
-1 68*** -0-26 -2-00*** -0-39
1919-31
2-82 0-63 -0-042 3-30 1-00 --020 2-69 0-79 --0025
2-85 0-53 --0008 2-31 0-67 -0-066 2-21 0-60 -0-090*
--1 82*** -3 09*** -2-21***
-0-75 -1-55** -1 24**
-0-70 -0-16 -0-01
-0-05 +0-02 +0-10
Late -1 44 -0-94
-1 08 -0-62 -0-92
Previous year
-0-64* -0-43
-0-61*** -0-60* -0-82**
-1-03 --026 -0-69 -0-18
I-
-0-51 --018 +0-31 -0-21 t -0-27 -0-31
-0-81 -0-06 +0-34
-0-00 -0-22 -0-18
1-60 0-37 -0-051 -0-77** --010 -0-40 --0-13
This content downloaded from 130.132.123.28 on Sat, 3 May 2014 12:18:54 PMAll use subject to JSTOR Terms and Conditions

TABLE V-PARTIAL REGRESSION COEFFICIENTS OF YIELD IN KANTARS PER FEDDAN ON FOUR RAINFALL VARIATES
IN DM AND TIME
Period Early rain
Middle Late rain rain
Previous year's rain
Year Standard errors of partial regression coefficients of
yield on
1-Total Gezira .... 2-Total Gezira ....
3-Old Taiyibal .... 4-Old Taiyiba .... 4a-0ld Taiyiba ....
(480 feddans annually)
5-Old Barakat2 .... 6-Old Barakat ....
e 1911-33 -0-97 1921-33 -1-06
1911-31 1917-31 1917-31
-1.16*** -1 32** -1 -29**
m -0-62** -0-66*
-0-42* -0-37 -0-43
1914-31 -2 20*** +0-07 1921-31 --217* +0-06
1 -1-22 -1-51
-0-87* -0-89 -1 09
P -0-53* -0-57*
-0-35* -0-49* -0-64**
t -0-056* -0-088***
-0-010 -0-032 -0-078
e m I p 0-67 023 0-71 021 1-09 0-25 0-76 0-20
0-36 0-42 0-51
t 0-026 0-185 tri
0-18 0-41 0-17 0-037 0-20 044 0-19 0-052 0-24 0-53 0-23 0-062
g
O
CD
3 r-h -1-10** +0-01 -0 093*** 0 45 0-19 0-41 0-15 0-026
-0-81 +0-09 --0038 0-73 0-34 1-02 0-21 0-076
7-Gezira Research Farm3 ........ 1919-31
Three-course cotton. 7a-Total Farm .... 7b-Water duty plots 7c-Miscellaneous
plots ........
Two-course cotton. (Old experiments.)
7d-Cotton-lubia.... 7e-Cotton-fallow .. 7f-Cotton-dura ....
Continuous Cotton.
-2-07*** +0-16 -1-32*** -0-08 -3 62*** +0-08 -0-68 +0-07
+0-006 0-34 +0-040 0-72
0-07 0-33 0-07 0-021 0-15 0-70 0-14 0-045
-2-43*** +0-17 -1.50*** -0-19 +0 037 0-48 0-10 0-47 0-10 0-030
-1 -22 -1-50 -1 07
+0-07 +0-10 +0-13
-1-18 -0-72
0-06
+0-03 -0-11 -0-05
+0-020 +0-029 -0-065
0-65 0-13 0-63 0-13 0-040 0-72 0-15 070 0-14 0045 0-61 0-13 0-60 0-12 0-038
-0-08 --065* --012* -0-037* 0-26 0-05 0-25 0-05 0-016
Area
Ci ul
0
Co
CD
7g ............... -0-47
This content downloaded from 130.132.123.28 on Sat, 3 May 2014 12:18:54 PMAll use subject to JSTOR Terms and Conditions
Rainfall and Cotton Yields in the Sudan Gezira
latter values must be multiplied by three to give the mean change from one cotton crop to the next one on the same land.
It will be seen from Table IV that yields of Barakat and the Gezira Research Farm gave highly significant negative regressions on early rain- fall, and that the Gezira as a whole and Taiyiba showed negative regres- sions on the middle rains, and also on the previous year's rainfall. Since middle rains form the bulk of the year's rainfall, the whole Gezira and Taiyiba are adversely affected by the total rain in both of the seasons preceding the main growth of the crop. These areas also show significant deterioration with time.
The simple regression coefficients are not, however, sufficiently precise measures of the relationship between yield and rainfall, for there may be hidden correlations between the weather at different periods, or progressive changes in rainfall or yield with time. In addition, it is desirable to remove the variance ascribed to one factor before proceeding to test the significance of another.
The best simple expression of the independent effects of the five seasonal variates employed is provided by the partial regression coefficients, that is, by the values for the coefficients ke, kn, etc., in the equation
(y - j) - ke (e - e) + k (m - m) + k, (I - 1) + k, (p -- p) + kt (t - t)
The methods of fitting such multiple regression equations and of testing the significance of the individual coefficients were given by Fisher ;(1926).
Table V gives the partial regression coefficients (with their standard .errors) for yield on the five seasonal variates for the centres already listed in Table IV. These partial regression coefficients form the basis of the discussion in the following sections.
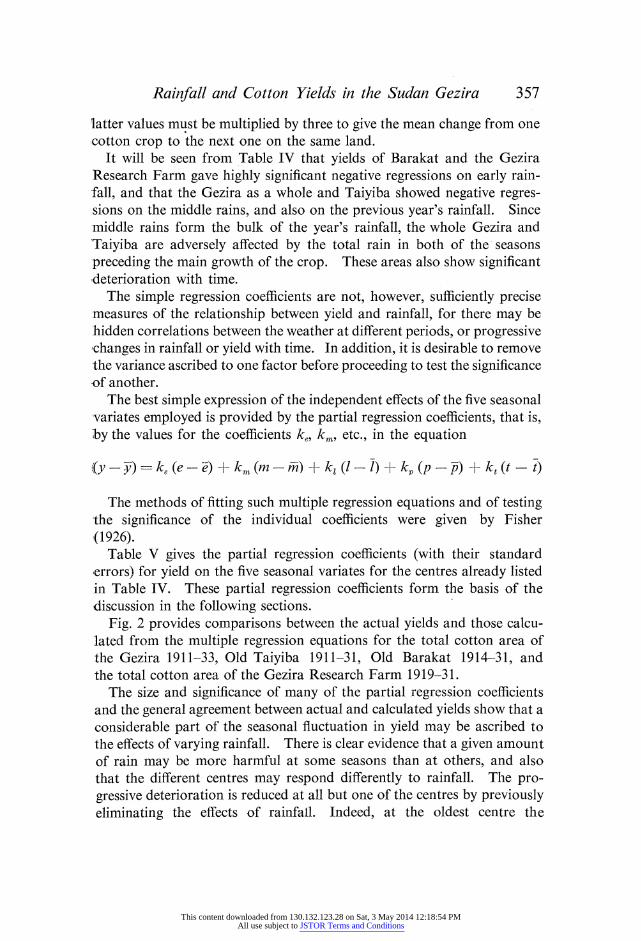
Fig. 2 provides comparisons between the actual yields and those calcu- lated from the multiple regression equations for the total cotton area of the Gezira 1911-33, Old Taiyiba 1911-31, Old Barakat 1914-31, and the total cotton area of the Gezira Research Farm 1919--31.
The size and significance of many of the partial regression coefficients and the general agreement between actual and calculated yields show that a considerable part of the seasonal fluctuation in yield may be ascribed to the effects of varying rainfall. There is clear evidence that a given amount of rain may be more harmful at some seasons than at others, and also that the different centres may respond differently to rainfall. The pro- gressive deterioration is reduced at all but one of the centres by previously eliminating the effects of rainfall. Indeed, at the oldest centre the
357
This content downloaded from 130.132.123.28 on Sat, 3 May 2014 12:18:54 PMAll use subject to JSTOR Terms and Conditions

E. M. Crowther and F. Crowther
deterioration ceases to be significant when the effects of rainfall are removed.
All centres show a markedly depressing effect of early rain, and it is interesting to notice that the correlation between yields and early rainfall appears to have been even closer since 1925 than in the earlier years from
0
4
2 Gezira Research Farm (Total Farm)
0 1911 1915 1920 1925 1930
FIG. 2-Comparison of actual yields-o -o-in k/f with yields calculated from multiple regression equations on rainfalls and time- a - -
which it was first detected. Most centres show depression from late rains, but they differ in their responses to middle and previous year's rain.
In comparing different centres and periods, it should be noted that as they include certain common years, they are not independent. Further, the standard errors of the coefficients are relatively high for the shorter periods.
358
This content downloaded from 130.132.123.28 on Sat, 3 May 2014 12:18:54 PMAll use subject to JSTOR Terms and Conditions
Rainfall and Cotton Yields in the Sudan Gezira
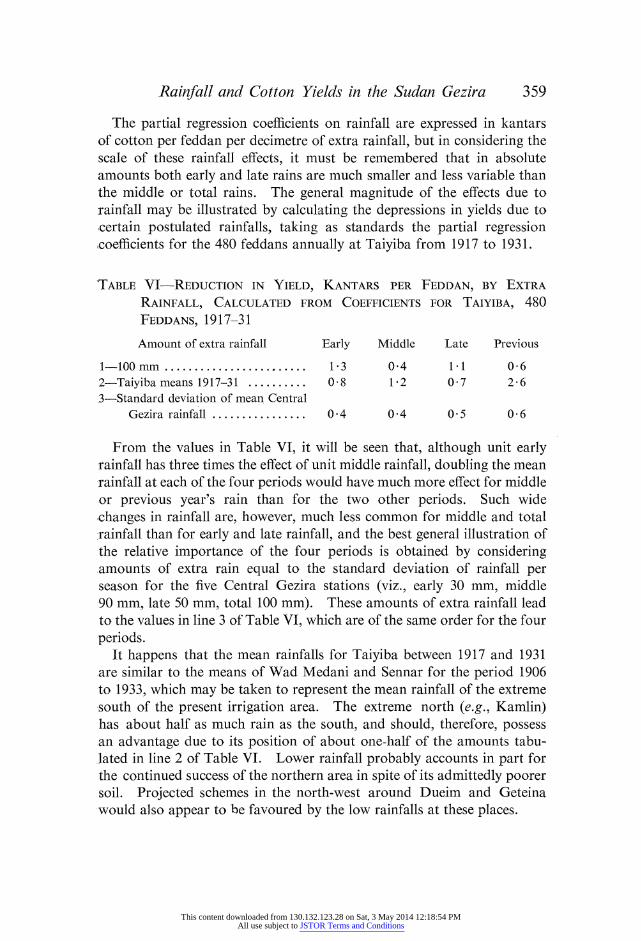
The partial regression coefficients on rainfall are expressed in kantars of cotton per feddan per decimetre of extra rainfall, but in considering the scale of these rainfall effects, it must be remembered that in absolute amounts both early and late rains are much smaller and less variable than the middle or total rains. The general magnitude of the effects due to rainfall may be illustrated by calculating the depressions in yields due to icertain postulated rainfalls, taking as standards the partial regression (coefficients for the 480 feddans annually at Taiyiba from 1917 to 1931.
TABLE VI-REDUCTION IN YIELD, KANTARS PER FEDDAN, BY EXTRA
RAINFALL, CALCULATED FROM COEFFICIENTS FOR TAIYIBA, 480
FEDDANS, 1917-31
Amount of extra rainfall Early Middle Late Previous
1- 100mm ........................ 1.3 0.4 1.1 0.6
2-Taiyiba means 1917-31 .......... 0.8 1.2 0 7 2.6 3-Standard deviation of mean Central
Gezira rainfall ................ 0-4 0.4 0.5 0.6
From the values in Table VI, it will be seen that, although unit early rainfall has three times the effect of unit middle rainfall, doubling the mean rainfall at each of the four periods would have much more effect for middle or previous year's rain than for the two other periods. Such wide changes in rainfall are, however, much less common for middle and total rainfall than for early and late rainfall, and the best general illustration of the relative importance of the four periods is obtained by considering amounts of extra rain equal to the standard deviation of rainfall per season for the five Central Gezira stations (viz., early 30 mm, middle 90 mm, late 50 mm, total 100 mm). These amounts of extra rainfall lead to the values in line 3 of Table VI, which are of the same order for the four periods.
It happens that the mean rainfalls for Taiyiba between 1917 and 1931 are similar to the means of Wad Medani and Sennar for the period 1906 to 1933, which may be taken to represent the mean rainfall of the extreme south of the present irrigation area. The extreme north (e.g., Kamlin) has about half as much rain as the south, and should, therefore, possess an advantage due to its position of about one-half of the amounts tabu- lated in line 2 of Table VI. Lower rainfall probably accounts in part for the continued success of the northern area in spite of its admittedly poorer soil. Projected schemes in the north-west around Dueim and Geteina would also appear to be favoured by the low rainfalls at these places.
359
This content downloaded from 130.132.123.28 on Sat, 3 May 2014 12:18:54 PMAll use subject to JSTOR Terms and Conditions

E. M. Crowther and F. Crowther
The above illustrations were based on results for a single centre and period, but Table V shows that the partial regression coefficients differ in magnitude and significance between centres. The effects of rainfall at the separate periods are therefore considered in more detail in the following sections.
EARLY RAINS
In all of the data examined for three-course cotton at single centres, the early rains reduce the yields significantly, at the rate of from one to over two kantars of seed cotton per feddan per decimetre of rain. Although some of the low yields might be ascribed in certain years to particularly severe Blackarm or Leaf Curl damage, and in others to excessive flooding or other causes, it should be emphasized that the early rainfall is the only factor which has been successfully related to the yields at the three older centres over a long period of years. The early rainfall effect fails to reach significance for the Gezira as a whole, probably on account of the lower variance for the means of five widely separated rain gauges, and the irregularities in soil and rainfall over a large and increasing area.
The effects of the first rains on the physical, chemical, and biological properties of the soil were not investigated in detail until recently, for it was generally assumed that May and June were unimportant months for a crop which was to be sown in August after much heavier rain and irrigation. Partly as the results of the present analysis, they are now receiving active study, and we do not propose, therefore, to discuss the possible mechanism of the early rain effect in any detail. It will be suffi- cient to refer to some of the hypotheses advanced. The essential feature of the first appreciable rainfall is that it interrupts the desiccation of the soil which proceeds through the fallow period. Early rainfall shortens the fallow, and any explanation of the effects of early rains requires an understanding of the effects of fallow on the Gezira soil.
In 1925, E. M. Crowther (1926) suggested that the early rains initiated the cycle of biochemical oxidation in the soil, and postulated that micro- organic activity long in advance of the main rains and first irrigation led to an increased loss of available nitrogen from the wet soil during July and August. It has, however, recently been shown (F. Crowther, 1933- 34) that flooding soil rich in nitrate does not necessarily cause a per-- manent loss of available nitrogen. On removing the surplus water, the nitrate content soon rises rapidly, either through nitrification or through capillary rise in the wet soil. Flooding before the cotton was planted had no adverse effect on the growth and final yield of cotton.
360
This content downloaded from 130.132.123.28 on Sat, 3 May 2014 12:18:54 PMAll use subject to JSTOR Terms and Conditions

Rainfall and Cotton Yields in the Sudan Gezira
F. Crowther (1933-34) suggested that early rains affected the crop through causing some adverse condition in the subsoil. It was repeatedly observed that, in years of early rainfall, the crop grew well until November and then fell back rapidly, as would be expected if root growth in the second and third feet of soil was restricted by some shortage of water, oxygen, or nitrate. The Gezira soil cracks extensively during the fallow seasons, and F. Crowther suggested that the early rains run down and close up these cracks from the bottom upwards, thus making the accessible soil profile still shallower. In a preliminary experiment in 1933-34 on screening small plots from early rains, he obtained significantly higher mean yields of cotton per plant than on unprotected soil. Snow (1933) suggested that the lower temperatures and higher humidities in May and June in years of high early rainfall reduce evaporation and thus prevent further desiccation and cracking. It is well known that the yields fall off rapidly as the sowing date is postponed after an optimum about the middle of August, and Greene (1933-34) suggested that the optimal sowing date may be related to the time of the first rain which initiates the main seasonal cycles of physical and biological changes in the soil. Effects of early rains in enabling weeds and insects to survive the later and more intense stages of the fallow and in favouring " wilt " and other soil fungi have also been considered. But none of the above hypotheses has yet been substantiated.
MID-SEASON RAINS
About three-quarters of the total annual rainfall occurs in July and August, and during this period the land is irrigated and the seed sown. Heavy rains delay sowing and may necessitate resowing. They wash out quantities of seed and delay work on the land; young cotton plants may be asphyxiated by flooding, and weed growth is encouraged at a critical period. Late re-sowings give low final yields, for it has been repeatedly demonstrated that September sowings give much lower yields than August sowings.
The analysis in Table V shows that high mid-season rainfall reduces the yield in the Gezira as a whole, and at Taiyiba, but has no appreciable effect at Barakat or the Research Farm. The differences in standards of cultivation and supervision would lead one to expect less disturbance from flooding at the Research Farm than over the large commercial area, which, in addition, contains many low-lying parts from which it is difficult to draw off surplus water. The Taiyiba and Barakat farms are similarly managed, and the difference between them probably depends on the level
361
This content downloaded from 130.132.123.28 on Sat, 3 May 2014 12:18:54 PMAll use subject to JSTOR Terms and Conditions

E. M. Crowther and F. Crowther
of the belt of land which separates them from the Blue Nile. At the Barakat farm where mid-season rains are without effect, this land is relatively low and flood water is more easily drained away than at Taiyiba, where the intervening land is higher and the depressing effect of mid-season rains is significant.
LATE RAINS
Rainfall in September and October is negatively correlated with yields for the full term of years at Taiyiba, Barakat, and the average of the Gezira Research Farm. The regression coefficients are of similar magni- tude, though not significant, for the whole Gezira, for shorter periods at Taiyiba and Barakat, and for the water duty, cotton-fallow, and cotton- lubia plots at the Gezira Research Farm.
It is known from Massey's (1930, 1931) work on Blackarm that rain splashes spread the bacteria responsible for the secondary infection, and that the disease can develop rapidly in the plant tissues only under the humid conditions associated with actual rainfall. Late rains greatly increase the damage to affected plants. Late rains may also cause temporary flooding when they coincide with irrigation. Watering pro- ceeds continuously throughout the Gezira from October onwards at about fortnightly intervals at any one point. The small amounts of rain in October may increase the risk of flooding by puddling the soil and by reducing evaporation through the increased humidity and cloudiness associated with rain. Flooding and over-watering during the early stages of growth cause the leaves to turn yellow, and F. Crowther (1933-34) showed by direct experiments in 1932 and 1933 that such flooding greatly reduced the final yield, probably through root asphyxiation.
The fact that at the Gezira Research Farm, the total farm, the miscel- laneous plots, and continuous cotton show large late-rain effects suggests that the increased development of Blackarm due to these late rains may be more important than the physiological effects due to waterlogging. The miscellaneous plots always include variety and sowing-date experi- ments, both of which are notoriously liable to the early appearance of Blackarm which invariably causes severe damage on these plots. The variety experiments often include infected Gezira seed, and early sowing renders cotton particularly susceptible to damage. Since 1925, the mis- cellaneous plots have taken the form of replicated and randomly- distributed small plots. These favour the spread of Blackarm, which is essentially an " edge-effect." On the other hand, in the " water duty " and the two-course rotation plots, which have insignificant late-rain effects, the cotton occurs as single blocks of similarly treated plants. Great
362
This content downloaded from 130.132.123.28 on Sat, 3 May 2014 12:18:54 PMAll use subject to JSTOR Terms and Conditions

Rainfall and Cotton Yields in the Sudan Gezira
emphasis should not, however, be placed on these differences in response to late rainfall, for the differences between the regression coefficients are subject to relatively large errors. It is probable, too, that the bad effects of late showers will depend more on the intensity of the storms than on the total amount of rain in two or three months.
PREVIOUS YEAR'S RAINFALL
The rainfall in the previous season (10 to 16 months before the cotton is sown) is negatively correlated with yields in the Gezira as a whole, at Taiyiba and in the continuous cotton at the Gezira Research Farm, but not at Baraket or the rest of the Research Farm.
This grouping of centres suggests that the previous year's rains influence the cotton crop chiefly by increasing weeds, and that the effect is more serious on land which has been frequently cropped and irrigated. At first, the Taiyiba farm was cropped every year, and throughout the rest of the period considered each cotton crop was followed by irrigated dura or lubia. At Barakat, successive cotton crops were generally separated by complete fallows for two years. Frequent cropping and irrigation would favour weed growth, and they might also cause some deterioration in soil structure. Heavy rainfall in the year preceding a cotton crop would leave more weeds and weed-seeds, and, in addition, more dried straw-like residues which would immobilize available soil nitrogen when the young cotton most needed it. In 1931 and 1932, food crops were omitted from the whole of the commercial cotton area, and from 1933 the rotation was changed to four-course to allow a two years' fallow before each cotton crop and in the hope of providing greater control of perennial weeds.
DETERIORATION OF SOIL AND WEATHER
The low yields of the last few seasons and the general downward trend of the mean Gezira yield, since the dam began to be used, have some- times been taken by others (Balls, 1935, Vageler and Alten, 1932) as evidence of serious soil deterioration. It is generally believed that virgin land yields more than previously irrigated land, but it is a matter of the utmost importance to know whether there is evidence of further pro- gressive deterioration. In the past, many irrigation schemes have failed through the deleterious effect on the chemical and physical properties of the soil of irrigation without drainage. Again, the cultivation of a single new crop in a large and isolated area might allow a rapid spread of
VOL. CXVIII.-B.
363
2 c
This content downloaded from 130.132.123.28 on Sat, 3 May 2014 12:18:54 PMAll use subject to JSTOR Terms and Conditions

E. M. Crowther and F. Crowther
certain weeds and pests, especially when seed is imported. Current research and observations on these possibilities need to be supplemented by an analysis of slow changes in the recorded yields of definite areas, after eliminating the estimated effects of other known variables. The simple regression coefficients of yield on time, ignoring rainfall effects, Table IV, are significantly negative for the whole Gezira area, for Taiyiba, and probably for Barakat. They amount to about one-third of a kantar per feddan, and about 10%, for each cropping rotation. It must, however, be remembered that in the early years the Taiyiba farm formed either the whole or a large fraction of the total cotton area, and that in spite of the significant decline, its mean yield is still high. Barakat and the Research Farm gave lower mean yields and deteriorations, as would be expected from the circumstance that they are both near the large town of Wad Medani and were overcropped with dura before the irrigation scheme. Expansion from land of the Taiyiba type to the Barakat type would produce apparent deterioration of the overall yield, and it is known that the present irrigated area contains some land of still lower inherent fertility.
A run of seasons with unfavourable weather or a progressive increase in rainfall could account for falling yields in short sets of data. The partial regression coefficients of yield on time in Table V show the progressive changes in yield, calculated for constant values of the four rainfall variates considered. Deterioration was significant only for the total Gezira area, the full term of Old Barakat and the continuous cotton plots of the Gezira Research Farm. The behaviour of the oldest centre, Taiyiba, is of the greatest importance. Correction for rainfall effects reduces the mean annual change over the whole area and period of this farm from - 0-12 5 0 04 k/f to - 0 01 ? 0 04 k/f, and for the five rotations of
uniformly treated cotton on 480 feddans annually from - 0 21 ? 0 07 k/f to - 0 -08 ? 0 06 k/f. Thus, the deterioration ceases to be significant after allowing for rainfall effects. The pronounced downward trend in the Taiyiba yields apparent from fig. 2 is to be ascribed to the combination of marked effects of rain in the two seasons preceding the cotton crop with the fact that the Taiyiba rainfalls increased significantly over the period considered. There is no direct evidence that the chemical and physical properties of the soils have been adversely affected by irrigation at the older centres, but before ascribing the deterioration to the weather rather than the soil, it seems necessary to inquire whether other rainfall data support, for once, the practical man's opinion that the weather is not so good as it was.
364
This content downloaded from 130.132.123.28 on Sat, 3 May 2014 12:18:54 PMAll use subject to JSTOR Terms and Conditions
Rainfall and Cotton Yields in the Sudan Gezira
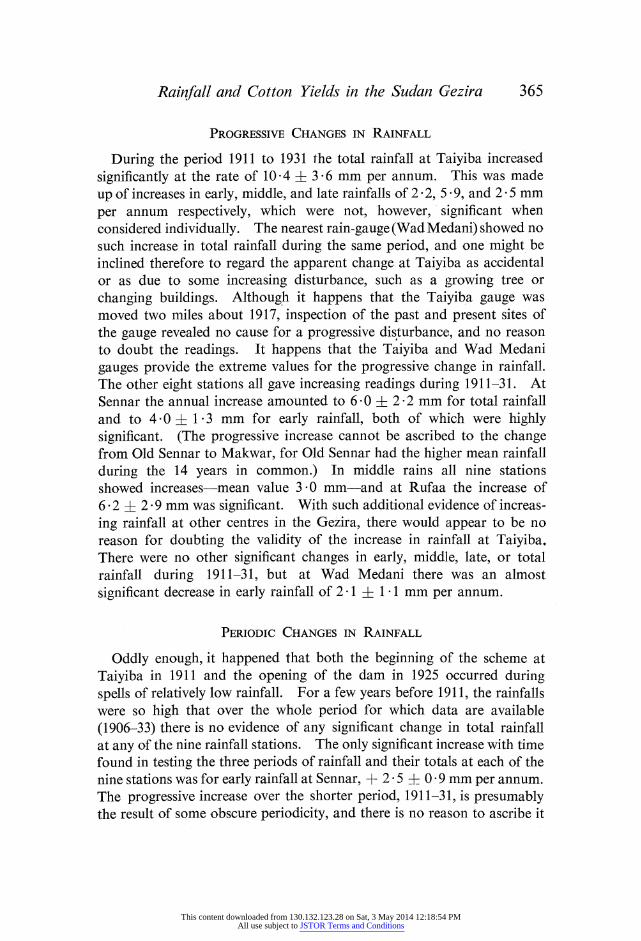
PROGRESSIVE CHANGES IN RAINFALL
During the period 1911 to 1931 the total rainfall at Taiyiba increased
significantly at the rate of 10 4 ? 3 6 mm per annum. This was made
up of increases in early, middle, and late rainfalls of 2 2, 5 9, and 2 5 mm
per annum respectively, which were not, however, significant when considered individually. The nearest rain-gauge (Wad Medani) showed no such increase in total rainfall during the same period, and one might be inclined therefore to regard the apparent change at Taiyiba as accidental or as due to some increasing disturbance, such as a growing tree or
changing buildings. Although it happens that the Taiyiba gauge was moved two miles about 1917, inspection of the past and present sites of the gauge revealed no cause for a progressive disturbance, and no reason to doubt the readings. It happens that the Taiyiba and Wad Medani gauges provide the extreme values for the progressive change in rainfall. The other eight stations all gave increasing readings during 1911-31. At Sennar the annual increase amounted to 6 0 4? 2 2 mm for total rainfall and to 4 0 ? 1-3 mm for early rainfall, both of which were highly significant. (The progressive increase cannot be ascribed to the change from Old Sennar to Makwar, for Old Sennar had the higher mean rainfall during the 14 years in common.) In middle rains all nine stations showed increases-mean value 3 0 mm-and at Rufaa the increase of 6 2 ? 2 9 mm was significant. With such additional evidence of increas- ing rainfall at other centres in the Gezira, there would appear to be no reason for doubting the validity of the increase in rainfall at Taiyiba, There were no other significant changes in early, middle, late, or total rainfall during 1911-31, but at Wad Medani there was an almost significant decrease in early rainfall of 2 1 i 1 1 mm per annum.
PERIODIC CHANGES IN RAINFALL
Oddly enough, it happened that both the beginning of the scheme at Taiyiba in 1911 and the opening of the dam in 1925 occurred during spells of relatively low rainfall. For a few years before 1911, the rainfalls were so high that over the whole period for which data are available (1906-33) there is no evidence of any significant change in total rainfall at any of the nine rainfall stations. The only significant increase with time found in testing the three periods of rainfall and their totals at each of the nine stations was for early rainfall at Sennar, + 2 5 + 0 9 mm per annum. The progressive increase over the shorter period, 1911-31, is presumably the result of some obscure periodicity, and there is no reason to ascribe it
365
This content downloaded from 130.132.123.28 on Sat, 3 May 2014 12:18:54 PMAll use subject to JSTOR Terms and Conditions

366 E. M. Crowther and F. Crowther
to the effects of the dam and irrigation, or to expect that it will con- tinue.
A run of 28 years is insufficient for any elaborate analysis of periodici- ties, but it is of interest to notice that the Gezira rainfall records from 1906 to 1933 show a significant seven-year periodicity with minima about 1912, 1919, 1926, and 1933. Table VII gives the coefficients of simple harmonic motion for this periodicity at the nine rainfall stations, together with the amplitude or maximum fluctuation on either side of the mean value.
TABLE VII-SEVEN YEARS' PERIODICITY IN GEZIRA TOTAL RAINFALL
Co-ordinates of Station Amplitude
cos 27rt sin 2rt 7 7
1-Wad Medani...... -62 28 68* 2-Manaqil .......... -74 -18 76* 3 -Rufaa ............ -47 -11 48 4-Hasiheisa ........ -79 -21 82* 5-Kamlin .......... -57 24 62** Mean of 1-5 .......... -63 0 63*** 6-Sennar .......... -16 -11 19 7-Dueim .......... -1 -15 15 8-Geteina .......... -57 +17 60 9-Khartoum ........ -38 +36 52 Mean of 1-9 .......... -48 +3 48*
For the mean of the five central stations the significance of the seven-year periodicity in total rainfall reaches the 1% probability value, and at four of these stations considered individually the significance reaches the 5% point. The fitting is not significant for the outlying stations taken individually, though it remains significant for the mean of all nine stations. Fig. 3 illustrates the periodicity in the total rainfall for the means of the five central stations by a comparison of the curve fitted to the annual values and lines joining three-year means.
Although a seven-year term does not correspond to any of the well- known meteorological periodicities, there is additional evidence to support it in the Sudan. Thus, the Secretary for Economic Development, Sudan Government (1931-32), wrote in 1932: " From the records that are avail- able, the periods of food scarcity appear to occur in cycles of six or seven years. In 1913-14, 1918-19, and again in 1925-26 measures had to be taken by the Government to meet a serious shortage in food grains. Between these lean years occur the seasons of plenteous supply, when the
This content downloaded from 130.132.123.28 on Sat, 3 May 2014 12:18:54 PMAll use subject to JSTOR Terms and Conditions

Rainfall and Cotton Yields in the Sudan Gezira
country has a surplus of grain for exports." Similar relief measures were required in 1933. Each of these four periods is within a year of the minimum in the seven-year rainfall cycle illustrated in fig. 3. The desperate famine of 1889 and the only other one recorded (1903) are both within two years of minima on the same cycle. The bottom curve of fig. 3 shows that the dura exports from the Sudan exhibit some seven-year periodicity, though the amplitude naturally depends on external economic factors. The cotton yields in the Gezira tend to be high during the spells
1905 1912 1919 1926 1933 400 I I D I T I I I T T I II I
a
200
ob b
5-C
4-
3-
Tons - 60,000 - 40.000
d -20000
e tt t tt t FIG. 3-Three-year means for a, total; and b, early rainfall in mm for the average of
five East-Central stations; c, average cotton yield in k/f for the whole Gezira area; d, total exports of dura from the Sudan. The thick line in a gives the calculated seven-year periodicity for total rainfall. The arrows, e, mark years in which dura exports were below 2,000 tons
of low total rainfall. On the other hand, there is some suggestion that the total cotton production at Tokar is lower during these periods; the area planted is controlled by the flood of the River Baraka, which in turn depends on the rainfall in the Red Sea Hills.
In the early and total rainfall of the Gezira there is some sign of a fourteen-year periodicity, but the data are insufficient for an adequate test.
These periodicities are not sufficiently well established to be of much
367
This content downloaded from 130.132.123.28 on Sat, 3 May 2014 12:18:54 PMAll use subject to JSTOR Terms and Conditions

E. M. Crowther and F. Crowther
value in forecasting future rainfalls, but they are sufficient to show the value of a systematic collection of reliable rainfall records at as many places as possible, especially during the early stages of new agricultural developments. When taken in conjunction with the rainfall correlations presented earlier in this paper, they suggest that the declining yields in the early years at Taiyiba, and again two cycles later on the expanded scheme, may have been due in part to a temporary worsening in the weather and not necessarily to soil deterioration or the inadequacy of the rotations and cultural methods then adopted.
THE NEED FOR RECORD AREAS
We suggest that the detection of possible effects of weather and of soil deterioration is sufficiently important to justify the retention of uniformly treated record areas on an adequate scale in new agricultural schemes. Thus, we regret that it was found necessary in 1932 to change the rotation on the 1440 acres of Taiyiba which had been farmed for fifteen years on a uniform plan. Should the correlations observed in the past fail to be repeated during the next decade or two, it will be impossible to decide whether the effects so far observed were accidental or whether they were valid only for a specified system of cultivation, since abandoned. In irrigation schemes it is particularly important to ascertain by direct trial the direction and approximate rate of progressive changes in soil fertility. The commercial advantage of treating the whole of a large area uniformly .may be dearly bought if attempts to use the latest suggestions from
practice and experiment are allowed to destroy the means of measuring and
interpreting the value of those changes and of detecting the more funda- mental causes of variations in yield.
We wish to record our indebtedness to the Sudan Plantations Syndicate, Ltd., the Controller of the Gezira Agricultural Research Service, the Director of the Egyptian Irrigation Department, Khartoum, and the Director of the Physical Department, Cairo, for affording us access to their detailed records, and for permission to publish our findings. We have profited from many discussions with Messrs. M. A. Bailey, H. Greene, and 0. W. Snow of the Gezira Agricultural Research Service on the interpretation of the results, and with Mr. F. Yates, of Rothamsted Experimental Station, on the methods for the statistical analysis; we are also indebted to them for detailed criticisms of a draft of this paper.
368
This content downloaded from 130.132.123.28 on Sat, 3 May 2014 12:18:54 PMAll use subject to JSTOR Terms and Conditions

Rainfall and Cotton Yields in the Sudan Gezira
SUMMARY
The relationships between seasonal yield and weather fluctuations for cotton grown under irrigation in the Sudan Gezira were analysed for periods up to 23 years.
The analysis confirmed the generally recognized bad effects of high rainfall about the period of sowing cotton, but showed that this effect was not universal. An unsuspected but apparently general effect was discovered. Cotton yields were negatively correlated with the amount of early-May and June-rainfall. In some areas yields were negatively correlated with late rainfall and with the total rainfall in the preceding year. The differences between areas in their responses to weather could be partially interpreted in terms of their situations and agricultural histories.
The progressive decline in yield at the oldest trial farm could be largely accounted for by a significant increase in total rainfall during the period of cotton cultivation. The total annual rainfall in the Sudan Gezira exhibited a significant seven-year periodicity, which was reflected in cotton yields, dura exports, and recorded famines. It happened that the first trial of irrigated cotton and the first use of the Sennar Dam coincided with minimal rainfalls on this periodicity. The early promise and rapidly increasing difficulties may well have been due in part to the recurrence of unfavourable weather conditions and not necessarily to soil deterioration and pests.
Uniformly treated record areas could easily be established on a normal commercial basis in irrigation projects under central control, and would provide valuable material for research in agricultural meteorology, and a surer background for determining both experimental and commercial programmes.
REFERENCES
Balls, W. L. (1935). 'Emp. Cotton Grow. Rev.,' vol. 12, p. 32. Crowther, E. M. (1926). 'Sudan Govt. Rep. of a meeting in the Sudan Gezira in
December, 1925, for the discussion of certain problems connected with cotton growing,' p. 18.
Crowther, F. (1933). 'Sudan Govt. Ann. Rep. Gezira Agric. Res. Ser.,' p. 71. (1933-34). 'Sudan Govt. Interim Rep. Gezira Agric. Res. Ser.,' p. 25.
Fisher, R. A. (1924). 'Phil. Trans.,' B, vol. 213, p. 89. - (1926). " Statistical Methods for Research Workers," Edinburgh, Sec. 29.
Greene, H. (1928, a). ' J. Agric. Sci.,' vol. 18, p. 518. - (1928, b). 'J. Agric. Sci.,' vol. 18, p. 531.
369
This content downloaded from 130.132.123.28 on Sat, 3 May 2014 12:18:54 PMAll use subject to JSTOR Terms and Conditions

370 Rainfall and Cotton Yields in the Sudan Gezira
Greene (1933-34). 'Sudan Govt. Interim Rep. Gezira Agric. Res. Ser.,' p. 50. Hewison, R. (1931). ' Emp. Cotton Grow. Rev.,' vol. 8, p. 290 a. Massey, R. E. (1930). 'Emp. Cotton Grow. Rev.,' vol. 7, p. 185.
(1931). 'Emp. Cotton Grow. Rev.,' vol. 8, p. 187. Snow, O. W. (1933). ' Sudan Govt. Ann. Rep. Gezira Agric. Res. Ser.,' p. 106. Sudan Government (1931-32). 'Ann. Rep. Sec. for Econ. Devel.,' vol. 25, p. 3. Vageler, P., and Alten, F. (1932). 'Z. Pflanz. Diing.,' A, vol. 23, p. 1.
This content downloaded from 130.132.123.28 on Sat, 3 May 2014 12:18:54 PMAll use subject to JSTOR Terms and Conditions