rail access charges and the competitiveness of high speed trains
TRANSCRIPT
ARTICLE IN PRESS
Transport Policy 17 (2010) 102–109
Contents lists available at ScienceDirect
Transport Policy
0967-07
doi:10.1
n Corr
E-m
(M. San
journal homepage: www.elsevier.com/locate/tranpol
Rail access charges and the competitiveness of high speed trains
Marta Sanchez-Borr�as a,n, Chris Nash b, Pedro Abrantes b, Andres Lopez-Pita c
a CENIT-Center for Innovation in Transport, Universitat Polit�ecnica de Catalunya (UPC), Spainb Institute for Transport Studies, University of Leeds, UKc Universitat Polit�ecnica de Catalunya (UPC), Spain
a r t i c l e i n f o
Available online 4 January 2010
Keywords:
Access charges
High speed trains
0X/$ - see front matter & 2009 Elsevier Ltd. A
016/j.tranpol.2009.12.001
esponding author. Tel.: +34 610971827; fax:
ail addresses: [email protected]
chez-Borr�as).
a b s t r a c t
This paper examines rail access charges for high speed trains on new high speed lines in Europe and the
impact these have on the market position of high speed rail. It examines the latest evidence on the
marginal infrastructure and external costs of high speed rail, finding that the best evidence is that these
are both not more than 2 h/train-km. However, current legislation states that environmental costs
should not be charged for unless they are charged for on competing modes. Mark ups based on Ramsey
pricing principles might reasonably raise prices by 100–200%, given that infrastructure charges are only
a part of the final price of rail. The paper then examines the actual prices charged in the main European
countries operating high speed trains and the impact these are likely to have on traffic levels and mode
split. It is found that mark ups often exceed even the optimal Ramsey levels, with a significant impact
on rail volumes and market share. It is concluded that, whilst it is not surprising that governments wish
to recover some of the construction costs of new high speed rail lines from users, they should consider
carefully whether the level of charges is actually significantly reducing traffic on and benefits from
these lines.
& 2009 Elsevier Ltd. All rights reserved.
1. Introduction
Rail access charges have become a major issue in European railpolicy as a result of the policy of restructuring railways to provideopen access for new entrants. European Union legislation requiresmember states to separate rail infrastructure from operations, atleast in accounting terms, and to charge for the use of theinfrastructure on a transparent and non-discriminatory basis.
Directive 2001/14, on allocation of railway infrastructurecapacity and levying of charges, implements the proposals oninfrastructure charging put forward in the 1998 White Paper (CEC,1998). In summary, the directive determines that charges must bebased on ‘‘costs directly incurred as a result of operating the trainservice’’. They may include:
�
charges for scarcity, although where a section of track isdefined as having a scarcity problem, the infrastructuremanager must examine proposals to relieve that scarcity,and undertake them unless they are shown, on the basis of costbenefit analysis, not to be worthwhile. � environmental costs, but only where these are levied on othermodes. Otherwise, any differentiation of charges according toenvironmental costs may not raise the overall level of charges.
ll rights reserved.
+34 934137675.
�
recovery of the costs of specific investments where these areworthwhile and could not otherwise be funded. � discounts but only where justified by costs; large operatorsmay not use their market power to get discounts.
� reservation charges for scarce capacity, which must be paidwhether the capacity is used or not.
� non-discriminatory mark ups but these must not excludesegments of traffic which could cover direct cost.
Explicit time-limited subsidies are permitted to compensate fora failure to charge fully for costs on other modes.
In short, the discussion of the various elements making up thecharges suggests that what is being recommended is essentiallyshort run marginal social cost pricing, with mark-ups as necessaryfor financial purposes based on what the market will bear(Ramsey pricing).
ECMT (2005) brings together evidence on what rail accesspricing policy is actually followed by different European coun-tries. In response to a questionnaire, European countries de-scribed themselves as following one of the following policies:
�
Social marginal cost pricing (SMC), with state compensationfor the difference between the revenue this brings and totalfinancial cost. � Full financial cost minus subsidies (FC�): Setting accesscharges to collect the difference between state compensation
ARTICLE IN PRESS
M. Sanchez-Borr �as et al. / Transport Policy 17 (2010) 102–109 103
and full financial cost. This protects the financial state of theinfrastructure manager but may lead to inefficient use of theinfrastructure.
� Mark-ups to social marginal cost (MC+): Applying mark-ups tosocial marginal cost in order to reduce or eliminate necessarystate compensation could yield the best trade-off betweenefficiency goals and the budgetary needs. MC+ pricing may befully consistent with FC� , but in practice countries using FC�tend to share costs between operators on formulae not based onmarginal cost. MC+ is most efficiently applied by differentiatingmark ups according to market conditions (Ramsey pricing).
In the case of costly new high speed lines it is not surprising ifgovernments want to charge a mark up to make a contributiontowards the investment costs, if not to cover full costs. Where thereis a monopoly operator, the most efficient way of doing this is bymeans of a two-part tariff, which preserves the correct incentive ofcharging marginal cost for additional train kilometres and leaves theoperator free to cover the contribution towards investment costs inthe most efficient way possible. However, this leaves a problemregarding the charge that should be levied on new entrants. If theyare just charged marginal cost, then they are placed in a favourableposition relative to the incumbent and indeed may destroy theability of the incumbent to make a contribution towards investmentcosts. There is an argument that they should pay to the extent thattheir entry reduces the surplus made by the existing operator(Baumol, 1983). It is however difficult for the infrastructure or aregulator to estimate this amount.
Thus there is a dilemma here. Governments typically wantinternational traffic, and particularly high speed traffic, tocontribute more than just short run marginal cost to the costsof infrastructure provision. The most efficient approach to this isvia two-part tariffs. However, given the existence of open accesscompetition for freight traffic, and its introduction for interna-tional passenger traffic in 2010, it is impossible to design a two-part tariff that simultaneously meets the objectives of givingcorrect price signals, a high level of cost recovery and fair terms ofcompetition between operators.
In the next section, we consider evidence on the marginalinfrastructure and external costs of rail services, with particularreference to high speed rail, and on the likely impact of Ramseypricing. We then examine existing charges in practice, beforeconsidering their likely impact on competition with air transport,and reaching our conclusions.
One point should be clarified. In most European countries, highspeed trains run over conventional lines to destinations off the highspeed network, and in some, other trains run over new purposebuilt high speed lines. Our focus in this paper is on the charges forrunning high speed trains over new purpose built high speed lines.
2. Cost measurement and Ramsey pricing
There has been considerable research on how to measure shortrun marginal social cost, although this remains the subject ofconsiderable debate. In this section, we consider in turninfrastructure costs, environmental costs, accidents and conges-tion and scarcity.
2.1. Infrastructure cost
As the level of traffic increases, rail infrastructure suffersgreater damage therefore leading to additional maintenance costsand the need to bring forward renewal work. The estimation of
the costs incurred as the result of train operations can be done intwo main ways (Link and Nilsson, 2005).
The engineering or bottom-up approach relies on physicalmodels and empirical knowledge about the detailed processesinvolved to calculate the damage caused by running an extraservice with given weight and speed characteristics on eachindividual component of the infrastructure. The cost of rectifyingthis damage then yields the respective marginal cost. Althoughthis approach should in theory provide a very accurate estimate ofmarginal cost the fact that it cannot easily deal with all types ofcost involved, the shortcomings of the models used and the needfor very detailed information have meant that the railways havetended to use information from such models in conjunction withtop-down or statistical models. These approaches rely onaggregate data by cost category and attempt to estimate theproportion of each type of cost that varies with traffic. One way todo this is by using cost allocation methods, which allocate costcategories to specific activities and then use judgement todetermine their variability with traffic.
In recent years, however, there has been a growth in the use ofsophisticated econometric techniques to estimate an infrastruc-ture cost function (Link et al., 2007). The strength of this approachis that it provides concrete evidence on what actually happens tocosts when traffic volumes change. The latest evidence from suchstudies is summarised in Wheat and Smith (2008). Costelasticities from such studies are generally in the range of0.1–0.3, with the study of Gaudry and Quinet (2003) on Frenchdata being the sole higher value at 0.37. Thus marginal cost-basedprices will require substantial mark ups if full cost even ofmaintenance and renewals is to be covered, let alone a contribu-tion made to investment costs.
The Gaudry and Quinet study is the only one to achieve adisaggregation of results that separately identifies high speedpassenger services. Although they do not directly report marginalcost, Crozet (2007) has used their results to estimate the marginalinfrastructure costs of high speed trains as 2.1–2.4 euros per trainkilometre.
There is considerable debate about whether other elements ofthe infrastructure manager’s (e.g. train planning, signalling) costsvary in the short run with the actual service run. Most opinion,and the limited econometric evidence available, suggests that anyvariable cost other than wear and tear is very small. Thus we mayreasonably take around 2 h/train-km as a reasonable estimate ofthe marginal infrastructure cost per train-km for high speed rail.As already noted, this study has a higher cost elasticity, andtherefore higher marginal costs, than any other study and mayreasonably be regarded as an upper limit.
2.2. Environmental costs
The most significant environmental costs associated with railare greenhouse gas emissions, air pollutant emissions, and noise.Detailed methodologies exist to estimate these impacts andconvert them into monetary costs.
Given that marginal environmental costs vary considerablywith vehicle technology and site (or route) characteristics, adetailed bottom-up calculation is the only option to assess costswith a reasonable degree of confidence. Currently, the mostcommon approach to the calculation of environmental costs is theimpact pathway approach (IPA), originally developed in theExternE project series (see e.g. European Commission, 1999;Friedrich and Bickel, 2001). The IPA is based on information atthree levels: (i) the increase in emissions, (ii) the associatedimpact and (iii) the monetary valuation of this impact.

ARTICLE IN PRESS
M. Sanchez-Borr �as et al. / Transport Policy 17 (2010) 102–109104
In terms of the level of impact, greenhouse gas emissions aremuch lower for rail than for other modes, but there are significantdifferences in CO2 emissions between countries and train types.Differences are based on how electricity is generated, powerrequirements, a function of train weight and accelerationcharacteristics and the type and amount of equipment fitted.Again, air pollution from rail, apart from SO2, is much lower thanfrom road transport, and accounts for less than 1% of totalemissions for each of the six pollutants from all transport andindustrial sectors. There are, once more, large variations in thelevels of air pollution associated with different classes ofpassenger trains and different types of freight locomotives. Theimpact of both local air pollution and noise varies greatly alsowith the population density around the track.
Most studies show environmental externalities for rail trans-port to be low; for instance Sansom et al. (2001) suggest a figureof 0.6 h/train-km for British intercity trains whereas Bickel et al.(2005) give figures ranging from 0.61 to 1.33 euros per trainkilometre for different countries covering air pollution, noise andglobal warming. Even allowing for the higher energy consumptionof high speed trains, a reasonable upper limit for environmentalcosts would seem to be 2 h/train-km.
2.3. Accident costs
The total social costs of accidents include both the material(including property damage, administrative costs, medical andhospital costs, net lost production and congestion caused) andnon-material (emotional and social costs of casualties resultingfrom transport accidents) costs (HLG, 1999a, b). Non-marketestimation techniques such as contingent valuation methods(CVM) are the most commonly used methods to assess the valuepeople place on the risk of death or injury: they allow the elicitingof the willingness to pay (WTP) of the users for a small reductionof risk.
For rail, marginal external accident costs comprise those costscaused by the running of additional trains and not borne by thetrain operator either directly or through insurance. These mightinclude increased risk of accidents to other trains on the network(but we are unaware of any evidence as to whether the risk ofaccident increases faster than the train kilometres on thenetwork), increased risk of accidents to road users at levelcrossings (on which there is evidence from Sweden: see Lindberg,2002) and any element of costs (e.g. medical expenses, costs ofpain, grief and suffering) borne by third parties and notadequately compensated. There is very little evidence on thesevalues for rail; it is generally assumed that given the smallnumber of rail accidents and the degree to which costs are bornedirectly or through insurance by train operators, external accidentcosts for rail are very small.
Purpose built high speed rail infrastructure is invariablyequipped with modern cab signalling and does not have levelcrossings. There has never been a fatal accident on a purpose builtconventional high speed rail system anywhere in the world,although there have been fatal accidents to high speed trainsrunning on conventional lines and on a maglev test track. Forpurpose built high speed rail lines, we may reasonably regardexternal accident costs as zero.
2.4. Congestion and scarcity costs
Congestion arises from delays due to trains running close toeach other and obstructing each other’s passage. In a plannedsystem such as a railway the timetable is designed to prevent thisfrom happening, but it remains the case that at high levels of
utilisation, the presence of an additional train on the tracks maylead to additional delays to other trains by reducing the ability ofthe system to recover from delays. It is only where the delayedtrain belongs to another operator that this is an external cost.Estimates of marginal congestion costs are available for Britain, asa result of regressing delays on levels of capacity utilisation(Gibson et al., 2002).
Scarcity costs, on the other hand, arise where the presence of atrain prevents another train from operating, or requires it to takean inferior path. Because a rail route might be used in manydifferent ways, it is impossible to uniquely determine its capacity.Furthermore, the impact of an additional train of a particular typeon the paths available to other trains will differ enormouslyaccording to the precise mix of traffic on the line. At the sametime, the value of a slot to other commercial operators or togovernment bodies providing social services will also differenormously in time and space. It is therefore difficult to cometo a general methodology to estimate scarcity values for rail slotsin a variety of typical circumstances.
Congestion and scarcity costs only become significant whenlines are operating close to capacity. Whilst this is the case for afew locations (e.g. Paris–Lyon) at peak times of day, the capacityof new high speed lines is so vast that usually this is not an issue.Moreover, where there is only one operator on a route (as iscurrently usually the case with passenger only high speed lines),then congestion and scarcity costs are already internalised, as theoperator causing them is also the one suffering the consequences.Thus, we would not generally see a case for a congestion orscarcity charge on current high speed rail routes, although withthe forthcoming open access for international services this couldbecome an issue on some intensively used international highspeed routes.
2.5. Ramsey pricing
The impact of high track access charges may be minimised bymeans of Ramsey–Boiteux pricing (Ramsey, 1927; Boiteux, 1956).Essentially this means pricing up more in those market segmentswhich are least sensitive to price. This is permitted under theDirective, provided there is no discrimination between differentoperators competing for the same market segment. However, theability of the infrastructure manager or regulator to identify suchmarket segments is limited. It is generally possible to differentiateby broad category of passenger train (intercity, suburban,regional) and freight train (container, bulk, general merchandise).It is also possible to differentiate by location and by time ofday/week/year. But it is not possible to differentiate by keydeterminants of elasticities such as journey purpose for passen-gers, or commodity in the case of freight (except that somelimited differentiation in the case of bulk commodities may bepossible). This is because individual trains may carry a mix ofjourney purposes and commodities and the infrastructuremanager has no way of knowing that mix.
A particular issue arises with respect to international traffic inthat mark ups for the entire trip are typically just the sum of themark ups applied to that category of traffic in each countrythrough which it passes. Thus the mark up for the whole journeyis not considered in relation to the competitive position of rail, orworse still, if it is considered then each infrastructure managermay price to obtain the maximum surplus from such trafficregardless of what other infrastructure managers are doing (thedouble marginalisation problem). Where charges exceed shortrun marginal social cost, charges for international traffic reallyneed to be negotiated between the infrastructure managers
ARTICLE IN PRESS
M. Sanchez-Borr �as et al. / Transport Policy 17 (2010) 102–109 105
concerned and set at a corridor level in the light of thecompetitive position of rail in the corridor as a whole.
Crozet (2007) calculates the value of the optimum mark upfrom the formula below, derived from the rule of the mark upbeing proportional to the inverse of the price elasticity of demand:
a¼ ðCiþa=e � CsÞ=ð1�a=eÞ ð1Þ
where a is the level of infrastructure charge, Ci is the marginalinfrastructure cost, a=l/(1+l) is a parameter reflecting theopportunity cost of public funds l, e is the price elasticity oftraffic expressed in absolute value, Cs is the marginal train servicecost, and Cs+Ci=C, which is the overall marginal cost.
Assuming that l is typically equal to 0.3 (Crozet, 2007), we canwork out the optimal mark up given information on the elasticityof demand. For the French high speed network, the optimal markup would range between 3.2 and twice the marginal cost, forelasticities of 0.7 (Paris–Lyon) and 1.5 (Paris–Nice), respectively.That is, even allowing for the opportunity cost of governmentfunds, infrastructure charges for high speed lines should not behigher than 6.4 h/train-km taking 2 h/train-km as an upper limitto the marginal infrastructure cost per train-km for high speed railand a price elasticity of 0.7 and if there is no environmentalcharge (which arguably should be the case given the generalabsence of environmental charges in air transport). Where priceelasticities are higher the mark up should be less.
3. Rail access charging in practice
Rail access charging implemented in European countries withhigh speed lines in operation follow two of the three differentpolicies described in Section 1. On the one hand, France and Spainapply mark ups to social marginal cost (MC+). On the other hand,Germany, Italy and Belgium follow a pricing policy consisting ofcollecting the full financial cost minus subsidies (FC�).
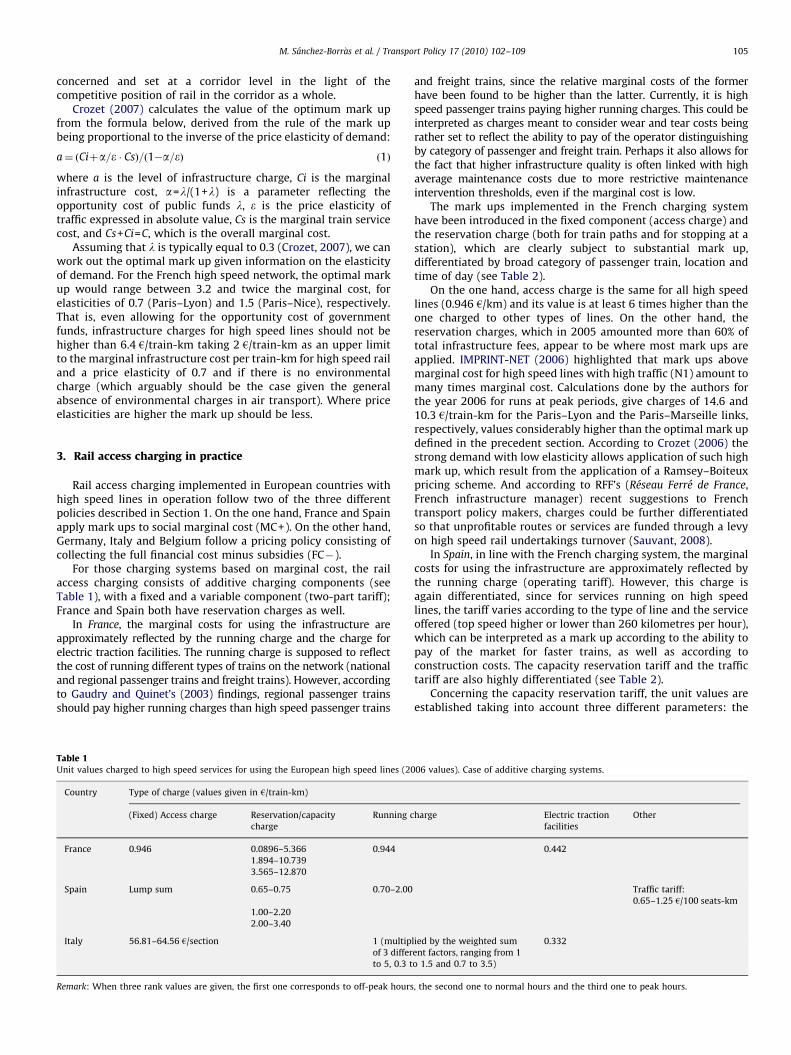
For those charging systems based on marginal cost, the railaccess charging consists of additive charging components (seeTable 1), with a fixed and a variable component (two-part tariff);France and Spain both have reservation charges as well.
In France, the marginal costs for using the infrastructure areapproximately reflected by the running charge and the charge forelectric traction facilities. The running charge is supposed to reflectthe cost of running different types of trains on the network (nationaland regional passenger trains and freight trains). However, accordingto Gaudry and Quinet’s (2003) findings, regional passenger trainsshould pay higher running charges than high speed passenger trains
Table 1Unit values charged to high speed services for using the European high speed lines (20
Country Type of charge (values given in h/train-km)
(Fixed) Access charge Reservation/capacity
charge
Running c
France 0.946 0.0896–5.366 0.944
1.894–10.739
3.565–12.870
Spain Lump sum 0.65–0.75 0.70–2.00
1.00–2.20
2.00–3.40
Italy 56.81–64.56 h/section 1 (multip
of 3 differ
to 5, 0.3 t
Remark: When three rank values are given, the first one corresponds to off-peak hours
and freight trains, since the relative marginal costs of the formerhave been found to be higher than the latter. Currently, it is highspeed passenger trains paying higher running charges. This could beinterpreted as charges meant to consider wear and tear costs beingrather set to reflect the ability to pay of the operator distinguishingby category of passenger and freight train. Perhaps it also allows forthe fact that higher infrastructure quality is often linked with highaverage maintenance costs due to more restrictive maintenanceintervention thresholds, even if the marginal cost is low.
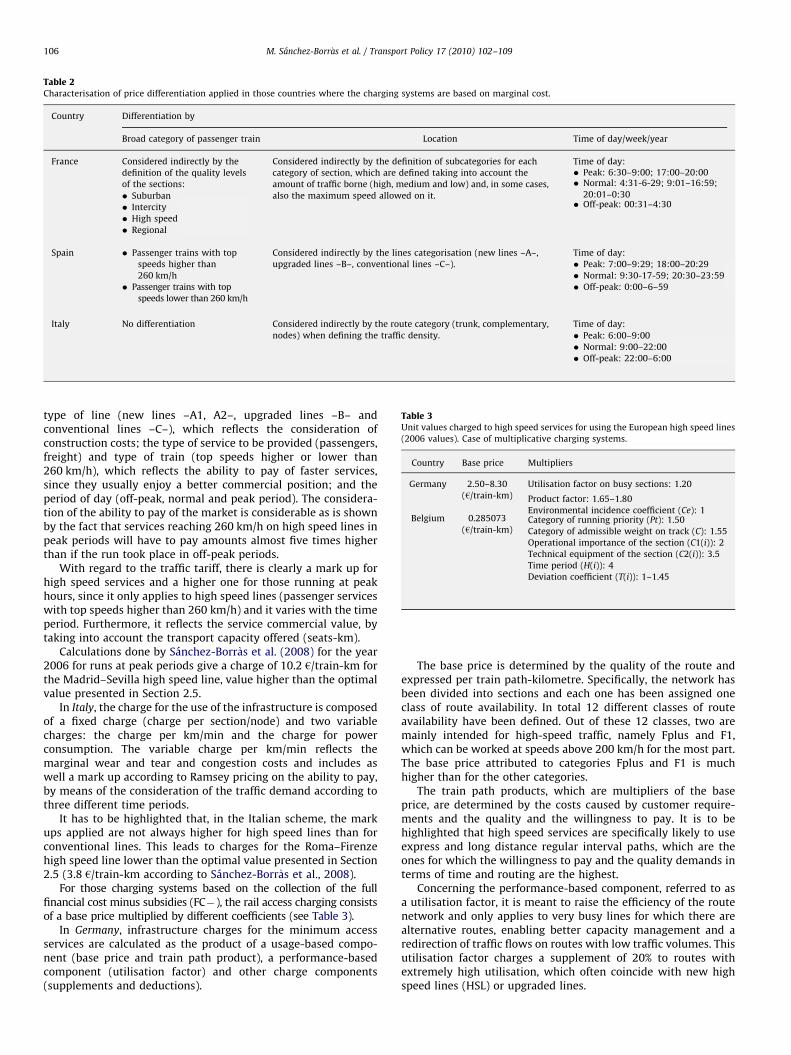
The mark ups implemented in the French charging systemhave been introduced in the fixed component (access charge) andthe reservation charge (both for train paths and for stopping at astation), which are clearly subject to substantial mark up,differentiated by broad category of passenger train, location andtime of day (see Table 2).
On the one hand, access charge is the same for all high speedlines (0.946 h/km) and its value is at least 6 times higher than theone charged to other types of lines. On the other hand, thereservation charges, which in 2005 amounted more than 60% oftotal infrastructure fees, appear to be where most mark ups areapplied. IMPRINT-NET (2006) highlighted that mark ups abovemarginal cost for high speed lines with high traffic (N1) amount tomany times marginal cost. Calculations done by the authors forthe year 2006 for runs at peak periods, give charges of 14.6 and10.3 h/train-km for the Paris–Lyon and the Paris–Marseille links,respectively, values considerably higher than the optimal mark updefined in the precedent section. According to Crozet (2006) thestrong demand with low elasticity allows application of such highmark up, which result from the application of a Ramsey–Boiteuxpricing scheme. And according to RFF’s (Reseau Ferre de France,French infrastructure manager) recent suggestions to Frenchtransport policy makers, charges could be further differentiatedso that unprofitable routes or services are funded through a levyon high speed rail undertakings turnover (Sauvant, 2008).
In Spain, in line with the French charging system, the marginalcosts for using the infrastructure are approximately reflected bythe running charge (operating tariff). However, this charge isagain differentiated, since for services running on high speedlines, the tariff varies according to the type of line and the serviceoffered (top speed higher or lower than 260 kilometres per hour),which can be interpreted as a mark up according to the ability topay of the market for faster trains, as well as according toconstruction costs. The capacity reservation tariff and the traffictariff are also highly differentiated (see Table 2).
Concerning the capacity reservation tariff, the unit values areestablished taking into account three different parameters: the
06 values). Case of additive charging systems.
harge Electric traction
facilities
Other
0.442
Traffic tariff:
0.65–1.25 h/100 seats-km
lied by the weighted sum
ent factors, ranging from 1
o 1.5 and 0.7 to 3.5)
0.332
, the second one to normal hours and the third one to peak hours.
ARTICLE IN PRESS
Table 2Characterisation of price differentiation applied in those countries where the charging systems are based on marginal cost.
Country Differentiation by
Broad category of passenger train Location Time of day/week/year
France Considered indirectly by the
definition of the quality levels
of the sections:
� Suburban
� Intercity
� High speed
� Regional
Considered indirectly by the definition of subcategories for each
category of section, which are defined taking into account the
amount of traffic borne (high, medium and low) and, in some cases,
also the maximum speed allowed on it.
Time of day:� Peak: 6:30–9:00; 17:00–20:00� Normal: 4:31-6-29; 9:01–16:59;
20:01–0:30� Off-peak: 00:31–4:30
Spain � Passenger trains with top
speeds higher than
260 km/h
� Passenger trains with top
speeds lower than 260 km/h
Considered indirectly by the lines categorisation (new lines –A–,
upgraded lines –B–, conventional lines –C–).
Time of day:
� Peak: 7:00–9:29; 18:00–20:29
� Normal: 9:30-17-59; 20:30–23:59
� Off-peak: 0:00–6–59
Italy No differentiation Considered indirectly by the route category (trunk, complementary,
nodes) when defining the traffic density.
Time of day:
� Peak: 6:00–9:00
� Normal: 9:00–22:00
� Off-peak: 22:00–6:00
Table 3Unit values charged to high speed services for using the European high speed lines
(2006 values). Case of multiplicative charging systems.
Country Base price Multipliers
Germany 2.50–8.30
(h/train-km)
Utilisation factor on busy sections: 1.20
Product factor: 1.65–1.80
Belgium 0.285073
(h/train-km)
Environmental incidence coefficient (Ce): 1Category of running priority (Pt): 1.50
Category of admissible weight on track (C): 1.55
Operational importance of the section (C1(i)): 2
Technical equipment of the section (C2(i)): 3.5
Time period (H(i)): 4
Deviation coefficient (T(i)): 1–1.45
M. Sanchez-Borr �as et al. / Transport Policy 17 (2010) 102–109106
type of line (new lines –A1, A2–, upgraded lines –B– andconventional lines –C–), which reflects the consideration ofconstruction costs; the type of service to be provided (passengers,freight) and type of train (top speeds higher or lower than260 km/h), which reflects the ability to pay of faster services,since they usually enjoy a better commercial position; and theperiod of day (off-peak, normal and peak period). The considera-tion of the ability to pay of the market is considerable as is shownby the fact that services reaching 260 km/h on high speed lines inpeak periods will have to pay amounts almost five times higherthan if the run took place in off-peak periods.
With regard to the traffic tariff, there is clearly a mark up forhigh speed services and a higher one for those running at peakhours, since it only applies to high speed lines (passenger serviceswith top speeds higher than 260 km/h) and it varies with the timeperiod. Furthermore, it reflects the service commercial value, bytaking into account the transport capacity offered (seats-km).
Calculations done by Sanchez-Borr�as et al. (2008) for the year2006 for runs at peak periods give a charge of 10.2 h/train-km forthe Madrid–Sevilla high speed line, value higher than the optimalvalue presented in Section 2.5.
In Italy, the charge for the use of the infrastructure is composedof a fixed charge (charge per section/node) and two variablecharges: the charge per km/min and the charge for powerconsumption. The variable charge per km/min reflects themarginal wear and tear and congestion costs and includes aswell a mark up according to Ramsey pricing on the ability to pay,by means of the consideration of the traffic demand according tothree different time periods.
It has to be highlighted that, in the Italian scheme, the markups applied are not always higher for high speed lines than forconventional lines. This leads to charges for the Roma–Firenzehigh speed line lower than the optimal value presented in Section2.5 (3.8 h/train-km according to Sanchez-Borr�as et al., 2008).
For those charging systems based on the collection of the fullfinancial cost minus subsidies (FC�), the rail access charging consistsof a base price multiplied by different coefficients (see Table 3).
In Germany, infrastructure charges for the minimum accessservices are calculated as the product of a usage-based compo-nent (base price and train path product), a performance-basedcomponent (utilisation factor) and other charge components(supplements and deductions).
The base price is determined by the quality of the route andexpressed per train path-kilometre. Specifically, the network hasbeen divided into sections and each one has been assigned oneclass of route availability. In total 12 different classes of routeavailability have been defined. Out of these 12 classes, two aremainly intended for high-speed traffic, namely Fplus and F1,which can be worked at speeds above 200 km/h for the most part.The base price attributed to categories Fplus and F1 is muchhigher than for the other categories.
The train path products, which are multipliers of the baseprice, are determined by the costs caused by customer require-ments and the quality and the willingness to pay. It is to behighlighted that high speed services are specifically likely to useexpress and long distance regular interval paths, which are theones for which the willingness to pay and the quality demands interms of time and routing are the highest.
Concerning the performance-based component, referred to asa utilisation factor, it is meant to raise the efficiency of the routenetwork and only applies to very busy lines for which there arealternative routes, enabling better capacity management and aredirection of traffic flows on routes with low traffic volumes. Thisutilisation factor charges a supplement of 20% to routes withextremely high utilisation, which often coincide with new highspeed lines (HSL) or upgraded lines.
ARTICLE IN PRESS
M. Sanchez-Borr �as et al. / Transport Policy 17 (2010) 102–109 107
Therefore, it can be affirmed that the German charging systemapplies mark ups to high speed lines and differentiates bycategory of passenger trains and location. However, those markups do not strictly follow the Ramsey–Boiteux principle. Thischarging system leads to charges for high speed lines higher thanthe optimal value (12.1 h/train-km for the Frankfurt–Koln HSLaccording to Sanchez-Borr�as et al., 2008).
In Belgium, infrastructure charges for the minimum accessservices are calculated as the product of a base price P and sevencoefficients covering the key drivers relating to marginal costs aswell as other parameters that compose the social marginal costsof running a train. The coefficients include a differentiation bybroad category of passenger train (coefficient Pt, corresponding tothe running priority assigned to a train with regard to othertrains) and time of day (coefficient H(i), which varies with thetime of the day as well as with the line and running direction),which could be reflecting the ability to pay of certain services.This pricing scheme results once again in charges for HSL higherthan the optimal value (10.5 h/train-km for the Bruxelles–Li�egeHSL according to Sanchez-Borr�as et al., 2008).
Finally, it is worth mentioning the high speed route throughthe Channel Tunnel to London. Within England, this route iscurrently solely used by Eurostar, who pay according to a two-part tariff, with a very high fixed charge to contribute to the highconstruction costs of the line. It is not clear how this will beadapted when open access for international passenger services isintroduced in 2010; the problems with combining two-part tariffswith open access have been noted above.
For the Channel Tunnel itself, the charge structure forpassenger services consists of fixed administration cost plus anannual reservation charge per single train crossing plus anadditional charge per train passenger (Eurotunnel, 2008). Forexample, a high speed train (140–160 km/h) operating during theintermediate time period on a regular weekly timetable with 70%occupancy would be charged an average of 4778h per crossing(4600h variable charge+[17.7h fixed charge/52 weeksn70%occupancyn750 seats]) in addition to administration costs.Operating the same service in the peak period would incur anadditional 20% charge. Given that the length of the ChannelTunnel is 50.5 km this represents an average intermediate periodcharge of 94.6 h/train-km.
It is clear that these are very high charges by any standards.For example, the reservation peak-hour charge on the Frenchsection of the London–Paris route is 11.8 h/train-km1 (RFF, 2007).Outside France, it is difficult to find charges above 20 h/train-kmon any of the busiest sections of the European rail networkeven during peak periods. It is therefore clear that the rationalebehind charging on the Channel Tunnel is based on FullCost.
The characterisation of the rail access charging in the Europeancountries with high speed lines in operation allows affirming that,even if the charging systems differ from one country to another,some common features can be identified:
�
trac
Par
add
0.23
Major mark ups above marginal costs are applied to high speedlines.
� Ramsey–Boiteux pricing is broadly applied in those countriescharging mark ups to social marginal cost, differentiating bybroad category of passenger train, location and time of day,each country using however different criteria.
1 This value is obtained by adding together the following components: fixed
k access charge, reservation charge, track usage charge, charge for one stop at
is–Nord only (non-stop between Paris–Nord and the Channel Tunnel),
itional charge for using the overhead catenary system (RCE assumed to be
3 h/train-km).
�
Mark ups applied to high speed lines seem to be higher thanthe optimal values defined by Crozet (2007) except for theItalian case, the only one not aiming at recovering investmentcosts. Indeed, calculations published by Sanchez-Borr�as et al.(2008) for the year 2006 and for a train supposed to leave at 8a.m. from the origin point and heading for the destinationpoint and without taking into consideration intermediate stopsin order to ease the calculations, result in infrastructurecharges higher than 10 h/train-km for the main national linksof the countries analysed with the exception of the Italian link.4. The competitive impact of high speed railways’ charges
In the preceding section it has been ascertained that thecurrent level of mark ups applied to the European high speed linesin operation are by and large far above the marginal cost of wearand tear and higher than the optimal level of mark up. Thissection is devoted to quantifying the competitive impact of thoselevels of high speed railways (HSR) charges.
The analysis of the impact that an increase/decrease in railinfrastructure charges can have on traffic volumes requires us toestablish a link between, on the one hand, infrastructure chargesand, on the other hand, traffic demand.
The revenue (Rev) to the train operator on a particular line iscalculated as the product of the ticket fare (F) and the trafficexpressed in passengers per train (Q); the proportionate change inrevenue from a price change can be expressed as:
DRev=Rev¼DF=FþDQ=Q ð2Þ
Taking into consideration the definition of the price elasticityof demand (e), which links ticket fares to traffic volumes, andassuming that the profitability must be unchanged (i.e. assumingthat the change in revenues must equal the change in infra-structure charges), it is possible to work out the change in fareresulting from any change in infrastructure charge (IC):
DF=F ¼ 1=ðRev�ð1þeÞÞ�DIC ð3Þ
Combining (3) with the definition of the price elasticity, wecan work out the relative change in traffic:
DQ=Q ¼ e=ð1þeÞ�g�DIC=IC ð4Þ
where g is the ratio between infrastructure charges and therevenues for a train running on a given link.
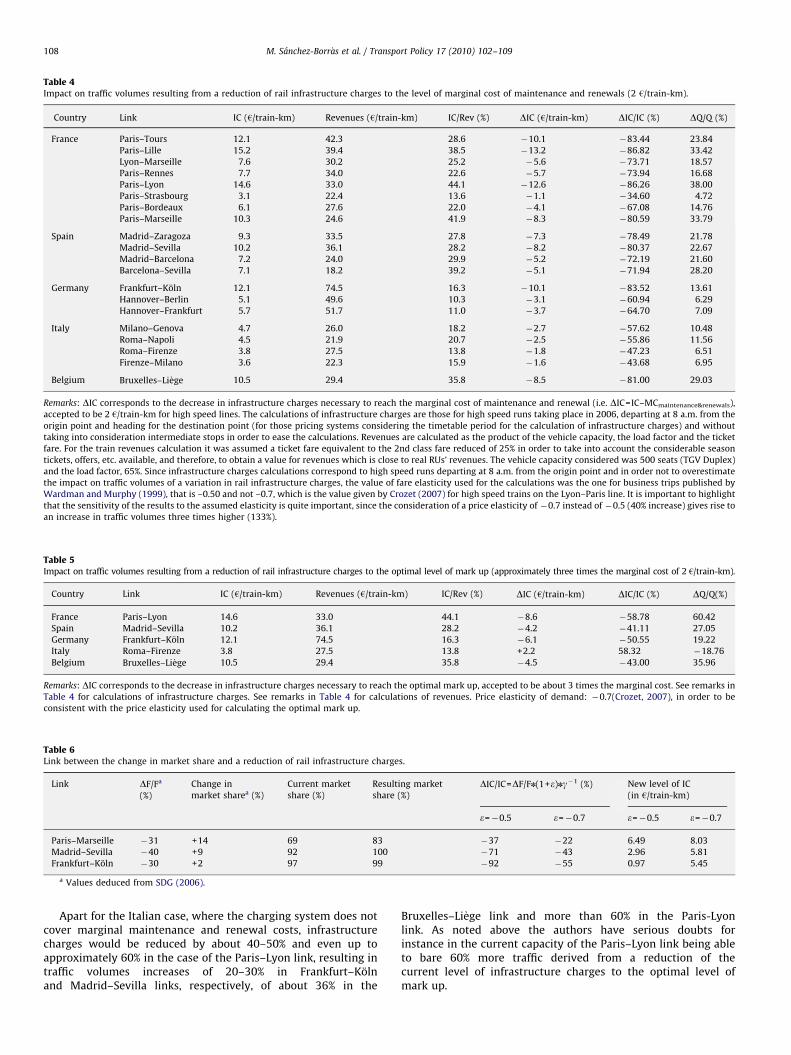
Table 4 presents the impact on traffic volumes resulting from areduction of rail infrastructure charges to the level of marginalcost of maintenance and renewals (2 h/train-km).
The increases in traffic volumes deduced from (4) are verysignificant. Indeed, transporting up to approximately 40% morepassengers in a link such as Paris-Lyon, where 100 trains run daily(included both directions), would in all likelihood be prone to leadto capacity problems. Consequently, in such cases, it may beappropriate to maintain the level of infrastructure charges abovethe marginal costs of maintenance and renewals, so as to ensurethat the current capacity of the existing lines is sufficient to bearthe increases in traffic resulting from a reduction of infrastructurecharges. But in many cases the suggested increase in traffic couldbe accommodated on the existing infrastructure.
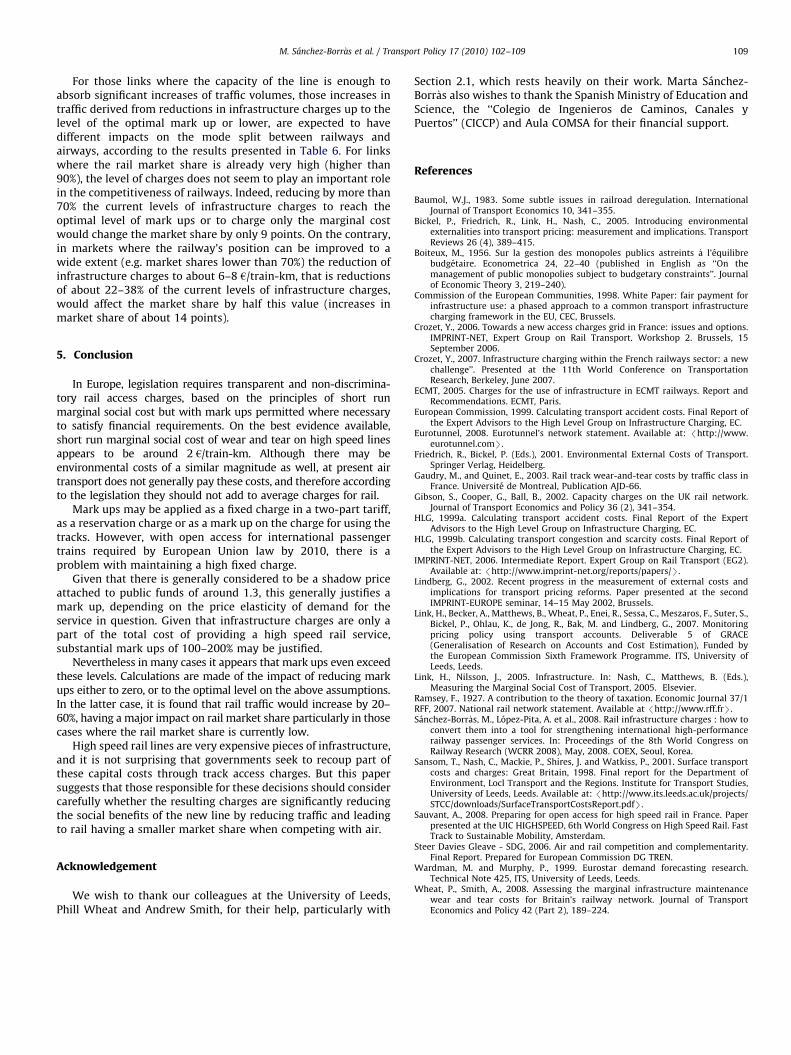
The impact on traffic volumes resulting from a reduction ofcurrent levels of rail infrastructure charges to the optimal level ofmark up would be the one presented in Table 5. The valuespresented were obtained assuming that the optimal level of markup for the main national European high speed links isapproximately three times the marginal cost and that the priceelasticity of traffic equals 0.7 for such links (see Section 2.5). Thisis probably an upper limit for the optimal mark up, as elasticity istypically higher.
ARTICLE IN PRESS
Table 4Impact on traffic volumes resulting from a reduction of rail infrastructure charges to the level of marginal cost of maintenance and renewals (2 h/train-km).
Country Link IC (h/train-km) Revenues (h/train-km) IC/Rev (%) DIC (h/train-km) DIC/IC (%) DQ/Q (%)
France Paris–Tours 12.1 42.3 28.6 �10.1 �83.44 23.84
Paris–Lille 15.2 39.4 38.5 �13.2 �86.82 33.42
Lyon–Marseille 7.6 30.2 25.2 �5.6 �73.71 18.57
Paris–Rennes 7.7 34.0 22.6 �5.7 �73.94 16.68
Paris–Lyon 14.6 33.0 44.1 �12.6 �86.26 38.00
Paris–Strasbourg 3.1 22.4 13.6 �1.1 �34.60 4.72
Paris–Bordeaux 6.1 27.6 22.0 �4.1 �67.08 14.76
Paris–Marseille 10.3 24.6 41.9 �8.3 �80.59 33.79
Spain Madrid–Zaragoza 9.3 33.5 27.8 �7.3 �78.49 21.78
Madrid–Sevilla 10.2 36.1 28.2 �8.2 �80.37 22.67
Madrid–Barcelona 7.2 24.0 29.9 �5.2 �72.19 21.60
Barcelona–Sevilla 7.1 18.2 39.2 �5.1 �71.94 28.20
Germany Frankfurt–Koln 12.1 74.5 16.3 �10.1 �83.52 13.61
Hannover–Berlin 5.1 49.6 10.3 �3.1 �60.94 6.29
Hannover–Frankfurt 5.7 51.7 11.0 �3.7 �64.70 7.09
Italy Milano–Genova 4.7 26.0 18.2 �2.7 �57.62 10.48
Roma–Napoli 4.5 21.9 20.7 �2.5 �55.86 11.56
Roma–Firenze 3.8 27.5 13.8 �1.8 �47.23 6.51
Firenze–Milano 3.6 22.3 15.9 �1.6 �43.68 6.95
Belgium Bruxelles–Li�ege 10.5 29.4 35.8 �8.5 �81.00 29.03
Remarks: DIC corresponds to the decrease in infrastructure charges necessary to reach the marginal cost of maintenance and renewal (i.e. DIC=IC–MCmaintenance&renewals),
accepted to be 2 h/train-km for high speed lines. The calculations of infrastructure charges are those for high speed runs taking place in 2006, departing at 8 a.m. from the
origin point and heading for the destination point (for those pricing systems considering the timetable period for the calculation of infrastructure charges) and without
taking into consideration intermediate stops in order to ease the calculations. Revenues are calculated as the product of the vehicle capacity, the load factor and the ticket
fare. For the train revenues calculation it was assumed a ticket fare equivalent to the 2nd class fare reduced of 25% in order to take into account the considerable season
tickets, offers, etc. available, and therefore, to obtain a value for revenues which is close to real RUs’ revenues. The vehicle capacity considered was 500 seats (TGV Duplex)
and the load factor, 65%. Since infrastructure charges calculations correspond to high speed runs departing at 8 a.m. from the origin point and in order not to overestimate
the impact on traffic volumes of a variation in rail infrastructure charges, the value of fare elasticity used for the calculations was the one for business trips published by
Wardman and Murphy (1999), that is –0.50 and not –0.7, which is the value given by Crozet (2007) for high speed trains on the Lyon–Paris line. It is important to highlight
that the sensitivity of the results to the assumed elasticity is quite important, since the consideration of a price elasticity of �0.7 instead of �0.5 (40% increase) gives rise to
an increase in traffic volumes three times higher (133%).
Table 5Impact on traffic volumes resulting from a reduction of rail infrastructure charges to the optimal level of mark up (approximately three times the marginal cost of 2 h/train-km).
Country Link IC (h/train-km) Revenues (h/train-km) IC/Rev (%) DIC (h/train-km) DIC/IC (%) DQ/Q(%)
France Paris–Lyon 14.6 33.0 44.1 �8.6 �58.78 60.42
Spain Madrid–Sevilla 10.2 36.1 28.2 �4.2 �41.11 27.05
Germany Frankfurt–Koln 12.1 74.5 16.3 �6.1 �50.55 19.22
Italy Roma–Firenze 3.8 27.5 13.8 +2.2 58.32 �18.76
Belgium Bruxelles–Li�ege 10.5 29.4 35.8 �4.5 �43.00 35.96
Remarks: DIC corresponds to the decrease in infrastructure charges necessary to reach the optimal mark up, accepted to be about 3 times the marginal cost. See remarks in
Table 4 for calculations of infrastructure charges. See remarks in Table 4 for calculations of revenues. Price elasticity of demand: �0.7(Crozet, 2007), in order to be
consistent with the price elasticity used for calculating the optimal mark up.
Table 6Link between the change in market share and a reduction of rail infrastructure charges.
Link DF/Fa
(%)
Change in
market sharea (%)
Current market
share (%)
Resulting market
share (%)DIC/IC=DF/Fn(1+e)ng�1 (%) New level of IC
(in h/train-km)
e=�0.5 e=�0.7 e=�0.5 e=�0.7
Paris–Marseille �31 +14 69 83 �37 �22 6.49 8.03
Madrid–Sevilla �40 +9 92 100 �71 �43 2.96 5.81
Frankfurt–Koln �30 +2 97 99 �92 �55 0.97 5.45
a Values deduced from SDG (2006).
M. Sanchez-Borr �as et al. / Transport Policy 17 (2010) 102–109108
Apart for the Italian case, where the charging system does notcover marginal maintenance and renewal costs, infrastructurecharges would be reduced by about 40–50% and even up toapproximately 60% in the case of the Paris–Lyon link, resulting intraffic volumes increases of 20–30% in Frankfurt–Kolnand Madrid–Sevilla links, respectively, of about 36% in the
Bruxelles–Li�ege link and more than 60% in the Paris-Lyonlink. As noted above the authors have serious doubts forinstance in the current capacity of the Paris–Lyon link being ableto bare 60% more traffic derived from a reduction of thecurrent level of infrastructure charges to the optimal level ofmark up.
ARTICLE IN PRESS
M. Sanchez-Borr �as et al. / Transport Policy 17 (2010) 102–109 109
For those links where the capacity of the line is enough toabsorb significant increases of traffic volumes, those increases intraffic derived from reductions in infrastructure charges up to thelevel of the optimal mark up or lower, are expected to havedifferent impacts on the mode split between railways andairways, according to the results presented in Table 6. For linkswhere the rail market share is already very high (higher than90%), the level of charges does not seem to play an important rolein the competitiveness of railways. Indeed, reducing by more than70% the current levels of infrastructure charges to reach theoptimal level of mark ups or to charge only the marginal costwould change the market share by only 9 points. On the contrary,in markets where the railway’s position can be improved to awide extent (e.g. market shares lower than 70%) the reduction ofinfrastructure charges to about 6–8 h/train-km, that is reductionsof about 22–38% of the current levels of infrastructure charges,would affect the market share by half this value (increases inmarket share of about 14 points).
5. Conclusion
In Europe, legislation requires transparent and non-discrimina-tory rail access charges, based on the principles of short runmarginal social cost but with mark ups permitted where necessaryto satisfy financial requirements. On the best evidence available,short run marginal social cost of wear and tear on high speed linesappears to be around 2 h/train-km. Although there may beenvironmental costs of a similar magnitude as well, at present airtransport does not generally pay these costs, and therefore accordingto the legislation they should not add to average charges for rail.
Mark ups may be applied as a fixed charge in a two-part tariff,as a reservation charge or as a mark up on the charge for using thetracks. However, with open access for international passengertrains required by European Union law by 2010, there is aproblem with maintaining a high fixed charge.
Given that there is generally considered to be a shadow priceattached to public funds of around 1.3, this generally justifies amark up, depending on the price elasticity of demand for theservice in question. Given that infrastructure charges are only apart of the total cost of providing a high speed rail service,substantial mark ups of 100–200% may be justified.
Nevertheless in many cases it appears that mark ups even exceedthese levels. Calculations are made of the impact of reducing markups either to zero, or to the optimal level on the above assumptions.In the latter case, it is found that rail traffic would increase by 20–60%, having a major impact on rail market share particularly in thosecases where the rail market share is currently low.
High speed rail lines are very expensive pieces of infrastructure,and it is not surprising that governments seek to recoup part ofthese capital costs through track access charges. But this papersuggests that those responsible for these decisions should considercarefully whether the resulting charges are significantly reducingthe social benefits of the new line by reducing traffic and leadingto rail having a smaller market share when competing with air.
Acknowledgement
We wish to thank our colleagues at the University of Leeds,Phill Wheat and Andrew Smith, for their help, particularly with
Section 2.1, which rests heavily on their work. Marta Sanchez-Borr�as also wishes to thank the Spanish Ministry of Education andScience, the ‘‘Colegio de Ingenieros de Caminos, Canales yPuertos’’ (CICCP) and Aula COMSA for their financial support.
References
Baumol, W.J., 1983. Some subtle issues in railroad deregulation. InternationalJournal of Transport Economics 10, 341–355.
Bickel, P., Friedrich, R., Link, H., Nash, C., 2005. Introducing environmentalexternalities into transport pricing: measurement and implications. TransportReviews 26 (4), 389–415.
Boiteux, M., 1956. Sur la gestion des monopoles publics astreints �a l’equilibrebudgetaire. Econometrica 24, 22–40 (published in English as ‘‘On themanagement of public monopolies subject to budgetary constraints’’. Journalof Economic Theory 3, 219–240).
Commission of the European Communities, 1998. White Paper: fair payment forinfrastructure use: a phased approach to a common transport infrastructurecharging framework in the EU, CEC, Brussels.
Crozet, Y., 2006. Towards a new access charges grid in France: issues and options.IMPRINT-NET, Expert Group on Rail Transport. Workshop 2. Brussels, 15September 2006.
Crozet, Y., 2007. Infrastructure charging within the French railways sector: a newchallenge’’. Presented at the 11th World Conference on TransportationResearch, Berkeley, June 2007.
ECMT, 2005. Charges for the use of infrastructure in ECMT railways. Report andRecommendations. ECMT, Paris.
European Commission, 1999. Calculating transport accident costs. Final Report ofthe Expert Advisors to the High Level Group on Infrastructure Charging, EC.
Eurotunnel, 2008. Eurotunnel’s network statement. Available at: /http://www.eurotunnel.comS.
Friedrich, R., Bickel, P. (Eds.), 2001. Environmental External Costs of Transport.Springer Verlag, Heidelberg.
Gaudry, M., and Quinet, E., 2003. Rail track wear-and-tear costs by traffic class inFrance. Universite de Montreal, Publication AJD-66.
Gibson, S., Cooper, G., Ball, B., 2002. Capacity charges on the UK rail network.Journal of Transport Economics and Policy 36 (2), 341–354.
HLG, 1999a. Calculating transport accident costs. Final Report of the ExpertAdvisors to the High Level Group on Infrastructure Charging, EC.
HLG, 1999b. Calculating transport congestion and scarcity costs. Final Report ofthe Expert Advisors to the High Level Group on Infrastructure Charging, EC.
IMPRINT-NET, 2006. Intermediate Report. Expert Group on Rail Transport (EG2).Available at: /http://www.imprint-net.org/reports/papers/S.
Lindberg, G., 2002. Recent progress in the measurement of external costs andimplications for transport pricing reforms. Paper presented at the secondIMPRINT-EUROPE seminar, 14–15 May 2002, Brussels.
Link, H., Becker, A., Matthews, B., Wheat, P., Enei, R., Sessa, C., Meszaros, F., Suter, S.,Bickel, P., Ohlau, K., de Jong, R., Bak, M. and Lindberg, G., 2007. Monitoringpricing policy using transport accounts. Deliverable 5 of GRACE(Generalisation of Research on Accounts and Cost Estimation), Funded bythe European Commission Sixth Framework Programme. ITS, University ofLeeds, Leeds.
Link, H., Nilsson, J., 2005. Infrastructure. In: Nash, C., Matthews, B. (Eds.),Measuring the Marginal Social Cost of Transport, 2005. Elsevier.
Ramsey, F., 1927. A contribution to the theory of taxation. Economic Journal 37/1RFF, 2007. National rail network statement. Available at /http://www.rff.frS.Sanchez-Borr�as, M., Lopez-Pita, A. et al., 2008. Rail infrastructure charges : how to
convert them into a tool for strengthening international high-performancerailway passenger services. In: Proceedings of the 8th World Congress onRailway Research (WCRR 2008), May, 2008. COEX, Seoul, Korea.
Sansom, T., Nash, C., Mackie, P., Shires, J. and Watkiss, P., 2001. Surface transportcosts and charges: Great Britain, 1998. Final report for the Department ofEnvironment, Locl Transport and the Regions. Institute for Transport Studies,University of Leeds, Leeds. Available at: /http://www.its.leeds.ac.uk/projects/STCC/downloads/SurfaceTransportCostsReport.pdfS.
Sauvant, A., 2008. Preparing for open access for high speed rail in France. Paperpresented at the UIC HIGHSPEED, 6th World Congress on High Speed Rail. FastTrack to Sustainable Mobility, Amsterdam.
Steer Davies Gleave - SDG, 2006. Air and rail competition and complementarity.Final Report. Prepared for European Commission DG TREN.
Wardman, M. and Murphy, P., 1999. Eurostar demand forecasting research.Technical Note 425, ITS, University of Leeds, Leeds.
Wheat, P., Smith, A., 2008. Assessing the marginal infrastructure maintenancewear and tear costs for Britain’s railway network. Journal of TransportEconomics and Policy 42 (Part 2), 189–224.