radiocesium derived from the fukushima daiichi nuclear power plant accident in seabed sediments:...
TRANSCRIPT

This is an Accepted Manuscript, which has been through the Royal Society of Chemistry peer review process and has been accepted for publication.
Accepted Manuscripts are published online shortly after acceptance, before technical editing, formatting and proof reading. Using this free service, authors can make their results available to the community, in citable form, before we publish the edited article. We will replace this Accepted Manuscript with the edited and formatted Advance Article as soon as it is available.
You can find more information about Accepted Manuscripts in the Information for Authors.
Please note that technical editing may introduce minor changes to the text and/or graphics, which may alter content. The journal’s standard Terms & Conditions and the Ethical guidelines still apply. In no event shall the Royal Society of Chemistry be held responsible for any errors or omissions in this Accepted Manuscript or any consequences arising from the use of any information it contains.
Accepted Manuscript
Environmental ScienceProcesses & Impacts
rsc.li/process-impacts
View Article OnlineView Journal
This article can be cited before page numbers have been issued, to do this please use: S. Otosaka and Y.
Kato, Environ. Sci.: Processes Impacts, 2014, DOI: 10.1039/C4EM00016A.
Environmental impact statement
The accident of TEPCO’s Fukushima Daiichi Nuclear Power Plant released large amounts of
radionuclides, especially radiocesium, to the environment and has still been affecting residents
in the vicinity of the plant. However, little measurement data associated with contaminated
seabed sediments at Fukushima has been published in open literature. Since the
accident-derived radiocesium in seabed sediments are expected to remain over a decadal scale,
continuous monitoring and accurate prediction are highly recommended. In this paper, the
distributional pattern of the initial deposition of radiocesium in the surrounding regions of the
plant is outlined, and primary processes accumulating radiocesium in the seabed are assessed
based on the inventory data. This paper provides helpful information in planning of effective
monitoring as well as in estimation of the impact of the accident on the marine ecosystem.
Page 1 of 32 Environmental Science: Processes & Impacts
Env
iron
men
talS
cien
ce:P
roce
sses
&Im
pact
sA
ccep
ted
Man
uscr
ipt
Publ
ishe
d on
17
Mar
ch 2
014.
Dow
nloa
ded
by N
atio
nal D
ong
Hw
a U
nive
rsity
Lib
rary
on
05/0
4/20
14 1
2:57
:31.
View Article OnlineDOI: 10.1039/C4EM00016A
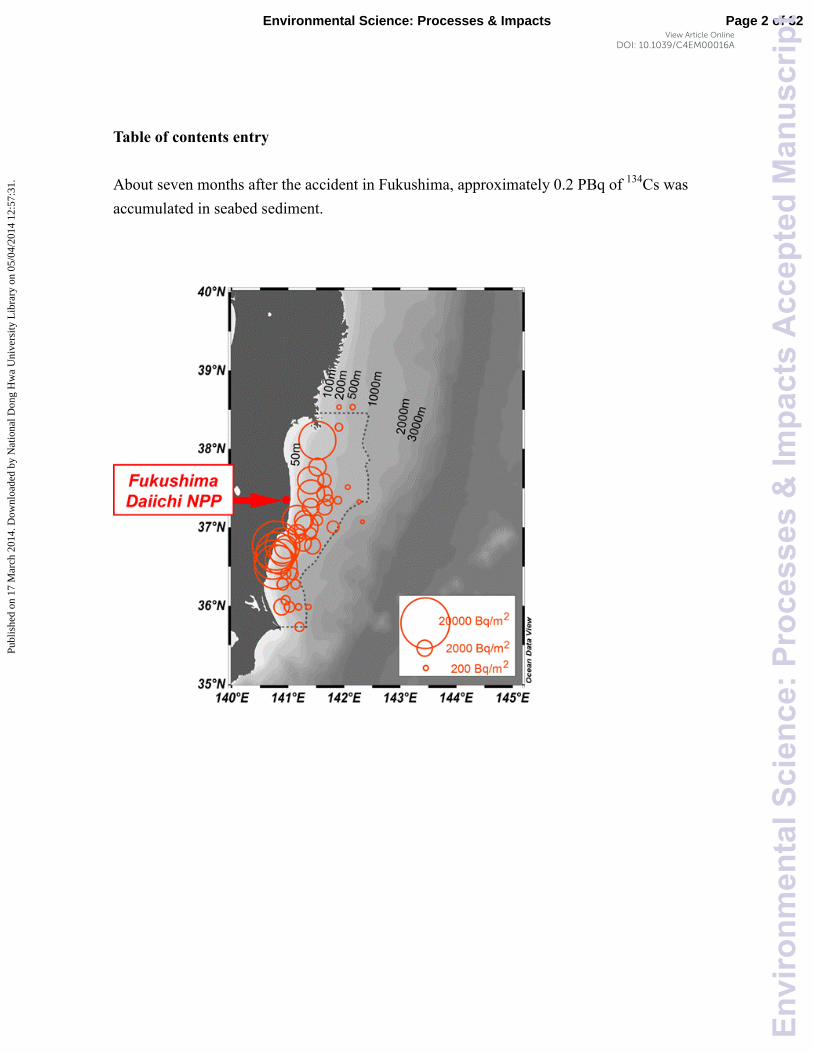
Table of contents entry
About seven months after the accident in Fukushima, approximately 0.2 PBq of 134
Cs was
accumulated in seabed sediment.
Page 2 of 32Environmental Science: Processes & Impacts
Env
iron
men
talS
cien
ce:P
roce
sses
&Im
pact
sA
ccep
ted
Man
uscr
ipt
Publ
ishe
d on
17
Mar
ch 2
014.
Dow
nloa
ded
by N
atio
nal D
ong
Hw
a U
nive
rsity
Lib
rary
on
05/0
4/20
14 1
2:57
:31.
View Article OnlineDOI: 10.1039/C4EM00016A
1
Radiocesium derived from the Fukushima Daiichi Nuclear Power Plant accident in seabed sediments: Initial 1
deposition and inventories. 2
3
Shigeyoshi Otosaka1,*, Yoshihisa Kato2 4
5
1Research Group for Environmental Sciences, Japan Atomic Energy Agency, Tokai-mura, Ibaraki 319-1195, 6
Japan 7
2School of Marine Science and Technology, Tokai University, Shimizu-ku, Shizuoka 424-8610, Japan 8
9
*Corresponding author: 10
Phone +81.29.282.5171; Facsimile +81.29.282.6760; E-mail [email protected] 11
12
13
14
Abstract 15
Since the accident of Fukushima Dai-ichi Nuclear Power Plant (1FNPP), significant levels of 16
anthropogenic radionuclides have been detected from seabed sediments off the east coast of Japan. In this 17
paper, the approximate amount of accident-derived radiocesium in seabed sediments off Fukushima, Miyagi 18
and Ibaraki prefectures was estimated from a sediment integration algorithm. As of October 2011, about 19
half year after the accident, the total amount of sedimentary 134Cs was 0.20±0.06 PBq (decay corrected to 20
March 11, 2011) and more than 90% of the radiocesium was accumulated in the regions shallower than 200 21
m depths. The large inventory in the coastal sediments was attributed to effective adsorption of dissolved 22
radiocesium onto suspended particles and directly to sediments in the early post-accidental stage. Although 23
rivers are also an important source to supply radiocesium to the coastal regions, this flux was much lower 24
than that of the above-mentioned process within half a year after the accident. 25
26
27
Page 3 of 32 Environmental Science: Processes & Impacts
Env
iron
men
talS
cien
ce:P
roce
sses
&Im
pact
sA
ccep
ted
Man
uscr
ipt
Publ
ishe
d on
17
Mar
ch 2
014.
Dow
nloa
ded
by N
atio
nal D
ong
Hw
a U
nive
rsity
Lib
rary
on
05/0
4/20
14 1
2:57
:31.
View Article OnlineDOI: 10.1039/C4EM00016A
2
1. Introduction 28
On March 11, 2011, the Great East Japan Earthquake and the associated tsunami triggered the TEPCO’s 29
Fukushima Daiichi Nuclear Power Plant (1FNPP) accident. The accident released large amounts of 30
radionuclides to the environment and has still been affecting residents in the vicinity of the plant. 31
Monitoring surveys of the marine environment in the early post-accident stage detected significant levels of 32
radionuclides from seawater and seabed sediments collected at 30~180 km from 1FNPP.1 Among the 33
radionuclides, two radioisotopes of cesium; 134Cs and 137Cs, have been major radionuclides that should be 34
monitored from a viewpoint of radiological dose assessment. While concentrations of radiocesium in 35
nearshore seawater decreased by two orders of magnitude within a year after the accident,2,3,4
those in seabed 36
sediments have not decreased remarkably.5,6 37
Two major mechanisms are known to affect the concentration of cesium in seabed sediments. One is 38
the electrostatically-controlled adsorption of cesium ions (Cs+) onto the surface of clay minerals7 or within 39
the interlayer which leads to inner sphere complexes.8 This mechanism occurs by contact of Cs
+ with clay 40
minerals. The second mechanism is the biological uptake of Cs+ into organisms and their subsequent 41
settling to the seabed.9-11
Otosaka and Kobayashi6 found that most of the accident-derived associated with 42
seabed sediments, and the characteristics are consistent with the low mobility of sedimentary radiocesium. 43
It is also indicated that the low mobility of sedimentary radiocesium correlates with elevated concentrations 44
of radiocesium in bottom-dwelling fishes near Fukushima.12-15 45
Since the accident-derived radiocesium in seabed sediments are thus expected to remain over a decadal 46
scale, continuous monitoring and accurate prediction are highly recommended. As the first step, it is 47
necessary to explain processes controlling the initial distribution of the radiocesium in seabed sediment and 48
the amount of the initial deposition. In order to estimate the inventory of sedimentary radiocesium, 49
concentrations of the radiocesium as well as the thickness that radiocesium penetrates into the sediment 50
needs to be understood. The upper 0-3 cm of seabed sediment is regarded as a reference layer to assess 51
radiological effects on the benthic ecosystem.16
Since the 1FNPP accident, much monitoring data of 52
sedimentary radiocesium have actually been obtained from this layer.5 These data are helpful to observe the 53
general distribution of radionuclides in the reference layer, but are sometimes inadequate to estimate the 54
amount of radionuclides in the sediment because a significant amount of radiocesium penetrates to the 55
deeper sedimentary layers. In this paper, an index to associate monitoring data with inventory of 56
sedimentary radiocesium is proposed, and the distributional pattern of the initial deposition of radiocesium in 57
the surrounding regions of 1FNPP is outlined. In addition, primary processes accumulating radiocesium in 58
the seabed are assessed based on the inventory data. 59
60
2. Methods 61
Page 4 of 32Environmental Science: Processes & Impacts
Env
iron
men
talS
cien
ce:P
roce
sses
&Im
pact
sA
ccep
ted
Man
uscr
ipt
Publ
ishe
d on
17
Mar
ch 2
014.
Dow
nloa
ded
by N
atio
nal D
ong
Hw
a U
nive
rsity
Lib
rary
on
05/0
4/20
14 1
2:57
:31.
View Article OnlineDOI: 10.1039/C4EM00016A
3
2.1 Data sources 62
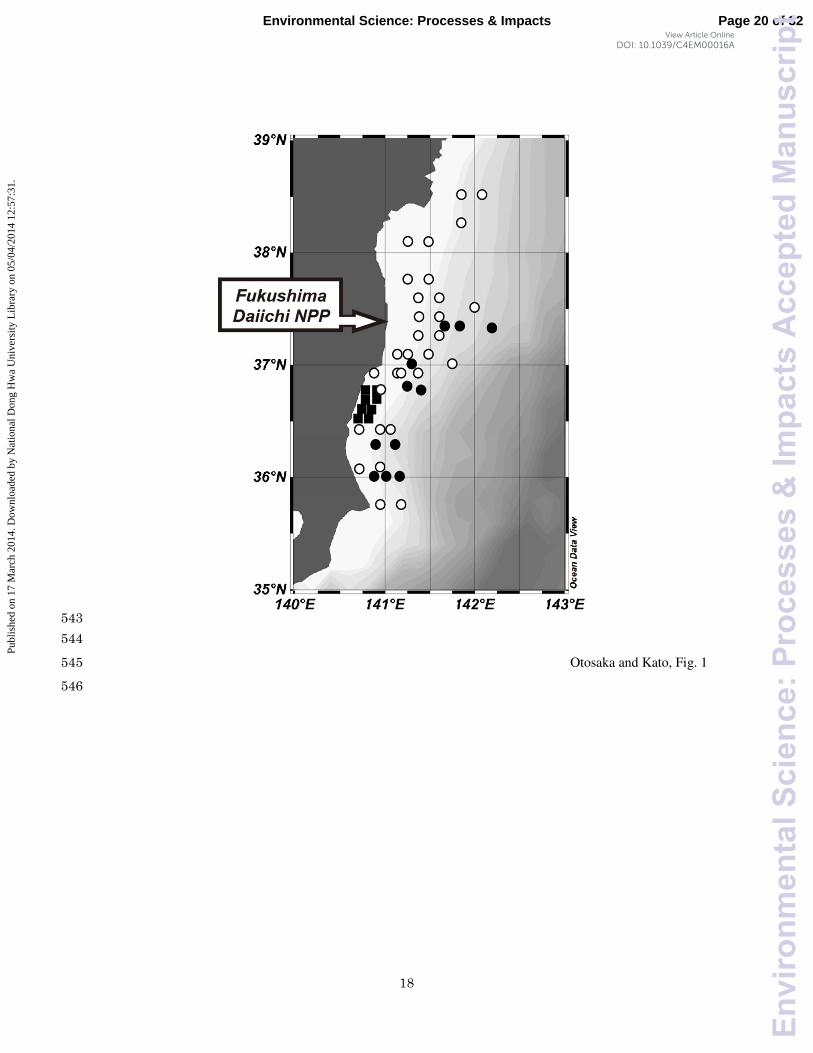
Cumulative inventories of radiocesium in seabed sediment were estimated from observation data 63
obtained at 44 stations (Table 1 and Fig. 1). The data consist of three datasets. Data from 13 stations 64
categorized as “A” in Table 1 were obtained by two sampling campaigns in August 2011 and 65
October/November 2011 (see subsection 2.2 for details). Since this dataset contains data obtained from 66
broad area of the study area (depth range: 105~1175 m) for 0~10 cm of sedimentary layers, and covers the 67
lack of monitoring data (category “C” data described below) for sedimentary layers below 3 cm. Seabed 68
sediments in the nearshore region (< 100 m depth) consist of coarse and fine sand.17 Because it is quite 69
difficult to observe accurate vertical profiles of the radionuclides in such sandy sediment, data on the 70
cumulative inventory of the radionuclides are quite limited. In this paper, we regarded cumulative 71
inventories obtained at seven coastal stations 70~110 km south from 1FNPP 6 as representative ones of 72
coastal regions (category “B” in Table 1). Data from the other 24 stations, categorized “C”, were obtained 73
from monitoring program by the Ministry of Education, Culture, Sports, Science and Technology, Japan and 74
compiled by Kusakabe et al.5 The category “C” dataset provides data only for upper 3 cm of the sediment. 75
Calculations of cumulative inventories of radiocesium are different for each data source. 76
77
2.2 Sampling 78
Sediment samples with category “A” stations were collected in R/V Tansei-Maru KT-11-27 cruise 79
(October-November 2011) and R/V Hakuho-Maru KH-11-07 cruise (August 2011) using a multiple corer. 80
Core samples (80 mm in diameter) were subsampled by cutting into 1 cm thickness sections on board the 81
ship and transferred to laboratories on land for the further processes. 82
83
2.3 Analysis of radiocesium and sediment properties 84
After being transferred to the laboratory on land, sediment samples were dried at 105°C, crushed, and 85
the coarse fractions were removed using a 2 mm sieve.16
Powdered sediment samples were filled and 86
sealed in a plastic container. 87
Specific gamma-rays of 134
Cs (604 and 795 keV) and 137
Cs (661 keV) were measured using a coaxial 88
Ge detector (ORTEC GEM20P4, 1.7 keV/1.33 MeV of resolution and 29~31% of relative efficiencies). 89
The 134
Cs/137
Cs counting ratio with the least contribution from summing effects was estimated by 90
measurement of a soil sample collected in Fukushima after the FDNPP accident at a distance (~20 cm) from 91
the detector. By comparing this ratio with that measured under the same conditions for the sample in 92
contact with the detector, the contribution due to cascade summing of 134Cs was then estimated for each 93
detectors used in this study, and corrected for all samples. Specific gamma-rays of 210
Pb (46.5 keV) and 94
214Pb (352 keV) were measured using a low-energy photon detector (ORTEC LOAx-51370/20P, 625 95
Page 5 of 32 Environmental Science: Processes & Impacts
Env
iron
men
talS
cien
ce:P
roce
sses
&Im
pact
sA
ccep
ted
Man
uscr
ipt
Publ
ishe
d on
17
Mar
ch 2
014.
Dow
nloa
ded
by N
atio
nal D
ong
Hw
a U
nive
rsity
Lib
rary
on
05/0
4/20
14 1
2:57
:31.
View Article OnlineDOI: 10.1039/C4EM00016A
4
keV/122 keV of resolution). Activities of the excess-210Pb (210Pbxs) were calculated by subtracting 214Pb 96
activities from the 210
Pb activities on the assumption that the supported 210
Pb from 226
Ra is equal to 214
Pb. 97
Gamma detectors were calibrated using standard material (MX033U8PP, Japan Radioisotope Association, 98
Tokyo). Under our analytical conditions (36,000~200,000 seconds counting), the lowest amount of 134Cs 99
and 137Cs that could be determined in a sediment sample was ~87 mBq and ~73 mBq, corresponding to ~5 100
Bq/kg and ~4 Bq/kg, respectively. 101
Concentrations of radiocesium reported in the following sections are represented as Bq/kg by dry 102
weight. For all sediment samples, water content and dry bulk density were measured with a given volume 103
of plastic tube. The organic matter content was determined by the loss of ignition method: the samples 104
were heated in a muffle furnace at 500°C for 24 hours. Size distribution of sediment was measured using a 105
laser diffraction particle size analyzer (Shimadzu SALD-2000J). 106
107
2.4 Data analysis 108
Since it is estimated that 137Cs was also discharged to the ocean by the 1FNPP accident with a uniform 109
134Cs/
137Cs activity ratio (0.99±0.03, as of March 11, 2011),
2 both
134Cs and
137Cs should be concerned. 110
Both radionuclides had been released to the environment by nuclear weapon testing, operation of spent 111
nuclear fuel reprocessing plants or accidents of nuclear facilities.18-20
At the time of the outbreak of 1FNPP 112
accident, slightly but significant amount of 137Cs (half-live: 30.1 years) originates from such past incidents 113
remained in seabed sediments near Fukushima, and 134
Cs (half-live: 2.06 years) was undetectable.5 In order 114
to estimate the amount of radiocesium derived from the 1FNPP accident in the seabed sediment, we report 115
data of 134
Cs as representative radiocesium with few influence of the other sources. 116
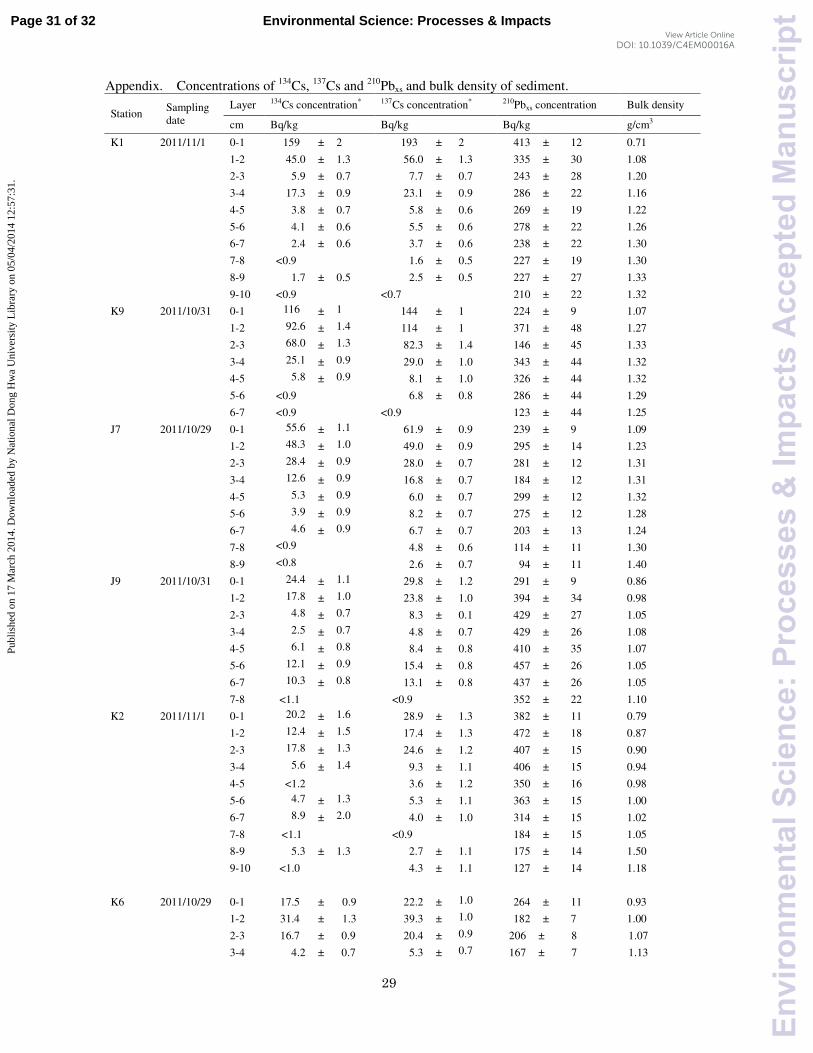
With regard to category “A” stations, inventory of sedimentary radiocesium in each sub-sample was 117
calculated by multiplying the radiocesium concentration with the bulk density (see Appendix). By 118
cumulating the radiocesium inventories to 10 cm layer, cumulative inventory of sedimentary radiocesium at 119
each station was estimated. Based on the inventory data, F0-3 values, defined as the proportion of 134
Cs 120
inventory in the upper 3 cm to the cumulative inventory in the sediment core, were estimated. 121
In this paper, activities data were normalized (decay-corrected) to March 11, 2011 to estimate the total 122
amount of sedimentary radiocesium from various data sources. 123
124
3. Results and discussion 125
3.1 Vertical distribution of radiocesium in sediment 126
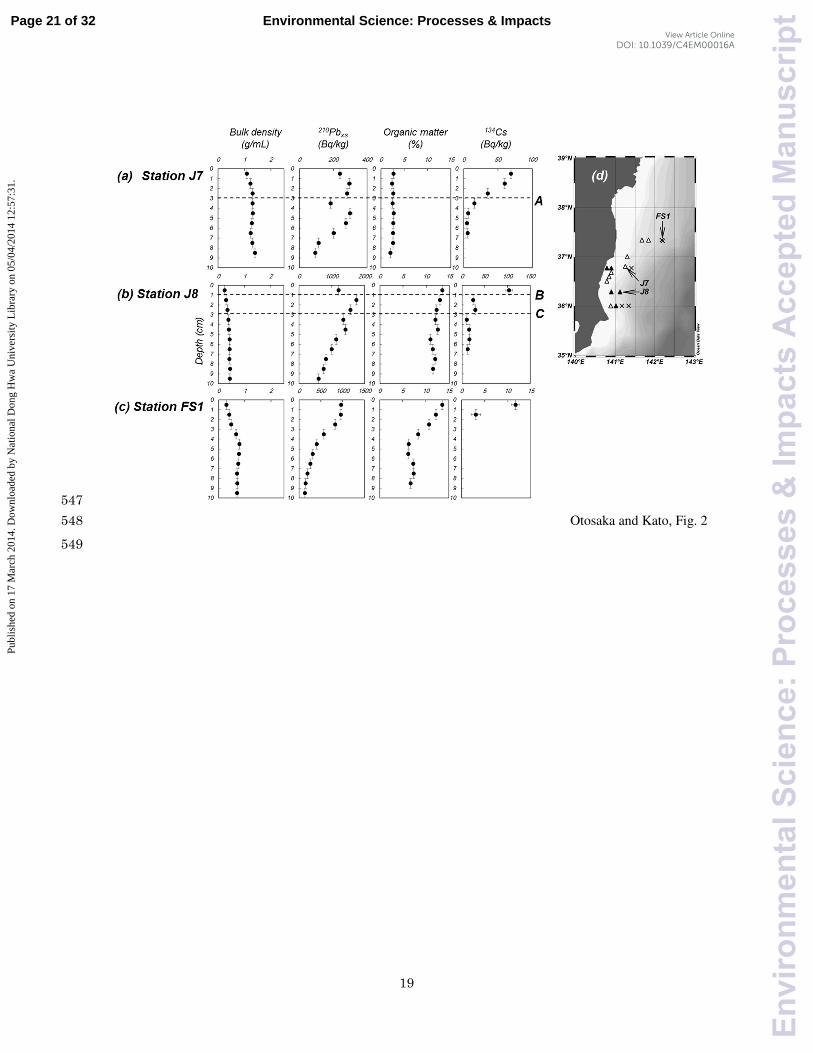
Vertical changes in 134Cs concentration and sediment properties (bulk density, 210Pbxs, and organic matter 127
content) at three representative stations (J7, J8 and FS1) are shown in Fig. 2 (a)~(c). Three patterns of the 128
134Cs profile were found in this study, and the lateral distribution of the three patterns is shown in Fig. 2 (d). 129
Page 6 of 32Environmental Science: Processes & Impacts
Env
iron
men
talS
cien
ce:P
roce
sses
&Im
pact
sA
ccep
ted
Man
uscr
ipt
Publ
ishe
d on
17
Mar
ch 2
014.
Dow
nloa
ded
by N
atio
nal D
ong
Hw
a U
nive
rsity
Lib
rary
on
05/0
4/20
14 1
2:57
:31.
View Article OnlineDOI: 10.1039/C4EM00016A
5
Sediment at Sta. J7 mainly consisted of sand (Table 1). A discontinuous surface of 210Pbxs was found at 130
3-4 cm layer (indicated “A” in Fig. 2(a)), and slightly lower content of manganese indicated reductive 131
characteristics of the layer. The 134Cs concentrations in sediment decreased exponentially with increasing 132
depth, and most of 134Cs was accumulated between the surface and the boundary layer. Sediments 133
characterized by such profiles (categorized as Pattern I) distributed over a wide area of this study (Fig. 2(d)). 134
It can be considered that the boundary layer was formed by the earthquake and the following tsunami in 135
March 2011, and accident-radiocesium was permeated into the upper layers of the boundary. 136
In Sta J8, at least two boundaries were found and significant 134Cs concentrations were distributed across 137
the boundaries (Fig. 2(b)). This characteristics of 134
Cs profile, categorized as “Pattern II”, was observed at 138
stations located the south of 1FNPP (Fig. 2(d)). A significant accumulation of anthropogenic heavy metals, 139
such as zinc, was observed near the lower boundary layer (indicated “C” in Fig. 2(b)). It is likely that the 140
“C” layer is also attributable to the earthquake and tsunami, and 134Cs was diffused to the deeper layers of the 141
sediment in the early post-accident stage. Large earthquake and the following tsunami caused high 142
turbulence in the water on the seafloor. The median diameter of surface sediment at this station was 40 µm. 143
Even if we assume a calm condition (slowest sinking) and general hydrographical parameters,21
estimated 144
sinking rates would be in the order of 10-4 m/s. Therefore, if the fine particles were resuspended in the 145
bottom waters, it would take several days to weeks to resettle to the seabed. This timescale is sufficient for 146
the accident-derived radionuclides to adsorb onto the suspended particles in the water column. 147
In Sta. FS1, no disturbance of the sedimentary layer was observed (Pattern III). Such a characteristic 148
was found in the offshore regions, and all of 134Cs was accumulated in the upper 3 cm layers (Fig. 2(c)). In 149
the offshore stations, 134
Cs would be supplied into the sedimentary layers across the sediment-water interface 150
and diffused to the deeper layers of the sediment. 151
In this study, almost all of the accident-derived radiocesium was observed in the layers upper 10 cm. 152
Although significant concentrations of 134Cs were detected at 10 cm layers at Sta. K2, the proportion of 134Cs 153
below the 10 cm layers is expected to less than 5% of the total 134
Cs inventory in the station. In the 154
following subsections, we estimate a total amount of 134Cs in sediment by integrating 134Cs inventory from 155
the surface to 10 cm layers. 156
Relationship between F0-3 values and bottom depth is shown in Fig. 3. The F0-3 values were less than 157
0.5 in the nearshore regions (<100 m depth), indicating that more than half of the radiocesium was 158
accumulated into sedimentary layer deeper than 3 cm. 159
F0-3 values in the offshore (water depth: 100~400 m) and hemiplegic (>400m) regions ranged 0.78±0.16 160
and 0.93±0.14, respectively. Although the F0-3 values generally increased toward offshore regions, a 161
proportion of radiocesium was accumulated in the deeper layers of sediment. It is difficult to simplify F0-3 162
values with a specific parameter because the value is controlled by various factors such as bulk density of 163
Page 7 of 32 Environmental Science: Processes & Impacts
Env
iron
men
talS
cien
ce:P
roce
sses
&Im
pact
sA
ccep
ted
Man
uscr
ipt
Publ
ishe
d on
17
Mar
ch 2
014.
Dow
nloa
ded
by N
atio
nal D
ong
Hw
a U
nive
rsity
Lib
rary
on
05/0
4/20
14 1
2:57
:31.
View Article OnlineDOI: 10.1039/C4EM00016A

6
sediment, radiocesium concentration in the bottom water, bottom current, and bioturbation. As mentioned 164
above, the F0-3 values are also affected by sedimentary processes attributable to the earthquake and tsunami. 165
Nevertheless, at least for the nearshore and offshore regions in this study area, results in Fig. 3 indicate that 166
representative F0-3 values can be applied to obtain an inventory of sedimentary radiocesium. 167
168
3.2 Lateral distribution of radiocesium inventory in seabed sediment 169
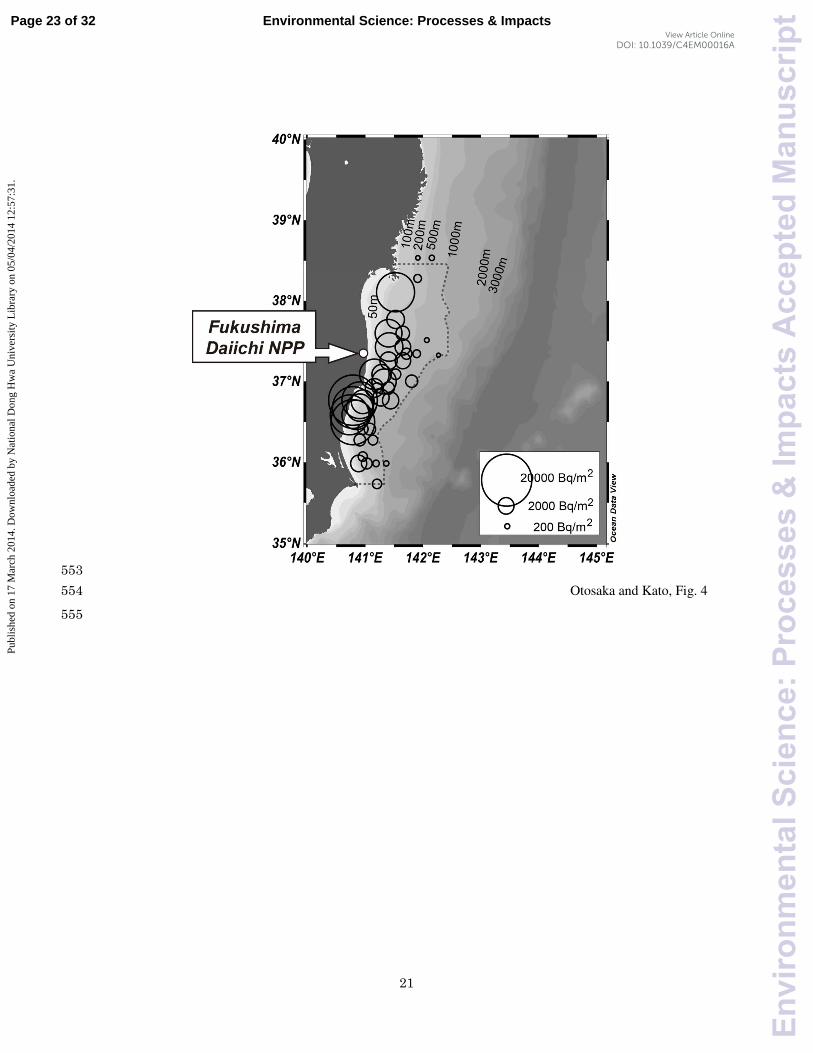
Estimated 134Cs inventories in the seabed sediment observed in October and November 2011 are shown 170
in Table 1 and Fig. 4. As described in the subsection 2.2, data shown in this figure consists of three groups. 171
Within the three groups, data from Otosaka and Kobayashi,6 categorized as “B” in Table 1, are
134Cs 172
inventories accumulated to the 10 cm sedimentary layer. Since radiocesium penetrates to more than 10 cm 173
depths in the nearshore sediments, these data might be an underestimate of the “total” inventories. Data 174
obtained from 24 stations, categorized as “C” in Table 1, are estimated with the following equation (1). 175
176
I = C0-3 × δ / F0-3 , (1) 177
178
where, I is the cumulative 134
Cs inventory in sediment (Bq/m2), C0-3 is the
134Cs concentration in upper 3 cm 179
layer (Bq/kg), and δ is the dry bulk density (kg/L).5 As shown in Fig. 3, radiocesium permeates into the 180
deeper layers of the coastal sediment, and this enhances uncertainty of F0-3 values. We thus did not include 181
monitoring data at the nearshore (<100 m) stations in the category “C” dataset although much data had been 182
obtained from the coastal region.5 183
As uncertainty of F0-3 values is determined as the 95% confident interval, uncertainties of 134Cs inventory 184
for category “C” data propagate to ±30%. Uncertainties of cumulative 134
Cs inventory for “A” and “B” 185
categories, less than ±10%, are smaller than those of category “C” data. Although it would be inappropriate 186
to summarize datasets with different data qualities, all data are summarized in Fig. 4 in order to overview the 187
distribution of 134
Cs inventories in the study area. 188
Fig. 4 clearly shows that inventories of 134Cs are remarkably higher in the coastal and nearshore regions 189
at the latitudinal range between 35°40’ N and 38°30’ N. In this region, the Tsugaru Warm Current flows 190
southward and the Kuroshio Current flows northward along the coast.22,23 Both currents merge and flow 191
eastward around 36°N~38°N. At least in the surface waters, contaminated seawater affected by 1FNPP 192
hardly flows southward across 38°N.24 Distribution of 134Cs inventories in seabed sediment (Fig. 4) showed 193
a similar pattern to the simulation result of radiocesium-contained seawater at the early post-accident 194
stage.25-27 From these results, it can be considered that 134Cs deposition to sediment associates with 195
transport of contaminated seawater from 1FNPP. 196
In Figs. 5 (a) and (b), cumulative 134Cs inventories in seabed sediment between 35°40’ N and 38°30’ N 197
Page 8 of 32Environmental Science: Processes & Impacts
Env
iron
men
talS
cien
ce:P
roce
sses
&Im
pact
sA
ccep
ted
Man
uscr
ipt
Publ
ishe
d on
17
Mar
ch 2
014.
Dow
nloa
ded
by N
atio
nal D
ong
Hw
a U
nive
rsity
Lib
rary
on
05/0
4/20
14 1
2:57
:31.
View Article OnlineDOI: 10.1039/C4EM00016A
7
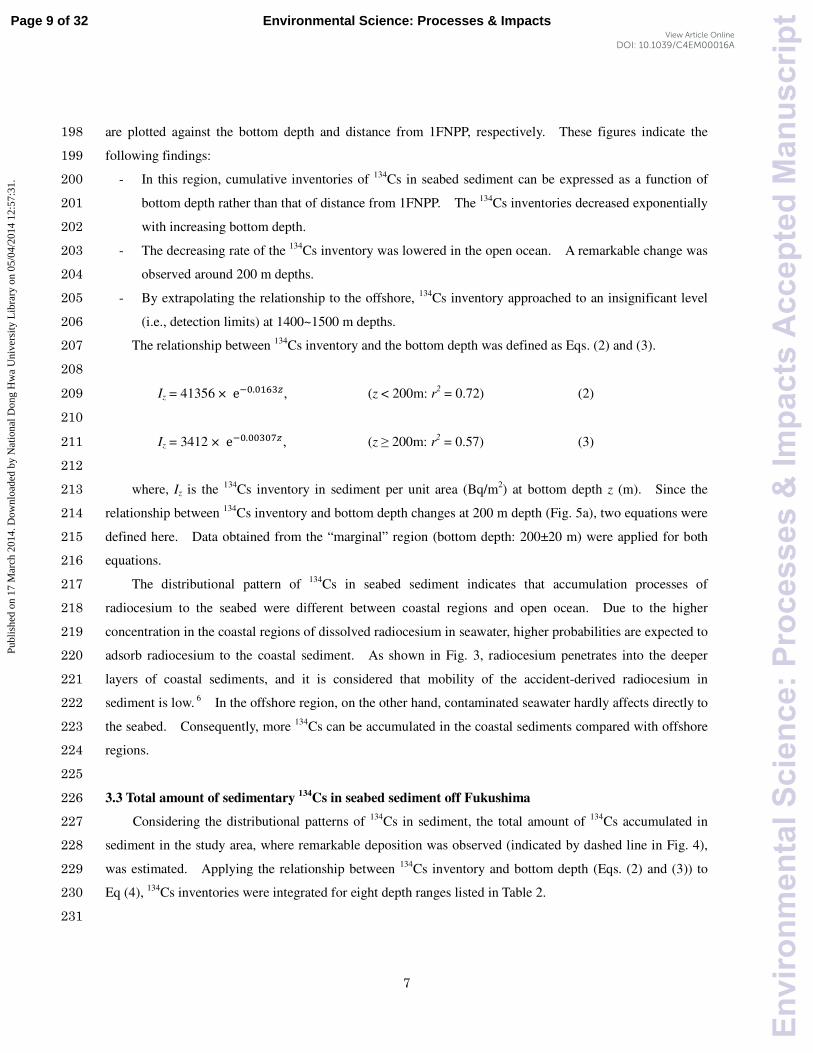
are plotted against the bottom depth and distance from 1FNPP, respectively. These figures indicate the 198
following findings: 199
- In this region, cumulative inventories of 134Cs in seabed sediment can be expressed as a function of 200
bottom depth rather than that of distance from 1FNPP. The 134Cs inventories decreased exponentially 201
with increasing bottom depth. 202
- The decreasing rate of the 134
Cs inventory was lowered in the open ocean. A remarkable change was 203
observed around 200 m depths. 204
- By extrapolating the relationship to the offshore, 134Cs inventory approached to an insignificant level 205
(i.e., detection limits) at 1400~1500 m depths. 206
The relationship between 134Cs inventory and the bottom depth was defined as Eqs. (2) and (3). 207
208
Iz = 41356 × e��.�����, (z < 200m: r2 = 0.72) (2) 209
210
Iz = 3412 × e��.����� , (z ≥ 200m: r2 = 0.57) (3) 211
212
where, Iz is the 134
Cs inventory in sediment per unit area (Bq/m2) at bottom depth z (m). Since the 213
relationship between 134Cs inventory and bottom depth changes at 200 m depth (Fig. 5a), two equations were 214
defined here. Data obtained from the “marginal” region (bottom depth: 200±20 m) were applied for both 215
equations. 216
The distributional pattern of 134
Cs in seabed sediment indicates that accumulation processes of 217
radiocesium to the seabed were different between coastal regions and open ocean. Due to the higher 218
concentration in the coastal regions of dissolved radiocesium in seawater, higher probabilities are expected to 219
adsorb radiocesium to the coastal sediment. As shown in Fig. 3, radiocesium penetrates into the deeper 220
layers of coastal sediments, and it is considered that mobility of the accident-derived radiocesium in 221
sediment is low. 6 In the offshore region, on the other hand, contaminated seawater hardly affects directly to 222
the seabed. Consequently, more 134
Cs can be accumulated in the coastal sediments compared with offshore 223
regions. 224
225
3.3 Total amount of sedimentary 134
Cs in seabed sediment off Fukushima 226
Considering the distributional patterns of 134
Cs in sediment, the total amount of 134
Cs accumulated in 227
sediment in the study area, where remarkable deposition was observed (indicated by dashed line in Fig. 4), 228
was estimated. Applying the relationship between 134
Cs inventory and bottom depth (Eqs. (2) and (3)) to 229
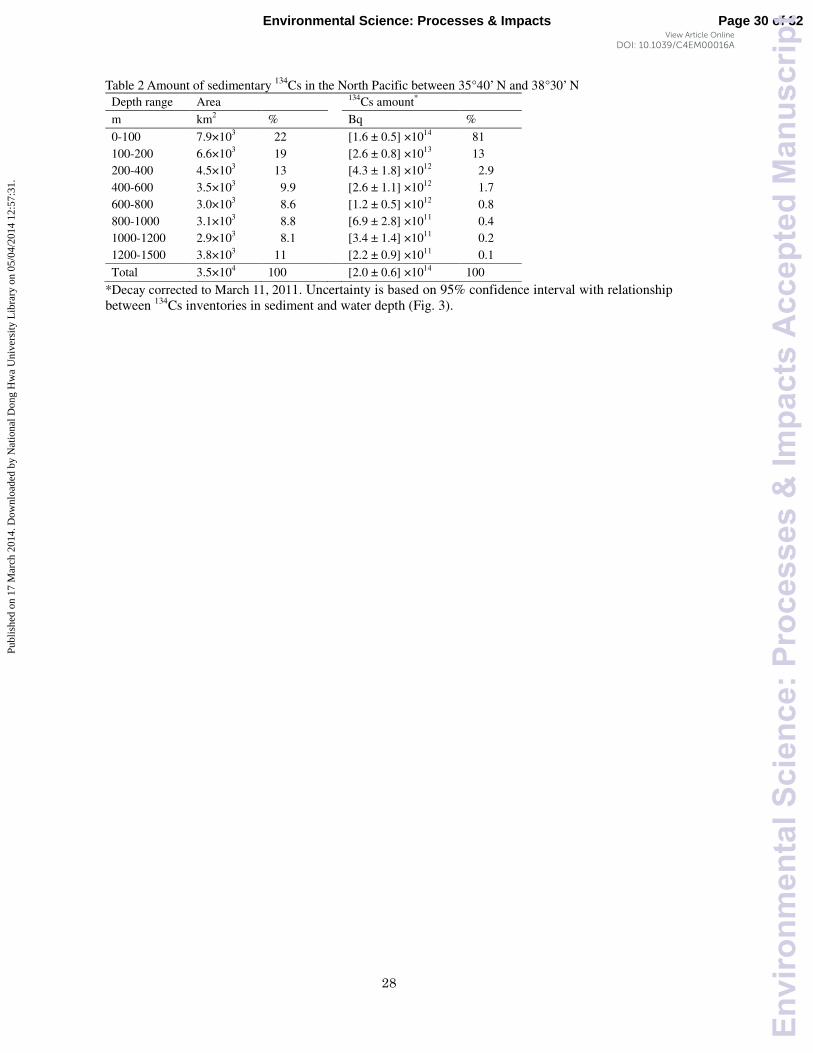
Eq (4), 134Cs inventories were integrated for eight depth ranges listed in Table 2. 230
231
Page 9 of 32 Environmental Science: Processes & Impacts
Env
iron
men
talS
cien
ce:P
roce
sses
&Im
pact
sA
ccep
ted
Man
uscr
ipt
Publ
ishe
d on
17
Mar
ch 2
014.
Dow
nloa
ded
by N
atio
nal D
ong
Hw
a U
nive
rsity
Lib
rary
on
05/0
4/20
14 1
2:57
:31.
View Article OnlineDOI: 10.1039/C4EM00016A

8
Ia-b = �( ��)
� ������
. (4) 232
233
Ia-b (Bq/m2) is the mean 134Cs inventory per unit area at a depth range between a (m) and b (m). 234
Amount of 134
Cs in each depth range (Bq) was calculated by multiplying Ia-b by the bottom area of the 235
corresponding depth range. As topography data, the 1 minute Gridded Global Relief Data (ETOPO2v2) 28 236
were used here. The sum of 134
Cs amounts at the eight depth ranges was regarded as the total 134
Cs 237
inventory in seabed sediment in the study area. 238
This estimation does not include data in the area within a 20 km radius from 1FNPP due to restriction of 239
entrance for research vessels into the area in the early post-accidental stage. From observations in October 240
2011, TEPCO reported that concentration 134
Cs in seabed sediments within 20 km radius ranged between 9 241
and 918 Bq/kg-wet (194 Bq/kg-wet in average; n=10)29. Applying a conversion factor from wet- to 242
dry-based concentration for this region (1.4), 30
the averaged 134
Cs in sediment is calculated to be 271 243
Bq/kg-dry. This concentration is about twice as those at coastal stations listed in Table 1 (119 Bq/kg in 244
average, n=7). Sea area within the 20 km radius from 1FNPP (6.3×10⁸ m
2) corresponds to 1.8% of the total 245
area in Table 2 (3.5×10¹⁰ m2). Accordingly, the seabed sediments within the 20 km radius may raise total 246
134Cs amount by 4%. Although TEPCO also reported that more than 2000 Bq/kg-wet of
134Cs was detected 247
from seabed sediment adjacent to 1FNPP (< 1km from the facility),31 the area is quite limited. 248
High-resolution observations, carried out within 20 km radius from 1FNPP using an in-situ gamma detector, 249
found that such a high concentrations of radiocesium is unevenly distributed with the size between several 250
and tens of meters.32,33
Because the expected increase of 134
Cs amount is much smaller than uncertainty of 251
134Cs inventories estimated by Eqs. (2) and (3), we applied them for all areas including the area within the 20 252
km radius. 253
The total 134Cs amount in sediment was estimated to be 2.0±0.6×10¹⁴ Bq (Table 2). It is estimated that 254
[3.5~3.6]×1015
Bq of 137
Cs was discharged directly from the 1FNPP facility to the ocean.25,26
Kobayashi et 255
al.35 estimated that the cumulative deposition of 137Cs from the atmosphere to the ocean surface between 256
March and July 2011 was 7.4×10¹⁵ Bq. Since 134Cs/137Cs released by the accident is about 1.0 (as of March 257
11, 2011),2 initial supply of
134Cs to the North Pacific is calculated to be 11×10
15 Bq. From these results, 258
about 2% of the initial supply of 134Cs to the ocean is accumulated in the seafloor. 259
Ito et al.35
estimated that the amount of sedimentary 137
Cs in the Japan Sea (a marginal sea in the 260
western North Pacific) consists of 3.8% of the total amount of 137Cs (including dissolved and sedimentary 261
137Cs) in the sea. Most of the
137Cs was supplied by global fallout and the following lateral transport 262
between 1950s and 2000s. Although the spatial and temporal scales are different from the 1FNPP’s case, it 263
is reasonable that several % of radiocesium is accumulated to the seafloor. 264
265
Page 10 of 32Environmental Science: Processes & Impacts
Env
iron
men
talS
cien
ce:P
roce
sses
&Im
pact
sA
ccep
ted
Man
uscr
ipt
Publ
ishe
d on
17
Mar
ch 2
014.
Dow
nloa
ded
by N
atio
nal D
ong
Hw
a U
nive
rsity
Lib
rary
on
05/0
4/20
14 1
2:57
:31.
View Article OnlineDOI: 10.1039/C4EM00016A
9
3.4 Accumulation processes of radiocesium to sediment in the coastal region 266
Results in Table 2 also indicate that more than 90% of sedimentary 134
Cs is accumulated on the coastal 267
region (<200 m). The accumulation of 134Cs was remarkable especially in the nearshore (<100 m) regions. 268
In order to understand the dominant factors controlling the initial deposition of radiocesium to the seabed, it 269
is important to outline the accumulation processes in the coastal regions. In the following subsections, 270
potential amounts of 134
Cs supplied to the coastal sediment are estimated for three dominant processes as 271
follows: (1) riverine input of radiocesium; (2) biological uptake and sinking to the seabed, (3) adsorption of 272
dissolved radiocesium onto the surface of suspended particles/sediment. The integration period for the 273
estimation is from March 23 (the day when the first significant concentration of accident-derived 274
radionuclides was observed from seawater) to October 31, 2011. 275
276
3.4.1 Riverine input of radiocesium 277
Compared to a saltwater system, accumulation of radiocesium in particulate materials is more efficient 278
in a freshwater system.36 Unfortunately, little is known about radiocesium concentration in the suspended 279
materials in river water at the post-accident stage of the 1FNPP accident. In addition, for most rivers 280
flowing into this study area, stations used for observations of the flow rates as well as water levels had not 281
been operating due to the damage from the tsunami that occurred on March 11, 2011. 282
Yamaguchi et al.37 compiled monitoring data of radiocesium in soil, and estimated that 1.5 PBq of 134Cs 283
was accumulated on land within 80 km radius from 1FNPP until July, 2011. By time-series observations of 284
at contaminated watersheds in Fukushima, it was estimated that ~0.5% of the accident-derived radiocesium 285
in the watersheds was discharged during 2011.38
From these parameters, the amount of 134
Cs supplied from 286
rivers to the Pacific coast until the end of October 2011 is calculated to be 7.5×10¹² Bq (Fig. 6). This 287
amount is much smaller than amount of sedimentary 134
Cs in the coastal region (<200 m: 1.9±0.6×10¹⁴
Bq, 288
Table 2). In general, radiocesium supplied in a watershed is accumulated in the riverbed,39 and the riverine 289
transport of radiocesium to estuaries mainly occurs during flood events.38,40
Typhoon “Roke” in 290
September 2011 actually induced a large suspended flux to the study area, but no significant increase of 291
radiocesium inventories in coastal sediment was observed.6 This result indicates that such a sporadic 292
supply of suspended 134Cs within half a year after the accident was smaller than the above-mentioned 293
estimation. However, continuous monitoring of the riverine input of radiocesium to the coastal regions is 294
highly recommended considering that watersheds in the surrounding regions of 1FNPP accumulated high 295
levels of radiocesium. 296
297
3.4.2 Biological uptake of radiocesium and sinking to the seabed 298
A significant levels of the accident-derived radiocesium was detected from lower trophic levels of 299
Page 11 of 32 Environmental Science: Processes & Impacts
Env
iron
men
talS
cien
ce:P
roce
sses
&Im
pact
sA
ccep
ted
Man
uscr
ipt
Publ
ishe
d on
17
Mar
ch 2
014.
Dow
nloa
ded
by N
atio
nal D
ong
Hw
a U
nive
rsity
Lib
rary
on
05/0
4/20
14 1
2:57
:31.
View Article OnlineDOI: 10.1039/C4EM00016A

10
marine biota such as zooplankton.25,41 It is well known that such biogenic materials are considered as a 300
carrier of the radionuclides.9-11
301
Concentration factors (CF), the relative concentration in biota to that of the ambient seawater, is widely 302
used as a parameter in modeling interactions between the living organisms and seawater of an 303
element/nuclides. By using a recommended CF values (100 L/Kg for Cs)18 and 134Cs concentration in 304
seawater, 134
Cs concentration in biogenic particles under equilibrium conditions can be estimated. As 305
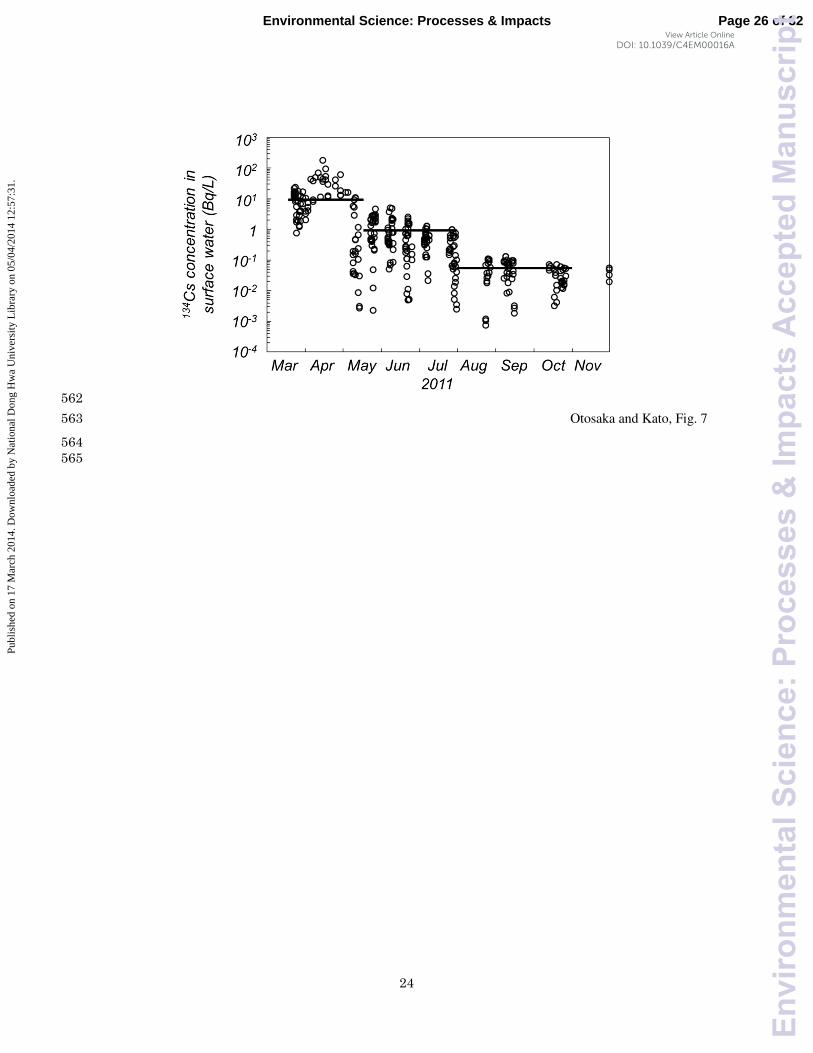
shown in Fig. 7, 134Cs concentrations in surface seawater decreased with time,4 and an averaged 306
concentration of the 134Cs concentration between March and October 2011 within 100 km radius from 307
1FNPP was about 3 Bq/L. As the recommended CF value is based on wet weight of organisms or particles, 308
considering the water content of the materials (c.a. 90%) 42,43, averaged 134Cs concentration of biogenic 309
particles is estimated to be 2,800 Bq/kg by dry weight. 310
An annual mean mass flux of sinking particles observed by a sediment trap experiment carried out from 311
August 2011 to July 2012 at Sta. K8 is 0.5 g/m2/d (observed at 100 m above the bottom: Otosaka, 312
unpublished data). As a 210Pb-based mass accumulation rate at coastal stations (Stas. J7, J9, K1 and K9) 313
was about 1~15 times higher than the offshore station K8, the mass flux in the coastal regions is estimated to 314
be ~7.5 g/m2/d. Assuming that 80% of sinking particles consists of biogenic materials,44 the downward flux 315
of the biogenic particles is calculated to be ~6.0 g/m2/day. 316
From these parameters and the area of the coastal region, 1.5×10¹⁰ m2 (<200 m depth, Table 2), 317
cumulative amount of 134
Cs supplied to the coastal seafloor by sinking biogenic particles until the end of 318
October 2011 is calculated to be ~6×10¹³ Bq (Fig. 6). This amount is approximately equivalent to 35% of 319
the amount of sedimentary 134
Cs in the coastal region. It can be concluded that sinking of biogenic particles 320
is a minor mechanism to accumulate radiocesium to the coastal seafloor. 321
322
3.4.3 Adsorption of dissolved radiocesium to suspended particles and seabed sediment 323
Concentrations of radiocesium in seawater increased in the three months after the accident, and 324
decreased by two orders of magnitude in the next three months (Fig. 7). In these periods, radiocesium 325
concentrations in the seabed sediment also increased over three orders of magnitude, but decreased only one 326
order.5,6 These results indicate that, although surface waters actually have direct affected on the seabed, a 327
seawater-sediment equivalent of radiocesium has not been established in half a year after the accident. 328
Nevertheless, in a closed system, seawater-sediment equivalent of radiocesium can be established within 329
several days,45
and desorption of radiocesium from sediment is quite slow. 6
Contacting of the bottom 330
waters with the seabed sediments over in half a year after the accident can lead to efficient adsorption of 331
radiocesium to the sediment. 332
As described in subsection 3.1, sediment surface was disturbed by tsunami and a large amount of 333
Page 12 of 32Environmental Science: Processes & Impacts
Env
iron
men
talS
cien
ce:P
roce
sses
&Im
pact
sA
ccep
ted
Man
uscr
ipt
Publ
ishe
d on
17
Mar
ch 2
014.
Dow
nloa
ded
by N
atio
nal D
ong
Hw
a U
nive
rsity
Lib
rary
on
05/0
4/20
14 1
2:57
:31.
View Article OnlineDOI: 10.1039/C4EM00016A

11
suspended particles existed in the coastal region over a few months after March 11, 2011. Repeated 334
aftershocks would affect on the redistribution of the sediments. We therefore can consider that these 335
processes also enhanced particle-seawater interactions and accumulation of radiocesium in the seabed 336
sediment. 337
For the estimation the amount of adsorption of 134Cs onto seabed, the following scenarios controlling 338
initial deposition of radiocesium to the seabed can be assumed; 339
- An equilibrium between the bottom water and seabed sediment was established through the 340
sediment-water interface, 341
- An equilibrium between the contaminated seawater and suspended particles was also established and 342
the suspended particles settled to the seabed, and 343
- Both processes accumulated 134
Cs in sedimentary layer with 1 cm in thickness. 344
Based on these assumptions, potential amount of 134Cs deposition is estimated using typical parameters 345
such as, distribution coefficient (Kd) between sediment and seawater (3,500 L/kg)18
, and bulk density of 346
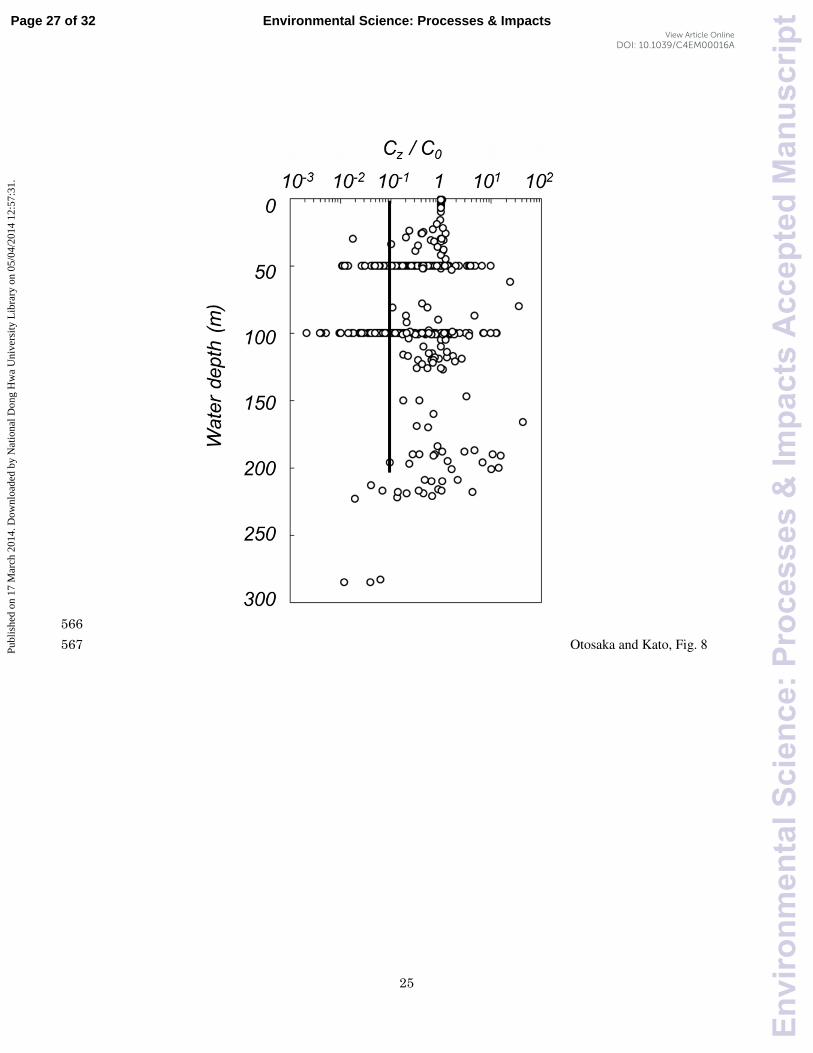
sediment (0.5~1.5 kg/L: Appendix). Concentration of 134Cs in the bottom water was calculated by the 134Cs 347
concentration in the surface water (Fig. 7) and Cz/C0 values (Fig. 8). The Cz/C0 is defined as a ratio of 134
Cs 348
concentration in seawater at water depth z (m) to that in the surface water, and the values were about 1 in the 349
coastal waters (<200m depth: Fig.8). We here adopted 0.1 as Cz/C0 with a lower estimation, and obtained 350
0.3 Bq/L as an averaged 134Cs concentration in the bottom water. 351
Estimated amount of 134
Cs accumulation per unit area of sediment ranges 5.2×10³ and 1.6×10
4 Bq/m
2. 352
As the area of the coastal region (<200 m depth) is 1.5×10¹⁰ m2 (Table 2), the total amount of 134Cs supplied 353
by this process is estimated to be 8×10¹³
~ 2×10¹⁴
Bq (Fig. 6). It is reported that processes such as diffusion 354
of bottom water across the seawater-sediment interface, bioturbation, and turbulence of the sediment surface 355
can accumulate radionuclides in the middle layers (~10 cm) of sediment.46-48
Therefore, the total amount 356
estimated here might be underestimated. Nevertheless, this amount adequately supports the total inventory 357
in the coastal region (Table 2: 1.9×10¹⁴
Bq), and this process is a more reasonable process to accumulate 358
radiocesium to the seabed. 359
360
5. Summary 361
With respect to radiocesium released by the accident of 1FNPP, distributional patterns and their 362
accumulation processes in the surrounding region of the plant are summarized as follows; 363
Sedimentation of the accident-derived radiocesium mainly occurred in the region off Fukushima, 364
Miyagi and Ibaraki prefectures (35.7°N~38.5°N). As of November 2011, 0.2 PBq of 134Cs, corresponding 365
to about 2% of the accident-derived 134
Cs discharged to the marine environment, was accumulated in the 366
seabed sediment. 367
Page 13 of 32 Environmental Science: Processes & Impacts
Env
iron
men
talS
cien
ce:P
roce
sses
&Im
pact
sA
ccep
ted
Man
uscr
ipt
Publ
ishe
d on
17
Mar
ch 2
014.
Dow
nloa
ded
by N
atio
nal D
ong
Hw
a U
nive
rsity
Lib
rary
on
05/0
4/20
14 1
2:57
:31.
View Article OnlineDOI: 10.1039/C4EM00016A

12
More than 90% of the sedimentary radiocesium was accumulated in the coastal regions with water 368
depth shallower than 200 m depth. It can be inferred that the primary process that derived the preferential 369
accumulation of radiocesium to the coastal seafloor was adsorption of dissolved radiocesium to suspended 370
particles or the sediment surface. This process is attributable to advection of contaminated seawater near 371
the seabed of the regions during the post-accident stage within half a year after the accident. 372
Although downward transport of particulate radiocesium by biogenic particles seems to be a minor 373
process in the coastal region, it might play a significant role in the offshore region. Remineralization and/or 374
lateral transport of sedimentary radiocesium will become primary processes in redistributing of the 375
radiocesium in the future. 376
As a process accumulating radiocesium to the seabed in the coastal regions, supply of radiocesium 377
through rivers would not be significant at least in the post accidental stage. Nevertheless, continuous 378
monitoring of the land-sea fluxes of radiocesium is highly recommended. 379
380
Acknowledgements 381
Field supports were provided by captains, crews and researchers of R/V Hakuho-maru KH11-07, R/V 382
Tansei-maru KT-11-27 cruises. This investigation benefited enormously and was vastly improved through 383
discussions with Drs. T. Gamo, M. Uematsu, H. Obata, J. Nishikawa (Univ of Tokyo), S. Igarashi 384
(Fukushima pref.), M. Ikeda (Hokkaido Univ.), J. Kanda (Tokyo Univ. Mar. Sci. Technol.), H. Narita (Tokai 385
Univ.), J. Zhang, K. Horikawa (Univ. of Toyama), S. Nagao (Kanazawa Univ.), M. Aoyama (MRI., Japan) T. 386
Kobayashi, H. Kawamura and T. Suzuki (JAEA). We are also grateful to the two anonymous reviewers for 387
their constructive and helpful comments. This work was partially supported by Grant-in-Aid for Scientific 388
Research on Innovative Areas (#24110004) to YK. 389
390
391
Page 14 of 32Environmental Science: Processes & Impacts
Env
iron
men
talS
cien
ce:P
roce
sses
&Im
pact
sA
ccep
ted
Man
uscr
ipt
Publ
ishe
d on
17
Mar
ch 2
014.
Dow
nloa
ded
by N
atio
nal D
ong
Hw
a U
nive
rsity
Lib
rary
on
05/0
4/20
14 1
2:57
:31.
View Article OnlineDOI: 10.1039/C4EM00016A

13
References 392
1. MEXT (Ministry of Education, Culture, Sports, Science and Technology, Japan). 2011a. 393
http://radioactivity.nsr.go.jp/ja/contents/4000/3857/24/1305744_0527.pdf 394
2. K.O. Buesseler, Impacts of the Fukushima Nuclear Power Plants on marine radioactivity. 395
Environmental Science and Technology, 2011, 45, 9931-9935. 396
3. M. Aoyama, D. Tsumune, M. Uematsu, F. Kondo, Y. Hamajima. Temporal variation of 134
Cs and 137
Cs 397
activities in surface water at stations along the coastline near the Fukushima Dai-ichi Nuclear Power 398
Plant accident site, Japan. Geochem. J., 2012, 46, 321-325. 399
4. S. Oikawa, H. Takata, T. Watabe, J. Misonoo, M. Kusakabe. Distribution of the Fukushima-derived 400
radionuclides in seawater in the Pacific off the coast of Miyagi, Fukushima, and Ibaraki Prefectures, 401
Japan, Biogeosci., 2013, 10, 5031-5047. 402
5. M. Kusakabe, S. Oikawa, H. Takata, J. Misonoo. Spatiotemporal distributions of Fukushima-derived 403
radionuclides in surface sediments in the waters off Miyagi, Fukushima, and Ibaraki Prefectures, Japan. 404
Biogeosci., 2013, 10, 4819-4850. 405
6. S. Otosaka, T. Kobayashi. Sedimentation and remobilization of radiocesium in the coastal area of 406
Ibaraki, 70 km south of the Fukushima Dai-ichi Nuclear Power Plant, Environ. Monit. Assess., 2013, 407
185, 5419-5433. 408
7. R.N.J. Comans, M. Haller, P. DePreter. Sorption of cesium on illite: Non-equilibrium behavior and 409
reversibility. Geochim. Cosmochim. Acta, 1991, 55, 433-440. 410
8. C. Poinssot, B. Baeyens, M.H. Bradbury: Experimental and modeling studies of caesium sorption on 411
illite, Geochim. Cosmochim. Acta, 1999, 63, 3217-3227. 412
9. S.W. Fowler, P. Buat-Menard, Y. Yokoyama, S. Ballestra, E. Holm, H.V. Nguyen. Rapid removal of 413
Chernobyl fallout from Mediterranean surface waters by biological activity. Nature, 1987, 329, 56-58. 414
10. M. Kusakabe, T.L. Ku, K. Harada, K.Taguchi, S. Tsunogai. Chernobyl radioactivity found in 415
mid-water sediment trap interceptor in the N. Pacific and Bering Sea. Geophys. Res. Lett., 1988, 15, 416
44-47. 417
11. M. C. Honda, H. Kawakami, S. Watanabe, T. Saino. Concentration and vertical flux of 418
Fukushima-derived radiocesium in sinking particles from two sites in the Northwestern Pacific Ocean. 419
Biogeosci., 2013, 10, 3525–3534. 420
12. K.O. Buesseler, Fishing for answers off Fukushima, Science, 2012, 338, 480. 421
13. Y. Tateda, D. Tsumune, T. Tsubono. Simulation of radioactive cesium transfer in the southern 422
Fukushima coastal biota using a dynamic food chain transfer model. J. Environ. Radioactiv., 2013, 423
124, 1-12. 424
14. T. Wada, Y. Nemoto, S. Shimamura, T. Fujita, T. Mizuno, T. Sohtome, K. Kamiyama, T. Morita, S. 425
Page 15 of 32 Environmental Science: Processes & Impacts
Env
iron
men
talS
cien
ce:P
roce
sses
&Im
pact
sA
ccep
ted
Man
uscr
ipt
Publ
ishe
d on
17
Mar
ch 2
014.
Dow
nloa
ded
by N
atio
nal D
ong
Hw
a U
nive
rsity
Lib
rary
on
05/0
4/20
14 1
2:57
:31.
View Article OnlineDOI: 10.1039/C4EM00016A
14
Igarashi. Effects of the nuclear disaster on marine products in Fukushima. J. Environ. Radioactiv., 426
2013, 124, 246-254. 427
15. Z. Baumann, N. Casacuberta, H. Baumann, P. Masqué, N.S. Fisher. Natural and Fukushima-derived 428
radioactivity in macroalgae and mussels along the Japanese shoreline. Biogeosci., 2013, 10, 3809–429
3815. 430
16. IAEA (International Atomic Energy Agency). Collection and preparation of bottom sediment 431
samples for analysis of radionuclides and trace elements. IAEA-TECDOC, 1360, Vienna, 1993. 432
17. K. Aoyagi, C. Igarashi. On the size distribution of sediments in the coastal sea of Fukushima 433
Prefecture. Bull. Fukushima Pref. Fish. Exp. Sta., 1999, 8, 69-81 (in Japanese). 434
18. D.A. Stanners, S.R. Aston. Desorption of 106Ru, 134Cs, 137Cs, 144Ce and 241Am from intertidal sediment 435
contaminated by nuclear fuel reprocessing effluents. Estuarine Coastal and Shelf Sci., 1982, 14, 436
687-691. 437
19. N.G. Alexandeopoulos, T. Alexandropoulou, D. Anagnostopoulos, E.Evangelou, J.T. Kotsis, I. 438
Theodoridou. Chernobyl fallout on Ioannina, Greece. Nature, 1986, 322, 779. 439
20. UNSCEAR, Sources and effects of ionizing radiation. UNSCEAR 2000 Report, Scientific Annex C, 440
United Nations, New York, 2000 441
21. E. Seibold and W.H. Berger, in The Sea Floor: An Introduction to Marine Geology, Springer-Verlag, 442
New York, 3rd edn., 1996, ch. 4, pp. 97-125. 443
22. K. Hanawa, H. Mitsudera. Variation of water system distribution in the Sanriku coastal area. J. 444
Oceanogr. Soc. Japan, 1987, 42, 435-446. 445
23. H. Kubo. Research on the oceanographic conditions of Kashima-Nada, off the east coast of Honshu. 446
Bull. Ibaraki Pref. Fish. Exp. Sta., 1988, 26, 1-98 (in Japanese with English summary and captions). 447
24. K.O. Buesseler, S.R. Jayne, N.S. Fisher, I.I. Rypina, H. Baumann, Z. Baumann, C.F. Breier, E.M. 448
Douglass, J. George, A.M. Macdonald, H. Miyamoto, J. Nishikawa, S.M. Pike, S. Yoshida. 449
Fukushima-derived radionuclides in the ocean and biota off Japan. Proc. Natl. Acad. Sci., 2012, 109, 450
5984-5988. 451
25. H. Kawamura, T. Kobayashi, A. Furuno, T. In, Y. Ishikawa, T. Nakayama, S. Shima, T. Awaji. 452
Preliminary numerical experiments on oceanic dispersion of 131I and 137Cs discharged into the ocean 453
because of the Fukushima Daiichi Nuclear Power Plant Disaster. J. Nucl. Sci. Technol., 2011, 48, 454
1349-1356. 455
26. D. Tsumune, T. Tsubono, M. Aoyama, K. Hirose. Distribution of oceanic 137
Cs from the Fukushima 456
Dai-ichi Nuclear Power Plant simulated numerically by a regional ocean model. J. Environ. Radioact., 457
2012, 111, 100-108. 458
27. Y. Masumoto, Y. Miyazawa, D. Tsumune, T. Tsubono, T. Kobayashi, H. Kawamura, C. Estournel, P. 459
Page 16 of 32Environmental Science: Processes & Impacts
Env
iron
men
talS
cien
ce:P
roce
sses
&Im
pact
sA
ccep
ted
Man
uscr
ipt
Publ
ishe
d on
17
Mar
ch 2
014.
Dow
nloa
ded
by N
atio
nal D
ong
Hw
a U
nive
rsity
Lib
rary
on
05/0
4/20
14 1
2:57
:31.
View Article OnlineDOI: 10.1039/C4EM00016A
15
Marsaleix, L. Lanerolle, A. Mehra, Z.D. Garraffo. Oceanic dispersion simulations of 137Cs released 460
from the Fukushima Daiichi Nuclear Power Plant. Elements, 2012, 8, 207-212. 461
28. NOAA (National Oceanic and Atmospheric Administration). 1-minute Gridded Global Relief Data 462
(ETOPO2v2). NOAA National Geophysical Data Center, Boulder, 2006. 463
29. TEPCO: 2011b. http://radioactivity.nsr.go.jp/ja/list/280/list-201110.html 464
30. TEPCO: 2011c. http://radioactivity.nsr.go.jp/ja/contents/6000/5591/24/229_0625.pdf 465
31. TEPCO (Tokyo Electric Power Co.): 2011a. http://radioactivity.nsr.go.jp/ja/contents/5000/4623/ 466
24/1307070_071610d.pdf 467
32. B. Thornton, S. Ohnishi, T. Ura, N. Odano, S. Sasaki, T. Fujita, T. Watanabe, K. Nakata, T. Ono, D. 468
Ambe. Distribution of local 137Cs anomalies on the seafloor near the Fukushima Dai-ichi Nuclear 469
Power Plant. Mar. Pollution Bull., 2013, 74, 344–350. 470
33. B. Thornton, S. Ohnishi, T. Ura, N. Odano, T. Fujita. Continuous measurement of radionuclide 471
distribution off Fukushima using a towed sea-bed gamma ray spectrometer. Deep-sea Res. I, 2013, 79, 472
10–19. 473
34. T. Kobayashi, H. Nagai, M. Chino, H. Kawamura: Source term estimation of atmospheric release due 474
to the Fukushima Dai-ichi Nuclear Power Plant accident by atmospheric and oceanic dispersion 475
simulations. J. Nucl. Sci. Technol., 2013, 50, 255-264. 476
35. T. Ito, S. Otosaka, H. Kawamura. Estimation of total amounts of anthropogenic radionuclides in the 477
Japan Sea. J. Nucl. Sci. Technol., 2007, 44, 912-922. 478
36. IAEA. Sediment distribution coefficients and concentration factors for biota in the marine 479
environment. IAEA Technical Report Series 422, Vienna, 2004. 480
37. M. Yamaguchi, K. Maekawa, S. Takeuchi, A. Kitamura, Y. Onishi. Development of a model to predict 481
a radionuclide distribution based on soil migration after Fukushima Dai-ichi Nuclear Power Plant 482
accident. J. Nucl. Fuel Cycle Environ., 2014, in press (in Japanese with English abstract). 483
38. S. Ueda, H. Hasegawa, H. Kakiuchi, N. Akata, Y. Ohtsuka. Fluvial discharges of radiocaesium from 484
watersheds contaminated by the Fukushima Dai-ichi Nuclear Power Plant accident, Japan. J. Enriron. 485
Radioactiv., 2013, 118, 96-104. 486
39. T. Matsunaga, H. Amano, N. Yanase. Discharge of dissolved and particulate 137Cs in the Kuji River, 487
Japan. Appl. Geochem., 1991, 6, 159-167. 488
40. S. Nagao, M. Kanamori, S. Ochiai, S. Tomihara, K. Fukushi, M. Yamamoto. Export of 134Cs and 137Cs 489
in the Fukushima river systems at heavy rains by Typhoon Roke in September 2011. Biogeosci., 2013, 490
10, 6215-6223. 491
41. M. Kitamura, Y. Kumamoto, H. Kawakami, E. C. Cruz, K. Fujikura. Horizontal distribution of 492
Fukushima-derived radiocesium in zooplankton in the northwestern Pacific Ocean. Biogeosci., 2013, 493
Page 17 of 32 Environmental Science: Processes & Impacts
Env
iron
men
talS
cien
ce:P
roce
sses
&Im
pact
sA
ccep
ted
Man
uscr
ipt
Publ
ishe
d on
17
Mar
ch 2
014.
Dow
nloa
ded
by N
atio
nal D
ong
Hw
a U
nive
rsity
Lib
rary
on
05/0
4/20
14 1
2:57
:31.
View Article OnlineDOI: 10.1039/C4EM00016A
16
10, 5729-5738. 494
42 H.H. Hannan, T.C. Dorris. Succession of a macrophyte community in a constant temperature river. 495
Limnol. Oceanogr., 1970. 15, 442-453. 496
43 V. Sladecek, A. Sladeckova. Relationship between wet weight and dry weight of the periphyton. 497
Limnol. Oceanogr., 1963, 8, 309-311. 498
44 S. Otosaka and S. Noriki. Relationship between Composition of Settling Particles and Organic Carbon 499
Flux in the Western North Pacific and the Japan Sea. J. Oceanogr., 2005, 61, 25-40. 500
45. U.P. Nyffeler, Y.-H. Li, P.H. Santschi. A kinetic approach to describe trace-element distribution 501
between particles and solution in natural aquatic systems. Geochim. Cosmochim. Acta, 1984, 48, 502
1513-1522. 503
46 P.H. Santschi, P.Bower, U.P. Nyffeler, A. Axevedo, W.S. Broecker. Estimates of the resistance to 504
chemical transport posed by the deep-sea boundary layer. Limnol. Oceanogr. 1983, 28, 899-912. 505
47 K.M. Yeager, P.H. Santschi, G.T. Rowe. Sediment accumulation and radionuclide inventories (239,240
Pu, 506
210Pb and 234Th) in the northern Gulf of Mexico, as influenced by organic matter and macrofaunal 507
density. Marine Chemistry, 2004, 91, 1–14. 508
48 F. Dufois, R. Verney, P. LeHir, F. Dumas, S. Charmasson. Impact of winter storms on sediment erosion 509
in the Rhone River prodelta and fate of sediment in the Gulf of Lions (North Western Mediterranean 510
Sea). Continental Shelf Res., 2014, 72, 57-72. 511
512
Page 18 of 32Environmental Science: Processes & Impacts
Env
iron
men
talS
cien
ce:P
roce
sses
&Im
pact
sA
ccep
ted
Man
uscr
ipt
Publ
ishe
d on
17
Mar
ch 2
014.
Dow
nloa
ded
by N
atio
nal D
ong
Hw
a U
nive
rsity
Lib
rary
on
05/0
4/20
14 1
2:57
:31.
View Article OnlineDOI: 10.1039/C4EM00016A

17
Figure captions 513
Fig. 1 Sampling stations 514
Fig. 2 Vertical changes in bulk density, 210Pbxs, organic matter content and 134Cs concentration at (a) Sta. J7, 515
(b) Sta.J8, and (c) Sta.FS1. Fig.(d) shows lateral distribution of the three sedimentary patterns. In 516
Fig. (d), open triangles, closed triangles, and crosses indicate stations at where sedimentary pattern I, 517
II and III was observed, respectively. See text for the sedimentary patterns. 518
Fig. 3 F0-3 values as a function of bottom depth. 519
Fig. 4 Distribution of sedimentary 134Cs. In this paper, the “total” amount of sedimentary 134Cs was 520
estimated for the area inside the dashed line. 521
Fig. 5 134Cs inventories as a function of (a) bottom depth and (b) distance from 1FNPP. Data are obtained 522
in October and November 2011, except for two offshore data obtained in August 2011. Activities 523
are decay corrected to March 11, 2011. Solid lines in Fig. (a) indicate regression lines between the 524
two parameters for continental shelf (<200 m) and the outer (>200 m) regions. Dashed line 525
indicates lowest level of significant 134Cs inventory estimated from detection limit of gamma 526
counting. 527
Fig. 6 Expected accumulation processes of radiocesium in the coastal region. Total amount denotes 528
cumulative 134
Cs amount from 0m to 200m (Table 2). See text for estimated 134
Cs supply with each 529
process. 530
Fig. 7 Temporal change in 134
Cs concentration in surface seawater within 100 km radius from 1FNPP. 531
Data are from Oikawa et al. 4, and decay-corrected to March 11, 2011. Horizontal lines indicate 532
representative values used in the calculation in subsection 3.3.2. 533
Fig. 8 Vertical distribution of the Cz/C0 value. Data are from Oikawa et al. (2013) 4 obtained within 100 534
km radius from 1FNPP, and decay-corrected to March 11, 2011. The Cz/C0 value is defined as a 535
ratio of 134Cs concentration in seawater at water depth z to that in the surface. Horizontal line 536
indicates the representative value used in the calculation in subsection 3.3.3 (Cz/C0 = 0.1). 537
538
Table captions 539
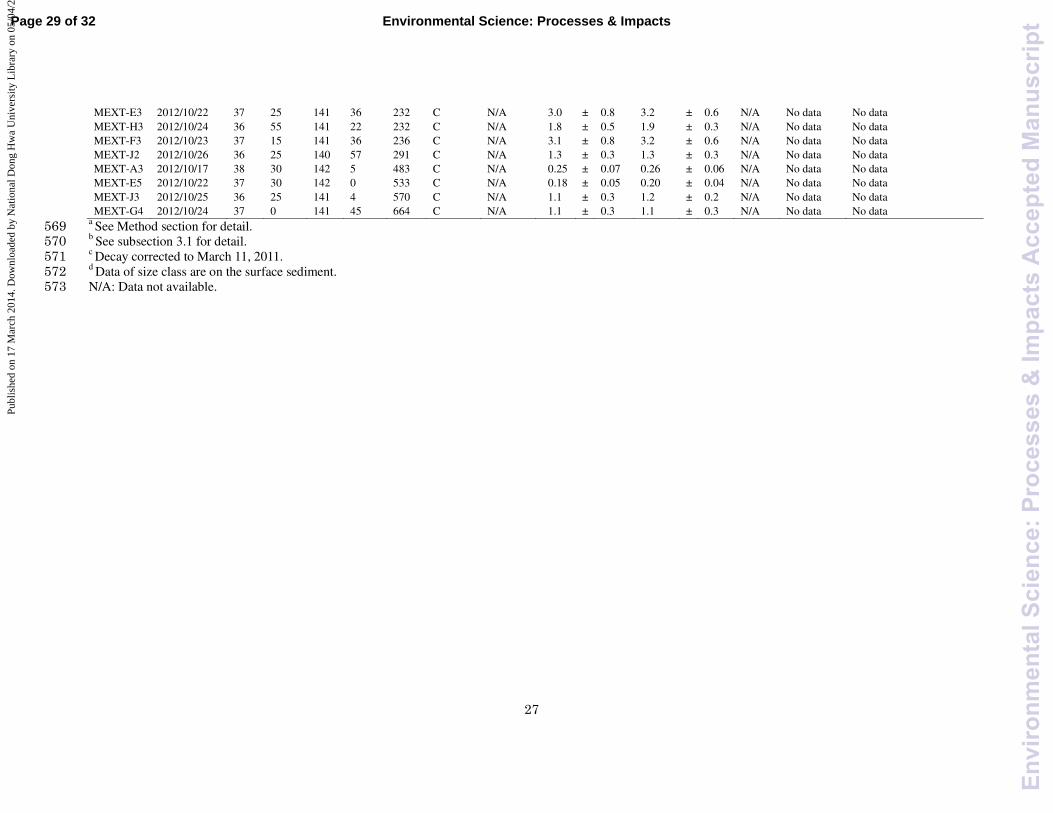
Table 1 Locations of sampling station, 134Cs and 137Cs inventories, F0-3 values, and sediment properties. 540
Table 2 Table 2 Amount of sedimentary 134
Cs in the North Pacific between 35°40’ N and 38°30’ N 541
542
Page 19 of 32 Environmental Science: Processes & Impacts
Env
iron
men
talS
cien
ce:P
roce
sses
&Im
pact
sA
ccep
ted
Man
uscr
ipt
Publ
ishe
d on
17
Mar
ch 2
014.
Dow
nloa
ded
by N
atio
nal D
ong
Hw
a U
nive
rsity
Lib
rary
on
05/0
4/20
14 1
2:57
:31.
View Article OnlineDOI: 10.1039/C4EM00016A
18
543
544
Otosaka and Kato, Fig. 1 545
546
Page 20 of 32Environmental Science: Processes & Impacts
Env
iron
men
talS
cien
ce:P
roce
sses
&Im
pact
sA
ccep
ted
Man
uscr
ipt
Publ
ishe
d on
17
Mar
ch 2
014.
Dow
nloa
ded
by N
atio
nal D
ong
Hw
a U
nive
rsity
Lib
rary
on
05/0
4/20
14 1
2:57
:31.
View Article OnlineDOI: 10.1039/C4EM00016A
19
547
Otosaka and Kato, Fig. 2 548
549
Page 21 of 32 Environmental Science: Processes & Impacts
Env
iron
men
talS
cien
ce:P
roce
sses
&Im
pact
sA
ccep
ted
Man
uscr
ipt
Publ
ishe
d on
17
Mar
ch 2
014.
Dow
nloa
ded
by N
atio
nal D
ong
Hw
a U
nive
rsity
Lib
rary
on
05/0
4/20
14 1
2:57
:31.
View Article OnlineDOI: 10.1039/C4EM00016A

20
550
Otosaka and Kato, Fig. 3 551
552
Page 22 of 32Environmental Science: Processes & Impacts
Env
iron
men
talS
cien
ce:P
roce
sses
&Im
pact
sA
ccep
ted
Man
uscr
ipt
Publ
ishe
d on
17
Mar
ch 2
014.
Dow
nloa
ded
by N
atio
nal D
ong
Hw
a U
nive
rsity
Lib
rary
on
05/0
4/20
14 1
2:57
:31.
View Article OnlineDOI: 10.1039/C4EM00016A
21
553
Otosaka and Kato, Fig. 4 554
555
Page 23 of 32 Environmental Science: Processes & Impacts
Env
iron
men
talS
cien
ce:P
roce
sses
&Im
pact
sA
ccep
ted
Man
uscr
ipt
Publ
ishe
d on
17
Mar
ch 2
014.
Dow
nloa
ded
by N
atio
nal D
ong
Hw
a U
nive
rsity
Lib
rary
on
05/0
4/20
14 1
2:57
:31.
View Article OnlineDOI: 10.1039/C4EM00016A

22
556
Otosaka and Kato, Fig. 5 557
558
Page 24 of 32Environmental Science: Processes & Impacts
Env
iron
men
talS
cien
ce:P
roce
sses
&Im
pact
sA
ccep
ted
Man
uscr
ipt
Publ
ishe
d on
17
Mar
ch 2
014.
Dow
nloa
ded
by N
atio
nal D
ong
Hw
a U
nive
rsity
Lib
rary
on
05/0
4/20
14 1
2:57
:31.
View Article OnlineDOI: 10.1039/C4EM00016A

23
559
Otosaka and Kato, Fig. 6 560
561
Page 25 of 32 Environmental Science: Processes & Impacts
Env
iron
men
talS
cien
ce:P
roce
sses
&Im
pact
sA
ccep
ted
Man
uscr
ipt
Publ
ishe
d on
17
Mar
ch 2
014.
Dow
nloa
ded
by N
atio
nal D
ong
Hw
a U
nive
rsity
Lib
rary
on
05/0
4/20
14 1
2:57
:31.
View Article OnlineDOI: 10.1039/C4EM00016A
24
562
Otosaka and Kato, Fig. 7 563
564
565
Page 26 of 32Environmental Science: Processes & Impacts
Env
iron
men
talS
cien
ce:P
roce
sses
&Im
pact
sA
ccep
ted
Man
uscr
ipt
Publ
ishe
d on
17
Mar
ch 2
014.
Dow
nloa
ded
by N
atio
nal D
ong
Hw
a U
nive
rsity
Lib
rary
on
05/0
4/20
14 1
2:57
:31.
View Article OnlineDOI: 10.1039/C4EM00016A
25
566
Otosaka and Kato, Fig. 8 567
Page 27 of 32 Environmental Science: Processes & Impacts
Env
iron
men
talS
cien
ce:P
roce
sses
&Im
pact
sA
ccep
ted
Man
uscr
ipt
Publ
ishe
d on
17
Mar
ch 2
014.
Dow
nloa
ded
by N
atio
nal D
ong
Hw
a U
nive
rsity
Lib
rary
on
05/0
4/20
14 1
2:57
:31.
View Article OnlineDOI: 10.1039/C4EM00016A

26
Table 1 Locations of sampling station, 134
Cs and 137
Cs inventories, F0-3 values, and sediment properties. 568
Station Sampling
date
North latitude East longitude Depth Data
categorya
Sediment
pattern b
134Cs inventory c 137Cs inventory c F0-3 b Org. matter
Wentworth size class d Deg Min Deg Min m kBq/m2 kBq/m2 %
K1 2011/11/1 36 0 140 53 105 A I 2.52 ± 0.04 2.57 ± 0.03 0.83 4.8 Fine sand
K9 2011/10/31 36 60 141 18 158 A I 4.61 ± 0.04 4.67 ± 0.04 0.89 3.7 Coarse silt
J7 2011/10/31 36 48 141 15 220 A I 2.30 ± 0.04 2.23 ± 0.03 0.85 2.7 Medium sand
J9 2011/10/31 36 17 140 54 225 A II 0.94 ± 0.03 1.04 ± 0.02 0.57 3.8 Fine sand
K2 2011/11/1 36 0 141 1 273 A II 0.84 ± 0.05 0.90 ± 0.02 0.63 4.9 Very fine sand
K6 2011/10/29 37 20 141 40 300 A I 0.87 ± 0.03 0.90 ± 0.02 0.93 3.7 Fine sand
J6 2011/10/31 36 46 141 24 497 A III 2.16 ± 0.03 2.09 ± 0.03 0.92 9.7 Coarse silt
K7 2011/10/29 37 20 141 50 501 A I 0.48 ± 0.02 0.46 ± 0.02 1.00 7.4 Very fine sand
K3 2011/11/1 35 60 141 10 597 A III 0.28 ± 0.02 0.31 ± 0.02 1.00 9.3 Coarse silt
J8 2011/10/31 36 17 141 7 708 A II 0.65 ± 0.03 0.71 ± 0.02 0.65 13.5 Coarse silt
FS1 2011/8/3 37 20 142 10 992 A III 0.05 ± 0.01 0.10 ± 0.01 1.00 11.2 Coarse silt
K8 2011/10/29 37 19 142 12 1047 A III 0.08 ± 0.01 0.10 ± 0.01 1.00 13.6 Coarse silt
FS5 2011/8/5 36 0 141 20 1175 A III 0.22 ± 0.01 0.21 ± 0.01 0.91 13.0 Coarse silt
S4 2011/10/27 36 46 140 47 26 B N/A 18.9 ± 0.8 19.1 ± 0.8 0.15 3.3 Very fine sand / Fine sand
S2 2011/10/27 36 35 140 44 35 B N/A 12.4 ± 0.5 12.1 ± 0.5 0.23 5.6 Coarse silt - Granule
S3 2011/10/27 36 41 140 47 47 B N/A 13.3 ± 0.5 13.3 ± 0.5 0.28 3.6 Fine sand / Medium sand
S5 2011/10/27 36 46 140 54 75 B II 10.7 ± 0.4 10.1 ± 0.4 0.48 6.4 Very fine sand
S8 2011/10/27 36 30 140 47 75 B I 16.0 ± 0.7 15.4 ± 0.6 0.23 3.4 Very fine sand / Fine sand
S7 2011/10/27 36 35 140 51 90 B I 6.93 ± 0.28 6.56 ± 0.2 0.73 6.5 Very fine sand
S6 2011/10/27 36 41 140 54 95 B II 5.78 ± 0.22 5.56 ± 0.2 0.66 6.6 Very fine sand
MEXT-I1 2012/10/25 36 45 140 57 99 C N/A 7.6 ± 1. 9 8.0 ± 1.4 N/A No data No data
MEXT-G0 2012/10/22 37 5 141 8 107 C N/A 13.7 ± 3.4 13.0 ± 2.3 N/A No data No data
MEXT-B3 2012/10/18 38 5 141 29 118 C N/A 21.6 ± 5.4 21.3 ± 3.8 N/A No data No data
MEXT-D1 2012/10/18 37 35 141 22 124 C N/A 10.1 ± 2.5 10. 6 ± 1.9 N/A No data No data
MEXT-C3 2012/10/18 37 45 141 29 133 C N/A 4.5 ± 1.1 4.6 ± 0.8 N/A No data No data
MEXT-H1 2012/10/23 36 55 141 8 134 C N/A 4.7 ± 1.2 4.7 ± 0.8 N/A No data No data
MEXT-E1 2012/10/19 37 25 141 23 135 C N/A 11.0 ± 2.6 11.0 ± 2.0 N/A No data No data
MEXT-G1 2012/10/23 37 5 141 15 141 C N/A 5.5 ± 1.4 5.4 ± 1.0 N/A No data No data
MEXT-F1 2012/10/19 37 15 141 22 142 C N/A 4.0 ± 1.0 4.2 ± 0.8 N/A No data No data
MEXT-L3 2012/10/13 35 45 141 11 171 C N/A 1.2 ± 0.3 1.2 ± 0.2 N/A No data No data
MEXT-I3 2012/10/25 36 55 141 11 184 C N/A 1.3 ± 0.3 1.4 ± 0.2 N/A No data No data
MEXT-A1 2012/10/17 38 30 141 51 209 C N/A 0.23 ± 0.06 0.24 ± 0.04 N/A No data No data
MEXT-G3 2012/10/23 37 5 141 29 210 C N/A 1.4 ± 0.3 1.4 ± 0.3 N/A No data No data
MEXT-a1 2012/10/17 38 15 141 51 214 C N/A 0.80 ± 0.20 0.81 ± 0.15 N/A No data No data
MEXT-K2 2012/10/13 36 5 140 57 215 C N/A 1.2 ± 0.3 1.2 ± 0.2 N/A No data No data
MEXT-D3 2012/10/19 37 35 141 36 224 C N/A 2.4 ± 0.6 2.5 ± 0.5 N/A No data No data
Page 28 of 32Environmental Science: Processes & Impacts
Env
iron
men
talS
cien
ce:P
roce
sses
&Im
pact
sA
ccep
ted
Man
uscr
ipt
Publ
ishe
d on
17
Mar
ch 2
014.
Dow
nloa
ded
by N
atio
nal D
ong
Hw
a U
nive
rsity
Lib
rary
on
05/0
4/20
14 1
2:57
:31.
View Article OnlineDOI: 10.1039/C4EM00016A
27
MEXT-E3 2012/10/22 37 25 141 36 232 C N/A 3.0 ± 0.8 3.2 ± 0.6 N/A No data No data
MEXT-H3 2012/10/24 36 55 141 22 232 C N/A 1.8 ± 0.5 1.9 ± 0.3 N/A No data No data
MEXT-F3 2012/10/23 37 15 141 36 236 C N/A 3.1 ± 0.8 3.2 ± 0.6 N/A No data No data
MEXT-J2 2012/10/26 36 25 140 57 291 C N/A 1.3 ± 0.3 1.3 ± 0.3 N/A No data No data
MEXT-A3 2012/10/17 38 30 142 5 483 C N/A 0.25 ± 0.07 0.26 ± 0.06 N/A No data No data
MEXT-E5 2012/10/22 37 30 142 0 533 C N/A 0.18 ± 0.05 0.20 ± 0.04 N/A No data No data
MEXT-J3 2012/10/25 36 25 141 4 570 C N/A 1.1 ± 0.3 1.2 ± 0.2 N/A No data No data
MEXT-G4 2012/10/24 37 0 141 45 664 C N/A 1.1 ± 0.3 1.1 ± 0.3 N/A No data No data a See Method section for detail. 569
b See subsection 3.1 for detail. 570
c Decay corrected to March 11, 2011. 571
d Data of size class are on the surface sediment. 572
N/A: Data not available. 573
Page 29 of 32 Environmental Science: Processes & Impacts
Env
iron
men
talS
cien
ce:P
roce
sses
&Im
pact
sA
ccep
ted
Man
uscr
ipt
Publ
ishe
d on
17
Mar
ch 2
014.
Dow
nloa
ded
by N
atio
nal D
ong
Hw
a U
nive
rsity
Lib
rary
on
05/0
4/20
14 1
2:57
:31.
View Article OnlineDOI: 10.1039/C4EM00016A
28
Table 2 Amount of sedimentary 134
Cs in the North Pacific between 35°40’ N and 38°30’ N
Depth range Area
134Cs amount
*
m km
2 % Bq %
0-100 7.9×10³ 22 [1.6 ± 0.5] ×10
14 81
100-200 6.6×10³ 19 [2.6 ± 0.8] ×10
13 13
200-400 4.5×10³ 13 [4.3 ± 1.8] ×10
12 2.9
400-600 3.5×10³ 9.9 [2.6 ± 1.1] ×1012 1.7
600-800 3.0×10³ 8.6 [1.2 ± 0.5] ×10
12 0.8
800-1000 3.1×10³ 8.8 [6.9 ± 2.8] ×10
11 0.4
1000-1200 2.9×10³ 8.1 [3.4 ± 1.4] ×10
11 0.2
1200-1500 3.8×10³ 11 [2.2 ± 0.9] ×1011 0.1
Total 3.5×10⁴ 100 [2.0 ± 0.6] ×1014 100
*Decay corrected to March 11, 2011. Uncertainty is based on 95% confidence interval with relationship
between 134Cs inventories in sediment and water depth (Fig. 3).
Page 30 of 32Environmental Science: Processes & Impacts
Env
iron
men
talS
cien
ce:P
roce
sses
&Im
pact
sA
ccep
ted
Man
uscr
ipt
Publ
ishe
d on
17
Mar
ch 2
014.
Dow
nloa
ded
by N
atio
nal D
ong
Hw
a U
nive
rsity
Lib
rary
on
05/0
4/20
14 1
2:57
:31.
View Article OnlineDOI: 10.1039/C4EM00016A
29
Appendix. Concentrations of 134
Cs, 137
Cs and 210
Pbxs and bulk density of sediment.
Station Sampling
date
Layer 134Cs concentration* 137Cs concentration* 210Pbxs concentration Bulk density
cm Bq/kg Bq/kg Bq/kg g/cm3
K1 2011/11/1 0-1 159 ± 2 193 ± 2 413 ± 12 0.71
1-2 45.0 ± 1.3 56.0 ± 1.3 335 ± 30 1.08
2-3 5.9 ± 0.7 7.7 ± 0.7 243 ± 28 1.20
3-4 17.3 ± 0.9 23.1 ± 0.9 286 ± 22 1.16
4-5 3.8 ± 0.7 5.8 ± 0.6 269 ± 19 1.22
5-6 4.1 ± 0.6 5.5 ± 0.6 278 ± 22 1.26
6-7 2.4 ± 0.6 3.7 ± 0.6 238 ± 22 1.30
7-8 <0.9
1.6 ± 0.5 227 ± 19 1.30
8-9 1.7 ± 0.5 2.5 ± 0.5 227 ± 27 1.33
9-10 <0.9
<0.7
210 ± 22 1.32
K9 2011/10/31 0-1 116 ± 1 144 ± 1 224 ± 9 1.07
1-2 92.6 ± 1.4 114 ± 1 371 ± 48 1.27
2-3 68.0 ± 1.3 82.3 ± 1.4 146 ± 45 1.33
3-4 25.1 ± 0.9 29.0 ± 1.0 343 ± 44 1.32
4-5 5.8 ± 0.9 8.1 ± 1.0 326 ± 44 1.32
5-6 <0.9
6.8 ± 0.8 286 ± 44 1.29
6-7 <0.9
<0.9
123 ± 44 1.25
J7 2011/10/29 0-1 55.6 ± 1.1 61.9 ± 0.9 239 ± 9 1.09
1-2 48.3 ± 1.0 49.0 ± 0.9 295 ± 14 1.23
2-3 28.4 ± 0.9 28.0 ± 0.7 281 ± 12 1.31
3-4 12.6 ± 0.9 16.8 ± 0.7 184 ± 12 1.31
4-5 5.3 ± 0.9 6.0 ± 0.7 299 ± 12 1.32
5-6 3.9 ± 0.9 8.2 ± 0.7 275 ± 12 1.28
6-7 4.6 ± 0.9 6.7 ± 0.7 203 ± 13 1.24
7-8 <0.9 4.8 ± 0.6 114 ± 11 1.30
8-9 <0.8 2.6 ± 0.7 94 ± 11 1.40
J9 2011/10/31 0-1 24.4 ± 1.1 29.8 ± 1.2 291 ± 9 0.86
1-2 17.8 ± 1.0 23.8 ± 1.0 394 ± 34 0.98
2-3 4.8 ± 0.7 8.3 ± 0.1 429 ± 27 1.05
3-4 2.5 ± 0.7 4.8 ± 0.7 429 ± 26 1.08
4-5 6.1 ± 0.8 8.4 ± 0.8 410 ± 35 1.07
5-6 12.1 ± 0.9 15.4 ± 0.8 457 ± 26 1.05
6-7 10.3 ± 0.8 13.1 ± 0.8 437 ± 26 1.05
7-8 <1.1 <0.9
352 ± 22 1.10
K2 2011/11/1 0-1 20.2 ± 1.6 28.9 ± 1.3 382 ± 11 0.79
1-2 12.4 ± 1.5 17.4 ± 1.3 472 ± 18 0.87
2-3 17.8 ± 1.3 24.6 ± 1.2 407 ± 15 0.90
3-4 5.6 ± 1.4 9.3 ± 1.1 406 ± 15 0.94
4-5 <1.2 3.6 ± 1.2 350 ± 16 0.98
5-6 4.7 ± 1.3 5.3 ± 1.1 363 ± 15 1.00
6-7 8.9 ± 2.0 4.0 ± 1.0 314 ± 15 1.02
7-8 <1.1
<0.9
184 ± 15 1.05
8-9 5.3 ± 1.3 2.7 ± 1.1 175 ± 14 1.50
9-10 <1.0 4.3 ± 1.1 127 ± 14 1.18
K6 2011/10/29 0-1 17.5 ± 0.9 22.2 ± 1.0 264 ± 11 0.93
1-2 31.4 ± 1.3 39.3 ± 1.0 182 ± 7 1.00
2-3 16.7 ± 0.9 20.4 ± 0.9 206 ± 8 1.07
3-4 4.2 ± 0.7 5.3 ± 0.7 167 ± 7 1.13
Page 31 of 32 Environmental Science: Processes & Impacts
Env
iron
men
talS
cien
ce:P
roce
sses
&Im
pact
sA
ccep
ted
Man
uscr
ipt
Publ
ishe
d on
17
Mar
ch 2
014.
Dow
nloa
ded
by N
atio
nal D
ong
Hw
a U
nive
rsity
Lib
rary
on
05/0
4/20
14 1
2:57
:31.
View Article OnlineDOI: 10.1039/C4EM00016A

30
4-5 <1.1 2.4 ± 0.7 156 ± 7 1.09
J6 2011/10/31 0-1 178 ± 3 213 ± 3 934 ± 5 0.36
1-2 108 ± 2 132 ± 3 748 ± 41 0.49
2-3 76.3 ± 2.5 84.6 ± 2.4 686 ± 45 0.58
3-4 20.9 ± 2.1 22.1 ± 2.3 571 ± 39 0.67
4-5 <2.2 6.2 ± 1.7 458 ± 35 0.77
5-6 <2.2 <1.8 466 ± 36 0.81
K7 2011/10/29 0-1 42.2 ± 1.8 56.2 ± 2.0 666 ± 17 0.50
1-2 20.9 ± 1.6 18.2 ± 1.5 262 ± 15 0.85
2-3 <1.1
<0.9 311 ± 14 1.07
3-4 <1.2
<1.0
120 ± 14 1.00
K3 2011/11/1 0-1 59.5 ± 3.2 73.6 ± 2.7 1064 ± 27 0.38
1-2 <1.6
<1.3
563 ± 43 0.74
2-3 <1.6
<1.3
238 ± 43 0.74
J8 2011/10/29 0-1 83.6 ± 6.0 97.4 ± 5.8 1204 ± 24 0.24
1-2 19.9 ± 2.1 29.7 ± 2.2 1748 ± 35 0.29
2-3 23.4 ± 2.0 26.3 ± 1.9 1566 ± 36 0.35
3-4 8.4 ± 2.0 15.5 ± 1.8 1349 ± 45 0.39
4-5 12.6 ± 2.2 15.9 ± 2.2 1417 ± 51 0.40
5-6 13.2 ± 1.6 15.2 ± 1.5 1135 ± 19 0.44
6-7 10.0 ± 1.5 12.0 ± 1.5 999 ± 19 0.43
7-8 <2.8
<2.3
824 ± 19 0.42
8-9 <2.6
4.6 ± 1.4 752 ± 19 0.45
9-10 <2.7 7.5 ± 1.3 595 ± 19 0.44
K8 2011/10/29 0-1 11.3 ± 1.3 15.8 ± 2.5 1089 ± 34 0.25
1-2 7.7 ± 1.5 11.4 ± 1.0 627 ± 7 0.48
2-3 <1.4
<1.2
347 ± 16 0.82
3-4 <1.3
<1.1
136 ± 15 0.90
FS1 2011/8/1 0-1 10.3 ± 0.8 11.0 ± 2.2 961 ± 28 0.30
1-2 2.7 ± 1.0 5.8 ± 1.5 956 ± 26 0.40
2-3 <1.6 3.0 ± 0.9 827 ± 19 0.47
3-4 <1.1 4.0 ± 1.1 565 ± 15 0.67
4-5 <0.9 <0.8
404 ± 12 0.79
FS5 2011/8/2 0-1 54.1 ± 1.4 58.4 ± 1.6 1420 ± 39 0.26
1-2 6.6 ± 1.1 8.9 ± 0.9 ND
0.34
2-3 3.8 ± 0.9 2.3 ± 0.7 1175 ± 29 0.40
3-4 3.2 ± 0.6 4.1 ± 0.5 564 ± 27 0.56
4-5 <1.2
<1.0
223 ± 27 0.60
*Activities are decay corrected to sampling date
Uncertainties are given 1-sigma counting errors
ND: No data
Page 32 of 32Environmental Science: Processes & Impacts
Env
iron
men
talS
cien
ce:P
roce
sses
&Im
pact
sA
ccep
ted
Man
uscr
ipt
Publ
ishe
d on
17
Mar
ch 2
014.
Dow
nloa
ded
by N
atio
nal D
ong
Hw
a U
nive
rsity
Lib
rary
on
05/0
4/20
14 1
2:57
:31.
View Article OnlineDOI: 10.1039/C4EM00016A