radio frequency glow discharge mass spectrometry for the characterization of bulk polymers
TRANSCRIPT
Radio Frequency Glow Discharge MassSpectrometry for the Characterization of BulkPolymers
Charles R. Shick, Jr., Patrick A. DePalma, Jr., and R. Kenneth Marcus*
Department of Chemistry, Howard L. Hunter Chemical Laboratory, Clemson University,Clemson, South Carolina 29634-1905
A radio frequency (rf)-powered glow discharge (GD)atomization/ionization source is utilized to determine theapplicability of the technique for direct polymer analysis.A series of PTFE-based polymers are studied to assesstheir fingerprint mass spectra and to distinguish eachsample by its differing base peaks and relative peakintensities. A parametric study with respect to dischargegas pressure and rf power is conducted to evaluate theirrespective roles in the sputtering process as well aspossible ionization mechanisms. The results of the GDsputtering processes are examined by scanning electronmicrographs of a sputtered PTFE surface. Excellentdischarge stabilization characteristics (<3 min) wereobserved in temporal response curves. Internal stabilitywith respect to signal intensity is observed to be <5% RSDfor samples of different thicknesses. Finally, the abilityto obtain depth profiles of layered samples was demon-strated for the case of a Cu layer deposited on a PTFEsubstrate.
Synthetic polymers, copolymers, and blends are presently usedfor a variety of applications and products. Consequently, polymeranalysis has evolved through the years to meet the needs of thepolymer manufacturer. Several polymer analysis techniques havebeen utilized for structure determination, quantitation of residualmonomers and additives, molecular weight determination, surfacecharacterization, and thermal characterization.
The analysis of polymer samples has been performed byseveral complementary beam techniques for thin-film and surfaceanalysis to determine physical and chemical properties. X-rayphotoelectron spectroscopy (XPS) was the early technique ofchoice for polymers.1,2 Both multielement and chemical stateinformation are obtained by XPS by examining the core andvalence level photoemission lines; yet, many polymers are typicallycomposed of carbon, oxygen, and silicon, which have difficult XPSchemical shifts to resolve. Thus, XPS can determine specificfunctional groups but cannot identify organic molecules.
Secondary ion mass spectrometry (SIMS) is a valuable surfaceanalysis technique to determine chemical composition. Bothdynamic and static modes of operation allow for better charac-terization of the sample surface than XPS, as well as for bulkanalysis. Dynamic SIMS can be used for depth profiling, whilestatic SIMS can be coupled with XPS and ion scattering spectros-
copy (ISS) to allow multidimensional measurements with onesystem. Further elaboration of fundamental SIMS principles andanalytical reviews can be found elsewhere.3-5
As the surface of an electrically nonconducting solid willbecome positively charged if it is bombarded with positive primaryions, SIMS has been predominantly applied to solids of goodelectrical conductance. This surface charge buildup is detrimentalin all charged particle (beam) techniques as the charge barrierinfluences the acceleration/deceleration and deflection of theprimary ion beam as well as affects the secondary particle energiesand trajectories. Several charge compensation methods have beenstudied, including evaporation of a conductive mesh onto thesolid,6 modulation of the primary ion beam,7 alternating bombard-ment of the solid with negative primary ions or neutral particles,8
and sample bombardment with electrons from a separate sourcein conjunction with positive primary ions.9-15 Although electronflood guns have enjoyed commercial success, Briggs and Wootonhave employed a relatively high energy electron gun to induceelectron stimulated desorption (ESD) effects on poly(tetrafluoro-ethylene) (PTFE) and paraffin wax samples.12
A number of early works illustrated the possibilities ofstructural elucidation of polymers by SIMS.16,17 Gardella andHercules more recently investigated SIMS capabilities for poly-meric materials analysis for a series of polymethacrylates.10,11 Thiswork showed positive molecular fragments from 0 to 300 m/z anddemonstrated different base peaks as a function of different sidechains within the polymer series. Colton and co-workers also usedstatic SIMS to distinguish four polymethacrylates with respect todifferent functional groups.18 Through a series of publications,Briggs assessed the analysis of polymer surfaces by SIMS.12-14
(1) Clark, D. T. CRC Crit. Rev. Solid State Mater. Sci. 1978, 8, 1-52.(2) Clark, D. T.; Thomas, H. R. J. Polym. Sci., Polym. Chem. Ed. 1976, 14,
1701-1714.
(3) Benninghoven, A. Angew. Chem., Int. Ed. Engl. 1994, 33, 1023-1043.(4) Short, R. D.; Ameen, A. P.; Jackson, S. T.; Pawson, D. J.; O’Toole, L. O.;
Ward, A. J. Vacuum 1993, 44, 1143-1160.(5) Benninghoven, A. Surf. Sci. 1994, 299/300, 246-260.(6) Slodzain, G. Ann. Phys. 1964, 9, 591-648.(7) Betanov, G. M. Sov. Phys. Solid State 1961, 3, 409-415.(8) Anderson, C. A.; Roden, H. J.; Robinson, C. F. J. Appl. Phys. 1969, 40, 3419-
3420.(9) Hasseltine, E. H.; Hurlbat, F. C.; Olson, N. T.; Smith, H. P., Jr. J. Appl. Phys.
1967, 38, 4313-4316.(10) Gardella, J. A.; Hercules, D. M. Anal. Chem. 1980, 52, 226-232.(11) Gardella, J. A.; Hercules, D. M. Anal. Chem. 1981, 53, 1879-1884.(12) Briggs, D.; Wootton, A. B. Surf. Interface Anal. 1982, 4, 109-115.(13) Briggs, D. Surf. Interface Anal. 1982, 4, 151-155.(14) Briggs, D. Surf. Interface Anal. 1983, 5, 113-118.(15) Muller, G. Appl. Phys. 1976, 10, 317-324.(16) Benninghoven, A.; Jaspers, D.; Sichtermann, W. Appl. Phys. 1976, 11, 35-
39.(17) Werner, H. W. Mikrochim. Acta Suppl. VII 1977, 63-83.(18) Campana, J. E.; DeCorpo, J. J.; Colton, R. J. Appl. Surf. Sci. 1981, 8, 337-
342.
Anal. Chem. 1996, 68, 2113-2121
S0003-2700(95)01220-0 CCC: $12.00 © 1996 American Chemical Society Analytical Chemistry, Vol. 68, No. 13, July 1, 1996 2113
Fingerprint spectra from several polymer films and preliminarymolecular imaging were also reported.13,14 These investigationsfacilitated the current level of success of polymeric analysis bySIMS with routine polymer identification and molecular imaging.
In the 1980s, glow discharge (GD) began to gain prominencewithin the analytical community. Since then, GD techniques forelemental analysis have proceeded with rapid advancement.19-22
This warranted interest in GD techniques can be attributed totheir versatility in the direct analysis of surfaces, multilayer coatedsamples, and bulk substrates. Several commercial GD systemshave been developed for elemental analysis utilizing atomicemission spectroscopy (GD-AES) and mass spectrometry (GDMS).Most are equipped with dc-powered GD sources; hence, allnonconducting samples are required to be made conductive bymixing with a conducting matrix.23-26 Another alternative fornonconductive sample GDMS applications has been the use ofsecondary metal cathodes to initiate the GD at the surface of thesample.27,28 In this laboratory, radio frequency (rf)-powered GDsources have been demonstrated to atomize both conducting andnonconducting samples for atomic emission spectroscopy (rf-GD-AES) and mass spectrometry (rf-GDMS) applications.29
Relevant to the work reported here, Coburn and co-workersreported on the ionic species present in an rf-GD for differentsamples, including metals, alloys, inorganic compounds, andorganic solids.30 Of particular interest, a PTFE polymer targetproduced a complex mass spectrum containing several combina-tions of C and F. They also studied hydrocarbon polymers suchas polyethylene (PE) and polystyrene (PS), noting a reducedintensity of molecular fragments and variety of the molecularspecies. The larger abundance of molecular species observed withfluorocarbons relative to hydrocarbons was attributed to thedifferent bond energies. The C-F bond energy is 5.5 eV, whilethe C-H bond energy is 3.5 eV.
A new rf-GD ion source has been successfully developed tohandle flat samples, like plate glasses, since the machining of pin-type electrodes can be difficult if not impossible for certainmatrices.31,32 Described here are preliminary findings pertainingto the use of the quadrupole rf-GD mass spectrometer for theanalysis of polymers, specifically, three PTFE-based polymers.Preliminary characterization was performed to assess the rolesof the discharge parameters on the polymeric fragment intensities
and plasma stabilization times for such fragments. The effects ofion bombardment on the polymer surface were determined byscanning electron microscopy, and finally a Cu-coated PTFEsample was analyzed to illustrate depth profiling capabilities.Thus, this work with well-characterized polymers represents thepreliminary observations of polymer analysis by rf-GDMS, il-lustrating the dual capabilities of elemental analysis and structureelucidation, hopefully leading to further understanding of thefundamental nature of rf-GD.
EXPERIMENTAL SECTIONInstrumentation. Mass spectrometric measurements for all
polymer samples were performed on a commercial quadrupoleGDMS system (VG GloQuad, FI Elemental, Winsford, Cheshire,England). Several modifications were necessary for the couplingof both pin- and flat-type sample rf-GD ion sources to thiscommercial system.32-34 In summary, an interlock chamberfaceplate with a 12.5 mm i.d. compression fitting (Swagelock,Solon, OH) replaced the original dc source interface. A directinsertion probe (DIP) is passed through the compression fitting,and the flat sample holder is slip-fitted to the end of the DIP. Theinterlock chamber is evacuated, and the pneumatic gate valve isopened such that the DIP and flat sample holder are inserted intothe main housing chamber while maintaining the compressionfitting seal. The DIP construction has been described in detailpreviously.35 For polymer samples, a stock copper disk is utilizedfor mechanical support as a backing disk. The polymer is notphysically or chemically attached to the backing disk, as iscommonly done in SIMS work employing double-sided tape orsolvent evaporation onto the metal probe.
Typical analysis discharge conditions were 20 W rf power, 0.075mbar Ar discharge gas pressure, and an 8 mm diameter limitingorifice (anode) plate. Radio frequency power was supplied by a13.56 MHz generator and was impedance matched by an auto-matic matching network (Models RF-5S and AM-5, respectively,RF Power Products, Voorhees, NJ). This matching network iscapable of effective operation over a wide range of sample sizes,source geometries, and sample matrices (both conducting andnonconducting). A 10 mm length discharge cell was machinedfrom stainless steel and designed to couple directly to thecryoplate and exit orifice of the commercial source. The dischargepressures were varied from 0.06 to 0.20 mbar for evaluation ofthe extent of molecular fragmentation as a function of dischargeparameters, while the rf powers were varied between 15 and 25W.
Polymer Samples. A series of poly(tetrafluoroethylene)(PTFE) samples (Small Parts, Miami Lakes, FL) with thicknessesof 1, 1.5, and 3 mm were examined by rf-GDMS. A copolymer,PTFE-co-PFA (Savillex, Minnetonka, MN), composed of PTFE andperfluoromethyl vinyl ether, and a terpolymer film, THV (3M, St.Paul, MN), consisting of PTFE, hexafluoropropylene, and poly-(vinylindene fluoride), were also investigated. To demonstratethis rf-GDMS system’s ability to perform depth profile analysis, amultilayered polymer sample was needed. With the use of aModel CrC-100 plasma deposition system (Plasma Sciences,Lorton, VA), an ∼1 µm Cu layer was grown onto a 1.5 mm thick
(19) Chapman, B. N. Glow Discharge Processes; John Wiley and Sons: New York,1980.
(20) Harrison, W. W.; Barshick, C. M.; Klingler, J. A.; Ratliff, P. H.; Mei, Y. Anal.Chem. 1990, 62, 943A-949A.
(21) Marcus, R. K. Spectroscopy 1992, 7, 12-21.(22) Glow Discharge Spectroscopies; Marcus, R. K., Ed.; Plenum Press: New York,
1993.(23) Brenner, I. B.; Laqua, K.; Dvorachek, M. J. Anal. At. Spectrom. 1987, 2,
623-627.(24) Florian, K.; Fischer, W.; Nickel, H. J. Anal. At. Spectrom. 1994, 9, 257-
262.(25) Duckworth, D. C.; Barshick, C. M.; Smith, D. H. J. Anal. At. Spectrom. 1993,
8, 875-879.(26) Battagliarin, M.; Sentimenti, E.; Scattolin, R. Spectrochim. Acta 1995, 50B,
13-25.(27) Milton, D. M. P.; Hutton, R. C. Spectrochim. Acta 1993, 48B, 39-52.(28) Schelles, W.; DeGendt, S.; Muller, V.; Van Grieken, R. Appl. Spectrosc. 1995,
49, 939-944.(29) Marcus, R. K.; Harville, T. R.; Mei, Y.; Shick, C. R., Jr. Anal. Chem. 1994,
66, 902A-911A.(30) Coburn, J. W.; Eckstein, E. W.; Kay, E. J. Vac. Sci. Technol. 1975, 12, 151-
154.(31) Shick, C. R., Jr.; Marcus, R. K.; Duckworth, D. C.; Smith, D. H.; Wheeler,
D. Anal. Chem., in press.(32) Shick, C. R., Jr.; Marcus, R. K. Appl. Spectrosc., 1996, 50, 454-466.
(33) Shick, C. R., Jr.; Marcus, R. K.; Raith, A. J. Anal. At. Spectrom. 1994, 9,1045-1051.
(34) Shick, C. R., Jr.; Marcus, R. K.; Raith, A. J. Anal. At. Spectrom. 1993, 8,1043-1048.
(35) Duckworth, D. C.; Marcus, R. K. J. Anal. At. Spectrom. 1992, 7, 711-715.
2114 Analytical Chemistry, Vol. 68, No. 13, July 1, 1996
PTFE film. All polymer samples were washed with methanol inorder to remove surface contamination and dried at 25 °C priorto mass spectrometric analysis.
RESULTS AND DISCUSSIONPolymer Fingerprint Spectra. The three PTFE-based samples
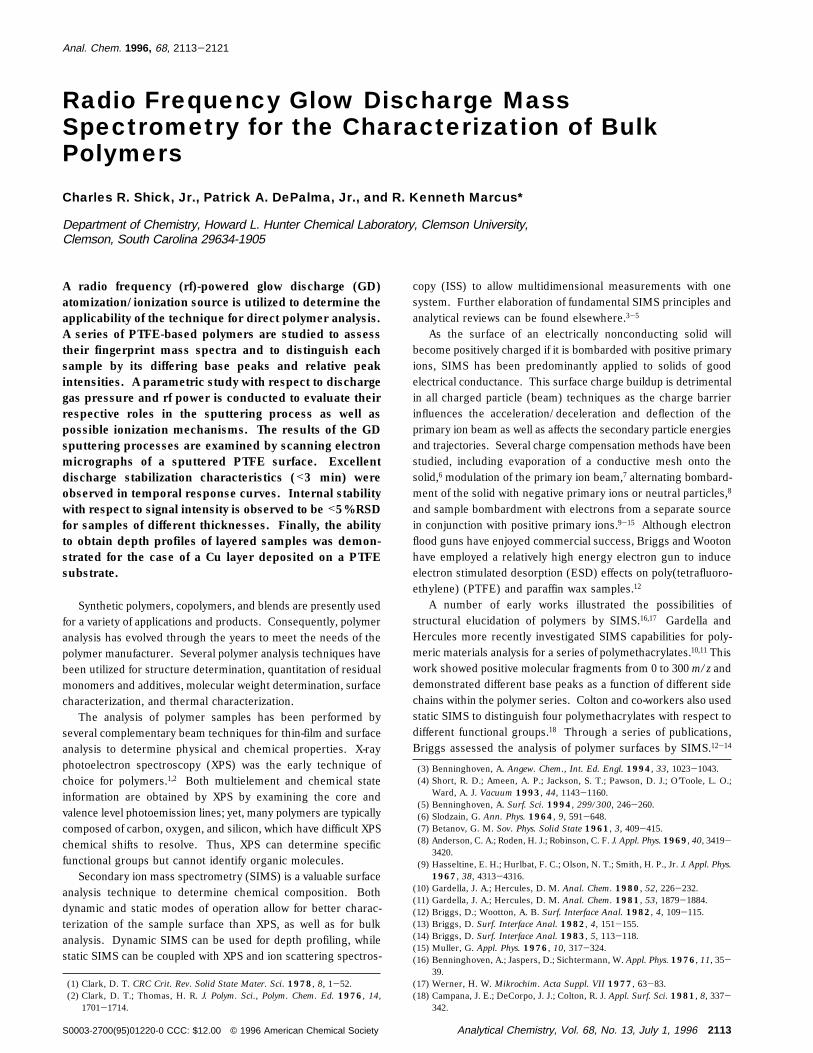
were studied in order to assess the fingerprinting capacity of rf-GDMS. All three samples were analyzed at 20 W rf power and a0.075 mbar discharge gas pressure. Positive ion spectra wereobtained from the Faraday cup detector and are shown in Figures1-3 for the respective polymers. Atomic and molecular ions areshown for these polymers across the range of detection (2-240m/z). The typical Ar discharge gas background peaks are presentat m/z ) 20, 40, and 80, which correspond to 40Ar2+, 40Ar+, and40Ar2
+.The mass spectrum (logarithmic scale) of PTFE by rf-GDMS
is shown in Figure 1. The prominent peaks (>1 × 10⁻¹⁰ A) canbe assigned as 12C+, 31CF+, 50CF2
+, 69CF3+, 119C2F5
+, and 131C3F5+.
All the peaks can be interpreted as fragments of the general
composition CxFy+, with x,y ) 0, 1, 2, ...., n. The outstanding peaks
are labeled in the figure, with the largest fragment in the massrange covered with this quadrupole mass spectrometer having acomposition of 231C5F9
+. Clearly evident is the decrease inintensity as a function of fragment mass. It is important to notehere, and in the subsequent mass spectra, that the analyte(fragment) ion beam currents are quite high, nominally >10-9 A.This is the same level of ion production as seen for the analysisof metals and glasses by this same source. This indicates thatthe energy coupling into the plasma is the same for the polymersas for other solids. With the dual-detector system employed onthis instrument, ion currents down to ∼10-18 A can be effectivelyquantified. Thus, it appears that the rf-GDMS approach topolymer analysis holds the promise of excellent sensitivity.
Positive ion mass spectra from SIMS analysis of PTFE havebeen previously reported using different MS systems and samplepreparations.12,15,17,36,37 The positive and negative mass spectra of
(36) Wheeler, D. R.; Pepper, S. V. J. Vac. Sci. Technol. 1982, 20, 226-232.
Figure 1. rf-GDMS (logarithmic scale) mass spectrum of a 1.5 mm thick PTFE sample: (a) m/z 4-80, (b) m/z 81-160, (c) m/z 161-240 (rfpower, 20 W; argon pressure, 0.075 mbar).
Analytical Chemistry, Vol. 68, No. 13, July 1, 1996 2115
compacted PTFE pellets were acquired by Muller with a quad-rupole-based SIMS system utilizing a filament (electron) sourcefor charge compensation.15 The author noted that the fragmentintensities decreased with higher masses due to a combinationof lower secondary ion yields at larger masses and the inherentmass discrimination of the quadrupole mass filter. Werner alsoused a quadrupole-based SIMS system to produce a positive ionspectrum with intense 31CF+, 69CF3
+, and 131C3F5+ peaks from a
thick PTFE target, again with signal intensity decreasing forhigher mass fragments.17 Briggs and Wootton examined 0.25 mmthick PTFE samples as a function of electron current density froman electron flood source, illustrating electron-stimulated desorption(ESD) of secondary ions.12 The electron current density had aprofound effect on the PTFE fragment ion intensities, demonstrat-ing a PTFE positive ion spectrum with electron currents of aslittle as 8 nA cm-2. Other mass spectra of PTFE samples havebeen reported for characterizing the chemical modifications of
polymer samples induced by X-rays36 and MeV ion beams.37
Comparison of these examples and the spectrum shown in Figure1 reveals no appreciable differences, which is surprising giventhe wide variety of experimental procedures. The coupling ofSIMS and time-of-flight mass analyzers (TOF-SIMS) has enhancedpolymer analysis, permitting simultaneous detection of secondaryions, high transmission efficiency compared to quadrupole massanalyzers, and unlimited mass range (in theory). The enhancedpower of TOF-SIMS systems has been used to analyze polymersamples toward the determination of structural information,molecular weight distribution, and direct identification ofadditives.38-42
(37) Ingemarsson, P. A.; Keane, M. P.; Gelius, U. J. Appl. Phys. 1989, 66, 3548-3553.
(38) Bletsos, I. V.; Hercules, D. M.; Greifendorf, D.; Benninghoven, A. Anal.Chem. 1985, 57, 2384-2388.
(39) Bletsos, I. V.; Hercules, D. M.; Magille, J. H.; Van Leyen, D.; Niehuis, E.;Benninghoven, A. Anal. Chem. 1988, 60, 938-944.
(40) Lub, J.; Benninghoven, A. Org. Mass Spectrom. 1989, 24, 164-168.(41) Linton, R. W.; Mawn, M. P.; Belu, A. M.; DeSimone, J. M.; Hunt, M. O., Jr.;
Menceloglu, Y. Z.; Cramer, H. G.; Benninghoven, A. Surf. Interface Anal.1993, 20, 991-999.
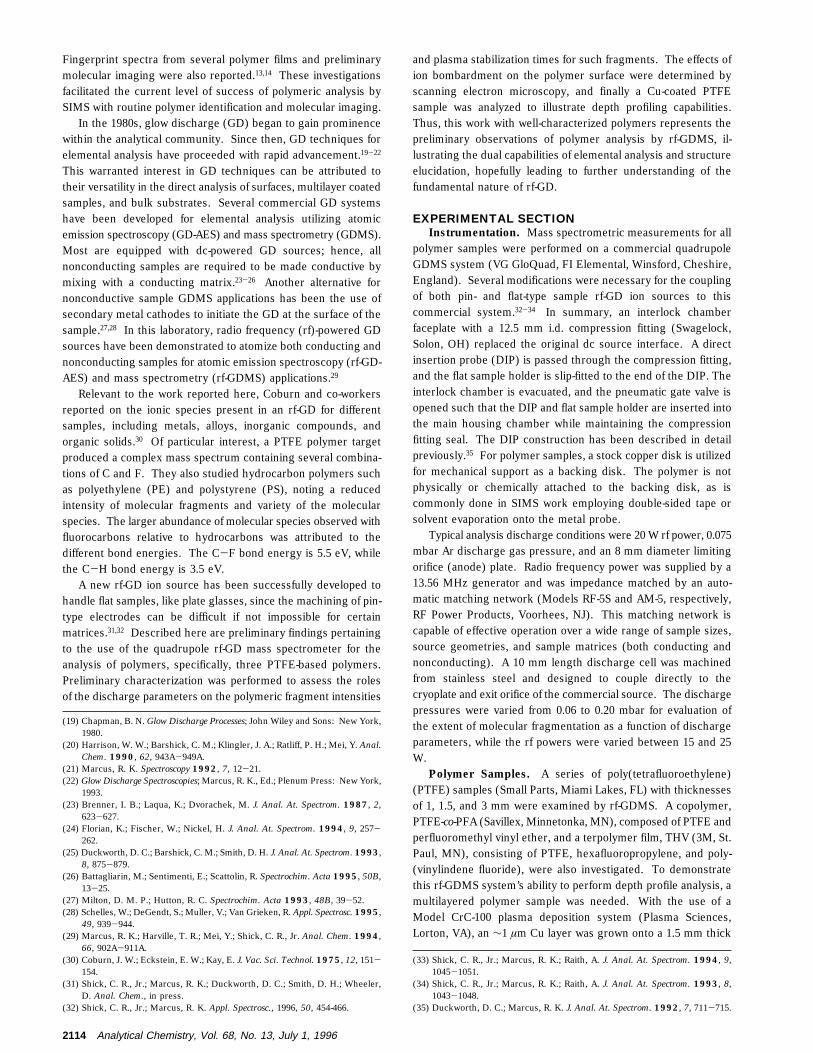
Figure 2. rf-GDMS (logarithmic scale) mass spectrum of a 3.0 mm thick PTFE-co-PFA sample: (a) m/z 4-80, (b) m/z 81-160, (c) m/z161-240 (rf power, 20 W; argon pressure, 0.075 mbar).
2116 Analytical Chemistry, Vol. 68, No. 13, July 1, 1996
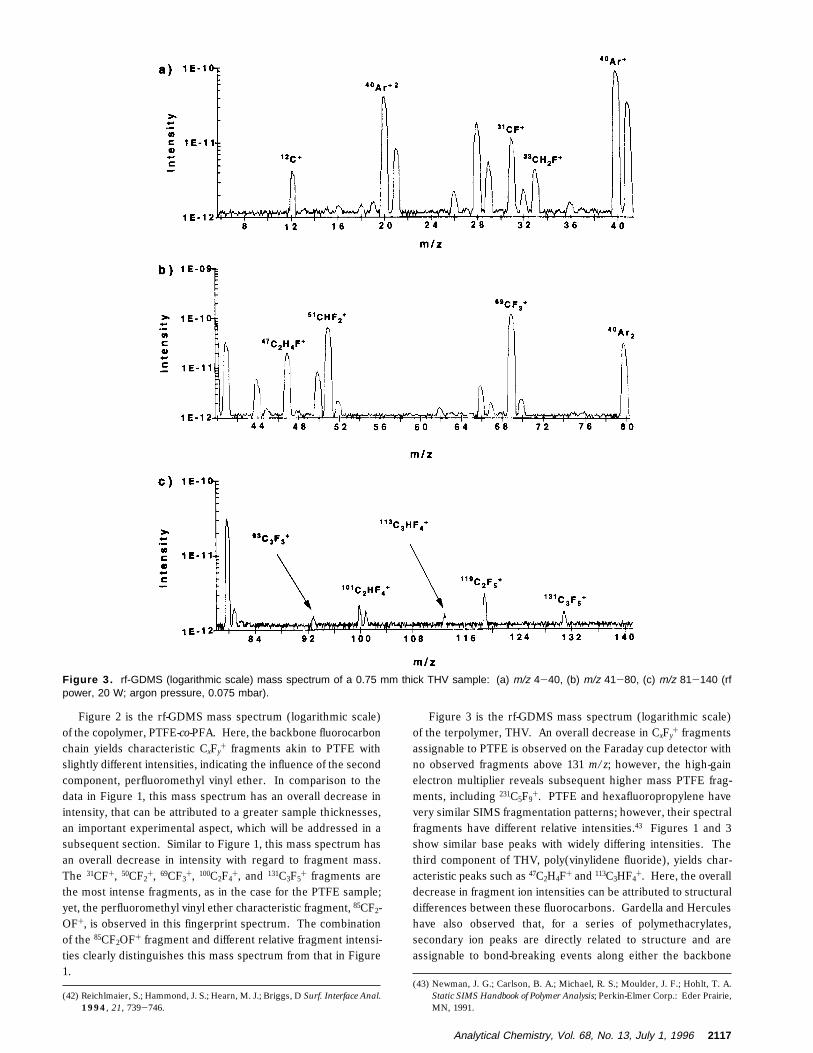
Figure 2 is the rf-GDMS mass spectrum (logarithmic scale)of the copolymer, PTFE-co-PFA. Here, the backbone fluorocarbonchain yields characteristic CxFy
+ fragments akin to PTFE withslightly different intensities, indicating the influence of the secondcomponent, perfluoromethyl vinyl ether. In comparison to thedata in Figure 1, this mass spectrum has an overall decrease inintensity, that can be attributed to a greater sample thicknesses,an important experimental aspect, which will be addressed in asubsequent section. Similar to Figure 1, this mass spectrum hasan overall decrease in intensity with regard to fragment mass.The 31CF+, 50CF2
+, 69CF3+, 100C2F4
+, and 131C3F5+ fragments are
the most intense fragments, as in the case for the PTFE sample;yet, the perfluoromethyl vinyl ether characteristic fragment, 85CF2-OF+, is observed in this fingerprint spectrum. The combinationof the 85CF2OF+ fragment and different relative fragment intensi-ties clearly distinguishes this mass spectrum from that in Figure1.
Figure 3 is the rf-GDMS mass spectrum (logarithmic scale)of the terpolymer, THV. An overall decrease in CxFy
+ fragmentsassignable to PTFE is observed on the Faraday cup detector withno observed fragments above 131 m/z; however, the high-gainelectron multiplier reveals subsequent higher mass PTFE frag-ments, including 231C5F9
+. PTFE and hexafluoropropylene havevery similar SIMS fragmentation patterns; however, their spectralfragments have different relative intensities.43 Figures 1 and 3show similar base peaks with widely differing intensities. Thethird component of THV, poly(vinylidene fluoride), yields char-acteristic peaks such as 47C2H4F+ and 113C3HF4
+. Here, the overalldecrease in fragment ion intensities can be attributed to structuraldifferences between these fluorocarbons. Gardella and Herculeshave also observed that, for a series of polymethacrylates,secondary ion peaks are directly related to structure and areassignable to bond-breaking events along either the backbone
(42) Reichlmaier, S.; Hammond, J. S.; Hearn, M. J.; Briggs, D Surf. Interface Anal.1994, 21, 739-746.
(43) Newman, J. G.; Carlson, B. A.; Michael, R. S.; Moulder, J. F.; Hohlt, T. A.Static SIMS Handbook of Polymer Analysis; Perkin-Elmer Corp.: Eder Prairie,MN, 1991.
Figure 3. rf-GDMS (logarithmic scale) mass spectrum of a 0.75 mm thick THV sample: (a) m/z 4-40, (b) m/z 41-80, (c) m/z 81-140 (rfpower, 20 W; argon pressure, 0.075 mbar).
Analytical Chemistry, Vol. 68, No. 13, July 1, 1996 2117
hydrocarbon chain or the side chain pendant group.10,11 Figures1-3 allude to the fact that varying structures result in differentbase peaks, different relative intensities, and different fragmenta-tion patterns; thus, similar polymers could be distinguished fromone another by rf-GDMS in a manner similar to SIMS.
rf-GD Parametric Influences and Ionization Processes.Previous reports have shown that plasma parameters influencethe analyte intensity and spectral character from various dc-powered GDMS44-46 and rf-GDMS sources.32,33,35,47 This particularrf-GD ion source has been evaluated for elemental analysis ofmetals and glass samples.32 Analysis of organic species by GDMSsources has also been performed by other research groups.Chapman and Pratt obtained mass spectra using a sector-basedmass spectrometer with a thermospray interface and GD acces-sory, inducing fragmentation of caffeine in a controlled mannerto obtain structural information.48 A GDMS source designed byCarrazzato and Bertrand exhibited picogram range detection limitswith a 6 orders of magnitude linear response range for organiccompounds introduced via a liquid chromatography pump.49 Thatwork illustrated that many ionization processes occur simulta-neously in the GD plasma, leading to different fragmentationpathways. GD ionization can produce fragments which are similarto those obtained by electron impact (EI) and chemical ionization(CI) methods. DePalma and co-workers have characterizedfragmentation patterns for GD, EI, and CI ionization sources fororganometallic, inorganic, and organic compounds.50 While thepreviously cited applications were based on GC or LC sampleintroduction, Mason and Milton have, in fact, acquired dc-GD massspectra of several organic compounds, including sucrose andtyrosine, deposited directly onto a copper probe tip.51 That workindicated that sputtering of organic samples was, indeed, possibleand capable of producing mass spectra of intact molecular ions.
The physicochemical processes occurring within the GD havebeen extensively studied.19,22 Neutral atoms and clusters arenormally removed from the sample surface by a cathodic sput-tering process and diffuse into the negative glow region forsubsequent ionization. It is important to note that the molecularions seen in these spectra are the result of the sputter-removal ofneutral species and not the gas-phase association of isolatedatoms/ions. The fragment ions observed in the spectra shownin Figures 1-3 indicate that various ionization processes are quitepossible. The 31CF+, 69CF3
+, 181C4F7+, and 231C5F7
+ fragments couldbe produced by several different pathways. Among the possibleCI reagents present in the discharge, 41ArH+ and 18H3O+ couldproduce the various protonated species like 32CFH+, 70CF3H+, and101C2F4H+. In Figure 3, more protonated species are observedsince one of the pendant side chains is a hydrocarbon. Also, theamount of sample wetness will influence the formation of proto-
nated species. Charge exchange and EI processes could also berationalized for the fragmentation patterns observed in Figures1-3. Penning transfer in the negative glow of the GD is likelyan important mechanism for the formation of organic ions andradicals. In a seemingly unrelated work, Hess and co-workersstudied the effect of methane addition on the argon metastablepopulations in a GD.52 Their work indicated that argon meta-stables efficiently ionize methane, removing this mechanism as ameans of ionizing atomic species present in that discharge. Theextent of Penning ionization present in this rf-GD source cannotbe determined within the discharge source design employed inthese studies.
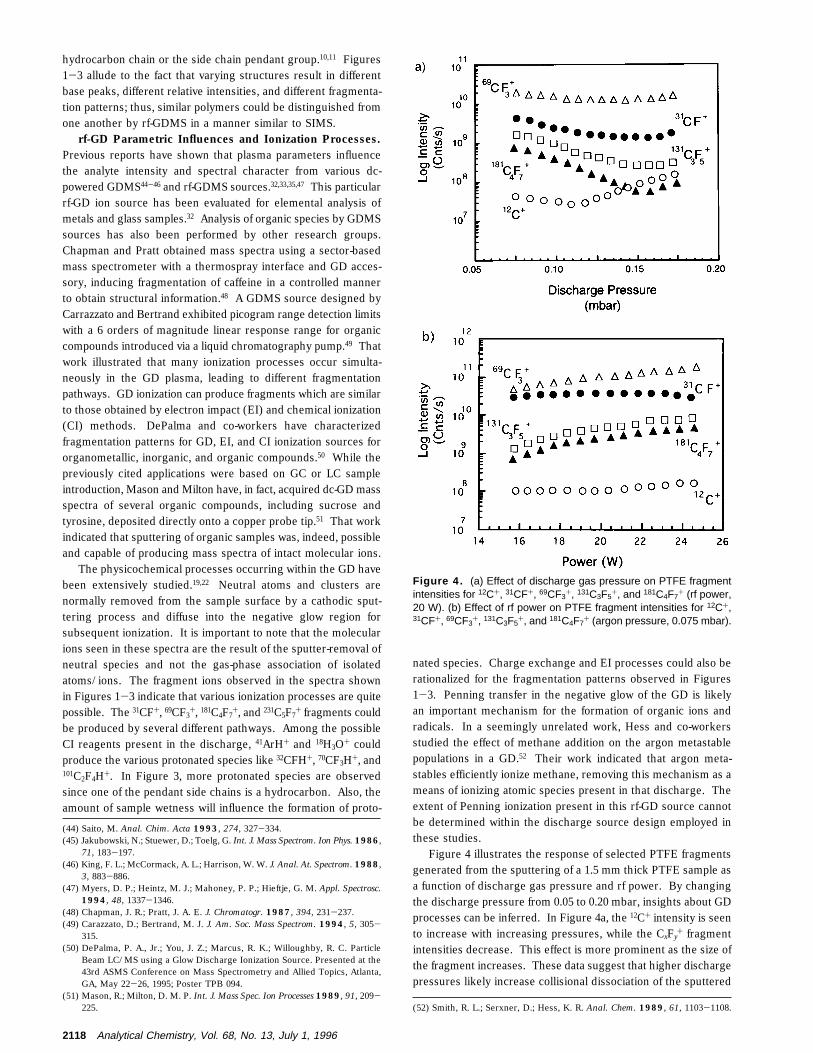
Figure 4 illustrates the response of selected PTFE fragmentsgenerated from the sputtering of a 1.5 mm thick PTFE sample asa function of discharge gas pressure and rf power. By changingthe discharge pressure from 0.05 to 0.20 mbar, insights about GDprocesses can be inferred. In Figure 4a, the 12C+ intensity is seento increase with increasing pressures, while the CxFy
+ fragmentintensities decrease. This effect is more prominent as the size ofthe fragment increases. These data suggest that higher dischargepressures likely increase collisional dissociation of the sputtered
(44) Saito, M. Anal. Chim. Acta 1993, 274, 327-334.(45) Jakubowski, N.; Stuewer, D.; Toelg, G. Int. J. Mass Spectrom. Ion Phys. 1986,
71, 183-197.(46) King, F. L.; McCormack, A. L.; Harrison, W. W. J. Anal. At. Spectrom. 1988,
3, 883-886.(47) Myers, D. P.; Heintz, M. J.; Mahoney, P. P.; Hieftje, G. M. Appl. Spectrosc.
1994, 48, 1337-1346.(48) Chapman, J. R.; Pratt, J. A. E. J. Chromatogr. 1987, 394, 231-237.(49) Carazzato, D.; Bertrand, M. J. J. Am. Soc. Mass Spectrom. 1994, 5, 305-
315.(50) DePalma, P. A., Jr.; You, J. Z.; Marcus, R. K.; Willoughby, R. C. Particle
Beam LC/MS using a Glow Discharge Ionization Source. Presented at the43rd ASMS Conference on Mass Spectrometry and Allied Topics, Atlanta,GA, May 22-26, 1995; Poster TPB 094.
(51) Mason, R.; Milton, D. M. P. Int. J. Mass Spec. Ion Processes 1989, 91, 209-225. (52) Smith, R. L.; Serxner, D.; Hess, K. R. Anal. Chem. 1989, 61, 1103-1108.
Figure 4. (a) Effect of discharge gas pressure on PTFE fragmentintensities for 12C+, 31CF+, 69CF3+, 131C3F5+, and 181C4F7+ (rf power,20 W). (b) Effect of rf power on PTFE fragment intensities for 12C+,31CF+, 69CF3+, 131C3F5+, and 181C4F7+ (argon pressure, 0.075 mbar).
2118 Analytical Chemistry, Vol. 68, No. 13, July 1, 1996
fragments, yielding more 12C+. An analogous response is seenin atomic GDMS, where collisional dissociation of metal dimers(M2
+) has been implied for both rf- and dc-powered GDs withincreases in discharge pressure.32,46
The mechanism of increased gas-phase dissociation as afunction of discharge pressure is discounted when the role ofdischarge power is considered. For a given discharge pressure,subsequent rf power increases have been shown to enhanceanalyte signal intensities in elemental analysis applications32-35 andwould be expected to do so as well for the polymer samples. Thisis seen to be the case in Figure 4b, wherein all of the selectedfragment intensities become more intense across the 15-25 Wrf power range at a constant 0.075 mbar discharge pressure.Similar rf power and discharge pressure results were observedfor both the PTFE-co-PFA and THV samples.
The dc bias voltage characteristics (on the sample surface) ofrf-GDs have been extensively studied.53 As might be expected,increases in applied power result in proportional increases in dcbias values, while an inverse relationship exists between thedischarge pressure and the dc bias. One would expect that higherdc bias values would produce more energetic argon ions arrivingat the sample surface with more kinetic energy to transfer to thesample material. Within certain limitations, higher energy ionswould be more effective at liberating larger clusters/fragmentsfrom the sample surface. This is, in fact, the case in Figure 4b,where the increases in rf power result in the 12C+, 31CF+, and69CF3
+ fragment intensities slightly increasing, while the 131C3F5+
and 181C4F7+ fragment intensities have more pronounced increases.
This must be interpreted as larger fragments being sputtered fromthe sample. The data in Figure 4a support this sort of mechanism,where the 131C3F5
+ and 181C4F7+ fragment intensities are higher
at lower discharge pressures, i.e., where the dc bias values arehighest. It can be concluded, therefore, that the sputteringprocess controls the extent of fragmentation in the rf-GDMSspectra as opposed to gas-phase collisions.
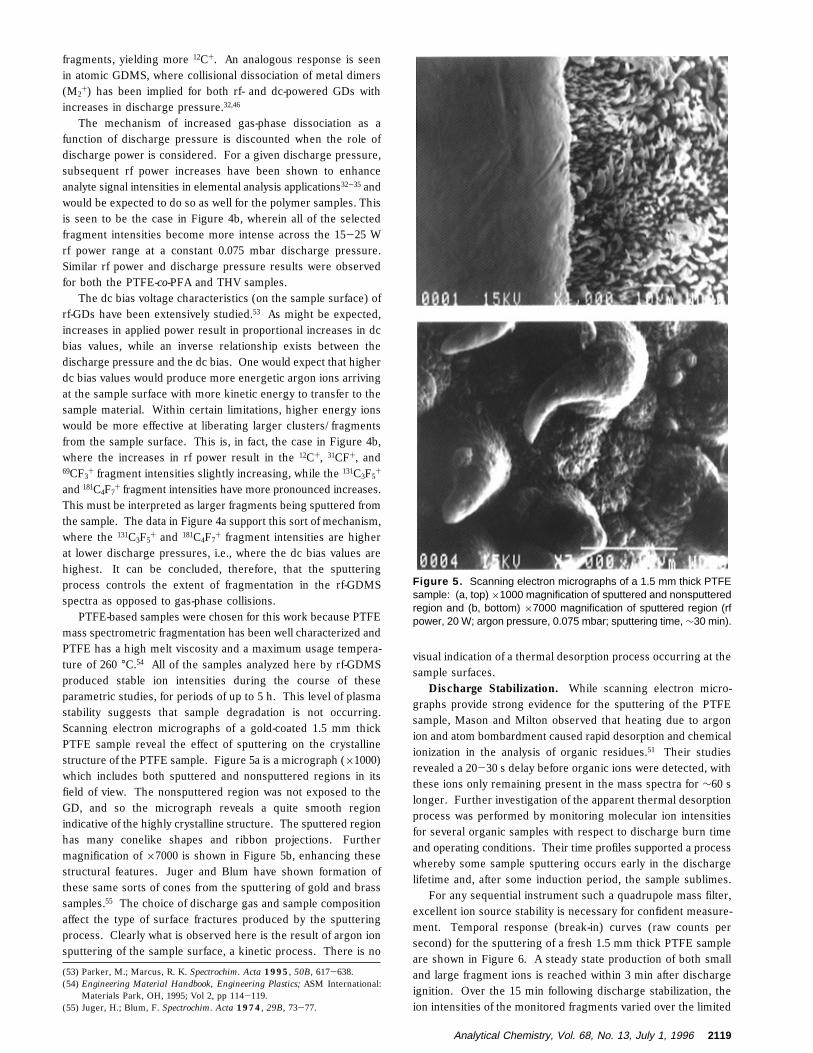
PTFE-based samples were chosen for this work because PTFEmass spectrometric fragmentation has been well characterized andPTFE has a high melt viscosity and a maximum usage tempera-ture of 260 °C.54 All of the samples analyzed here by rf-GDMSproduced stable ion intensities during the course of theseparametric studies, for periods of up to 5 h. This level of plasmastability suggests that sample degradation is not occurring.Scanning electron micrographs of a gold-coated 1.5 mm thickPTFE sample reveal the effect of sputtering on the crystallinestructure of the PTFE sample. Figure 5a is a micrograph (×1000)which includes both sputtered and nonsputtered regions in itsfield of view. The nonsputtered region was not exposed to theGD, and so the micrograph reveals a quite smooth regionindicative of the highly crystalline structure. The sputtered regionhas many conelike shapes and ribbon projections. Furthermagnification of ×7000 is shown in Figure 5b, enhancing thesestructural features. Juger and Blum have shown formation ofthese same sorts of cones from the sputtering of gold and brasssamples.55 The choice of discharge gas and sample compositionaffect the type of surface fractures produced by the sputteringprocess. Clearly what is observed here is the result of argon ionsputtering of the sample surface, a kinetic process. There is no
visual indication of a thermal desorption process occurring at thesample surfaces.
Discharge Stabilization. While scanning electron micro-graphs provide strong evidence for the sputtering of the PTFEsample, Mason and Milton observed that heating due to argonion and atom bombardment caused rapid desorption and chemicalionization in the analysis of organic residues.51 Their studiesrevealed a 20-30 s delay before organic ions were detected, withthese ions only remaining present in the mass spectra for ∼60 slonger. Further investigation of the apparent thermal desorptionprocess was performed by monitoring molecular ion intensitiesfor several organic samples with respect to discharge burn timeand operating conditions. Their time profiles supported a processwhereby some sample sputtering occurs early in the dischargelifetime and, after some induction period, the sample sublimes.
For any sequential instrument such a quadrupole mass filter,excellent ion source stability is necessary for confident measure-ment. Temporal response (break-in) curves (raw counts persecond) for the sputtering of a fresh 1.5 mm thick PTFE sampleare shown in Figure 6. A steady state production of both smalland large fragment ions is reached within 3 min after dischargeignition. Over the 15 min following discharge stabilization, theion intensities of the monitored fragments varied over the limited
(53) Parker, M.; Marcus, R. K. Spectrochim. Acta 1995, 50B, 617-638.(54) Engineering Material Handbook, Engineering Plastics; ASM International:
Materials Park, OH, 1995; Vol 2, pp 114-119.(55) Juger, H.; Blum, F. Spectrochim. Acta 1974, 29B, 73-77.
Figure 5. Scanning electron micrographs of a 1.5 mm thick PTFEsample: (a, top) ×1000 magnification of sputtered and nonsputteredregion and (b, bottom) ×7000 magnification of sputtered region (rfpower, 20 W; argon pressure, 0.075 mbar; sputtering time, ∼30 min).
Analytical Chemistry, Vol. 68, No. 13, July 1, 1996 2119
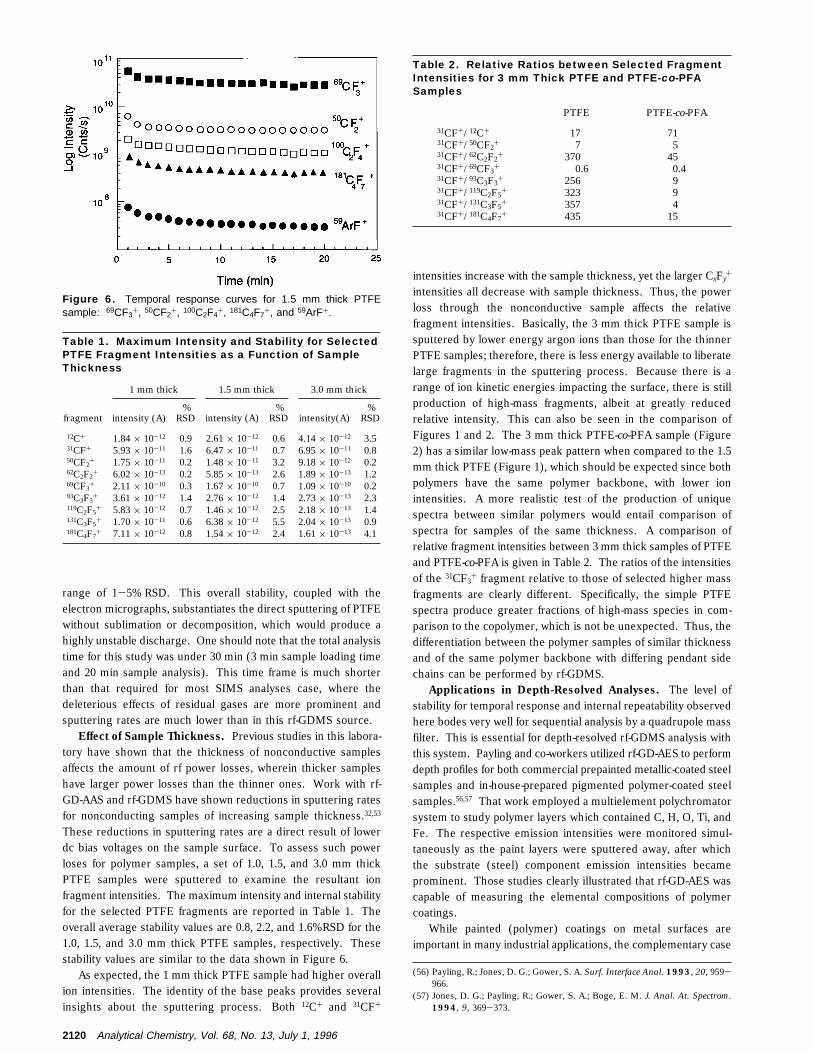
range of 1-5% RSD. This overall stability, coupled with theelectron micrographs, substantiates the direct sputtering of PTFEwithout sublimation or decomposition, which would produce ahighly unstable discharge. One should note that the total analysistime for this study was under 30 min (3 min sample loading timeand 20 min sample analysis). This time frame is much shorterthan that required for most SIMS analyses case, where thedeleterious effects of residual gases are more prominent andsputtering rates are much lower than in this rf-GDMS source.
Effect of Sample Thickness. Previous studies in this labora-tory have shown that the thickness of nonconductive samplesaffects the amount of rf power losses, wherein thicker sampleshave larger power losses than the thinner ones. Work with rf-GD-AAS and rf-GDMS have shown reductions in sputtering ratesfor nonconducting samples of increasing sample thickness.32,53
These reductions in sputtering rates are a direct result of lowerdc bias voltages on the sample surface. To assess such powerloses for polymer samples, a set of 1.0, 1.5, and 3.0 mm thickPTFE samples were sputtered to examine the resultant ionfragment intensities. The maximum intensity and internal stabilityfor the selected PTFE fragments are reported in Table 1. Theoverall average stability values are 0.8, 2.2, and 1.6% RSD for the1.0, 1.5, and 3.0 mm thick PTFE samples, respectively. Thesestability values are similar to the data shown in Figure 6.
As expected, the 1 mm thick PTFE sample had higher overallion intensities. The identity of the base peaks provides severalinsights about the sputtering process. Both 12C+ and 31CF+
intensities increase with the sample thickness, yet the larger CxFy+
intensities all decrease with sample thickness. Thus, the powerloss through the nonconductive sample affects the relativefragment intensities. Basically, the 3 mm thick PTFE sample issputtered by lower energy argon ions than those for the thinnerPTFE samples; therefore, there is less energy available to liberatelarge fragments in the sputtering process. Because there is arange of ion kinetic energies impacting the surface, there is stillproduction of high-mass fragments, albeit at greatly reducedrelative intensity. This can also be seen in the comparison ofFigures 1 and 2. The 3 mm thick PTFE-co-PFA sample (Figure2) has a similar low-mass peak pattern when compared to the 1.5mm thick PTFE (Figure 1), which should be expected since bothpolymers have the same polymer backbone, with lower ionintensities. A more realistic test of the production of uniquespectra between similar polymers would entail comparison ofspectra for samples of the same thickness. A comparison ofrelative fragment intensities between 3 mm thick samples of PTFEand PTFE-co-PFA is given in Table 2. The ratios of the intensitiesof the 31CF3
+ fragment relative to those of selected higher massfragments are clearly different. Specifically, the simple PTFEspectra produce greater fractions of high-mass species in com-parison to the copolymer, which is not be unexpected. Thus, thedifferentiation between the polymer samples of similar thicknessand of the same polymer backbone with differing pendant sidechains can be performed by rf-GDMS.
Applications in Depth-Resolved Analyses. The level ofstability for temporal response and internal repeatability observedhere bodes very well for sequential analysis by a quadrupole massfilter. This is essential for depth-resolved rf-GDMS analysis withthis system. Payling and co-workers utilized rf-GD-AES to performdepth profiles for both commercial prepainted metallic-coated steelsamples and in-house-prepared pigmented polymer-coated steelsamples.56,57 That work employed a multielement polychromatorsystem to study polymer layers which contained C, H, O, Ti, andFe. The respective emission intensities were monitored simul-taneously as the paint layers were sputtered away, after whichthe substrate (steel) component emission intensities becameprominent. Those studies clearly illustrated that rf-GD-AES wascapable of measuring the elemental compositions of polymercoatings.
While painted (polymer) coatings on metal surfaces areimportant in many industrial applications, the complementary case
(56) Payling, R.; Jones, D. G.; Gower, S. A. Surf. Interface Anal. 1993, 20, 959-966.
(57) Jones, D. G.; Payling, R.; Gower, S. A.; Boge, E. M. J. Anal. At. Spectrom.1994, 9, 369-373.
Figure 6. Temporal response curves for 1.5 mm thick PTFEsample: 69CF3+, 50CF2+, 100C2F4+, 181C4F7+, and 59ArF+.
Table 1. Maximum Intensity and Stability for SelectedPTFE Fragment Intensities as a Function of SampleThickness
1 mm thick 1.5 mm thick 3.0 mm thick
fragment intensity (A)%
RSD intensity (A)%
RSD intensity(A)%
RSD
12C+ 1.84 × 10⁻¹² 0.9 2.61 × 10⁻¹² 0.6 4.14 × 10⁻¹² 3.531CF+ 5.93 × 10⁻¹¹ 1.6 6.47 × 10⁻¹¹ 0.7 6.95 × 10⁻¹¹ 0.850CF2
+ 1.75 × 10⁻¹¹ 0.2 1.48 × 10⁻¹¹ 3.2 9.18 × 10⁻¹² 0.262C2F2
+ 6.02 × 10⁻¹³ 0.2 5.85 × 10⁻¹³ 2.6 1.89 × 10⁻¹³ 1.269CF3
+ 2.11 × 10⁻¹⁰ 0.3 1.67 × 10⁻¹⁰ 0.7 1.09 × 10⁻¹⁰ 0.293C3F3
+ 3.61 × 10⁻¹² 1.4 2.76 × 10⁻¹² 1.4 2.73 × 10⁻¹³ 2.3119C2F5
+ 5.83 × 10⁻¹² 0.7 1.46 × 10⁻¹² 2.5 2.18 × 10⁻¹³ 1.4131C3F5
+ 1.70 × 10⁻¹¹ 0.6 6.38 × 10⁻¹² 5.5 2.04 × 10⁻¹³ 0.9181C4F7
+ 7.11 × 10⁻¹² 0.8 1.54 × 10⁻¹² 2.4 1.61 × 10⁻¹³ 4.1
Table 2. Relative Ratios between Selected FragmentIntensities for 3 mm Thick PTFE and PTFE-co-PFASamples
PTFE PTFE-co-PFA
31CF+/12C+ 17 7131CF+/50CF2
+ 7 531CF+/62C2F2
+ 370 4531CF+/69CF3
+ 0.6 0.431CF+/93C3F3
+ 256 931CF+/119C2F5
+ 323 931CF+/131C3F5
+ 357 431CF+/181C4F7
+ 435 15
2120 Analytical Chemistry, Vol. 68, No. 13, July 1, 1996
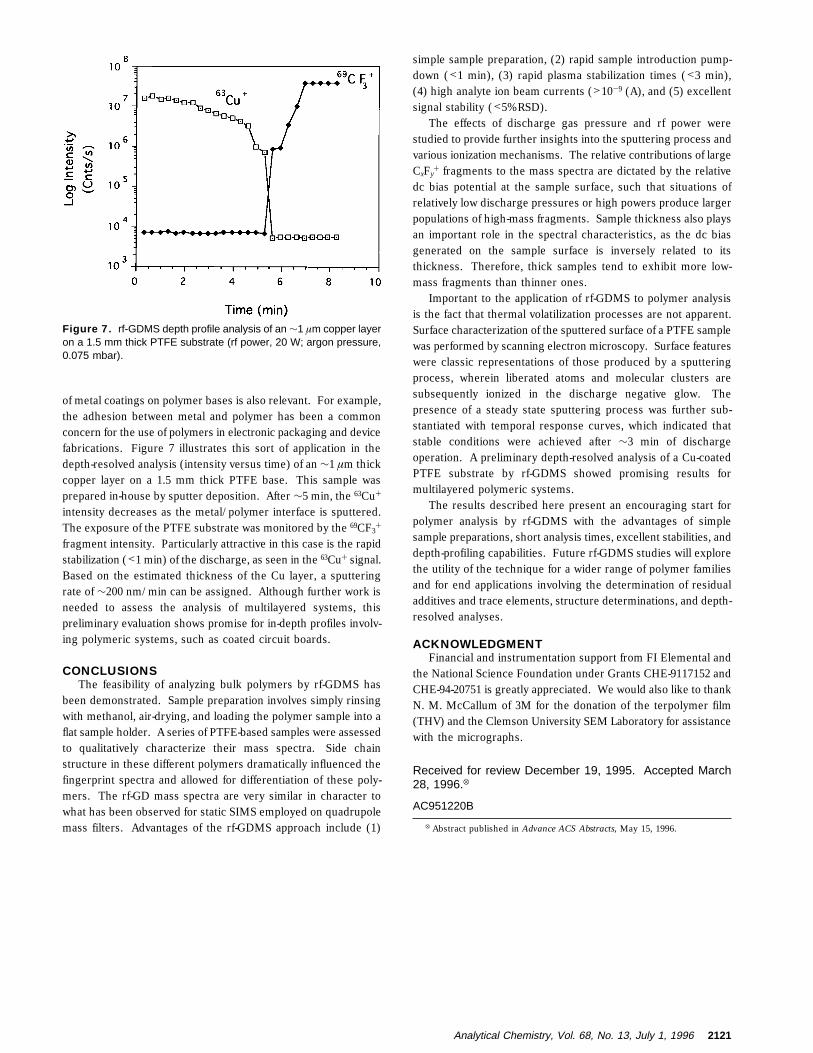
of metal coatings on polymer bases is also relevant. For example,the adhesion between metal and polymer has been a commonconcern for the use of polymers in electronic packaging and devicefabrications. Figure 7 illustrates this sort of application in thedepth-resolved analysis (intensity versus time) of an ∼1 µm thickcopper layer on a 1.5 mm thick PTFE base. This sample wasprepared in-house by sputter deposition. After ∼5 min, the 63Cu+
intensity decreases as the metal/polymer interface is sputtered.The exposure of the PTFE substrate was monitored by the 69CF3
+
fragment intensity. Particularly attractive in this case is the rapidstabilization (<1 min) of the discharge, as seen in the 63Cu+ signal.Based on the estimated thickness of the Cu layer, a sputteringrate of ∼200 nm/min can be assigned. Although further work isneeded to assess the analysis of multilayered systems, thispreliminary evaluation shows promise for in-depth profiles involv-ing polymeric systems, such as coated circuit boards.
CONCLUSIONSThe feasibility of analyzing bulk polymers by rf-GDMS has
been demonstrated. Sample preparation involves simply rinsingwith methanol, air-drying, and loading the polymer sample into aflat sample holder. A series of PTFE-based samples were assessedto qualitatively characterize their mass spectra. Side chainstructure in these different polymers dramatically influenced thefingerprint spectra and allowed for differentiation of these poly-mers. The rf-GD mass spectra are very similar in character towhat has been observed for static SIMS employed on quadrupolemass filters. Advantages of the rf-GDMS approach include (1)
simple sample preparation, (2) rapid sample introduction pump-down (<1 min), (3) rapid plasma stabilization times (<3 min),(4) high analyte ion beam currents (>10-9 (A), and (5) excellentsignal stability (<5% RSD).
The effects of discharge gas pressure and rf power werestudied to provide further insights into the sputtering process andvarious ionization mechanisms. The relative contributions of largeCxFy
+ fragments to the mass spectra are dictated by the relativedc bias potential at the sample surface, such that situations ofrelatively low discharge pressures or high powers produce largerpopulations of high-mass fragments. Sample thickness also playsan important role in the spectral characteristics, as the dc biasgenerated on the sample surface is inversely related to itsthickness. Therefore, thick samples tend to exhibit more low-mass fragments than thinner ones.
Important to the application of rf-GDMS to polymer analysisis the fact that thermal volatilization processes are not apparent.Surface characterization of the sputtered surface of a PTFE samplewas performed by scanning electron microscopy. Surface featureswere classic representations of those produced by a sputteringprocess, wherein liberated atoms and molecular clusters aresubsequently ionized in the discharge negative glow. Thepresence of a steady state sputtering process was further sub-stantiated with temporal response curves, which indicated thatstable conditions were achieved after ∼3 min of dischargeoperation. A preliminary depth-resolved analysis of a Cu-coatedPTFE substrate by rf-GDMS showed promising results formultilayered polymeric systems.
The results described here present an encouraging start forpolymer analysis by rf-GDMS with the advantages of simplesample preparations, short analysis times, excellent stabilities, anddepth-profiling capabilities. Future rf-GDMS studies will explorethe utility of the technique for a wider range of polymer familiesand for end applications involving the determination of residualadditives and trace elements, structure determinations, and depth-resolved analyses.
ACKNOWLEDGMENTFinancial and instrumentation support from FI Elemental and
the National Science Foundation under Grants CHE-9117152 andCHE-94-20751 is greatly appreciated. We would also like to thankN. M. McCallum of 3M for the donation of the terpolymer film(THV) and the Clemson University SEM Laboratory for assistancewith the micrographs.
Received for review December 19, 1995. Accepted March28, 1996.X
AC951220B
X Abstract published in Advance ACS Abstracts, May 15, 1996.
Figure 7. rf-GDMS depth profile analysis of an ∼1 µm copper layeron a 1.5 mm thick PTFE substrate (rf power, 20 W; argon pressure,0.075 mbar).
Analytical Chemistry, Vol. 68, No. 13, July 1, 1996 2121