radio access network (utran) modeling for...
TRANSCRIPT
Radio Access Network (UTRAN) Modeling for
Heterogenous Network Simulations
Frida Gunnarsson, Anders Bjorsson, Bjorn Knutsson,Fredrik Gunnarsson, Fredrik Gustafsson
Control & Communication
Department of Electrical Engineering
Linkopings universitet, SE-581 83 Linkoping, Sweden
WWW: http://www.control.isy.liu.se
E-mail: [email protected], [email protected],[email protected], [email protected],
14th August 2003
AUTOMATIC CONTROL
COMMUNICATION SYSTEMS
LINKÖPING
Report no.: LiTH-ISY-R-2533
Technical reports from the Control & Communication group in Linkoping areavailable at http://www.control.isy.liu.se/publications.
Abstract
The vision of mobile Internet comprises heterogeneous networks withboth wired and wireless infrastructures. The network parts are typicallyradio access network, core network, service network, Internet, etc. Dueto the multitude of nodes and users in such networks and the compli-cated nature of layered communications protocols, performance analysisthrough simulations is crucial. The open source network simulation tool,ns-2, is widely used for simulating the behavior of wired, routed networks.This work adds modules to model radio access network nodes and emulatetypical behavior of UTRAN (UMTS Terrestrial Radio Access Network) –the 3G standard opted for in Europe and Japan. Furthermore, data com-munication examples illustrate typical behavior of such a heterogeneousnetwork.
Keywords: TCP, WCDMA, Internet, simulation, implementation
Radio Access Network (UTRAN) Modeling for
Heterogenous Network Simulations
Frida Gunnarsson†, Anders Bjorsson†, Bjorn Knutsson†,
Fredrik Gunnarsson†‡, Fredrik Gustafsson†,
†Division of Communication SystemsDepartement of Electrical Engineering
Linkopings UniversitetSE-581 83 Linkoping, Sweden
‡Ericsson ResearchP.O. Box 1248
SE-581 12 Linkoping, Sweden
Corresponding authors:Frida Gunnarsson ([email protected])Fredrik Gunnarsson ([email protected])
Abstract
The vision of mobile Internet comprises heterogeneous networks with both wiredand wireless infrastructures. The network parts are typically radio access network,core network, service network, Internet, etc. Due to the multitude of nodes and usersin such networks and the complicated nature of layered communications protocols,performance analysis through simulations is crucial. The open source network simu-lation tool, ns-2, is widely used for simulating the behavior of wired, routed networks.This work adds modules to model radio access network nodes and emulate typicalbehavior of UTRAN (UMTS Terrestrial Radio Access Network) – the 3G standardopted for in Europe and Japan. Furthermore, data communication examples illustratetypical behavior of such a heterogeneous network.
1 Introduction
The performance of network communications have been an interesting issue since the birthof the Internet in the 1960’s. When new technologies emerge and are supposed to interactwith old ones this is even more so. The ambition of future wireless systems is to enablealmost all data communication services available from an Internet-connected stationarycomputer together with the mobile services that are already present. Moreover, newwireless infrastructure enable more advanced services from dedicated third-party serviceproviders. Therefore, the interaction between the wireless and wired infrastructure is ofgreat interest and it is important to understand where problems may arise and also trynew solutions.
1

Today the main tool for performance evaluation of existing and new structures issimulations, due to the complexity of the network. The behavior of the Internet hasbeen thoroughly studied on different levels, e.g., control functions (Balakrishnan et al.,1998; Barakat et al., 2000; Zhu et al., 2002), and different requirements on the datatransfer (Maniatis et al., 2002). When considering using control functions such as theTransport Control Protocol (TCP) over wireless links, some unwanted behavior comeabout (Xylomenos et al., 2001). These effects have been investigated both using analyticalmodels, e.g. (Peisa and Meyer, 2001) and simulator environments e.g. (Balkat et al., 2002;Heier et al., 2002; Sachs, 2000; Xu et al., 2002; Zhang and Su, 2002). Some of thesestudies include simplistic models of the fixed network (essentially modeled by a delay).Such models are applicable when the service is provided to the radio access network via anetwork with service guarantees and very little delay jitter.
The existing simulator environments are diverse, it is common to use in-house de-veloped testbeds well-suited for a particular study (Brakmo and Peterson, 1995; Kaldenet al., 2000; Meyer, 1999). Another approach is to use one of the existing network simu-lators. REAL (Keshav, 1997; Sim 1) and NS (Sim 2) are both open source and providethe basic protocol modules for network simulations. They also assure easy inclusion ofnew implementations. OPNET (Sim 3) is a commercial software for network simulationswith support, but new algorithms are harder to try. For radio access network simulationsmostly proprietary environments are used.
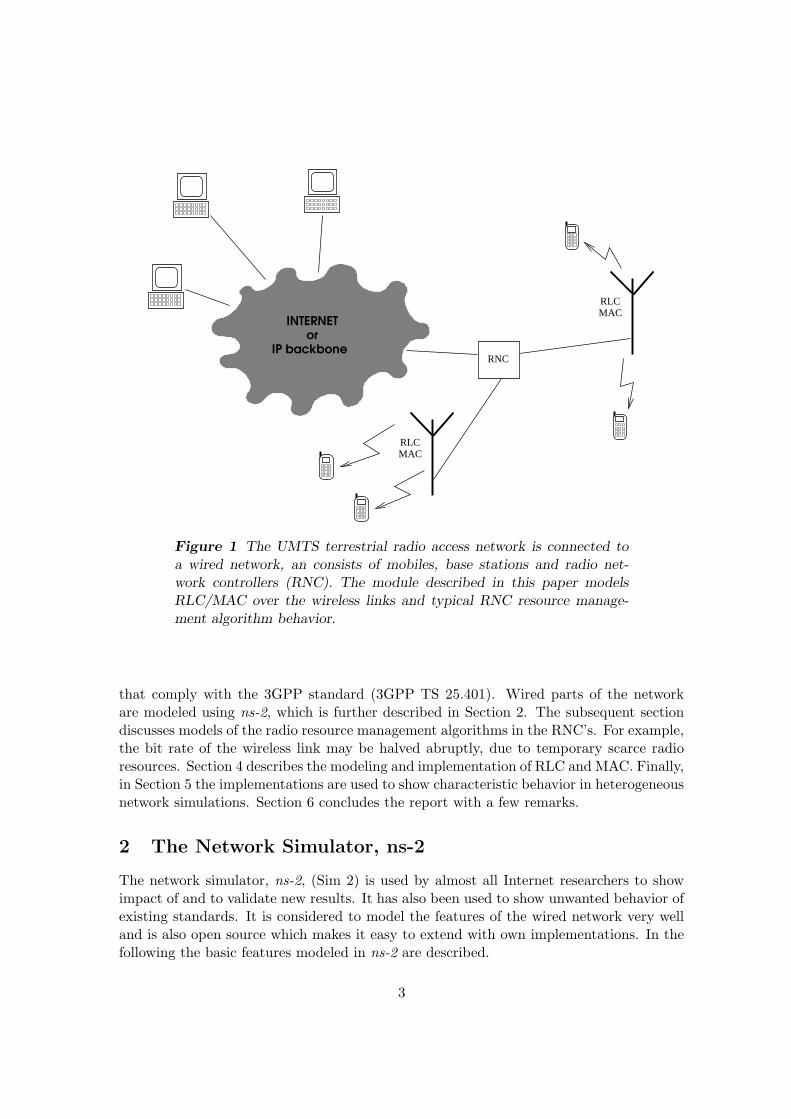
The main focus in this work is on the UMTS (Universal Mobile Telephony System)Terrestrial Radio Access Network (UTRAN) connected to a wired network, see Figure 1.The radio access network consists of User Equipment (UE) or mobiles connected to basestations. Both the mobiles and the base stations are controlled by radio network controller(RNC). The RNC connects to the UMTS core network, which typically is a wired network,and bridges to other operator’s networks, the public-switched telephony network, theInternet, and other nodes and networks managed by the wireless operator. Data transportover the wireless links is carried by the physical layer, but controlled by a layer for radiolink control (RLC) and media access control (MAC). Both these protocols terminate in theRNC. The RNC is also responsible for managing the radio resources of each base stationand communicates control actions to the mobile using the radio resource control (RRC)protocol. Each time a service is initiated, the RNC and the core network negotiatesa Radio Access Bearer (RAB) with requirements on for example guaranteed bit rate,minimum delay etc over the radio access network. The RNC may alter the properties ofthe wireless links over time as long as these requirements are met. This could be neededin order to utilize the radio resources efficiently.
Services may be accessed from servers on the Internet. An alternative is when servicesare made available through a service network (Johnston et al., 2003), which handles ser-vices from the operator and third-part service providers as well as billing, authorizationetc via an IP infrastructure. A realistic model of the network between the server provid-ing the service and the radio access network is therefore a wired, routed network. Thus,the dynamics of TCP and interactions with other traffic flows over the wired part of thenetwork need to be more accurately modeled than simply assuming an additional delay.
This paper describes modeling and simulation of radio access network components
2
RLCMAC
RLCMAC
INTERNET
IP backboneor
RNC
Figure 1 The UMTS terrestrial radio access network is connected toa wired network, an consists of mobiles, base stations and radio net-work controllers (RNC). The module described in this paper modelsRLC/MAC over the wireless links and typical RNC resource manage-ment algorithm behavior.
that comply with the 3GPP standard (3GPP TS 25.401). Wired parts of the networkare modeled using ns-2, which is further described in Section 2. The subsequent sectiondiscusses models of the radio resource management algorithms in the RNC’s. For example,the bit rate of the wireless link may be halved abruptly, due to temporary scarce radioresources. Section 4 describes the modeling and implementation of RLC and MAC. Finally,in Section 5 the implementations are used to show characteristic behavior in heterogeneousnetwork simulations. Section 6 concludes the report with a few remarks.
2 The Network Simulator, ns-2
The network simulator, ns-2, (Sim 2) is used by almost all Internet researchers to showimpact of and to validate new results. It has also been used to show unwanted behavior ofexisting standards. It is considered to model the features of the wired network very welland is also open source which makes it easy to extend with own implementations. In thefollowing the basic features modeled in ns-2 are described.
3
2.1 Protocols
The protocol stack is implemented from the application layer down to the network layer.More information on layers and protocol features can be found in (Stevens, 1994), andfor example TCP details are left out here. The network layer in ns-2 consists of differentrouting schemes, such as unicast, multicast and hierarchical routing, and the transportand application layer are defined by real Internet standards.
Both UDP (User Datagram Protocol) and TCP with different versions are implementedfor the transport layer. For TCP there are a number of configurable parameters to obtainthe wanted performance. The implemented versions are briefly described below.
Tahoe is the basic TCP-agent which is very similar to the TCP version released togetherwith 4.3BSD UNIX system release, a.k.a “Tahoe”. It performs slow start and con-gestion avoidance. On congestion it reinitializes the congestion window.
Reno and NewReno perform like Tahoe but also include fast recovery and fast re-transmit, i.e., they do not reinitialize the congestion window after three duplicateacknowledgments, but decrease it slightly.
Vegas uses a different updating mechanism for its congestion window (Brakmo and Pe-terson, 1995).
Sack and Fack TCP uses different schemes for acknowledgments.
There is also the possibility of using the delayed ACK mechanism for the receiver. DuplexTCP is only available for the Reno version yet.
For the application layer two choices exist. Either a traffic generator is used or asimulated application. For the traffic generator different distributions for the length of theon and off periods exists, exponential and Pareto. During the on periods data is sent witha constant bit rate. It is also possible to use a trace file that defines the packet deliveriesor only a constant bit rate.
The FTP application simulates bulk data transfer over a certain time span or for acertain number of packets. The telnet application generates packets with either exponen-tially distributed inter-packet times or according to an internal distribution called tcplib.There is also a implementation of a web cache or a HTTP application.
2.2 Network Layout
In ns-2 it is possible to totally design the network. Nodes and links can be arbitrarilyconnected and the delays and bandwidths chosen freely for each link. The nodes handlepacket forwarding and can be both receivers and routers at the same time. There are bothunicast and multicast nodes.
Queues can be connected to a link between two nodes. Several models are implementedfor setting up the queue. The type of dropping (or forwarding) procedure can be chosenfrom drop-tail, stochastic fair queuing, random early detection, class based queuing andround robin scheduling.
4
2.3 Packet Error Models
To introduce packet losses in the simulation, ns-2 uses error models. An error model is alink-level packet loss that can be attached to any link in wired topologies and any nodein wireless topologies. The size of the error can be selected by means of corrupting abit, a byte or the whole packet. The erroneous packet is then either marked by settingthe error flag in the header or by sending it to a drop target instead of the originaldestination. Which entity to corrupt can be selected in a variety of ways, some of thealready implemented ones are described below.
Rate based is a simple model with a configurable rate at which the entities are corrupted.
Deterministic has a predefined list of which entities to corrupt.
Timer based uses timers to determine which entities to corrupt.
Twostate is a more complex model that uses a two state automata with dropping rates0 and 1 for the two states and configurable state change probabilities.
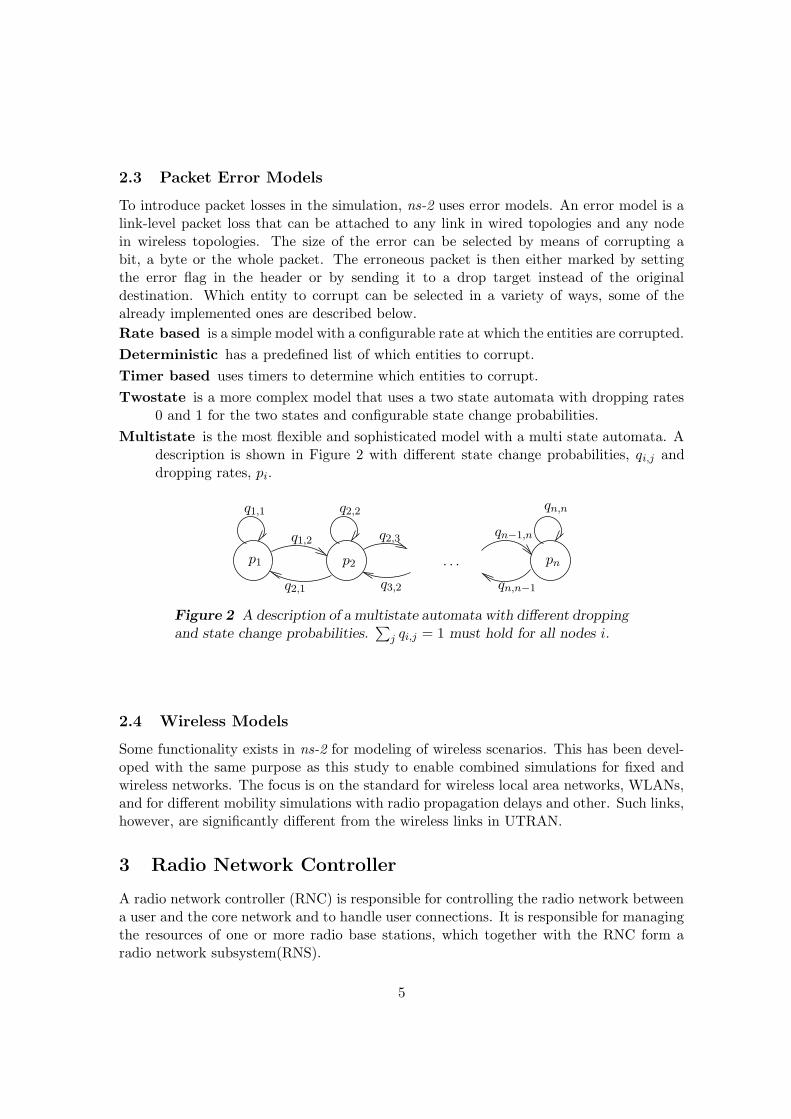
Multistate is the most flexible and sophisticated model with a multi state automata. Adescription is shown in Figure 2 with different state change probabilities, qi,j anddropping rates, pi.
. . .
PSfrag replacements
q1,1
q1,2
q2,1
q2,2
q2,3
q3,2
qn,n
qn−1,n
qn,n−1
p1 p2 pn
Figure 2 A description of a multistate automata with different droppingand state change probabilities.
∑j qi,j = 1 must hold for all nodes i.
2.4 Wireless Models
Some functionality exists in ns-2 for modeling of wireless scenarios. This has been devel-oped with the same purpose as this study to enable combined simulations for fixed andwireless networks. The focus is on the standard for wireless local area networks, WLANs,and for different mobility simulations with radio propagation delays and other. Such links,however, are significantly different from the wireless links in UTRAN.
3 Radio Network Controller
A radio network controller (RNC) is responsible for controlling the radio network betweena user and the core network and to handle user connections. It is responsible for managingthe resources of one or more radio base stations, which together with the RNC form aradio network subsystem(RNS).
5
RNC provides the following main services in a 3G system (3GPP TS 25.401, pp. 23-26):
• Admission and congestion control is described in 3.1.
• User mobility is discussed in 3.2
• Transfer of user data is discussed in 3.3.
• Radio resource management is described in 3.4
The current implementation of the module contains only some limited resource manage-ment functionality, and the data transfer part restricted to only best effort traffic.
3.1 Admission and Congestion Control
Admission control is applied to new user connections, e.g., newly established or causedby hand-over due to user mobility. The purpose is to try to avoid overload in the RNSand maintain the quality of existing radio links. The decision to admit or reject is basedon base station power output and interference levels from already connected users. Ifoverload occurs with the existing radio links, a congestion control mechanism is appliedwhich disconnects one or several radio links.
3.2 User Mobility
To allow users to move around and continuously be connected while moving, the RNCcontrols which base-station the user is connected to. When the user gets too far from itscurrent base station, the RNC initiates a switch to a closer base station with a hand-over.To support movement over a larger area, RNCs are interconnected and each RNC allowsthe use of their controlled base stations to other RNCs. When the user have moved farenough so that it is only connected to base stations controlled by a different RNC thanthe one that is currently managing the user connection, the new RNC can be assignedcontrol of the connection in an inter-RNC hand-over.
3.3 Transfer of User Data
One of the main concepts of 3G is to support connections with Quality of Service (QoS)attributes. In order to do so, resources have to be reserved throughout the entire system foreach connection. In the RNC, this is done by applying admission control on the connectionand assigning it to a certain QoS class. Each class is associated with a number of QoSattributes, specified in (3GPP TS 23.107, pp. 18-25). These attributes are negotiatedbetween the core network and the RNC to determine the appropriate radio access bearer(RAB) for the service. Then the RNC allocates and re-allocates resources to fulfill theRAB service.
One of the attributes is maximum bit rate Rm, which is used to limit the data sentover each connection through the RNC. Furthermore, not any rate is realizable by theradio access network. Typically, a number J of pre-defined formats are defined, each witha specific rate rj , j = 1, . . . , J . The result of the RAB negotiation given the radio access
6
network link limitations is therefore modeled as a list of ordered rates, and the momentaryflow rate Ri of a user belongs to this list, i.e.
Ri ∈ {r1, r2, . . . , rJ} , rJ ≤ Rm (1)
The lowest rate r1 is very low, and this typically corresponds to data over a shared lowrate wireless link. Thereby, many essentially idle connections can be maintained withoututilizing much radio resources.
3.4 Radio Resource Management
The main radio resource management functions performed by a RNC consists of connectionsetup, combining/splitting control, radio environment survey, power control and resourceallocation.
Connection setup is performed either when a user first connects to the RNC or as a partof a mobility-hand-over. It controls connection element setup for the user connection inthe RNS. Combining/splitting control allows the same information for a single connectionto be sent over several physical channels. This can be used to support mobility and toimprove the radio link quality.
Radio environment survey performs measurements on radio channels and use the mea-surements to construct an overall channel quality estimate. The quality estimates are thenused by power control functions to control the transmitted power from base stations andusers to minimize interference and keep the quality of connections. The main limitingfactors of radio link quality is base station power and interference from other users.
Furthermore, UTRAN is based on Code Division Multiple Access (CDMA) technol-ogy using orthogonal variable spreading factor (OVSF) channelization codes (Holma andToskala, 2000) to separate channels from each base station. This means that there areonly two codes available with the highest rate, or four with the second highest rate, orone with the highest and two with the second highest etc. Therefore, the aggregated ratefrom a base station is limited by availability of codes. A higher rate requires a higher basestation power for that connection. Hence, the code limitation and the total base stationpower limitation are similar, and it is modeled as a total rate limitation
∑
i
Ri ≤ Rtot, (2)
where Ri is the rate allocated to flow i and Rtot is the maximum flow rate from the RNC.When the sum of the RAB negotiated maximum rates
∑i R
mi fails to meet the rate limit
in (2), the RNC allocates lower rates to one or several, maybe all, flows based on incomingrate to the RNC and radio channel quality. In this implementation, the physical layer isessentially not implemented, and therefore only incoming rate to the RNC is considered.
The implementation uses a specific algorithm for sharing the resources between flowsin the same class whenever (2) cannot be fulfilled with the maximum rate for every flow.In this version Ri is re-allocated, based on priorities pi, as described by the pseudo codein Algorithm 1. Note that a few stopping criteria have been left out of the algorithm de-scription for readability purposes. After a rate has been re-allocated a delay is introduced
7
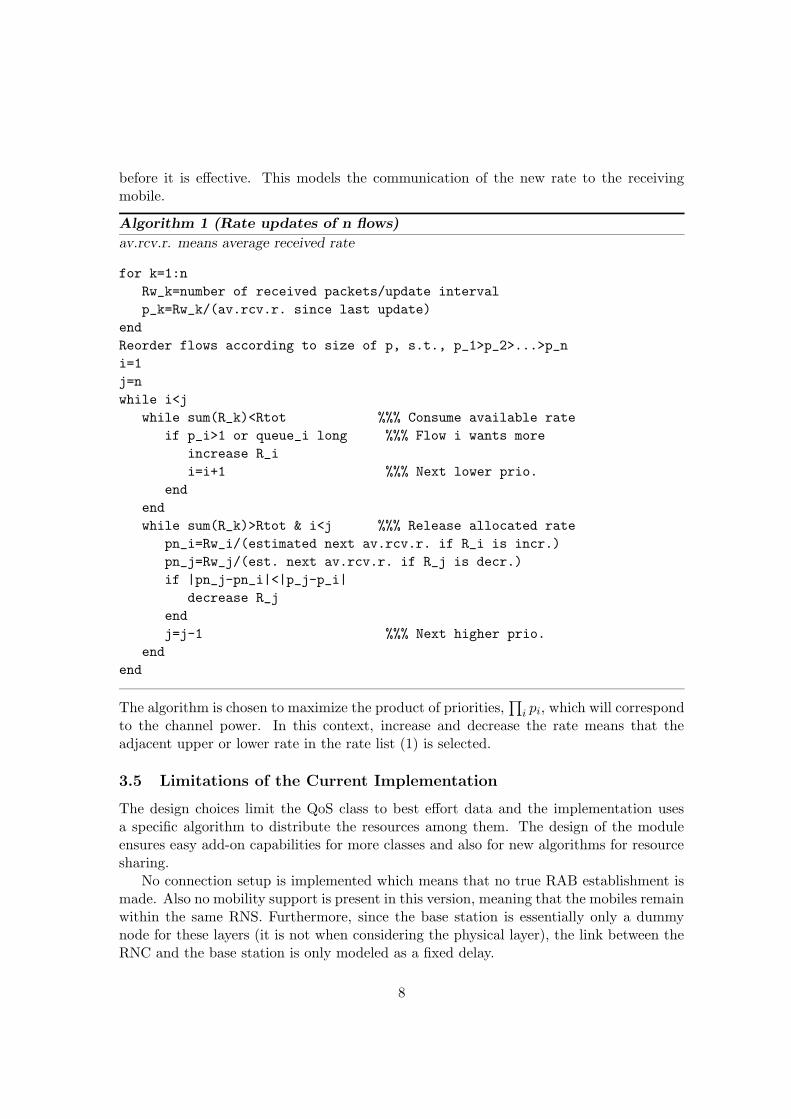
before it is effective. This models the communication of the new rate to the receivingmobile.
Algorithm 1 (Rate updates of n flows)
av.rcv.r. means average received rate
for k=1:n
Rw_k=number of received packets/update interval
p_k=Rw_k/(av.rcv.r. since last update)
end
Reorder flows according to size of p, s.t., p_1>p_2>...>p_n
i=1
j=n
while i<j
while sum(R_k)<Rtot %%% Consume available rate
if p_i>1 or queue_i long %%% Flow i wants more
increase R_i
i=i+1 %%% Next lower prio.
end
end
while sum(R_k)>Rtot & i<j %%% Release allocated rate
pn_i=Rw_i/(estimated next av.rcv.r. if R_i is incr.)
pn_j=Rw_j/(est. next av.rcv.r. if R_j is decr.)
if |pn_j-pn_i|<|p_j-p_i|
decrease R_j
end
j=j-1 %%% Next higher prio.
end
end
The algorithm is chosen to maximize the product of priorities,∏
i pi, which will correspondto the channel power. In this context, increase and decrease the rate means that theadjacent upper or lower rate in the rate list (1) is selected.
3.5 Limitations of the Current Implementation
The design choices limit the QoS class to best effort data and the implementation usesa specific algorithm to distribute the resources among them. The design of the moduleensures easy add-on capabilities for more classes and also for new algorithms for resourcesharing.
No connection setup is implemented which means that no true RAB establishment ismade. Also no mobility support is present in this version, meaning that the mobiles remainwithin the same RNS. Furthermore, since the base station is essentially only a dummynode for these layers (it is not when considering the physical layer), the link between theRNC and the base station is only modeled as a fixed delay.
8
4 Radio Link Layer
The link layer in a radio access network contains more functionality and control algorithmsthan in a wired network. This comes of course from the fact that a radio channel introducesmore and different errors compared to an ordinary cable. Most errors will be caused bytransmission problems rather than packet losses or buffer overflows.
The radio link layer in the 3G architecture is divided into Radio Link Control, RLC,and Media Access Control, MAC. Packets from upper layers are called Service Data Units,SDUs, and the packets to lower layers are called Protocol Data Units or PDUs. Followingis a description of the services provided by the two components in the 3G link layer.
MAC provides the following services (3GPP TS 25.301, 5.3.1).
Data transfer in unacknowledged mode between two MAC entities are provided withoutany segmentation or concatenation. Therefore the segmentation/concatenation andreassembly should be done in higher layers. This is implemented fully in the design.
Allocation of radio resources are changed when requested by the RNC. This meansfor example reconfiguration of transport format set or channel type. Radio resourcesare defined as rates Ri in this version. For each flow a time-slot is assigned and thenumber of packets in each time slot reflects the assigned rate. The rates are currentlyhandled by the RLC layer, and the possible entries of the rate list (1) are thereforedetermined by RLC.
Measurement reports of traffic volume and quality indications are reported to RRC.No measurements reports are implemented in this version.
The protocol specification for RLC is described in (3GPP TS 25.322). RLC is respon-sible for both transfer of user data and transfer of control data. RLC can be used in threedifferent transport modes: transparent, unacknowledged and acknowledged.
The most simple mode is transparent mode. In this mode no information is added tothe upper layer data packets or SDUs. That means that the RLC PDU has the same sizeand content as the SDU.
In unacknowledged mode RLC adds a header to each sent PDU. The upper layer PDUsmay be segmented or concatenated as needed, see 4.2. The receiving side is responsiblefor reassembly and in-sequence delivery.
The most complex mode is the acknowledged mode, AM. In this mode RLC has thefunctionality of the unacknowledged mode but also error correction by retransmission. Theretransmission mechanism uses polling and status packets, see 4.3. To limit the amount ofsent data a receiving window is communicated between the to RLC entities. This windowis basically the available space in the receivers input buffer. The acknowledged mode isthe most interesting to simulate and therefore the following descriptions will assume thismode, although the implementation contains all modes. In the current version the receiversbuffer is assumed to be infinite and the receiver window functionality is not implemented.The following sections describe a few RLC services more closely.
9
4.1 RLC Packet Format
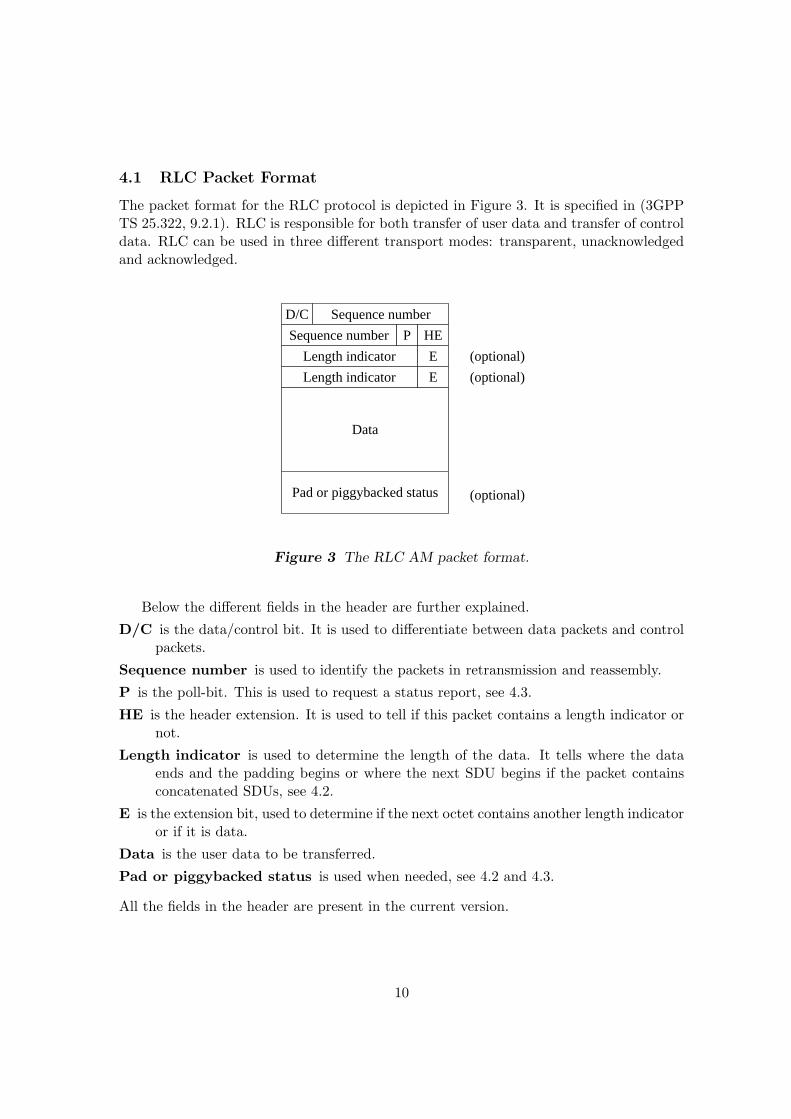
The packet format for the RLC protocol is depicted in Figure 3. It is specified in (3GPPTS 25.322, 9.2.1). RLC is responsible for both transfer of user data and transfer of controldata. RLC can be used in three different transport modes: transparent, unacknowledgedand acknowledged.
Length indicator
Sequence number
Length indicator
Data
Pad or piggybacked status
D/C
E
E
(optional)
(optional)
Sequence number P HE
(optional)
Figure 3 The RLC AM packet format.
Below the different fields in the header are further explained.
D/C is the data/control bit. It is used to differentiate between data packets and controlpackets.
Sequence number is used to identify the packets in retransmission and reassembly.
P is the poll-bit. This is used to request a status report, see 4.3.
HE is the header extension. It is used to tell if this packet contains a length indicator ornot.
Length indicator is used to determine the length of the data. It tells where the dataends and the padding begins or where the next SDU begins if the packet containsconcatenated SDUs, see 4.2.
E is the extension bit, used to determine if the next octet contains another length indicatoror if it is data.
Data is the user data to be transferred.
Pad or piggybacked status is used when needed, see 4.2 and 4.3.
All the fields in the header are present in the current version.
10
4.2 RLC Services
The RLC provides a number of services to the above layer. The most important onesconcern handling of packets and are listed below.
Segmentation, concatenation and reassembly are used to fit variable SDU sizes intoRLC PDUs. When the SDU is larger than the RLC PDU the SDU will be segmentedinto several RLC PDUs. If the SDUs are smaller than the RLC PDU or if there isspace left in a PDU the SDUs will be concatenated. The PDUs are then reassembledat the receiving side. Each PDU has a duration of less than the Transmission TimeInterval (TTI).
Padding is used when the remaining data does not fill an RLC PDU and there is nomore SDU to fill with. The contents of the padding is unimportant and the receivershall disregard it.
Transfer of user data can be done in transparent, unacknowledged or acknowledgedmode. The different options was described earlier in this section.
Error correction is implemented by retransmission in acknowledged mode. The othertransport modes have no error correction.
In-sequence delivery is used to preserve the order of upper layer PDUs.
Duplicate detection is used to detect reception of duplicated RLC PDUs and deliverthe resulting upper layer PDU only once.
Ciphering can be used to prevent unauthorized acquisition of data.
The current version of the implementation contains all parts except ciphering.
4.3 Polling and Status Reports
The polling function is used to request a status report from the RLC entity on the otherside in the communication, the peer RLC entity. A poll-bit in the header, see 4.1, indicatesthe poll request. Polling can be triggered in several ways (3GPP TS 25.322, 9.7.1). Whichto use is configured by upper layers. The available triggers for polling are of two sorts. Incase of emergencies the following are deployed
• last PDU in buffer or retransmission buffer,
• poll timer expired and
• based on the relation between the receiving window and the number of unacknowl-edged PDUs
and normal polling is based on every n:th PDU; on every n:th SDU and/or on a timer.When the configured trigger occurs the poll-bit will be set in the next sent packet.
Upon reception of a packet with the poll-bit set, the RLC compiles a status packet. Thestatus packet contains one or more of the following
Positive acknowledgment for the last PDU received in sequence without error, calledACK.
11
Negative acknowledgment for missing PDUs, called NACK. There are several datastructures to describe which PDUs that are missing; linked list, bitmap, etc.
Window size options exist to handle changes and updates of the RLC receiving window.These are not implemented in the current version.
No more indicates that there is no more status information.
An RLC entity has an internal representation of the next sequence number to use, calledseqno, and the sequence number of the last packet received in sequence without error,called acknowledgment number or ackno. The acknowledgments are based on the ackno.
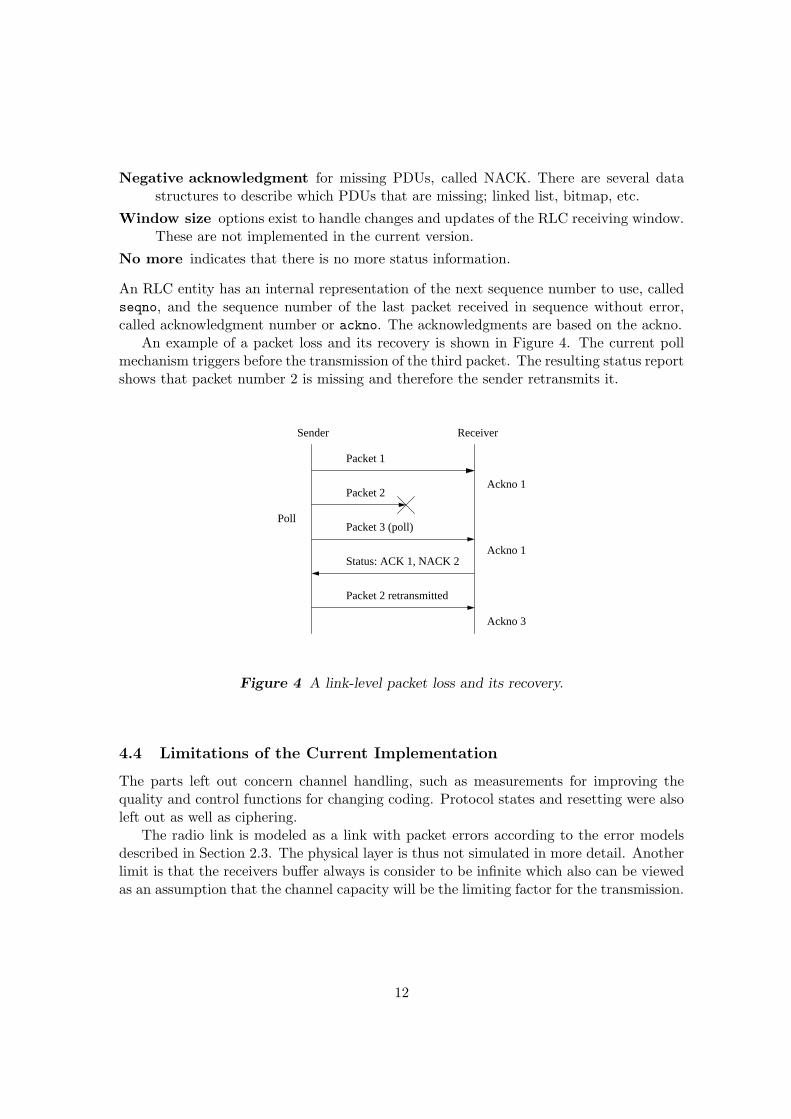
An example of a packet loss and its recovery is shown in Figure 4. The current pollmechanism triggers before the transmission of the third packet. The resulting status reportshows that packet number 2 is missing and therefore the sender retransmits it.
Packet 1
Ackno 1Packet 2
PollPacket 3 (poll)
Status: ACK 1, NACK 2
Packet 2 retransmitted
Ackno 3
Sender Receiver
Ackno 1
Figure 4 A link-level packet loss and its recovery.
4.4 Limitations of the Current Implementation
The parts left out concern channel handling, such as measurements for improving thequality and control functions for changing coding. Protocol states and resetting were alsoleft out as well as ciphering.
The radio link is modeled as a link with packet errors according to the error modelsdescribed in Section 2.3. The physical layer is thus not simulated in more detail. Anotherlimit is that the receivers buffer always is consider to be infinite which also can be viewedas an assumption that the channel capacity will be the limiting factor for the transmission.
12
5 Simulations
This section will show the result from a few simulation runs using the described modules.It highlights phenomena that are difficult to calculate and impossible to see without thefully modeled 3G system.
5.1 Setup
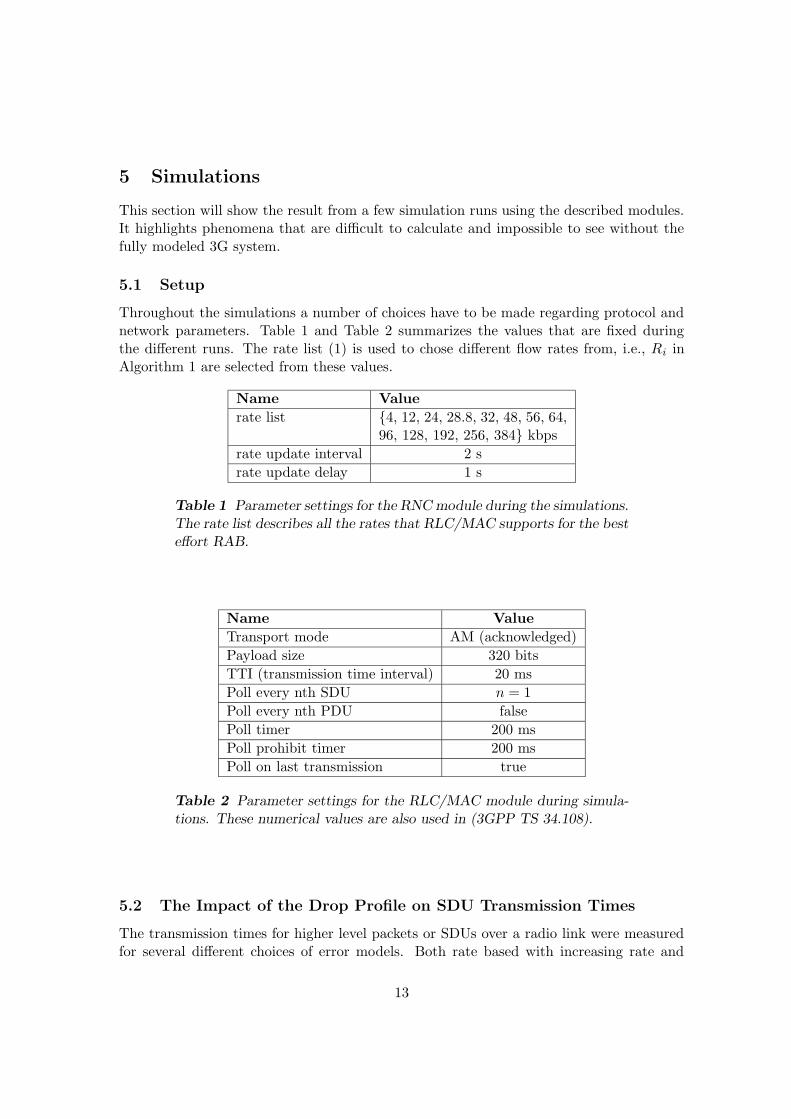
Throughout the simulations a number of choices have to be made regarding protocol andnetwork parameters. Table 1 and Table 2 summarizes the values that are fixed duringthe different runs. The rate list (1) is used to chose different flow rates from, i.e., Ri inAlgorithm 1 are selected from these values.
Name Value
rate list {4, 12, 24, 28.8, 32, 48, 56, 64,96, 128, 192, 256, 384} kbps
rate update interval 2 s
rate update delay 1 s
Table 1 Parameter settings for the RNC module during the simulations.The rate list describes all the rates that RLC/MAC supports for the besteffort RAB.
Name Value
Transport mode AM (acknowledged)
Payload size 320 bits
TTI (transmission time interval) 20 ms
Poll every nth SDU n = 1
Poll every nth PDU false
Poll timer 200 ms
Poll prohibit timer 200 ms
Poll on last transmission true
Table 2 Parameter settings for the RLC/MAC module during simula-tions. These numerical values are also used in (3GPP TS 34.108).
5.2 The Impact of the Drop Profile on SDU Transmission Times
The transmission times for higher level packets or SDUs over a radio link were measuredfor several different choices of error models. Both rate based with increasing rate and
13

based on a multistate model with two states. The distribution of the round trip times areshown in Figures 5 and 6. four different single drop rates where used, 0%, 1%, 10% and20%. For the multistate model, two states where used and designed to produce a totaldrop rate of 10%, the exact setting is given in the description Figure 6. Table 3 showsmean and max transmission times for all the scenarios. The scenarios with single drop
0 0.5 1 1.5 2 2.5 30
5
10
15
20
25
30
35
40
45
50
Delay [s]
Pac
kets
[%]
(a) p = 1%
0 0.5 1 1.5 2 2.5 30
5
10
15
20
25
30
35
40
45
50
Delay [s]
Pac
kets
[%]
(b) p = 10%
Figure 5 SDU transmission time distribution when a single drop rateis used.
Scenario Mean [s] Max [s]
p = 0% 0.1480 0.2402
p = 1% 0.1729 1.5649
p = 10% 0.3862 3.4952
p = 20% 0.7059 6.2202
p2 = 20% 0.3768 4.6952
p2 = 50% 0.3680 4.6648
Table 3 Performance values for different drop scenarios.
rates show that a higher error rate gives an increase in both mean and max delay, i.e.,the distribution is spread out. The Markov chains have a total error rate of 10%, butcompared to the rate based 10% scenario there is a slight increase in the max delay. Themean values are slightly lower but maybe not significantly. The increase of the maximumcould be from the fact that the errors are unevenly distributed and both the transmissionand retransmission of a packet are more likely to get corrupted.
14

0 0.5 1 1.5 2 2.5 30
5
10
15
20
25
30
35
40
45
50
Delay [s]
Pac
kets
[%]
(a) p2 = 20%,q2,2 = 95%
0 0.5 1 1.5 2 2.5 30
5
10
15
20
25
30
35
40
45
50
Delay [s]
Pac
kets
[%]
(b) p2 = 50%,q2,2 = 80%
Figure 6 SDU transmission time distribution, with Markov modelederrors, Figure 2 with n = 2 and p1 = 0%, q1,1 = 95%. The settings arechosen to produce two different cases with a total drop probability of10%.
5.3 The Impact of the Link Layer for a Single User
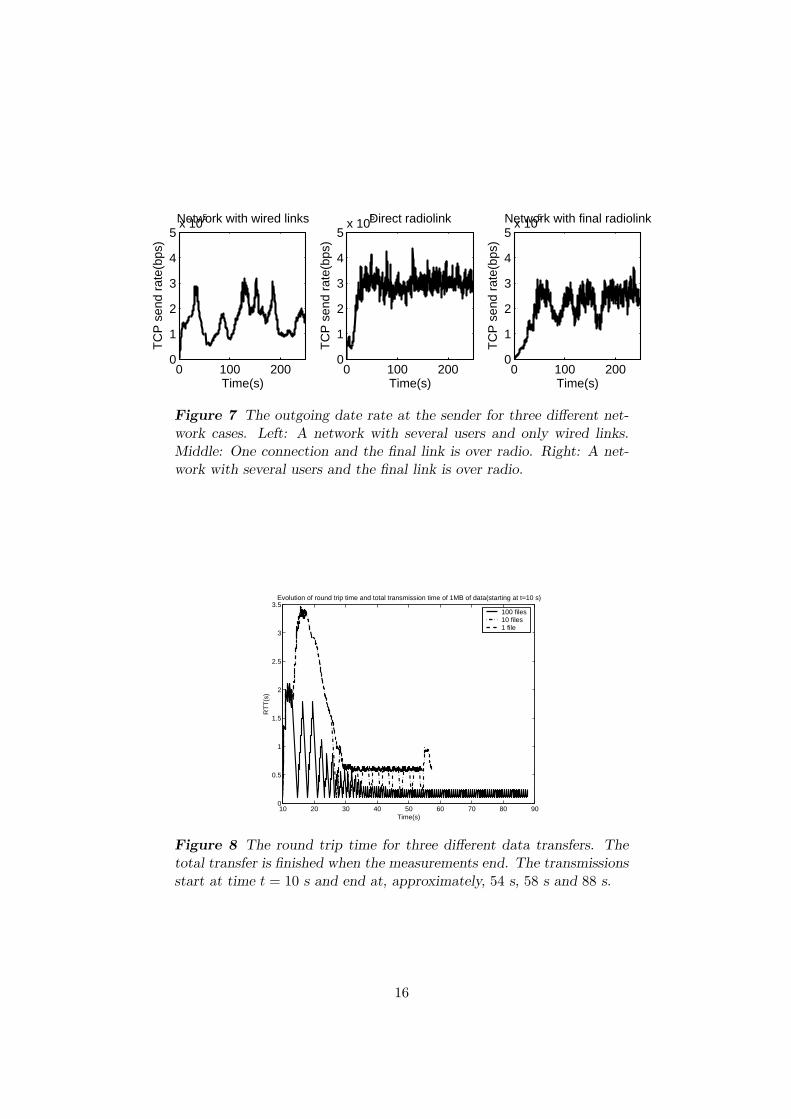
The outgoing data rate for a single TCP transmission is studied during various conditionsof the network. A large network with many users and the transmission only traverseswired links, only one user and the last link is radio and finally the mixed scenario; a largenetwork with many users and the last link for our transmission is a radio link. The radiolink uses a single drop rate of p = 1% for the error model.
All these scenarios introduces different kinds of round trip time variations which willaffect the transmission. Figure 7 shows the data rates for the three cases. The graphs showthat the radio link layer clearly has an effect on the behavior of the sender. The variationin the round trip times introduced by the link layer is significant over the variations causedby competing traffic. It is also obvious that the radio link itself is not the only contributorbut that the competition with the rest of the network makes a difference. Though, it isnoteworthy that no new phenomena seem to be added, but the resulting behavior is a sumof the two separate behaviors.
5.4 The Impact of the Link Layer for Different File Sizes
A data batch of ≈ 1 MB of data (1000 packets, 1040 bytes each) is transferred in varyingnumber of files. TCP is restarted between each file transfer. The maximum transfer rateon a flow is 384 kbps. The scenario have been studied using 1, 10 and 100 files. All filesare sent in the same RNC flow, which means that the RNC flow rate of one file transferis inherited by the next file transfer.
15
0 100 2000
1
2
3
4
5x 10
5Network with wired links
Time(s)
TC
P s
end
rate
(bps
)
0 100 2000
1
2
3
4
5x 10
5
Time(s)
TC
P s
end
rate
(bps
)
Direct radiolink
0 100 2000
1
2
3
4
5x 10
5
Time(s)
TC
P s
end
rate
(bps
)
Network with final radiolink
Figure 7 The outgoing date rate at the sender for three different net-work cases. Left: A network with several users and only wired links.Middle: One connection and the final link is over radio. Right: A net-work with several users and the final link is over radio.
10 20 30 40 50 60 70 80 900
0.5
1
1.5
2
2.5
3
3.5
Time(s)
RT
T(s
)
Evolution of round trip time and total transmission time of 1MB of data(starting at t=10 s)
100 files10 files1 file
Figure 8 The round trip time for three different data transfers. Thetotal transfer is finished when the measurements end. The transmissionsstart at time t = 10 s and end at, approximately, 54 s, 58 s and 88 s.
16
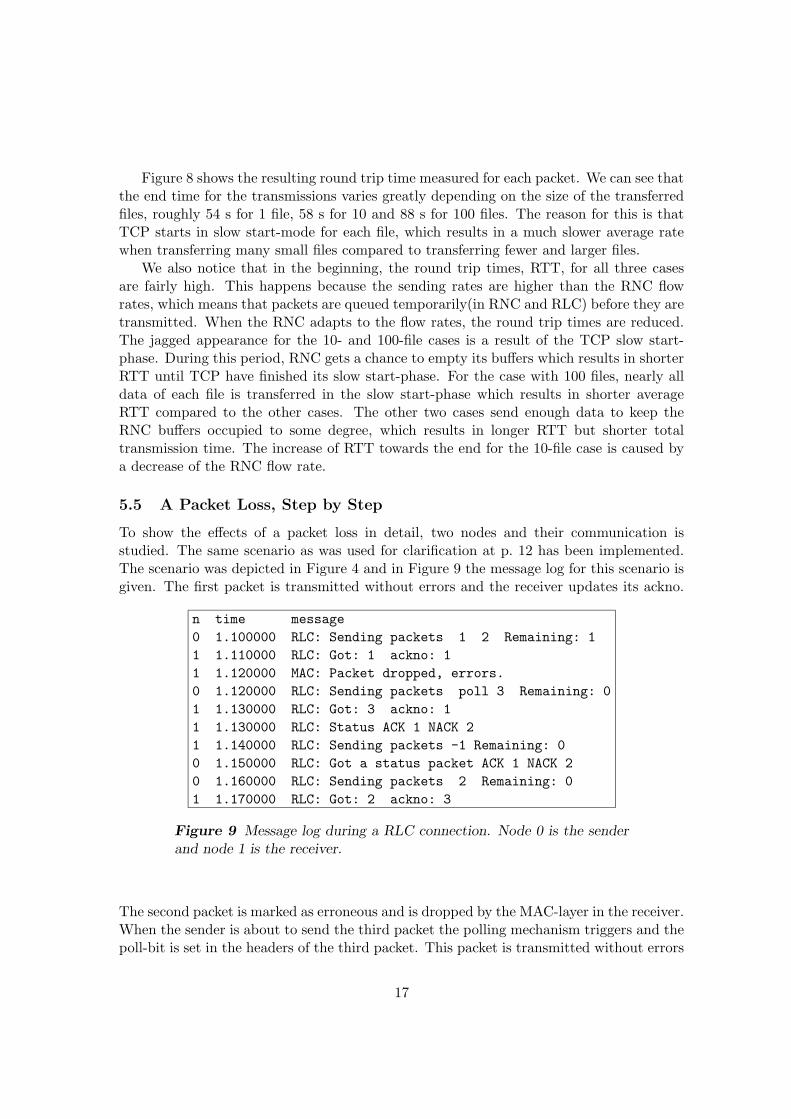
Figure 8 shows the resulting round trip time measured for each packet. We can see thatthe end time for the transmissions varies greatly depending on the size of the transferredfiles, roughly 54 s for 1 file, 58 s for 10 and 88 s for 100 files. The reason for this is thatTCP starts in slow start-mode for each file, which results in a much slower average ratewhen transferring many small files compared to transferring fewer and larger files.
We also notice that in the beginning, the round trip times, RTT, for all three casesare fairly high. This happens because the sending rates are higher than the RNC flowrates, which means that packets are queued temporarily(in RNC and RLC) before they aretransmitted. When the RNC adapts to the flow rates, the round trip times are reduced.The jagged appearance for the 10- and 100-file cases is a result of the TCP slow start-phase. During this period, RNC gets a chance to empty its buffers which results in shorterRTT until TCP have finished its slow start-phase. For the case with 100 files, nearly alldata of each file is transferred in the slow start-phase which results in shorter averageRTT compared to the other cases. The other two cases send enough data to keep theRNC buffers occupied to some degree, which results in longer RTT but shorter totaltransmission time. The increase of RTT towards the end for the 10-file case is caused bya decrease of the RNC flow rate.
5.5 A Packet Loss, Step by Step
To show the effects of a packet loss in detail, two nodes and their communication isstudied. The same scenario as was used for clarification at p. 12 has been implemented.The scenario was depicted in Figure 4 and in Figure 9 the message log for this scenario isgiven. The first packet is transmitted without errors and the receiver updates its ackno.
n time message
0 1.100000 RLC: Sending packets 1 2 Remaining: 1
1 1.110000 RLC: Got: 1 ackno: 1
1 1.120000 MAC: Packet dropped, errors.
0 1.120000 RLC: Sending packets poll 3 Remaining: 0
1 1.130000 RLC: Got: 3 ackno: 1
1 1.130000 RLC: Status ACK 1 NACK 2
1 1.140000 RLC: Sending packets -1 Remaining: 0
0 1.150000 RLC: Got a status packet ACK 1 NACK 2
0 1.160000 RLC: Sending packets 2 Remaining: 0
1 1.170000 RLC: Got: 2 ackno: 3
Figure 9 Message log during a RLC connection. Node 0 is the senderand node 1 is the receiver.
The second packet is marked as erroneous and is dropped by the MAC-layer in the receiver.When the sender is about to send the third packet the polling mechanism triggers and thepoll-bit is set in the headers of the third packet. This packet is transmitted without errors
17

and when the receiver detects the poll request it compiles a status packet. The statuspacket contains in this case an ACK for packet 1 and a NACK for packet 2. When thestatus packet is received at the sender it deletes packet 1 from the buffers, since it wasacknowledged, and it fetches packet 2 for retransmission. This time packet 2 is successfullytransmitted and the receiver can update its ackno.
6 Conclusions
There is an identified need for simulations of heterogeneous networks such as 3G networks.The network simulator ns-2 is widely used for simulating wired, routed networks, butis offers little support for radio access networks with Quality of Service support. Thispaper describes modules to model central functionality of the UMTS Terrestrial RadioAccess Network (UTRAN) that complies with the 3GPP standard to some extent forselected layers. The behavior of a wired network is strongly connected to the dynamicsof the transport control protocol (TCP) and its retransmission and bandwidth estimationschemes. Similar mechanisms are also provided for wireless links on the radio link layerto enable reliable communication. This module implements models of the media accesscontrol (MAC) and radio link control (RLC).
The behavior of a heterogeneous network also depends on resource management func-tionality in the radio access network. It may abruptly alter properties of the wireless linkssuch as the rate, to utilize the radio resources efficiently.
Simulations illustrate characteristic behavior of data transport through heterogeneousnetworks - a behavior different from that obtained with more simplistic models of eitherthe wired network or the radio access network.
6.1 Availability
At the time of the workshop, the module files and extensive information about installationand usage will be made available at www.control.isy.liu.se/~frida/nsmodules/.
References
3GPP TS 23.107. Quality of Service (QoS) concept and architecture, version 5.5, 2002. Availablevia http://www.3gpp.org.
3GPP TS 25.301. Radio Interface Protocol Architecture, version 5.2, 2002. Available viahttp://www.3gpp.org.
3GPP TS 25.322. Radio Link Control (RLC) protocol specification, version 5.2, 2002. Availablevia http://www.3gpp.org.
3GPP TS 25.401. UTRAN overall description, version 5.5, 2002. Available viahttp://www.3gpp.org.
3GPP TS 34.108. Common test environments for User Equipment (UE) conformance testing,version 4.6, 2003. Available via http://www.3gpp.org.
18

H. Balakrishnan, V.N Padmanabhan, S. Seshan, M. Stemm, and R.H. Katz. TCP behavior ofa busy Internet server: analysis and improvements. In IEEE INFOCOM, pages 256–262, SanFrancisco, CA, USA, March 1998.
R. Balkat, P. Godlewski, and P. Martins. A TCP connection over uplink UMTS radio access bearerin RLC acknowledged mode. In Proc. IEEE Vehicular Technology Conference, Birmingham, AL,USA, May 2002.
C. Barakat, E. Altman, and W. Dabbous. On TCP performance in a heterogeneous network: asurvey. IEEE Communications Magazine, 38(1):40–46, January 2000.
L.S. Brakmo and L.L. Peterson. TCP Vegas: end to end congestion avoidance on a global Internet.IEEE Journal on Selected Areas in Communications, 13:1465–1480, October 1995.
S. Heier, D. Heinrichs, and A. Kemper. Performance evaluation of Internet applications over theUMTS radio interface. In Proc. IEEE Vehicular Technology Conference, Birmingham, AL, USA,May 2002.
H. Holma and A. Toskala, editors. WCDMA for UMTS. Radio Access for Third Generation MobileCommunications. Wiley, New York, NY, USA, 2000.
A. Johnston, A. Gustafsson, A. Eriksson, and M. Slssingar. The service network framework – anarchitectural blueprint for the service network. Ericsson Reveiw, (1), 2003.
R. Kalden, I. Meirick, and M. Meyer. Wireless Internet Access based on GPRS. IEEE PersonalCommunications, 7(2), April 2000.
S. Keshav. An Engineering Approach to Computer Networking. Addison-Wesley, 1997. Descriptionof the REAL simulator.
S.I. Maniatis, E.G. Nikolouzou, and I.S. Venieris. QoS issues in the converged 3G wireless andwired networks. IEEE Communications Magazine, 40(8), August 2002.
M. Meyer. TCP Performance over GPRS. In IEEE Wireless Communications and NetworkingConference, Boston, MA, USA, September 1999.
J. Peisa and M. Meyer. Analytical Model for TCP File Transfers over UMTS. In 3G Wireless2001, San Francisco, CA, USA, May 2001.
J. Sachs. Mobile Internet - performance issues beyond the radio interface. In Proc. Mobile InternetWorkshop, Beijing, P.R. China, October 2000.
Sim 1. REAL simulator. URL http://www.cs.cornell.edu/skeshav/real/.
Sim 2. UCB/LBNL/VINT Network Simulator, ns-2. URL http://www.isi.edu/nsnam/ns/.
Sim 3. OPNET simulator. URL http://www.opnet.com/.
W. R. Stevens. TCP/IP illustrated vol 1:The protocols. Addison Wesley, 1994.
X. Xu, Y.-C. Chen, H. Xu, E. Gonen, and P. Liu. Simulation analysis of RLC timers in UTMSsystems. In Winter Simulation Conference, 2002.
G. Xylomenos, G. C. Polyzos, P. Mahonen, and M. Saaranen. TCP performance issues over wirelesslinks. IEEE Communications Magazine, 39(4), 2001.
19
Q. Zhang and H.-J. Su. Performance of UMTS Radio Link Control. In ICC 2002,IEEE Interna-tional Conference on Communications., New York, NY, USA, April 2002.
C. Zhu, O. W. W. Yang, L. Aweya, M. Ouellette, and D. Y. Montuno. A comparison of activequeue management algorithms using the OPNET Modeler. IEEE Communications Magazine,40(6), June 2002.
20