radiation dose and shielding for the space station
TRANSCRIPT
Acta Astronautica Vol. 17, No. 2, pp. 231-241, 1988 0094-5765/88 $3.00+0.00 Printed in Great Britain Pergamon Press plc
RADIATION DOSE AND SHIELDING FOR THE SPACE STATIONt
PERCIVAL D. MCCORMACK~ National Aeronautics and Space Administration, Office of Space Station, Washington, DC 20546, U.S.A.
(Received 27 May 1987)
Abstract--Significant differences in dose prediction for Space Station arise depending on whether or not the magnetic field model is extrapolated into the future. The basis for these calculations is examined in detail, and the importance of the residual atmospheric layer at altitudes below I000 km, with respect to radiation attenuation is emphasized.
Dosimetry results from Shuttle flights are presented and compared with the computed results. It is recommended that, at this stage, no extrapolation of the magnetic field into the future be included in the calculations. A model adjustment, to replace this arbitrary procedure is presented. Dose predictions indicate that, at altitudes below 500 km and at low inclination, and with nominal module wall thickness (0.125 in. aluminum), orbit stay times of 90 days in Space Station would result in quarterly radiation doses to the crew, which are well within present limits both for males and females. Countermeasures would be required for stay times of a year or more and the measure of increasing shielding is examined.
1. INTRODUCTION
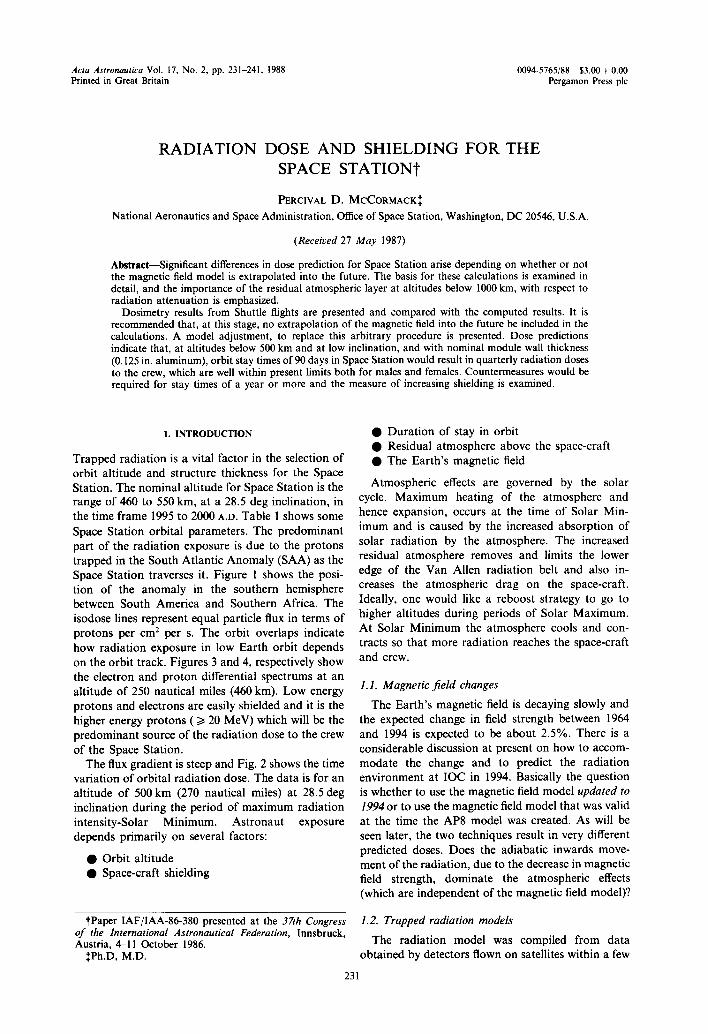
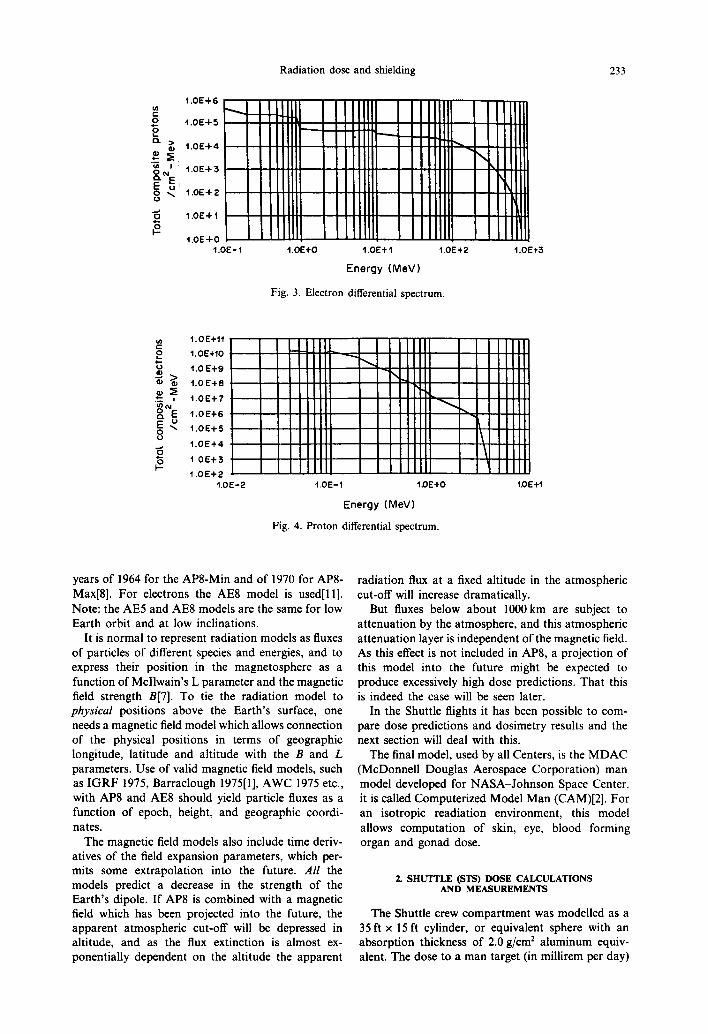
Trapped radiation is a vital factor in the selection of orbit altitude and structure thickness for the Space Station. The nominal altitude for Space Station is the range of 460 to 550 km, at a 28.5 deg inclination, in the time frame 1995 to 2000 A.D. Table 1 shows some Space Station orbital parameters. The predominant part of the radiation exposure is due to the protons trapped in the South Atlantic Anomaly (SAA) as the Space Station traverses it. Figure 1 shows the posi- tion of the anomaly in the southern hemisphere between South America and Southern Africa. The isodose lines represent equal particle flux in terms of protons per cm 2 per s. The orbit overlaps indicate how radiation exposure in low Earth orbit depends on the orbit track. Figures 3 and 4, respectively show the electron and proton differential spectrums at an altitude of 250 nautical miles (460 km). Low energy protons and electrons are easily shielded and it is the higher energy protons ( >i 20 MeV) which will be the predominant source of the radiation dose to the crew of the Space Station.
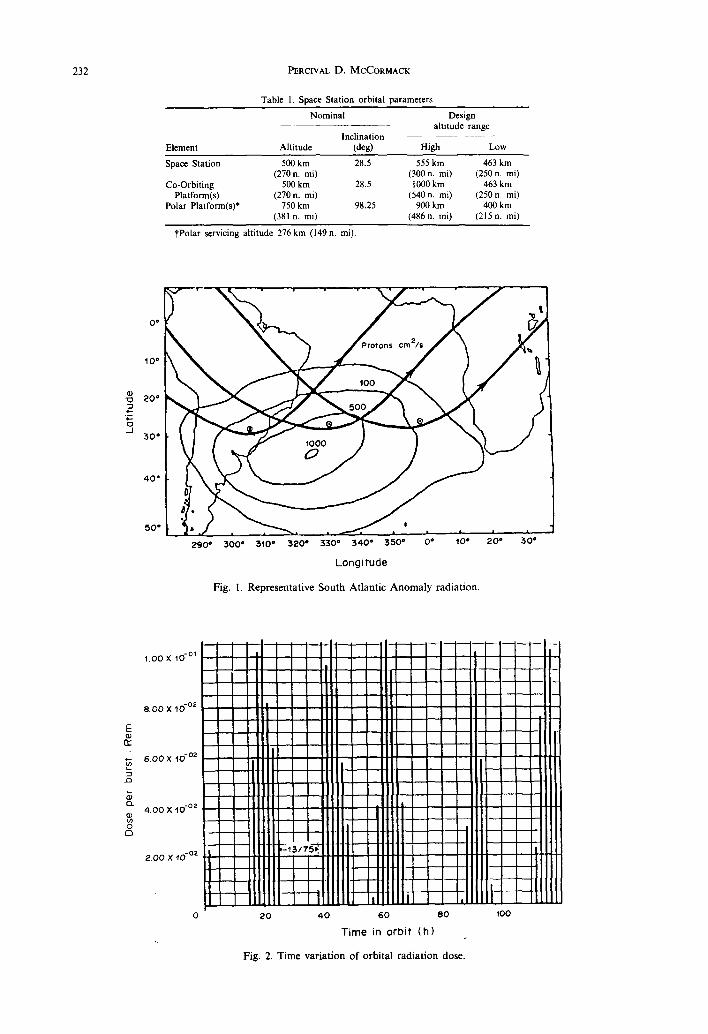
The flux gradient is steep and Fig. 2 shows the time variation of orbital radiation dose. The data is for an altitude of 500 km (270 nautical miles) at 28.5 deg inclination during the period of maximum radiation intensity-Solar Minimum. Astronaut exposure depends primarily on several factors:
• Orbit altitude • Space-craft shielding
• Duration of stay in orbit • Residual atmosphere above the space-craft • The Earth's magnetic field
Atmospheric effects are governed by the solar cycle. Maximum heating of the atmosphere and hence expansion, occurs at the time of Solar Min- imum and is caused by the increased absorption of solar radiation by the atmosphere. The increased residual atmosphere removes and limits the lower edge of the Van Allen radiation belt and also in- creases the atmospheric drag on the space-craft. Ideally, one would like a reboost strategy to go to higher altitudes during periods of Solar Maximum. At Solar Minimum the atmosphere cools and con- tracts so that more radiation reaches the space-craft and crew.
I.I. Magnetic field changes
The Earth's magnetic field is decaying slowly and the expected change in field strength between 1964 and 1994 is expected to be about 2.5%. There is a considerable discussion at present on how to accom- modate the change and to predict the radiation environment at IOC in 1994. Basically the question is whether to use the magnetic field model updated to 1994 or to use the magnetic field model that was valid at the time the AP8 model was created. As will be seen later, the two techniques result in very different predicted doses. Does the adiabatic inwards move- ment of the radiation, due to the decrease in magnetic field strength, dominate the atmospheric effects (which are independent of the magnetic field model)?
tPaper IAF/IAA-86-380 presented at the 37th Congress of the International Astronautical Federation, Innsbruck, Austria, 4-11 October 1986.
~Ph.D, M.D.
1.2. Trapped radiation models
The radiation model was compiled from data obtained by detectors flown on satellites within a few
231
O*
Nominal Design altitude range
Inclination Element Altitude (deg) High Low
Space Station 500 km 28.5 555 km 463 km (270 n. mi) (300 n. mi) (250 n. mi)
Co-Orbiting 500 km 28.5 1000 km 463 km Platform(s) (270 n. mi) (540 n. mi) (250 n. mi)
Polar Platform(s)* 750 km 98.25 900 km 400 km (381 n. mi) (486n. mi) (215n. mi)
tPolar servicing altitude 276 km (149 n. mi).
x~ 2 O ...I
E
cr
r~
$ (3.
0 c)
10"
20*
:50*
40*
50*
t . 00 X 10 -°1
290* 300" 3 t0" 320" 330" 3 4 0 * 350" O* 10 ° 2 0 * 30"
L o n g i t u d e
Fig. I. Representative South Atlantic Anomaly radiation.
2.00 X 10 -02
e.oo x 10 -02
e .oo x ~0 -°s
4.00 X 10 -o2
20 40 60 eo 1oo
PERCIVAL D. MCCORMACK
Table 1. Space Station orbital parameters
232
Time in orb i t (h )
Fig. 2. Time variation of orbital radiation dose,
Radiation dose and shielding 233
u) 1.0E+6 • r - l i o 4.0E-I- 5
"N I 1 .0E+3 ~'~E E O ,,ul 4.OE.4. 2 to
1 .0E+t
l .OE+O 1.0E- 1
mmillilll I i - . . . , , , , I I I I I I I I I I M i l l I I I M I I iBi i i i i i i . . . , I" ' mi!
IIIIII IIIIII IIIIII IIIIII
1.0E+O
IIII IIII IIII 1111
1.0E+ 1
III " III III 1.0E+2
Energy (MeVl
Fig. 3. Electron differential spectrum.
IIII!! !llllll
",llllll l'kllll II! 11 IIIill
1.0E+3
1.0E+11 E 1.0E+10 .t- O t . 0 E + 9
~ 1.O E-I-e
i ' 1.OE+ 7
~a.NE 1 ,O E-t-6
E .~ t.0E+S o 1.0E+4
"6 t . 0 E + 3
1.0E+2 1.0E-2
_~_LII~ I I I I 11111 IIIII - ' ~ . I I I I IIIII IIItL -'q.ll I Ilii, Ill I I1~ . Illi IIIII IIII ~ , ~ Ill I
Illi l i l l " illi IIIII l l i l \ llil IIIII IIII \ Illi illil I l l i IIII
1.0E-1 1.0E+O 1.0E+1
Energy (MeV)
Fig. 4. Proton differential spectrum.
years of 1964 for the AP8-Min and of 1970 for AP8- Max[8]. For electrons the AE8 model is used[ll]. Note: the AE5 and AE8 models are the same for low Earth orbit and at low inclinations.
It is normal to represent radiation models as fluxes of particles of different species and energies, and to express their position in the magnetosphere as a function of Mcllwain's L parameter and the magnetic field strength B[7]. To tie the radiation model to physical positions above the Earth's surface, one needs a magnetic field model which allows connection of the physical positions in terms of geographic longitude, latitude and altitude with the B and L parameters. Use of valid magnetic field models, such as IGRF 1975, Barraclough 1975[1], AWC 1975 etc., with AP8 and AE8 should yield particle fluxes as a function of epoch, height, and geographic coordi- nates.
The magnetic field models also include time deriv- atives of the field expansion parameters, which per- mits some extrapolation into the future. A// the models predict a decrease in the strength of the Earth's dipole. If AP8 is combined with a magnetic field which has been projected into the future, the apparent atmospheric cut-off will be depressed in altitude, and as the flux extinction is almost ex- ponentially dependent on the altitude the apparent
radiation flux at a fixed altitude in the atmospheric cut-off will increase dramatically.
But fluxes below about 1000km are subject to attenuation by the atmosphere, and this atmospheric attenuation layer is independent of the magnetic field. As this effect is not included in AP8, a projection of this model into the future might be expected to produce excessively high dose predictions. That this is indeed the case will be seen later.
In the Shuttle flights it has been possible to com- pare dose predictions and dosimetry results and the next section will deal with this.
The final model, used by all Centers, is the MDAC (McDonnell Douglas Aerospace Corporation) man model developed for NASA-Johnson Space Center. it is called Computerized Model Man (CAM)[2]. For an isotropic readiation environment, this model allows computation of skin, eye, blood forming organ and gonad dose.
2. SHUTTLE (STS) DOSE CALCULATIONS AND MEASUREMENTS
The Shuttle crew compartment was modelled as a 35ft × 15 ft cylinder, or equivalent sphere with an absorption thickness of 2.0 g/cm 2 aluminum equiv- alent. The dose to a man target (in millirem per day)
234 PERCIVAL D. MCCORMACK
t000
'~ lO0 o
E
c~ 1o
1.O
150 t75 200 225 250 275 300 325
2.95 CircuLar orbit altitude (N.Mi)
Fig. 5. Dose vs altitude (predicted and measured).
was computed for a range of altitudes from 150 to 325 nautical miles. Calculations were carried out at Goddard Space Flight Center (E. Stassinopoulos) with projection of the magnetic field model into the future and by Johnson Space Center (A. Hardy) with no such projection. The results are plotted in Fig. 5 (skin dose only reported) along with observations from Shuttle flights. It is seen that best agreement with the Shuttle observations is obtained when no
projection of the magnetic field into the future is carried out and for a Solar Max situation--although for the period in which these flights took place, Solar Min is the appropriate situation. The GSFC results for the cylindrical model and Solar Min are:
• Approximately 6 times the JSC results for Solar Min; and
• Approximately 10 times the JSC results for Solar Max and the shuttle dosimeter measurements.
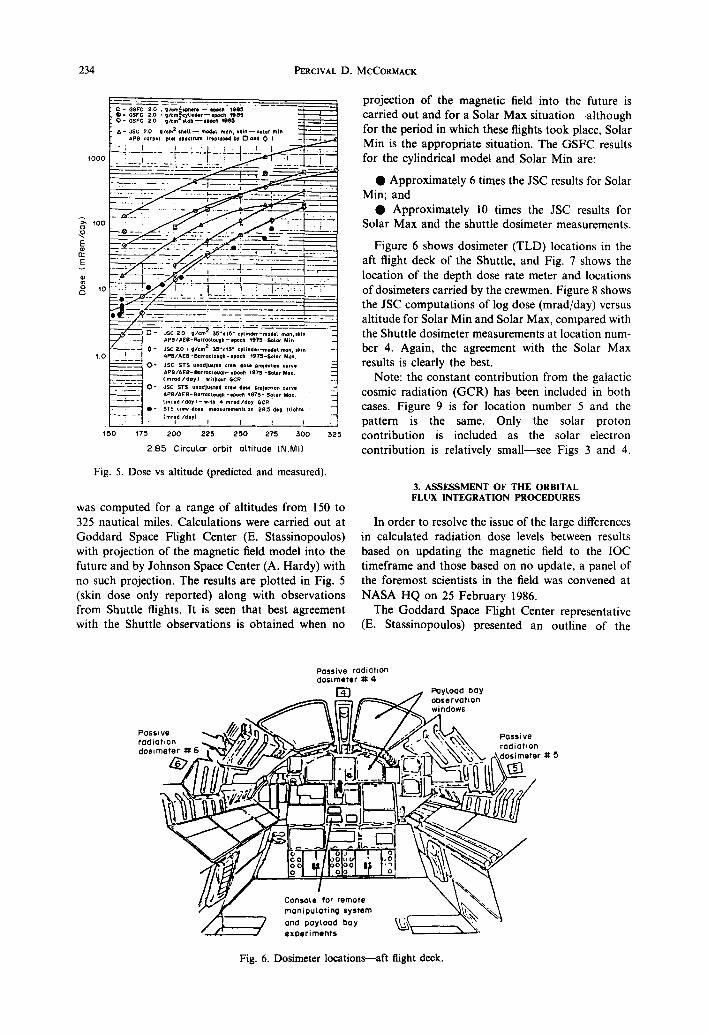
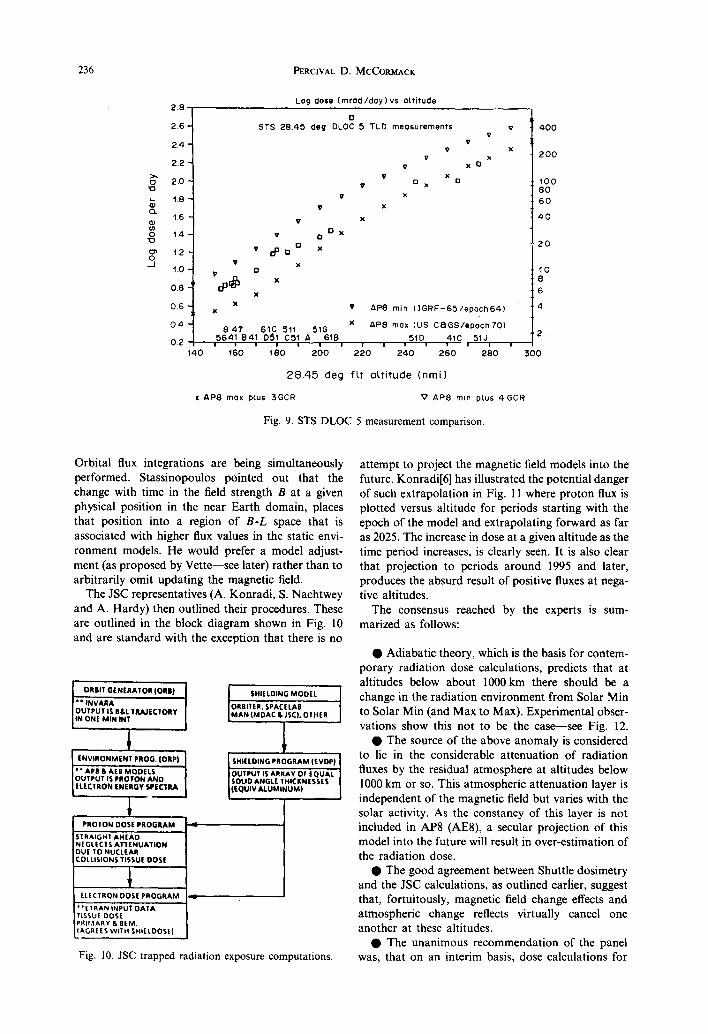
Figure 6 shows dosimeter (TLD) locations in the aft flight deck of the Shuttle, and Fig. 7 shows the location of the depth dose rate meter and locations of dosimeters carried by the crewmen. Figure 8 shows the JSC computations of log dose (mrad/day) versus altitude for Solar Min and Solar Max, compared with the Shuttle dosimeter measurements at location num- ber 4. Again, the agreement with the Solar Max results is clearly the best.
Note: the constant contribution from the galactic cosmic radiation (GCR) has been included in both cases. Figure 9 is for location number 5 and the pattern is the same. Only the solar proton contribution is included as the solar electron contribution is relatively small--see Figs 3 and 4.
3. ASSESSMENT OF THE ORBITAL FLUX INTEGRATION PROCEDURES
In order to resolve the issue of the large differences in calculated radiation dose levels between results based on updating the magnetic field to the IOC timeframe and those based on no update, a panel of the foremost scientists in the field was convened at NASA HQ on 25 February 1986.
The Goddard Space Flight Center representative (E. Stassinopoulos) presented an outline of the
Passive radiation dosimeter :1¢ 4
PayLoad Day ~ ~ oi~servotion .7 . ndows
radiaL,on ,i;n dosimeter ¢~ 6 ~ ~ F ~ J ~ ~ - ' ~ ~ ~ " ~ ~%~%~'~_ r-~dosi meter
experiments
Fig. 6. Dosimeter locations--aft flight deck.
# 5
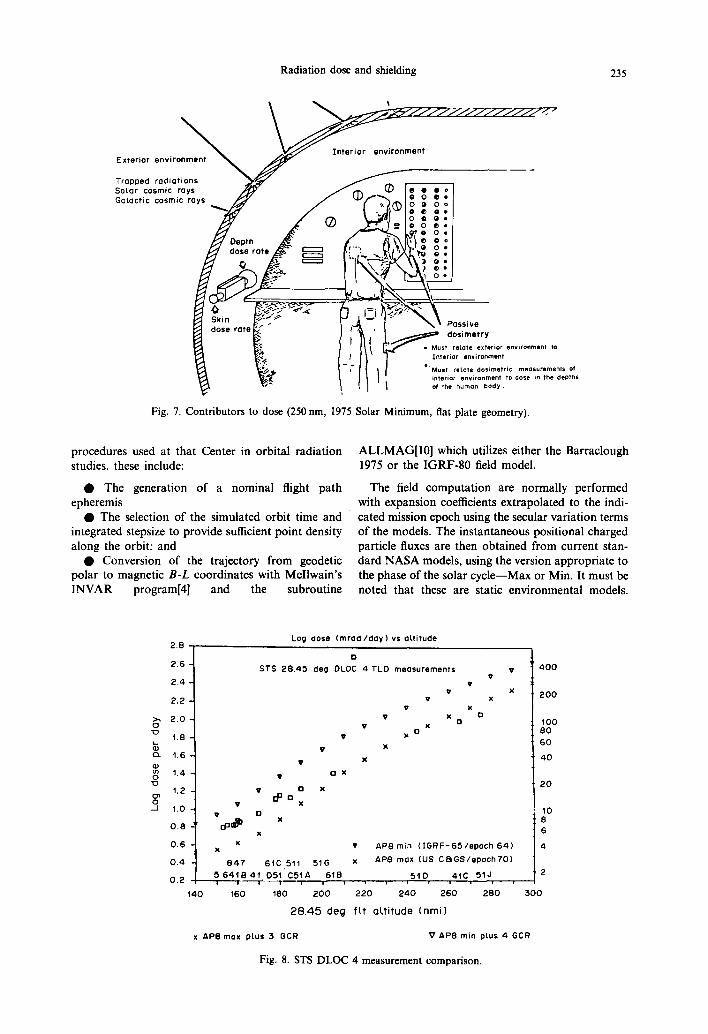
Radiation dose and shielding 235
E x t e r i o r e n v i r o n m e n t
T r a p P e d r a d i a t i o n s S o L a r c o s m i c r a y s G a L a c t i c c o s m i c r a y s
D e p t h d o s e r a t e i I
I n t e r i o r e n v i r o n m e n t
Fig. 7. Contributors to dose (250 nm, 1975
• P a s s i v e d o s i m e t r y
• Must retate exterior environment to In te r ior environment
• 'Must retote dos•mettle measuremenls of interior environment to dose in the depths of the human b o d y .
Solar Minimum, flat plate geometry).
procedures used at that Center in orbital radiation studies, these include:
• The generation of a nominal flight path epheremis
• The selection of the simulated orbit time and integrated stepsize to provide sufficient point density along the orbit: and
• Conversion of the trajectory from geodetic polar to magnetic B-L coordinates with Mcllwain's INVAR program[4] and the subroutine
ALLMAG[10] which utilizes either the Barraclough 1975 or the IGRF-80 field model.
The field computation are normally performed with expansion coefficients extrapolated to the indi- cated mission epoch using the secular variation terms of the models. The instantaneous positional charged particle fluxes are then obtained from current stan- dard NASA models, using the version appropriate to the phase of the solar cycle--Max or Min. It must be noted that these are static environmental models.
O
CZ
0
cn 0 d
2.8 L o g d o s e ( m r a d / d a y ) vs a l t i t u d e
2.6
2.4
2.2
2.0
1.8
1.6
1.4
1.2
1.0
0 .8
0 ,6
0 .4
0 .2
140
D
STS 28.4,5 deg DLOC 4 TLD m e a s u r e m e n t s
9
V
V
V O X O o
x
O x
o x
V
vo.=~ x
x
8 4 7 61C 511 51G
, 5 6 4 1 8 4 1 051 C51A 61B i i i I = i =
160 180 200
v v
v
V x O V (3 x
X
X
x
28.4,5 deg
v v
x x
rt
v AP8min ( I G R F - 6 5 / e p o c h 6 4 )
x AP8 max (US C&GS/epoch70)
5 t D 41C 51J i
220 240 260 280
fLt a l t i tude (nmi)
v 4 0 0
x 200
tO0 80
60
40
20
10 8
6
4
2
300
x APSmox plus 3 GCR V AP8 ra in p t u s 4 GCR
Fig. 8. STS DLOC 4 measurement comparison.
236 PERCIVAL D. MCCORMACK
13
13.
== 0 x3
0 J
2 .8
2 . 6 -
2 4 -
2 . 2 -
2.0
1.8
1.6
1.4
1,2
1.0
0.8
0.6
0 4
0.2 140
V
V 0 0
v 0 0 0 x
x 0
X
x
Log dose ( m r o d / d a y ) v s a t t i tude
O
STS 28 .45 (leg DLOC .5 TLD measurements
V
V x O rl V x
I t X
X
X
0 x
v v
x O
v
x x v AP8 rain ( I G R F - 6 5 / e p o c h 6 4 )
X AP8 max (US C S G S / e p o c h 7 0 ) 8 4 7 61C 511 51G 5641 B41 D5i C51 A 61B 51D 41C 51J
i i i i i / i 1 1 i i i i i
160 180 2 0 0 2 2 0 2 4 0 2 6 0 280
2 8 . 4 5 d e g f L t a l t i t u d e ( n m i )
x A P 8 max ptus 3GCR V AP8 min p~.us 4 GCR
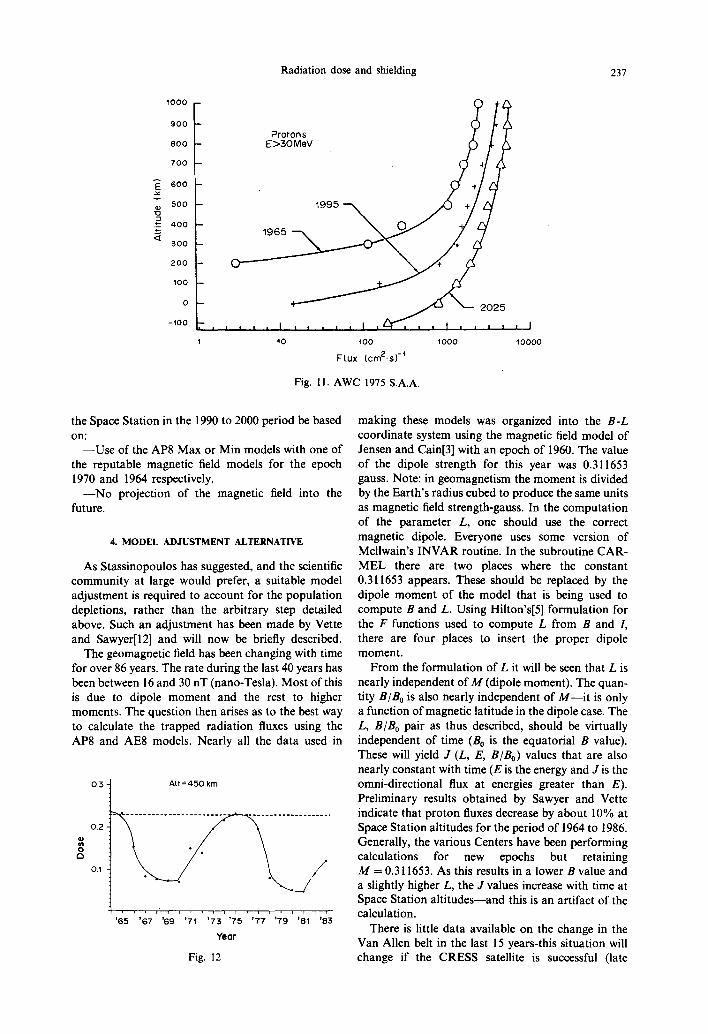
Fig. 9. STS DLOC 5 measurement comparison.
40O
200
100 8O 6 0
4 0
2 0
1 0
6
4
:500
Orbital flux integrations are being simultaneously performed. Stassinopoulos pointed out that the change with time in the field strength B at a given physical position in the near Earth domain, places that position into a region of B-L space that is associated with higher flux values in the static envi- ronment models. He would prefer a model adjust- ment (as proposed by Vette--see later) rather than to arbitrarily omit updating the magnetic field.
The JSC representatives (A. Konradi, S. Nachtwey and A. Hardy) then outlined their procedures. These are outlined in the block diagram shown in Fig. 10 and are standard with the exception that there is no
I I I OUTPUT IS lilt. TRAIEC'IORY LMAN |MDAC It, ISC). OTHER J lN ONE MIN INT
• ;'APB & AEli MODELS | OUTPUT IS ARRAY OF EQUAL | OUTPUT IS PROTON AND ELECIRONENERGYSPECIRA IIEQUIVALUMINUM)ISOUDANGLE'IHICKNESSES II
l PROTON DOSE PROGRAM
STRAIGHT AHEAD N | GL E C T S AI"I'E NUATION DUE TO NUCLEAR COLLISIONS TISSUE DOSE
1 ELECTRON DOSE PROGRAM
• ' E 1 RAN INPUT DAIA TISSUE DOSE PRIf,IARY & REM. (AGREES WITH SHIELDOSEI
Fig. 10. JSC trapped radiation exposure computations.
attempt to project the magnetic field models into the future. Konradi[6] has illustrated the potential danger of such extrapolation in Fig. 11 where proton flux is plotted versus altitude for periods starting with the epoch of the model and extrapolating forward as far as 2025. The increase in dose at a given altitude as the time period increases, is clearly seen. It is also clear that projection to periods around 1995 and later, produces the absurd result of positive fluxes at nega- tive altitudes.
The consensus reached by the experts is sum- marized as follows:
• Adiabatic theory, which is the basis for contem- porary radiation dose calculations, predicts that at altitudes below about 1000km there should be a change in the radiation environment from Solar Min to Solar Min (and Max to Max). Experimental obser- vations show this not to be the case--see Fig. 12.
• The source of the above anomaly is considered to lie in the considerable attenuation of radiation fluxes by the residual atmosphere at altitudes below 1000 km or so. This atmospheric attenuation layer is independent of the magnetic field but varies with the solar activity. As the constancy of this layer is not included in AP8 (AE8), a secular projection of this model into the future will result in over-estimation of the radiation dose.
• The good agreement between Shuttle dosimetry and the JSC calculations, as outlined earlier, suggest that, fortuitously, magnetic field change effects and atmospheric change reflects virtually cancel one another at these altitudes.
• The unanimous recommendation of the panel was, that on an interim basis, dose calculations for
Radiation dose and shielding 237
<~
1000
900
800
700
600
500
400
300
200
100
0
-100
P ro ton . / / ~
~ 0 2 5
, , , I , , J , I tL-T , , , 1 , J ~ t
10 t00 1000
FLux (cruZ.s) - t
Fig. 11. AWC 1975 S.A.A.
, I
10000
the Space Station in the 1990 to 2000 period be based on:
- -Use of the AP8 Max or Min models with one of the reputable magnetic field models for the epoch 1970 and 1964 respectively.
- - N o projection of the magnetic field into the future.
4. MODEL ADJUSTMENT ALTERNATIVE
As Stassinopoulos has suggested, and the scientific community at large would prefer, a suitable model adjustment is required to account for the population depletions, rather than the arbitrary step detailed above. Such an adjustment has been made by Vette and Sawyer[12] and will now be briefly described.
The geomagnetic field has been changing with time for over 86 years. The rate during the last 40 years has been between 16 and 30 nT (nano-Tesla). Most of this is due to dipole moment and the rest to higher moments. The question then arises as to the best way to calculate the trapped radiation fluxes using the AP8 and AE8 models. Nearly all the data used in
0.3-
02.
O.1
Art = 4'50 km
'65 ~67 '69 '71 '73 '75 '77 '79 ~81 t83
Year
Fig. 12
making these models was organized into the B-L coordinate system using the magnetic field model of Jensen and Cain[3] with an epoch of 1960. The value of the dipole strength for this year was 0.311653 gauss. Note: in geomagnetism the moment is divided by the Earth's radius cubed to produce the same units as magnetic field strength-gauss. In the computation of the parameter L, one should use the correct magnetic dipole. Everyone uses some version of Mcllwain's INVAR routine. In the subroutine CAR- MEL there are two places where the constant 0.311653 appears. These should be replaced by the dipole moment of the model that is being used to compute B and L. Using Hilton's[5] formulation for the F functions used to compute L from B and /, there are four places to insert the proper dipole moment.
From the formulation of L it will be seen that L is nearly independent of M (dipole moment). The quan- tity B/Bo is also nearly independent of M - - i t is only a function of magnetic latitude in the dipole case. The L, B/B o pair as thus described, should be virtually independent of time (B0 is the equatorial B value). These will yield J (L, E, B/Bo) values that are also nearly constant with time (E is the energy and J is the omni-directional flux at energies greater than E). Preliminary results obtained by Sawyer and Vette indicate that proton fluxes decrease by about 10% at Space Station altitudes for the period of 1964 to 1986. Generally, the various Centers have been performing calculations for new epochs but retaining M = 0.311653. As this results in a lower B value and a slightly higher L, the J values increase with time at Space Station alt i tudes--and this is an artifact of the calculation.
There is little data available on the change in the Van Allen belt in the last 15 years-this situation will change if the CRESS satellite is successful (late
238 PERCIVAL D. MCCORMACK
Fixed 14 1 4 Berthing L /
IVA
43.7 It 36.366 It _ -m - I Flexible
"~{ Berthing
Bumper ~ ~ t MLI - Pressure Shel l
AI Equlv - 0.2 In. glcm" = 1.37
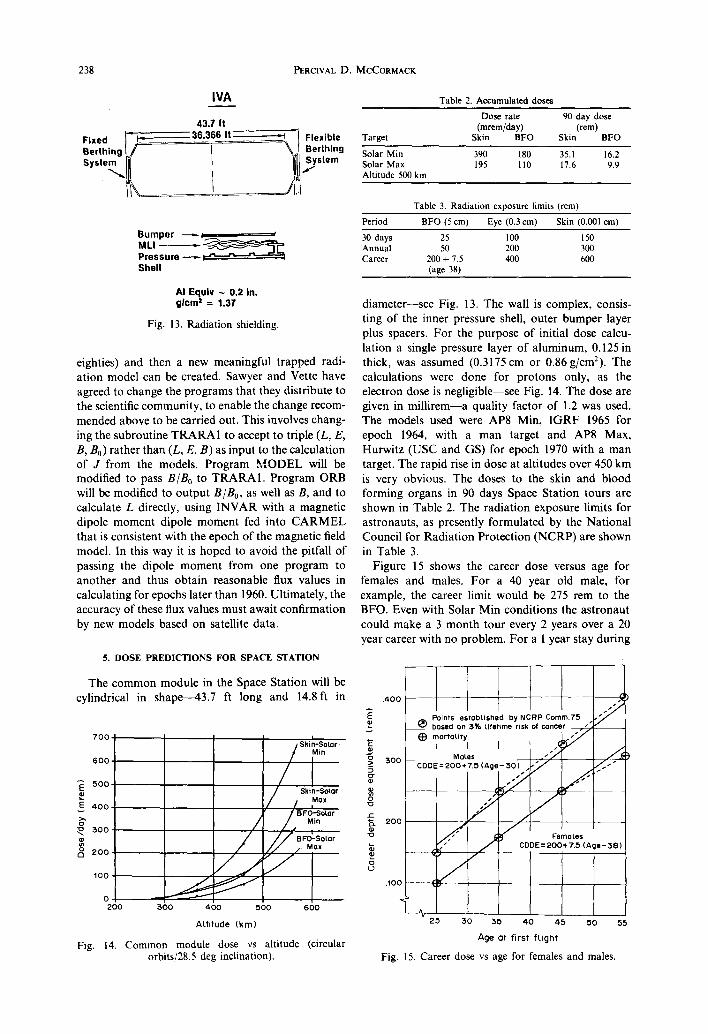
Fig. 13. Radiation shielding.
eighties) and then a new meaningful trapped radi- ation model can be created. Sawyer and Vette have agreed to change the programs that they distribute to the scientific community, to enable the change recom- mended above to be carried out. This involves chang- ing the subroutine T R A R A I to accept to triple (L, E, B, B0) rather than (L, E, B) as input to the calculation of J from the models. Program M O D E L will be modified to pass B / B o to T R A R A I . Program ORB will be modified to output B / B o, as well as B, and to calculate L directly, using I N V A R with a magnetic dipole moment dipole moment fed into C A R M E L that is consistent with the epoch of the magnetic field model. In this way it is hoped to avoid the pitfall of passing the dipole moment from one program to another and thus obtain reasonable flux values in calculating for epochs later than 1960. Ultimately, the accuracy of these flux values must await confirmation by new models based on satellite data.
5. DOSE PREDICTIONS FOR SPACE STATION
Table 2. Accumulated doses
Dose rate 90 day dose (mrem/day) (rem)
Target Skin BFO Skin BFO
Solar Min 390 180 35.1 16.2 Solar Max 195 110 17.6 9.9 Altitude 500 km
Table 3. Radiation exposure limits (rem)
Period BFO (5 cm) Eye (0.3 cm) Skin (0.001 cm)
30 days 25 100 150 Annual 50 200 300 Career 200 + 7.5 400 600
(age 38)
diameter--see Fig. 13. The wall is complex, consis- ting of the inner pressure shell, outer bumper layer plus spacers. For the purpose of initial dose calcu- lation a single pressure layer of aluminum, 0.125 in thick, was assumed (0.3175 cm or 0.86 g/cm2). The calculations were done for protons only, as the electron dose is negligible--see Fig. 14. The dose are given in mi l l i rem--a quality factor of 1.2 was used. The models used were AP8 Min, I G R F 1965 for epoch 1964, with a man target and AP8 Max, Hurwitz (USC and GS) for epoch 1970 with a man target. The rapid rise in dose at altitudes over 450 km is very obvious. The doses to the skin and blood forming organs in 90 days Space Station tours are shown in Table 2. The radiation exposure limits for astronauts, as presently formulated by the National Council for Radiation Protection (NCRP) are shown in Table 3.
Figure 15 shows the career dose versus age for females and males. For a 40 year old male, for example, the career limit would be 275 rem to the BFO. Even with Solar Min conditions the astronaut could make a 3 month tour every 2 years over a 20 year career with no problem. For a 1 year stay during
The common module in the Space Station will be cylindrical in shape--43.7 ft long and 14.8 ft in
700
600
`500
E 400
300
200
100
0 200
Fig. 14.
.400
/ Skin-SoLar.
/ F ,oo / Skin-Solar I / ,.o, o
f B FO-'SoLor / Min ~ .200
/ //,, -soLor / / / . M o,
/ / ' Y I 300 400 500 600
ALtitude (kin)
Common module dose vs altitude (circular orbits/28.5 deg inclination).
. J /
Points established by NCRP Comm.7`5 bosed on 3% Lifetime risk of concer -~
(~ mortoLitYl
MoLes - - - - CDDE = 200+7.`5 (Age-30) S
Y (
/ .100
U 2,5 30
,I7 / / / . ~ Femoles
CDDE=200+7.5 (Age-381 /
55 40 45 50 `55
Age Ot first flight
Fig. 15. Career dose vs age for females and males.
Radiation dose and shielding 239
== O 10
O 10
E E
O .J
3.2 3. '1-
3 . 0 -
2 . 9 -
2 . 8 -
2 . 7 -
2 . 6 -
2 .5"
2 .4"
2 .3"
2 .2" 2.t
2.0
1.9
t.8 1.7 1.6
250 nmi x 28.45 deg orbit
i ! i 0/97 80/86
75/75
65/64
' ' ; 2 ' ' ' 'o 4 16 2 ALuminum short thickness (g/cm 2)
Fig. 16. Dose rate vs shielding thickness.
' 2 ' *
1000 800
600
400
200
100 80 60
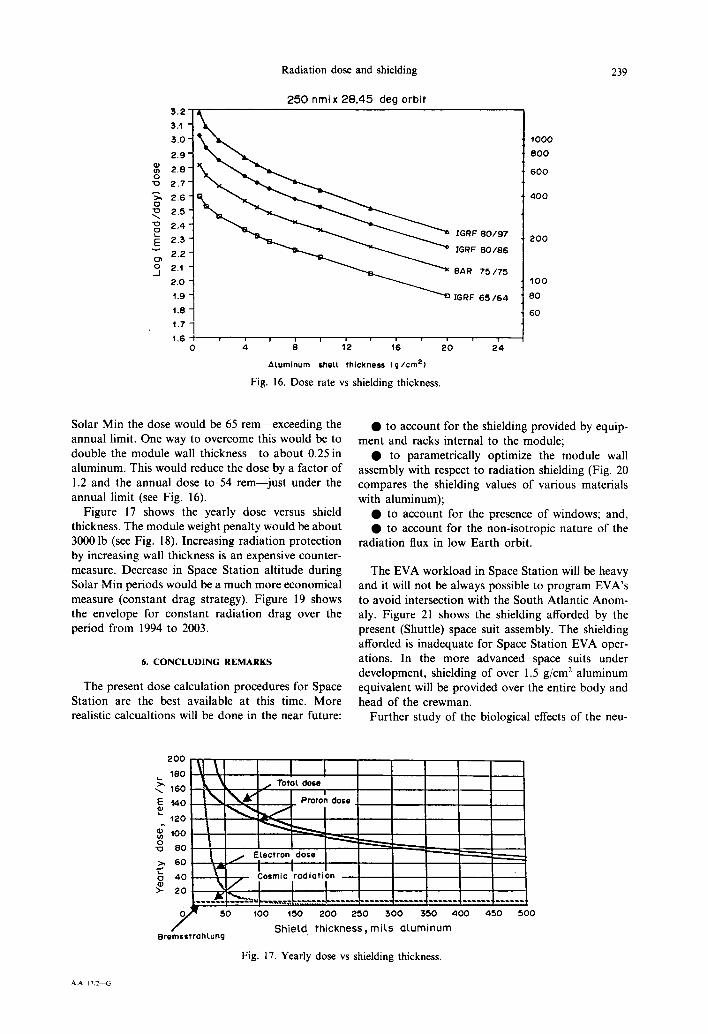
Solar Min the dose would be 65 rem----exceeding the annual limit. One way to overcome this would be to double the module wall thickness--to about 0.25 in aluminum. This would reduce the dose by a factor of 1.2 and the annual dose to 54 rem--just under the annual limit (see Fig. 16).
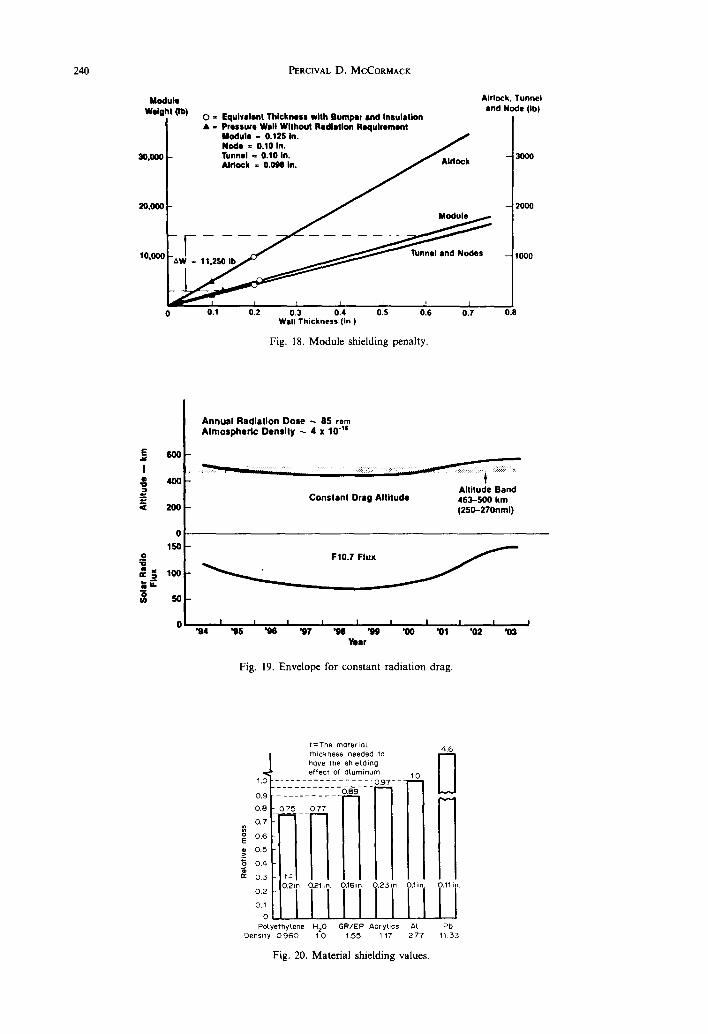
Figure 17 shows the yearly dose versus shield thickness. The module weight penalty would be about 3000 lb (see Fig. 18). Increasing radiation protection by increasing wall thickness is an expensive counter- measure. Decrease in Space Station altitude during Solar Min periods would be a much more economical measure (constant drag strategy). Figure 19 shows the envelope for constant radiation drag over the period from 1994 to 2003.
6. C O N C L U D I N G R E M A R K S
The present dose calculation procedures for Space Station are the best available at this time. More realistic calcualtions will be done in the near future:
• to account for the shielding provided by equip- ment and racks internal to the module;
• to parametrically optimize the module wall assembly with respect to radiation shielding (Fig. 20 compares the shielding values of various materials with aluminum);
• to account for the presence of windows; and, • to account for the non-isotropic nature of the
radiation flux in low Earth orbit.
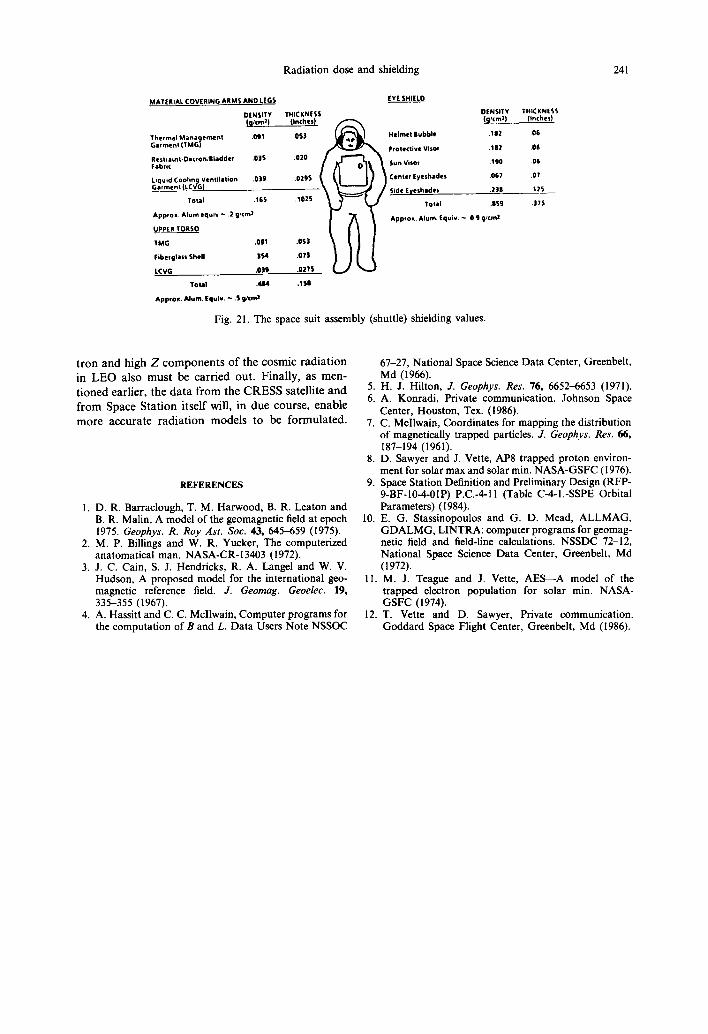
The EVA workload in Space Station will be heavy and it will not be always possible to program EVA's to avoid intersection with the South Atlantic Anom- aly. Figure 21 shows the shielding afforded by the present (Shuttle) space suit assembly. The shielding afforded is inadequate for Space Station EVA oper- ations. In the more advanced space suits under development, shielding of over 1.5 g/cm 2 aluminum equivalent will be provided over the entire body and head of the crewman.
Further study of the biological effects of the neu-
2OO
, 8 0 . . r o . = , o . . I E 140 l ~ ~ A " Proton close
~IOO
-~ 80~>, 60 ~ , ~ Eltectr°nld°Se ~ - - ~ ~ ~ J ~ " ~
~3 40 j Cosmic rodiotion
,,--...../ L J / , ~ 5o too 150 2oo 25o 3oo 35o 4oo 45o 5oo
ShieLd thickness, mils aluminum BremsstrohLung
Fig. 17. Yearly dose vs shielding thickness.
A.A. 17,2--G
240 PERCIVAL D. MCCORMACK
Module Airlock, Tunnel llnd Node (Ibl
Weight- (Ib) 0 = Equivalent Thickness with Bumper sod Insulation I • = Prossure Wall Without Radiation Requirement I Module = 0.125 In. / ] Node = 0.10 In. /
30,000 J- Tunnel ~ 0.10 In. . ~ " . . . . 3000 Alrlock = O.OIN~ In. J AIno¢IC
I . . . . . . . . . . .
1 0 , 0 0 0 L f ~ T u n n e l and Nodes 1000
0 0.1 0.2 0.3 0.4 0.5 0.6 0.7 0.8 Wall Thickness (in)
Fig. 18. Module shielding penalty.
E 6O0 I • 400
< 200
0 150
3";"
Annual Radiation Dose ~ 85 rein Almospherlc Density ~ 4 = 10 4*
e,....- "- i]Y":':'i?!: ̧:': " " : i : :¸':¸ ! : i ¸ :i:::!iii!i:: " : " i l ~
Altitude Band Constant Drag Altitude 463--500 km
(250-270nml)
F10.7 Flux
'94 I I I I I I I I I
• 9 5 .98 .97 .98 .99 '00 ~1 '02 ~ 3 Year
Fig. 19. Envelope for constant radiation drag.
t = T h e m a t e r i a l t h i ckness needed to hove the s h i e l d i n g e f fec t o f o L u m i n u m 1.0
. . . . . . . . . . . . . . . . . 0 .97 - - -
0 . 7
e 0 0 . 6
.o> 0 . 5
0.4 ~" 0 . 3
. . . . . . . . . . . . ~ f f g - - - N 0 . 9 . . . . . . . . . . . . . .
0 .8 - 0 7 5 0 7 7
I 0 . 2 i n 0 .21 in
0 . 1
0 PoLyethyLene H20 G R / E P A c r y t i c s AL
Dens i ty 0 . 9 6 0 1.0 1.5,5 1.17 2 7 7
Fig. 20. Material shielding values.
i
0.16in. 0 . 2 3 i n . 0.1in.
I
4 .6
0.11 in
Pb 11 33
Radiation dose and shielding 241
MATERIAL COVERING ARMS AND LEGS
DENSITY t~_m2)
Thermal Mana emenl .0gl Garment ( 1 M ~
Rest~aint-Oacron,'gladder .0]5 Fabric
Liquid Cooling Ventilation .039 Garment (LCVG)
Total .165
Approx Alum equiv - .1 g/tin2
UPPER TORSO
TMG .Ogl
Fiber glass Shell .)~dl
LCVG ,039
Total .4114
ApproIt. Alum. Equiv. -- .S g l¢/~
EYE SHIELD
THICKNESS (lathes)
.053 Helmet Bubble
Protective Visor .020 Sun Viso~
.029S ienter Eyeshades
.... Side Eyeshades
.1025 Total
.051
.07S
.0275
.lSB
DENSITY THICKNESS (gJcm2) [Inches)
.18l .06
.18l .06
.190 .06
.067 .07
.138 . 1 ~ 5
.8Sg .37S
Approx,Alum. Equ iv . - O,g g/cm2
Fig. 21. The space suit assembly (shuttle) shielding values.
tron and high Z components of the cosmic radiation in LEO also must be carried out. Finally, as men- tioned earlier, the data from the CRESS satellite and from Space Station itself will, in due course, enable more accurate radiation models to be formulated.
REFERENCES
1. D. R. Barraclough, T. M. Harwood, B. R. Leaton and B. R. Malin, A model of the geomagnetic field at epoch 1975. Geophys. R. Roy Ast. Soc. 43, 645~559 (1975).
2. M. P. Billings and W. R. Yucker, The computerized anatomatical man. NASA-CR-13403 (1972).
3. J. C. Cain, S. J. Hendricks, R. A. Langel and W. V. Hudson, A proposed model for the international geo- magnetic reference field. J. Geomag. Geoelec. 19, 335-355 (1967).
4. A. Hassitt and C. C. Mcllwain, Computer programs for the computation of B and L. Data Users Note NSSOC
6%27, National Space Science Data Center, Greenbelt, Md (1966).
5. H. J. Hilton, J. Geophys. Res. 76, 6652~653 (1971). 6. A. Konradi, Private communication. Johnson Space
Center, Houston, Tex. (1986). 7. C. Mcllwain, Coordinates for mapping the distribution
of magnetically trapped particles. J. Geophys. Res. 66, 187-194 (1961).
8. D. Sawyer and J. Vette, AP8 trapped proton environ- ment for solar max and solar min. NASA-GSFC (1976).
9. Space Station Definition and Preliminary Design (RFP- 9-BF-10-4-01P) P.C.-4-11 (Table C-4-1.-SSPE Orbital Parameters) (1984).
10. E. G. Stassinopoulos and G. D. Mead, ALLMAG, GDALMG, LINTRA: computer programs for geomag- netic field and field-line calculations. NSSDC 72-12, National Space Science Data Center, Greenbelt, Md (1972).
11. M. J. Teague and J. Vette, AES---A model of the trapped electron population for solar min. NASA- GSFC (1974).
12. T. Vette and D. Sawyer, Private communication. Goddard Space Flight Center, Greenbelt, Md (1986).