race/ethnicity and arts participation - eric · national endowment for the arts race/ethnicity and...
TRANSCRIPT
NATIONAL ENDOWMENT FOR THE ARTS
Race/ethnicity and Arts participation
Findings from the Survey of Public Participation in the Arts
Vincent Welch, Jr., NORC and Yonghyun Kim, NORC
6/13/2010
This report analyzes data from the 1982, 1985, 1992, 2002, and 2008 Surveys of Public Participation in the Arts (SPPA). Analyses focus on differential arts participation by race/ethnicity and the effect of race/ethnicity on arts participation. Descriptive and inferential analyses explore trends in arts participation by race/ethnicity across the five rounds of SPPA data. We find that, generally, the numbers and proportions of all race/ethnic groups that participate in the arts through attendance at arts events and arts creation are declining over time. The proportion of arts audiences that is white is not declining, despite the fact that the proportion of the national population that is white is declining. Race/ethnic group, per se, is not a strong predictor of attendance at arts events, but it is a good predictor of arts creation activities. Whites and Asians have had arts learning experiences at a greater rate than have blacks and Hispanics.

2
Table of Contents Executive Summary ................................................................................................................................. 5
Chapter 1 ......................................................................................................................................... 5
Chapter 2 ......................................................................................................................................... 5
Chapter 3 ......................................................................................................................................... 6
Chapter 4 ......................................................................................................................................... 6
Chapter 5 ......................................................................................................................................... 7
Chapter 6 ......................................................................................................................................... 7
Chapter 1: Introduction ........................................................................................................................... 9
Data and Variables............................................................................................................................... 9
Defining race and ethnicity ............................................................................................................ 11
Chapter 2: Arts Participation by Race and Ethnicity................................................................................ 13
Jazz ................................................................................................................................................ 15
Classical ......................................................................................................................................... 16
Opera ............................................................................................................................................ 17
Musical play ................................................................................................................................... 18
Non-musical Play ........................................................................................................................... 19
Ballet ............................................................................................................................................. 20
Museum/Gallery ............................................................................................................................ 21
Craft Fair ........................................................................................................................................ 22
Visiting Historic Parks and sites ...................................................................................................... 23
Participation in the arts through media ............................................................................................. 24
Summary ........................................................................................................................................... 26
Chapter 3: Arts creation by race and ethnicity ....................................................................................... 26
Pottery/Jewelry ............................................................................................................................. 27
Weaving/Sewing ............................................................................................................................ 28
Photo/Movie ................................................................................................................................. 29
Paint/Sculpture .............................................................................................................................. 30
Writing .......................................................................................................................................... 31
Play jazz ......................................................................................................................................... 32
Play classical .................................................................................................................................. 33
Sing opera...................................................................................................................................... 33

3
Sing musical ................................................................................................................................... 33
Summary ........................................................................................................................................... 34
Chapter 4: Effect of the changing demographic landscape on arts audiences ......................................... 36
Introduction ...................................................................................................................................... 36
The United States’ changing demographic profile .............................................................................. 36
Jazz ................................................................................................................................................ 37
Classical music performances......................................................................................................... 38
Opera performances ...................................................................................................................... 38
Attendance at live musical plays .................................................................................................... 39
Attendance at non-musical plays ................................................................................................... 40
Ballet ............................................................................................................................................. 40
Visiting a museum or gallery .......................................................................................................... 42
Visiting a craft or visual arts fair ..................................................................................................... 43
Visiting an historic park or site ....................................................................................................... 44
Summary ........................................................................................................................................... 44
Chapter 5: The net effect of race/ethnicity on arts participation in the core domains ............................ 47
Logistic regression models of core SPPA variables .............................................................................. 47
Control variables ............................................................................................................................ 48
Arts Participation ............................................................................................................................... 49
Jazz ................................................................................................................................................ 50
Classical Music performance .......................................................................................................... 51
Opera ............................................................................................................................................ 52
Musical Play ................................................................................................................................... 52
Non-musical Play ........................................................................................................................... 53
Ballet ............................................................................................................................................. 54
Museum/Gallery ............................................................................................................................ 54
Crafts fair ....................................................................................................................................... 55
Historic Park or Site ....................................................................................................................... 56
Arts creation ...................................................................................................................................... 63
Pottery/Jewelry ............................................................................................................................. 63
Weaving/Sewing ............................................................................................................................ 63
Photo/Movie ................................................................................................................................. 64

4
Paint/Sculpture .............................................................................................................................. 64
Writing .......................................................................................................................................... 64
Play jazz ......................................................................................................................................... 64
Play classical .................................................................................................................................. 64
Sing opera...................................................................................................................................... 65
Sing musical ................................................................................................................................... 65
Summary ........................................................................................................................................... 67
Chapter 6: Arts Learning by race/ethnicity ............................................................................................. 69
Music performance classes ............................................................................................................ 70
Visual arts classes .......................................................................................................................... 70
Acting classes................................................................................................................................. 71
Dance classes ................................................................................................................................. 71
Creative writing classes .................................................................................................................. 71
Art appreciation or art history classes ............................................................................................ 71
Music appreciation ........................................................................................................................ 71
Summary ........................................................................................................................................... 72
Technical Notes ..................................................................................................................................... 75
Appendix A – Descriptive statistics, 1982-2008 ...................................................................................... 76
Appendix B – Participation rate in core arts domains, by race/ethnicity, 1992-2008 .............................. 77
Appendix C – Participation rate in core arts creation domain, by race/ethnicity, 1992 – 2008 ................ 78
Appendix D – Race/ethnic composition of arts creators, by arts creation domain, 1992-2008 ................ 79
Appendix E - Effects of race/ethnicity, educational attainment, and their interactions on specific arts
participation (full results) ...................................................................................................................... 85
Appendix F - Effects of race/ethnicity, household income, and their interactions on specific arts
participation (full results) ...................................................................................................................... 95
Appendix G – Effects of race/ethnicity on specific arts creation (full results) ........................................ 105
Appendix H – Analysis of logistic regression assumptions .................................................................... 114
5
Executive Summary This monograph analyzes data from the 1982, 1985, 1992, 2002, and 2008 Survey of Public Participation
in the Arts (SPPA). The analyses in this monograph focus on how the four largest race/ethnic groups are
similar and different in their patterns audience membership and arts creation. In this monograph we
attempt to continue previous work done in this domain by describing trends in arts participation by each
race/ethnic group and exploring the unique effect of belonging to a particular race/ethnic group on arts
participation. We also seek to extend previous work by exploring more complex relationships between
race/ethnicity and education and income. The SPPA is the ideal vehicle for exploring how race/ethnicity
has affected participation in the arts over time as the surveys are well designed, have large sample sizes,
are nationally representative, and have many of the same items in each survey round.
Past research (Love & Kipple, 1994) has demonstrated that there were relatively wide disparities
between the racial/ethnic composition of the United States and the racial/ethnic composition of
audiences in many arts domains. Overall, these researchers found that the arts audiences tended to be
comprised of a higher proportion of whites and lower proportions of non-white race/ethnic groups than
would be expected if arts audiences were a reflection of the population composition. This pattern of the
under-representation of blacks, Hispanics, and Asians in arts audiences deeply concerns the National
Endowment for the Arts (NEA) and other organizations that create, display, and perform art.
Love and Kipple (1994) and other researchers (e.g., Nichols, 2003) found that race/ethnicity per se was
actually a relatively weak predictor of arts participation when other factors, especially education, were
taken into account. The most recent round of the SPPA allows us to explore whether the same patterns
that were evidenced in the eighties and nineties are still in effect or if there have been changes in either
direction.
This executive summary highlights the major findings from each chapter in the full monograph.
Chapter 1 This chapter orients the reader to the monograph and describes the SPPA variables and data collection
procedures. We describe the collection and conceptualization of race/ethnicity across the SPPA rounds
and introduce the reader to the nine core domains of arts participation and the nine core domains of
arts creation that will be used throughout the monograph.
Chapter 2 This chapter explores the trends in arts participation in the nine core arts participation domains, by
race/ethnicity, over time. In this chapter we see that the overall number of people attending arts events
has declined since 2002 in eight of the nine core arts domains (attendance at musical plays is the only
exception), despite the fact that the adult population of the United States grew by nearly eight percent
in that time frame.
In 2008, in all nine core arts domains whites attend at rates that are as high, or higher, than all other
race/ethnic groups. The 2008 SPPA is the first time that blacks did not attend jazz performances at a
higher rate than all other race/ethnic groups. In 2008, with the exception of jazz performances, Asians
6
participated in the all of the core arts domains at a rate that is less than whites, but as high, or higher,
than blacks and Hispanics. In 2008, with the exception of jazz performances (where a higher proportion
of blacks attended) and ballet performances (where a higher proportion of Hispanics attended) blacks
and Hispanics did not differ in their proportional attendance in any of the core arts participation
domains.
In 2008, there was much greater parity in usage of the internet to access the arts among race/ethnic
groups than there was in the core arts domains. Hispanics used the internet to stream or download arts
content at a higher rate than all other groups and Asians used the internet to post their own art at a
higher rate than all other race/ethnic groups. Blacks used the internet to access the arts less than other
race/ethnic groups in 2008.
Chapter 3 This chapter explores the trends in arts participation in the nine core arts creation domains, by
race/ethnicity, over time. In 2008, in all nine core arts creation domains whites attend at rates that are
as high, or higher, than all other race/ethnic groups.
Photography and sewing/weaving were far and away the most popular forms of arts creation with
around 15 percent of the population creating art in these ways. Performing various types of music (Jazz,
classical, opera) were the least popular forms of arts creation with less than four percent of the
population performing these types of music.
In general, the proportion of each race/ethnic group that is creating art in the core arts creations
domains is declining. However, there is not a pronounced race/ethnic group difference in the observed
rate of decline. That is, the groups are generally declining in arts participation proportions at roughly
the same rate.
Chapter 4 This chapter compares the changing demographics of the United States from 1992 to 2008 to the
changing demographics of the audience of each of the core arts activities to explore whether the
observed changes in the composition of the arts audiences are consistent with the underlying changes in
the nation’s demographic profile.
The United States, as a whole, became less white and far more Asian and Hispanic from 1992 to 2008.
The proportion of the US that was black remained about the same during that time.
Overall, whites were proportionally over-represented in the audience of all of the core arts domains in
the 1992, 2002, and 2008 rounds of the SPPA. There were no domains where the decline in
proportional representation of whites was equal to the decline seen in the overall population during
that time span. Generally, the proportion of the audience of the core arts participation domains that
were Asian grew from 1992 to 2008, but the rate of growth in the arts audiences did not keep pace with
the growth rate in the general population. The proportional representation of Hispanics in the core arts
audiences grew at a rate that was roughly comparable with the proportional growth of Hispanics in the
general population. Even though the proportion of the population that was black remained essentially

7
the same from 1992 to 2008, the proportion of the audience in the core arts participation domains that
was black decreased fairly dramatically in most domains.
Chapter 5 This chapter examines the net effect of race/ethnicity on arts participation through a series of logistic
regression models. In these models we control for the effect of factors that are known to affect arts
participation (e.g., education, income, age, sex, etc), to see if membership in a particular race/ethnic
group, per se, affects arts participation. In this chapter we run two different sets of models for each
domain, one using education as a key predictor and a second using income as a key predictor. We break
the chapter into two sections. The first explores the role of race/ethnicity in arts participation. The
second explores the role of race/ethnicity in arts creation.
Arts participation
Overall, being Asian or Hispanic is not predictive of participating in the arts at a different rate than
whites after taking other relevant factors into account. However, in three of the nine domains
(Attending musical plays, Visiting arts or craft fairs, and Visiting historic parks or sites) being black
strongly predicts lower participation than whites even after other factors are accounted for. In two
additional domains (Visiting museums or galleries, and Attending classical music performances) being
black is a weak predictor of lower participation than whites after other factors are accounted for.
Education is a very strong predictor of arts participation across all rounds and domains with more
educated respondents participating in the arts at a much higher rate than less educated respondents.
By 2008, income had become a significant predictor of participation in almost all domains. The
relationship between income and arts participation was not as strong in past rounds, which suggests
that cost may be becoming a more substantial barrier to arts participation
Arts creation
Overall race/ethnicity is a stronger predictor of arts creation than of arts participation. Whites are more
likely to take artistic photographs, paint or sculpt, and sew or weave than all other race/ethnic groups
after taking other relevant factors into account. Asians are far less likely than whites to make pottery or
jewelry, sew or weave, take artistic photographs or make movies, paint or sculpt, or perform jazz music.
Blacks are less likely than whites to make pottery or jewelry, sew or weave, paint or sculpt, and take
artistic photographs or make movies. Hispanics are less likely than whites to sew or weave, take artistic
photographs or make movies, paint or sculpt, and to play classical music.
Education is a very strong predictor of arts creation across nearly all domains with more educated
respondents creating art in the core domains at a much higher rate than less educated respondents. By
2008, income had become a significant predictor of arts creation in almost all domains. The relationship
between income and arts participation was not as strong in past rounds, which suggests that cost may
be becoming a more substantial barrier to creating art, as well.
Chapter 6 This chapter we examines the relationship between race/ethnicity and arts learning experiences at any
time in life.
8
A higher proportion of whites than other racial/ethnic groups have engaged in arts learning across all
domains. In most arts learning domains, Asians have had greater exposure to arts education than blacks
and Hispanics. Hispanics tended to have the lowest exposure to arts learning experiences of all
race/ethnic groups. The proportion of people who have ever taken arts courses declined in nearly all
race/ethnic groups in all domains from 1992 to 2008.
Summary Overall, this monograph shows that race/ethnic disparities in arts participation and arts creation persist.
Whites tend to participate as audience members and create art at a higher level than other race/ethnic
groups, though this finding is not uniform across all domains of arts participation and creation. Blacks
and Hispanics tend to participate as audience members at lower levels than whites and Asians.
While the overall demographic landscape of the United States has become less white since 1992 the
composition of arts audiences has stayed the same or white representation has increased in that time.
Race/ethnic membership, per se, is generally not a strong predictor of arts participation. Where
race/ethnicity, in and of itself, does predict differential arts participation, being black is generally
associated with lower participation rates than being white. Race/ethnic membership, per se, is a
stronger predictor of arts creation with whites generally creating art at a higher rate than other
race/ethnic groups even after accounting for other factors.
Consistent with past research, we found that education is the single most robust predictor of arts
participation and creation. We also found that income is playing an increasing role in arts participation
and creation.
Whites tend to have had greater exposure to arts learning experiences than other race/ethnic groups.
9
Chapter 1: Introduction
The Survey of Public Participation in the Arts (SPPA) is a nationally representative survey that measures
American adults’ patterns of arts participation and creation. The first round of the SPPA was conducted
for the National Endowment for the Arts (NEA) by the U.S. Census Bureau in 1982. Since then, there
have been five additional SPPA rounds, in 1985, 1992, 1997, 2002, and 2008.
The recently published Summary Report of the 2008 SPPA (Williams & Keen, 2009) shows some
disappointing results: the segment of the adult population that attended benchmark arts events was
lower than in any previous SPPA round. In addition, the absolute numbers of audience members at the
benchmark activities were down from the previous SPPA round.
What the Summary Report for the 2008 SPPA does not tell us is whether or not the declines that we see
in arts participation is evenly distributed across race/ethnic groups or if some groups are more deeply
impacted than others. This report addresses those very questions.
In this report, we build on earlier NEA-funded research (e.g., Love & Kipple, 1994) to examine not only
the state of arts participation by race/ethnicity in the 2008 SPPA, but we also look at trends in arts
participation across SPPA rounds. While we highlight differences in arts participation by race/ethnic
group, we do not attempt to make causal explanations for the observed differences. The SPPA is a rich
data source that addresses many issues regarding arts participation, but these data rarely speak to the
larger cultural and sociological issues that might explain the causes of observed differences in arts
participation. We purposely leave it to other researchers to explore issues of causality.
Some might question why we examine arts participation, at all. Others might wonder why focusing on
differences in arts participation by race/ethnicity matters. Love and Kipple (1994) eloquently state that
to the degree that fostering the arts is fostering a public good, the arts should be accessible to all. The
people of the United States unequivocally asserted that the arts formed a public good with the creation
of the NEA and through the continued funding for, and interest in, the arts. Under-representation by
one group or another in arts consumers may be evidence that the group has been denied access to a
valuable public asset. These authors also, rightly, point out that we can’t know if under-representation
by one group or another is a sign of exclusionary practices or differential choices. Likely, it is both. That
is, if a race/ethnic group is under-represented in a particular arts domain, it is likely that the under-
representation is caused by a combination of the preference of group members to do something other
than that activity and by conditions or practices that apply exclusionary pressure on those group
members.
Data and Variables This monograph aims to describe the results of the Survey of Public Participation in the Arts (SPPA) as
they relate to the nation’s various racial and ethnic groups. This periodically conducted survey is the
most comprehensive source of data on the arts. The last two rounds of the SPPA, 2002 SPPA and 2008
SPPA, were conducted for the National Endowment for the Arts (NEA) by the U.S. Census Bureau as a

10
supplement to the Current Population Study (CPS). Prior (i.e., 1982, 1985 and 1992) rounds of the SPPA
were also collected by the U.S. Census Bureau, but were collected as a part of the National Crime
Victimization Survey. Data from these rounds of the SPPA are all nationally representative and share the
same core group of items.1 See Appendix A for descriptive statistics on the SPPA universe.
The SPPA is organized such that there are a set of ‘benchmark activities’ that have remained largely
constant across data rounds from 1982 through the most recent SPPA in 2008. This core group of
activities allows for analysis of long term trends. These benchmark activities include attendance at one
or more of the following seven types of arts activities: jazz performance, classical music, performance,
opera, musical play, non-musical play, ballet and visits to an art museum or gallery. In addition to these
benchmark activities, additional activities are included that reflect changes in arts participation over
time. For example, the 2002 and 2008 rounds of the SPPA have many items that assess arts participation
through digital media, such as CDs, DVDs, and the internet.
In order to detect the change in arts participation over time, we focus primarily on the nine benchmark
activities which were included in all five rounds. All activities exclude elementary or high school
performances and ask respondents participation during the last twelve months. We considered those
who had participated in the specific activity at any time in the past 12 months as a participator. Those
who hadn’t participated in the activity in the last 12 months were considered a non-participator.
Variable name and its formal expression are described below.
- Jazz: Did you go to a live jazz performance [during the last 12 months]?
- Classical: Did you go to a live classical music performance such as symphony, chamber, or choral
music?
- Opera: Did you go to a live opera?
- Musical: Did you go to a live musical stage play?
- Play: Did you go to a live performance of a nonmusical stage play?
- Ballet: Did you go to a live ballet performance?
- Museum/Gallery: Did you visit an art museum or gallery?
- Crafts fair: Did you visit a crafts fair or a visual arts festival?
- Park: Did you visit an historic park or monument, or tour building or neighborhoods for their
historic or design value?
In addition to bench mark activities regarding arts participation, nine arts creation items are included.
These domains cover various personal arts performing which appeared in SPPA questionnaire
throughout all five rounds. Variable name and its formal expression are described below.
- Pottery/Jewelry: Did you work with pottery, ceramics, jewelry, or do any leatherwork or
metalwork?
- Weaving/Sewing: Did you do any weaving, crocheting, quilting, needlepoint, or sewing?
1 There was also a 1997 version of the SPPA that was collected as an independent survey by a private contractor. Because the 1997 SPPA was collected as an independent survey, overall levels or rates of participation from the 1997 SPPA cannot be compared directly to the SPPA estimates from other rounds.

11
- Photo/Movie: Did you make photographs, movies, or videotapes as an artistic activity?
- Paint/Sculpture: Did you do any painting, drawing, sculpture, or printmaking activities [during
the last 12 months]?
- Writing: Did you do any creative writing such as stories, poems, or plays?
- Play jazz: Did you perform or rehearse any jazz music?
- Play classical: Did you perform or rehearse any classical music?
- Sing opera: Did you sing any music in an opera?
- Sing musical: Did you sing or act in a musical play?
In considering these various domains of arts participation, past researchers have tried different ways of
grouping them to make analysis and interpretation easier. For example, previous work by Peterson and
colleagues often grouped various arts domains into ‘highbrow’ arts (e.g., attending classical, ballet and
opera performances) versus ‘lowbrow’ arts (e.g., attending jazz performances, craft fairs, or historic
parks or monuments). DiMaggio and colleagues distinguished between Euro-American arts versus
African-American arts. In the current work we do not aggregate the data in these, or similar ways for a
number of reasons. First, we do not have a compelling theoretical reason to consider participation in
any particular arts activity more highbrow or lowbrow than any other activity. We also reject the
implicit value judgment or ranking of certain forms of arts participation as superior to others. Also, an
empirical analysis of several rounds of SPPA data does not support such grouping. We performed latent
class analyses to test for underlying patterns of correlation and no compelling patterns were detected.2
Therefore, we deal each arts domain separately throughout this monograph.
Defining race and ethnicity
Measuring race and ethnicity has proven to be a significant challenge to survey researchers over time.
There are several causes for this difficulty. First, race has had different meanings to society over the
years. That is, assigning someone to a particular race has carried with it a set of characteristics that has
varied widely over time. Additionally, the nuance with which we, as a society, understand race has
changed dramatically in even the last thirty years. We have gone from defining anyone who was not
white or black to a catch-all ‘other’ category to making finer and finer racial distinctions. Finally
belonging to a particular race has had shifting meanings to members of that race over time. So, the
challenge for race researchers has been to measure a concept that has been changing for both society
and individuals.
Add to this complexity the domain of ethnicity. Whereas race was once assumed to have a biological
underpinning and is now believed to be a wholly social construct, ethnicity has been a social/cultural
construct all along. The United States Census Bureau only officially reports one ethnicity – Hispanic or
non-Hispanic. However, there are as many ethnicities as there are distinct cultures and communities.
Also, race/ethnic researchers consider ethnicity and race to be orthogonal to each other. That is, a
particular individual can be of a specified race and a specified ethnicity. A person can be white and
Hispanic or white and non-Hispanic. Much like with race, ethnicity has different meanings to different
individuals. Many people who are of Hispanic ethnicity consider themselves to be white. However
2 Full results of latent class analysis are available upon request.
12
many people who are of Hispanic ethnicity do not define themselves with a racial designation, preferring
to use Hispanicity as an equivalent concept to race.
To address these problems, many researchers, ourselves included, have combined the concepts of race
and ethnicity to form a single construct of race/ethnicity. We have taken this tack for several reasons.
First, this allows us to directly compare our results with previous SPPA results. Secondly, this reduces
the number of groups to be compared from at least six, to four. Finally, we believe that this reflects the
way that most respondents understand themselves.
In the 1982 SPPA respondents could self-identify as ‘white’, ‘black’ or ‘other’. Also in 1982 there was no
formal ethnicity item. Hispanic ethnicity was inferred from a series of questions regarding national
origin. By the 1985 SPPA respondents could self-identify as ‘white’, ‘black’, ‘Asian’ or other and a
dedicated Hispanic ethnicity item had been added. The structure of the race and ethnicity items
remained the same in the 1992 SPPA. In 1997, the United States Office of Management and Budget
gave guidance that ethnicity should be measured separately from race and that multiple racial
designations should be permitted. This change occurred between the 1992 and 2002 rounds of SPPA.
The 2002 SPPA followed OMB guidance for the measurement of race and ethnicity. The 2008 SPPA
collected race and ethnicity data in the same way that the 2002 version did.
Racial and ethnic groups are constructed in such a way that allows maximum comparability between
previous reports. Four racial/ethnic groups are categorized: white, black, Asian, and Hispanic. For the
purposes of this report any person who indicated that they were Hispanic is counted as Hispanic no
matter what their stated race was. All other race/ethnic groups are those who are only of that group
and not multi-race.
Descriptive statistics of key socio-demographic variables are shown in Appendix A. Throughout five
rounds, the portion of white decreased, while that of Hispanic grew sharply. Hispanics account for 13.79%
of the population and comprise a larger proportion of the population than blacks (11.59%) who, until
the 2002 SPPA, were the second largest racial/ethnic group. Blacks and Asians retain relatively stable
size. Household income is adjusted to 2008 US dollars. Such increase for Hispanics is shown in other
nationally representative surveys as well. For example, US Census Bureau estimates population size of
blacks and Hispanics 37.13 million and 45.43 million during 2006~2008, respectively3.
Average household income in 2008 is about 62,500 dollars which is higher than other previous rounds.
The 2008 SPPA was conducted in May, 2008 and asked respondents about their past year’s income.
Therefore, the impact of recent the economic recession is not fully reflected in 2008 SPPA.
3 Source: 2006-2008 American Community Survey
13
Chapter 2: Arts Participation by Race and Ethnicity
In this section, we present descriptive data on trends in arts participation by race/ethnicity. We begin
the chapter with a look at the participation rates, by race/ethnicity for the core arts participation
domains in 2008 and prior rounds. Focusing on the core domains allows us to compare the rates of
participation across race/ethnic groups within a given SPPA round as well as making comparisons within
race/ethnic groups across the span of the SPPA. We follow the presentation of the core domains with a
discussion of the rates, by race/ethnicity which Americans participated in the arts through media in
2008. We also include domains of arts participation that were newly introduced in the 2008 SPPA.
Compared to prior rounds, there was substantial decrease in the number of arts participants in 2008.
The total number for arts participants in the nine core activities fell by 14.0 percent, from 306.2 million
in 2002 to 263.4 million in 2008. As Table 2.1 shows, there has been an overall decrease in the number
of people participating in nearly all of the core arts domains over the past decade and a half. The
number of Americans attending core arts performances in 2008 was less than, or not significantly
different from, the number in 2002 in all nine of the core domains. In fact, in every race/ethnic group in
every domain, the number of participants in 2008 was lower than, or not significantly different from, the
number in 2002. This is despite the fact that all race/ethnic groups showed a population increase from
2002 to 2008. That is, even though the population of each race/ethnic group increased significantly in
size from 2002 to 2008, the size of the audience in each of the nine core domains of arts participation
defied this larger demographic trend by failing to grow significantly larger or shrinking.

14
Table 2.1 Number of arts participants (in millions), by racial/ethnicity, 1982-2008
1982 1985 1992 2002 2008
N SD N SD N SD N SD N SD Population
White 139.95 0.48 144.92 0.71 143.55 0.84 150.06 1.00 154.46 1.05 Black 17.48 0.42 18.58 0.51 20.76 0.61 23.68 0.66 25.60 0.72 Asian
2.79 0.19 4.82 0.28 8.22 0.36 10.28 0.49
Hispanic 3.52 0.19 4.66 0.30 15.30 0.48 22.68 0.63 30.44 0.78 Jazz
White 12.46 0.17 13.28 0.20 15.04 0.27 16.98 0.33 13.57 0.29 Black 2.71 0.17 2.40 0.19 3.36 0.25 2.99 0.23 2.19 0.19 Asian
0.23 0.05 0.24 0.06 0.60 0.10 0.31 0.08
Hispanic 0.34 0.06 0.34 0.07 0.91 0.12 1.40 0.16 1.19 0.14 Classical
White 19.53 0.15 19.81 0.21 20.11 0.26 20.42 0.32 17.31 0.31 Black 1.16 0.11 1.17 0.13 1.42 0.16 1.07 0.14 1.08 0.13 Asian
0.46 0.07 0.61 0.11 0.86 0.12 0.99 0.15
Hispanic 0.36 0.07 0.33 0.09 0.87 0.11 1.24 0.15 1.14 0.14 Opera
White 4.56 0.07 4.07 0.09 5.14 0.13 5.62 0.16 3.94 0.13 Black 0.24 0.04 0.26 0.06 0.40 0.08 0.25 0.07 0.18 0.04 Asian
0.13 0.04 0.23 0.06 0.23 0.06 0.14 0.05
Hispanic 0.08 0.03 0.01 0.01 0.27 0.07 0.40 0.09 0.34 0.07 Musical
White 27.98 0.18 26.08 0.23 27.31 0.32 29.99 0.40 30.76 0.42 Black 1.75 0.14 1.55 0.15 2.97 0.23 2.43 0.21 2.17 0.19 Asian
0.38 0.07 0.51 0.10 0.97 0.13 1.38 0.17
Hispanic 0.46 0.07 0.31 0.06 1.34 0.14 1.57 0.17 2.44 0.23 Play
White 18.13 0.14 18.23 0.19 20.54 0.28 21.28 0.34 17.43 0.29 Black 1.01 0.10 1.12 0.13 2.49 0.21 1.66 0.17 1.38 0.16 Asian
0.25 0.05 0.39 0.09 0.81 0.12 0.62 0.11
Hispanic 0.17 0.04 0.19 0.05 1.32 0.15 1.40 0.16 1.27 0.16 Ballet
White 6.29 0.08 6.63 0.11 7.21 0.15 6.99 0.18 5.37 0.16 Black 0.31 0.06 0.37 0.06 0.54 0.09 0.36 0.08 0.28 0.06 Asian
0.18 0.04 0.31 0.09 0.21 0.05 0.20 0.05
Hispanic 0.19 0.04 0.16 0.06 0.53 0.08 0.36 0.07 0.66 0.10 Museum/Gallery
White 32.65 0.21 34.01 0.28 41.05 0.41 44.07 0.51 39.79 0.50 Black 2.16 0.15 1.98 0.17 4.00 0.27 3.47 0.25 3.00 0.24 Asian
0.72 0.09 1.38 0.17 2.78 0.21 2.44 0.23
Hispanic 0.56 0.07 0.77 0.12 2.67 0.20 3.64 0.25 4.33 0.28 Craft fair
White 14.99 0.12 10.33 0.13 65.18 0.48 56.72 0.57 44.75 0.49 Black 0.75 0.09 0.46 0.07 4.70 0.30 4.63 0.30 3.05 0.24 Asian
0.18 0.04 1.09 0.15 2.02 0.18 1.36 0.17
Hispanic 0.12 0.03 0.23 0.05 3.89 0.25 4.58 0.28 4.06 0.27 Park
White 13.85 0.12 9.29 0.13 55.90 0.44 53.72 0.56 45.01 0.53 Black 0.94 0.10 0.53 0.07 3.63 0.26 4.19 0.29 3.15 0.23 Asian
0.13 0.04 1.02 0.14 2.47 0.20 1.99 0.21
Hispanic 0.19 0.04 0.20 0.04 2.98 0.22 3.87 0.26 4.16 0.28
15
Table 2.1 shows that there has been a net loss of participants in the core arts domains over time.
However, it is not clear from looking at Table 2.1 if the proportion of each race/ethnic group that
participated in the core arts domains is the same or different. That is, even though whites vastly
outnumber all other race/ethnic groups in each domain, do a higher proportion of whites participate in
the core domains than other race/ethnic groups? Figures 2.1 through 2.9 show the proportional
participation of each race/ethnic group in the core domains. These figures allow us to explore
race/ethnic differences in the proportion of each group that participated in a given SPPA round, as well
as examine trends in participation across SPPA rounds. Detailed estimates, including standard errors, of
the participation rates of each race/ethnic group are presented in Table B.1.
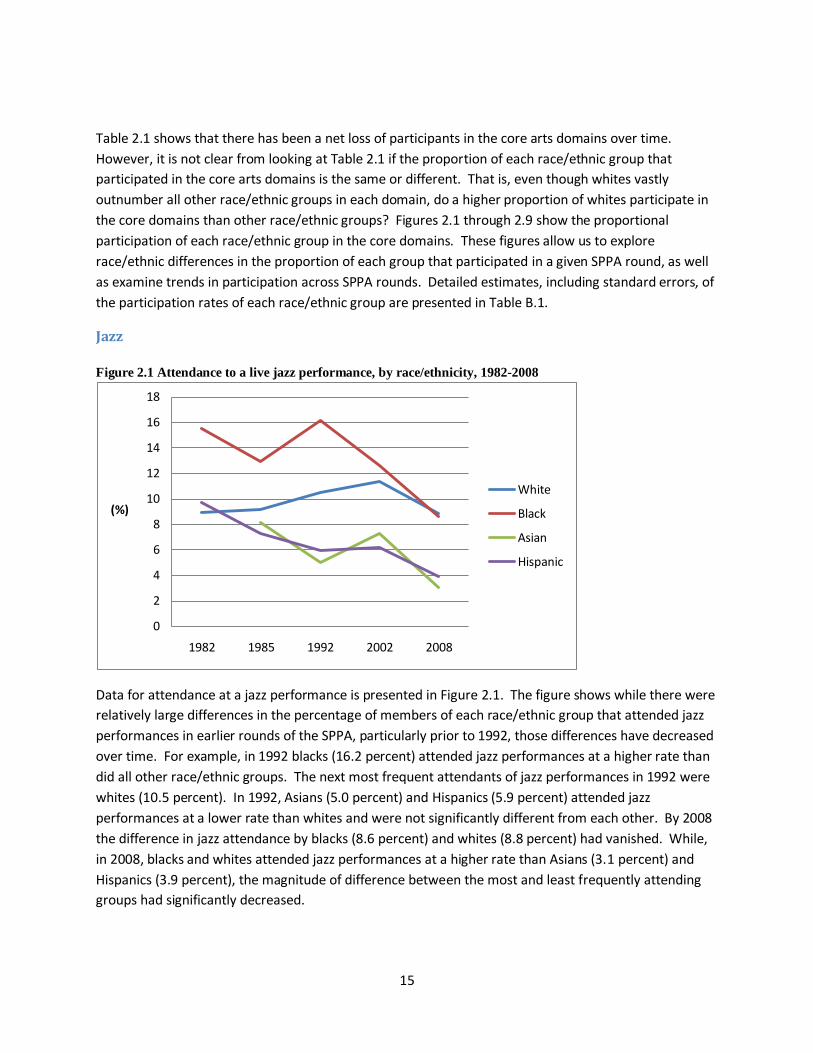
Jazz Figure 2.1 Attendance to a live jazz performance, by race/ethnicity, 1982-2008
Data for attendance at a jazz performance is presented in Figure 2.1. The figure shows while there were
relatively large differences in the percentage of members of each race/ethnic group that attended jazz
performances in earlier rounds of the SPPA, particularly prior to 1992, those differences have decreased
over time. For example, in 1992 blacks (16.2 percent) attended jazz performances at a higher rate than
did all other race/ethnic groups. The next most frequent attendants of jazz performances in 1992 were
whites (10.5 percent). In 1992, Asians (5.0 percent) and Hispanics (5.9 percent) attended jazz
performances at a lower rate than whites and were not significantly different from each other. By 2008
the difference in jazz attendance by blacks (8.6 percent) and whites (8.8 percent) had vanished. While,
in 2008, blacks and whites attended jazz performances at a higher rate than Asians (3.1 percent) and
Hispanics (3.9 percent), the magnitude of difference between the most and least frequently attending
groups had significantly decreased.
0
2
4
6
8
10
12
14
16
18
1982 1985 1992 2002 2008
(%)
White
Black
Asian
Hispanic
16
Along with the decreasing difference in jazz attendance by race/ethnicity there has been an overall
trend of decreasing participation in Jazz attendance over time. However, this trend is not equivalent
across all of the race/ethnic groups. Among blacks, attendance at jazz events has decreased
tremendously from its 1992 peak of 16.2 percent to its current level of 8.6 percent. Among whites,
Asians, and Hispanics, the decrease from jazz’s peak popularity in 2002 (11.3 percent, 7.3 percent, and
6.2 percent, respectively) has been less dramatic (to 8.8 percent, 3.1 percent, and 3.9 percent,
respectively), but is still significant. In 2008, jazz participation by all race and ethnic groups was at its
lowest level in the past two and a half decades.
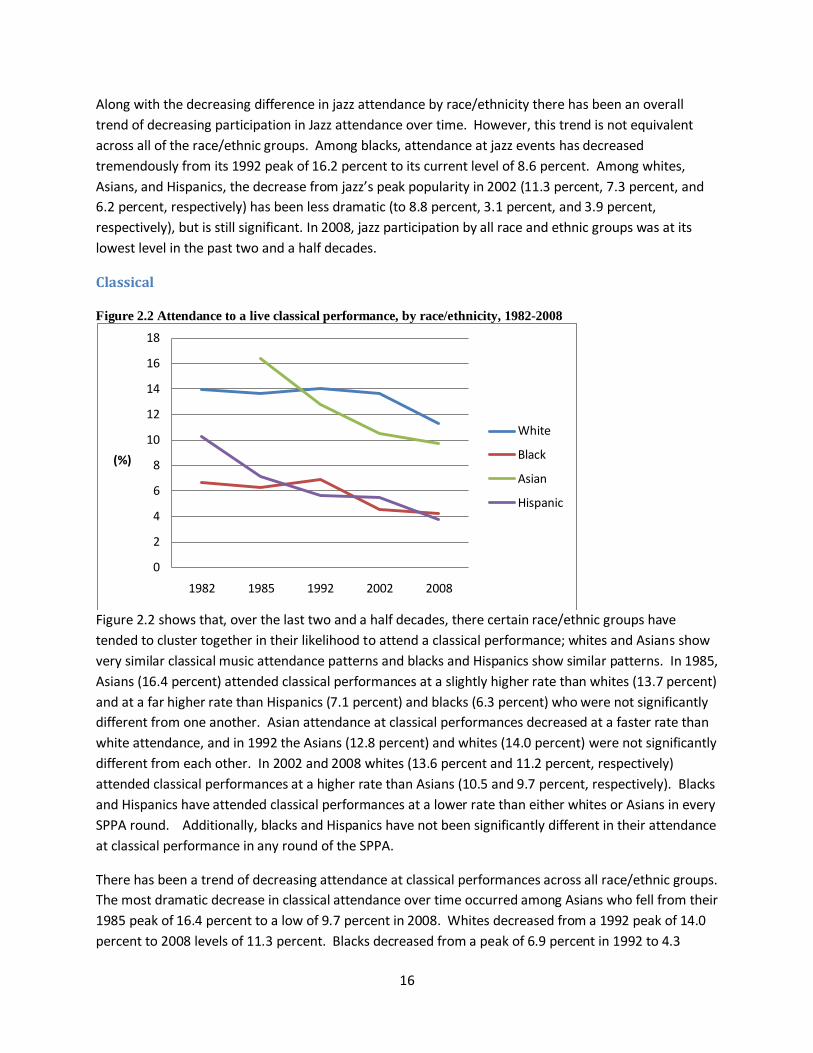
Classical Figure 2.2 Attendance to a live classical performance, by race/ethnicity, 1982-2008
Figure 2.2 shows that, over the last two and a half decades, there certain race/ethnic groups have
tended to cluster together in their likelihood to attend a classical performance; whites and Asians show
very similar classical music attendance patterns and blacks and Hispanics show similar patterns. In 1985,
Asians (16.4 percent) attended classical performances at a slightly higher rate than whites (13.7 percent)
and at a far higher rate than Hispanics (7.1 percent) and blacks (6.3 percent) who were not significantly
different from one another. Asian attendance at classical performances decreased at a faster rate than
white attendance, and in 1992 the Asians (12.8 percent) and whites (14.0 percent) were not significantly
different from each other. In 2002 and 2008 whites (13.6 percent and 11.2 percent, respectively)
attended classical performances at a higher rate than Asians (10.5 and 9.7 percent, respectively). Blacks
and Hispanics have attended classical performances at a lower rate than either whites or Asians in every
SPPA round. Additionally, blacks and Hispanics have not been significantly different in their attendance
at classical performance in any round of the SPPA.
There has been a trend of decreasing attendance at classical performances across all race/ethnic groups.
The most dramatic decrease in classical attendance over time occurred among Asians who fell from their
1985 peak of 16.4 percent to a low of 9.7 percent in 2008. Whites decreased from a 1992 peak of 14.0
percent to 2008 levels of 11.3 percent. Blacks decreased from a peak of 6.9 percent in 1992 to 4.3
0
2
4
6
8
10
12
14
16
18
1982 1985 1992 2002 2008
(%)
White
Black
Asian
Hispanic

17
percent in 2008. Hispanics decreased from a peak of 7.1 percent in 1985 to 3.8 percent in 2008. For all
race/ethnic groups, 2008 was the lowest recorded percentage of attendance at a classical performance.
Opera Figure 2.3 Attendance to a live opera, by race/ethnicity, 1982-2008
Figure 2.3 shows that in the eighties and nineties Asians attended opera performances at a higher rate
than all other race/ethnic groups. However, the proportion of Asians who attended an opera
performance dropped dramatically between 1992 and 2002 (from 4.7 percent to 2.8 percent), to the
point where Asians were replaced by whites (3.6 percent in 1992) as the race/ethnic group with the
highest proportion of opera attendants. Blacks and Hispanics have historically attended opera
performances at a lower rate than whites and Asians. For most years, there is not a significant
difference in the proportion of blacks and Hispanics that attended opera performances. However, there
has been a greater decrease in the proportion of both whites and Asians attending opera performances
than the proportion of blacks and Hispanics between 2002 and 2008, such that in 2008 no group
differed significantly from any other group in the proportion that attended an opera performance.
As with other art forms, there has been an overall trend of decreasing opera attendance by all
race/ethnic groups. With only one exception, 2008 equaled the lowest proportion of opera attendants
in all race/ethnic groups in all years. The singular exception was that a smaller proportion of Hispanics
attended an opera performance in 1985 (0.3 percent) than in 2008 (1.1 percent).
0
0.5
1
1.5
2
2.5
3
3.5
4
4.5
5
1982 1985 1992 2002 2008
(%)
White
Black
Asian
Hispanic
18
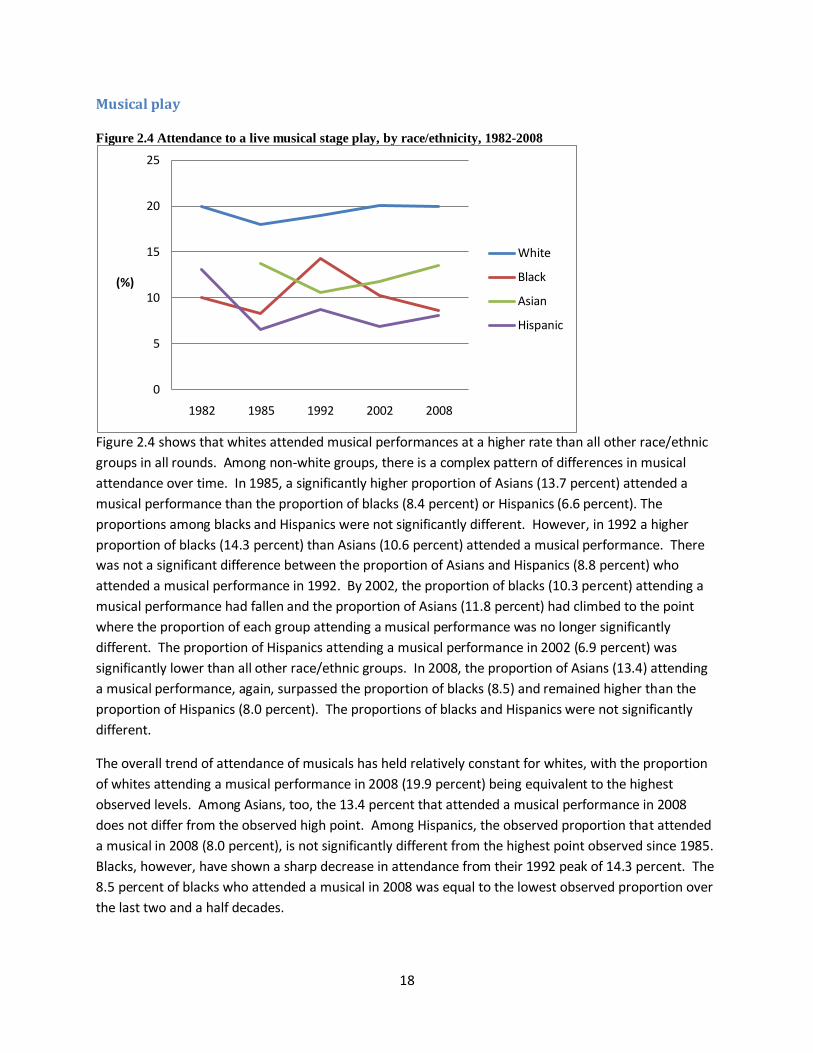
Musical play Figure 2.4 Attendance to a live musical stage play, by race/ethnicity, 1982-2008
Figure 2.4 shows that whites attended musical performances at a higher rate than all other race/ethnic
groups in all rounds. Among non-white groups, there is a complex pattern of differences in musical
attendance over time. In 1985, a significantly higher proportion of Asians (13.7 percent) attended a
musical performance than the proportion of blacks (8.4 percent) or Hispanics (6.6 percent). The
proportions among blacks and Hispanics were not significantly different. However, in 1992 a higher
proportion of blacks (14.3 percent) than Asians (10.6 percent) attended a musical performance. There
was not a significant difference between the proportion of Asians and Hispanics (8.8 percent) who
attended a musical performance in 1992. By 2002, the proportion of blacks (10.3 percent) attending a
musical performance had fallen and the proportion of Asians (11.8 percent) had climbed to the point
where the proportion of each group attending a musical performance was no longer significantly
different. The proportion of Hispanics attending a musical performance in 2002 (6.9 percent) was
significantly lower than all other race/ethnic groups. In 2008, the proportion of Asians (13.4) attending
a musical performance, again, surpassed the proportion of blacks (8.5) and remained higher than the
proportion of Hispanics (8.0 percent). The proportions of blacks and Hispanics were not significantly
different.
The overall trend of attendance of musicals has held relatively constant for whites, with the proportion
of whites attending a musical performance in 2008 (19.9 percent) being equivalent to the highest
observed levels. Among Asians, too, the 13.4 percent that attended a musical performance in 2008
does not differ from the observed high point. Among Hispanics, the observed proportion that attended
a musical in 2008 (8.0 percent), is not significantly different from the highest point observed since 1985.
Blacks, however, have shown a sharp decrease in attendance from their 1992 peak of 14.3 percent. The
8.5 percent of blacks who attended a musical in 2008 was equal to the lowest observed proportion over
the last two and a half decades.
0
5
10
15
20
25
1982 1985 1992 2002 2008
(%)
White
Black
Asian
Hispanic

19
Non-musical Play Figure 2.5 Attendance to a live nonmusical stage play, by race/ethnicity, 1982-2008
Figure 2.5 shows that whites attended plays at a higher rate than all other race/ethnic groups in all
rounds. Among non-white groups, there is a complex pattern of differences in play attendance over
time. In 1985 each race/ethnic group differed from all others in the proportion of the group that
attended a play with whites (12.6 percent) attending at the highest rate, followed by Asians (8.8
percent), blacks (6.0 percent) and Hispanics (4.0 percent). However, by 1992, the popularity of plays
among blacks increased dramatically and blacks (12.0 percent) attended plays at a higher rate than
Hispanics (8.7 percent) and Asians (8.1 percent), who were not significantly different from each other.
In 2002, Asians (9.9 percent) and blacks (7.1 percent) traded relative positions again. In 2002, blacks
and Hispanics (6.2 percent) did not differ significantly in the proportion of the group that attended a
play. In 2008, Asians (6.0 percent) and blacks (5.5 percent) did not differ significantly in the proportion
who attended a play. Additionally, blacks and Hispanics (4.3 percent) did not differ significantly, though
a significantly lower proportion of Hispanics than Asians attended a play in 2008.
The overall trend of attendance at plays has been decreasing over time for all race/ethnic groups. For
whites, blacks, and Hispanics plays reached peak popularity in 1992. For Asians the peak proportion
attending a play came in 2002. For all groups the proportion attending a play in 2008 was at or equal to
the lowest observed value in the past two and a half decades.
0
2
4
6
8
10
12
14
16
1982 1985 1992 2002 2008
(%)
White
Black
Asian
Hispanic
20
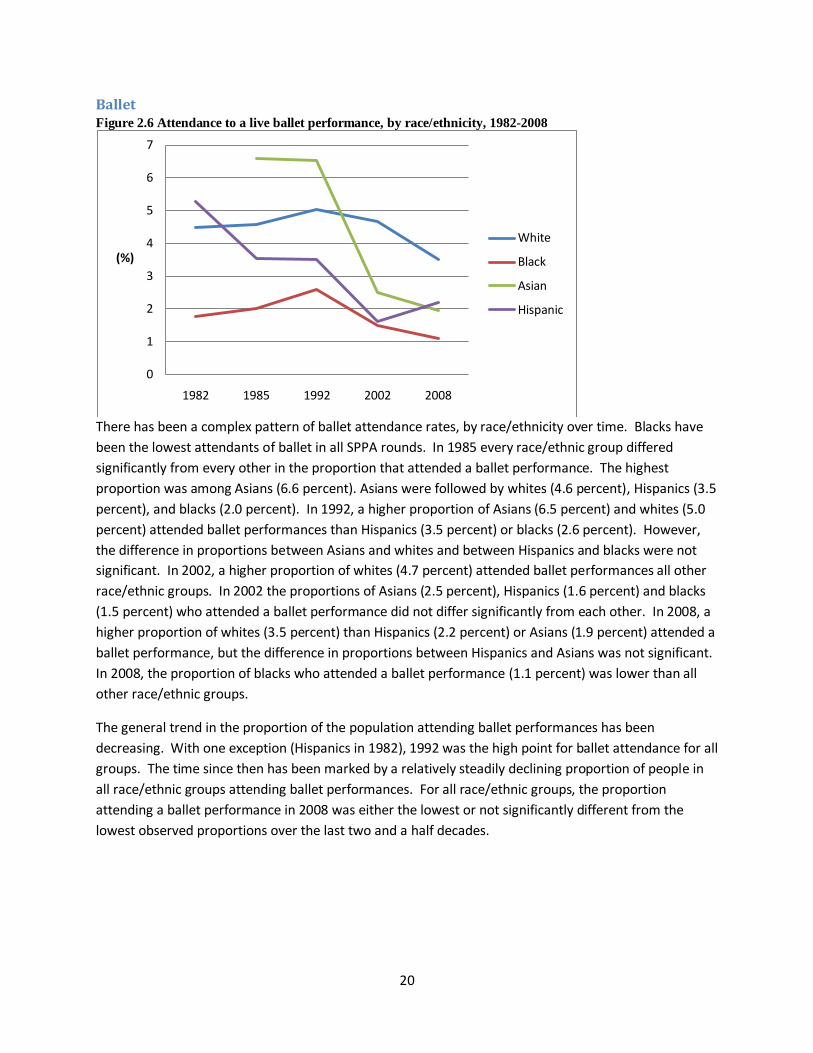
Ballet Figure 2.6 Attendance to a live ballet performance, by race/ethnicity, 1982-2008
There has been a complex pattern of ballet attendance rates, by race/ethnicity over time. Blacks have
been the lowest attendants of ballet in all SPPA rounds. In 1985 every race/ethnic group differed
significantly from every other in the proportion that attended a ballet performance. The highest
proportion was among Asians (6.6 percent). Asians were followed by whites (4.6 percent), Hispanics (3.5
percent), and blacks (2.0 percent). In 1992, a higher proportion of Asians (6.5 percent) and whites (5.0
percent) attended ballet performances than Hispanics (3.5 percent) or blacks (2.6 percent). However,
the difference in proportions between Asians and whites and between Hispanics and blacks were not
significant. In 2002, a higher proportion of whites (4.7 percent) attended ballet performances all other
race/ethnic groups. In 2002 the proportions of Asians (2.5 percent), Hispanics (1.6 percent) and blacks
(1.5 percent) who attended a ballet performance did not differ significantly from each other. In 2008, a
higher proportion of whites (3.5 percent) than Hispanics (2.2 percent) or Asians (1.9 percent) attended a
ballet performance, but the difference in proportions between Hispanics and Asians was not significant.
In 2008, the proportion of blacks who attended a ballet performance (1.1 percent) was lower than all
other race/ethnic groups.
The general trend in the proportion of the population attending ballet performances has been
decreasing. With one exception (Hispanics in 1982), 1992 was the high point for ballet attendance for all
groups. The time since then has been marked by a relatively steadily declining proportion of people in
all race/ethnic groups attending ballet performances. For all race/ethnic groups, the proportion
attending a ballet performance in 2008 was either the lowest or not significantly different from the
lowest observed proportions over the last two and a half decades.
0
1
2
3
4
5
6
7
1982 1985 1992 2002 2008
(%)
White
Black
Asian
Hispanic

21
Museum/Gallery Figure 2.7 Attendance to an art museum or gallery, by race/ethnicity, 1982-2008
Asians and whites have attended museums and galleries in larger proportions than blacks and Hispanics
for every time period since 1985. The proportion of Asians and the proportion of whites that have
attended museums or galleries only differed significantly at one point; in 2002 a higher proportion of
Asians (34.05 percent) attended a museum or gallery than whites (29.51). In 2008, the difference in
proportions between whites and Asians did not rise to the level of significance, but the estimated
percentage was higher for whites (26.0 percent) than for Asians (24.0 percent). For most SPPA rounds
Hispanics and blacks did not differ significantly in their proportional attendance at museums and
galleries. The two exceptions are in 1985, when a higher proportion of Hispanics than blacks visited a
museum or gallery (16.6 percent versus 10.7 percent, respectively) and in 2002 when, again, a higher
the proportion of Hispanics visiting a museum or gallery was higher than the proportion of blacks (14.5
percent versus 12.0 percent, respectively).
Unlike other arts activities that have seen dramatic declines in participation, museum and gallery
attendance has remained relatively constant over the past two and a half decades. The proportion of
whites attending a museum or gallery in 2008 (26.0 percent) is slightly lower than its 2002 peak (29.5),
but has not the dramatic decline seen in other arts domains. The proportion of Asians attending a
museum or gallery in 2008 (24.0) is down sharply from its 2002 peak (34.1 percent), but is still in line
with the proportions attending in 1985 (25.8) and 1992 (28.9). Hispanics, too, attended museums in
2008 and galleries in lower proportions than in previous years, but the proportion that attended in 2008
(14.5 percent), was not dramatically lower that the lowest previous observation, 15.9 percent in 1982.
After showing a peak in 1992 with 19.3 percent of blacks attending a museum or gallery, there has been
a steady decline in 2008 (14.8 percent) and 2008 (12.0 percent). The proportion of blacks attending
museums and galleries in 2008 matches the lowest observed proportion.
0
5
10
15
20
25
30
35
40
1982 1985 1992 2002 2008
(%)
White
Black
Asian
Hispanic

22
Craft Fair Figure 2.8 Attendance to a crafts fair or a visual arts festival, by race/ethnicity, 1982-2008
Craft fairs have been among the most popular types of arts activities that the SPPA measures. Craft fairs
are the only arts activity that has seen at least one in five members of every race/ethnic group
participated at any time during the last two and a half decades. A higher proportion of whites have
attended craft fairs than all other race/ethnic groups in all years, with the sole exception of Asians in
1985 who attended craft fairs in the same proportion as whites. Among the non-white race/ethnic
groups the pattern of craft fair attendance is more complicated. In 1985, a higher proportion of Asians
(43.7 percent) attended a craft fair than either Hispanics (37.4 percent) or blacks (14.9 percent).
However, by 1992 the proportions of Hispanics (25.6 percent) and Asians (22.8 percent) attending craft
fairs did not differ significantly. Additionally, the 22.7 percent of blacks who attended a craft fair in
1992 did not differ significantly from the proportion of Asians, though it was significantly lower than the
proportion of Hispanics who attended craft fairs. In 2002 a higher proportion of Asians (24.7 percent)
attended craft fairs than Hispanics (20.3 percent) or Blacks (19.7 percent), who did not differ
significantly from each other. In 2008, Hispanics (13.7 percent), Asians (13.4 percent) and blacks (12.2
percent) did not significantly differ from each other in the proportion that attended a craft fair.
Though craft fairs remain high in popularity relative to other arts domains, 2008 saw proportional
attendance at craft fairs that was as low, or lower, than any previous SPPA round in all race/ethnic
groups. Asians have seen the most dramatic decrease in craft fair attendance from the high of 43.7
percent in 1985 to the 2008 rate of 13.4 percent, for a nearly 70 percent decrease in proportional
attendance. The proportion of Hispanics attending a craft fair is off by more than 60 percent from the
high of 37.4 percent in 1985 to the 2008 low of 13.7 percent. Whites have seen nearly a one third
decrease in proportional attendance from the high of 43.1 percent in 1985 to the low in 2008 of 29.3
percent. Blacks have seen a decrease in proportional attendance at craft fairs of more than 45 percent
from their peak in of 22.7 percent 1992 to the 2008 low of 12.2 percent.
0
5
10
15
20
25
30
35
40
45
50
1982 1985 1992 2002 2008
(%)
White
Black
Asian
Hispanic
23
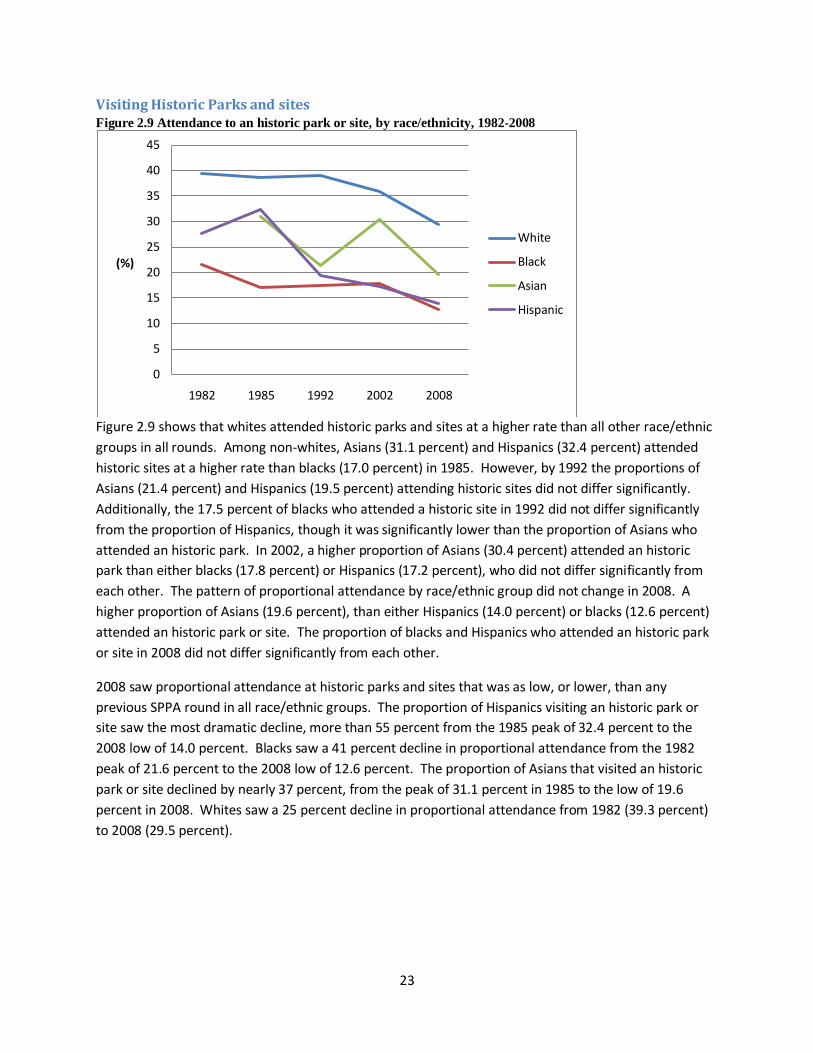
Visiting Historic Parks and sites Figure 2.9 Attendance to an historic park or site, by race/ethnicity, 1982-2008
Figure 2.9 shows that whites attended historic parks and sites at a higher rate than all other race/ethnic
groups in all rounds. Among non-whites, Asians (31.1 percent) and Hispanics (32.4 percent) attended
historic sites at a higher rate than blacks (17.0 percent) in 1985. However, by 1992 the proportions of
Asians (21.4 percent) and Hispanics (19.5 percent) attending historic sites did not differ significantly.
Additionally, the 17.5 percent of blacks who attended a historic site in 1992 did not differ significantly
from the proportion of Hispanics, though it was significantly lower than the proportion of Asians who
attended an historic park. In 2002, a higher proportion of Asians (30.4 percent) attended an historic
park than either blacks (17.8 percent) or Hispanics (17.2 percent), who did not differ significantly from
each other. The pattern of proportional attendance by race/ethnic group did not change in 2008. A
higher proportion of Asians (19.6 percent), than either Hispanics (14.0 percent) or blacks (12.6 percent)
attended an historic park or site. The proportion of blacks and Hispanics who attended an historic park
or site in 2008 did not differ significantly from each other.
2008 saw proportional attendance at historic parks and sites that was as low, or lower, than any
previous SPPA round in all race/ethnic groups. The proportion of Hispanics visiting an historic park or
site saw the most dramatic decline, more than 55 percent from the 1985 peak of 32.4 percent to the
2008 low of 14.0 percent. Blacks saw a 41 percent decline in proportional attendance from the 1982
peak of 21.6 percent to the 2008 low of 12.6 percent. The proportion of Asians that visited an historic
park or site declined by nearly 37 percent, from the peak of 31.1 percent in 1985 to the low of 19.6
percent in 2008. Whites saw a 25 percent decline in proportional attendance from 1982 (39.3 percent)
to 2008 (29.5 percent).
0
5
10
15
20
25
30
35
40
45
1982 1985 1992 2002 2008
(%)
White
Black
Asian
Hispanic

24
Participation in the arts through media
In addition to attending arts activities, many people participate in the arts through various media outlets,
such as television, the internet, and radio. The following section examines race/ethnic differences in
participation rates through media in the most recent SPPA. Table 2.2 also includes the two live
attendance domains that were not covered in detail above. We also report on arts domains that were
newly added to the SPPA in 2008 and, as such, do not permit trend analysis.
Table 2.2 Arts participation rates, by race/ethnicity, 2008
Total White Black Asian Hispanic Percent S.E Percent S.E Percent S.E Percent S.E Percent S.E Go to a live… Dance performance 5.17 0.19 5.93 0.23 3.00 0.44 4.75 0.98 3.16 0.44 Latin/salsa music 4.87 0.26 3.12 0.24 1.63 0.42 1.81 0.68 17.38 1.29 Read … Novel or short story 46.97 0.44 53.06 0.50 37.58 1.39 36.96 2.13 27.21 1.16 Play 2.58 0.14 2.56 0.16 3.05 0.49 2.27 0.64 2.19 0.38 Poetry 8.30 0.24 8.03 0.27 10.46 0.87 7.85 1.19 7.28 0.69 Use internet to… Watch, listen, or download 30.11 0.93 29.33 1.04 30.99 2.89 29.04 4.06 35.31 3.01 View visual art online 20.23 0.78 21.56 0.90 14.86 1.92 17.51 3.28 14.73 2.43 Obtain info on performance 34.92 0.95 37.25 1.09 26.10 2.54 27.90 3.98 30.07 3.00 Create or post own art 7.19 0.52 7.06 0.57 5.75 1.46 10.38 2.53 7.19 1.77 Watch or listen to any recorded or live broadcast of…
Jazz 14.19 0.58 14.25 0.66 19.63 2.14 12.51 2.34 9.57 1.51 Latin/salsa music 14.88 0.62 8.76 0.54 9.95 1.49 4.10 1.40 55.20 2.41 Classical music 17.83 0.61 19.60 0.73 10.70 1.36 27.01 3.43 12.10 1.59 Opera 4.87 0.33 5.45 0.41 2.50 0.65 7.44 1.35 3.50 0.93 Musical stage play 7.93 0.43 8.75 0.53 6.92 1.17 6.53 1.21 5.84 1.19 Non-musical stage play 6.77 0.41 6.43 0.46 8.39 1.32 8.48 2.29 7.35 1.37 Dance performance 7.99 0.42 9.06 0.52 6.65 1.21 8.15 2.04 4.01 0.94 Program about art 15.05 0.58 16.77 0.70 9.79 1.39 14.80 2.94 10.99 1.52 Program about books or writing 14.99 0.58 17.07 0.71 10.81 1.49 14.15 2.88 8.34 1.43
Overall, a higher proportion of whites and Asians attended live dance performances in 2008 than blacks
or Hispanics. However, when only Latin or Salsa dance performances are considered, the proportion of
Hispanics that attended dwarfs all other groups. This finding is not surprising due to the cultural
significance of Salsa dancing among Hispanics.
Participation through reading
Reading novels and short stories was far and away the most popular form of arts participation in 2008
with 47 percent of all people in the U.S. having read a novel or short story. However, readership was

25
not evenly distributed across the race/ethnic groups. More than half of whites (53.6 percent) read a
novel or short story in 2008, whereas only around 37 percent of blacks and Asians read a novel, and
barely more than a quarter of Hispanics read a novel or short story in 2008. The proportions of each
race/ethnic group that read plays in 2008 did not differ significantly from each other at around 2-3
percent. A higher proportion of blacks (10.5 percent) read poetry in 2008 than all other race/ethnic
groups. The proportions of the non-black race/ethnic groups that read poetry did not differ significantly
from each other at around eight percent.
Participation through the internet
Participation in the arts via the internet shows some promise for closing the race/ethnic arts
participation gap. Non-white groups had higher rates of arts participation through the internet in two
of the three internet participation domains that were measured in the SPPA. This contrasts with the
general trend observed in participation in the core domains where whites participated at a significantly
higher rate than non-whites in most domains. This reversing of the trend, or closing of the gap, in arts
participation on the internet by non-whites compared to whites may be an avenue institutions that
produce arts content to reach out to and re-engage with the non-white population.
A higher proportion of Hispanics (35.3 percent) used the internet to stream or download arts content
than other race/ethnic groups. The proportions of all other groups using the internet to stream or
download arts content did not significantly differ from each other at around 29 percent. We can not
determine from the SPPA if the content that was streamed or downloaded. So we can’t know if this
difference is indicative of higher streaming of popular music and videos by Hispanics than other
race/ethnic groups or is evidence of higher streaming of content from the core arts domains by
Hispanics. A higher proportion of whites than other race/ethnic groups used the internet to view visual
arts or to obtain information about arts performances (e.g., scheduled times, costs, etc.). A lower
proportion of blacks (5.8 percent) used the internet to create or post their own art than other
race/ethnic groups. The proportions of non-black race/ethnic groups that used the internet to post or
create their own art did not differ significantly from each other at around 7.1 percent.
Participation through watching or listening to live or recorded broadcasts
Watching or listening to arts broadcasts showed a widely varying pattern. The highest proportion of jazz
watchers and listeners was among blacks (19.6 percent). The highest proportion of salsa watchers and
listeners was Hispanics (55.2 percent). Asians watched or listened to classical (27.0 percent) and opera
(7.4 percent) in higher proportions than other race/ethnic groups. A higher proportion of whites than
other race/ethnic groups watched or listened to musical plays (8.8 percent). The proportion of whites
and Asians who watched or listened to dance performances (around 8-9 percent), programs about art
(around 15-17 percent) and programs about books or writing (around 14-17 percent) did not differ from
each other and were higher than the proportions of blacks and Hispanics engaging in those domains
through watching or listening to broadcasts.

26
Summary In general, across all core domains, whites have attended at higher rates than their non-white
counterparts. Even in jazz, where blacks historically attended in high proportions than whites, the gap
between whites and blacks reversed in 2008. Generally speaking, the peak for participation in the core
SPPA domains was in 1992 or 2002 for nearly all domains and nearly all race/ethnic groups. The time
since then has been marked by, in some cases, steep declines in proportional attendance across the core
domains. Indeed, for nearly every race/ethnic group in nearly every domain, 2008 was either the lowest,
or not significantly different from the lowest, recorded proportional attendance or in the core arts
domains. The differences in proportional attendance at the core activities by race/ethnicity have
generally been shrinking. However, the overall decline in attendance brings into question whether the
observed convergence in attendance rates at the core activities is due to social/cultural factors or
merely to a floor effect in attendance. Chapter 5 will attempt to address this question by examining the
unique effect of race/ethnicity on attendance at the SPPA core arts domains.
Chapter 3: Arts creation by race and ethnicity
In chapter two we focused on differences in participation being a spectator or audience member in the
core arts domains. In this chapter, we focus on arts creation. That is, we are seeking to illuminate the
differences and similarities in arts creation by race/ethnicity. There are nine arts creation domains in
the SPPA. Not only do these activities include painting or sculpture, but also various activities such as
weaving, crocheting, or videotaping could be regarded as arts creation as long as given activity has
artistic purpose. First, we present descriptive data on trends in arts creation by race and ethnicity. A
series of logistic regressions that seek to determine the degree to which a membership in a particular
racial/ethnic group predicts creation in arts activities are presented in Chapter 6. Creation rates of four
racial/ethnic groups in nine arts domains are shown in Appendix C.

27
Pottery/Jewelry Figure 3.1 Work with pottery/jewelry, by race/ethnicity, 1992-2008
In all SPPA rounds the proportion of whites that worked with pottery, ceramics, jewelry, or doing any
leatherwork or metal work was higher than, or as high as, every other race/ethnic group. In 2008, a
higher proportion of whites (6.9 percent) created pottery, ceramics, jewelry, or leather goods than all
other race/ethnic groups. The proportion of blacks, Hispanics, and Asians who created pottery and
other durable creations were not significantly different from each other (around 3.5 percent). The
proportion of people in every race/ethnic group making durable creations has been steadily declining.
In 2008, in all groups, the proportion of people creating durable art was at, or not different from, its
lowest point. The high point for durable arts creation was 1992 for whites (8.9 percent), blacks (7.7
percent), and Hispanics (5.4 percent), and 2002 for Asians (6.0 percent).
0
1
2
3
4
5
6
7
8
9
10
1992 2002
(%)
White
Black
Asian
Hispanic
2008
28
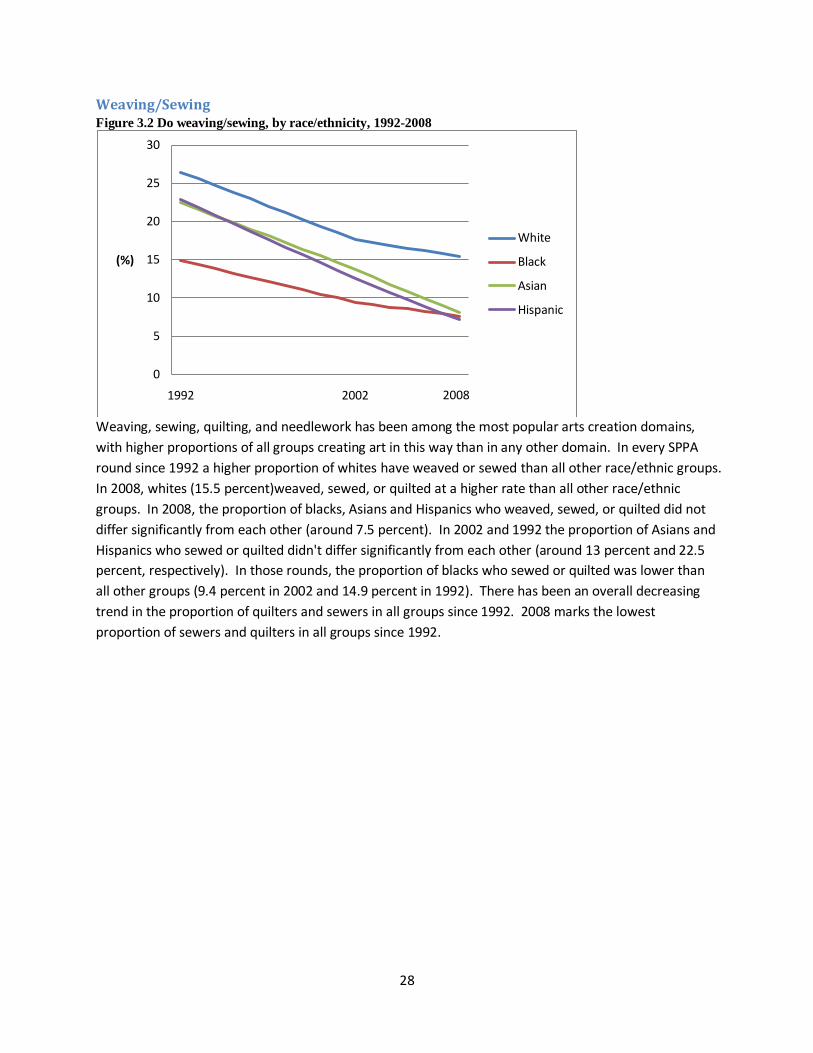
Weaving/Sewing Figure 3.2 Do weaving/sewing, by race/ethnicity, 1992-2008
Weaving, sewing, quilting, and needlework has been among the most popular arts creation domains,
with higher proportions of all groups creating art in this way than in any other domain. In every SPPA
round since 1992 a higher proportion of whites have weaved or sewed than all other race/ethnic groups.
In 2008, whites (15.5 percent)weaved, sewed, or quilted at a higher rate than all other race/ethnic
groups. In 2008, the proportion of blacks, Asians and Hispanics who weaved, sewed, or quilted did not
differ significantly from each other (around 7.5 percent). In 2002 and 1992 the proportion of Asians and
Hispanics who sewed or quilted didn't differ significantly from each other (around 13 percent and 22.5
percent, respectively). In those rounds, the proportion of blacks who sewed or quilted was lower than
all other groups (9.4 percent in 2002 and 14.9 percent in 1992). There has been an overall decreasing
trend in the proportion of quilters and sewers in all groups since 1992. 2008 marks the lowest
proportion of sewers and quilters in all groups since 1992.
0
5
10
15
20
25
30
1992 2002
(%)
White
Black
Asian
Hispanic
2008

29
Photo/Movie Figure 3.3 Make photographs or movies for art, by race/ethnicity, 1992-2008
Figure 3.3 shows the proportion of Americans in each race/ethnic group that made photographs, movies,
or videotapes as an artistic activity during last quarter century. The proportion of whites that created
artistic photography or videos was as higher than, or as high as, any other race/ethnic group in all SPPA
rounds. In 2008, a higher proportion of whites and Asians (around 16 percent) than Hispanics or blacks
(around 10 percent) created artistic photographs and videos. The proportions whites and Asians and
the proportions of blacks and Hispanics who created artistic photographs and movies did not differ
significantly from one another in 2008. Photography and movie-making is noteworthy because it is the
only arts creation domain that is on the rise. This may be due to the ease of creation that digital camera
and video technology offers. Indeed 2008 was the highest, or not different from the highest, proportion
of photographers and movie-makers in every race/ethnic group.
0
2
4
6
8
10
12
14
16
18
1992 2002
(%)
White
Black
Asian
Hispanic
2008
30
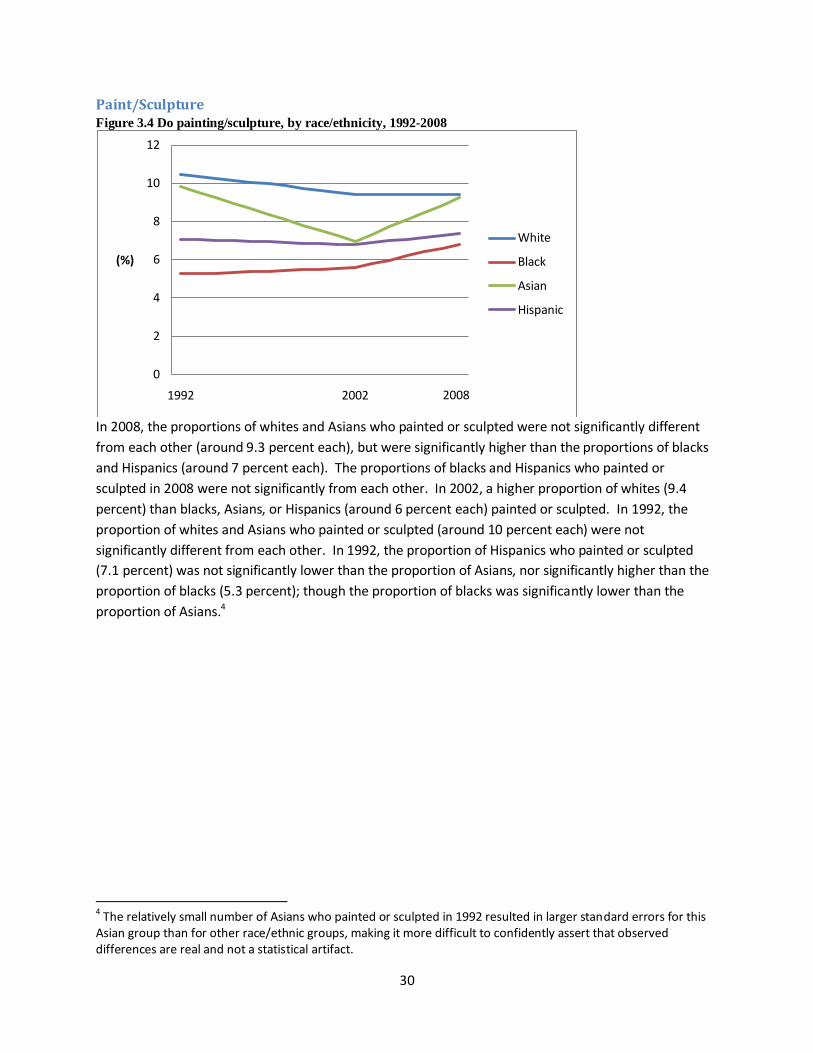
Paint/Sculpture
Figure 3.4 Do painting/sculpture, by race/ethnicity, 1992-2008
In 2008, the proportions of whites and Asians who painted or sculpted were not significantly different
from each other (around 9.3 percent each), but were significantly higher than the proportions of blacks
and Hispanics (around 7 percent each). The proportions of blacks and Hispanics who painted or
sculpted in 2008 were not significantly from each other. In 2002, a higher proportion of whites (9.4
percent) than blacks, Asians, or Hispanics (around 6 percent each) painted or sculpted. In 1992, the
proportion of whites and Asians who painted or sculpted (around 10 percent each) were not
significantly different from each other. In 1992, the proportion of Hispanics who painted or sculpted
(7.1 percent) was not significantly lower than the proportion of Asians, nor significantly higher than the
proportion of blacks (5.3 percent); though the proportion of blacks was significantly lower than the
proportion of Asians.4
4 The relatively small number of Asians who painted or sculpted in 1992 resulted in larger standard errors for this
Asian group than for other race/ethnic groups, making it more difficult to confidently assert that observed differences are real and not a statistical artifact.
0
2
4
6
8
10
12
1992 2002
(%)
White
Black
Asian
Hispanic
2008
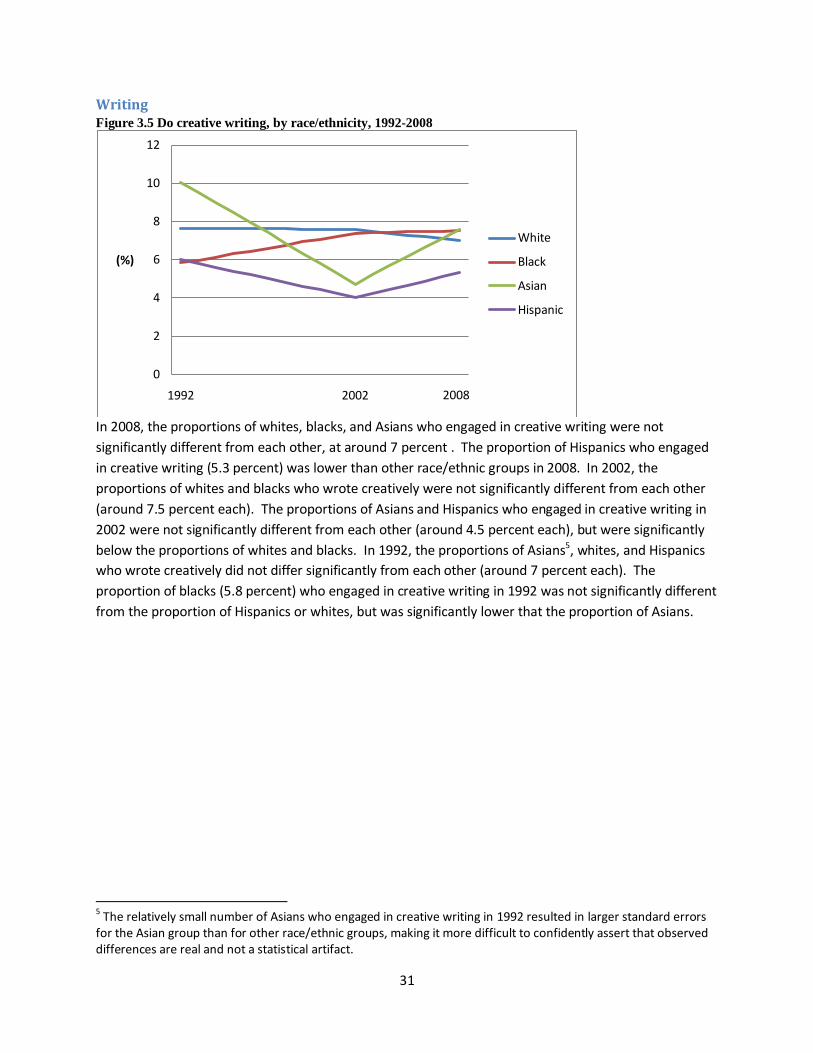
31
Writing Figure 3.5 Do creative writing, by race/ethnicity, 1992-2008
In 2008, the proportions of whites, blacks, and Asians who engaged in creative writing were not
significantly different from each other, at around 7 percent . The proportion of Hispanics who engaged
in creative writing (5.3 percent) was lower than other race/ethnic groups in 2008. In 2002, the
proportions of whites and blacks who wrote creatively were not significantly different from each other
(around 7.5 percent each). The proportions of Asians and Hispanics who engaged in creative writing in
2002 were not significantly different from each other (around 4.5 percent each), but were significantly
below the proportions of whites and blacks. In 1992, the proportions of Asians5, whites, and Hispanics
who wrote creatively did not differ significantly from each other (around 7 percent each). The
proportion of blacks (5.8 percent) who engaged in creative writing in 1992 was not significantly different
from the proportion of Hispanics or whites, but was significantly lower that the proportion of Asians.
5 The relatively small number of Asians who engaged in creative writing in 1992 resulted in larger standard errors
for the Asian group than for other race/ethnic groups, making it more difficult to confidently assert that observed differences are real and not a statistical artifact.
0
2
4
6
8
10
12
1992 2002
(%)
White
Black
Asian
Hispanic
2008

32
Play jazz Figure 3.6 Perform or rehearse jazz music, by race/ethnicity, 1992-2008
Overall, the proportion of the country that performs or rehearses jazz music is quite small. In no
race/ethnic group has the proportion ever reached as high as three percent. In 2008, the proportions of
whites and blacks that played jazz music did not differ significantly (around 1.5 percent each). The
proportion of Hispanics(0.8 percent) who played jazz did not differ significantly from blacks in 2008,
though it was significantly lower that the proportion of whites. The proportion of Asians (0.1 percent)
who played jazz in 2008 was lower than all other race/ethnic groups. In 2002 the proportions of whites
and blacks who played jazz (around 1.3 percent), again, were not different from each other, but were
higher than the proportions of Asians and Hispanics, which did not differ from each other (around 0.5
percent). In 1992, the proportion of whites, blacks, and Asians who played jazz music did not differ
significantly from each other (around 2 percent each); whereas the proportion of Hispanics who played
jazz music (0.8 percent) was lower than all other groups.
The high-water mark for jazz creation was in 1992. Since then, the proportion of whites creating jazz
has not differed significantly; the proportion of blacks has fallen and the proportion of Asians creating
jazz has plummeted to the current level of less than one quarter of one percent.
0
0.5
1
1.5
2
2.5
3
3.5
1992 2002
(%)
White
Black
Asian
Hispanic
2008

33
Play classical Figure 3.7 Perform or rehearse classical music, by race/ethnicity, 1992-2008
Figure 3.7 shows that in 2008 the proportions of whites and Asians who played classical music were not
significantly different from each other (around three and a half percent each), but these proportions
were higher than those of blacks (2.0 percent) and Hispanics (1.1 percent), which were not significantly
different from one another. The same pattern held in 2002, where the proportions of whites and Asians
were not significantly different from each other (around two and a quarter percent each), but were
higher than the proportions of blacks and Hispanics (around a half percent each), which were not
significantly different from each other. In 1992, the same pattern as the two later SPPAs persisted
where whites and Asians (between four and five percent each), but were higher than the proportions of
blacks and Hispanics (around two and a half percent each). The peak of classical music performance for
all race/ethnic groups was in 1992. There was a dramatic drop in the proportions of each race/ethnic
group from 1992 to 2002. The proportions of classical musicians have rebounded from their 2002 lows,
but have not matched their 1992 highs.
Sing opera6
Sing musical
6 The proportion of any group singing opera is so small that it is difficult to make meaningful between-group comparisons. Indeed, there are several data points where a reliable within group estimate of the proportion cannot be obtained. Therefore, this singing opera is not included in these figures. Opera-specific data are presented in Appendix D.
0
1
2
3
4
5
6
1992 2002
(%)
White
Black
Asian
Hispanic
2008
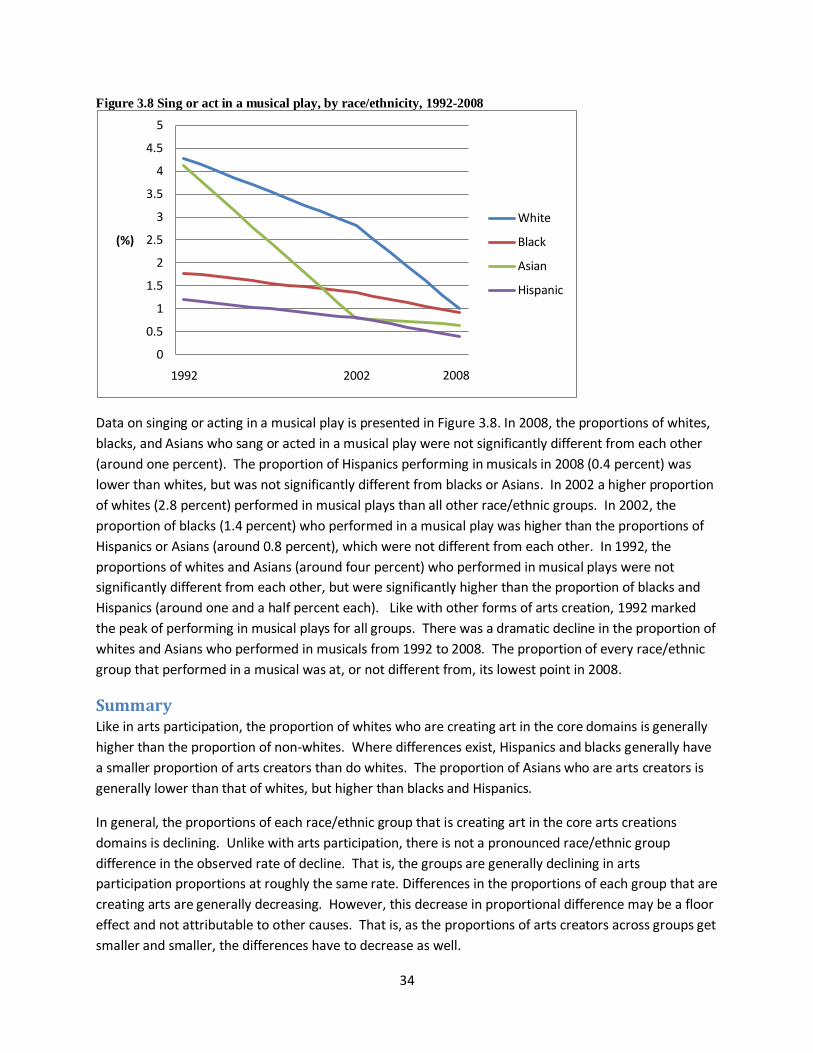
34
Figure 3.8 Sing or act in a musical play, by race/ethnicity, 1992-2008
Data on singing or acting in a musical play is presented in Figure 3.8. In 2008, the proportions of whites,
blacks, and Asians who sang or acted in a musical play were not significantly different from each other
(around one percent). The proportion of Hispanics performing in musicals in 2008 (0.4 percent) was
lower than whites, but was not significantly different from blacks or Asians. In 2002 a higher proportion
of whites (2.8 percent) performed in musical plays than all other race/ethnic groups. In 2002, the
proportion of blacks (1.4 percent) who performed in a musical play was higher than the proportions of
Hispanics or Asians (around 0.8 percent), which were not different from each other. In 1992, the
proportions of whites and Asians (around four percent) who performed in musical plays were not
significantly different from each other, but were significantly higher than the proportion of blacks and
Hispanics (around one and a half percent each). Like with other forms of arts creation, 1992 marked
the peak of performing in musical plays for all groups. There was a dramatic decline in the proportion of
whites and Asians who performed in musicals from 1992 to 2008. The proportion of every race/ethnic
group that performed in a musical was at, or not different from, its lowest point in 2008.
Summary Like in arts participation, the proportion of whites who are creating art in the core domains is generally
higher than the proportion of non-whites. Where differences exist, Hispanics and blacks generally have
a smaller proportion of arts creators than do whites. The proportion of Asians who are arts creators is
generally lower than that of whites, but higher than blacks and Hispanics.
In general, the proportions of each race/ethnic group that is creating art in the core arts creations
domains is declining. Unlike with arts participation, there is not a pronounced race/ethnic group
difference in the observed rate of decline. That is, the groups are generally declining in arts
participation proportions at roughly the same rate. Differences in the proportions of each group that are
creating arts are generally decreasing. However, this decrease in proportional difference may be a floor
effect and not attributable to other causes. That is, as the proportions of arts creators across groups get
smaller and smaller, the differences have to decrease as well.
0
0.5
1
1.5
2
2.5
3
3.5
4
4.5
5
1992 2002
(%)
White
Black
Asian
Hispanic
2008

35
The high-water mark for nearly every domain of arts creation occurred in 1992. Since then there has
been significant decreases or a lack of growth in nearly all domains. It is not clear what the cause of the
explosive participation in the arts at that time was.
The only arts creation domain that is showing consistent growth is photography and movie-making. We
speculate that the ubiquity and low cost of digital still and video cameras may be related to this
phenomenon, but there is insufficient evidence in the SPPA to draw any firm conclusions.

36
Chapter 4: Effect of the changing demographic landscape on
arts audiences
Introduction In previous chapters we’ve shown that there has been an overall decline in the proportion of the
population and the proportion of each race/ethnic group attending the core arts domains. However, it
is not clear from those data if the decline is uniform across race/ethnic groups or if some race/ethnic
groups are declining faster in some domains than others. Taking accurate stock of the relative
proportion of the audience of each of the arts domains, however, is not sufficient to answer the
question of whether the changes that we are witnessing are proportional or not. This is because the
overall demographic make-up of the United States is changing. That is, the relative proportion of the
United States population that is made up of whites or Hispanics, for example, is changing.
In this chapter we will compare the changing demographics of the United States to the changing
demographics of the audience of each of the core arts activities to ascertain if the observed changes in
the composition of the arts audiences are consistent with what we would expect, given the underlying
changes in the nation’s demographic profile.
The United States’ changing demographic profile Figure 4.1 Racial/ethnic composition of population, 1992-2008
Over the past decade and a half the racial/ethnic composition of the United States has been changing.
For example, in 1992 more than three quarters (77.8 percent) of adults in America were white, around
one in nine (11.2) were black, around one in twelve (8.3 percent) were Hispanic, and barely one in 40
(2.6 percent) were Asian. By 2002, the proportion of the United States population that was white had
fallen to 73.3 percent, the proportion of blacks had risen slightly to 11.6 percent and Hispanics and
Asians had climbed to 11.1 percent and 4.0 percent, respectively. In 2008, the proportion of the
population that was white continued to decline to 70.0 percent. The proportion of Hispanics climbed to
0%
10%
20%
30%
40%
50%
60%
70%
80%
90%
100%
1992 2002 2008
Hispanic
Asian
Black
White
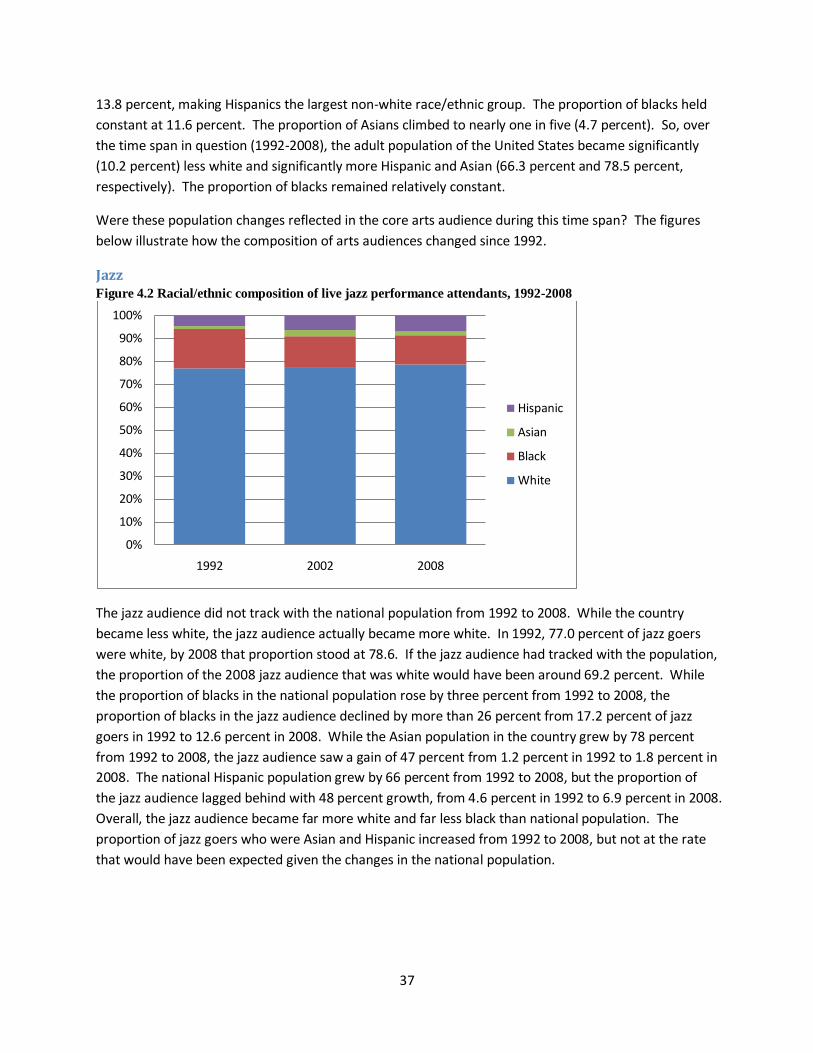
37
13.8 percent, making Hispanics the largest non-white race/ethnic group. The proportion of blacks held
constant at 11.6 percent. The proportion of Asians climbed to nearly one in five (4.7 percent). So, over
the time span in question (1992-2008), the adult population of the United States became significantly
(10.2 percent) less white and significantly more Hispanic and Asian (66.3 percent and 78.5 percent,
respectively). The proportion of blacks remained relatively constant.
Were these population changes reflected in the core arts audience during this time span? The figures
below illustrate how the composition of arts audiences changed since 1992.
Jazz Figure 4.2 Racial/ethnic composition of live jazz performance attendants, 1992-2008
The jazz audience did not track with the national population from 1992 to 2008. While the country
became less white, the jazz audience actually became more white. In 1992, 77.0 percent of jazz goers
were white, by 2008 that proportion stood at 78.6. If the jazz audience had tracked with the population,
the proportion of the 2008 jazz audience that was white would have been around 69.2 percent. While
the proportion of blacks in the national population rose by three percent from 1992 to 2008, the
proportion of blacks in the jazz audience declined by more than 26 percent from 17.2 percent of jazz
goers in 1992 to 12.6 percent in 2008. While the Asian population in the country grew by 78 percent
from 1992 to 2008, the jazz audience saw a gain of 47 percent from 1.2 percent in 1992 to 1.8 percent in
2008. The national Hispanic population grew by 66 percent from 1992 to 2008, but the proportion of
the jazz audience lagged behind with 48 percent growth, from 4.6 percent in 1992 to 6.9 percent in 2008.
Overall, the jazz audience became far more white and far less black than national population. The
proportion of jazz goers who were Asian and Hispanic increased from 1992 to 2008, but not at the rate
that would have been expected given the changes in the national population.
0%
10%
20%
30%
40%
50%
60%
70%
80%
90%
100%
1992 2002 2008
Hispanic
Asian
Black
White
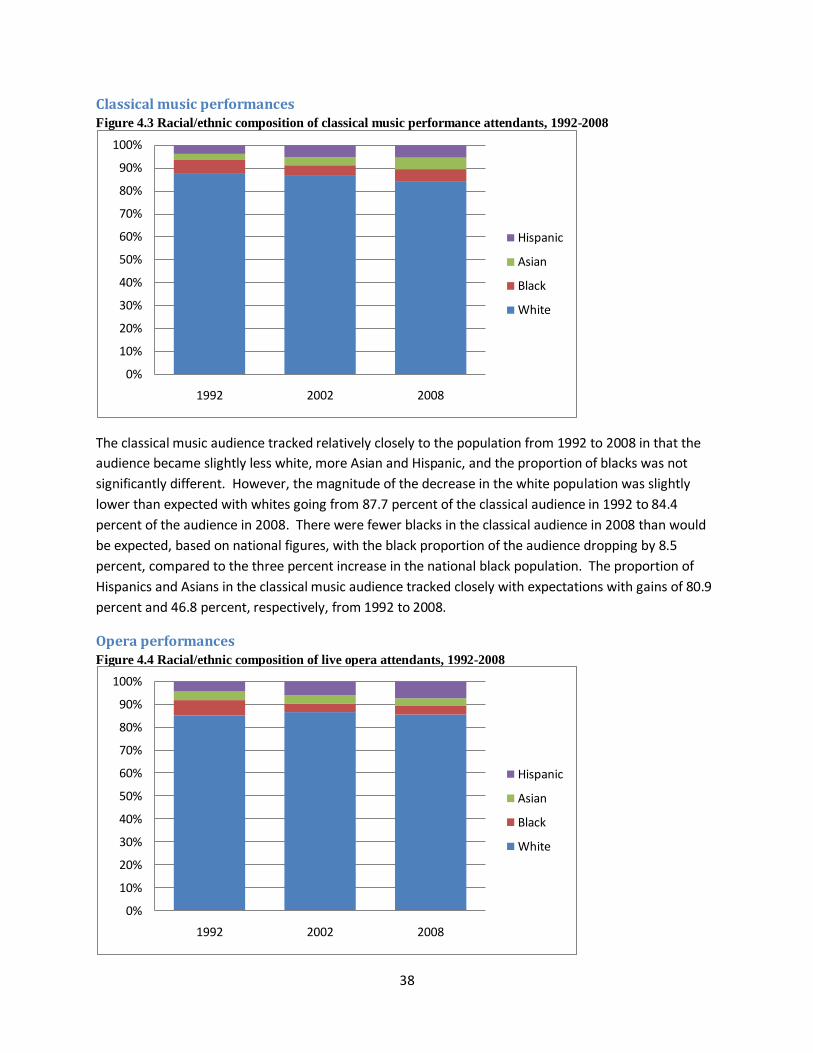
38
Classical music performances Figure 4.3 Racial/ethnic composition of classical music performance attendants, 1992-2008
The classical music audience tracked relatively closely to the population from 1992 to 2008 in that the
audience became slightly less white, more Asian and Hispanic, and the proportion of blacks was not
significantly different. However, the magnitude of the decrease in the white population was slightly
lower than expected with whites going from 87.7 percent of the classical audience in 1992 to 84.4
percent of the audience in 2008. There were fewer blacks in the classical audience in 2008 than would
be expected, based on national figures, with the black proportion of the audience dropping by 8.5
percent, compared to the three percent increase in the national black population. The proportion of
Hispanics and Asians in the classical music audience tracked closely with expectations with gains of 80.9
percent and 46.8 percent, respectively, from 1992 to 2008.
Opera performances Figure 4.4 Racial/ethnic composition of live opera attendants, 1992-2008
0%
10%
20%
30%
40%
50%
60%
70%
80%
90%
100%
1992 2002 2008
Hispanic
Asian
Black
White
0%
10%
20%
30%
40%
50%
60%
70%
80%
90%
100%
1992 2002 2008
Hispanic
Asian
Black
White

39
The proportion of the opera audience that was white was not significantly different in 2008 than it was
in 1992. However, given the overall decline in the proportion of the population that was white during
this same time, the opera audience still became whiter than expected. There was a 37.8 percent decline
in the proportion of the opera audience that was black from 1992 to 2008, which is far larger than the
three percent gain in blacks that the population experienced. The 17 percent decline in the proportion
of the opera audience that was made up of Asians is also contrary to expectation, given the substantial
growth of the proportion of Asians in the general population. The proportion of the opera audience that
was Hispanic grew by 66.6 percent from 1992 to 2008, which is very consistent with the 66.3 percent
growth in the general Hispanic population in the same time span. Overall, the opera audience in 2008
compared to 1992 was whiter than expected and less black and Asian than expected. The proportion of
Hispanics in the audience was well within expectations.
Attendance at live musical plays Figure 4.5 Racial/ethnic composition of musical stage play attendants, 1992-2008
The proportion of the audience at live musical plays that was white was not significantly different in
1992 than it was in 2008. However, given the overall decline in the proportion of the population that
was white during this same time, the musical plays audience became whiter than expected. There was a
41.6 percent decline in the proportion of the audience at musical plays that was black from 1992 to
2008, which diverges from the virtually unchanged proportional representation that blacks that the
population experienced. The 137 percent increase in the proportion of the audience at live musicals
from 1992 to 2008 that was Asian was outpaced the 78.5 percent proportional growth of Asians in the
overall There was a 48.9 percent increase in the proportion of the musical audience that was made up of
Hispanics, which is close, but not equivalent to the 66 percent growth in Hispanics seen in the general
population over the time period. Overall, the musical audience retained the proportion of whites, which
is counter to expectation, given the population change, lost a significant proportion of blacks, and
increased the proportion of Asians and Hispanics, but at a rate that is slightly lower than expectation,
given the underlying demographic climate.
0%
10%
20%
30%
40%
50%
60%
70%
80%
90%
100%
1992 2002 2008
Hispanic
Asian
Black
White
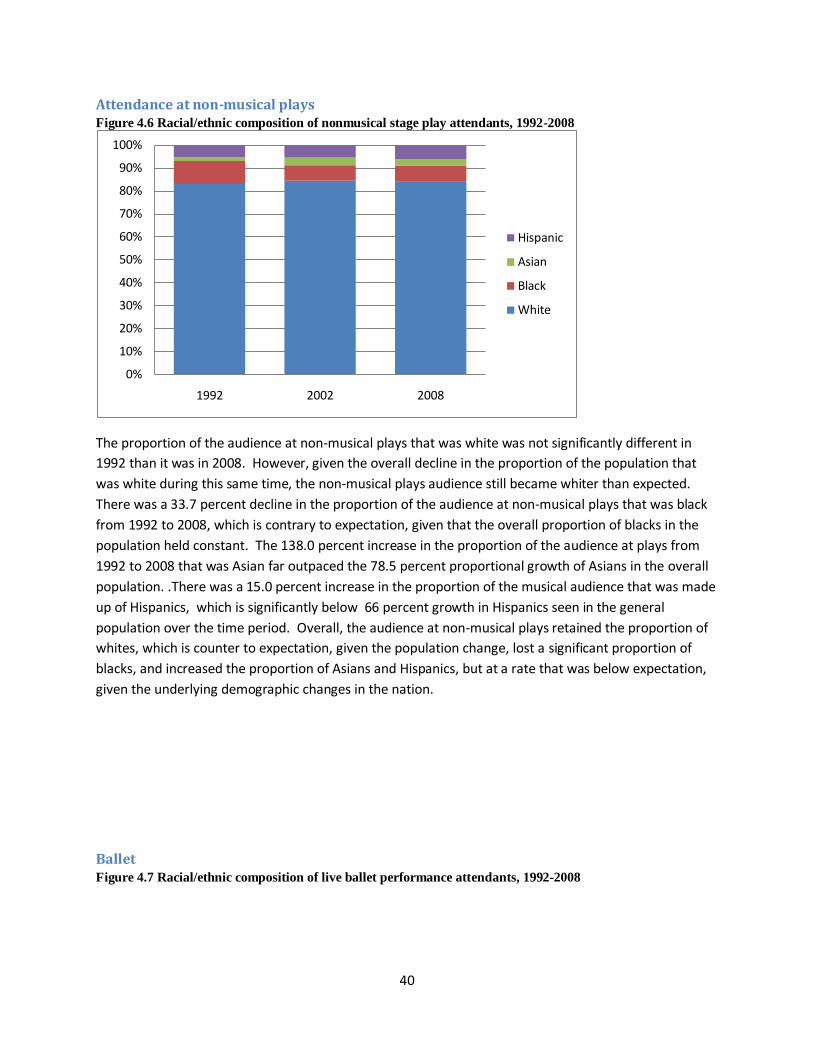
40
Attendance at non-musical plays Figure 4.6 Racial/ethnic composition of nonmusical stage play attendants, 1992-2008
The proportion of the audience at non-musical plays that was white was not significantly different in
1992 than it was in 2008. However, given the overall decline in the proportion of the population that
was white during this same time, the non-musical plays audience still became whiter than expected.
There was a 33.7 percent decline in the proportion of the audience at non-musical plays that was black
from 1992 to 2008, which is contrary to expectation, given that the overall proportion of blacks in the
population held constant. The 138.0 percent increase in the proportion of the audience at plays from
1992 to 2008 that was Asian far outpaced the 78.5 percent proportional growth of Asians in the overall
population. .There was a 15.0 percent increase in the proportion of the musical audience that was made
up of Hispanics, which is significantly below 66 percent growth in Hispanics seen in the general
population over the time period. Overall, the audience at non-musical plays retained the proportion of
whites, which is counter to expectation, given the population change, lost a significant proportion of
blacks, and increased the proportion of Asians and Hispanics, but at a rate that was below expectation,
given the underlying demographic changes in the nation.
Ballet Figure 4.7 Racial/ethnic composition of live ballet performance attendants, 1992-2008
0%
10%
20%
30%
40%
50%
60%
70%
80%
90%
100%
1992 2002 2008
Hispanic
Asian
Black
White

41
The proportion of the audience at ballet performances that was white was not significantly different in
1992 than it was in 2008. However, given the overall decline in the proportion of the population that
was white during this same time, the ballet audience still became whiter than expected. There was a
32.0 percent decline in the proportion of the ballet audience that was black from 1992 to 2008, which is
far significantly below the three percent gain in blacks in the overall population. The 16.0 percent
decrease in the proportion of the ballet audience from 1992 to 2008 that was Asian was contrary to the
78.5 percent growth in Asian representation in the overall population. There was a 62.2 percent
increase in the proportion of the musical audience that was made up of Hispanics, which is only slightly
below the 66 percent growth in Hispanics seen in the general population over the time period. Overall
the ballet audience became more white and less black and Asian that would have been expected from
1992-2008. The representation of Hispanics in the ballet audience was roughly on par with expectation,
given the growth of Hispanics in the general population.
0%
10%
20%
30%
40%
50%
60%
70%
80%
90%
100%
1992 2002 2008
Hispanic
Asian
Black
White

42
Visiting a museum or gallery Figure 4.8 Racial/ethnic composition of museum/gallery visitors, 1992-2008
The proportion of museum goers who were white decreased slightly from 1992 to 2008. However the
3.3 percent decrease (from 83.6 percent in 1992 to 80.3 percent in 2008) was substantially smaller than
the 7.8 percent decrease (from 77.8 percent in 1982 to 70.0 percent in 2008) in white representation
that the overall population experienced. The 25.8 percent decline in the proportional representation of
blacks among museum and gallery goers was contrary to the trend of relative stability that was seen in
the general population. The representation of Asians among museum growers climbed by 75.4 percent,
which is on a par with the growth 78.5 percent growth seen in the general population. The proportion
of museum goers who were Hispanic grew by 78.7 percent, which slightly outpaces the 66.3 percent
growth in proportional representation of Hispanics in the US from 1992-2008. Overall, the audience at
museums became less white and far less black. The museum-going audience also became more
Hispanic and Asian and the changes in Hispanic and Asian representation were on a par with overall
growth of Asian and Hispanic representation in the population. The decrease in the proportion of
museum goers who were white was not as large as expected degree, given the decline of the white
proportion in the population. The decrease in black museum goers differed dramatically from the
stability in proportional representation of blacks seen in the overall population.
0%
10%
20%
30%
40%
50%
60%
70%
80%
90%
100%
1992 2002 2008
Hispanic
Asian
Black
White
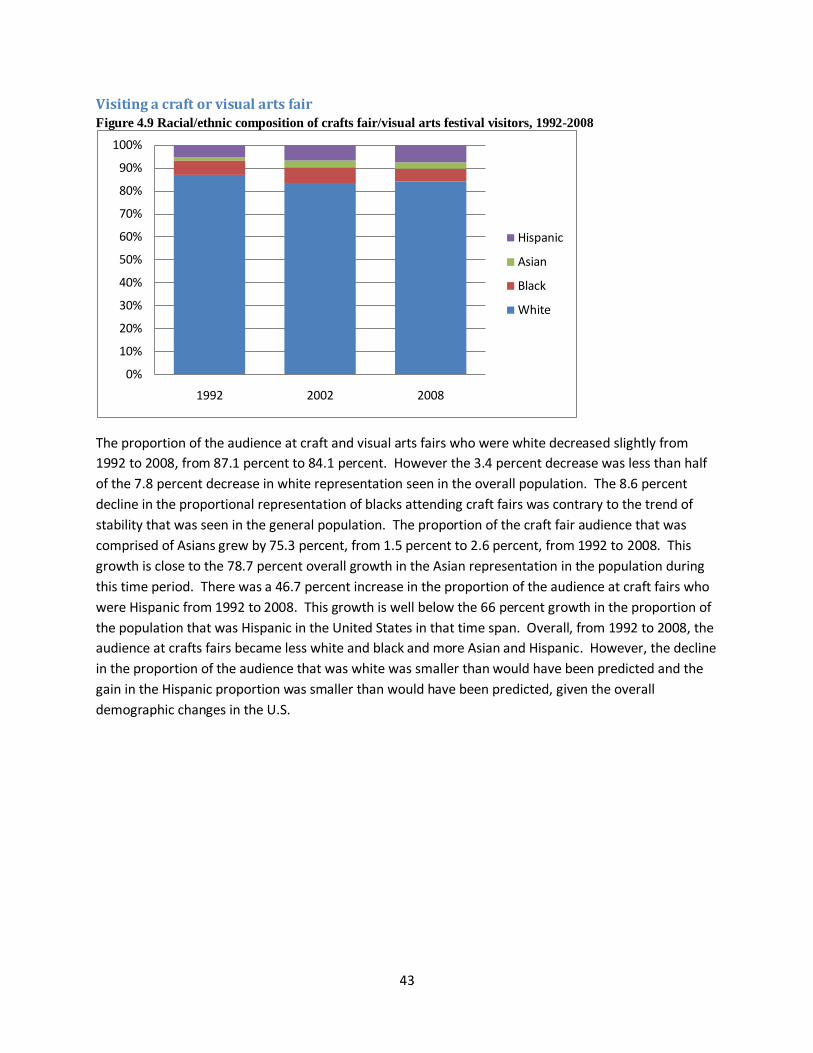
43
Visiting a craft or visual arts fair Figure 4.9 Racial/ethnic composition of crafts fair/visual arts festival visitors, 1992-2008
The proportion of the audience at craft and visual arts fairs who were white decreased slightly from
1992 to 2008, from 87.1 percent to 84.1 percent. However the 3.4 percent decrease was less than half
of the 7.8 percent decrease in white representation seen in the overall population. The 8.6 percent
decline in the proportional representation of blacks attending craft fairs was contrary to the trend of
stability that was seen in the general population. The proportion of the craft fair audience that was
comprised of Asians grew by 75.3 percent, from 1.5 percent to 2.6 percent, from 1992 to 2008. This
growth is close to the 78.7 percent overall growth in the Asian representation in the population during
this time period. There was a 46.7 percent increase in the proportion of the audience at craft fairs who
were Hispanic from 1992 to 2008. This growth is well below the 66 percent growth in the proportion of
the population that was Hispanic in the United States in that time span. Overall, from 1992 to 2008, the
audience at crafts fairs became less white and black and more Asian and Hispanic. However, the decline
in the proportion of the audience that was white was smaller than would have been predicted and the
gain in the Hispanic proportion was smaller than would have been predicted, given the overall
demographic changes in the U.S.
0%
10%
20%
30%
40%
50%
60%
70%
80%
90%
100%
1992 2002 2008
Hispanic
Asian
Black
White

44
Visiting an historic park or site Figure 4.10 Racial/ethnic composition of historic park or site visitors, 1992-2008
The proportion of visitors to historic parks and sites who were white declined from 88.0 percent in 1992
to 82.9 percent in 2008. The magnitude of this decrease in proportional representation (5.1 percent) is
around 60 percent of the 7.8 percent decrease in proportion of the overall U.S. population that was
white. The proportion of visitors to historic parks and sites who were black was not significantly
different in 1992 (5.7 percent) and 2008 (5.8 percent), which is consistent with the stable representation
of blacks in the overall population. The proportion of Asian visitors to historic parks and sites climbed by
127 percent from 1992 (1.6 percent) to 2008 (3.7 percent), which far exceeds the 78.7 percent growth in
Asian representation in the overall population during this time. The proportion of visitors to historic
parks and sites who were Hispanic grew from 4.7 percent in 1992 to 7.7 percent in 2008. The 63 percent
gain in the proportion of Hispanics at historic parks and sites was nearly the same as the 66.3 percent
gain in the proportion of the U.S. population that was Hispanic from 1992 to 2008. Overall the visitors
to historic parks and sites became less white and more Asian and Hispanic from 1992 to 2008. The
proportion of blacks was unchanged. The magnitude of the decline in white representation was below
the magnitude of decrease in the overall population. The magnitude of growth among Asians was above
expectation. The magnitude of change among Hispanics was roughly on par with expectation.
Summary Overall, whites were proportionally over-represented in the audience of all of the core arts domains in
1992 and that remained the case in 2008. Indeed, there were no domains where the decline in
proportional representation of whites was equal to the decline seen in the overall population during
that time span. In five of the nine domains, whites did not decline, or gained in proportional
representation. All of the non-white groups were generally under-represented in the core arts
audiences in 2008. The proportional representation of blacks either declined or was unchanged in all
nine domains. There were only two core domains, visiting craft or visual fairs and visiting historic parks
0%
10%
20%
30%
40%
50%
60%
70%
80%
90%
100%
1992 2002 2008
Hispanic
Asian
Black
White
45
and sites, where the decrease in proportional representation among blacks did not decline by at least 15
percent between 1992 and 2008. The proportional representation of Asians in the audiences of the core
arts domains generally grew from 1992 to 2008, though the growth in proportional representation was
below the impressive growth in the proportional representation of Asians in the U.S. population in the
majority of the core domains. The proportional representation of Hispanics in the core arts audiences
increased from 1992 to 2008 in nearly all of the core domains. Indeed, in many of the domains the
growth in representation of Hispanics was at or near the 63 percent growth in representation of
Hispanics in the general population.
Note: For figures and tables of the proportional representation of each race/ethnic group in the nine
arts creation domains discussed in Chapter 3, see Appendix D.

46
Table 4.1 Change in population and arts participation (%), 1992-2008
1992 2002 2008 Mean S.E Mean S.E Mean S.E
Population† White 77.84 0.41 73.33 0.42 69.96 0.44 Black 11.25 0.32 11.57 0.31 11.59 0.31 Asian 2.61 0.15 4.01 0.18 4.66 0.22 Hispanic 8.29 0.26 11.08 0.30 13.79 0.34
Jazz White 76.95 1.32 77.30 1.21 78.63 1.32 Black 17.16 1.21 13.61 1.01 12.67 1.07 Asian 1.23 0.32 2.72 0.45 1.81 0.48 Hispanic 4.65 0.62 6.37 0.72 6.88 0.83
Classical White 87.37 0.94 86.56 0.94 84.37 1.09 Black 6.18 0.70 4.55 0.59 5.25 0.64 Asian 2.67 0.49 3.65 0.51 4.83 0.71 Hispanic 3.78 0.50 5.24 0.63 5.55 0.68
Opera White 85.20 1.91 86.52 1.83 85.46 2.16 Black 6.60 1.35 3.85 1.05 4.01 1.16 Asian 3.74 1.03 3.50 0.92 3.10 1.10 Hispanic 4.46 1.11 6.12 1.34 7.43 1.64
Musical White 85.01 0.85 85.80 0.79 83.71 0.85 Black 9.24 0.70 6.95 0.59 5.89 0.50 Asian 1.58 0.32 2.77 0.36 3.76 0.46 Hispanic 4.17 0.44 4.48 0.47 6.64 0.61
Play White 83.01 1.04 84.62 0.96 84.21 1.12 Black 10.08 0.85 6.62 0.67 6.68 0.75 Asian 1.57 0.38 3.21 0.47 2.97 0.56 Hispanic 5.34 0.61 5.55 0.62 6.14 0.76
Ballet White 83.87 1.73 88.33 1.48 82.60 1.97 Black 6.28 1.16 4.50 1.01 4.27 1.00 Asian 3.63 1.02 2.60 0.72 3.05 0.94 Hispanic 6.22 1.04 4.58 0.92 10.09 1.59
Museum/Gallery White 83.60 0.72 81.66 0.70 80.28 0.79 Black 8.15 0.54 6.44 0.46 6.05 0.47 Asian 2.81 0.34 5.15 0.39 4.93 0.46 Hispanic 5.45 0.42 6.75 0.47 8.74 0.56
Craft fair White 87.06 0.52 83.47 0.60 84.07 0.70 Black 6.28 0.39 6.82 0.43 5.74 0.44 Asian 1.46 0.20 2.97 0.26 2.56 0.33 Hispanic 5.20 0.33 6.74 0.41 7.63 0.51
Park White 87.99 0.55 83.60 0.63 82.88 0.70 Black 5.72 0.41 6.53 0.44 5.80 0.42 Asian 1.61 0.22 3.85 0.32 3.66 0.38 Hispanic 4.68 0.34 6.02 0.40 7.65 0.50
†Includes both participants and non-participants

47
Chapter 5: The net effect of race/ethnicity on arts participation
in the core domains
Chapters two and three described the differences in participation in nine core domains and creation in
other nine core domains for by race/ethnicity across the SPPA rounds. However, as Love and Kipple
(1994) pointed out, these descriptive differences do not shed sufficient light on the degree to which
membership in a particular race/ethnic group predicts arts participation. The reason for the lack of
clarity in the descriptive statistics alone is that there are a number of factors that have been found to
strongly predict arts participation. Some of these factors are level of formal education, sex, and
proximity to arts outlets. Further, these factors are not evenly distributed across the various race/ethnic
groups. So, to truly understand the effect that belonging to a particular race/ethnic group has on one’s
arts participation above and beyond these other factors that are known to be associated with arts
participation, researchers must account for these factors in a model and see if, even after holding these
other factors constant, we still see a difference in arts participation. In keeping with Love and Kipple’s
work, we will use a series of logistic regressions to account for the known covariates and examine the
effect of belonging to a particular race/ethnic group on each of the arts domains. We will further seek
to expand on the work done by Love and Kipple (1994) and other researchers by examining the effect of
particularly important interactions in our models.
Previous research (Love and Kipple 1994; Williams and Keen 2009) shows that arts participation is
reliably associated with education, income, age, sex, and familial background. For example, Williams
and Keen (2009) report that the top third of earners make up nearly 50 percent of people reporting
attendance at, at least, one bench mark activity. These researchers, as well as Love and Kipple (1994)
and Nichols (2003), report that level of formal education is an extremely strong predictor of
participation in the core arts activities. Older people are more likely to attend arts activities than are
younger people (Williams & Keen, 2009) and women are more likely to attend arts activities than are
men. We hypothesized that other factors might also have a significant impact on arts participation.
Namely, we expected that factors from one’s family of origin would influence arts participation. That is,
we expected that if one were from a family in which arts possessed characteristics that are correlated
with high arts consumption, then he or she would be more likely to participate in the arts than if one
were from a family of origin did not possess these characteristics. We believe that this family-of-origin
effect would be seen even after accounting for characteristics that the person, himself, might possess.
The closest measure that we had of such family-of-origin factor was parental education. We
hypothesized that the strong relationship between an individual’s education level and arts participation
would extend from the family of origin and that people who had more educated parents would be more
likely to participate in the arts, even after accounting for their own educational level.
Logistic regression models of core SPPA variables This section reports the results of the logistic regression analyses that determine the extent to which
membership in a particular racial/ethnic group predicts participation in a particular arts activity. .
Logistic regression is a statistical technique that allows us to examine the influence of membership in
48
one group on outcome variables relative to another group. That is, using logistic regression will allow us
to say that, after taking other relevant factors into account, that members of the reference group are x
percent more likely than members of the comparison group to participate in a particular art form.
However, one of the problems with logistic regression, or any form of regression, is that we can not
know the direction of causality between factors. That is, just based on the results of a logistic regression
analysis, we can't tell if A caused B, if B caused A, or if there was some other factor that caused both A
and B. This problem is mitigated to a large degree by the nature of the factors that we are examining. It
is not reasonable to think that participation in the arts might cause one to be a member of a particular
race/ethnic group. It is also highly unlikely that the other factors that we consider (e.g., education,
income, etc.) are caused by participation in the arts. In these analyses we must compare one group to
all of the others. For all of the models that we will present, one model for each of the core arts
domains, the reference group will be whites. So, our final models will indicate the relative likelihood for
each race/ethnic group to participate in the specified activity compared to whites.
Control variables
In analyses of this kind, we use control variables, or covariates, to hold constant the impact of factors
that we know to be related to arts participation across race/ethnic groups. Previous research has shown
various socio-demographic variables influence arts participation. In this monograph, various factors are
taken into consideration including education, gender, family income, employment status, parents’
education, US citizenship status, and the size of respondent’s residential community alongside our key
variables: race and ethnicity. See Appendix A for a full description of each of the variables used in these
models.
The only difference of control variables included between arts participation and arts creation is that
parents’ education level is dropped in models for arts creation. This is not because their educational
attainment has nothing to do with arts creation, but because items on arts creation were not asked to
all respondents in some rounds.
In this report, we replicate the work done by Love and Kipple (1994) in assessing the predictive power
(i.e., main effect) of belonging to a particular race/ethnic group on arts participation. However, we also
extend on their work by including examining the effect of education within each race/ethnic group (i.e.,
interaction terms for race/ethnicity by education) into a full model for each domain. So, for each arts
domain, two models are presented. In reduced models, all of these variables are included to find out
their main effect. Four interaction terms between each racial/ethnic group and their education level are
added in full models. Table 5.1 and Table 5.2 report logistic regression results predicting specific arts
participation. Table 6.1 reports logistic regression results regarding specific arts creation. Due to space
limitation, only key variables regarding race and ethnicity are covered here, and full results are shown in
Appendix E and Appendix F for arts participation. Results for arts creation are shown in Appendix G.
We include the interaction terms because there are equivocal findings in the literature about the degree
to which differences in educational attainment fully account for the observed differences in arts
participation by race/ethnic group. DiMaggio and Ostrower (1990) show effects of race on arts
participation are dwarfed by those of educational attainment. They also find that blacks’ inclination
49
toward traditionally black arts remain even after education is taken into account. On the other hand,
Kalmijn and Kraaykamp (1996) claim blacks’ increase in arts forms such as attendance to classical music,
plays, and art museum is mainly caused by higher levels of schooling.
These findings suggest a possibility that the impact of education on arts participation differs by
racial/ethnic groups or arts domain. In other words, a possible explanation for the contradictory findings
is that education has different impact on, for instance, whites than on other race/ethnic groups or that
education has a different impact on, for example, jazz participation than it does on museum-going. We
attempt to tease apart the complex relationship between education and race/ethnicity by adding
interaction terms between each racial/ethnic group and their education level. For a full discussion of
the assumptions associated with the inclusion or exclusion of interaction terms in these models, see
Appendix H.
In light of our findings in our logistic regression models using education as a primary independent
variable and several other factors, including income, as covariates, which are discussed in detail below,
we also ran a second set of logistic regression models for each domain. This second set of models used
education as a covariate, rather than a primary independent variable, and used income as a primary
independent variable and also included income by race/ethnic group interaction terms.
Income and education have been shown to be correlated in a number of studies, which we also find in
our data. However, we find that the correlation between education and income is not sufficiently high
that issues of multi-collinearity arise. That is, in the SPPA data we find that there is a significant amount
of variance in income that is not accounted for by educational attainment to make separate analyses by
income meaningful. Love and Kipple (1994) as well as others have found that income is a significant
predictor of arts participation, with people with high incomes being more likely to participate in the arts
than those with low income.
In the discussion of each arts domain below, we express the predictive power of membership in a
race/ethnic group on participation in the particular domain in terms percent likelihood. This calculation
basically tells us how much more or less likely members of each race/ethnic group are than whites to
participate in the domain in question7.
Arts Participation
7 The percent likelihood is computed by exponentiating the coefficient of membership in the particular race/ethnic group and subtracting 1 from that value. That is, raising the value of e to the power of the observed coefficient and subtracting 1 from that value. For example, if the coefficient of group membership in a model was -.6915, then members of that group would be 50 percent less likely than whites to participate in the given activity [(e-.6915)-1] = -50%.

50
Jazz
Education
Table 5.1 shows that in all SPPA rounds education was, far and away, the strongest predictor of jazz
attendance after accounting for other socio-demographic factors. In pre-2002 rounds of the survey,
only membership in the black group predicted jazz participation with blacks being far more likely to
participate in jazz than whites. In later rounds (i.e., 2002 and 2008), the classical model (i.e., without
including interaction terms) shows both black and Asian membership predicted jazz participation. In
2008 blacks were 57.6 percent more likely than whites to attend a jazz performance and Asians were
75.5 percent less likely than whites, after accounting for other socio-demographic factors. See Appendix
E for the full model, including all covariates.
However, when the interaction terms are introduced, the effect of membership in a particular
race/ethnic group falls to non-significance. That is, after accounting for the effect of education within
each race/ethnic group, the overall effect of membership in a given group no longer significantly
predicts jazz participation. This finding is consistent with past research. However, we were surprised to
find that the interaction terms, too, did not reach significance. That is, the degree of education within
each race/ethnic group did not significantly predict jazz participation either. We initially expected that
this observation (i.e., lack of significance in the main effect and the interaction terms) might be due to a
lack of variation in education among jazz-goers within race. However, as Table H.1 shows, there was
only one instance where the variance in education among jazz-goers in any non-white race/ethnic group
differed significantly from white jazz-goers in 2008. See Appendix H for a full discussion of the degree to
which these data upheld the assumption of uniform variance that is associated with logistic regression
analyses.
Taken together, these findings do support pervious research that underscores the importance of
education as a predictor of jazz attendance, over and above the effect of belonging to any race/ethnic
group. However, this effect is not fully realized until the interaction terms between education and
race/ethnic membership are taken into account. That is, being a member of a particular race/ethnic
group, in and of itself, doesn’t seem to make one more or less likely to go to a jazz performance.
However, being highly educated is associated with higher jazz participation no matter one’s
race/ethnicity.
Income
After discovering that neither membership in any particular race/ethnic group, nor the interaction
between education and group membership significantly predicted attendance at a jazz performance, we
examined the relationship between income and attendance at jazz performances. The discussion of the
income model will be limited to the main effect of income on jazz attendance and the interaction
between income and race/ethnic membership, as the main effect of race/ethnic membership was
covered in the discussion of the education model above. In the reduced model, income was only a
significant predictor of jazz attendance in the 2002 and 2008 SPPAs. In the full model, in 2002, inclusion
of the interaction terms causes the main effect of income to fall to non-significance. The interaction
between blacks and income and Hispanics and income are significant in 2002. The significant interaction
51
should be interpreted, generally as additional income having a larger influence on black and Hispanic
jazz attendance than on white jazz attendance. The magnitude of the effect can be calculated by
converting the coefficient to an odds ratio. The interaction between blacks and income in 2002 shows
that for every $1,000 in additional household income, blacks were 1 percent more likely and Hispanics
were 1.5 percent more likely than whites to attend a jazz performance after all other socio-demographic
variables are controlled for. In 2008, none of the interaction terms were statistically significant.
Summary
In sum, among jazz-goers, education seems to be the force that is driving attendance. In 2008, in the full
models education was the only significant predictor of attendance at a jazz performance after
accounting for other socio-demographic factors and the interaction between race/ethnic group and
education and race/ethnic group and income.
Classical Music performance
Education
While the reduced model leads makes it appear that blacks, and to a lesser degree, Hispanics and Asians
attend classical performances less than whites, the full model (including the interaction terms), shows
that once within group variation in education is accounted for, membership in any race/ethnic group is
not a significant predictor of classical music attendance in any round since 1992. Again, education is an
extremely robust predictor of attendance of classical music performances.
Income
In both the reduced and full models, income is only a significant predictor of attendance at a classical
music performance in 2008. Moreover, in each SPPA round since 1992 being black is associated with a
lower probability of attending a classical music performance than being white in both the reduced and
the full model. In 2008 the full model shows that blacks are 57 percent less likely than whites to attend
a classical music performance even after accounting for all socio-demographic factors and the
interaction between income and being black.
Summary
In sum, membership in any particular race/ethnic group is not a robust predictor of attendance at a
classical music performance. Though, there is tentative evidence that being black may be related to
lower attendance at classical performances than being white. Education is a robust predictor of
attendance at classical performances over time. In earlier SPPA rounds, household income did not
predict attendance at a classical music performance, but it did in 2008. This may suggest that the
influence of income on classical music attendance is increasing, but such conclusions should be entered
into cautiously as such a trend over time has not yet been observed.

52
Opera
Education
Since 1985, membership in a race/ethnic group has only predicted opera attendance in one SPPA round
in the classical model. According to the classical model, in 2002, Asians were 54 percent less likely than
whites to attend an opera performance and blacks were 51 percent less likely to attend an opera
performance. In no other year did the classical model find that race/ethnic membership was a
significant predictor of opera attendance. Consistent with other arts domains, education was a robust
predictor of opera attendance in all years. When the interaction between education and group
membership was taken into account, membership in any race/ethnic group failed to significantly predict
opera attendance. The interaction terms are non-significant, in all cases except for Hispanics.
Income
In 2008, both the reduced and full models show that membership in any race/ethnic group was not a
significant predictor opera attendance. In 1992 and 2008 income was a significant predictor of opera
attendance in both the full and reduced models with higher income respondents being more likely to
attend an opera performance than low income respondents. The interaction between income and
race/ethnic membership was not significant in any SPPA round.
Summary
Overall, race/ethnic membership is not a robust predictor of opera attendance. There is some tentative
evidence that being Hispanic might be associated with lower opera attendance than being white, but
this finding was not seen in both models. The significant interaction between education and Hispanic
membership in 2008 suggests that highly educated Hispanics were less likely than highly educated
whites to attend an opera performance. Income was a significant predictor of opera attendance in 2008,
with higher earners being more likely than lower earners to attend an opera performance.
Musical Play
Education
In the classical models, education is, again, a robust predictor of attendance at a musical play in all SPPA
rounds. After accounting for the interaction between education and race/ethnic membership, in 2008,
being Asian or Hispanic were not predictive of attendance at musical plays, but being black was a robust
predictor, with blacks being 69.5 percent less likely to attend a musical play than whites. The interaction
terms are not statistically significant.
Income
Household income was a robust predictor of attendance at a musical play in all SPPA rounds since 1992.
In the full models, the inclusion of the income by race/ethnic interaction terms causes the main effect of
race/ethnic interaction to fall to non-significance in 1992 and 2002. However, in 2008 even with the
interaction terms included in the model being black predicted lower attendance at musical plays than

53
being white. Also, the interaction between black and income was significant indicating that higher
income blacks were more likely than higher income whites to attend a musical play in 2008.
Summary
Overall, Asians and Hispanics attend musical plays at about the same rate as whites, after other socio-
demographic factors have been accounted for. However, being black was related to lower attendance
at musical plays. This finding was present in both the education and the income models. However, the
income model shows that being higher income has a differential effect on attendance for blacks versus
whites, with higher income blacks being more likely than higher income whites to attend musical plays.
Again, education is far and away the most robust predictor of musical play attendance with more
educated people, regardless of race/ethnicity more likely to attend musicals. Income has grown to be a
fairly strong predictor of musical attendance over the course of the SPPA rounds.
Non-musical Play
Education
Like with other arts domains, education level is a robust predictor of attendance at a musical play even
after accounting for membership in a particular race/ethnic group in all SPPA rounds. In the early
rounds of the SPPA (i.e., 1982 and 1985), the classic model shows that membership in a particular
race/ethnicity is not predictive of play attendance. However, beginning in 1992, the classic model shows
that membership in certain race/ethnic groups is predictive of attendance at non-musical plays.
According to the classical model, in 2002 being black or Asian was associated with being less likely to
attend a non-musical play than being white (35% and 42% less likely, respectively). In 2008, the classical
model shows that only being Asian is predictive of lower attendance at non-musical plays than whites.
However, when the interaction between education and racial/ethnic membership are taken into
account, the predictive power of race/ethnic membership falls to non-significance in all rounds. The
interaction terms are also non-significant.
Income
Household income was a robust predictor of attendance at a non-musical play in all SPPA rounds since
1992. In the full models, the inclusion of the income by race/ethnic interaction terms causes the main
effect of race/ethnic interaction to fall to non-significance in all rounds from 1992 to 2008. There are no
significant interactions between race/ethnic membership and income in 2002 or 2008.
Summary
Membership in any particular race/ethnic group is not a significant predictor of attendance at a non-
musical play. However, education level and household income do predict non-musical play attendance
with those who are higher in education and higher in household income more likely to attend than
those who are lower in education and household income.
54
Ballet
Education
As with other domains, the classical model shows that education is a robust predictor of ballet
attendance across all SPPA rounds even after the effect of belonging to a particular race/ethnic group is
accounted for. Also like other domains, the classical model shows that race/ethnicity has its highest
predictive power in 2002 with blacks and Asians both less likely than whites to attend a ballet
performance. In 2008, too, the classical model shows that blacks were 47 percent less likely than whites
to attend a ballet performance and Asians were 65 percent less likely than whites to attend a ballet
performance. However, when the full model is applied, we see the predictive power of race/ethnic
membership fall to non-significance. The interaction terms are also non-significant.
Income
In 2002 and 2008, both the reduced and full models show that membership in any race/ethnic group
was not a significant predictor ballet attendance. In 2008 income was a significant predictor of ballet
attendance in both the full and reduced models with higher income respondents being more likely to
attend an opera performance than low income respondents. The interaction between income and
race/ethnic membership was not significant in any SPPA round.
Summary
Race/ethnicity is not a strong predictor of attendance at a ballet performance when other socio-
demographic factors are accounted for. Education is a robust predictor of ballet attendance with more
educated people being more likely to attend a ballet performance than less educated people. In the
most recent SPPA, income was a significant predictor of ballet attendance. It is not clear if the income
ballet attendance link is stable, as it has only been evidenced in a single SPPA round.
Museum/Gallery
Education
As with other domains, the classical model shows that education is a robust predictor of attending a
museum or gallery across all SPPA rounds even after the effect of belonging to a particular race/ethnic
group is accounted for. The classical model shows that being black predicted lower attendance at
museums or galleries than whites in both 2002 and 2008 (41 percent and 44 percent less likely,
respectively). As with other arts domains, inclusion of the interaction terms causes the main effect of
race/ethnic membership to fall to non-significance. The interaction terms are also non-significant.
Income
In full model, being black is associated with a lower likelihood of attending a museum or gallery than
whites in both 2002 and 2008. In 2002, the full model shows that blacks were 46 percent less likely than
whites to attend a museum or gallery and in 2008 blacks were 57 percent less likely than whites after
accounting for all other socio-demographic factors. Income was a significant predictor of visiting a
museum or gallery in every SPPA since 1992. The only interactions that were found to be significant
55
were between Asian and income in 1992 and 2002. In both of these rounds, higher income Asians were
less likely than higher income whites to attend a museum or gallery.
Summary
Being Asian or Hispanic is not a robust predictor of attendance at museums or galleries. However, there
is tentative evidence that being black may be associated with lower museum and gallery attendance
than being white. Education level is a robust predictor of museum attendance in all SPPA rounds.
Household income is a significant predictor of museum attendance in recent SPPA rounds. There is
some evidence that during the 1990s higher income Asians were less likely than their higher income
white counterparts to visit museums and galleries, but that effect was not observed in the most recent
SPPA.
Crafts fair
Education
Like in all other arts domains that have been examined level of formal education was a significant and
robust predictor of attendance at craft fairs. In the classical models in every SPPA round since 1992
membership in each race/ethnic group has predicted visiting craft fair or visual arts fairs. In each round
the classical model shows that membership every non-white race/ethnic group predicted lower
attendance at craft fairs than their white counterparts. In later SPPA rounds (i.e., 2002 and 2008), the
inclusion of the interaction terms in the models eliminated the significant predictive power of
membership in Asian or Hispanic race/ethnic groups. However, being black was still associated with a
61 percent lower likelihood of attending a craft fair in 2002 and a 73 percent lower likelihood of visiting
a craft fair in 2008. The only interaction term that was significant was the interaction between Hispanic
and education, such that highly educated Hispanics were 17 percent less likely than highly educated
whites to attend a craft fair.
Income
The full model shows that blacks were less likely than whites to attend a craft fair or visual arts festival
in every SPPA round. The pattern is less clear with other race/ethnic groups. In 2008 blacks were 49
percent less likely and Asians were 67 percent less likely than whites to attend a craft fair. Household
income was a robust predictor of visiting a craft or visual arts fair in all SPPA rounds with higher income
respondents being more likely than lower income respondents to attend arts fairs.
Summary
Being black is reliably associated with a lower likelihood of attending a craft or visual arts fair than
whites. There is also evidence that being Asian is associated with a lower likelihood of craft fair
attendance than whites, though the finding is less consistent than with blacks. Education and income
are both robust predictors of craft fair attendance in all rounds. There was not a significant interaction
effect between education and race/ethnicity or income and race/ethnicity in the most recent SPPA
round.
56
Historic Park or Site
Education
Like in all other arts domains that have been examined level of formal education was a significant and
robust predictor of attendance at a historic park or site. In both the classic and full models all non-white
groups were less likely than their white counterparts to visit historic parks or sites after accounting for
other socio-demographic factors. In both 1992 and 2002 Asians and blacks were less likely than whites
to attend historic parks or sites in the full model. In 2008, being black was associated with 85 percent
lower likelihood of visiting a historic park or site. However, the interaction between black and education
was significant in 2008. That is, being highly educated and black was associated with a 32 percent
higher likelihood than being highly educated and white.
Income
The full model shows that blacks have a lower likelihood of visiting an historic park or site than whites in
every SPPA round. In 2008, blacks were 46 percent less likely than their white counterparts to visit an
historic park or site. Additionally, in 2002 and 2008, being Hispanics were less likely than their white
counterparts to visit an historic park or site. In 2008, Hispanics were 37 percent less likely than their
white counterparts to visit an historic park or site. Income was a robust predictor of historic park
visitation in all SPPA rounds, with higher income respondents being more likely than lower income
respondents to visit after other socio-demographic factors were accounted for. There was not a
significant interaction between income and race/ethnic membership in any SPPA round.
Summary
Being black is a robust predictor of a lower likelihood to attend an historic park or site than whites
across multiple rounds of the SPPA, even after accounting for other socio-demographic variables (e.g.,
age, sex, parental education, etc.). There is also evidence that being Hispanic predicts a lower likelihood
than whites of visiting historic parks and sites, although the finding is not present in both models (i.e.,
education and income) in all rounds. There is scant evidence that being Asian may also be associated
with a lower likelihood of visiting an historic park than whites, but that effect was only seen in the one
of the full models in a single SPPA round. Education and household income are robust predictors of
historic park or site visitation in all SPPA rounds with more educated and higher income respondents
being more likely to visit than their less educated and lower income counterparts. There is some
evidence that blacks with higher education levels may be more likely to visit historic parks and sites than
whites with higher education levels, but this finding was only observed in a single SPPA round.

57
Table 5.1 Effects of race/ethnicity, educational attainment, and their interactions on specific arts participation
1982 1985 1992 2002 2008 Dependent Variable: Go to a live jazz performance
Black 1.323** 0.954 0.904** -0.235 1.086** 1.865** 0.603** 1.133** 0.455** 0.317 Asian
-0.366 0.431 -0.740 0.957 -0.701** -0.122 -1.408** -0.184
Hispanic -0.063 -2.941 -1.029 1.220 0.144 0.247 0.151 -0.575 -0.304 0.300 Education 0.408** 0.382** 0.512** 0.492** 0.458** 0.498** 0.435** 0.435** 0.417** 0.429**
Black*Education
0.097
0.305
-0.197
-0.131
0.036 Asian*Education
-0.164
-0.374
-0.122
-0.251
Hispanic*Education
0.769
-0.674
-0.022
0.182
-0.155 Dependent Variable: Go to a live classical music performance
Black -0.293 0.352 -0.497 0.560 -0.587* -0.969 -0.871** -1.208 -0.497** -0.753 Asian
-0.505 0.716 0.382 0.743 -0.624** -1.129 -0.382 0.755
Hispanic 0.219 -1.275 -0.930 2.295* -0.390 -0.055 -0.079 0.014 -0.482* -0.065 Education 0.603** 0.610** 0.468** 0.497** 0.479** 0.481** 0.628** 0.625** 0.576** 0.589**
Black*Education
-0.164
-0.289
0.087
0.075
0.060 Asian*Education
-0.272
-0.080
0.101
-0.232
Hispanic*Education
0.409
-1.161**
-0.081
-0.024
-0.100 Dependent Variable: Go to a live opera
Black -0.678 -2.373* 0.022 -0.878 0.201 0.995 -0.707* -0.951 -0.533 0.832 Asian
0.539 -0.548 0.760 1.395 -0.777* -2.368 -0.775 2.785
Hispanic 0.321 -6.027* 0.251 2.572 0.423 1.148 0.133 -0.377 0.141 1.931* Education 0.492** 0.459** 0.391** 0.383** 0.397** 0.437** 0.609** 0.585** 0.670** 0.751**
Black*Education
0.391
0.237
-0.181
0.051
-0.298 Asian*Education
0.225
-0.136
0.305
-0.723
Hispanic*Education 1.481* -0.915** -0.167 0.116 -0.412* * p<0.05, ** p<0.01
Controlled for: age, gender, family income, parents’ education, employment status, US citizenship status, size of respondent’s residential community

58
Table 5.1 Effects of race/ethnicity, educational attainment, and their interactions on specific arts participation (continued)
1982 1985 1992 2002 2008 Dependent Variable: Go to a live musical stage play
Black -0.122 -0.506 -0.105 -0.042 0.172 -0.097 -0.426** -0.368 -0.417** -1.186* Asian
-0.573 -0.728 -0.588 -4.006* -0.722** -0.094 -0.308 0.521
Hispanic -0.419 -2.829 -0.933 -0.327 -0.414 -0.696 -0.328* -0.401 -0.188 -0.383 Education 0.480** 0.466** 0.348** 0.351** 0.365** 0.344** 0.457** 0.460** 0.484** 0.473**
Black*Education
0.099
-0.018
0.067
-0.014
0.184 Asian*Education
0.034
0.703*
-0.131
-0.174
Hispanic*Education
0.655
-0.197
0.070
0.019
0.048 Dependent Variable: Go to a live performance of a nonmusical stage play
Black -0.427 -1.519 -0.410 -0.334 0.415* -0.021 -0.431** -0.337 -0.283 -0.136 Asian
-0.476 -0.304 -0.486 -1.946 -0.546** 0.735 -0.639* 1.361
Hispanic -0.479 -2.711 -1.012 1.840 0.097 -0.696 0.038 -0.787 -0.154 -0.053 Education 0.564** 0.546** 0.466** 0.477** 0.534** 0.503** 0.496** 0.489** 0.527** 0.544**
Black*Education
0.258
-0.019
0.104
-0.023
-0.033 Asian*Education
-0.038
0.302
-0.267
-0.418
Hispanic*Education
0.570
-1.047**
0.189
0.203
-0.023 Dependent Variable: Go to a live ballet performance
Black -0.270 -2.296 -0.627 -2.682* -0.044 -3.670** -0.846** -0.491 -0.644* -1.348 Asian
0.008 -1.961 0.567 -0.061 -1.138** 0.213 -1.051* -1.157
Hispanic 0.388 -0.979 0.502 -0.478 0.111 -1.084 -0.359 -0.377 0.075 -0.266 Education 0.551** 0.518** 0.557** 0.522** 0.390** 0.310** 0.544** 0.552** 0.504** 0.488**
Black*Education
0.460
0.495
0.769**
-0.080
0.156 Asian*Education
0.402
0.137
-0.273
0.021
Hispanic*Education 0.356 0.256 0.271 0.006 0.079 * p<0.05, ** p<0.01
Controlled for: age, gender, family income, parents’ education, employment status, US citizenship status, size of respondent’s residential community

59
Table 5.1 Effects of race/ethnicity, educational attainment, and their interactions on specific arts participation (continued)
1982 1985 1992 2002 2008 Dependent Variable: Visit an art museum or gallery
Black -0.179 -0.346 -0.802* 0.288 -0.103 -0.790 -0.527** -0.400 -0.575** -0.643 Asian
-0.052 -1.706 0.279 0.361 -0.065 -0.408 -0.294 0.780
Hispanic 0.365 -0.766 -0.718 1.166 -0.132 0.452 0.105 0.413 0.093 0.718 Education 0.597** 0.589** 0.548** 0.570** 0.559** 0.558** 0.533** 0.542** 0.542** 0.571**
Black*Education
0.043
-0.300
0.174
-0.030
0.018 Asian*Education
0.363
-0.019
0.075
-0.230
Hispanic*Education
0.336
-0.578
-0.154
-0.085
-0.164 Dependent Variable: Visit a crafts fair or a visual arts festival
Black -0.998** -2.373** -1.282** -1.405* -0.694** -1.121** -0.667** -0.930** -0.824** -1.294* Asian
0.111 -0.161 -1.071** -2.239* -0.690** -0.666 -0.969** -0.470
Hispanic -0.946* -2.151 0.078 -0.154 -0.496** -0.974** -0.220* -0.234 -0.384** 0.286 Education 0.473** 0.440** 0.447** 0.442** 0.340** 0.311** 0.309** 0.304** 0.321** 0.337**
Black*Education
0.387
0.035
0.114
0.067
0.121 Asian*Education
0.087
0.266
-0.005
-0.105
Hispanic*Education
0.370
0.076
0.139
0.003
-0.187* Dependent Variable: Visit an historic park
Black -0.271 -0.695 -0.949** -0.455 -0.783** -1.123* -0.610** -1.057** -0.727** -1.877** Asian
-0.462 -0.466 -1.033** -1.918* -0.537** -1.084* -0.467* -0.022
Hispanic 0.242 0.740 -0.052 -0.062 -0.660** 0.097 -0.286** -0.329 -0.248* -0.302 Education 0.564** 0.555** 0.456** 0.467** 0.398** 0.406** 0.432** 0.419** 0.427** 0.411**
Black*Education
0.127
-0.145
0.087
0.111
0.281* Asian*Education
0.002
0.192
0.119
-0.093
Hispanic*Education -0.163 0.005 -0.213* 0.010 0.012
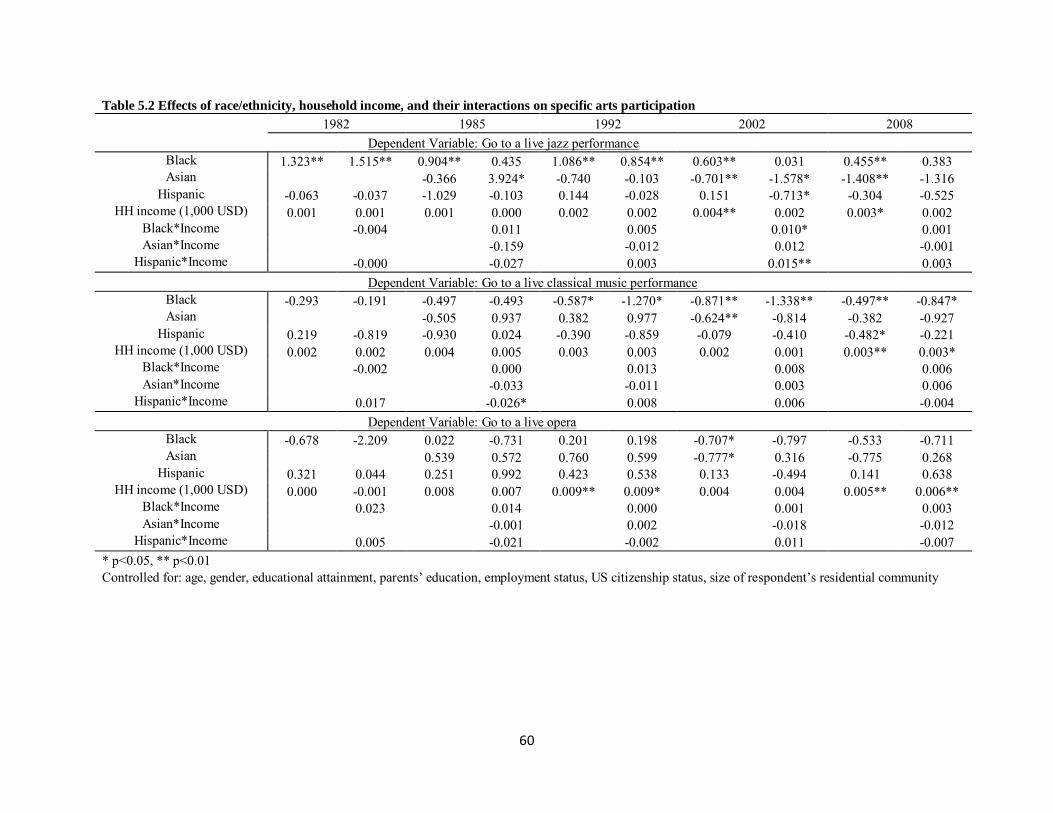
60
Table 5.2 Effects of race/ethnicity, household income, and their interactions on specific arts participation
1982 1985 1992 2002 2008
Dependent Variable: Go to a live jazz performance Black 1.323** 1.515** 0.904** 0.435 1.086** 0.854** 0.603** 0.031 0.455** 0.383 Asian
-0.366 3.924* -0.740 -0.103 -0.701** -1.578* -1.408** -1.316
Hispanic -0.063 -0.037 -1.029 -0.103 0.144 -0.028 0.151 -0.713* -0.304 -0.525 HH income (1,000 USD) 0.001 0.001 0.001 0.000 0.002 0.002 0.004** 0.002 0.003* 0.002
Black*Income
-0.004
0.011
0.005
0.010*
0.001 Asian*Income
-0.159
-0.012
0.012
-0.001
Hispanic*Income
-0.000
-0.027
0.003
0.015**
0.003 Dependent Variable: Go to a live classical music performance
Black -0.293 -0.191 -0.497 -0.493 -0.587* -1.270* -0.871** -1.338** -0.497** -0.847* Asian
-0.505 0.937 0.382 0.977 -0.624** -0.814 -0.382 -0.927
Hispanic 0.219 -0.819 -0.930 0.024 -0.390 -0.859 -0.079 -0.410 -0.482* -0.221 HH income (1,000 USD) 0.002 0.002 0.004 0.005 0.003 0.003 0.002 0.001 0.003** 0.003*
Black*Income
-0.002
0.000
0.013
0.008
0.006 Asian*Income
-0.033
-0.011
0.003
0.006
Hispanic*Income
0.017
-0.026*
0.008
0.006
-0.004 Dependent Variable: Go to a live opera
Black -0.678 -2.209 0.022 -0.731 0.201 0.198 -0.707* -0.797 -0.533 -0.711 Asian
0.539 0.572 0.760 0.599 -0.777* 0.316 -0.775 0.268
Hispanic 0.321 0.044 0.251 0.992 0.423 0.538 0.133 -0.494 0.141 0.638 HH income (1,000 USD) 0.000 -0.001 0.008 0.007 0.009** 0.009* 0.004 0.004 0.005** 0.006**
Black*Income
0.023
0.014
0.000
0.001
0.003 Asian*Income
-0.001
0.002
-0.018
-0.012
Hispanic*Income
0.005
-0.021 -0.002 0.011 -0.007 * p<0.05, ** p<0.01
Controlled for: age, gender, educational attainment, parents’ education, employment status, US citizenship status, size of respondent’s residential community

61
Table 5.2 Effects of race/ethnicity, household income, and their interactions on specific arts participation (continued)
1982 1985 1992 2002 2008 Dependent Variable: Go to a live musical stage play
Black -0.122 -0.866* -0.105 -0.438 0.172 0.077 -0.426** -0.482 -0.417** -0.838** Asian
-0.573 -0.262 -0.588 0.029 -0.722** -0.349 -0.308 -0.010
Hispanic -0.419 -0.645 -0.933 -3.524 -0.414 -1.090* -0.328* -0.232 -0.188 -0.360 HH income (1,000 USD) 0.009** 0.008** 0.005 0.004 0.012** 0.012** 0.010** 0.010** 0.008** 0.007**
Black*Income
0.013*
0.007
0.002
0.001
0.007* Asian*Income
-0.007
-0.010
-0.005
-0.003
Hispanic*Income
0.004
0.058
0.011
-0.002
0.003 Dependent Variable: Go to a live performance of a nonmusical stage play
Black -0.427 -1.088 -0.410 -1.689* 0.415* 0.337 -0.431** -0.045 -0.283 -0.218 Asian
-0.476 -0.474 -0.486 0.707 -0.546** -0.086 -0.639* -0.802
Hispanic -0.479 -0.486 -1.012 -0.336 0.097 0.021 0.038 -0.042 -0.154 -0.374 HH income (1,000 USD) 0.007** 0.006** -0.000 -0.002 0.005** 0.005** 0.009** 0.010** 0.005** 0.005**
Black*Income
0.011
0.026*
0.002
-0.007
-0.001 Asian*Income
-0.000
-0.024**
-0.006
0.002
Hispanic*Income
-0.000
-0.020
0.001
0.002
0.003 Dependent Variable: Go to a live ballet performance
Black -0.270 -0.415 -0.627 -1.425 -0.044 -0.561 -0.846** -0.920 -0.644* -0.851 Asian
0.008 2.896** 0.567 1.847* -1.138** -0.960 -1.051* -0.288
Hispanic 0.388 -2.804* 0.502 -1.355 0.111 -0.396 -0.359 -0.193 0.075 -0.840 HH income (1,000 USD) 0.004 0.004 0.004 0.003 0.004 0.004 0.004 0.004 0.006** 0.005**
Black*Income
0.002
0.016
0.010
0.001
0.003 Asian*Income
-0.098*
-0.028
-0.002
-0.009
Hispanic*Income
0.042**
0.046* 0.008 -0.003 0.012 * p<0.05, ** p<0.01
Controlled for: age, gender, educational attainment, parents’ education, employment status, US citizenship status, size of respondent’s residential community

62
Table 5.2 Effects of race/ethnicity, household income, and their interactions on specific arts participation (continued)
1982 1985 1992 2002 2008 Dependent Variable: Visit an art museum or gallery
Black -0.179 -0.231 -0.802* -1.246* -0.103 -0.288 -0.527** -0.617** -0.575** -0.847** Asian
-0.052 -0.200 0.279 1.115* -0.065 0.529 -0.294 0.042
Hispanic 0.365 -0.178 -0.718 -3.355* -0.132 -0.368 0.105 0.352 0.093 0.192 HH income (1,000 USD) 0.004** 0.003** 0.003 0.002 0.006** 0.006** 0.008** 0.009** 0.006** 0.006**
Black*Income
0.001
0.009
0.004
0.002
0.005 Asian*Income
0.003
-0.017*
-0.009*
-0.004
Hispanic*Income
0.010
0.062
0.005
-0.005
-0.002 Dependent Variable: Visit a crafts fair or a visual arts festival
Black -0.998** -1.303** -1.282** -1.105** -0.694** -1.312** -0.667** -0.622** -0.824** -0.677** Asian
0.111 0.793 -1.071** -0.368 -0.690** 0.006 -0.969** -1.097**
Hispanic -0.946* -2.431** 0.078 -0.533 -0.496** -0.449 -0.220* -0.250 -0.384** -0.374 HH income (1,000 USD) 0.004** 0.004* 0.010** 0.011** 0.005** 0.005** 0.006** 0.006** 0.004** 0.004**
Black*Income
0.006
-0.005
0.014**
-0.001
-0.003 Asian*Income
-0.017
-0.014
-0.011*
0.001
Hispanic*Income
0.034*
0.013
-0.001
0.001
-0.000 Dependent Variable: Visit an historic park
Black -0.271 -0.528 -0.949** -1.590** -0.783** -1.169** -0.610** -0.622** -0.727** -0.624** Asian
-0.462 -0.518 -1.033** -0.431 -0.537** -0.284 -0.467* -0.265
Hispanic 0.242 0.045 -0.052 -0.595 -0.660** -0.399 -0.286** -0.423* -0.248* -0.459* HH income (1,000 USD) 0.004** 0.004* 0.011** 0.010** 0.009** 0.009** 0.011** 0.011** 0.006** 0.006**
Black*Income
0.005
0.016
0.008
0.000
-0.002 Asian*Income
0.001
-0.011
-0.004
-0.003
Hispanic*Income 0.005 0.011 -0.005 0.003 0.004 * p<0.05, ** p<0.01
Controlled for: age, gender, educational attainment, parents’ education, employment status, US citizenship status, size of respondent’s residential community

63
Arts creation Participation in the arts by creating works of art is a different undertaking than participation via
attendance at arts events. The number of arts creators is smaller, in most cases than the number of
those who participate via attendance. This creates some different methodological issues when
analyzing arts creators than were present when examining the core arts audiences. One of the first
issues that arises is the small number of participators makes within group variation in some of the
critical independent variables rather unstable. In fact, there are several cases where an accurate
variance could not be estimated. As such, we were unable to arrive at stable models for arts creation
that included the interaction term between race/ethnic identification and education and race/ethnic
identification and income. Therefore, we will only present and discuss the reduced model of the
predictors of arts creation. We will not present or discuss the full model that was presented in the arts
participation section (i.e., the models that include interaction terms) due to the instability of the full
model. For a full discussion of the assumptions associated with the inclusion or exclusion of interaction
terms in these models, see Appendix H.
Pottery/Jewelry
Throughout all five rounds, education is a good predictor for working with pottery or jewelry. In 1982
and 1985, having one higher level of education increased one’s likelihood to work with pottery or
jewelry by 28 percent, controlling for other socio-demographic factors. Even in latter rounds, one level
increase in education predicted at least 10 percent growth in one’s probability to create pottery or
jewelry (16 percent in 2008). There was a positive and significant interaction between being black and
education. That is, even though, overall, blacks are less likely to create pottery or jewelry, highly
educated blacks are more likely to create pottery or jewelry than highly educated whites. Level of
household Income was not significant predictor of pottery or jewelry creation in most of the SPPA
rounds. However, in 2008 increased income was associated with a slight increase in the likelihood of
creating pottery or jewelry.
Overall, education was a robust predictor of creating pottery, jewelry, leatherwork, or metalwork in all
SPPA rounds. Compared to whites in 2008, blacks and Asians were less likely to work with pottery or
jewelry, after controlling for other socio-demographic factors. There was no significant difference
between whites and Hispanics. Increased income was associated with an increased likelihood of jewelry
and pottery making.
Weaving/Sewing
In 2008, all non-white race/ethnic groups were less likely than their white counterparts to weave or sew.
blacks were 57 percent less likely, Asians were 59 percent less likely, and Hispanics were 48 percent less
likely to weave or sew. In prior rounds, race/ethnic group was not as strongly predictive of weaving and
sewing. Education was positively associated with weaving or sewing in every SPPA round. Income has
not been significantly related to the likelihood to weave or sew in any SPPA round since 1982.
Overall, whites are far more likely to weave or sew than their non-white counterparts. This is true even
after accounting for other socio-demographic differences. Like with other arts participation and arts

64
creation domains, increased education is reliably associated with an increased likelihood of weaving or
sewing. Household income does not appear to be related to weaving or sewing.
Photo/Movie
In the two most recent SPPA rounds membership in a non-white race/ethnic group has predicted a
lower likelihood of creating artistic photos or movies. In 2008, being black or Asian was associated with
a reduced likelihood of artistic movie-making and photography (36 percent and 38 percent, respectively).
In 2002, being black or Hispanic was associated with a reduced likelihood of artistic photography.
Education is positively correlated with making photographs or movies as an artistic activity throughout
all rounds of SPPA. Since 1992, higher household incomes were associated with an increased likelihood
of artistic photography and movie-making. Prior to 1992, income was not a significant predictor of
artistic photography and movie-making.
Until 2002, there was no racial/ethnic discrepancy in terms of making photographs or movies as an
artistic activity. However, since 2002, blacks have been less likely than their white peers to make artistic
movies and photos. Asians were less likely to do so than whites in 2008 and Hispanics were less likely to
do so than whites in (or since?) 2002.
Paint/Sculpture
Blacks were significantly less likely than whites to paint, sculpt, or draw in every SPPA round since 1985,
31 percent less so in2008. Asians were less likely than whites to paint or sculpt in 2002 and Hispanics
were less likely than whites in 1992. Education was significant predictor of painting and sculpting in
every SPPA round. In the two most recent SPPA rounds, higher levels of household income have been
associated with a higher likelihood to paint or sculpt. This was not the case in SPPA rounds before 1992.
This finding suggests that cost may be becoming a barrier to painting and sculpting activity in a way that
it was not in previous decades.
Writing
Race/ethnic group membership has generally been a poor predictor of creative writing. Education,
however, is strongly and consistently associated with higher levels of creative writing. Since 1992,
higher household income has been predictive of higher levels of creative writing, where income was not
a significant predictor prior to that point.
Play jazz
Being Asian is associated with a dramatically reduced likelihood of performing or rehearsing jazz music.
In 2008, Asians were 90 percent less likely than their white counterparts to play jazz music. In 2002,
Asians were 76 percent less likely than whites to play jazz. Membership in other race/ethnic groups is
not predictive of jazz playing. Like with other forms of arts creation, education is a robust predictor of
jazz performing in all SPPA rounds. Income has not been related to jazz playing in any SPPA round.
Play classical
Overall, membership in a particular race/ethnic group is not a strong predictor of classical music play.
Hispanics were less likely than whites to play classical music in 2008 and blacks were less likely than
whites in 2002, but there are no other times since 1985 when race/ethnic membership was significantly

65
predictive of classical music playing. Education is a strong and consistent predictor of classical music
playing/performing. Household income is not predictive of classical music playing/performing.
Sing opera
Due to the very low number of opera singers in the U.S. it is difficult to tease out the predictive power of
race/ethnic membership. In 2008 being Hispanic was associated with a reduced likelihood of operatic
singing relative to whites, but the number of Asian opera singers was too small to even estimate the
association between being Asian and singing opera. In 1992 and 2002 being black was associated with a
lower likelihood of operatic singing than being white. In most SPPA rounds, high levels of education
were highly predictive of high levels of opera singing, but this relationship was not seen in 2008. It is
unclear if this is an artifact of the very small number of opera singers, generally, or if this is the start of a
trend. Income was not a significant predictor of opera singing in any SPPA round since 1992.
Sing musical
Membership in a particular race/ethnic group is not a strong predictor of singing in a musical stage play
after accounting for other socio-demographic variables. In 2008, race/ethnicity was not significantly
predictive of singing in a musical at all. In 2002, blacks and Asians were less likely than whites to sing in
a musical. In 1992, Hispanics were less likely than Asians to sing in a musical. In every SPPA round up to
2008, education is a strong predictor of singing in musical stage plays, but this relationship is not seen in
2008. Higher levels of household income were related to a higher likelihood of singing in a musical in
2008, but not in other SPPA rounds.

66
Table 5.3 Effects of race/ethnicity, educational attainment, and household income on specific arts
creation
1982 1985 1992 2002 2008 Dependent Variable: Work with pottery, ceramics, jewelry, or do any leatherwork or metalwork
Black -0.685** -1.196** -0.174 -0.668** -0.675** Asian
-1.320 -0.930 -0.320 -0.977*
Hispanic -0.206 -0.133 -0.554* -0.355* -0.390 Education 0.244** 0.247** 0.092* 0.139** 0.155**
HH income (1,000 USD) -0.001 0.000 0.001 0.001 0.003* Dependent Variable: Do any weaving, crocheting, quilting, needlepoint,
or sewing Black -0.776** -1.191** -0.878** -0.772** -0.845** Asian
-0.118 -0.354 -0.362* -0.881**
Hispanic -1.018** -0.777* -0.112 -0.140 -0.663** Education 0.166** 0.134** 0.070* 0.174** 0.215**
HH income (1,000 USD) 0.003* 0.001 0.001 -0.001 -0.001 Dependent Variable: Make photographs, movies, or videotapes as an
artistic activity
Black -0.165 -0.266 0.047 -0.422** -0.444** Asian
-0.275 -0.458 -0.311 -0.473*
Hispanic -0.205 -0.909 -0.119 -0.330* -0.141 Education 0.474** 0.388** 0.297** 0.345** 0.329**
HH income (1,000 USD) 0.002 -0.001 0.005** 0.005** 0.003** Dependent Variable: Do any painting, drawing, sculpture, or
printmaking activities
Black -0.269 -0.760* -0.902** -0.647** -0.374* Asian
-0.663 -0.192 -0.532** -0.118
Hispanic 0.331 0.663 -0.500* -0.169 -0.123 Education 0.350** 0.351** 0.237** 0.294** 0.279**
HH income (1,000 USD) -0.002 -0.001 -0.001 -0.002 -0.002 Dependent Variable: Do any creative writing such as stories, poems, or
plays
Black -0.264 -0.476 -0.323 -0.003 0.034 Asian
-1.036 0.157 -0.584* -0.062
Hispanic 0.226 -0.218 -0.213 -0.334 -0.062 Education 0.560** 0.539** 0.557** 0.484** 0.475**
HH income (1,000 USD) -0.004 -0.001 -0.007** -0.006** -0.004** Dependent Variable: Perform or rehearse any jazz music
Black -0.480 -0.759 0.110 -0.018 0.192 Asian
0.451 -1.419** -2.335*
Hispanic -0.073 0.663 -0.710 -0.607 -0.346 Education 0.252** 0.465** 0.456** 0.645** 0.344**
HH income (1,000 USD) 0.001 -0.002 -0.010 -0.002 0.001 * p<0.05, ** p<0.01
Controlled for: age, gender, employment status, US citizenship status, size of respondent’s residential community

67
Table 5.3 Effects of race/ethnicity, educational attainment, and their interactions on specific arts
creation (continued)
1982 1985 1992 2002 2008 Dependent Variable: Perform or rehearse any classical music
Black -0.987* -0.667 -0.430 -1.533** -0.415 Asian
0.922 0.145 -0.141 0.053
Hispanic 0.113 0.308 -0.389 -0.545 -0.840* Education 0.617** 0.719** 0.507** 0.724** 0.424**
HH income (1,000 USD) -0.003 -0.003 0.000 -0.004 0.003 Dependent Variable: Sing any music in an opera
Black -0.374 1.109 -1.348* -1.720* 0.992 Asian
0.608 -0.014
Hispanic
-1.670 0.133 -1.947 Education 0.722* -0.061 0.614** 0.538** 0.061
HH income (1,000 USD) -0.029* -0.019 -0.009* 0.005 0.007 Dependent Variable: Sing or act in a musical play
Black 0.028 -0.248 -0.637 -0.682* -0.029 Asian
0.435 0.079 -1.290** -0.108
Hispanic
-0.383 -1.305* -0.574 -0.409 Education 0.390** 0.326** 0.399** 0.493** 0.196
HH income (1,000 USD) -0.001 0.002 0.005 0.001 0.005* * p<0.05, ** p<0.01
Controlled for: age, gender, employment status, US citizenship status, size of respondent’s residential community
Summary As a whole, race/ethnicity, alone, tends not to be a very good predictor of participation in the core arts
domains. That is, after accounting for other socio-demographic factors there are more cases where
membership in any particular race/ethnic group does not account for a significant amount of the
variance in arts attendance than cases where it does. However, there are some very notable exceptions,
particularly in visiting historic sites and parks, attending craft fairs, and attending musical plays where
being black strongly predicts lower attendance than whites.
While the predictive power of race/ethnic membership in participation in the core arts domains is spotty,
at best, the predictive power of education is robust and nearly uniform. Even after accounting for other
socio-demographic factors, higher levels of education are associated with higher participation in the
core arts domains across all SPPA rounds. There is sparse evidence that education has a differential
influence on arts attendance for different race/ethnic groups, as significant interaction terms between
race/ethnicity and education were relatively rare.
Income was generally predictive of participation in the core arts domains, with higher income
respondents being more likely to participate in the core domains than their lower income counterparts.
Like with education, there were very few instances of significant interactions. One very interesting

68
finding is that with the exception of attendance at a jazz performance, income was a significant
predictor or arts participation in every domain in 2008. As one looks at past SPPA rounds, the predictive
power of income, after accounting for other socio-demographic variables, diminishes. That is, there are
fewer domains where income was a significant predictor in 2002 than in 2008 and fewer in 1992 than in
2002. This suggests that the role of income in arts participation may be increasing.
In arts creation, race/ethnic membership had much more predictive power than in arts participation. In
nearly all domains, with the exceptions of singing in a musical play or singing opera, members of at least
one non-white race/ethnic group (i.e., black, Asian, or Hispanic) were significantly different from whites
in their likelihood of that type of arts creation.
Within arts creation education was, again, a very robust predictor across domains of arts creation.
Income was less strongly related to arts creation than education, but there is evidence in arts creation,
like in arts participation, that the predictive power of household income has been increasing through
time.

69
Chapter 6: Arts Learning by race/ethnicity In this chapter we will examine the relationship between race/ethnicity and arts learning at any time in
life. Arts learning experiences have been linked to higher levels of arts participation later in life. Gray
(1998) found that taking arts lessons and art history and appreciation classes result in arts participation
later in life, controlling for other socio-demographic indicators including educational attainment (i.e.
level of formal education). In addition, such arts learning could be considered as a variant of arts
participation as well. Table 6.1 presents arts learning rates for seven domains by racial/ethnic groups in
2008. As such, examining the relationship between race/ethnicity and arts learning may help to shed
light on the differentially declining arts audience that was reported earlier in the current monograph.
In this chapter, we will describe the differences in arts learning experiences by race/ethnicity over the
past three rounds of the SPPA, 1992, 2002, and 2008. Seven domains of arts learning were assessed in
these rounds of the SPPA. The domains of arts learning were:
Acting
Art appreciation/Art history
Creative writing
Dance
Music appreciation
Musical performance
Visual Arts

70
Table 6.1. Arts learning rate (%) by racial and ethnic group, 1992-2008
1992 2002 2008 Mean S.E Mean S.E Mean S.E
Have you ever taken lessons or classes in… Music White 43.53 0.78 38.71 0.50 40.14 0.85
Black 29.12 1.96 23.81 1.24 21.19 1.78 Asian 25.13 3.60 27.24 1.90 24.91 2.15 Hispanic 19.95 1.92 15.32 1.02 16.99 1.63
Visual art White 19.07 0.62 18.87 0.41 20.10 0.69 Black 10.48 1.33 8.97 0.83 10.16 1.32 Asian 17.79 2.73 17.68 1.70 13.90 1.82 Hispanic 13.85 1.70 8.62 0.80 7.28 1.07
Acting White 7.82 0.43 7.68 0.28 7.12 0.44 Black 5.72 1.01 7.29 0.78 2.57 0.74 Asian 5.84 1.72 3.91 0.87 5.13 0.42 Hispanic 6.01 1.22 3.11 0.50 1.91 0.60
Dance White 20.23 0.63 15.46 0.37 14.61 0.61 Black 10.22 1.35 7.68 0.79 5.99 1.02 Asian 10.52 2.42 11.75 1.36 8.65 1.30 Hispanic 10.45 1.40 7.41 0.74 4.99 0.92
Creative writing White 16.66 0.59 15.04 0.37 13.34 0.59 Black 12.71 1.49 11.31 0.95 6.97 1.10 Asian 12.36 3.03 8.37 1.14 9.52 1.84 Hispanic 10.66 1.51 5.24 0.61 4.24 0.91
Art appreciation or art history White 23.40 0.66 21.21 0.43 16.61 0.65 Black 21.72 1.83 11.89 0.93 8.56 1.27 Asian 26.06 4.07 12.07 1.44 8.53 2.17 Hispanic 19.56 1.96 8.44 0.80 5.51 0.92
Music appreciation White 19.20 0.61 18.27 0.40 12.76 0.58 Black 15.68 1.66 13.82 1.02 8.14 1.21 Asian 12.98 2.97 9.53 1.31 5.27 1.11 Hispanic 12.53 1.69 6.16 0.68 6.32 1.08
Music performance classes
A significantly higher proportion of whites than all other race/ethnic groups have taken music classes in
all SPPA rounds. More than 4 in ten (40.1 percent) of whites had taken music classes in 2008. In 2008, a
higher proportion of Asians (24.9 percent) had taken music classes than did blacks (21.2 percent) and a
higher proportion of blacks had taken music classes than had Hispanics (17.0 percent). This relative
ordering was the case in all SPPA rounds since 1992. Overall, the proportion of people of all race/ethnic
groups who have ever taken music classes has declined from 1992 to2008. 2008 marks the lowest
proportion of blacks and Asians to have taken music classes and 2008 is not significantly different from
the lowest proportion of whites and Hispanics to have taken music classes.
Visual arts classes
The proportion of whites who took visual arts classes was as high, or higher, than every other
race/ethnic group in all rounds of the survey. In 1992 and 2002 the proportion of Asians who had taken
71
visual arts classes was nearly equivalent to whites, but by 2008 the proportion of Asians who had fallen
well below whites (13.9 percent versus 20.1 percent). In 2008, the proportion of blacks who had taken
visual arts classes (10.2 percent) was smaller than the proportion of Asians, but larger than the
proportion of Hispanics (7.3 percent). In most race/ethnic groups there has been relatively little change
in the proportion of respondents who had ever taken visual arts classes across SPPA rounds. Hispanics,
however have shown a proportional decline since 1992 to the current level.
Acting classes
In 2008, a higher proportion of whites (7.3 percent) had taken acting classes than all other race/ethnic
groups. Asians (5.3 percent) were less likely than whites to have ever taken acting classes in 2008, but a
higher proportion of Asians, than blacks (2.6 percent) or Hispanics (1.9 percent) had taken an acting
class. Overall, the proportion of all groups to have taken an acting class is lower in 2008 than in previous
SPPA rounds.
Dance classes
In 2008 a higher proportion of whites (14.6 percent) had ever taken dance classes than Asians (8.7
percent). The proportions of blacks (6.0 percent) and Hispanics (5.0 percent) to have ever taken a dance
class were not significantly different from each other, but were both lower than the proportion of Asians.
There has been a relatively steady decrease in the proportion of all groups who have taken dance
classes. 2008 marks the lowest proportion of respondents of all race/ethnic groups to have taken dance
classes.
Creative writing classes
In 2008, like with other arts learning domains, the proportion of whites (13.3 percent) to have ever
taken creative writing courses is higher than Asians (9.5 percent), which is higher than blacks (7.0
percent), which is higher than Hispanics (4.2 percent). Also like other arts learning domains, 2008 is, or
is not significantly different from, the lowest proportion of people in all race/ethnic groups to have
taken creative writing classes.
Art appreciation or art history classes
In 2008, a higher proportion of whites (16.6 percent) had ever taken art history or art appreciation
courses than Asians (8.5 percent) or blacks (8.6 percent), whose proportions were not significantly
different from each other. The proportion of Hispanics (5.5 percent) who had taken art appreciation
courses was lower than all other groups in 2008. There has been a sharp drop in the proportion of all
race/ethnic groups to have ever taken art appreciation or art history courses from 1992 to 2008. 2008
marks the lowest proportion in all race/ethnic groups to have taken such classes.
Music appreciation
In 2008, a higher proportion of whites (12.8 percent) had ever taken music appreciation courses than
blacks (8.1 percent). The proportion of blacks who had taken music appreciation courses was higher
than that of Asians (5.3 percent) and Hispanics (6.3 percent), who were not significantly different from
each other. Like in other arts learning domains, there has been a sharp drop in the proportion of all
race/ethnic groups to have ever taken music appreciation classes from 1992 to 2008. 2008 marks the
lowest proportion in all race/ethnic groups to have taken such classes.

72
Summary A higher proportion of whites than other racial/ethnic groups have engaged in arts learning across all
domains. In most arts learning domains, Asians have had greater exposure to arts education than blacks
and Hispanics. In nearly all arts learning domains, the proportion of Hispanics to have engaged in the
particular type of arts learning was, or was not significantly different from, the lowest proportion among
all race/ethnic groups. The proportion of people who have ever taken arts courses declined in nearly all
race/ethnic groups in all domains from 1992 to 2008.

73
REFERENCES
DiMaggio, Paul, and Francie Ostrower. 1990. “Participation in the Arts by Black and White Americans.”
Social Forces 68(3):753-778.
DiMaggio, Paul, and Michael Useem. 1978. “Social Class and Arts Consumption: the origins and
consequences of class differences in exposure to the arts in America.” Theory and Society
5(2):141-161.
DiMaggio, Paul, and Toqir Mukhtar. 2004. “Arts Participation as Cultural Capital in the United States,
1982–2002: Signs of decline?” Poetics 32(2):169-194.
Holbrook, Morris B., Michael J. Weiss, and John Habich. 2004. “Class-related Distinctions in American
Cultural Tastes.” Empirical Studies of the Arts 22(1):91-115.
Kalamijn, Matthijs, and Gerbert Kraaykamp. 1996. “Race, Cultural Capitals, and Schooling: An Analysis of
Trends in the United States.” Sociology of Education 69(1):22-34.
Lamont, Michele, and Annette Lareau. 1988. “Cultural Capital: Allusions, Gaps and Glissandos in Recent
Theoretical Developments.” Sociological Theory 61(2):153-168.
Love, Jeffrey, and Bramble C. Klipple. 1995. Arts Participation and Race/Ethnicity. An Analysis of 1982,
1985, and 1992 SPPA Surveys. <Available from:
http://eric.ed.gov/ERICDocs/data/ericdocs2sql/content_storage_01/0000019b/80/14/a4/b5.pd
f>
Nichols, Bonnie. 2003. Demographic Characteristics of Arts Attendance, 2002. NEA Research Note no.
82. Washington D.C.: National Endowment for the Arts.
Peterson, Richard A., and Albert Simkus. 1992. “How Musical Taste Groups Mark Occupational Status
Groups.” Pp.152-168 in Cultivating Differences: Symbolic Boundaries and the Making of
Inequality, edited by M. Lamont and M. Fournier. Chicago: University of Chicago Press.
Peterson, Richard A., and Roger M. Kern. 1996. “Changing Highbrow Taste: From Snob to Omnivore.”
American Sociological Review 61(5):900-907.
74
Peterson, Richard A., and Darren E. Sherkat. 1995. Age Factors in Arts Participation: 1982-1992.
<Available from:
http://eric.ed.gov/ERICDocs/data/ericdocs2sql/content_storage_01/0000019b/80/14/53/71.pd
f>
Robinson, John P. 1993. Arts Participation in America: 1982-1992. Washington, DC: National Endowment
for the Arts.
Stigler, George, and Gary S. Becker. 1977. “De Gustibus Non Est Disputandum.” American Economic
Review 67:26-50.
van Eijck, Koen, and John Lievens. 2008. “Cultural Omnivorousness as a Combination of Highbrow, Pop,
and Folk Elements: The relation between taste patterns and attitudes concerning social
integration.” Poetics 36(2-3):217-242.
Williams, Kevin, and David Keen. 2009. 2008 Survey of Public Participation in the Arts. NEA Research
Report no. 49. <Available from: http://www.arts.gov/research/2008-SPPA.pdf>
75
Technical Notes Survey estimates
SPPA data were collected using a complex sampling procedure that ensured adequate representation of
each group in the final sample. Given that SPPA data is sample data, estimates provided in this report
have standard errors associated with them. In any place group differences are discussed, the mean
differences are outside of the 95% confidence interval. Differences that do not fall outside of the 95%
confidence interval are not considered statistically significant and are not discussed in this monograph.
The means and standard errors in this report were computed using SAS survey procedures
(SURVEYMEANS and SURVEYLOGISTIC) to ensure that the complex sampling design was accounted for.
For a full explanation of the accuracy of SPPA data the reader is advised to consult the Census Bureau’s
source and accuracy statement on the SPPA supplement on the Current Population Survey web site –
http://www.census.gov/apsd/techdoc/cps/cpsmay08.pdf.
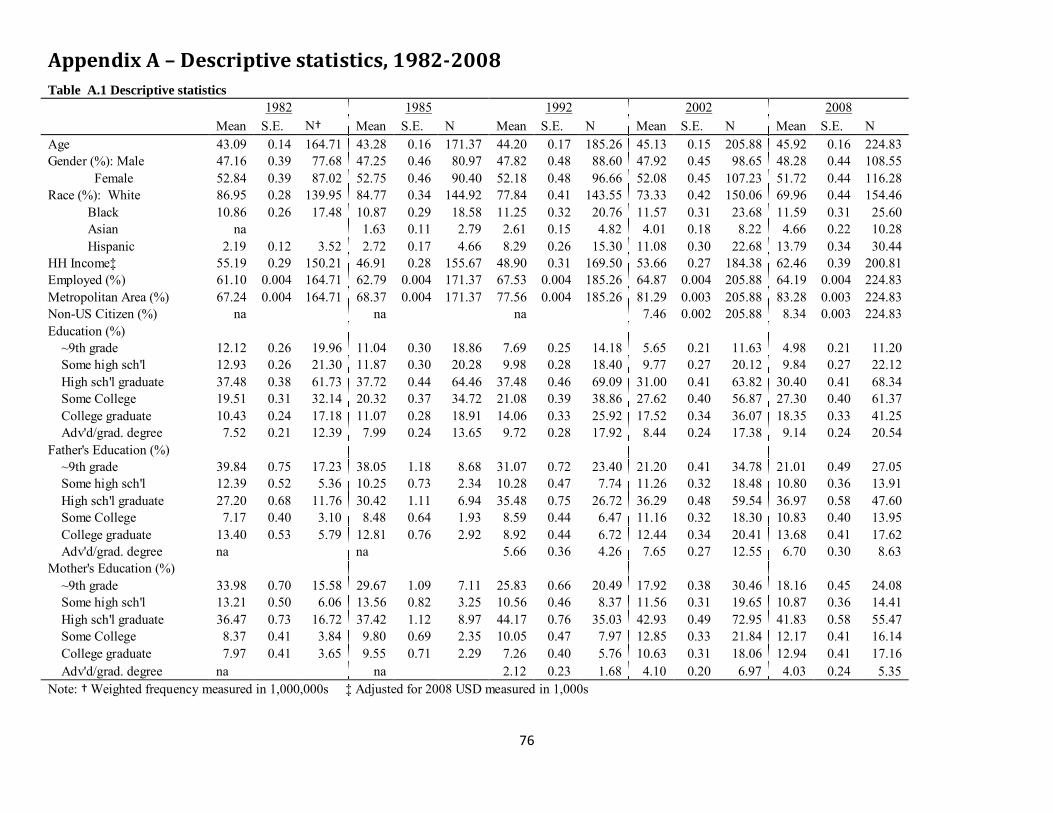
76
Appendix A – Descriptive statistics, 1982-2008
Table A.1 Descriptive statistics
1982 1985 1992 2002 2008 Mean S.E. N† Mean S.E. N Mean S.E. N Mean S.E. N Mean S.E. N Age 43.09 0.14 164.71 43.28 0.16 171.37 44.20 0.17 185.26 45.13 0.15 205.88 45.92 0.16 224.83 Gender (%): Male 47.16 0.39 77.68 47.25 0.46 80.97 47.82 0.48 88.60 47.92 0.45 98.65 48.28 0.44 108.55
Female 52.84 0.39 87.02 52.75 0.46 90.40 52.18 0.48 96.66 52.08 0.45 107.23 51.72 0.44 116.28 Race (%): White 86.95 0.28 139.95 84.77 0.34 144.92 77.84 0.41 143.55 73.33 0.42 150.06 69.96 0.44 154.46
Black 10.86 0.26 17.48 10.87 0.29 18.58 11.25 0.32 20.76 11.57 0.31 23.68 11.59 0.31 25.60 Asian na
1.63 0.11 2.79 2.61 0.15 4.82 4.01 0.18 8.22 4.66 0.22 10.28
Hispanic 2.19 0.12 3.52 2.72 0.17 4.66 8.29 0.26 15.30 11.08 0.30 22.68 13.79 0.34 30.44 HH Income‡ 55.19 0.29 150.21 46.91 0.28 155.67 48.90 0.31 169.50 53.66 0.27 184.38 62.46 0.39 200.81 Employed (%) 61.10 0.004 164.71 62.79 0.004 171.37 67.53 0.004 185.26 64.87 0.004 205.88 64.19 0.004 224.83 Metropolitan Area (%) 67.24 0.004 164.71 68.37 0.004 171.37 77.56 0.004 185.26 81.29 0.003 205.88 83.28 0.003 224.83 Non-US Citizen (%) na
na
na
7.46 0.002 205.88 8.34 0.003 224.83
Education (%)
~9th grade 12.12 0.26 19.96 11.04 0.30 18.86 7.69 0.25 14.18 5.65 0.21 11.63 4.98 0.21 11.20
Some high sch'l 12.93 0.26 21.30 11.87 0.30 20.28 9.98 0.28 18.40 9.77 0.27 20.12 9.84 0.27 22.12 High sch'l graduate 37.48 0.38 61.73 37.72 0.44 64.46 37.48 0.46 69.09 31.00 0.41 63.82 30.40 0.41 68.34 Some College 19.51 0.31 32.14 20.32 0.37 34.72 21.08 0.39 38.86 27.62 0.40 56.87 27.30 0.40 61.37 College graduate 10.43 0.24 17.18 11.07 0.28 18.91 14.06 0.33 25.92 17.52 0.34 36.07 18.35 0.33 41.25 Adv'd/grad. degree 7.52 0.21 12.39 7.99 0.24 13.65 9.72 0.28 17.92 8.44 0.24 17.38 9.14 0.24 20.54
Father's Education (%)
~9th grade 39.84 0.75 17.23 38.05 1.18 8.68 31.07 0.72 23.40 21.20 0.41 34.78 21.01 0.49 27.05
Some high sch'l 12.39 0.52 5.36 10.25 0.73 2.34 10.28 0.47 7.74 11.26 0.32 18.48 10.80 0.36 13.91 High sch'l graduate 27.20 0.68 11.76 30.42 1.11 6.94 35.48 0.75 26.72 36.29 0.48 59.54 36.97 0.58 47.60 Some College 7.17 0.40 3.10 8.48 0.64 1.93 8.59 0.44 6.47 11.16 0.32 18.30 10.83 0.40 13.95 College graduate 13.40 0.53 5.79 12.81 0.76 2.92 8.92 0.44 6.72 12.44 0.34 20.41 13.68 0.41 17.62 Adv'd/grad. degree na
na
5.66 0.36 4.26 7.65 0.27 12.55 6.70 0.30 8.63
Mother's Education (%)
~9th grade 33.98 0.70 15.58 29.67 1.09 7.11 25.83 0.66 20.49 17.92 0.38 30.46 18.16 0.45 24.08
Some high sch'l 13.21 0.50 6.06 13.56 0.82 3.25 10.56 0.46 8.37 11.56 0.31 19.65 10.87 0.36 14.41 High sch'l graduate 36.47 0.73 16.72 37.42 1.12 8.97 44.17 0.76 35.03 42.93 0.49 72.95 41.83 0.58 55.47 Some College 8.37 0.41 3.84 9.80 0.69 2.35 10.05 0.47 7.97 12.85 0.33 21.84 12.17 0.41 16.14 College graduate 7.97 0.41 3.65 9.55 0.71 2.29 7.26 0.40 5.76 10.63 0.31 18.06 12.94 0.41 17.16 Adv'd/grad. degree na na 2.12 0.23 1.68 4.10 0.20 6.97 4.03 0.24 5.35
Note: † Weighted frequency measured in 1,000,000s ‡ Adjusted for 2008 USD measured in 1,000s

77
Appendix B – Participation rate in core arts domains, by
race/ethnicity, 1992-2008
Table B.1 Arts participation rate (%) by racial and ethnic groups
1982 1985 1992 2002 2008 Mean S.E Mean S.E Mean S.E Mean S.E Mean S.E
Jazz White 8.92 0.24 9.18 0.28 10.48 0.33 11.36 0.33 8.81 0.28 Black 15.54 0.95 12.93 1.01 16.18 1.14 12.67 0.94 8.62 0.74 Asian 8.17 1.58 5.01 1.14 7.30 1.16 3.06 0.73 Hispanic 9.68 1.48 7.32 1.23 5.94 0.77 6.20 0.69 3.93 0.48
Classical White 13.96 0.29 13.67 0.33 14.02 0.37 13.66 0.35 11.27 0.32 Black 6.65 0.62 6.30 0.68 6.87 0.77 4.54 0.58 4.25 0.52 Asian 16.36 2.07 12.82 1.86 10.51 1.35 9.74 1.20 Hispanic 10.24 1.63 7.14 1.45 5.68 0.72 5.47 0.64 3.79 0.47
Opera White 3.26 0.15 2.81 0.16 3.58 0.19 3.76 0.19 2.56 0.15 Black 1.35 0.28 1.40 0.33 1.92 0.40 1.06 0.29 0.73 0.21 Asian 4.55 1.09 4.71 1.08 2.78 0.65 1.40 0.50 Hispanic 2.36 0.57 0.27 0.27 1.76 0.45 1.76 0.39 1.14 0.26
Musical White 20.00 0.34 18.01 0.36 19.04 0.41 20.06 0.41 20.04 0.40 Black 10.00 0.77 8.36 0.77 14.32 1.07 10.29 0.87 8.59 0.72 Asian 13.78 1.60 10.65 1.91 11.79 1.39 13.56 1.36 Hispanic 13.12 1.60 6.60 1.19 8.77 0.90 6.94 0.72 8.12 0.74
Play White 12.97 0.28 12.60 0.32 14.32 0.37 14.23 0.36 11.37 0.31 Black 5.77 0.59 6.04 0.67 12.02 0.99 7.06 0.71 5.49 0.62 Asian 8.80 1.62 8.12 1.62 9.85 1.32 6.04 1.00 Hispanic 4.70 0.98 4.02 0.96 8.67 0.90 6.19 0.68 4.25 0.53
Ballet White 4.49 0.17 4.57 0.20 5.03 0.23 4.67 0.22 3.50 0.18 Black 1.76 0.32 2.01 0.38 2.60 0.49 1.51 0.34 1.10 0.26 Asian 6.60 1.33 6.53 1.55 2.50 0.68 1.94 0.55 Hispanic 5.28 0.82 3.54 1.17 3.51 0.57 1.60 0.32 2.19 0.36
Museum/Gallery White 23.35 0.36 23.48 0.41 28.63 0.48 29.51 0.47 26.04 0.44 Black 12.35 0.84 10.65 0.87 19.28 1.19 14.77 1.01 11.98 0.90 Asian 25.81 2.24 28.93 2.52 34.05 1.99 23.97 1.76 Hispanic 15.87 1.78 16.57 1.98 17.56 1.20 16.14 1.05 14.53 0.90
Craft fair White 42.57 0.83 43.06 1.14 45.46 0.53 38.01 0.49 29.34 0.45 Black 17.07 1.75 14.94 2.03 22.70 1.27 19.68 1.15 12.22 0.91 Asian 43.71 4.62 22.78 2.42 24.73 1.77 13.37 1.47 Hispanic 18.28 3.39 37.38 5.73 25.55 1.37 20.28 1.13 13.68 0.87
Park White 39.34 0.81 38.71 1.12 38.99 0.52 35.96 0.49 29.50 0.46 Black 21.58 1.91 16.97 2.16 17.52 1.18 17.83 1.12 12.63 0.87 Asian 31.06 5.29 21.38 2.40 30.41 1.90 19.60 1.70 Hispanic 27.73 3.86 32.35 4.73 19.47 1.24 17.17 1.05 14.00 0.88
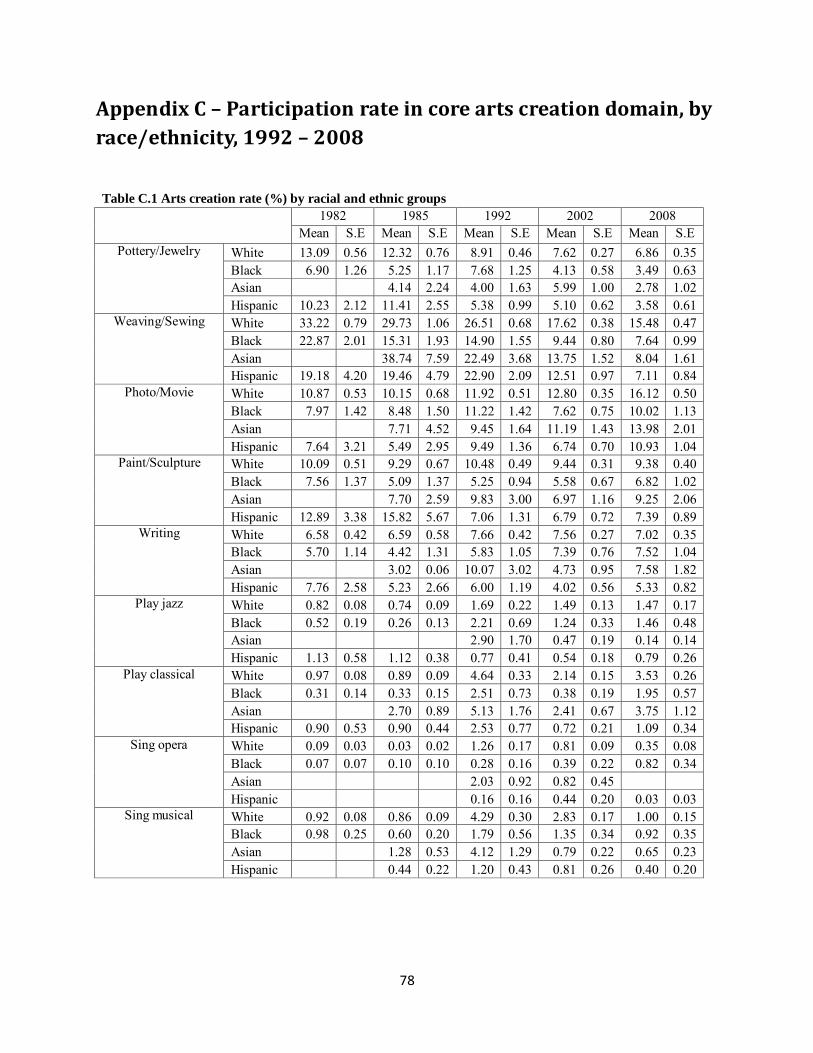
78
Appendix C – Participation rate in core arts creation domain, by
race/ethnicity, 1992 – 2008
Table C.1 Arts creation rate (%) by racial and ethnic groups
1982 1985 1992 2002 2008
Mean S.E Mean S.E Mean S.E Mean S.E Mean S.E Pottery/Jewelry White 13.09 0.56 12.32 0.76 8.91 0.46 7.62 0.27 6.86 0.35
Black 6.90 1.26 5.25 1.17 7.68 1.25 4.13 0.58 3.49 0.63 Asian 4.14 2.24 4.00 1.63 5.99 1.00 2.78 1.02 Hispanic 10.23 2.12 11.41 2.55 5.38 0.99 5.10 0.62 3.58 0.61
Weaving/Sewing White 33.22 0.79 29.73 1.06 26.51 0.68 17.62 0.38 15.48 0.47 Black 22.87 2.01 15.31 1.93 14.90 1.55 9.44 0.80 7.64 0.99 Asian 38.74 7.59 22.49 3.68 13.75 1.52 8.04 1.61 Hispanic 19.18 4.20 19.46 4.79 22.90 2.09 12.51 0.97 7.11 0.84
Photo/Movie White 10.87 0.53 10.15 0.68 11.92 0.51 12.80 0.35 16.12 0.50 Black 7.97 1.42 8.48 1.50 11.22 1.42 7.62 0.75 10.02 1.13 Asian 7.71 4.52 9.45 1.64 11.19 1.43 13.98 2.01 Hispanic 7.64 3.21 5.49 2.95 9.49 1.36 6.74 0.70 10.93 1.04
Paint/Sculpture White 10.09 0.51 9.29 0.67 10.48 0.49 9.44 0.31 9.38 0.40 Black 7.56 1.37 5.09 1.37 5.25 0.94 5.58 0.67 6.82 1.02 Asian 7.70 2.59 9.83 3.00 6.97 1.16 9.25 2.06 Hispanic 12.89 3.38 15.82 5.67 7.06 1.31 6.79 0.72 7.39 0.89
Writing White 6.58 0.42 6.59 0.58 7.66 0.42 7.56 0.27 7.02 0.35 Black 5.70 1.14 4.42 1.31 5.83 1.05 7.39 0.76 7.52 1.04 Asian 3.02 0.06 10.07 3.02 4.73 0.95 7.58 1.82 Hispanic 7.76 2.58 5.23 2.66 6.00 1.19 4.02 0.56 5.33 0.82
Play jazz White 0.82 0.08 0.74 0.09 1.69 0.22 1.49 0.13 1.47 0.17 Black 0.52 0.19 0.26 0.13 2.21 0.69 1.24 0.33 1.46 0.48 Asian 2.90 1.70 0.47 0.19 0.14 0.14 Hispanic 1.13 0.58 1.12 0.38 0.77 0.41 0.54 0.18 0.79 0.26
Play classical White 0.97 0.08 0.89 0.09 4.64 0.33 2.14 0.15 3.53 0.26 Black 0.31 0.14 0.33 0.15 2.51 0.73 0.38 0.19 1.95 0.57 Asian 2.70 0.89 5.13 1.76 2.41 0.67 3.75 1.12 Hispanic 0.90 0.53 0.90 0.44 2.53 0.77 0.72 0.21 1.09 0.34
Sing opera White 0.09 0.03 0.03 0.02 1.26 0.17 0.81 0.09 0.35 0.08 Black 0.07 0.07 0.10 0.10 0.28 0.16 0.39 0.22 0.82 0.34 Asian 2.03 0.92 0.82 0.45 Hispanic 0.16 0.16 0.44 0.20 0.03 0.03
Sing musical White 0.92 0.08 0.86 0.09 4.29 0.30 2.83 0.17 1.00 0.15 Black 0.98 0.25 0.60 0.20 1.79 0.56 1.35 0.34 0.92 0.35 Asian 1.28 0.53 4.12 1.29 0.79 0.22 0.65 0.23 Hispanic 0.44 0.22 1.20 0.43 0.81 0.26 0.40 0.20
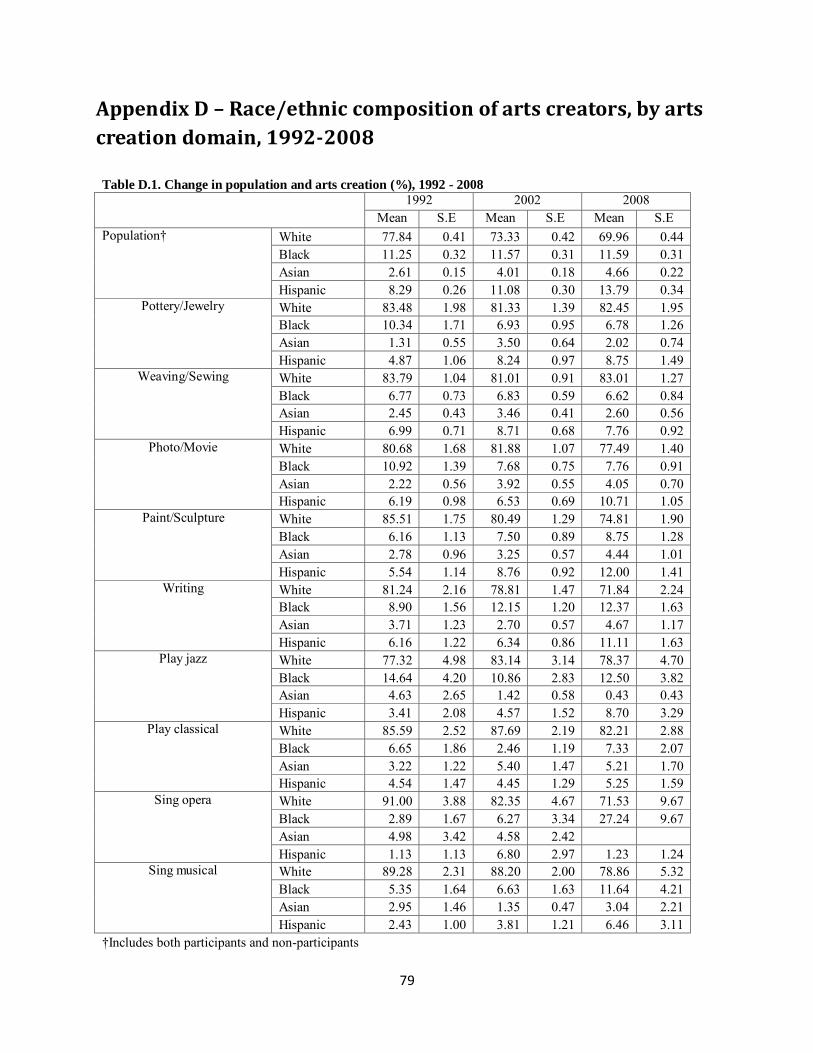
79
Appendix D – Race/ethnic composition of arts creators, by arts
creation domain, 1992-2008
Table D.1. Change in population and arts creation (%), 1992 - 2008
1992 2002 2008
Mean S.E Mean S.E Mean S.E Population† White 77.84 0.41 73.33 0.42 69.96 0.44
Black 11.25 0.32 11.57 0.31 11.59 0.31 Asian 2.61 0.15 4.01 0.18 4.66 0.22 Hispanic 8.29 0.26 11.08 0.30 13.79 0.34
Pottery/Jewelry White 83.48 1.98 81.33 1.39 82.45 1.95 Black 10.34 1.71 6.93 0.95 6.78 1.26 Asian 1.31 0.55 3.50 0.64 2.02 0.74 Hispanic 4.87 1.06 8.24 0.97 8.75 1.49
Weaving/Sewing White 83.79 1.04 81.01 0.91 83.01 1.27 Black 6.77 0.73 6.83 0.59 6.62 0.84 Asian 2.45 0.43 3.46 0.41 2.60 0.56 Hispanic 6.99 0.71 8.71 0.68 7.76 0.92
Photo/Movie White 80.68 1.68 81.88 1.07 77.49 1.40 Black 10.92 1.39 7.68 0.75 7.76 0.91 Asian 2.22 0.56 3.92 0.55 4.05 0.70 Hispanic 6.19 0.98 6.53 0.69 10.71 1.05
Paint/Sculpture White 85.51 1.75 80.49 1.29 74.81 1.90 Black 6.16 1.13 7.50 0.89 8.75 1.28 Asian 2.78 0.96 3.25 0.57 4.44 1.01 Hispanic 5.54 1.14 8.76 0.92 12.00 1.41
Writing White 81.24 2.16 78.81 1.47 71.84 2.24 Black 8.90 1.56 12.15 1.20 12.37 1.63 Asian 3.71 1.23 2.70 0.57 4.67 1.17 Hispanic 6.16 1.22 6.34 0.86 11.11 1.63
Play jazz White 77.32 4.98 83.14 3.14 78.37 4.70 Black 14.64 4.20 10.86 2.83 12.50 3.82 Asian 4.63 2.65 1.42 0.58 0.43 0.43 Hispanic 3.41 2.08 4.57 1.52 8.70 3.29
Play classical White 85.59 2.52 87.69 2.19 82.21 2.88 Black 6.65 1.86 2.46 1.19 7.33 2.07 Asian 3.22 1.22 5.40 1.47 5.21 1.70 Hispanic 4.54 1.47 4.45 1.29 5.25 1.59
Sing opera White 91.00 3.88 82.35 4.67 71.53 9.67 Black 2.89 1.67 6.27 3.34 27.24 9.67 Asian 4.98 3.42 4.58 2.42 Hispanic 1.13 1.13 6.80 2.97 1.23 1.24
Sing musical White 89.28 2.31 88.20 2.00 78.86 5.32 Black 5.35 1.64 6.63 1.63 11.64 4.21 Asian 2.95 1.46 1.35 0.47 3.04 2.21 Hispanic 2.43 1.00 3.81 1.21 6.46 3.11
†Includes both participants and non-participants

80
Figure D.1 Racial/ethnic composition of people with experience of working
with pottery/jewelry, 1992-2008
Figure D.2 Racial/ethnic composition of people with experience of weaving/sewing, 1992-2008
0%
10%
20%
30%
40%
50%
60%
70%
80%
90%
100%
1992 2002 2008
Hispanic
Asian
Black
White
0%
10%
20%
30%
40%
50%
60%
70%
80%
90%
100%
1992 2002 2008
Hispanic
Asian
Black
White
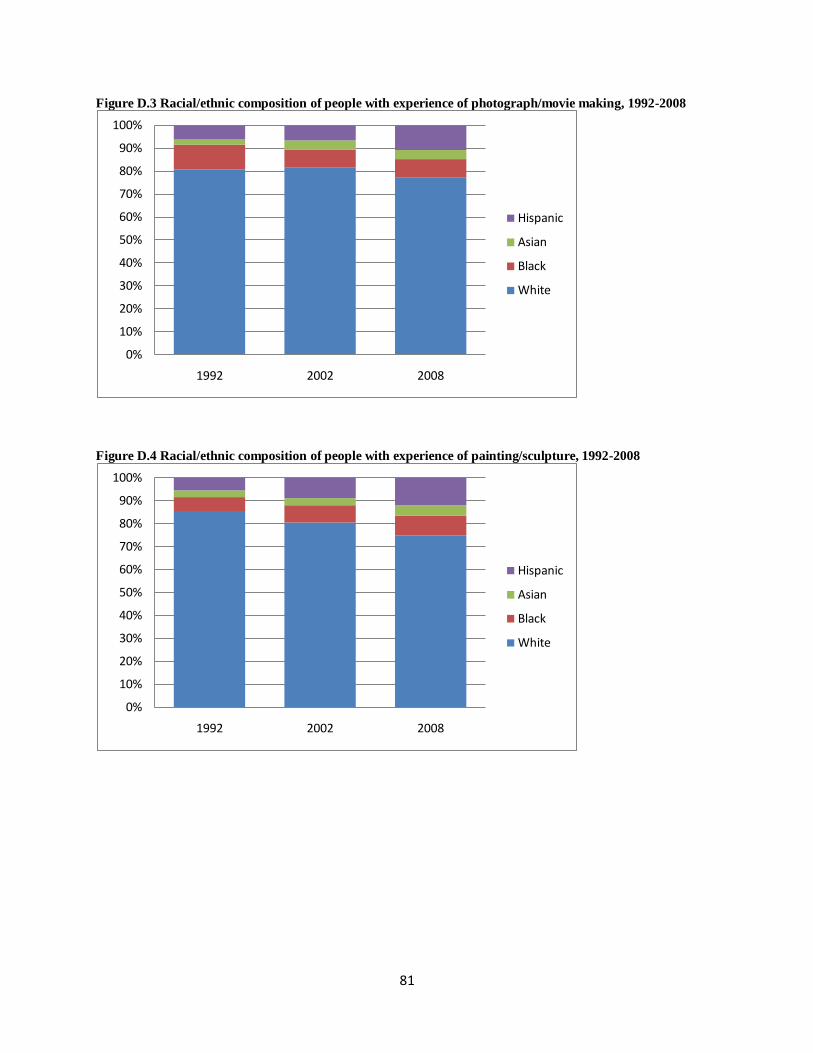
81
Figure D.3 Racial/ethnic composition of people with experience of photograph/movie making, 1992-2008
Figure D.4 Racial/ethnic composition of people with experience of painting/sculpture, 1992-2008
0%
10%
20%
30%
40%
50%
60%
70%
80%
90%
100%
1992 2002 2008
Hispanic
Asian
Black
White
0%
10%
20%
30%
40%
50%
60%
70%
80%
90%
100%
1992 2002 2008
Hispanic
Asian
Black
White

82
Figure D.5 Racial/ethnic composition of people with experience of creative writing, 1992-2008
Figure D.6 Racial/ethnic composition of people with experience of playing jazz, 1992-2008
0%
10%
20%
30%
40%
50%
60%
70%
80%
90%
100%
1992 2002 2008
Hispanic
Asian
Black
White
0%
10%
20%
30%
40%
50%
60%
70%
80%
90%
100%
1992 2002 2008
Hispanic
Asian
Black
White

83
Figure D.7 Racial/ethnic composition of people with experience of playing classical music, 1992-2008
Figure D.8 Racial/ethnic composition of people with experience of singing opera, 1992-2008
0%
10%
20%
30%
40%
50%
60%
70%
80%
90%
100%
1992 2002 2008
Hispanic
Asian
Black
White
0%
10%
20%
30%
40%
50%
60%
70%
80%
90%
100%
1992 2002 2008
Hispanic
Asian
Black
White

84
Figure D.9 Racial/ethnic composition of people with experience of singing/acting in musical play, 1992-2008
0%
10%
20%
30%
40%
50%
60%
70%
80%
90%
100%
1992 2002 2008
Hispanic
Asian
Black
White

85
Appendix E - Effects of race/ethnicity, educational attainment,
and their interactions on specific arts participation (full results)

86
Table E.1 Effects of race/ethnicity, educational attainment, and their interactions on JAZZ (full results)
Dependent Variable: Go to a live jazz performance
1982 1982 1985 1985 1992 1992 2002 2002 2008 2008 Black 1.323** 0.954 0.904** -0.235 1.086** 1.865** 0.603** 1.133** 0.455** 0.317
(0.178) (0.510) (0.310) (1.133) (0.167) (0.464) (0.119) (0.429) (0.140) (0.555) Asian
-0.366 0.431 -0.740 0.957 -0.701** -0.122 -1.408** -0.184
(0.644) (2.034) (0.457) (1.439) (0.208) (0.901) (0.415) (1.527)
Hispanic -0.063 -2.941 -1.029 1.220 0.144 0.247 0.151 -0.575 -0.304 0.300 (0.415) (2.136) (0.877) (1.523) (0.233) (0.616) (0.164) (0.482) (0.200) (0.644)
Female -0.014 -0.021 -0.197 -0.188 -0.174 -0.161 0.088 0.089 0.013 0.013 (0.113) (0.113) (0.184) (0.185) (0.107) (0.107) (0.069) (0.069) (0.088) (0.089)
Age -0.032** -0.032** -0.026** -0.026** 0.000 0.000 -0.002 -0.002 0.004 0.004 (0.005) (0.005) (0.007) (0.007) (0.004) (0.004) (0.003) (0.003) (0.003) (0.003)
HH income (1,000 USD)
0.001 0.000 0.001 0.001 0.002 0.002 0.004** 0.004** 0.003* 0.003* (0.002) (0.002) (0.003) (0.003) (0.002) (0.002) (0.001) (0.001) (0.001) (0.001)
Education 0.408** 0.382** 0.512** 0.492** 0.458** 0.498** 0.435** 0.435** 0.417** 0.429** (0.050) (0.053) (0.081) (0.084) (0.048) (0.054) (0.035) (0.037) (0.046) (0.048)
Father's Education
0.054 0.053 0.083 0.081 -0.023 -0.029 0.117** 0.117** 0.113** 0.113** (0.051) (0.051) (0.076) (0.077) (0.048) (0.048) (0.031) (0.031) (0.040) (0.040)
Mother's Education
0.118 0.124* 0.163 0.172 0.253** 0.257** 0.155** 0.153** 0.112* 0.114* (0.061) (0.061) (0.089) (0.090) (0.054) (0.054) (0.036) (0.036) (0.046) (0.046)
Employed 0.041 0.036 0.281 0.288 0.363* 0.372* 0.246** 0.245** 0.314* 0.310* (0.134) (0.134) (0.233) (0.232) (0.152) (0.152) (0.089) (0.089) (0.123) (0.123)
Metropolitan Area 0.564** 0.567** 0.278 0.280 0.650** 0.645** 0.551** 0.552** 0.221 0.216 (0.142) (0.142) (0.216) (0.219) (0.159) (0.160) (0.099) (0.099) (0.139) (0.140)
Non-US Citizen
-0.031 0.026 -0.318 -0.347
(0.183) (0.184) (0.264) (0.264)
Black*Education
0.097
0.305
-0.197
-0.131
0.036
(0.130)
(0.293)
(0.111)
(0.101)
(0.129)
Asian*Education
-0.164
-0.374
-0.122
-0.251
(0.413)
(0.312)
(0.184)
(0.321)
Hispanic*Education
0.769
-0.674
-0.022
0.182
-0.155
(0.541)
(0.445)
(0.142)
(0.110)
(0.160)
Constant -3.563** -3.470** -4.224** -4.176** -5.492** -5.666** -5.577** -5.580** -5.505** -5.553** (0.314) (0.317) (0.487) (0.488) (0.333) (0.352) (0.222) (0.233) (0.308) (0.320)
Unweighted N 3989 3989 1717 1717 4156 4156 12078 12078 9255 9255 Weighted N (Million) 38.51 38.51 20.12 20.12 67.20 67.20 145.00 145.00 114.80 114.80
F 27.69 23.02 12.30 10.10 28.25 22.13 52.01 41.06 27.68 24.05 Standard errors in parentheses ** p<0.01, * p<0.05

87
Table E.2 Effects of race/ethnicity, educational attainment, and their interactions on CLASSICAL (full results)
Dependent Variable: Go to a live classical music performance
1982 1982 1985 1985 1992 1992 2002 2002 2008 2008 Black -0.293 0.352 -0.497 0.560 -0.587* -0.969 -0.871** -1.208 -0.497** -0.753
(0.237) (0.634) (0.365) (0.828) (0.241) (0.818) (0.174) (0.719) (0.178) (0.834) Asian
-0.505 0.716 0.382 0.743 -0.624** -1.129 -0.382 0.755
(0.565) (1.486) (0.336) (0.939) (0.193) (0.918) (0.284) (1.008)
Hispanic 0.219 -1.275 -0.930 2.295* -0.390 -0.055 -0.079 0.014 -0.482* -0.065 (0.409) (1.416) (0.789) (1.011) (0.261) (0.682) (0.166) (0.458) (0.196) (0.723)
Female 0.685** 0.689** 0.346* 0.338* 0.354** 0.352** 0.337** 0.337** 0.145 0.143 (0.105) (0.105) (0.158) (0.159) (0.104) (0.104) (0.067) (0.067) (0.085) (0.085)
Age 0.022** 0.022** 0.020** 0.020** 0.023** 0.023** 0.020** 0.020** 0.019** 0.019** (0.003) (0.003) (0.005) (0.005) (0.004) (0.004) (0.003) (0.003) (0.003) (0.003)
HH income (1,000 USD) 0.002 0.002 0.004 0.004 0.003 0.003 0.002 0.002 0.003** 0.003** (0.001) (0.001) (0.003) (0.003) (0.002) (0.002) (0.001) (0.001) (0.001) (0.001)
Education 0.603** 0.610** 0.468** 0.497** 0.479** 0.481** 0.628** 0.625** 0.576** 0.589** (0.044) (0.045) (0.065) (0.068) (0.047) (0.051) (0.034) (0.036) (0.044) (0.045)
Father's Education
0.026 0.023 0.215** 0.207** 0.087* 0.087* 0.154** 0.154** 0.137** 0.139** (0.044) (0.044) (0.068) (0.069) (0.043) (0.042) (0.030) (0.030) (0.036) (0.036)
Mother's Education
0.221** 0.222** 0.173* 0.183* 0.223** 0.222** 0.059 0.059 0.174** 0.174** (0.050) (0.050) (0.073) (0.074) (0.056) (0.055) (0.035) (0.035) (0.042) (0.042)
Employed 0.151 0.155 0.241 0.222 0.338* 0.333* 0.160 0.160 -0.020 -0.023 (0.118) (0.118) (0.183) (0.185) (0.141) (0.142) (0.087) (0.087) (0.105) (0.105)
Metropolitan Area 0.182 0.181 0.414* 0.409* 0.393** 0.390** 0.366** 0.367** 0.188 0.182 (0.115) (0.115) (0.180) (0.182) (0.141) (0.141) (0.094) (0.094) (0.113) (0.114)
Non-US Citizen
0.188 0.181 0.056 0.055
(0.183) (0.183) (0.232) (0.227)
Black*Education
-0.164
-0.289
0.087
0.075
0.060
(0.155)
(0.226)
(0.173)
(0.154)
(0.184)
Asian*Education
-0.272
-0.080
0.101
-0.232
(0.353)
(0.210)
(0.180)
(0.194)
Hispanic*Education
0.409
-1.161**
-0.081
-0.024
-0.100
(0.330)
(0.223)
(0.154)
(0.107)
(0.170)
Constant -6.390** -6.413** -6.204** -6.281** -6.561** -6.564** -6.803** -6.787** -6.817** -6.866** (0.301) (0.303) (0.464) (0.468) (0.339) (0.341) (0.238) (0.244) (0.294) (0.300)
Unweighted N 3993 3993 1717 1717 4157 4157 12075 12075 9258 9258 Weighted N (Million) 38.55 38.55 20.13 20.13 67.22 67.22 145.00 145.00 114.80 114.80
F 38.30 32.47 16.87 14.64 30.24 23.85 69.54 55.39 45.99 38.69 Standard errors in parentheses ** p<0.01, * p<0.05

88
Table E.3 Effects of race/ethnicity, educational attainment, and their interactions on OPERA (full results)
Dependent Variable: Go to a live opera
1982 1982 1985 1985 1992 1992 2002 2002 2008 2008 Black -0.678 -2.373* 0.022 -0.878 0.201 0.995 -0.707* -0.951 -0.533 0.832
(0.655) (1.159) (0.640) (0.840) (0.374) (1.548) (0.331) (1.481) (0.401) (1.520) Asian
0.539 -0.548 0.760 1.395 -0.777* -2.368 -0.775 2.785
(0.782) (2.588) (0.487) (1.544) (0.322) (2.095) (0.527) (2.702)
Hispanic 0.321 -6.027* 0.251 2.572 0.423 1.148 0.133 -0.377 0.141 1.931* (0.742) (2.507) (1.054) (1.374) (0.392) (0.834) (0.295) (0.726) (0.358) (0.959)
Female 0.699** 0.681** 0.703* 0.705* 0.264 0.279 0.410** 0.411** 0.322* 0.329* (0.212) (0.212) (0.295) (0.296) (0.190) (0.187) (0.120) (0.120) (0.162) (0.163)
Age 0.022** 0.022** 0.025** 0.024** 0.022** 0.022** 0.012** 0.013** 0.017** 0.017** (0.006) (0.006) (0.008) (0.008) (0.007) (0.007) (0.004) (0.004) (0.006) (0.006)
HH income (1,000 USD) 0.000 0.000 0.008 0.008 0.009** 0.009** 0.004 0.004 0.005** 0.005** (0.003) (0.003) (0.006) (0.006) (0.003) (0.003) (0.003) (0.003) (0.002) (0.002)
Education 0.492** 0.459** 0.391** 0.383** 0.397** 0.437** 0.609** 0.585** 0.670** 0.751** (0.090) (0.093) (0.104) (0.114) (0.086) (0.092) (0.063) (0.069) (0.097) (0.107)
Father's Education
-0.040 -0.045 0.102 0.101 0.119 0.116 0.194** 0.194** 0.088 0.087 (0.085) (0.085) (0.141) (0.144) (0.076) (0.075) (0.051) (0.051) (0.073) (0.073)
Mother's Education
0.165 0.179 -0.002 0.003 0.173 0.176 0.072 0.072 0.192* 0.199* (0.099) (0.099) (0.135) (0.138) (0.092) (0.092) (0.058) (0.058) (0.080) (0.081)
Employed 0.279 0.273 0.532 0.517 0.219 0.216 -0.032 -0.031 -0.177 -0.186 (0.241) (0.242) (0.360) (0.370) (0.274) (0.271) (0.144) (0.144) (0.205) (0.206)
Metropolitan Area 0.290 0.295 -0.158 -0.155 0.956** 0.948** 0.621** 0.626** 0.040 0.025 (0.256) (0.255) (0.314) (0.315) (0.329) (0.329) (0.196) (0.196) (0.216) (0.216)
Non-US Citizen
0.986** 1.014** -0.152 -0.185
(0.244) (0.241) (0.453) (0.448)
Black*Education
0.391
0.237
-0.181
0.051
-0.298
(0.238)
(0.184)
(0.337)
(0.319)
(0.352)
Asian*Education
0.225
-0.136
0.305
-0.723
(0.506)
(0.326)
(0.400)
(0.559)
Hispanic*Education
1.481*
-0.915**
-0.167
0.116
-0.412*
(0.611)
(0.259)
(0.194)
(0.153)
(0.207)
Constant -7.576** -7.439** -7.334** -7.310** -8.467** -8.655** -8.425** -8.320** -8.832** -9.223** (0.570) (0.566) (0.781) (0.777) (0.676) (0.667) (0.416) (0.429) (0.555) (0.612)
Unweighted N 3991 3991 1715 1715 4157 4157 12079 12079 9262 9262 Weighted N (Million) 38.53 38.53 20.11 20.11 67.22 67.22 145.00 145.00 114.90 114.90
F 9.459 9.283 4.488 5.100 12.92 10.79 29.81 24.08 15.34 14.60 Standard errors in parentheses ** p<0.01, * p<0.05

89
Table E.4 Effects of race/ethnicity, educational attainment, and their interactions on MUSICAL (full results)
Dependent Variable: Go to a live musical stage play
1982 1982 1985 1985 1992 1992 2002 2002 2008 2008 Black -0.122 -0.506 -0.105 -0.042 0.172 -0.097 -0.426** -0.368 -0.417** -1.186*
(0.194) (0.602) (0.293) (0.674) (0.168) (0.478) (0.126) (0.452) (0.130) (0.588) Asian
-0.573 -0.728 -0.588 -4.006* -0.722** -0.094 -0.308 0.521
(0.627) (1.771) (0.411) (1.703) (0.170) (0.677) (0.201) (0.974)
Hispanic -0.419 -2.829 -0.933 -0.327 -0.414 -0.696 -0.328* -0.401 -0.188 -0.383 (0.383) (1.478) (0.646) (1.377) (0.215) (0.564) (0.147) (0.418) (0.160) (0.508)
Female 0.546** 0.542** 0.551** 0.550** 0.490** 0.487** 0.601** 0.600** 0.515** 0.510** (0.092) (0.092) (0.147) (0.147) (0.093) (0.093) (0.059) (0.059) (0.072) (0.071)
Age 0.011** 0.011** 0.012* 0.012* 0.012** 0.012** 0.005* 0.005* 0.004 0.004 (0.003) (0.003) (0.005) (0.005) (0.003) (0.003) (0.002) (0.002) (0.002) (0.002)
HH income (1,000 USD) 0.009** 0.009** 0.005 0.005 0.012** 0.012** 0.010** 0.010** 0.008** 0.008** (0.001) (0.001) (0.003) (0.003) (0.002) (0.002) (0.001) (0.001) (0.001) (0.001)
Education 0.480** 0.466** 0.348** 0.351** 0.365** 0.344** 0.457** 0.460** 0.484** 0.473** (0.040) (0.041) (0.060) (0.064) (0.040) (0.043) (0.029) (0.031) (0.036) (0.037)
Father's Education
0.045 0.044 0.161* 0.160* 0.036 0.039 0.092** 0.092** 0.056 0.058 (0.040) (0.040) (0.071) (0.072) (0.040) (0.040) (0.027) (0.027) (0.032) (0.032)
Mother's Education
0.127** 0.130** 0.071 0.073 0.131** 0.132** 0.086** 0.086** 0.138** 0.136** (0.047) (0.047) (0.088) (0.088) (0.049) (0.049) (0.031) (0.031) (0.035) (0.035)
Employed 0.147 0.145 0.433* 0.429* 0.248* 0.253* 0.047 0.047 0.058 0.056 (0.105) (0.105) (0.174) (0.175) (0.118) (0.119) (0.073) (0.073) (0.090) (0.090)
Metropolitan Area 0.451** 0.453** 0.562** 0.563** 0.293* 0.302* 0.248** 0.247** 0.369** 0.366** (0.103) (0.102) (0.171) (0.171) (0.118) (0.119) (0.077) (0.077) (0.091) (0.091)
Non-US Citizen
-0.296 -0.290 -0.509* -0.496*
(0.172) (0.171) (0.200) (0.200)
Black*Education
0.099
-0.018
0.067
-0.014
0.184
(0.149)
(0.182)
(0.116)
(0.106)
(0.135)
Asian*Education
0.034
0.703*
-0.131
-0.174
(0.369)
(0.326)
(0.140)
(0.207)
Hispanic*Education
0.655
-0.197
0.070
0.019
0.048
(0.358)
(0.408)
(0.134)
(0.102)
(0.118)
Constant -5.282** -5.233** -5.098** -5.102** -5.181** -5.109** -5.197** -5.208** -5.351** -5.290** (0.256) (0.259) (0.438) (0.438) (0.281) (0.286) (0.191) (0.197) (0.230) (0.241)
Unweighted N 3993 3993 1716 1716 4156 4156 12074 12074 9258 9258 Weighted N (Million) 38.55 38.55 20.13 20.13 67.21 67.21 145.00 145.00 114.80 114.80
F 44.36 36.36 12.25 9.774 37.16 28.73 78.78 63.13 59.95 47.15 Standard errors in parentheses ** p<0.01, * p<0.05

90
Table E.5 Effects of race/ethnicity, educational attainment, and their interactions on PLAY (full results)
Dependent Variable: Go to a live performance of a nonmusical stage play
1982 1982 1985 1985 1992 1992 2002 2002 2008 2008 Black -0.427 -1.519 -0.410 -0.334 0.415* -0.021 -0.431** -0.337 -0.283 -0.136
(0.251) (1.090) (0.413) (0.930) (0.175) (0.579) (0.144) (0.599) (0.167) (0.723) Asian
-0.476 -0.304 -0.486 -1.946 -0.546** 0.735 -0.639* 1.361
(0.613) (1.497) (0.461) (2.241) (0.193) (0.667) (0.275) (1.428)
Hispanic -0.479 -2.711 -1.012 1.840 0.097 -0.696 0.038 -0.787 -0.154 -0.053 (0.550) (1.820) (0.787) (1.011) (0.218) (0.671) (0.151) (0.543) (0.199) (0.708)
Female 0.458** 0.451** 0.287 0.284 0.381** 0.375** 0.504** 0.502** 0.536** 0.535** (0.110) (0.109) (0.152) (0.153) (0.103) (0.103) (0.066) (0.066) (0.086) (0.086)
Age 0.014** 0.014** 0.009 0.009 0.014** 0.014** 0.005 0.005 0.008* 0.007* (0.004) (0.004) (0.005) (0.005) (0.004) (0.004) (0.003) (0.003) (0.003) (0.003)
HH income (1,000 USD) 0.007** 0.007** -0.000 -0.000 0.005** 0.005** 0.009** 0.009** 0.005** 0.005** (0.002) (0.002) (0.003) (0.003) (0.002) (0.002) (0.001) (0.001) (0.001) (0.001)
Education 0.564** 0.546** 0.466** 0.477** 0.534** 0.503** 0.496** 0.489** 0.527** 0.544** (0.048) (0.048) (0.072) (0.077) (0.046) (0.049) (0.034) (0.036) (0.045) (0.046)
Father's Education
0.111* 0.111* 0.160* 0.155* 0.053 0.056 0.095** 0.096** 0.075* 0.076* (0.044) (0.044) (0.065) (0.066) (0.043) (0.043) (0.030) (0.030) (0.038) (0.038)
Mother's Education
0.075 0.080 0.073 0.080 0.110* 0.108* 0.106** 0.105** 0.164** 0.164** (0.054) (0.054) (0.073) (0.074) (0.051) (0.050) (0.035) (0.035) (0.041) (0.042)
Employed 0.173 0.169 0.257 0.243 0.114 0.118 0.045 0.042 -0.019 -0.021 (0.129) (0.128) (0.179) (0.180) (0.132) (0.134) (0.085) (0.085) (0.101) (0.101)
Metropolitan Area 0.236* 0.239* 0.179 0.177 0.300* 0.308* 0.246** 0.246** 0.278* 0.273* (0.118) (0.118) (0.176) (0.177) (0.138) (0.137) (0.090) (0.090) (0.117) (0.117)
Non-US Citizen
-0.260 -0.211 -0.798** -0.783**
(0.185) (0.188) (0.282) (0.283)
Black*Education
0.258
-0.019
0.104
-0.023
-0.033
(0.248)
(0.239)
(0.135)
(0.138)
(0.165)
Asian*Education
-0.038
0.302
-0.267
-0.418
(0.317)
(0.473)
(0.139)
(0.302)
Hispanic*Education
0.570
-1.047**
0.189
0.203
-0.023
(0.474)
(0.218)
(0.149)
(0.125)
(0.158)
Constant -6.044** -5.974** -4.958** -4.983** -5.818** -5.690** -5.786** -5.750** -6.278** -6.345** (0.300) (0.302) (0.470) (0.475) (0.338) (0.344) (0.220) (0.227) (0.280) (0.286)
Unweighted N 3992 3992 1718 1718 4155 4155 12074 12074 9256 9256 Weighted N (Million) 38.54 38.54 20.16 20.16 67.21 67.21 144.90 144.90 114.80 114.80
F 37.43 30.10 9.252 8.391 28.49 22.06 62.60 49.27 41.48 36.34 Standard errors in parentheses ** p<0.01, * p<0.05
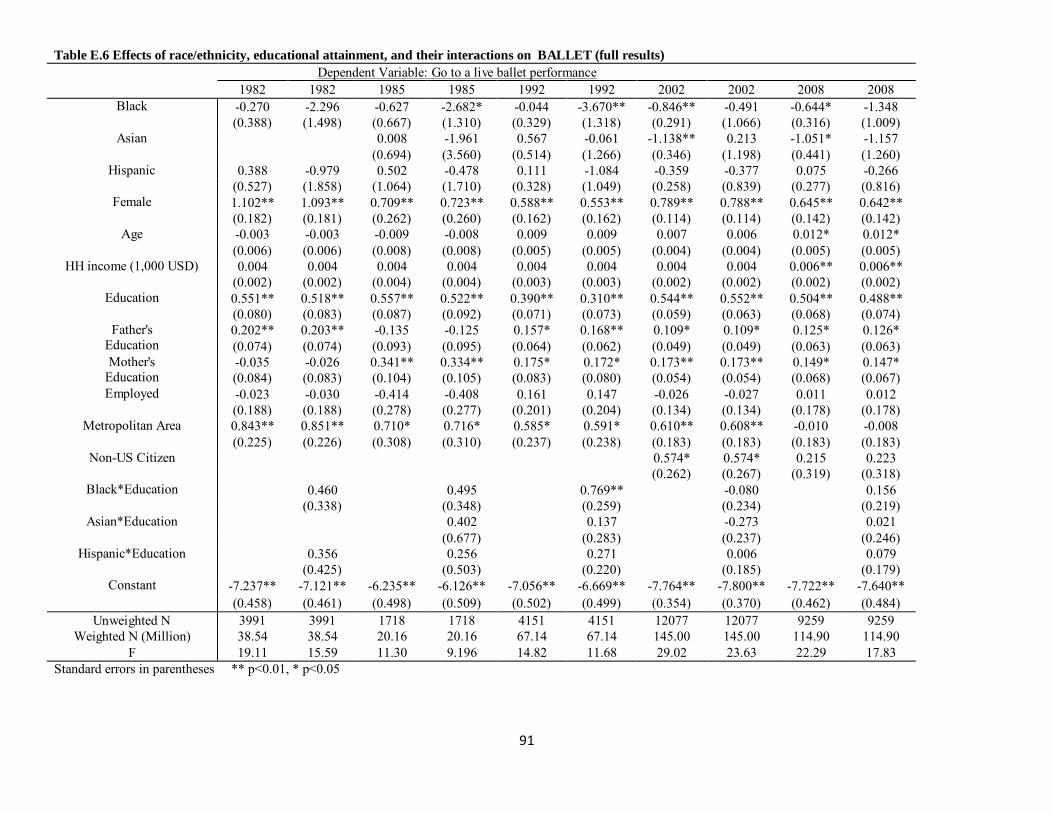
91
Table E.6 Effects of race/ethnicity, educational attainment, and their interactions on BALLET (full results)
Dependent Variable: Go to a live ballet performance
1982 1982 1985 1985 1992 1992 2002 2002 2008 2008 Black -0.270 -2.296 -0.627 -2.682* -0.044 -3.670** -0.846** -0.491 -0.644* -1.348
(0.388) (1.498) (0.667) (1.310) (0.329) (1.318) (0.291) (1.066) (0.316) (1.009) Asian
0.008 -1.961 0.567 -0.061 -1.138** 0.213 -1.051* -1.157
(0.694) (3.560) (0.514) (1.266) (0.346) (1.198) (0.441) (1.260)
Hispanic 0.388 -0.979 0.502 -0.478 0.111 -1.084 -0.359 -0.377 0.075 -0.266 (0.527) (1.858) (1.064) (1.710) (0.328) (1.049) (0.258) (0.839) (0.277) (0.816)
Female 1.102** 1.093** 0.709** 0.723** 0.588** 0.553** 0.789** 0.788** 0.645** 0.642** (0.182) (0.181) (0.262) (0.260) (0.162) (0.162) (0.114) (0.114) (0.142) (0.142)
Age -0.003 -0.003 -0.009 -0.008 0.009 0.009 0.007 0.006 0.012* 0.012* (0.006) (0.006) (0.008) (0.008) (0.005) (0.005) (0.004) (0.004) (0.005) (0.005)
HH income (1,000 USD) 0.004 0.004 0.004 0.004 0.004 0.004 0.004 0.004 0.006** 0.006** (0.002) (0.002) (0.004) (0.004) (0.003) (0.003) (0.002) (0.002) (0.002) (0.002)
Education 0.551** 0.518** 0.557** 0.522** 0.390** 0.310** 0.544** 0.552** 0.504** 0.488** (0.080) (0.083) (0.087) (0.092) (0.071) (0.073) (0.059) (0.063) (0.068) (0.074)
Father's Education
0.202** 0.203** -0.135 -0.125 0.157* 0.168** 0.109* 0.109* 0.125* 0.126* (0.074) (0.074) (0.093) (0.095) (0.064) (0.062) (0.049) (0.049) (0.063) (0.063)
Mother's Education
-0.035 -0.026 0.341** 0.334** 0.175* 0.172* 0.173** 0.173** 0.149* 0.147* (0.084) (0.083) (0.104) (0.105) (0.083) (0.080) (0.054) (0.054) (0.068) (0.067)
Employed -0.023 -0.030 -0.414 -0.408 0.161 0.147 -0.026 -0.027 0.011 0.012 (0.188) (0.188) (0.278) (0.277) (0.201) (0.204) (0.134) (0.134) (0.178) (0.178)
Metropolitan Area 0.843** 0.851** 0.710* 0.716* 0.585* 0.591* 0.610** 0.608** -0.010 -0.008 (0.225) (0.226) (0.308) (0.310) (0.237) (0.238) (0.183) (0.183) (0.183) (0.183)
Non-US Citizen
0.574* 0.574* 0.215 0.223
(0.262) (0.267) (0.319) (0.318)
Black*Education
0.460
0.495
0.769**
-0.080
0.156
(0.338)
(0.348)
(0.259)
(0.234)
(0.219)
Asian*Education
0.402
0.137
-0.273
0.021
(0.677)
(0.283)
(0.237)
(0.246)
Hispanic*Education
0.356
0.256
0.271
0.006
0.079
(0.425)
(0.503)
(0.220)
(0.185)
(0.179)
Constant -7.237** -7.121** -6.235** -6.126** -7.056** -6.669** -7.764** -7.800** -7.722** -7.640** (0.458) (0.461) (0.498) (0.509) (0.502) (0.499) (0.354) (0.370) (0.462) (0.484)
Unweighted N 3991 3991 1718 1718 4151 4151 12077 12077 9259 9259 Weighted N (Million) 38.54 38.54 20.16 20.16 67.14 67.14 145.00 145.00 114.90 114.90
F 19.11 15.59 11.30 9.196 14.82 11.68 29.02 23.63 22.29 17.83 Standard errors in parentheses ** p<0.01, * p<0.05

92
Table E.7 Effects of race/ethnicity, educational attainment, and their interactions on MUSEUM/GALLERY (full results)
Dependent Variable: Visit an art museum or gallery
1982 1982 1985 1985 1992 1992 2002 2002 2008 2008 Black -0.179 -0.346 -0.802* 0.288 -0.103 -0.790 -0.527** -0.400 -0.575** -0.643
(0.180) (0.524) (0.315) (0.649) (0.155) (0.552) (0.108) (0.441) (0.131) (0.679) Asian
-0.052 -1.706 0.279 0.361 -0.065 -0.408 -0.294 0.780
(0.442) (1.416) (0.284) (0.996) (0.137) (0.523) (0.189) (0.772)
Hispanic 0.365 -0.766 -0.718 1.166 -0.132 0.452 0.105 0.413 0.093 0.718 (0.298) (1.117) (0.606) (0.963) (0.188) (0.416) (0.114) (0.297) (0.127) (0.398)
Female 0.322** 0.322** 0.306* 0.298* 0.217** 0.212* 0.296** 0.298** 0.291** 0.292** (0.088) (0.088) (0.134) (0.135) (0.082) (0.083) (0.051) (0.051) (0.064) (0.064)
Age 0.005 0.005 0.000 -0.000 0.001 0.001 0.006** 0.006** -0.000 -0.000 (0.003) (0.003) (0.005) (0.005) (0.003) (0.003) (0.002) (0.002) (0.002) (0.002)
HH income (1,000 USD) 0.004** 0.004** 0.003 0.002 0.006** 0.006** 0.008** 0.008** 0.006** 0.006** (0.001) (0.001) (0.003) (0.003) (0.001) (0.001) (0.001) (0.001) (0.001) (0.001)
Education 0.597** 0.589** 0.548** 0.570** 0.559** 0.558** 0.533** 0.542** 0.542** 0.571** (0.039) (0.041) (0.063) (0.067) (0.038) (0.041) (0.026) (0.029) (0.034) (0.036)
Father's Education
0.075* 0.075* 0.088 0.078 0.063 0.064 0.121** 0.121** 0.126** 0.126** (0.038) (0.038) (0.063) (0.064) (0.035) (0.036) (0.024) (0.024) (0.029) (0.029)
Mother's Education
0.127** 0.129** 0.203** 0.216** 0.265** 0.264** 0.120** 0.121** 0.190** 0.191** (0.044) (0.044) (0.077) (0.078) (0.044) (0.044) (0.027) (0.027) (0.034) (0.034)
Employed -0.005 -0.005 0.145 0.125 0.013 0.003 0.094 0.095 0.002 -0.003 (0.099) (0.099) (0.160) (0.161) (0.104) (0.104) (0.063) (0.063) (0.079) (0.079)
Metropolitan Area 0.301** 0.302** 0.636** 0.645** 0.076 0.072 0.344** 0.343** 0.378** 0.371** (0.096) (0.096) (0.159) (0.160) (0.103) (0.103) (0.065) (0.065) (0.085) (0.086)
Non-US Citizen
0.313* 0.287* -0.144 -0.166
(0.128) (0.127) (0.161) (0.158)
Black*Education
0.043
-0.300
0.174
-0.030
0.018
(0.132)
(0.171)
(0.138)
(0.104)
(0.154)
Asian*Education
0.363
-0.019
0.075
-0.230
(0.309)
(0.236)
(0.111)
(0.161)
Hispanic*Education
0.336
-0.578
-0.154
-0.085
-0.164
(0.314)
(0.304)
(0.104)
(0.079)
(0.099)
Constant -4.678** -4.648** -4.732** -4.789** -4.483** -4.469** -4.958** -4.994** -5.090** -5.204** (0.247) (0.250) (0.412) (0.417) (0.254) (0.264) (0.170) (0.174) (0.211) (0.217)
Unweighted N 3991 3991 1717 1717 4153 4153 12068 12068 9257 9257 Weighted N (Million) 38.52 38.52 20.15 20.15 67.17 67.17 144.90 144.90 114.80 114.80
F 46.42 38.50 18.44 15.54 53.20 42.30 102.3 83.95 80.34 68.99 Standard errors in parentheses ** p<0.01, * p<0.05

93
Table E.8 Effects of race/ethnicity, educational attainment, and their interactions on CRAFTS FAIR (full results)
Dependent Variable: Visit a crafts fair or a visual arts festival
1982 1982 1985 1985 1992 1992 2002 2002 2008 2008 Black -0.998** -2.373** -1.282** -1.405* -0.694** -1.121** -0.667** -0.930** -0.824** -1.294*
(0.230) (0.795) (0.204) (0.553) (0.138) (0.426) (0.098) (0.358) (0.124) (0.535) Asian
0.111 -0.161 -1.071** -2.239* -0.690** -0.666 -0.969** -0.470
(0.422) (1.063) (0.281) (0.958) (0.135) (0.526) (0.218) (0.921)
Hispanic -0.946* -2.151 0.078 -0.154 -0.496** -0.974** -0.220* -0.234 -0.384** 0.286 (0.427) (1.360) (0.342) (1.008) (0.151) (0.363) (0.102) (0.258) (0.125) (0.330)
Female 0.859** 0.854** 0.824** 0.823** 0.668** 0.664** 0.755** 0.754** 0.653** 0.656** (0.111) (0.111) (0.108) (0.108) (0.074) (0.074) (0.048) (0.048) (0.061) (0.061)
Age -0.006 -0.006 -0.006 -0.006 0.001 0.001 0.003 0.003 0.008** 0.008** (0.003) (0.003) (0.003) (0.003) (0.003) (0.003) (0.002) (0.002) (0.002) (0.002)
HH income (1,000 USD) 0.004** 0.004** 0.010** 0.010** 0.005** 0.005** 0.006** 0.006** 0.004** 0.004** (0.002) (0.002) (0.002) (0.002) (0.001) (0.001) (0.001) (0.001) (0.001) (0.001)
Education 0.473** 0.440** 0.447** 0.442** 0.340** 0.311** 0.309** 0.304** 0.321** 0.337** (0.051) (0.052) (0.044) (0.046) (0.034) (0.037) (0.023) (0.025) (0.030) (0.031)
Father's Education
-0.055 -0.050
0.024 0.028 0.044* 0.045* 0.012 0.013 (0.051) (0.051)
(0.033) (0.033) (0.022) (0.022) (0.028) (0.028)
Mother's Education
0.119* 0.124*
0.119** 0.118** 0.085** 0.085** 0.099** 0.100** (0.059) (0.059)
(0.040) (0.040) (0.025) (0.025) (0.032) (0.032)
Employed 0.221 0.217 0.033 0.032 0.329** 0.333** 0.284** 0.284** 0.361** 0.356** (0.117) (0.116) (0.121) (0.121) (0.091) (0.092) (0.057) (0.057) (0.077) (0.077)
Metropolitan Area 0.033 0.031 -0.104 -0.102 -0.292** -0.281** 0.053 0.054 -0.016 -0.024 (0.112) (0.112) (0.114) (0.114) (0.088) (0.088) (0.057) (0.057) (0.073) (0.074)
Non-US Citizen
-0.151 -0.153 -0.389* -0.449**
(0.123) (0.125) (0.165) (0.166)
Black*Education
0.387
0.035
0.114
0.067
0.121
(0.207)
(0.155)
(0.109)
(0.088)
(0.126)
Asian*Education
0.087
0.266
-0.005
-0.105
(0.294)
(0.220)
(0.111)
(0.194)
Hispanic*Education
0.370
0.076
0.139
0.003
-0.187*
(0.421)
(0.318)
(0.101)
(0.069)
(0.084)
Constant -2.501** -2.413** -2.522** -2.499** -2.329** -2.231** -3.097** -3.076** -3.681** -3.735** (0.286) (0.288) (0.260) (0.266) (0.220) (0.225) (0.147) (0.150) (0.193) (0.196)
Unweighted N 1895 1895 2136 2136 4154 4154 12070 12070 9255 9255 Weighted N (Million) 19.51 19.51 25.63 25.63 67.19 67.19 144.80 144.80 114.70 114.70
F 24.57 19.55 31.50 23.65 39.15 30.21 70.90 56.64 48.94 41.21 Standard errors in parentheses ** p<0.01, * p<0.05
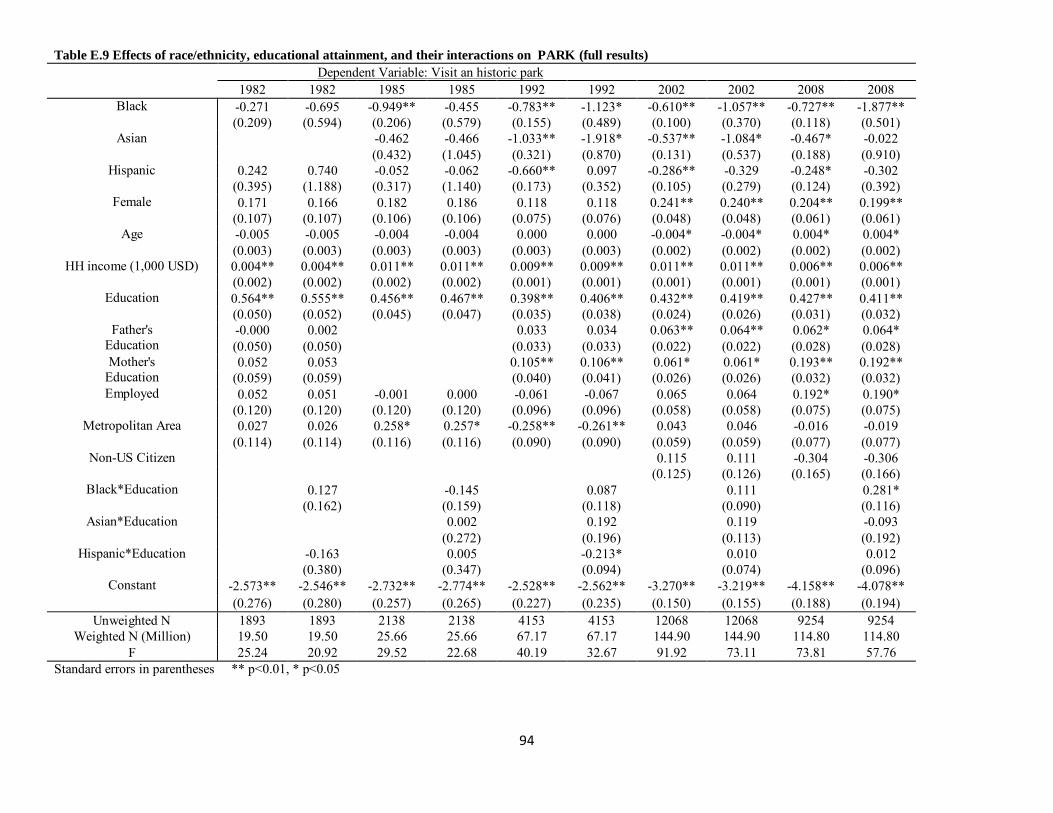
94
Table E.9 Effects of race/ethnicity, educational attainment, and their interactions on PARK (full results)
Dependent Variable: Visit an historic park
1982 1982 1985 1985 1992 1992 2002 2002 2008 2008 Black -0.271 -0.695 -0.949** -0.455 -0.783** -1.123* -0.610** -1.057** -0.727** -1.877**
(0.209) (0.594) (0.206) (0.579) (0.155) (0.489) (0.100) (0.370) (0.118) (0.501) Asian
-0.462 -0.466 -1.033** -1.918* -0.537** -1.084* -0.467* -0.022
(0.432) (1.045) (0.321) (0.870) (0.131) (0.537) (0.188) (0.910)
Hispanic 0.242 0.740 -0.052 -0.062 -0.660** 0.097 -0.286** -0.329 -0.248* -0.302 (0.395) (1.188) (0.317) (1.140) (0.173) (0.352) (0.105) (0.279) (0.124) (0.392)
Female 0.171 0.166 0.182 0.186 0.118 0.118 0.241** 0.240** 0.204** 0.199** (0.107) (0.107) (0.106) (0.106) (0.075) (0.076) (0.048) (0.048) (0.061) (0.061)
Age -0.005 -0.005 -0.004 -0.004 0.000 0.000 -0.004* -0.004* 0.004* 0.004* (0.003) (0.003) (0.003) (0.003) (0.003) (0.003) (0.002) (0.002) (0.002) (0.002)
HH income (1,000 USD) 0.004** 0.004** 0.011** 0.011** 0.009** 0.009** 0.011** 0.011** 0.006** 0.006** (0.002) (0.002) (0.002) (0.002) (0.001) (0.001) (0.001) (0.001) (0.001) (0.001)
Education 0.564** 0.555** 0.456** 0.467** 0.398** 0.406** 0.432** 0.419** 0.427** 0.411** (0.050) (0.052) (0.045) (0.047) (0.035) (0.038) (0.024) (0.026) (0.031) (0.032)
Father's Education
-0.000 0.002
0.033 0.034 0.063** 0.064** 0.062* 0.064* (0.050) (0.050)
(0.033) (0.033) (0.022) (0.022) (0.028) (0.028)
Mother's Education
0.052 0.053
0.105** 0.106** 0.061* 0.061* 0.193** 0.192** (0.059) (0.059)
(0.040) (0.041) (0.026) (0.026) (0.032) (0.032)
Employed 0.052 0.051 -0.001 0.000 -0.061 -0.067 0.065 0.064 0.192* 0.190* (0.120) (0.120) (0.120) (0.120) (0.096) (0.096) (0.058) (0.058) (0.075) (0.075)
Metropolitan Area 0.027 0.026 0.258* 0.257* -0.258** -0.261** 0.043 0.046 -0.016 -0.019 (0.114) (0.114) (0.116) (0.116) (0.090) (0.090) (0.059) (0.059) (0.077) (0.077)
Non-US Citizen
0.115 0.111 -0.304 -0.306
(0.125) (0.126) (0.165) (0.166)
Black*Education
0.127
-0.145
0.087
0.111
0.281*
(0.162)
(0.159)
(0.118)
(0.090)
(0.116)
Asian*Education
0.002
0.192
0.119
-0.093
(0.272)
(0.196)
(0.113)
(0.192)
Hispanic*Education
-0.163
0.005
-0.213*
0.010
0.012
(0.380)
(0.347)
(0.094)
(0.074)
(0.096)
Constant -2.573** -2.546** -2.732** -2.774** -2.528** -2.562** -3.270** -3.219** -4.158** -4.078** (0.276) (0.280) (0.257) (0.265) (0.227) (0.235) (0.150) (0.155) (0.188) (0.194)
Unweighted N 1893 1893 2138 2138 4153 4153 12068 12068 9254 9254 Weighted N (Million) 19.50 19.50 25.66 25.66 67.17 67.17 144.90 144.90 114.80 114.80
F 25.24 20.92 29.52 22.68 40.19 32.67 91.92 73.11 73.81 57.76 Standard errors in parentheses ** p<0.01, * p<0.05
95
Appendix F - Effects of race/ethnicity, household income, and their interactions on specific arts
participation (full results)
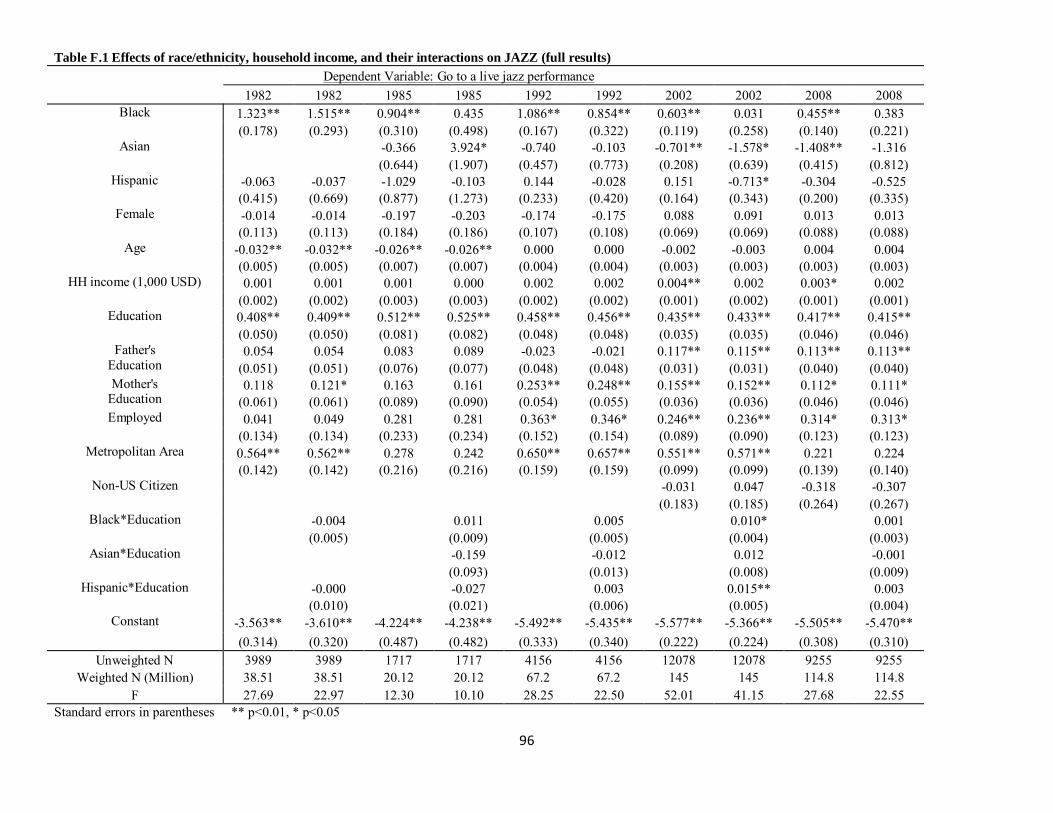
96
Table F.1 Effects of race/ethnicity, household income, and their interactions on JAZZ (full results)
Dependent Variable: Go to a live jazz performance
1982 1982 1985 1985 1992 1992 2002 2002 2008 2008 Black 1.323** 1.515** 0.904** 0.435 1.086** 0.854** 0.603** 0.031 0.455** 0.383
(0.178) (0.293) (0.310) (0.498) (0.167) (0.322) (0.119) (0.258) (0.140) (0.221) Asian
-0.366 3.924* -0.740 -0.103 -0.701** -1.578* -1.408** -1.316
(0.644) (1.907) (0.457) (0.773) (0.208) (0.639) (0.415) (0.812)
Hispanic -0.063 -0.037 -1.029 -0.103 0.144 -0.028 0.151 -0.713* -0.304 -0.525 (0.415) (0.669) (0.877) (1.273) (0.233) (0.420) (0.164) (0.343) (0.200) (0.335)
Female -0.014 -0.014 -0.197 -0.203 -0.174 -0.175 0.088 0.091 0.013 0.013 (0.113) (0.113) (0.184) (0.186) (0.107) (0.108) (0.069) (0.069) (0.088) (0.088)
Age -0.032** -0.032** -0.026** -0.026** 0.000 0.000 -0.002 -0.003 0.004 0.004 (0.005) (0.005) (0.007) (0.007) (0.004) (0.004) (0.003) (0.003) (0.003) (0.003)
HH income (1,000 USD) 0.001 0.001 0.001 0.000 0.002 0.002 0.004** 0.002 0.003* 0.002 (0.002) (0.002) (0.003) (0.003) (0.002) (0.002) (0.001) (0.002) (0.001) (0.001)
Education 0.408** 0.409** 0.512** 0.525** 0.458** 0.456** 0.435** 0.433** 0.417** 0.415** (0.050) (0.050) (0.081) (0.082) (0.048) (0.048) (0.035) (0.035) (0.046) (0.046)
Father's Education
0.054 0.054 0.083 0.089 -0.023 -0.021 0.117** 0.115** 0.113** 0.113** (0.051) (0.051) (0.076) (0.077) (0.048) (0.048) (0.031) (0.031) (0.040) (0.040)
Mother's Education
0.118 0.121* 0.163 0.161 0.253** 0.248** 0.155** 0.152** 0.112* 0.111* (0.061) (0.061) (0.089) (0.090) (0.054) (0.055) (0.036) (0.036) (0.046) (0.046)
Employed 0.041 0.049 0.281 0.281 0.363* 0.346* 0.246** 0.236** 0.314* 0.313* (0.134) (0.134) (0.233) (0.234) (0.152) (0.154) (0.089) (0.090) (0.123) (0.123)
Metropolitan Area 0.564** 0.562** 0.278 0.242 0.650** 0.657** 0.551** 0.571** 0.221 0.224 (0.142) (0.142) (0.216) (0.216) (0.159) (0.159) (0.099) (0.099) (0.139) (0.140)
Non-US Citizen
-0.031 0.047 -0.318 -0.307
(0.183) (0.185) (0.264) (0.267)
Black*Education
-0.004
0.011
0.005
0.010*
0.001
(0.005)
(0.009)
(0.005)
(0.004)
(0.003)
Asian*Education
-0.159
-0.012
0.012
-0.001
(0.093)
(0.013)
(0.008)
(0.009)
Hispanic*Education
-0.000
-0.027
0.003
0.015**
0.003
(0.010)
(0.021)
(0.006)
(0.005)
(0.004)
Constant -3.563** -3.610** -4.224** -4.238** -5.492** -5.435** -5.577** -5.366** -5.505** -5.470** (0.314) (0.320) (0.487) (0.482) (0.333) (0.340) (0.222) (0.224) (0.308) (0.310)
Unweighted N 3989 3989 1717 1717 4156 4156 12078 12078 9255 9255 Weighted N (Million) 38.51 38.51 20.12 20.12 67.2 67.2 145 145 114.8 114.8
F 27.69 22.97 12.30 10.10 28.25 22.50 52.01 41.15 27.68 22.55 Standard errors in parentheses ** p<0.01, * p<0.05
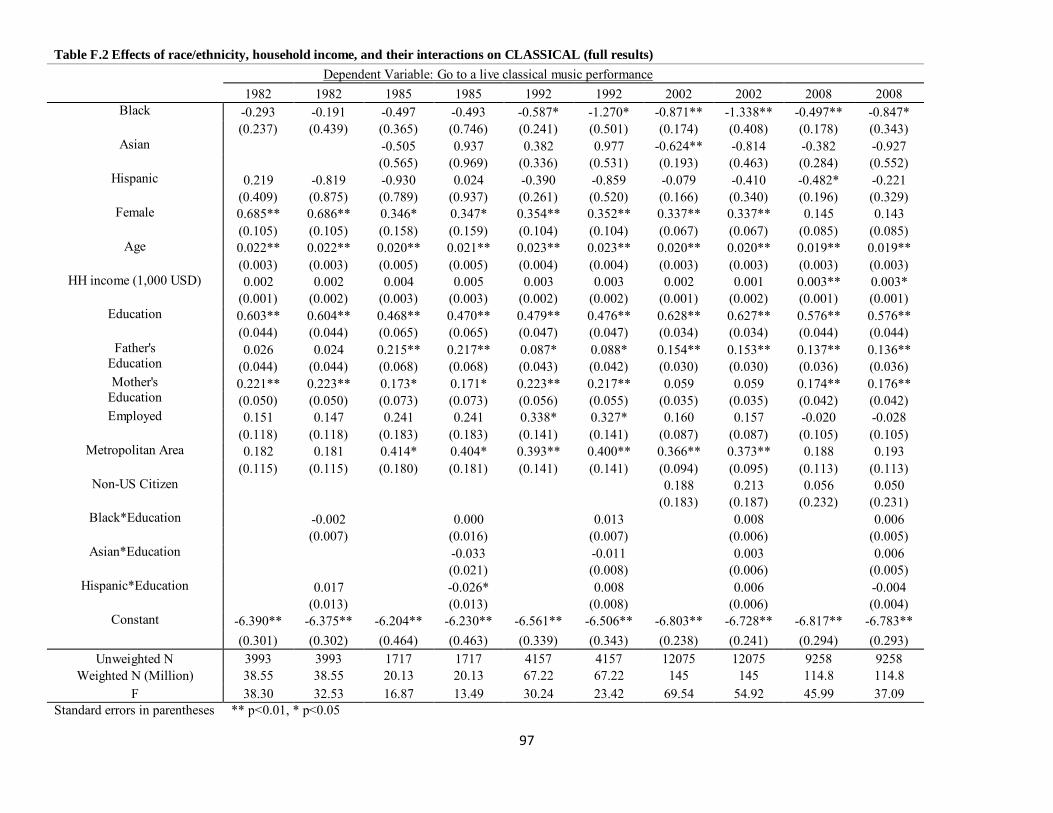
97
Table F.2 Effects of race/ethnicity, household income, and their interactions on CLASSICAL (full results)
Dependent Variable: Go to a live classical music performance
1982 1982 1985 1985 1992 1992 2002 2002 2008 2008 Black -0.293 -0.191 -0.497 -0.493 -0.587* -1.270* -0.871** -1.338** -0.497** -0.847*
(0.237) (0.439) (0.365) (0.746) (0.241) (0.501) (0.174) (0.408) (0.178) (0.343) Asian
-0.505 0.937 0.382 0.977 -0.624** -0.814 -0.382 -0.927
(0.565) (0.969) (0.336) (0.531) (0.193) (0.463) (0.284) (0.552)
Hispanic 0.219 -0.819 -0.930 0.024 -0.390 -0.859 -0.079 -0.410 -0.482* -0.221 (0.409) (0.875) (0.789) (0.937) (0.261) (0.520) (0.166) (0.340) (0.196) (0.329)
Female 0.685** 0.686** 0.346* 0.347* 0.354** 0.352** 0.337** 0.337** 0.145 0.143 (0.105) (0.105) (0.158) (0.159) (0.104) (0.104) (0.067) (0.067) (0.085) (0.085)
Age 0.022** 0.022** 0.020** 0.021** 0.023** 0.023** 0.020** 0.020** 0.019** 0.019** (0.003) (0.003) (0.005) (0.005) (0.004) (0.004) (0.003) (0.003) (0.003) (0.003)
HH income (1,000 USD) 0.002 0.002 0.004 0.005 0.003 0.003 0.002 0.001 0.003** 0.003* (0.001) (0.002) (0.003) (0.003) (0.002) (0.002) (0.001) (0.002) (0.001) (0.001)
Education 0.603** 0.604** 0.468** 0.470** 0.479** 0.476** 0.628** 0.627** 0.576** 0.576** (0.044) (0.044) (0.065) (0.065) (0.047) (0.047) (0.034) (0.034) (0.044) (0.044)
Father's Education
0.026 0.024 0.215** 0.217** 0.087* 0.088* 0.154** 0.153** 0.137** 0.136** (0.044) (0.044) (0.068) (0.068) (0.043) (0.042) (0.030) (0.030) (0.036) (0.036)
Mother's Education
0.221** 0.223** 0.173* 0.171* 0.223** 0.217** 0.059 0.059 0.174** 0.176** (0.050) (0.050) (0.073) (0.073) (0.056) (0.055) (0.035) (0.035) (0.042) (0.042)
Employed 0.151 0.147 0.241 0.241 0.338* 0.327* 0.160 0.157 -0.020 -0.028 (0.118) (0.118) (0.183) (0.183) (0.141) (0.141) (0.087) (0.087) (0.105) (0.105)
Metropolitan Area 0.182 0.181 0.414* 0.404* 0.393** 0.400** 0.366** 0.373** 0.188 0.193 (0.115) (0.115) (0.180) (0.181) (0.141) (0.141) (0.094) (0.095) (0.113) (0.113)
Non-US Citizen
0.188 0.213 0.056 0.050
(0.183) (0.187) (0.232) (0.231)
Black*Education
-0.002
0.000
0.013
0.008
0.006
(0.007)
(0.016)
(0.007)
(0.006)
(0.005)
Asian*Education
-0.033
-0.011
0.003
0.006
(0.021)
(0.008)
(0.006)
(0.005)
Hispanic*Education
0.017
-0.026*
0.008
0.006
-0.004
(0.013)
(0.013)
(0.008)
(0.006)
(0.004)
Constant -6.390** -6.375** -6.204** -6.230** -6.561** -6.506** -6.803** -6.728** -6.817** -6.783** (0.301) (0.302) (0.464) (0.463) (0.339) (0.343) (0.238) (0.241) (0.294) (0.293)
Unweighted N 3993 3993 1717 1717 4157 4157 12075 12075 9258 9258 Weighted N (Million) 38.55 38.55 20.13 20.13 67.22 67.22 145 145 114.8 114.8
F 38.30 32.53 16.87 13.49 30.24 23.42 69.54 54.92 45.99 37.09 Standard errors in parentheses ** p<0.01, * p<0.05

98
Table F.3 Effects of race/ethnicity, household income, and their interactions on OPERA (full results)
Dependent Variable: Go to a live opera
1982 1982 1985 1985 1992 1992 2002 2002 2008 2008 Black -0.678 -2.209 0.022 -0.731 0.201 0.198 -0.707* -0.797 -0.533 -0.711
(0.655) (1.678) (0.640) (1.461) (0.374) (1.023) (0.331) (0.840) (0.401) (0.605) Asian
0.539 0.572 0.760 0.599 -0.777* 0.316 -0.775 0.268
(0.782) (3.002) (0.487) (1.030) (0.322) (0.660) (0.527) (0.995)
Hispanic 0.321 0.044 0.251 0.992 0.423 0.538 0.133 -0.494 0.141 0.638 (0.742) (1.557) (1.054) (1.177) (0.392) (0.695) (0.295) (0.582) (0.358) (0.670)
Female 0.699** 0.696** 0.703* 0.695* 0.264 0.266 0.410** 0.409** 0.322* 0.326* (0.212) (0.212) (0.295) (0.294) (0.190) (0.190) (0.120) (0.120) (0.162) (0.163)
Age 0.022** 0.022** 0.025** 0.025** 0.022** 0.022** 0.012** 0.012** 0.017** 0.017** (0.006) (0.006) (0.008) (0.008) (0.007) (0.007) (0.004) (0.004) (0.006) (0.006)
HH income (1,000 USD) 0.000 -0.001 0.008 0.007 0.009** 0.009* 0.004 0.004 0.005** 0.006** (0.003) (0.003) (0.006) (0.006) (0.003) (0.004) (0.003) (0.003) (0.002) (0.002)
Education 0.492** 0.491** 0.391** 0.398** 0.397** 0.397** 0.609** 0.603** 0.670** 0.670** (0.090) (0.090) (0.104) (0.105) (0.086) (0.085) (0.063) (0.063) (0.097) (0.096)
Father's Education
-0.040 -0.038 0.102 0.106 0.119 0.120 0.194** 0.194** 0.088 0.088 (0.085) (0.086) (0.141) (0.141) (0.076) (0.075) (0.051) (0.051) (0.073) (0.073)
Mother's Education
0.165 0.160 -0.002 -0.007 0.173 0.174 0.072 0.067 0.192* 0.197* (0.099) (0.100) (0.135) (0.134) (0.092) (0.092) (0.058) (0.058) (0.080) (0.081)
Employed 0.279 0.268 0.532 0.525 0.219 0.221 -0.032 -0.028 -0.177 -0.172 (0.241) (0.241) (0.360) (0.361) (0.274) (0.272) (0.144) (0.144) (0.205) (0.204)
Metropolitan Area 0.290 0.297 -0.158 -0.161 0.956** 0.957** 0.621** 0.620** 0.040 0.029 (0.256) (0.254) (0.314) (0.317) (0.329) (0.328) (0.196) (0.197) (0.216) (0.216)
Non-US Citizen
0.986** 0.997** -0.152 -0.195
(0.244) (0.249) (0.453) (0.463)
Black*Education
0.023
0.014
0.000
0.001
0.003
(0.020)
(0.024)
(0.015)
(0.013)
(0.007)
Asian*Education
-0.001
0.002
-0.018
-0.012
(0.053)
(0.013)
(0.011)
(0.011)
Hispanic*Education
0.005
-0.021
-0.002
0.011
-0.007
(0.025)
(0.012)
(0.009)
(0.008)
(0.008)
Constant -7.576** -7.487** -7.334** -7.300** -8.467** -8.473** -8.425** -8.379** -8.832** -8.919** (0.570) (0.566) (0.781) (0.777) (0.676) (0.676) (0.416) (0.415) (0.555) (0.546)
Unweighted N 3991 3991 1715 1715 4157 4157 12079 12079 9262 9262 Weighted N (Million) 38.53 38.53 20.11 20.11 67.22 67.22 145 145 114.9 114.9
F 9.459 7.422 4.488 3.450 12.92 10.94 29.81 24.32 15.34 13.26 Standard errors in parentheses ** p<0.01, * p<0.05
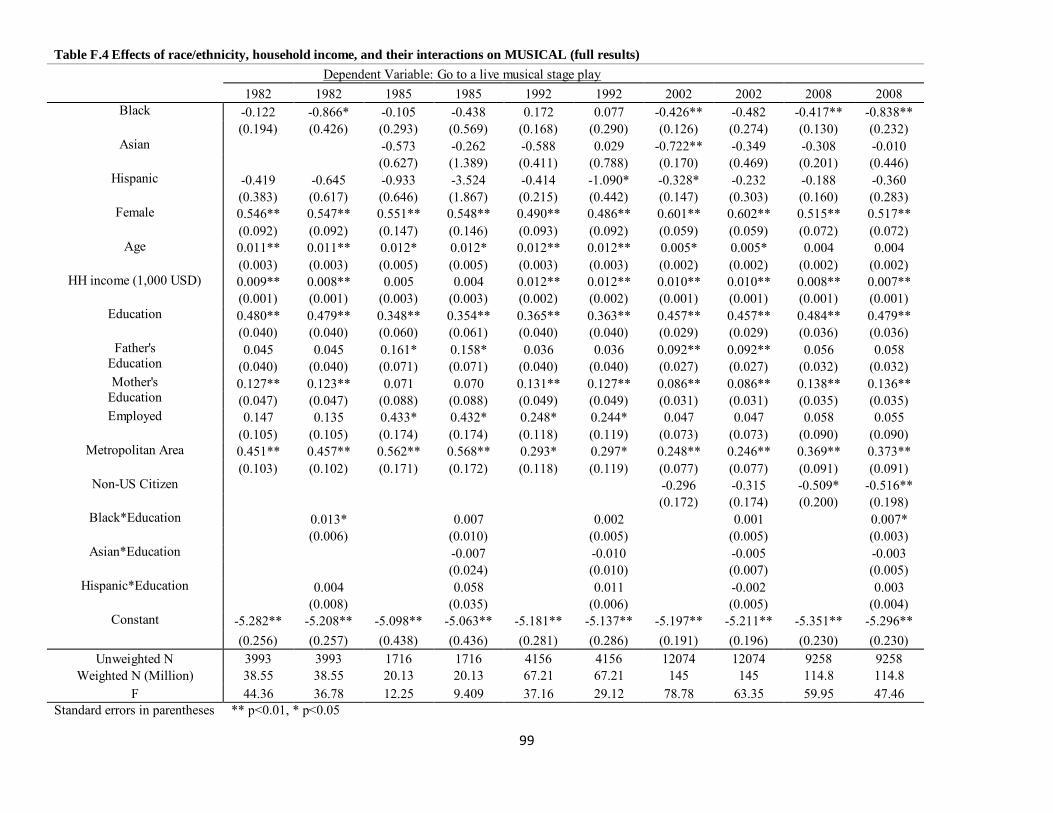
99
Table F.4 Effects of race/ethnicity, household income, and their interactions on MUSICAL (full results)
Dependent Variable: Go to a live musical stage play
1982 1982 1985 1985 1992 1992 2002 2002 2008 2008 Black -0.122 -0.866* -0.105 -0.438 0.172 0.077 -0.426** -0.482 -0.417** -0.838**
(0.194) (0.426) (0.293) (0.569) (0.168) (0.290) (0.126) (0.274) (0.130) (0.232) Asian
-0.573 -0.262 -0.588 0.029 -0.722** -0.349 -0.308 -0.010
(0.627) (1.389) (0.411) (0.788) (0.170) (0.469) (0.201) (0.446)
Hispanic -0.419 -0.645 -0.933 -3.524 -0.414 -1.090* -0.328* -0.232 -0.188 -0.360 (0.383) (0.617) (0.646) (1.867) (0.215) (0.442) (0.147) (0.303) (0.160) (0.283)
Female 0.546** 0.547** 0.551** 0.548** 0.490** 0.486** 0.601** 0.602** 0.515** 0.517** (0.092) (0.092) (0.147) (0.146) (0.093) (0.092) (0.059) (0.059) (0.072) (0.072)
Age 0.011** 0.011** 0.012* 0.012* 0.012** 0.012** 0.005* 0.005* 0.004 0.004 (0.003) (0.003) (0.005) (0.005) (0.003) (0.003) (0.002) (0.002) (0.002) (0.002)
HH income (1,000 USD) 0.009** 0.008** 0.005 0.004 0.012** 0.012** 0.010** 0.010** 0.008** 0.007** (0.001) (0.001) (0.003) (0.003) (0.002) (0.002) (0.001) (0.001) (0.001) (0.001)
Education 0.480** 0.479** 0.348** 0.354** 0.365** 0.363** 0.457** 0.457** 0.484** 0.479** (0.040) (0.040) (0.060) (0.061) (0.040) (0.040) (0.029) (0.029) (0.036) (0.036)
Father's Education
0.045 0.045 0.161* 0.158* 0.036 0.036 0.092** 0.092** 0.056 0.058 (0.040) (0.040) (0.071) (0.071) (0.040) (0.040) (0.027) (0.027) (0.032) (0.032)
Mother's Education
0.127** 0.123** 0.071 0.070 0.131** 0.127** 0.086** 0.086** 0.138** 0.136** (0.047) (0.047) (0.088) (0.088) (0.049) (0.049) (0.031) (0.031) (0.035) (0.035)
Employed 0.147 0.135 0.433* 0.432* 0.248* 0.244* 0.047 0.047 0.058 0.055 (0.105) (0.105) (0.174) (0.174) (0.118) (0.119) (0.073) (0.073) (0.090) (0.090)
Metropolitan Area 0.451** 0.457** 0.562** 0.568** 0.293* 0.297* 0.248** 0.246** 0.369** 0.373** (0.103) (0.102) (0.171) (0.172) (0.118) (0.119) (0.077) (0.077) (0.091) (0.091)
Non-US Citizen
-0.296 -0.315 -0.509* -0.516**
(0.172) (0.174) (0.200) (0.198)
Black*Education
0.013*
0.007
0.002
0.001
0.007*
(0.006)
(0.010)
(0.005)
(0.005)
(0.003)
Asian*Education
-0.007
-0.010
-0.005
-0.003
(0.024)
(0.010)
(0.007)
(0.005)
Hispanic*Education
0.004
0.058
0.011
-0.002
0.003
(0.008)
(0.035)
(0.006)
(0.005)
(0.004)
Constant -5.282** -5.208** -5.098** -5.063** -5.181** -5.137** -5.197** -5.211** -5.351** -5.296** (0.256) (0.257) (0.438) (0.436) (0.281) (0.286) (0.191) (0.196) (0.230) (0.230)
Unweighted N 3993 3993 1716 1716 4156 4156 12074 12074 9258 9258 Weighted N (Million) 38.55 38.55 20.13 20.13 67.21 67.21 145 145 114.8 114.8
F 44.36 36.78 12.25 9.409 37.16 29.12 78.78 63.35 59.95 47.46 Standard errors in parentheses ** p<0.01, * p<0.05

100
Table F.5 Effects of race/ethnicity, household income, and their interactions on PLAY (full results)
Dependent Variable: Go to a live performance of a nonmusical stage play
1982 1982 1985 1985 1992 1992 2002 2002 2008 2008 Black -0.427 -1.088 -0.410 -1.689* 0.415* 0.337 -0.431** -0.045 -0.283 -0.218
(0.251) (0.568) (0.413) (0.773) (0.175) (0.326) (0.144) (0.312) (0.167) (0.291) Asian
-0.476 -0.474 -0.486 0.707 -0.546** -0.086 -0.639* -0.802
(0.613) (1.708) (0.461) (0.646) (0.193) (0.514) (0.275) (0.593)
Hispanic -0.479 -0.486 -1.012 -0.336 0.097 0.021 0.038 -0.042 -0.154 -0.374 (0.550) (0.753) (0.787) (0.922) (0.218) (0.395) (0.151) (0.346) (0.199) (0.380)
Female 0.458** 0.458** 0.287 0.276 0.381** 0.385** 0.504** 0.503** 0.536** 0.535** (0.110) (0.110) (0.152) (0.153) (0.103) (0.103) (0.066) (0.066) (0.086) (0.086)
Age 0.014** 0.014** 0.009 0.009 0.014** 0.014** 0.005 0.005 0.008* 0.007* (0.004) (0.004) (0.005) (0.005) (0.004) (0.004) (0.003) (0.003) (0.003) (0.003)
HH income (1,000 USD) 0.007** 0.006** -0.000 -0.002 0.005** 0.005** 0.009** 0.010** 0.005** 0.005** (0.002) (0.002) (0.003) (0.003) (0.002) (0.002) (0.001) (0.001) (0.001) (0.001)
Education 0.564** 0.564** 0.466** 0.476** 0.534** 0.534** 0.496** 0.496** 0.527** 0.528** (0.048) (0.048) (0.072) (0.073) (0.046) (0.045) (0.034) (0.034) (0.045) (0.045)
Father's Education
0.111* 0.112* 0.160* 0.167* 0.053 0.053 0.095** 0.095** 0.075* 0.075* (0.044) (0.045) (0.065) (0.065) (0.043) (0.043) (0.030) (0.030) (0.038) (0.038)
Mother's Education
0.075 0.072 0.073 0.068 0.110* 0.107* 0.106** 0.105** 0.164** 0.162** (0.054) (0.054) (0.073) (0.072) (0.051) (0.051) (0.035) (0.035) (0.041) (0.042)
Employed 0.173 0.167 0.257 0.246 0.114 0.112 0.045 0.049 -0.019 -0.020 (0.129) (0.129) (0.179) (0.180) (0.132) (0.132) (0.085) (0.084) (0.101) (0.101)
Metropolitan Area 0.236* 0.241* 0.179 0.171 0.300* 0.301* 0.246** 0.242** 0.278* 0.281* (0.118) (0.118) (0.176) (0.178) (0.138) (0.137) (0.090) (0.090) (0.117) (0.117)
Non-US Citizen
-0.260 -0.264 -0.798** -0.786**
(0.185) (0.188) (0.282) (0.284)
Black*Education
0.011
0.026*
0.002
-0.007
-0.001
(0.007)
(0.012)
(0.005)
(0.005)
(0.004)
Asian*Education
-0.000
-0.024**
-0.006
0.002
(0.032)
(0.009)
(0.007)
(0.005)
Hispanic*Education
-0.000
-0.020
0.001
0.002
0.003
(0.009)
(0.013)
(0.006)
(0.005)
(0.004)
Constant -6.044** -5.996** -4.958** -4.908** -5.818** -5.837** -5.786** -5.833** -6.278** -6.258** (0.300) (0.302) (0.470) (0.467) (0.338) (0.338) (0.220) (0.225) (0.280) (0.281)
Unweighted N 3992 3992 1718 1718 4155 4155 12074 12074 9256 9256 Weighted N (Million) 38.54 38.54 20.16 20.16 67.21 67.21 144.9 144.9 114.8 114.8
F 37.43 30.62 9.252 7.270 28.49 22.96 62.60 51.09 41.48 33.31 Standard errors in parentheses ** p<0.01, * p<0.05

101
Table F.6 Effects of race/ethnicity, household income, and their interactions on BALLET (full results)
Dependent Variable: Go to a live ballet performance
1982 1982 1985 1985 1992 1992 2002 2002 2008 2008 Black -0.270 -0.415 -0.627 -1.425 -0.044 -0.561 -0.846** -0.920 -0.644* -0.851
(0.388) (0.765) (0.667) (1.195) (0.329) (0.626) (0.291) (0.666) (0.316) (0.552) Asian
0.008 2.896** 0.567 1.847* -1.138** -0.960 -1.051* -0.288
(0.694) (0.985) (0.514) (0.796) (0.346) (0.821) (0.441) (0.830)
Hispanic 0.388 -2.804* 0.502 -1.355 0.111 -0.396 -0.359 -0.193 0.075 -0.840 (0.527) (1.101) (1.064) (1.288) (0.328) (0.756) (0.258) (0.542) (0.277) (0.555)
Female 1.102** 1.107** 0.709** 0.706** 0.588** 0.587** 0.789** 0.790** 0.645** 0.648** (0.182) (0.182) (0.262) (0.262) (0.162) (0.160) (0.114) (0.114) (0.142) (0.142)
Age -0.003 -0.004 -0.009 -0.009 0.009 0.009 0.007 0.007 0.012* 0.011* (0.006) (0.006) (0.008) (0.008) (0.005) (0.005) (0.004) (0.004) (0.005) (0.005)
HH income (1,000 USD) 0.004 0.004 0.004 0.003 0.004 0.004 0.004 0.004 0.006** 0.005** (0.002) (0.002) (0.004) (0.004) (0.003) (0.003) (0.002) (0.002) (0.002) (0.002)
Education 0.551** 0.550** 0.557** 0.577** 0.390** 0.387** 0.544** 0.544** 0.504** 0.497** (0.080) (0.080) (0.087) (0.090) (0.071) (0.072) (0.059) (0.059) (0.068) (0.068)
Father's Education
0.202** 0.192** -0.135 -0.147 0.157* 0.157* 0.109* 0.109* 0.125* 0.126* (0.074) (0.074) (0.093) (0.093) (0.064) (0.064) (0.049) (0.049) (0.063) (0.063)
Mother's Education
-0.035 -0.030 0.341** 0.349** 0.175* 0.164* 0.173** 0.173** 0.149* 0.140* (0.084) (0.084) (0.104) (0.106) (0.083) (0.080) (0.054) (0.054) (0.068) (0.068)
Employed -0.023 -0.047 -0.414 -0.412 0.161 0.151 -0.026 -0.025 0.011 0.017 (0.188) (0.189) (0.278) (0.275) (0.201) (0.199) (0.134) (0.134) (0.178) (0.179)
Metropolitan Area 0.843** 0.843** 0.710* 0.700* 0.585* 0.589* 0.610** 0.608** -0.010 -0.003 (0.225) (0.226) (0.308) (0.310) (0.237) (0.237) (0.183) (0.184) (0.183) (0.184)
Non-US Citizen
0.574* 0.558* 0.215 0.260
(0.262) (0.271) (0.319) (0.321)
Black*Education
0.002
0.016
0.010
0.001
0.003
(0.010)
(0.022)
(0.009)
(0.011)
(0.007)
Asian*Education
-0.098*
-0.028
-0.002
-0.009
(0.049)
(0.016)
(0.011)
(0.009)
Hispanic*Education
0.042**
0.046*
0.008
-0.003
0.012
(0.016)
(0.021)
(0.010)
(0.009)
(0.006)
Constant -7.237** -7.129** -6.235** -6.261** -7.056** -7.023** -7.764** -7.783** -7.722** -7.604** (0.458) (0.461) (0.498) (0.508) (0.502) (0.509) (0.354) (0.361) (0.462) (0.461)
Unweighted N 3991 3991 1718 1718 4151 4151 12077 12077 9259 9259 Weighted N (Million) 38.54 38.54 20.16 20.16 67.14 67.14 145 145 114.9 114.9
F 19.11 16.35 11.30 9.361 14.82 11.63 29.02 23.40 22.29 17.55 Standard errors in parentheses ** p<0.01, * p<0.05
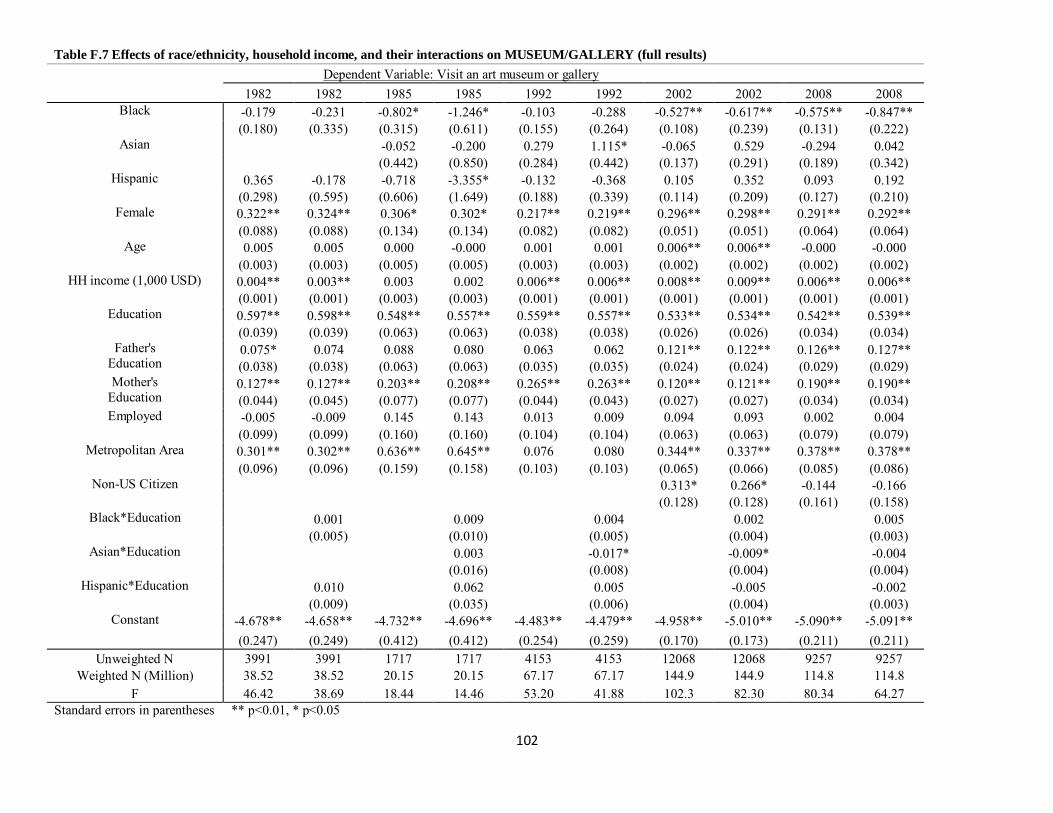
102
Table F.7 Effects of race/ethnicity, household income, and their interactions on MUSEUM/GALLERY (full results)
Dependent Variable: Visit an art museum or gallery
1982 1982 1985 1985 1992 1992 2002 2002 2008 2008 Black -0.179 -0.231 -0.802* -1.246* -0.103 -0.288 -0.527** -0.617** -0.575** -0.847**
(0.180) (0.335) (0.315) (0.611) (0.155) (0.264) (0.108) (0.239) (0.131) (0.222) Asian
-0.052 -0.200 0.279 1.115* -0.065 0.529 -0.294 0.042
(0.442) (0.850) (0.284) (0.442) (0.137) (0.291) (0.189) (0.342)
Hispanic 0.365 -0.178 -0.718 -3.355* -0.132 -0.368 0.105 0.352 0.093 0.192 (0.298) (0.595) (0.606) (1.649) (0.188) (0.339) (0.114) (0.209) (0.127) (0.210)
Female 0.322** 0.324** 0.306* 0.302* 0.217** 0.219** 0.296** 0.298** 0.291** 0.292** (0.088) (0.088) (0.134) (0.134) (0.082) (0.082) (0.051) (0.051) (0.064) (0.064)
Age 0.005 0.005 0.000 -0.000 0.001 0.001 0.006** 0.006** -0.000 -0.000 (0.003) (0.003) (0.005) (0.005) (0.003) (0.003) (0.002) (0.002) (0.002) (0.002)
HH income (1,000 USD) 0.004** 0.003** 0.003 0.002 0.006** 0.006** 0.008** 0.009** 0.006** 0.006** (0.001) (0.001) (0.003) (0.003) (0.001) (0.001) (0.001) (0.001) (0.001) (0.001)
Education 0.597** 0.598** 0.548** 0.557** 0.559** 0.557** 0.533** 0.534** 0.542** 0.539** (0.039) (0.039) (0.063) (0.063) (0.038) (0.038) (0.026) (0.026) (0.034) (0.034)
Father's Education
0.075* 0.074 0.088 0.080 0.063 0.062 0.121** 0.122** 0.126** 0.127** (0.038) (0.038) (0.063) (0.063) (0.035) (0.035) (0.024) (0.024) (0.029) (0.029)
Mother's Education
0.127** 0.127** 0.203** 0.208** 0.265** 0.263** 0.120** 0.121** 0.190** 0.190** (0.044) (0.045) (0.077) (0.077) (0.044) (0.043) (0.027) (0.027) (0.034) (0.034)
Employed -0.005 -0.009 0.145 0.143 0.013 0.009 0.094 0.093 0.002 0.004 (0.099) (0.099) (0.160) (0.160) (0.104) (0.104) (0.063) (0.063) (0.079) (0.079)
Metropolitan Area 0.301** 0.302** 0.636** 0.645** 0.076 0.080 0.344** 0.337** 0.378** 0.378** (0.096) (0.096) (0.159) (0.158) (0.103) (0.103) (0.065) (0.066) (0.085) (0.086)
Non-US Citizen
0.313* 0.266* -0.144 -0.166
(0.128) (0.128) (0.161) (0.158)
Black*Education
0.001
0.009
0.004
0.002
0.005
(0.005)
(0.010)
(0.005)
(0.004)
(0.003)
Asian*Education
0.003
-0.017*
-0.009*
-0.004
(0.016)
(0.008)
(0.004)
(0.004)
Hispanic*Education
0.010
0.062
0.005
-0.005
-0.002
(0.009)
(0.035)
(0.006)
(0.004)
(0.003)
Constant -4.678** -4.658** -4.732** -4.696** -4.483** -4.479** -4.958** -5.010** -5.090** -5.091** (0.247) (0.249) (0.412) (0.412) (0.254) (0.259) (0.170) (0.173) (0.211) (0.211)
Unweighted N 3991 3991 1717 1717 4153 4153 12068 12068 9257 9257 Weighted N (Million) 38.52 38.52 20.15 20.15 67.17 67.17 144.9 144.9 114.8 114.8
F 46.42 38.69 18.44 14.46 53.20 41.88 102.3 82.30 80.34 64.27 Standard errors in parentheses ** p<0.01, * p<0.05
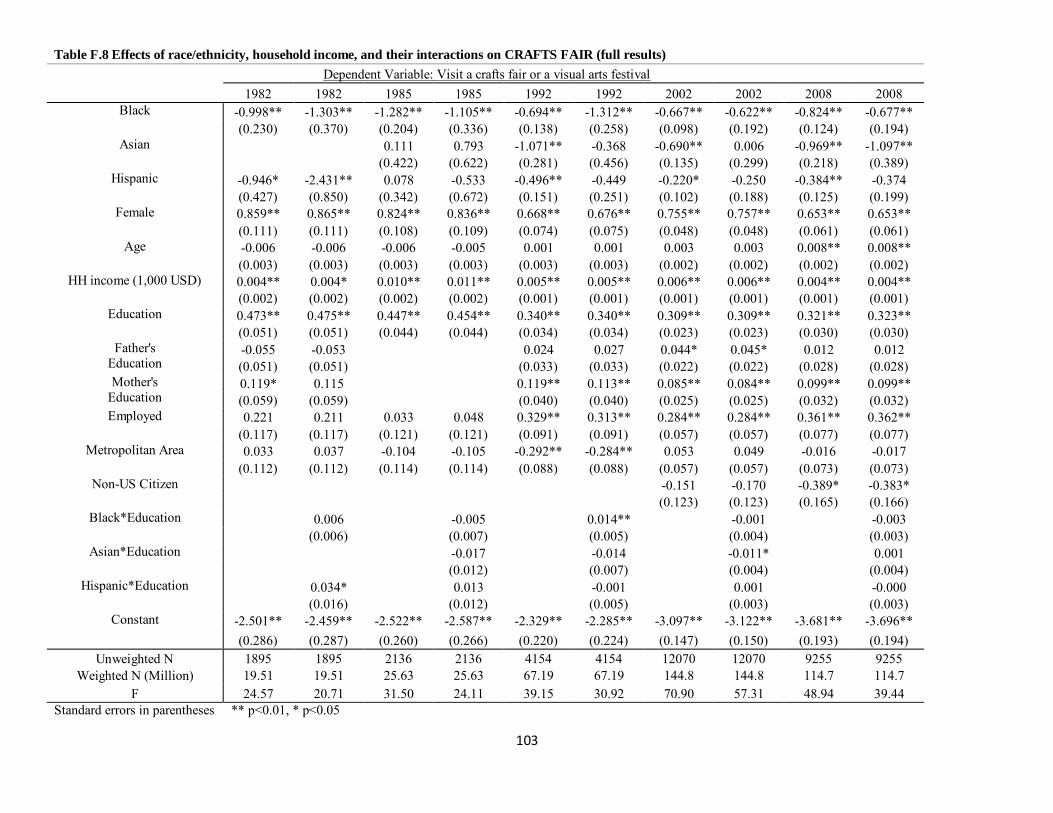
103
Table F.8 Effects of race/ethnicity, household income, and their interactions on CRAFTS FAIR (full results)
Dependent Variable: Visit a crafts fair or a visual arts festival
1982 1982 1985 1985 1992 1992 2002 2002 2008 2008 Black -0.998** -1.303** -1.282** -1.105** -0.694** -1.312** -0.667** -0.622** -0.824** -0.677**
(0.230) (0.370) (0.204) (0.336) (0.138) (0.258) (0.098) (0.192) (0.124) (0.194) Asian
0.111 0.793 -1.071** -0.368 -0.690** 0.006 -0.969** -1.097**
(0.422) (0.622) (0.281) (0.456) (0.135) (0.299) (0.218) (0.389)
Hispanic -0.946* -2.431** 0.078 -0.533 -0.496** -0.449 -0.220* -0.250 -0.384** -0.374 (0.427) (0.850) (0.342) (0.672) (0.151) (0.251) (0.102) (0.188) (0.125) (0.199)
Female 0.859** 0.865** 0.824** 0.836** 0.668** 0.676** 0.755** 0.757** 0.653** 0.653** (0.111) (0.111) (0.108) (0.109) (0.074) (0.075) (0.048) (0.048) (0.061) (0.061)
Age -0.006 -0.006 -0.006 -0.005 0.001 0.001 0.003 0.003 0.008** 0.008** (0.003) (0.003) (0.003) (0.003) (0.003) (0.003) (0.002) (0.002) (0.002) (0.002)
HH income (1,000 USD) 0.004** 0.004* 0.010** 0.011** 0.005** 0.005** 0.006** 0.006** 0.004** 0.004** (0.002) (0.002) (0.002) (0.002) (0.001) (0.001) (0.001) (0.001) (0.001) (0.001)
Education 0.473** 0.475** 0.447** 0.454** 0.340** 0.340** 0.309** 0.309** 0.321** 0.323** (0.051) (0.051) (0.044) (0.044) (0.034) (0.034) (0.023) (0.023) (0.030) (0.030)
Father's Education
-0.055 -0.053
0.024 0.027 0.044* 0.045* 0.012 0.012 (0.051) (0.051)
(0.033) (0.033) (0.022) (0.022) (0.028) (0.028)
Mother's Education
0.119* 0.115
0.119** 0.113** 0.085** 0.084** 0.099** 0.099** (0.059) (0.059)
(0.040) (0.040) (0.025) (0.025) (0.032) (0.032)
Employed 0.221 0.211 0.033 0.048 0.329** 0.313** 0.284** 0.284** 0.361** 0.362** (0.117) (0.117) (0.121) (0.121) (0.091) (0.091) (0.057) (0.057) (0.077) (0.077)
Metropolitan Area 0.033 0.037 -0.104 -0.105 -0.292** -0.284** 0.053 0.049 -0.016 -0.017 (0.112) (0.112) (0.114) (0.114) (0.088) (0.088) (0.057) (0.057) (0.073) (0.073)
Non-US Citizen
-0.151 -0.170 -0.389* -0.383*
(0.123) (0.123) (0.165) (0.166)
Black*Education
0.006
-0.005
0.014**
-0.001
-0.003
(0.006)
(0.007)
(0.005)
(0.004)
(0.003)
Asian*Education
-0.017
-0.014
-0.011*
0.001
(0.012)
(0.007)
(0.004)
(0.004)
Hispanic*Education
0.034*
0.013
-0.001
0.001
-0.000
(0.016)
(0.012)
(0.005)
(0.003)
(0.003)
Constant -2.501** -2.459** -2.522** -2.587** -2.329** -2.285** -3.097** -3.122** -3.681** -3.696** (0.286) (0.287) (0.260) (0.266) (0.220) (0.224) (0.147) (0.150) (0.193) (0.194)
Unweighted N 1895 1895 2136 2136 4154 4154 12070 12070 9255 9255 Weighted N (Million) 19.51 19.51 25.63 25.63 67.19 67.19 144.8 144.8 114.7 114.7
F 24.57 20.71 31.50 24.11 39.15 30.92 70.90 57.31 48.94 39.44 Standard errors in parentheses ** p<0.01, * p<0.05
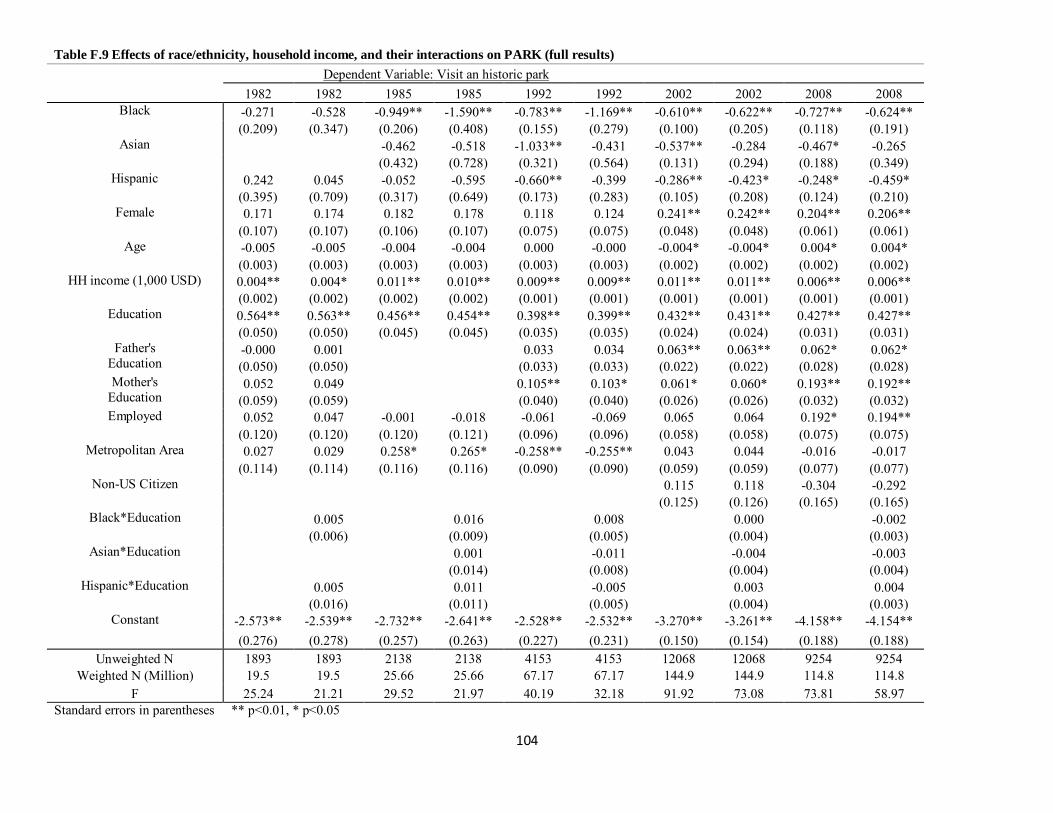
104
Table F.9 Effects of race/ethnicity, household income, and their interactions on PARK (full results)
Dependent Variable: Visit an historic park
1982 1982 1985 1985 1992 1992 2002 2002 2008 2008 Black -0.271 -0.528 -0.949** -1.590** -0.783** -1.169** -0.610** -0.622** -0.727** -0.624**
(0.209) (0.347) (0.206) (0.408) (0.155) (0.279) (0.100) (0.205) (0.118) (0.191) Asian
-0.462 -0.518 -1.033** -0.431 -0.537** -0.284 -0.467* -0.265
(0.432) (0.728) (0.321) (0.564) (0.131) (0.294) (0.188) (0.349)
Hispanic 0.242 0.045 -0.052 -0.595 -0.660** -0.399 -0.286** -0.423* -0.248* -0.459* (0.395) (0.709) (0.317) (0.649) (0.173) (0.283) (0.105) (0.208) (0.124) (0.210)
Female 0.171 0.174 0.182 0.178 0.118 0.124 0.241** 0.242** 0.204** 0.206** (0.107) (0.107) (0.106) (0.107) (0.075) (0.075) (0.048) (0.048) (0.061) (0.061)
Age -0.005 -0.005 -0.004 -0.004 0.000 -0.000 -0.004* -0.004* 0.004* 0.004* (0.003) (0.003) (0.003) (0.003) (0.003) (0.003) (0.002) (0.002) (0.002) (0.002)
HH income (1,000 USD) 0.004** 0.004* 0.011** 0.010** 0.009** 0.009** 0.011** 0.011** 0.006** 0.006** (0.002) (0.002) (0.002) (0.002) (0.001) (0.001) (0.001) (0.001) (0.001) (0.001)
Education 0.564** 0.563** 0.456** 0.454** 0.398** 0.399** 0.432** 0.431** 0.427** 0.427** (0.050) (0.050) (0.045) (0.045) (0.035) (0.035) (0.024) (0.024) (0.031) (0.031)
Father's Education
-0.000 0.001
0.033 0.034 0.063** 0.063** 0.062* 0.062* (0.050) (0.050)
(0.033) (0.033) (0.022) (0.022) (0.028) (0.028)
Mother's Education
0.052 0.049
0.105** 0.103* 0.061* 0.060* 0.193** 0.192** (0.059) (0.059)
(0.040) (0.040) (0.026) (0.026) (0.032) (0.032)
Employed 0.052 0.047 -0.001 -0.018 -0.061 -0.069 0.065 0.064 0.192* 0.194** (0.120) (0.120) (0.120) (0.121) (0.096) (0.096) (0.058) (0.058) (0.075) (0.075)
Metropolitan Area 0.027 0.029 0.258* 0.265* -0.258** -0.255** 0.043 0.044 -0.016 -0.017 (0.114) (0.114) (0.116) (0.116) (0.090) (0.090) (0.059) (0.059) (0.077) (0.077)
Non-US Citizen
0.115 0.118 -0.304 -0.292
(0.125) (0.126) (0.165) (0.165)
Black*Education
0.005
0.016
0.008
0.000
-0.002
(0.006)
(0.009)
(0.005)
(0.004)
(0.003)
Asian*Education
0.001
-0.011
-0.004
-0.003
(0.014)
(0.008)
(0.004)
(0.004)
Hispanic*Education
0.005
0.011
-0.005
0.003
0.004
(0.016)
(0.011)
(0.005)
(0.004)
(0.003)
Constant -2.573** -2.539** -2.732** -2.641** -2.528** -2.532** -3.270** -3.261** -4.158** -4.154** (0.276) (0.278) (0.257) (0.263) (0.227) (0.231) (0.150) (0.154) (0.188) (0.188)
Unweighted N 1893 1893 2138 2138 4153 4153 12068 12068 9254 9254 Weighted N (Million) 19.5 19.5 25.66 25.66 67.17 67.17 144.9 144.9 114.8 114.8
F 25.24 21.21 29.52 21.97 40.19 32.18 91.92 73.08 73.81 58.97 Standard errors in parentheses ** p<0.01, * p<0.05

105
Appendix G – Effects of race/ethnicity on specific arts creation
(full results)
Table G.1 Effects of race/ethnicity on POTTERY/JEWELRY (full results)
Dependent Variable: Work with pottery, ceramics, jewelry, or do any leatherwork or metalwork
1982 1985 1992 2002 2008 Black -0.685** -1.196** -0.174 -0.668** -0.675**
(0.218) (0.340) (0.204) (0.157) (0.226) Asian
-1.320 -0.930 -0.320 -0.977*
(0.736) (0.485) (0.207) (0.432)
Hispanic -0.206 -0.133 -0.554* -0.355* -0.390 (0.418) (0.428) (0.251) (0.156) (0.203)
Female 0.362** 0.157 0.218 0.635** 0.593** (0.106) (0.151) (0.113) (0.079) (0.107)
Age -0.020** -0.021** -0.018** -0.019** -0.012** (0.003) (0.005) (0.004) (0.003) (0.003)
HH income (1,000 USD) -0.001 0.000 0.001 0.001 0.003* (0.002) (0.003) (0.002) (0.002) (0.001)
Education 0.244** 0.247** 0.092* 0.139** 0.155** (0.041) (0.055) (0.044) (0.033) (0.048)
Employed 0.055 -0.228 -0.046 -0.003 0.086 (0.116) (0.179) (0.146) (0.093) (0.134)
Metropolitan Area -0.105 0.273 -0.364** 0.010 -0.150 (0.108) (0.169) (0.127) (0.094) (0.124)
Non-US Citizen
-0.302 -0.848*
(0.190) (0.335)
Constant -2.052** -2.039** -1.721** -2.610** -3.083** (0.249) (0.357) (0.295) (0.204) (0.311)
Unweighted N 3850 2138 5217 15308 9038 Weighted N (Million) 37.41 25.64 83.86 183.50 107.70
F 17.26 7.588 6.481 17.89 12.82 Standard errors in parentheses ** p<0.01, * p<0.05
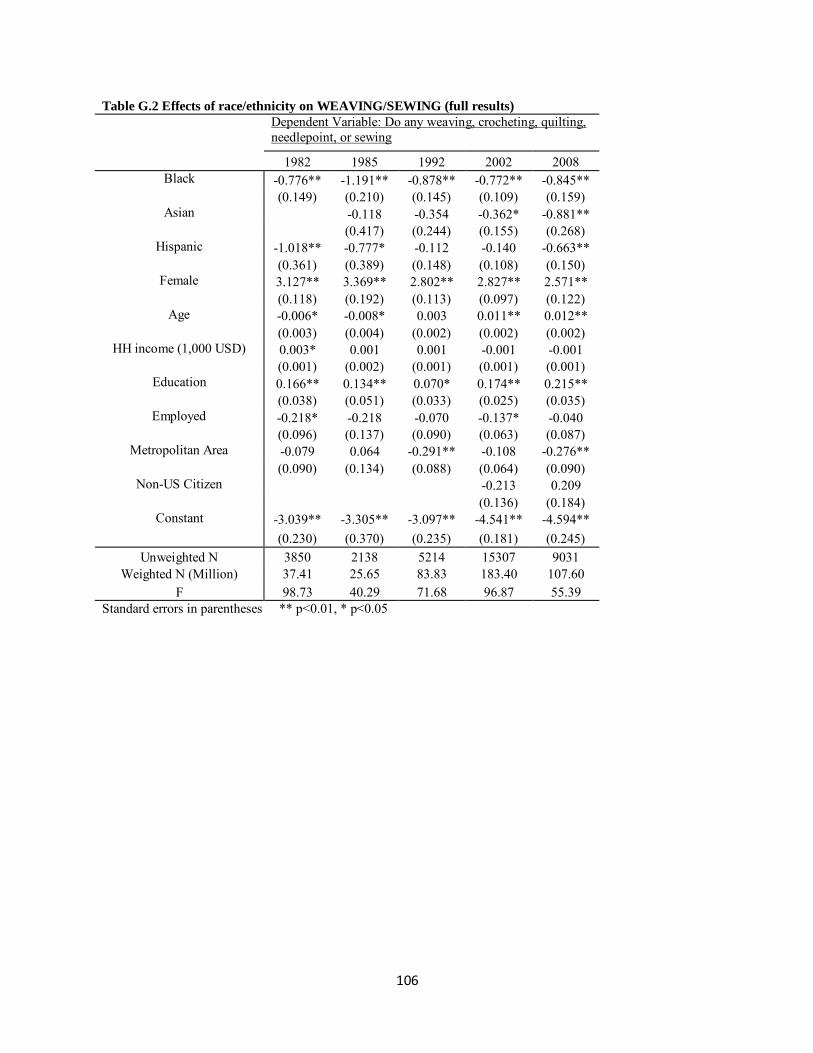
106
Table G.2 Effects of race/ethnicity on WEAVING/SEWING (full results)
Dependent Variable: Do any weaving, crocheting, quilting, needlepoint, or sewing
1982 1985 1992 2002 2008 Black -0.776** -1.191** -0.878** -0.772** -0.845**
(0.149) (0.210) (0.145) (0.109) (0.159) Asian
-0.118 -0.354 -0.362* -0.881**
(0.417) (0.244) (0.155) (0.268)
Hispanic -1.018** -0.777* -0.112 -0.140 -0.663** (0.361) (0.389) (0.148) (0.108) (0.150)
Female 3.127** 3.369** 2.802** 2.827** 2.571** (0.118) (0.192) (0.113) (0.097) (0.122)
Age -0.006* -0.008* 0.003 0.011** 0.012** (0.003) (0.004) (0.002) (0.002) (0.002)
HH income (1,000 USD) 0.003* 0.001 0.001 -0.001 -0.001 (0.001) (0.002) (0.001) (0.001) (0.001)
Education 0.166** 0.134** 0.070* 0.174** 0.215** (0.038) (0.051) (0.033) (0.025) (0.035)
Employed -0.218* -0.218 -0.070 -0.137* -0.040 (0.096) (0.137) (0.090) (0.063) (0.087)
Metropolitan Area -0.079 0.064 -0.291** -0.108 -0.276** (0.090) (0.134) (0.088) (0.064) (0.090)
Non-US Citizen
-0.213 0.209
(0.136) (0.184)
Constant -3.039** -3.305** -3.097** -4.541** -4.594** (0.230) (0.370) (0.235) (0.181) (0.245)
Unweighted N 3850 2138 5214 15307 9031 Weighted N (Million) 37.41 25.65 83.83 183.40 107.60
F 98.73 40.29 71.68 96.87 55.39 Standard errors in parentheses ** p<0.01, * p<0.05

107
Table G.3 Effects of race/ethnicity on PHOTO/MOVIE (full results)
Dependent Variable: Make photographs, movies, or videotapes as an artistic activity
1982 1985 1992 2002 2008 Black -0.165 -0.266 0.047 -0.422** -0.444**
(0.214) (0.277) (0.172) (0.119) (0.146) Asian
-0.275 -0.458 -0.311 -0.473*
(0.651) (0.315) (0.163) (0.222)
Hispanic -0.205 -0.909 -0.119 -0.330* -0.141 (0.494) (0.717) (0.193) (0.137) (0.133)
Female -0.245* -0.213 -0.238* 0.221** 0.278** (0.115) (0.163) (0.095) (0.061) (0.073)
Age -0.024** -0.022** -0.013** -0.013** -0.016** (0.004) (0.005) (0.003) (0.002) (0.002)
HH income (1,000 USD) 0.002 -0.001 0.005** 0.005** 0.003** (0.002) (0.003) (0.002) (0.001) (0.001)
Education 0.474** 0.388** 0.297** 0.345** 0.329** (0.047) (0.057) (0.040) (0.027) (0.035)
Employed 0.035 0.000 0.145 0.202** -0.080 (0.135) (0.194) (0.136) (0.078) (0.091)
Metropolitan Area 0.176 0.207 0.011 0.177* 0.079 (0.134) (0.185) (0.121) (0.079) (0.093)
Non-US Citizen
-0.184 -0.293
(0.153) (0.177)
Constant -3.061** -2.638** -2.861** -3.407** -2.603** (0.270) (0.376) (0.274) (0.177) (0.221)
Unweighted N 3846 2137 5207 15313 9028 Weighted N (Million) 37.36 25.63 83.72 183.50 107.50
F 26.92 12.48 19.60 46.39 32.00 Standard errors in parentheses ** p<0.01, * p<0.05

108
Table G.4 Effects of race/ethnicity on PAINT/SCULPTURE (full results)
Dependent Variable: Do any painting, drawing, sculpture, or printmaking activities
1982 1985 1992 2002 2008 Black -0.269 -0.760* -0.902** -0.647** -0.374*
(0.216) (0.335) (0.236) (0.147) (0.176) Asian
-0.663 -0.192 -0.532** -0.118
(0.784) (0.384) (0.205) (0.285)
Hispanic 0.331 0.663 -0.500* -0.169 -0.123 (0.398) (0.487) (0.239) (0.141) (0.158)
Female 0.324** 0.693** 0.275* 0.554** 0.444** (0.122) (0.174) (0.110) (0.073) (0.093)
Age -0.032** -0.027** -0.028** -0.029** -0.027** (0.004) (0.006) (0.004) (0.002) (0.003)
HH income (1,000 USD) -0.002 -0.001 -0.001 -0.002 -0.002 (0.002) (0.003) (0.002) (0.001) (0.001)
Education 0.350** 0.351** 0.237** 0.294** 0.279** (0.049) (0.063) (0.044) (0.031) (0.044)
Employed -0.055 -0.161 -0.133 -0.103 -0.216* (0.132) (0.197) (0.137) (0.083) (0.109)
Metropolitan Area 0.037 -0.166 -0.133 -0.020 -0.059 (0.126) (0.174) (0.123) (0.087) (0.108)
Non-US Citizen
-0.401* -0.609*
(0.177) (0.251)
Constant -2.286** -2.588** -1.780** -2.284** -2.091** (0.287) (0.422) (0.298) (0.192) (0.273)
Unweighted N 3849 2139 5209 15311 9031 Weighted N (Million) 37.40 25.66 83.75 183.50 107.60
F 17.81 9.203 13.82 36.30 20.33 Standard errors in parentheses ** p<0.01, * p<0.05
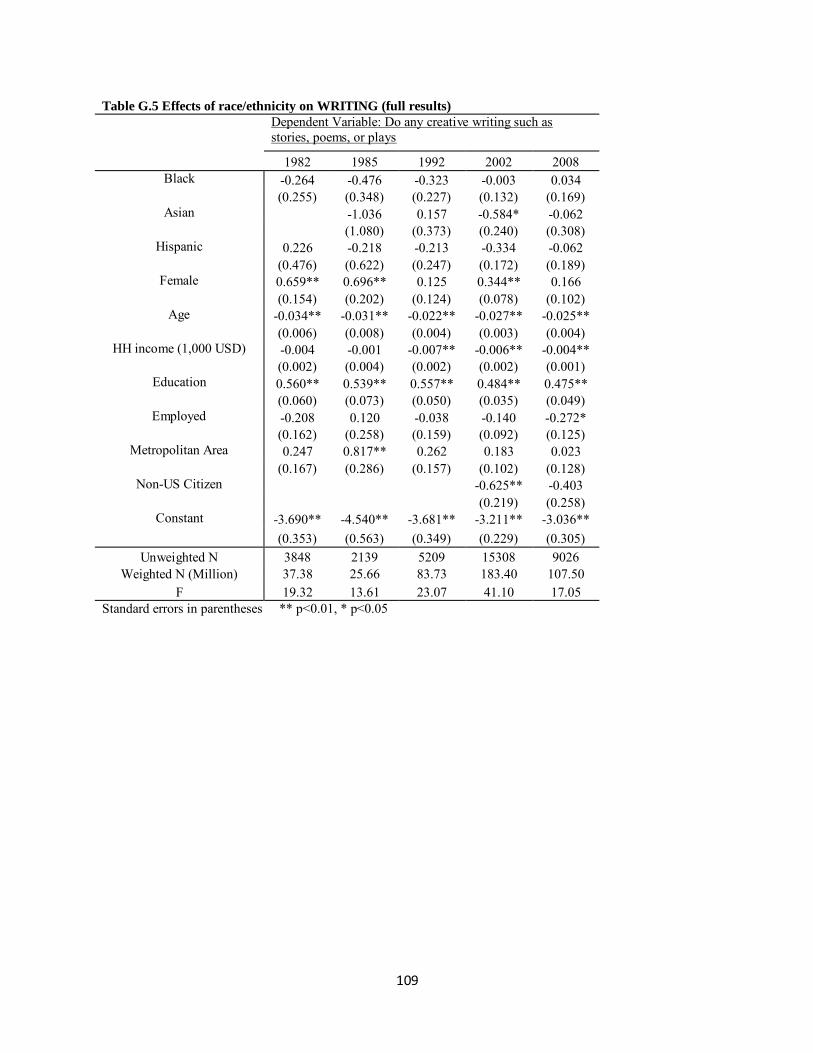
109
Table G.5 Effects of race/ethnicity on WRITING (full results)
Dependent Variable: Do any creative writing such as stories, poems, or plays
1982 1985 1992 2002 2008 Black -0.264 -0.476 -0.323 -0.003 0.034
(0.255) (0.348) (0.227) (0.132) (0.169) Asian
-1.036 0.157 -0.584* -0.062
(1.080) (0.373) (0.240) (0.308)
Hispanic 0.226 -0.218 -0.213 -0.334 -0.062 (0.476) (0.622) (0.247) (0.172) (0.189)
Female 0.659** 0.696** 0.125 0.344** 0.166 (0.154) (0.202) (0.124) (0.078) (0.102)
Age -0.034** -0.031** -0.022** -0.027** -0.025** (0.006) (0.008) (0.004) (0.003) (0.004)
HH income (1,000 USD) -0.004 -0.001 -0.007** -0.006** -0.004** (0.002) (0.004) (0.002) (0.002) (0.001)
Education 0.560** 0.539** 0.557** 0.484** 0.475** (0.060) (0.073) (0.050) (0.035) (0.049)
Employed -0.208 0.120 -0.038 -0.140 -0.272* (0.162) (0.258) (0.159) (0.092) (0.125)
Metropolitan Area 0.247 0.817** 0.262 0.183 0.023 (0.167) (0.286) (0.157) (0.102) (0.128)
Non-US Citizen
-0.625** -0.403
(0.219) (0.258)
Constant -3.690** -4.540** -3.681** -3.211** -3.036** (0.353) (0.563) (0.349) (0.229) (0.305)
Unweighted N 3848 2139 5209 15308 9026 Weighted N (Million) 37.38 25.66 83.73 183.40 107.50
F 19.32 13.61 23.07 41.10 17.05 Standard errors in parentheses ** p<0.01, * p<0.05
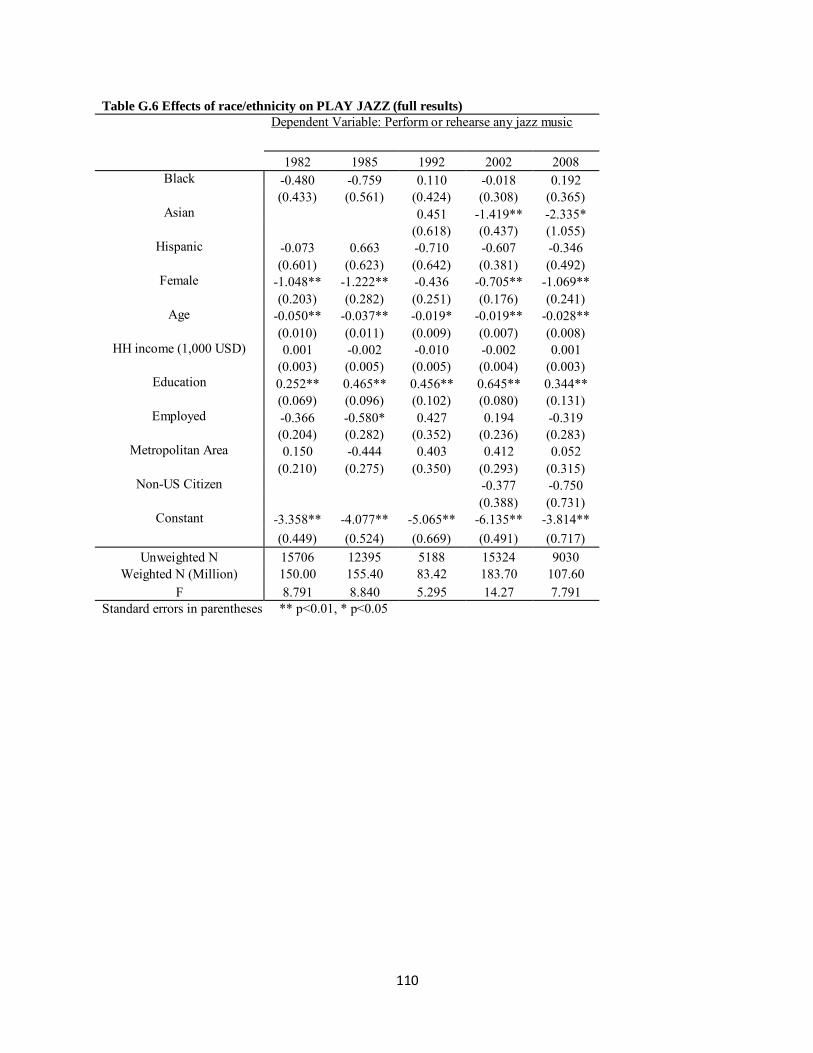
110
Table G.6 Effects of race/ethnicity on PLAY JAZZ (full results)
Dependent Variable: Perform or rehearse any jazz music
1982 1985 1992 2002 2008 Black -0.480 -0.759 0.110 -0.018 0.192
(0.433) (0.561) (0.424) (0.308) (0.365) Asian
0.451 -1.419** -2.335*
(0.618) (0.437) (1.055)
Hispanic -0.073 0.663 -0.710 -0.607 -0.346 (0.601) (0.623) (0.642) (0.381) (0.492)
Female -1.048** -1.222** -0.436 -0.705** -1.069** (0.203) (0.282) (0.251) (0.176) (0.241)
Age -0.050** -0.037** -0.019* -0.019** -0.028** (0.010) (0.011) (0.009) (0.007) (0.008)
HH income (1,000 USD) 0.001 -0.002 -0.010 -0.002 0.001 (0.003) (0.005) (0.005) (0.004) (0.003)
Education 0.252** 0.465** 0.456** 0.645** 0.344** (0.069) (0.096) (0.102) (0.080) (0.131)
Employed -0.366 -0.580* 0.427 0.194 -0.319 (0.204) (0.282) (0.352) (0.236) (0.283)
Metropolitan Area 0.150 -0.444 0.403 0.412 0.052 (0.210) (0.275) (0.350) (0.293) (0.315)
Non-US Citizen
-0.377 -0.750
(0.388) (0.731)
Constant -3.358** -4.077** -5.065** -6.135** -3.814** (0.449) (0.524) (0.669) (0.491) (0.717)
Unweighted N 15706 12395 5188 15324 9030 Weighted N (Million) 150.00 155.40 83.42 183.70 107.60
F 8.791 8.840 5.295 14.27 7.791 Standard errors in parentheses ** p<0.01, * p<0.05
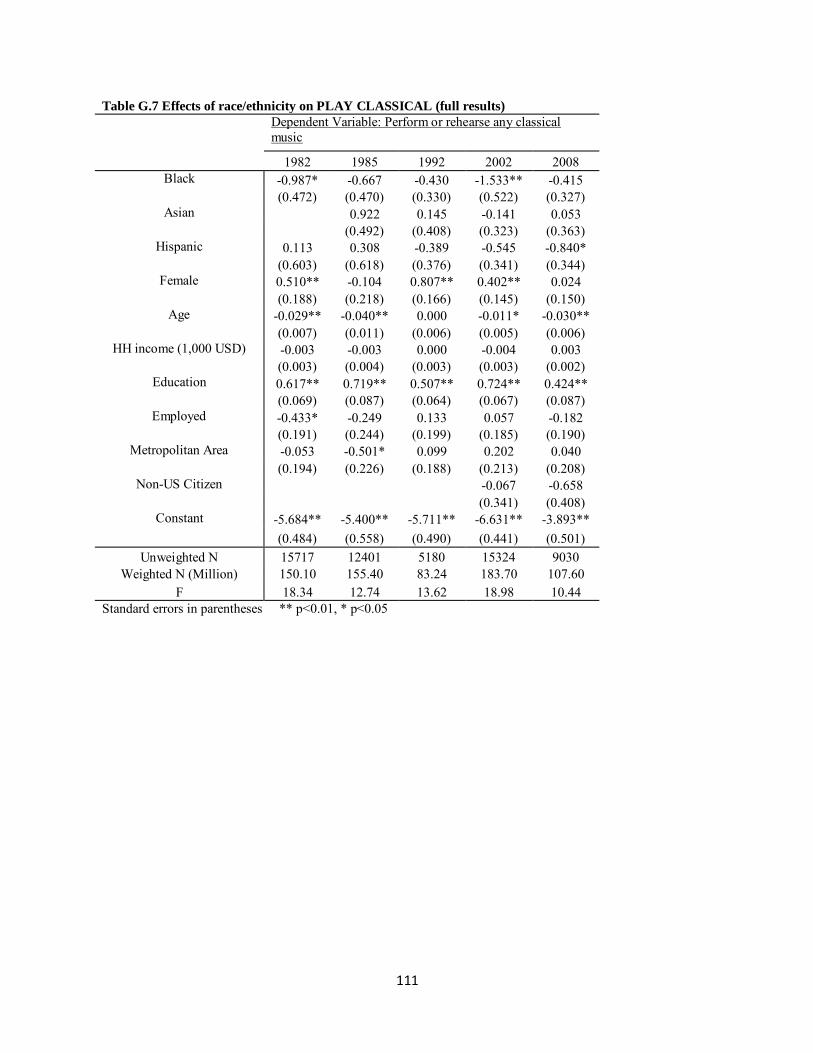
111
Table G.7 Effects of race/ethnicity on PLAY CLASSICAL (full results)
Dependent Variable: Perform or rehearse any classical music
1982 1985 1992 2002 2008 Black -0.987* -0.667 -0.430 -1.533** -0.415
(0.472) (0.470) (0.330) (0.522) (0.327) Asian
0.922 0.145 -0.141 0.053
(0.492) (0.408) (0.323) (0.363)
Hispanic 0.113 0.308 -0.389 -0.545 -0.840* (0.603) (0.618) (0.376) (0.341) (0.344)
Female 0.510** -0.104 0.807** 0.402** 0.024 (0.188) (0.218) (0.166) (0.145) (0.150)
Age -0.029** -0.040** 0.000 -0.011* -0.030** (0.007) (0.011) (0.006) (0.005) (0.006)
HH income (1,000 USD) -0.003 -0.003 0.000 -0.004 0.003 (0.003) (0.004) (0.003) (0.003) (0.002)
Education 0.617** 0.719** 0.507** 0.724** 0.424** (0.069) (0.087) (0.064) (0.067) (0.087)
Employed -0.433* -0.249 0.133 0.057 -0.182 (0.191) (0.244) (0.199) (0.185) (0.190)
Metropolitan Area -0.053 -0.501* 0.099 0.202 0.040 (0.194) (0.226) (0.188) (0.213) (0.208)
Non-US Citizen
-0.067 -0.658
(0.341) (0.408)
Constant -5.684** -5.400** -5.711** -6.631** -3.893** (0.484) (0.558) (0.490) (0.441) (0.501)
Unweighted N 15717 12401 5180 15324 9030 Weighted N (Million) 150.10 155.40 83.24 183.70 107.60
F 18.34 12.74 13.62 18.98 10.44 Standard errors in parentheses ** p<0.01, * p<0.05

112
Table G.8 Effects of race/ethnicity on SING OPERA (full results)
Dependent Variable: Sing any music in an opera
1982 1985 1992 2002 2008 Black -0.374 1.109 -1.348* -1.720* 0.992
(1.074) (0.889) (0.601) (0.740) (0.620) Asian
0.608 -0.014
(0.734) (0.598) Hispanic
-1.670 0.133 -1.947
(1.005) (0.537) (1.080)
Female 1.074 0.109 0.961** 0.565* 0.413 (0.620) (0.971) (0.315) (0.234) (0.463)
Age -0.050 -0.003 0.020* 0.010 0.004 (0.035) (0.028) (0.009) (0.009) (0.014)
HH income (1,000 USD) -0.029* -0.019 -0.009* 0.005 0.007 (0.014) (0.019) (0.005) (0.005) (0.005)
Education 0.722* -0.061 0.614** 0.538** 0.061 (0.308) (0.409) (0.098) (0.107) (0.222)
Employed 0.614 1.066 0.765 -0.035 -0.463 (0.756) (1.692) (0.463) (0.292) (0.421)
Metropolitan Area 0.781 -0.881 0.202 0.138 0.152 (0.726) (1.067) (0.382) (0.386) (0.748)
Non-US Citizen
-0.356 -0.476
(0.674) (1.060)
Constant -8.549** -7.345** -8.552** -8.234** -6.823** (1.575) (1.975) (0.865) (0.809) (1.439)
Unweighted N 15697 12389 5185 15321 9040 Weighted N (Million) 150.00 155.30 83.33 183.60 107.80
F 2.286 96.00 6.901 7.656 1.579 Standard errors in parentheses ** p<0.01, * p<0.05

113
Table G.9 Effects of race/ethnicity on SING MUSICAL (full results)
Dependent Variable: Sing or act in a musical play
1982 1985 1992 2002 2008 Black 0.028 -0.248 -0.637 -0.682* -0.029
(0.316) (0.396) (0.347) (0.290) (0.450) Asian
0.435 0.079 -1.290** -0.108
(0.610) (0.526) (0.380) (0.807)
Hispanic
-0.383 -1.305* -0.574 -0.409
(0.730) (0.516) (0.342) (0.497)
Female 0.612** 0.467* 0.711** 0.520** 0.462 (0.183) (0.211) (0.161) (0.133) (0.268)
Age -0.029** -0.004 0.005 0.002 -0.016 (0.008) (0.007) (0.005) (0.005) (0.012)
HH income (1,000 USD) -0.001 0.002 0.005 0.001 0.005* (0.003) (0.004) (0.003) (0.003) (0.003)
Education 0.390** 0.326** 0.399** 0.493** 0.196 (0.073) (0.091) (0.070) (0.058) (0.116)
Employed 0.069 0.158 -0.019 0.244 -0.542 (0.195) (0.257) (0.203) (0.167) (0.373)
Metropolitan Area -0.051 -0.240 -0.029 0.160 -0.201 (0.191) (0.238) (0.191) (0.167) (0.331)
Non-US Citizen
-0.741 -1.197
(0.485) (0.955)
Constant -5.324** -6.108** -5.534** -6.285** -4.848** (0.431) (0.531) (0.419) (0.400) (0.911)
Unweighted N 15705 12393 5185 15315 9039 Weighted N (Million) 150.00 155.30 83.34 183.60 107.80
F 9.577 3.579 9.783 14.88 1.669 Standard errors in parentheses ** p<0.01, * p<0.05

114
Appendix H – Analysis of logistic regression assumptions
The fact that the main effects of race/ethnic membership generally fell to non-significance in the full
models, but the interaction terms were also non-significant is a somewhat puzzling finding that required
exploration. Generally, when such findings occur, the most likely cause is that there are differential
variances in the interaction term. That is, one explanation for our findings might be that among non-
white arts participators there is very little variance in education (e.g., all non-white participators are
highly educated).
We tested for this effect. The results are for the core arts domains are presented in Table H.1.
This table shows that the variance in education among arts-goers in the core domains only differed
significantly in one instance. Asian opera-goers had significantly less variation in education than did
white opera-goers. When income was considered, there were more instances of significantly different
variation. In most of the domains, Asian arts goers had significantly less variation in income than did
their white counterparts. In jazz and classical, Hispanics showed significantly less variation in income
than their white counterparts. Overall, the evidence suggests that the underlying assumptions of the
logistic regression models were not violated in the core arts domains analysis.
Evidence for equality of variance in the arts creation models is not there. Table H.2 shows that
there were many instances of differing variances among arts creators. Indeed, there were instances
where the relative scarcity of non-white arts creators in some domains made it such that a stable
variance could not be estimated. The relatively small number of arts creators made for wide variation in
the variance in both education and income between white arts creators and their non-white
counterparts. As such, the presentation discussion of the full models for arts creators was omitted since
the stability of the models could not be assured.

115
Table H.1 Educational attainment and household income of arts participants by race/ ethnicity, 2008
White Black Asian Hispanic
Mean S.D Mean S.D Mean S.D Mean S.D Education†
Total‡ 3.89 1.41 3.41 1.32 4.27 1.50 2.96 1.46 Jazz 4.59 1.25 4.20 1.29 5.03 0.14 3.83 0.94
Classical 4.72 1.22 4.36 0.95 5.17 0.92 3.92 1.12 Opera 4.98 1.09 4.29 1.09 4.28 0.23* 3.63 0.84
Musical 4.55 1.23 4.37 0.95 4.86 0.99 4.15 1.00 Play 4.68 1.21 4.16 0.96 4.81 1.17 4.20 1.28
Ballet 4.72 1.11 4.54 0.67 5.10 0.92 4.53 0.60 Museum/Gallery 4.59 1.27 4.29 1.44 4.96 0.93 3.87 1.28
Crafts fair 4.31 1.28 4.12 1.21 4.78 1.07 3.52 1.25 Park 4.42 1.29 4.24 1.00 4.84 1.12 3.84 1.18
Household income (1000 USD) Total‡ 68.44 52.07 42.01 38.72 75.69 41.88 46.91 37.10 Jazz 84.66 53.32 60.32 34.80 101.42 2.81* 65.79 25.35*
Classical 86.51 50.14 69.20 25.85 104.33 22.39 57.41 24.03* Opera 94.27 43.88 72.58 27.24 64.06 7.35* 62.00 43.26
Musical 89.56 51.27 68.16 32.72 97.22 21.85* 72.60 37.82 Play 88.69 50.58 57.33 30.23 100.93 24.75 78.48 41.47
Ballet 89.21 46.72 75.42 43.06 70.59 6.57* 88.49 25.12 Museum/Gallery 86.52 52.92 66.46 32.47 90.75 28.52 63.67 37.25
Crafts fair 78.85 49.16 55.81 27.91 99.78 26.90 57.87 33.98 Park 83.44 52.69 57.05 30.76 89.42 25.33* 66.16 38.36
* Statistically different from whites (p<0.05) †Measured as the highest attained degree among six levels
‡Includes both participants and non-participants

116
Table H.2. Educational attainment and household income of arts creators, by race/ethnicity, 2008
White Black Asian Hispanic
Mean S.D Mean S.D Mean S.D Mean S.D Education†
Total‡ 3.89 1.41 3.41 1.32 4.27 1.50 2.96 1.46 Pottery/Jewelry 4.15 1.28 4.24 0.53* 5.02 0.17* 3.25 1.21
Weaving/Sewing 4.04 1.32 3.80 1.10 4.30 0.82 3.06 1.25 Photo/Movie 4.32 1.39 3.97 0.89 4.86 0.39* 3.73 1.11
Paint/Sculpture 4.21 1.45 3.62 0.55* 4.53 0.10* 3.56 1.14 Writing 4.39 1.29 3.85 0.52* 4.92 0.01* 3.79 0.71
Play jazz 4.45 1.17 3.58 0.29 4.00 4.19 0.33* Play classical 4.53 1.31 4.00 4.79 4.34 0.34*
Sing opera 3.99 0.31 3.43 1.15 2.00 Sing musical 4.17 0.60 3.75 4.64 2.65
Household income (1,000 USD) Total‡ 68.44 52.07 42.01 38.72 75.69 41.88 46.91 37.10
Pottery/Jewelry 74.35 48.75 62.22 8.41* 124.04 2.51* 56.60 38.07 Weaving/Sewing 65.12 49.45 46.22 15.28* 86.15 29.40 43.59 32.93
Photo/Movie 78.72 50.79 55.70 29.93 88.82 8.52* 60.29 41.50 Paint/Sculpture 69.07 48.90 44.59 21.02* 82.76 3.28* 60.66 37.26
Writing 69.16 45.15 48.50 15.24* 66.43 0.71* 55.02 34.26 Play jazz 77.08 38.90 45.70 2.22* 150.00 61.66 0.00*
Play classical 81.91 46.19 57.34 90.30 66.07 0.00* Sing opera 72.07 28.03 84.17 4.23* 87.50
Sing musical 78.82 22.53 68.09 106.37 35.36 * Statistically different from whites (p<0.05)
†Measured as the highest attained degree among six levels ‡Includes both participants and non-participants ‽ Empty cells for standard deviation are due to limited cell size and/or heavily skewed distribution