quick start to value with db2 web query ez-install start to value with db2 web query...quick start...
TRANSCRIPT
5/26/2018
1
© 2018 IBM Corporation© 2018 IBM Corporation
Quick Start to Value with Db2
Web Query EZ-Install
Doug Mack
IBM Lab Services
© 2018 IBM Corporation
Agenda
• Step 1: Get the product installed using EZ-Install
• Step 2: Take the EZ-Install “Test Drive”
– Learn what you have: sample reports
– Learn how to build reports: self guided and/or video tutorials
• Step 3: Consider Modernizing Query/400 Reports
5/26/2018
2
© 2018 IBM Corporation
Db2 Web Query Installation and Setup
(in 15 minutes)
With the NEW EZ-Install Package
Request by sending email to [email protected] w/ serial number of system you plan to install on
© 2018 IBM Corporation
What is the EZ-Install Package
– A single downloadable image that you can request that includes:
• Db2 Web Query Version 2.2
– Express and Standard Edition
– Data Migrator and Developer Workbench
• Sample IBM i System Administration Reports
• Db2 Web Query Auditing/Monitoring Reports
• Query/400 Discovery Tool
• All of the Tutorial Reports already completed
– (but this would be cheating if you didn’t do the tutorials yourself)
– Installation Process Walks You through the Installation
– Add a user you designate as a Db2 Web Query Administrator (don’t use QSECOFR please)
– Restore of Db2 Web Query Sample Database and Meta data (needed for self guided tutorials)
– Restore of Audit and Sample IBM i System Admin reports
– Discovery Tool and completed tutorial reports are included but enabled optionally

5/26/2018
3
© 2018 IBM Corporation
EZ-Install Considerations
– Request the Package by sending email to [email protected]
• Include your name, company name, and serial # of system you plan to install on
• You’ll receive an email with installation instructions and a second email with a link to a box.com website
• The download of pre-req checker is FAST. The download and subsequent upload of the EZ-Install
package can be lengthy based on network speeds
• The actual installation after uploading to your system is 15-20 minutes
– If you’ve already got Version 2.x installed, this will UPGRADE that version
• Recommend you have a good backup of your current environment
– Gotchas
• Some companies block access to box.com. If so, reach out to us and we’ll provide an alternative to get
you the package
• Java (product JV1) Option 16 must be installed prior to running EZ-Install SETUP
• User id to run SETUP requires *allobj, but if you use QSECOFR hit F4 on SETUP to provide a non
Qxxxx user profile to be assigned as the Db2 Web Query Adminstrator (or your install will fail)
• Other issues – reach out to us at [email protected]
© 2018 IBM Corporation
Agenda
• Step 1: Get the product installed using EZ-Install
• Step 2: Take the EZ-Install “Test Drive”
– Learn what you have: sample reports
– Learn how to build reports: self guided and/or video tutorials
• Step 3: Consider Modernizing Query/400 Reports
5/26/2018
4
© 2018 IBM Corporation
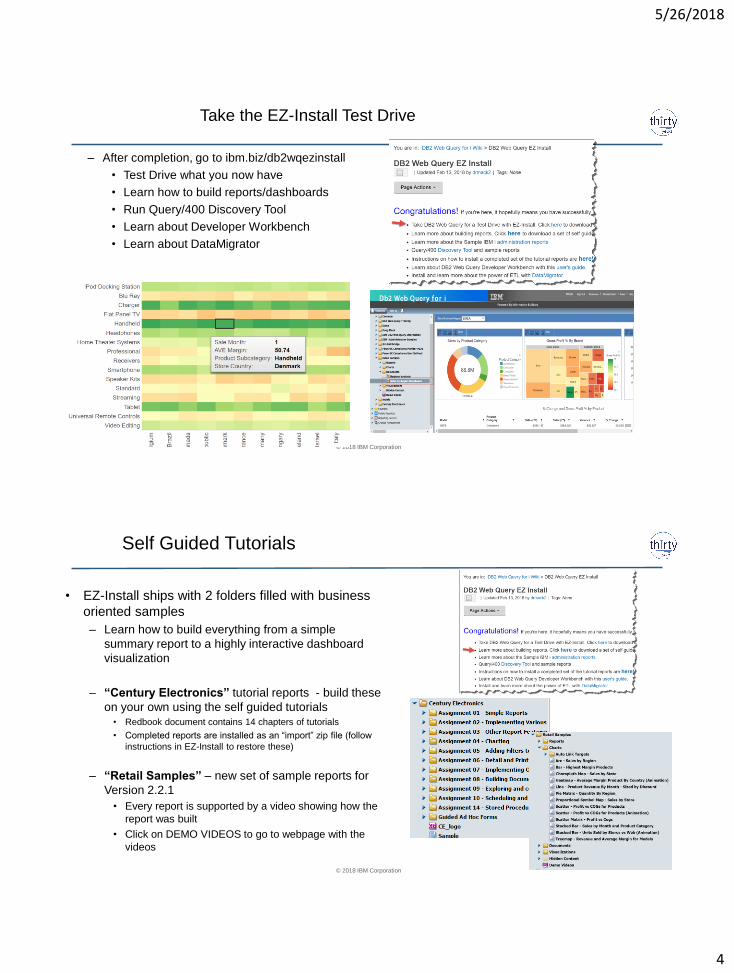
Take the EZ-Install Test Drive
– After completion, go to ibm.biz/db2wqezinstall
• Test Drive what you now have
• Learn how to build reports/dashboards
• Run Query/400 Discovery Tool
• Learn about Developer Workbench
• Learn about DataMigrator
© 2018 IBM Corporation
Self Guided Tutorials
• EZ-Install ships with 2 folders filled with business
oriented samples
– Learn how to build everything from a simple
summary report to a highly interactive dashboard
visualization
– “Century Electronics” tutorial reports - build these
on your own using the self guided tutorials
• Redbook document contains 14 chapters of tutorials
• Completed reports are installed as an “import” zip file (follow
instructions in EZ-Install to restore these)
– “Retail Samples” – new set of sample reports for
Version 2.2.1
• Every report is supported by a video showing how the
report was built
• Click on DEMO VIDEOS to go to webpage with the
videos
5/26/2018
5
© 2018 IBM Corporation
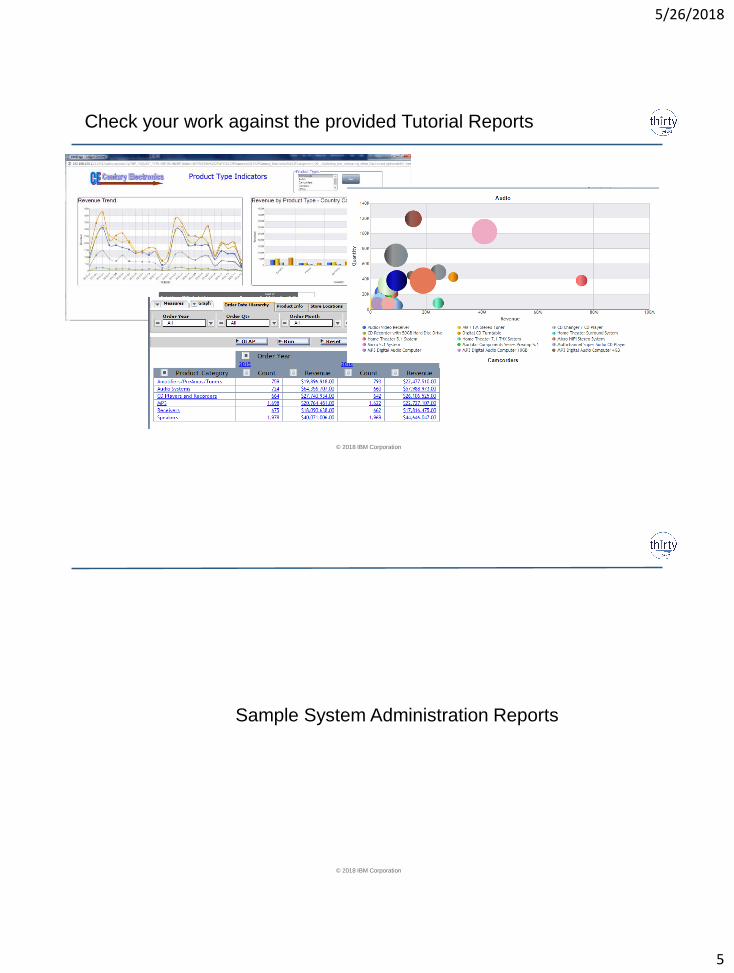
Check your work against the provided Tutorial Reports
© 2018 IBM Corporation
Sample System Administration Reports
5/26/2018
6
© 2018 IBM Corporation
IBM i Services
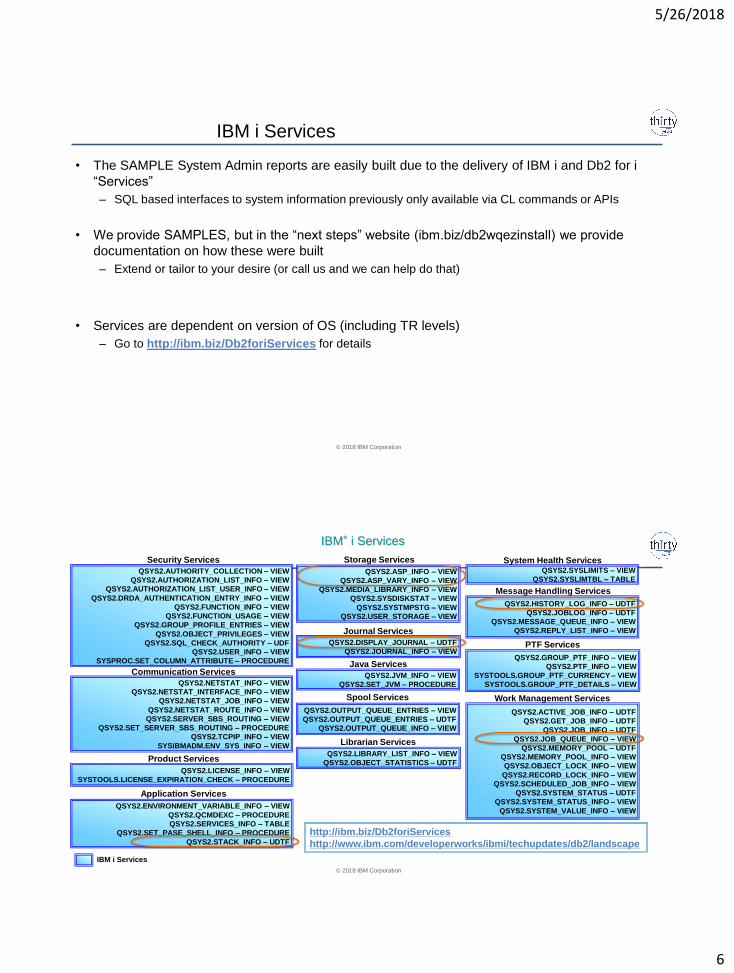
• The SAMPLE System Admin reports are easily built due to the delivery of IBM i and Db2 for i
“Services”
– SQL based interfaces to system information previously only available via CL commands or APIs
• We provide SAMPLES, but in the “next steps” website (ibm.biz/db2wqezinstall) we provide
documentation on how these were built
– Extend or tailor to your desire (or call us and we can help do that)
• Services are dependent on version of OS (including TR levels)
– Go to http://ibm.biz/Db2foriServices for details
© 2018 IBM Corporation
PTF Services
QSYS2.GROUP_PTF_INFO – VIEW
QSYS2.PTF_INFO – VIEW
SYSTOOLS.GROUP_PTF_CURRENCY – VIEW
SYSTOOLS.GROUP_PTF_DETAILS – VIEW
http://ibm.biz/Db2foriServices
http://www.ibm.com/developerworks/ibmi/techupdates/db2/landscape
Security Services
QSYS2.AUTHORITY_COLLECTION – VIEW
QSYS2.AUTHORIZATION_LIST_INFO – VIEW
QSYS2.AUTHORIZATION_LIST_USER_INFO – VIEW
QSYS2.DRDA_AUTHENTICATION_ENTRY_INFO – VIEW
QSYS2.FUNCTION_INFO – VIEW
QSYS2.FUNCTION_USAGE – VIEW
QSYS2.GROUP_PROFILE_ENTRIES – VIEW
QSYS2.OBJECT_PRIVILEGES – VIEW
QSYS2.SQL_CHECK_AUTHORITY – UDF
QSYS2.USER_INFO – VIEW
SYSPROC.SET_COLUMN_ATTRIBUTE – PROCEDURE
Communication Services
QSYS2.NETSTAT_INFO – VIEW
QSYS2.NETSTAT_INTERFACE_INFO – VIEW
QSYS2.NETSTAT_JOB_INFO – VIEW
QSYS2.NETSTAT_ROUTE_INFO – VIEW
QSYS2.SERVER_SBS_ROUTING – VIEW
QSYS2.SET_SERVER_SBS_ROUTING – PROCEDURE
QSYS2.TCPIP_INFO – VIEW
SYSIBMADM.ENV_SYS_INFO – VIEW
Work Management Services
QSYS2.ACTIVE_JOB_INFO – UDTF
QSYS2.GET_JOB_INFO – UDTF
QSYS2.JOB_INFO – UDTF
QSYS2.JOB_QUEUE_INFO – VIEW
QSYS2.MEMORY_POOL – UDTF
QSYS2.MEMORY_POOL_INFO – VIEW
QSYS2.OBJECT_LOCK_INFO – VIEW
QSYS2.RECORD_LOCK_INFO – VIEW
QSYS2.SCHEDULED_JOB_INFO – VIEW
QSYS2.SYSTEM_STATUS – UDTF
QSYS2.SYSTEM_STATUS_INFO – VIEW
QSYS2.SYSTEM_VALUE_INFO – VIEW
System Health ServicesQSYS2.SYSLIMITS – VIEW
QSYS2.SYSLIMTBL – TABLE
Application Services
Journal Services
QSYS2.DISPLAY_JOURNAL – UDTF
QSYS2.JOURNAL_INFO – VIEW
Storage Services
QSYS2.ASP_INFO – VIEW
QSYS2.ASP_VARY_INFO – VIEW
QSYS2.MEDIA_LIBRARY_INFO – VIEW
QSYS2.SYSDISKSTAT – VIEW
QSYS2.SYSTMPSTG – VIEW
QSYS2.USER_STORAGE – VIEW
IBM® i Services
QSYS2.ENVIRONMENT_VARIABLE_INFO – VIEW
QSYS2.QCMDEXC – PROCEDURE
QSYS2.SERVICES_INFO – TABLE
QSYS2.SET_PASE_SHELL_INFO – PROCEDURE
QSYS2.STACK_INFO – UDTF
Librarian Services
QSYS2.LIBRARY_LIST_INFO – VIEW
QSYS2.OBJECT_STATISTICS – UDTF
Message Handling Services
QSYS2.HISTORY_LOG_INFO – UDTF
QSYS2.JOBLOG_INFO – UDTF
QSYS2.MESSAGE_QUEUE_INFO – VIEW
QSYS2.REPLY_LIST_INFO – VIEW
Java Services
QSYS2.JVM_INFO – VIEW
QSYS2.SET_JVM – PROCEDURE
IBM i Services
QSYS2.LICENSE_INFO – VIEW
SYSTOOLS.LICENSE_EXPIRATION_CHECK – PROCEDURE
QSYS2.OUTPUT_QUEUE_ENTRIES – VIEW
QSYS2.OUTPUT_QUEUE_ENTRIES – UDTF
QSYS2.OUTPUT_QUEUE_INFO – VIEW
Product Services
Spool Services
5/26/2018
7
© 2018 IBM Corporation
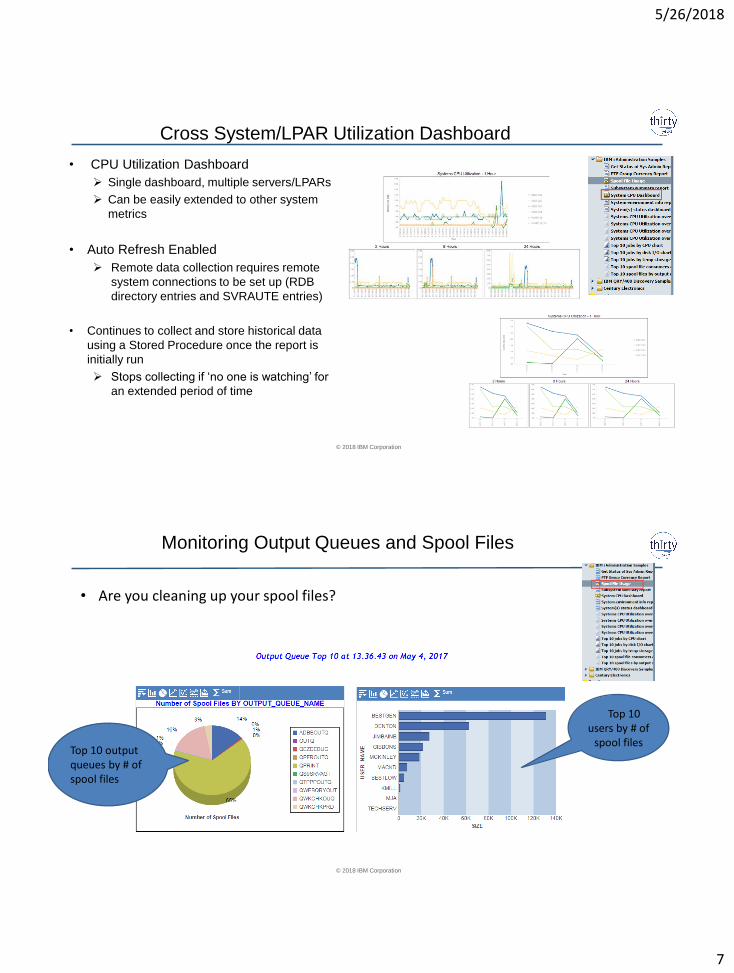
Cross System/LPAR Utilization Dashboard
• CPU Utilization Dashboard
➢ Single dashboard, multiple servers/LPARs
➢ Can be easily extended to other system
metrics
• Auto Refresh Enabled
➢ Remote data collection requires remote
system connections to be set up (RDB
directory entries and SVRAUTE entries)
• Continues to collect and store historical data
using a Stored Procedure once the report is
initially run
➢ Stops collecting if ‘no one is watching’ for
an extended period of time
© 2018 IBM Corporation
Monitoring Output Queues and Spool Files
• Are you cleaning up your spool files?
Top 10 output queues by # of spool files
Top 10 users by # of
spool files
5/26/2018
8
© 2018 IBM Corporation
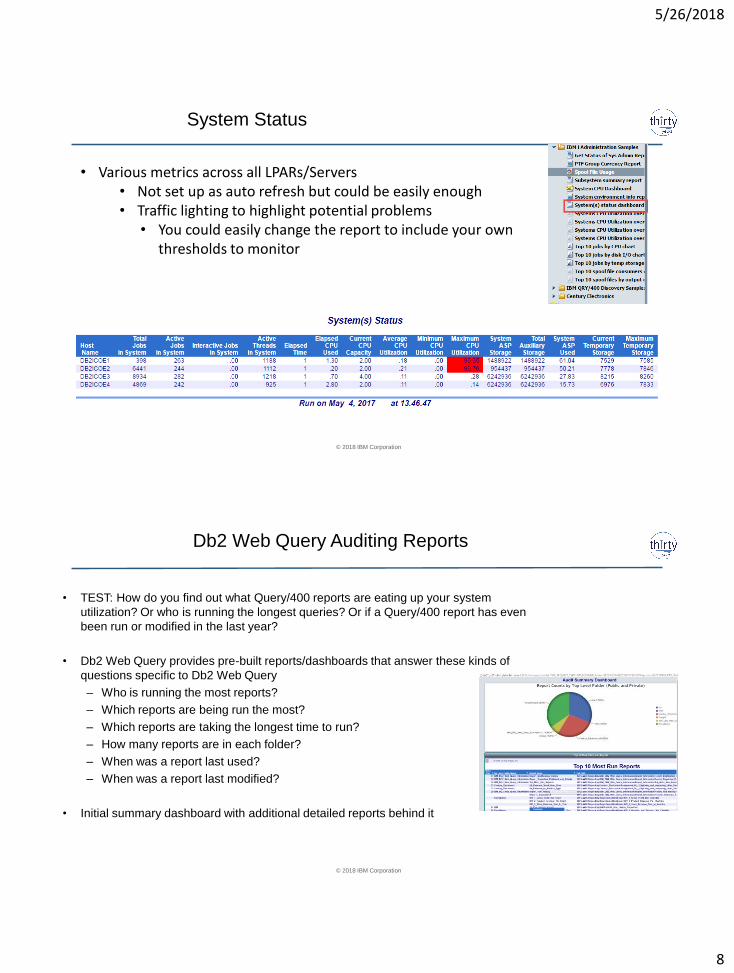
System Status
• Various metrics across all LPARs/Servers• Not set up as auto refresh but could be easily enough• Traffic lighting to highlight potential problems
• You could easily change the report to include your own thresholds to monitor
© 2018 IBM Corporation
Db2 Web Query Auditing Reports
• TEST: How do you find out what Query/400 reports are eating up your system
utilization? Or who is running the longest queries? Or if a Query/400 report has even
been run or modified in the last year?
• Db2 Web Query provides pre-built reports/dashboards that answer these kinds of
questions specific to Db2 Web Query
– Who is running the most reports?
– Which reports are being run the most?
– Which reports are taking the longest time to run?
– How many reports are in each folder?
– When was a report last used?
– When was a report last modified?
• Initial summary dashboard with additional detailed reports behind it
5/26/2018
9
© 2018 IBM Corporation
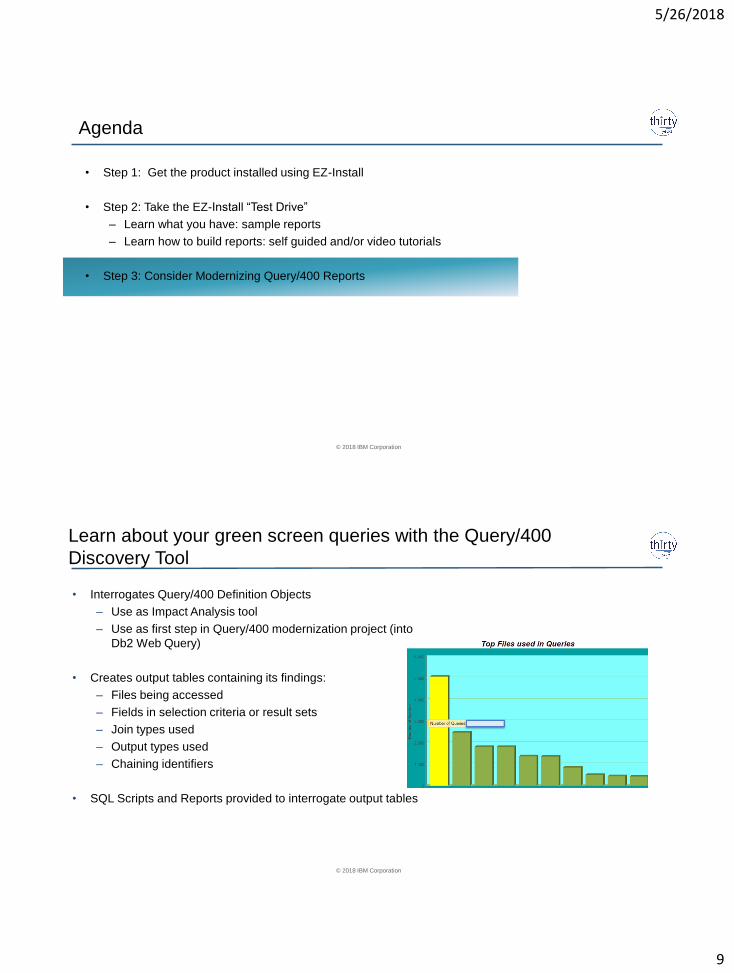
Agenda
• Step 1: Get the product installed using EZ-Install
• Step 2: Take the EZ-Install “Test Drive”
– Learn what you have: sample reports
– Learn how to build reports: self guided and/or video tutorials
• Step 3: Consider Modernizing Query/400 Reports
© 2018 IBM Corporation
Learn about your green screen queries with the Query/400
Discovery Tool
• Interrogates Query/400 Definition Objects
– Use as Impact Analysis tool
– Use as first step in Query/400 modernization project (into
Db2 Web Query)
• Creates output tables containing its findings:
– Files being accessed
– Fields in selection criteria or result sets
– Join types used
– Output types used
– Chaining identifiers
• SQL Scripts and Reports provided to interrogate output tables
5/26/2018
10
© 2018 IBM Corporation
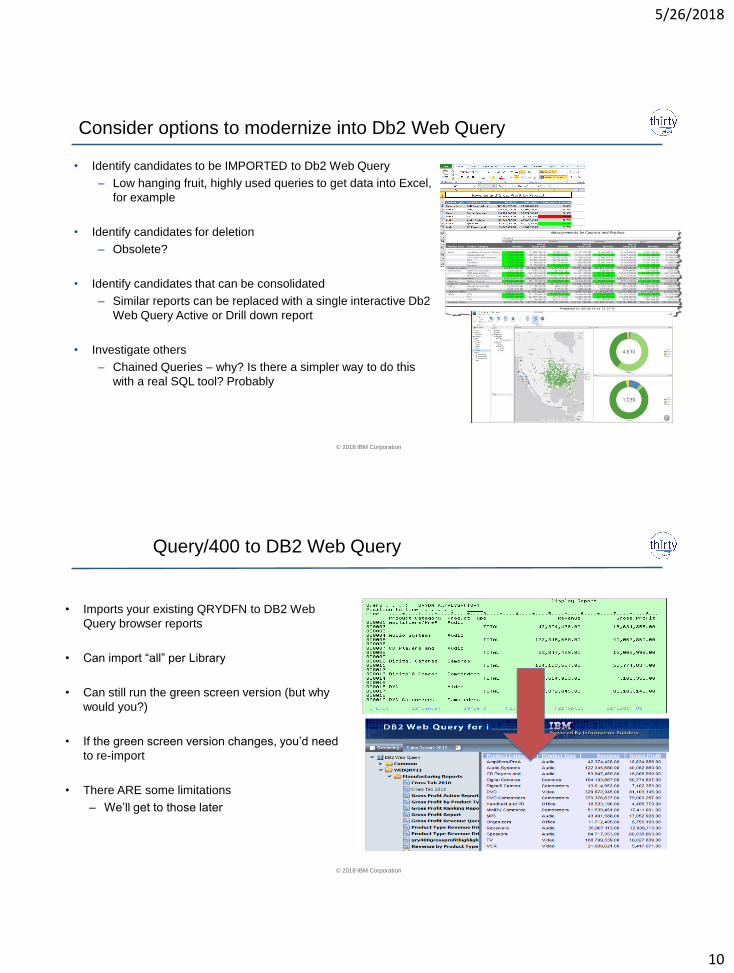
Consider options to modernize into Db2 Web Query
• Identify candidates to be IMPORTED to Db2 Web Query
– Low hanging fruit, highly used queries to get data into Excel,
for example
• Identify candidates for deletion
– Obsolete?
• Identify candidates that can be consolidated
– Similar reports can be replaced with a single interactive Db2
Web Query Active or Drill down report
• Investigate others
– Chained Queries – why? Is there a simpler way to do this
with a real SQL tool? Probably
© 2018 IBM Corporation
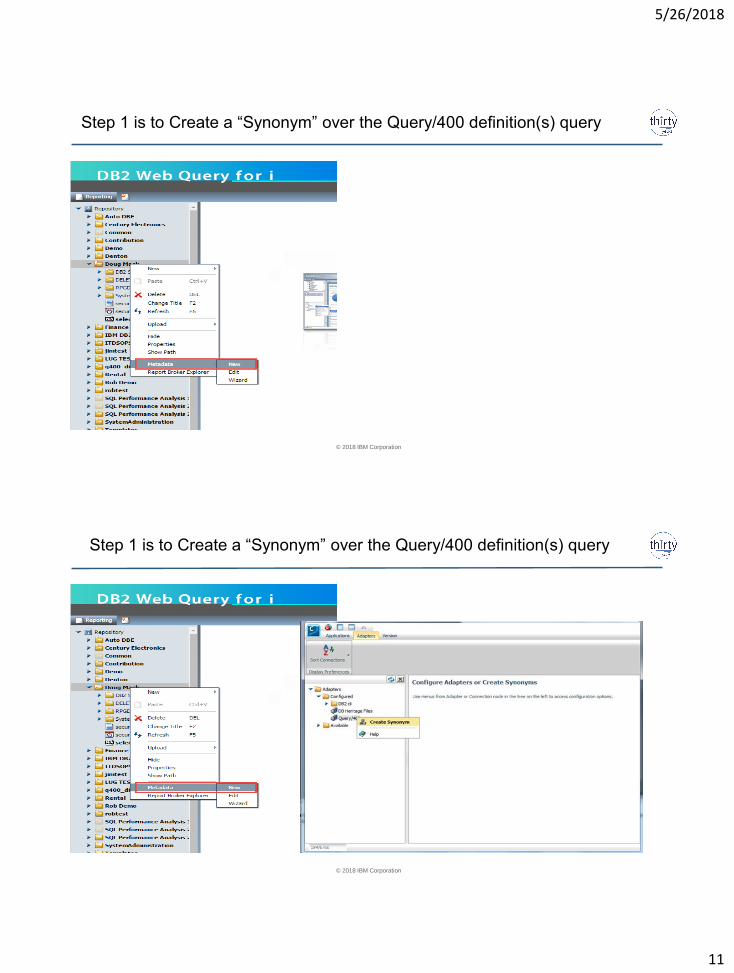
Query/400 to DB2 Web Query
• Imports your existing QRYDFN to DB2 Web
Query browser reports
• Can import “all” per Library
• Can still run the green screen version (but why
would you?)
• If the green screen version changes, you’d need
to re-import
• There ARE some limitations
– We’ll get to those later
5/26/2018
11
© 2018 IBM Corporation
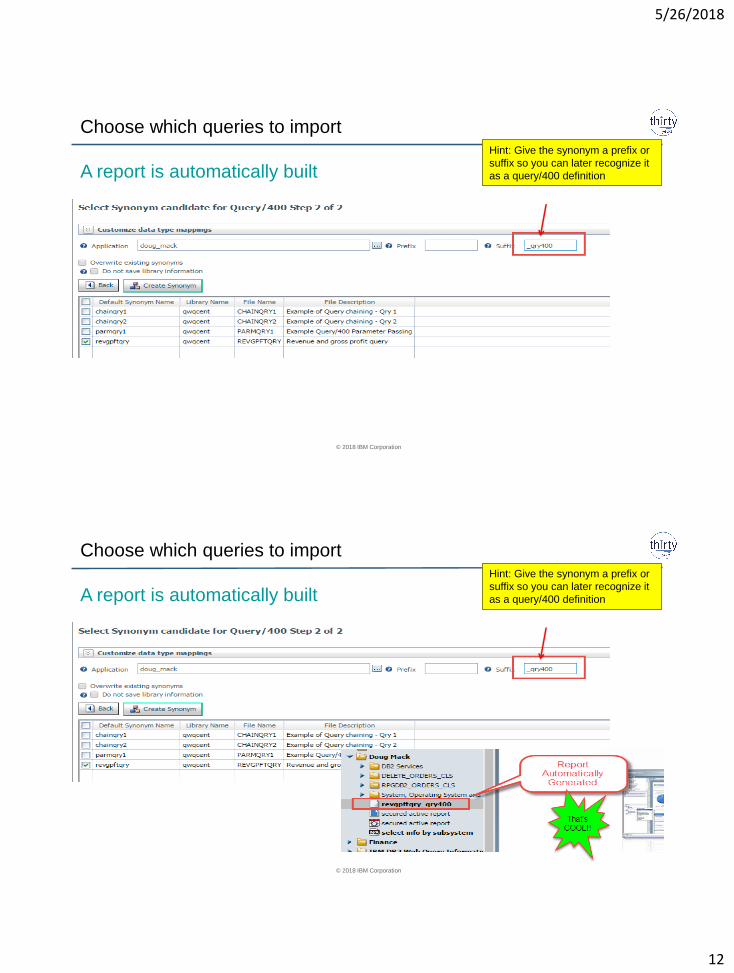
Step 1 is to Create a “Synonym” over the Query/400 definition(s) query
© 2018 IBM Corporation
Step 1 is to Create a “Synonym” over the Query/400 definition(s) query
5/26/2018
12
© 2018 IBM Corporation
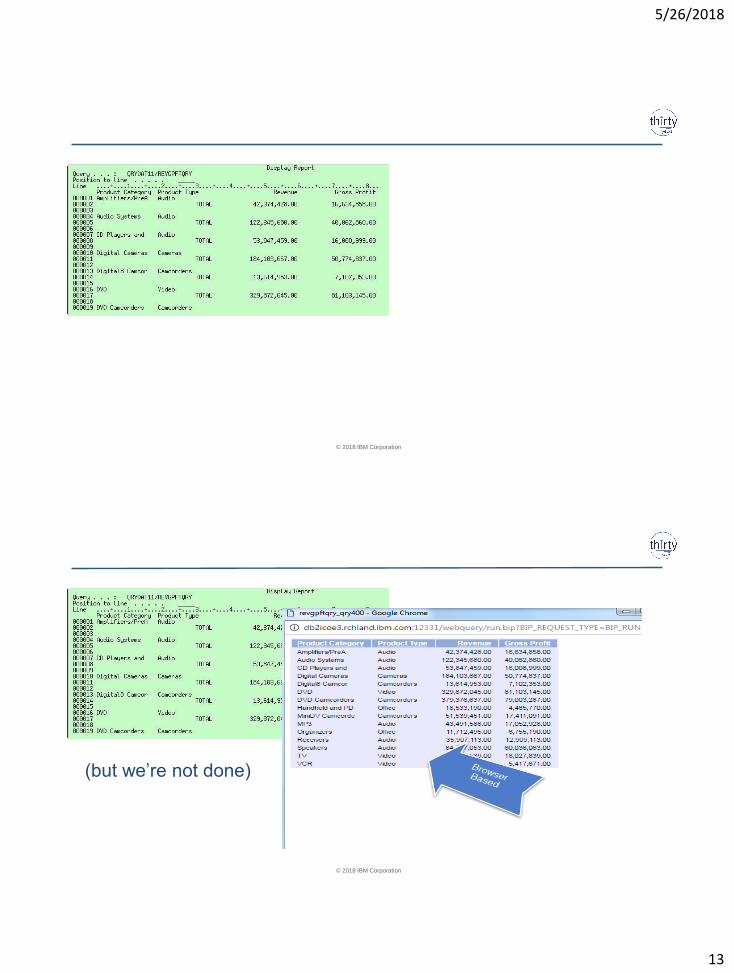
Choose which queries to import
A report is automatically built
Hint: Give the synonym a prefix or
suffix so you can later recognize it
as a query/400 definition
© 2018 IBM Corporation
Choose which queries to import
A report is automatically built
Hint: Give the synonym a prefix or
suffix so you can later recognize it
as a query/400 definition
5/26/2018
13
© 2018 IBM Corporation
© 2018 IBM Corporation
(but we’re not done)
5/26/2018
14
© 2018 IBM Corporation
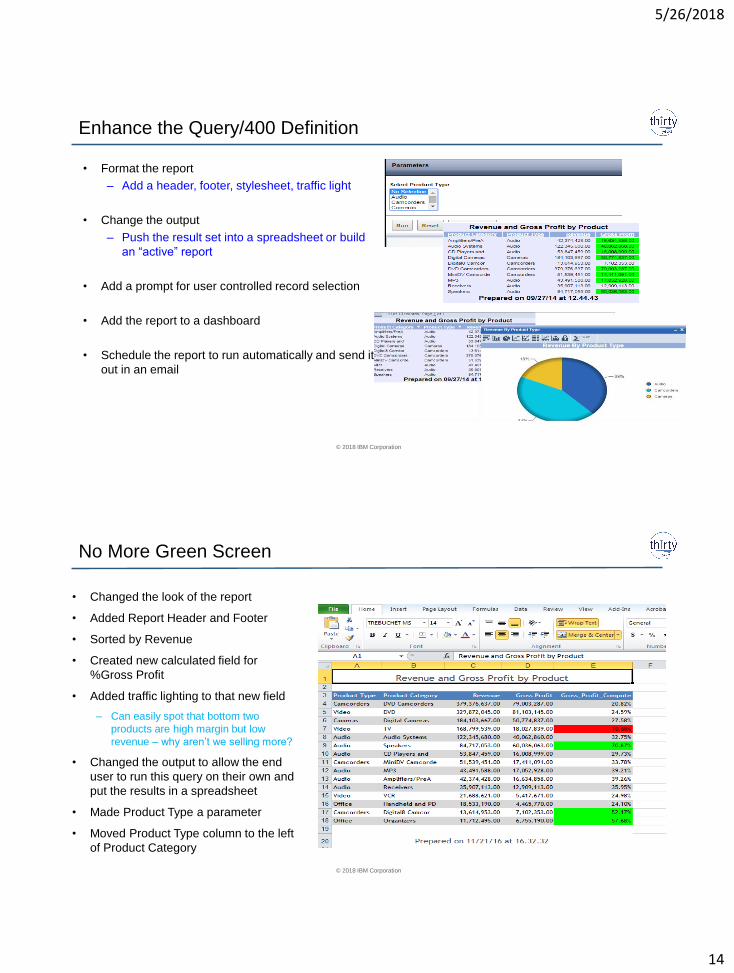
Enhance the Query/400 Definition
• Format the report
– Add a header, footer, stylesheet, traffic light
• Change the output
– Push the result set into a spreadsheet or build
an “active” report
• Add a prompt for user controlled record selection
• Add the report to a dashboard
• Schedule the report to run automatically and send it
out in an email
© 2018 IBM Corporation
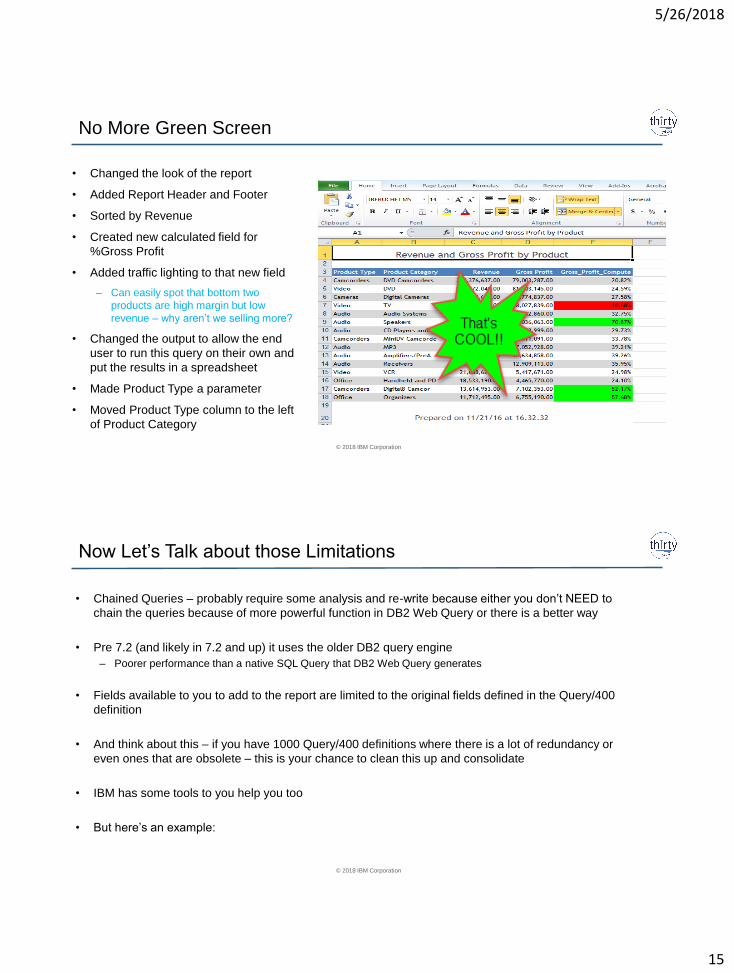
No More Green Screen
• Changed the look of the report
• Added Report Header and Footer
• Sorted by Revenue
• Created new calculated field for
%Gross Profit
• Added traffic lighting to that new field
– Can easily spot that bottom two
products are high margin but low
revenue – why aren’t we selling more?
• Changed the output to allow the end
user to run this query on their own and
put the results in a spreadsheet
• Made Product Type a parameter
• Moved Product Type column to the left
of Product Category
5/26/2018
15
© 2018 IBM Corporation
No More Green Screen
• Changed the look of the report
• Added Report Header and Footer
• Sorted by Revenue
• Created new calculated field for
%Gross Profit
• Added traffic lighting to that new field
– Can easily spot that bottom two
products are high margin but low
revenue – why aren’t we selling more?
• Changed the output to allow the end
user to run this query on their own and
put the results in a spreadsheet
• Made Product Type a parameter
• Moved Product Type column to the left
of Product Category
© 2018 IBM Corporation
Now Let’s Talk about those Limitations
• Chained Queries – probably require some analysis and re-write because either you don’t NEED to
chain the queries because of more powerful function in DB2 Web Query or there is a better way
• Pre 7.2 (and likely in 7.2 and up) it uses the older DB2 query engine
– Poorer performance than a native SQL Query that DB2 Web Query generates
• Fields available to you to add to the report are limited to the original fields defined in the Query/400
definition
• And think about this – if you have 1000 Query/400 definitions where there is a lot of redundancy or
even ones that are obsolete – this is your chance to clean this up and consolidate
• IBM has some tools to you help you too
• But here’s an example:
5/26/2018
16
© 2018 IBM Corporation
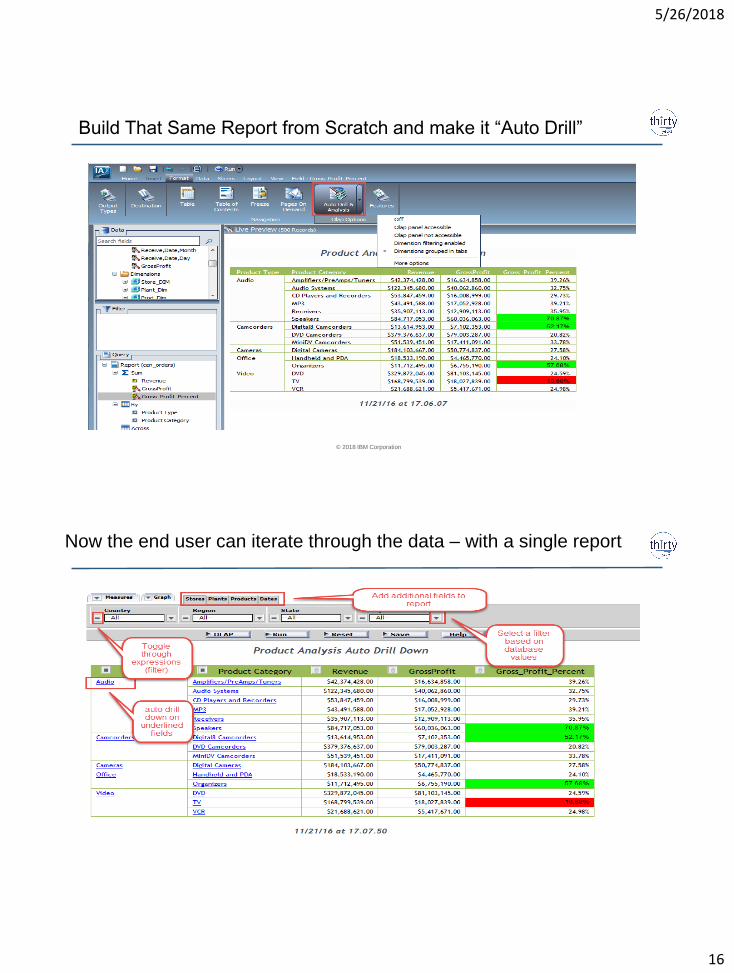
Build That Same Report from Scratch and make it “Auto Drill”
© 2018 IBM Corporation
Now the end user can iterate through the data – with a single report
5/26/2018
17
© 2018 IBM Corporation
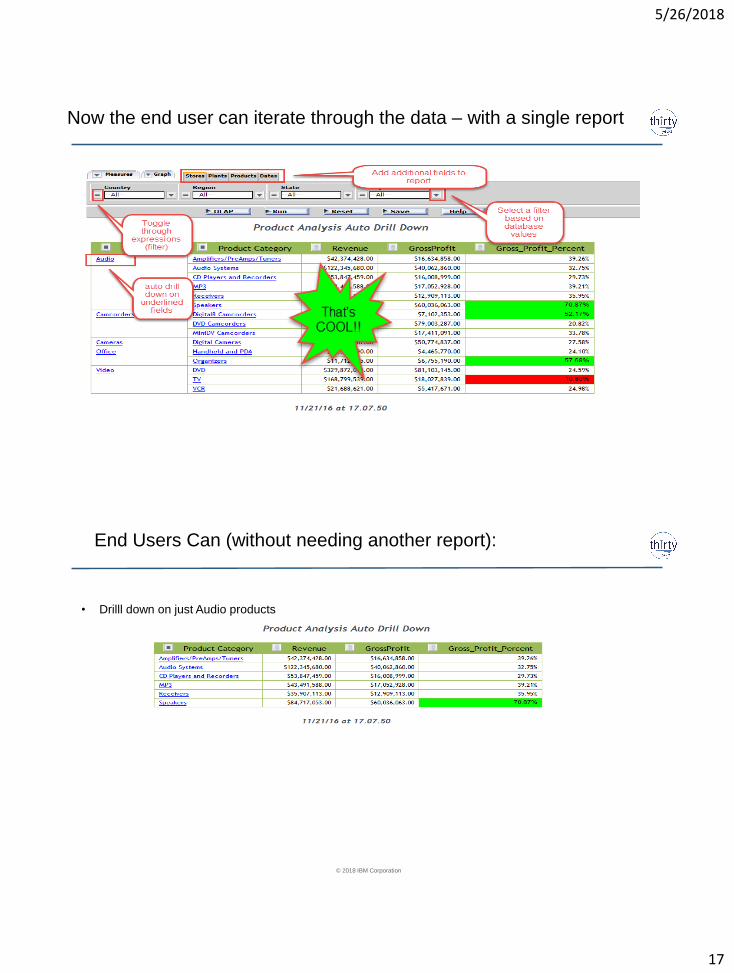
Now the end user can iterate through the data – with a single report
© 2018 IBM Corporation
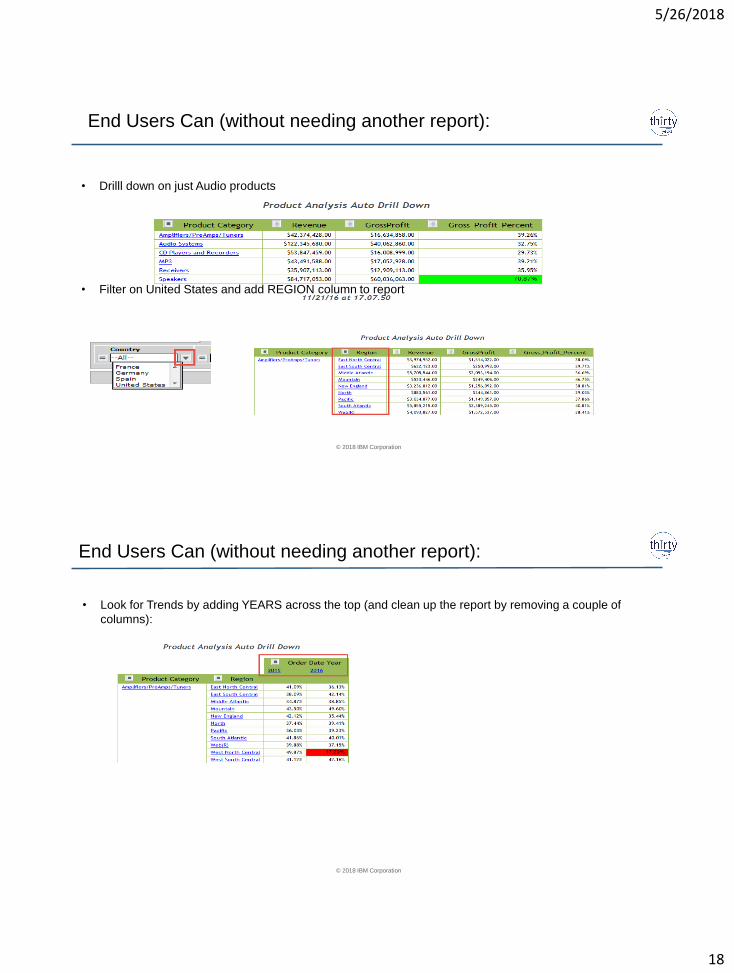
End Users Can (without needing another report):
• Drilll down on just Audio products
5/26/2018
18
© 2018 IBM Corporation
End Users Can (without needing another report):
• Drilll down on just Audio products
• Filter on United States and add REGION column to report
© 2018 IBM Corporation
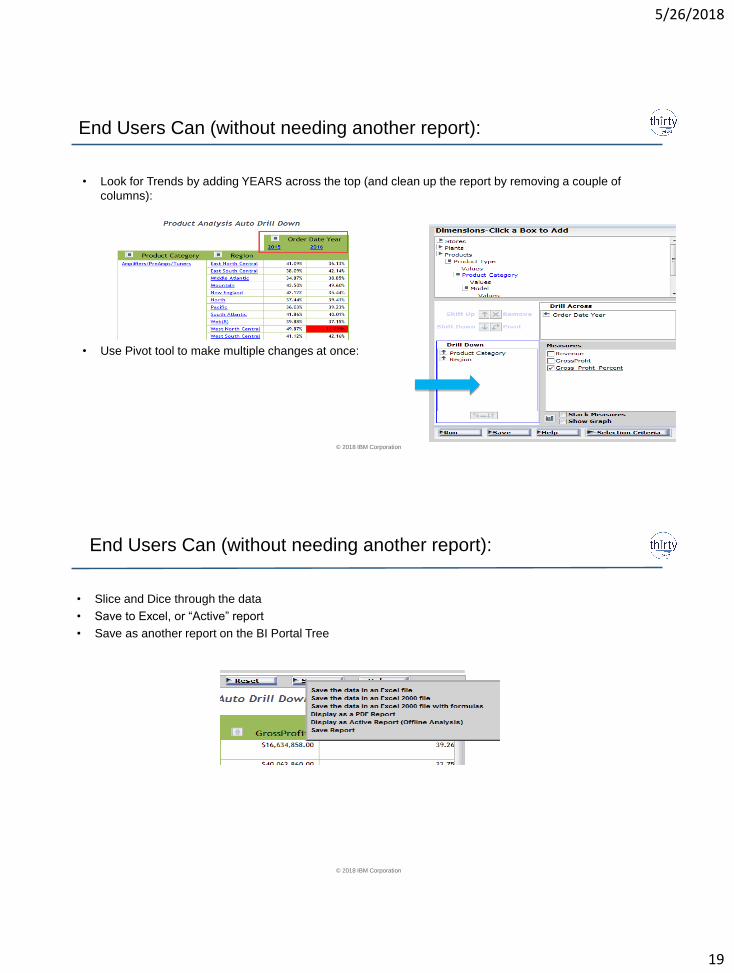
End Users Can (without needing another report):
• Look for Trends by adding YEARS across the top (and clean up the report by removing a couple of
columns):
5/26/2018
19
© 2018 IBM Corporation
End Users Can (without needing another report):
• Look for Trends by adding YEARS across the top (and clean up the report by removing a couple of
columns):
• Use Pivot tool to make multiple changes at once:
© 2018 IBM Corporation
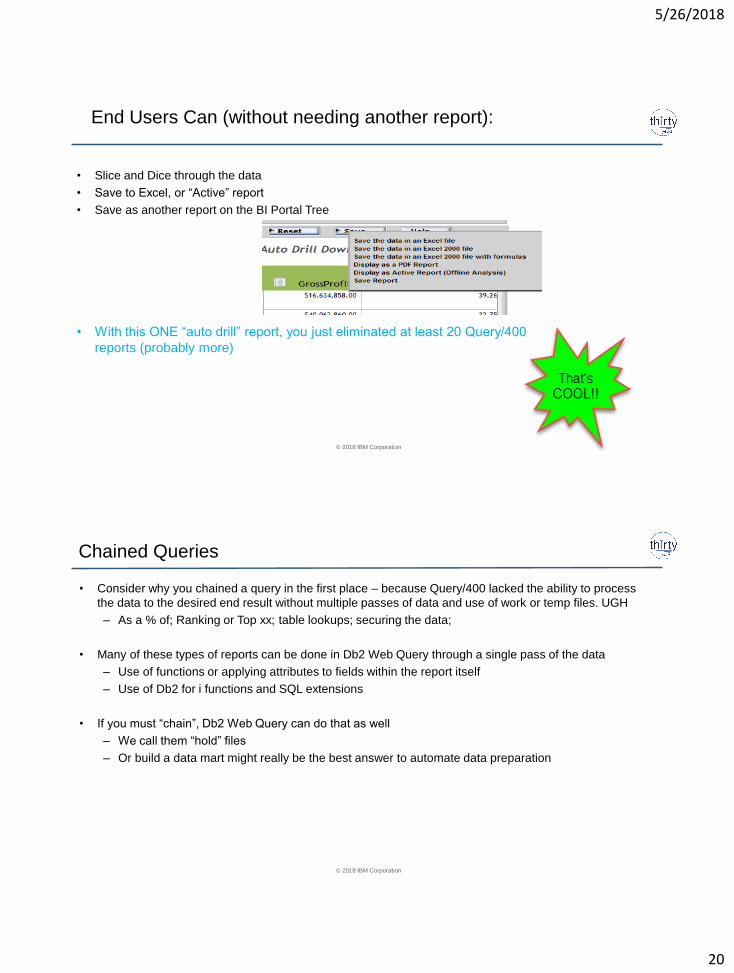
End Users Can (without needing another report):
• Slice and Dice through the data
• Save to Excel, or “Active” report
• Save as another report on the BI Portal Tree
5/26/2018
20
© 2018 IBM Corporation
End Users Can (without needing another report):
• Slice and Dice through the data
• Save to Excel, or “Active” report
• Save as another report on the BI Portal Tree
• With this ONE “auto drill” report, you just eliminated at least 20 Query/400
reports (probably more)
© 2018 IBM Corporation
Chained Queries
• Consider why you chained a query in the first place – because Query/400 lacked the ability to process
the data to the desired end result without multiple passes of data and use of work or temp files. UGH
– As a % of; Ranking or Top xx; table lookups; securing the data;
• Many of these types of reports can be done in Db2 Web Query through a single pass of the data
– Use of functions or applying attributes to fields within the report itself
– Use of Db2 for i functions and SQL extensions
• If you must “chain”, Db2 Web Query can do that as well
– We call them “hold” files
– Or build a data mart might really be the best answer to automate data preparation
5/26/2018
21
© 2018 IBM Corporation
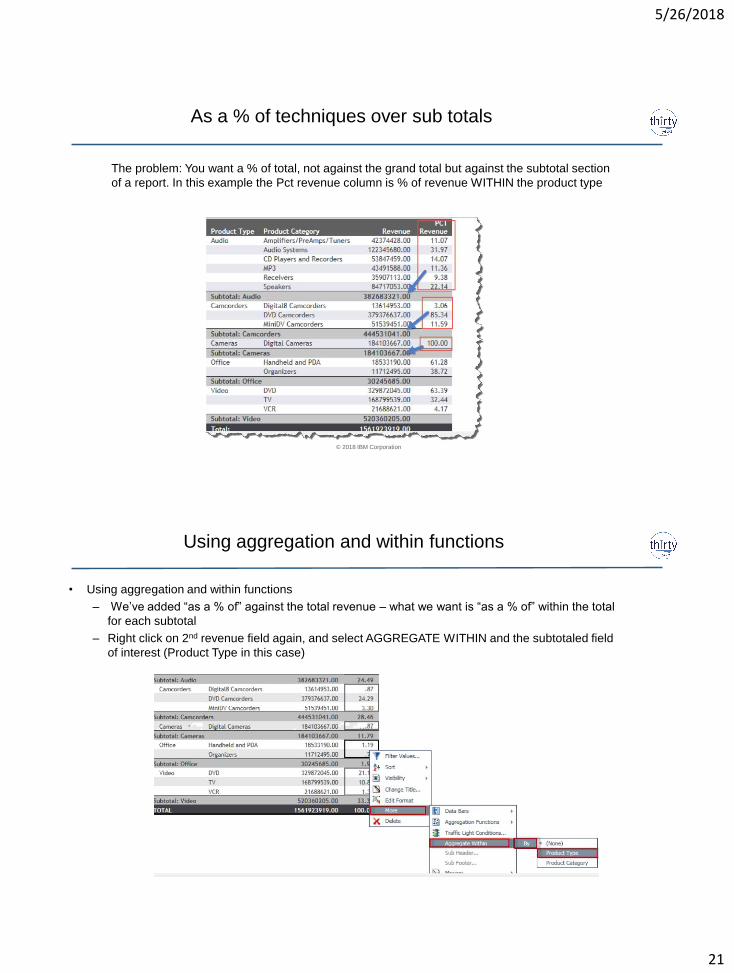
As a % of techniques over sub totals
The problem: You want a % of total, not against the grand total but against the subtotal section
of a report. In this example the Pct revenue column is % of revenue WITHIN the product type
© 2018 IBM Corporation
Using aggregation and within functions
• Using aggregation and within functions
– We’ve added “as a % of” against the total revenue – what we want is “as a % of” within the total
for each subtotal
– Right click on 2nd revenue field again, and select AGGREGATE WITHIN and the subtotaled field
of interest (Product Type in this case)
5/26/2018
22
© 2018 IBM Corporation
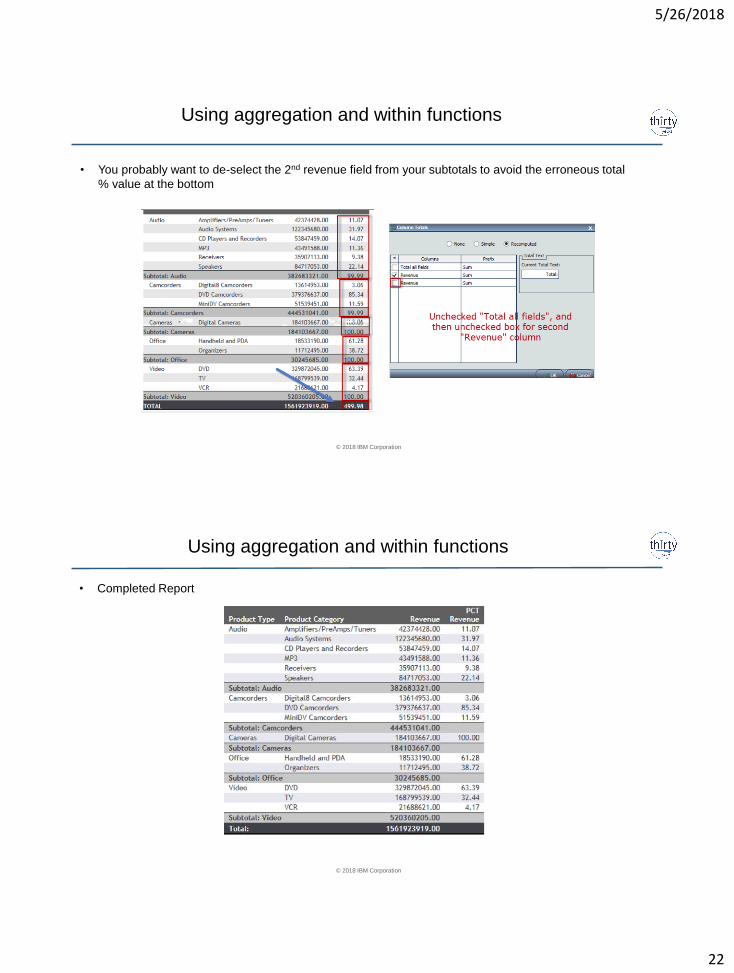
Using aggregation and within functions
• You probably want to de-select the 2nd revenue field from your subtotals to avoid the erroneous total
% value at the bottom
© 2018 IBM Corporation
Using aggregation and within functions
• Completed Report
5/26/2018
23
© 2018 IBM Corporation
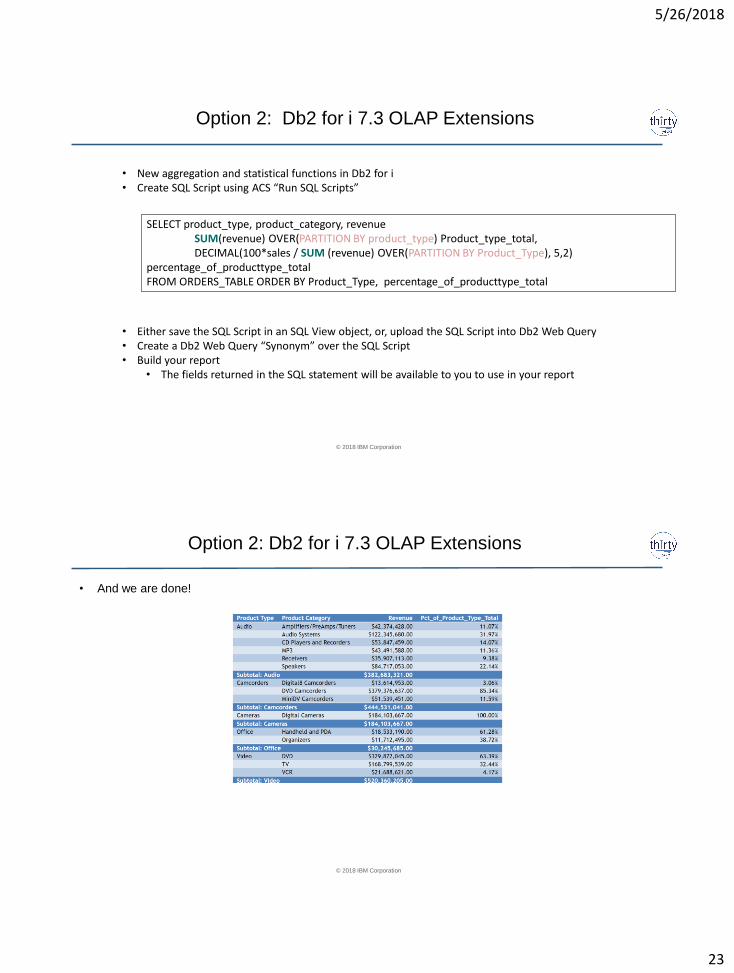
Option 2: Db2 for i 7.3 OLAP Extensions
SELECT product_type, product_category, revenue SUM(revenue) OVER(PARTITION BY product_type) Product_type_total, DECIMAL(100*sales / SUM (revenue) OVER(PARTITION BY Product_Type), 5,2)
percentage_of_producttype_totalFROM ORDERS_TABLE ORDER BY Product_Type, percentage_of_producttype_total
• New aggregation and statistical functions in Db2 for i• Create SQL Script using ACS “Run SQL Scripts”
• Either save the SQL Script in an SQL View object, or, upload the SQL Script into Db2 Web Query• Create a Db2 Web Query “Synonym” over the SQL Script• Build your report
• The fields returned in the SQL statement will be available to you to use in your report
© 2018 IBM Corporation
Option 2: Db2 for i 7.3 OLAP Extensions
• And we are done!

5/26/2018
24
© 2018 IBM Corporation
Questions?