questionnaire survey on the - transform! europe€¦ · questionnaire survey on the data, ......
TRANSCRIPT
Athens 2013
QUESTIONNAIRE SURVEY ON THE
Data, profiles, personal values and views of delegates at the 3rd EL Congress, 3-5 December 2010, Paris
NICOS
POULANTZAS
INSTITUTE

1 1
This document does not represent the point of view of the Party of the European Left.
The interpretation and opinions contained in it are solely those of the authors.
2 2
Table of contents
Introduction and a brief summary of the results ...................................................................... 3
1. Profile of the delegates ..................................................................................................... 7
1.1 Age, marital and parental status ..................................................................................... 8
1.2 Education, internet use ................................................................................................. 11
1.3 Occupation, Income....................................................................................................... 17
1.4 Years of national party membership, position in the national party ............................ 20
1.5 Participation in trade-unions and social movements .................................................... 26
2. Values of the delegates ................................................................................................... 31
2.1 Attitude towards immigrants ........................................................................................ 32
2.2 Attitude towards violence ............................................................................................. 35
2.3 Attitude towards drug use, abortion and same sex marriage ....................................... 39
2.4 Religiousness ................................................................................................................. 42
3. Views of the delegates on various issues ........................................................................ 43
3.1 The economic crisis and its impact on national parties attitude towards the EU ......... 44
3.2 National parties and social movements ........................................................................ 47
3.3 Placement on the Left-Right axis ................................................................................... 49
3.4 National and European identity .................................................................................... 54
3.5 Democracy and the European Union ............................................................................ 57
3.6 Impact of EU membership ............................................................................................. 63
4. Evaluation of the Party of the European Left by the delegates ...................................... 65
4.1Discourse ........................................................................................................................ 66
4.2 Policies ........................................................................................................................... 67
4.3 Party bodies ................................................................................................................... 69
4.4 Impact on national parties ............................................................................................ 70
4.5 Impact on EU politics ..................................................................................................... 71
4.6 Impact on the campaign for the European elections .................................................... 72
4.7 Desirable future priorities ............................................................................................. 73
4.8 Views regarding the desirable structure of the EL ........................................................ 74
Appendix .................................................................................................................................. 77
Survey Details ...................................................................................................................... 78
Questionnaire ...................................................................................................................... 81
3 3
Introduction and a brief summary of the results
4 4
The present Survey on the Party of the European Left is based on the answers given to a
questionnaire by the delegates of the 3rd Congress of the Party of the European Left, held in
Paris on 3-5 December 2010. This Survey is a product of the on-going, since 2009, “Left
Strategy” project of transform! Europe, dealing with issues that can be useful to the parties
of the so called “radical” or “transformative” Left, as well as to the EL, in the setting of their
policies.
The EL itself has conducted a similar Survey in the past, which was based on a questionnaire
answered by the delegates of its 2nd Congress, held in Prague on 23-25 November 2007.
However, that first effort was rather limited and referred almost exclusively to the
demographic data of the delegates. In this sense, the present transform! / Nicos Poulantzas
Institute Survey is the first extended exercise of this kind, which will hopefully have a follow-
up so that one can have meaningful comparisons of the respective results.
The text is divided in four sections:
A. Profile of the delegates
B. Values of the delegates
C. Views of the values of the delegates on various issues
D. Evaluation of the Party of the European Left by the delegates
The technical specifications of the Survey (sampling method, sample size, regional
classification of the delegates’ parties, Questionnaire) are included in the Appendix.
The answers to the questionnaire were classified by sex, age and region. On some issues this
classification revealed significant differences in the delegates’ answers. Regional differences
were more distinct, especially regarding the answers of delegates representing parties from
Eastern Europe.
Although the reading of all chapters of the Survey is advisable, we present here a very brief
summary of that part of the Survey which we consider more important.
A. Profile of the delegates
Delegates in the 3rd EL Congress are on average over 45 years of age, university graduates
and frequent internet users (who, however, rarely or never visit the EL website and portal),
they can communicate mainly in English and are high ranking cadres of their parties in which
they are active for more than 10 years. They have (or had in the past) a very high rate of
participation in trade-unions but not in social movements, with the exception of
student/youth organizations. They are wage earners with an income highly differentiated in
regional terms: the overwhelming majority of delegates form parties of Eastern Europe earn
less than 20.000 Euro per year, while the opposite is the case with delegates from Southern
and Northern Europe. Western European delegates are clustered equally around the 20.000
euro annual income.
5 5
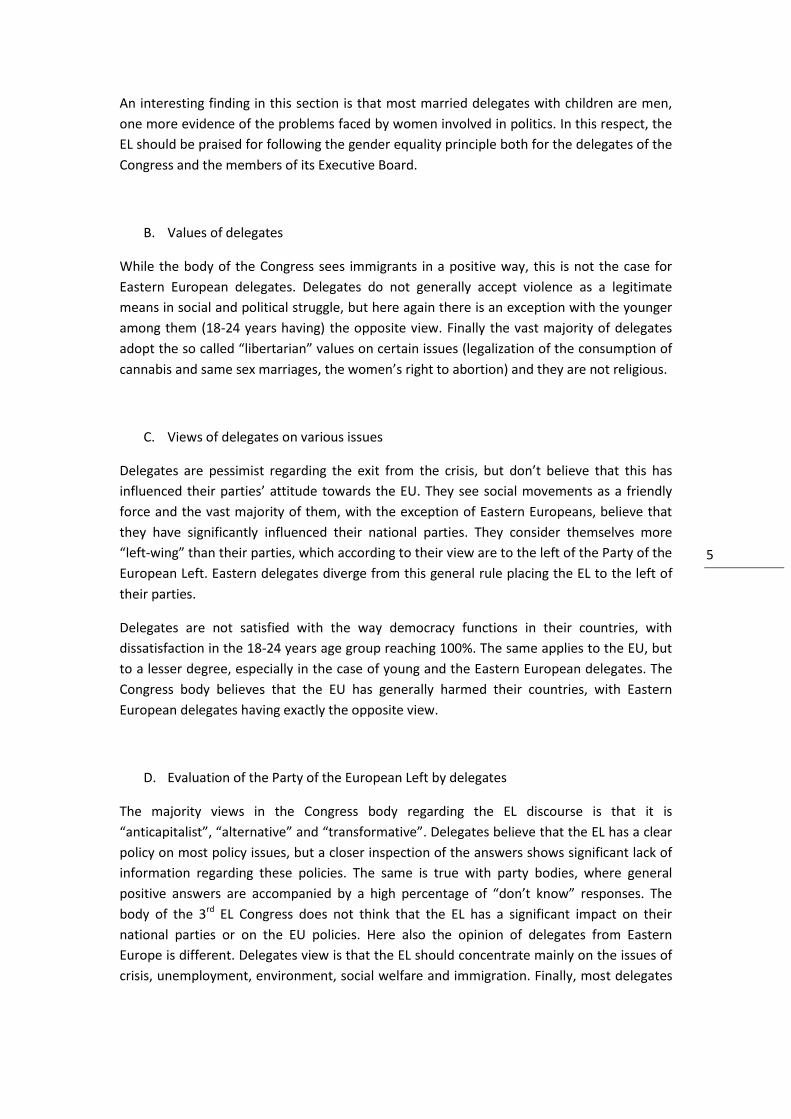
An interesting finding in this section is that most married delegates with children are men,
one more evidence of the problems faced by women involved in politics. In this respect, the
EL should be praised for following the gender equality principle both for the delegates of the
Congress and the members of its Executive Board.
B. Values of delegates
While the body of the Congress sees immigrants in a positive way, this is not the case for
Eastern European delegates. Delegates do not generally accept violence as a legitimate
means in social and political struggle, but here again there is an exception with the younger
among them (18-24 years having) the opposite view. Finally the vast majority of delegates
adopt the so called “libertarian” values on certain issues (legalization of the consumption of
cannabis and same sex marriages, the women’s right to abortion) and they are not religious.
C. Views of delegates on various issues
Delegates are pessimist regarding the exit from the crisis, but don’t believe that this has
influenced their parties’ attitude towards the EU. They see social movements as a friendly
force and the vast majority of them, with the exception of Eastern Europeans, believe that
they have significantly influenced their national parties. They consider themselves more
“left-wing” than their parties, which according to their view are to the left of the Party of the
European Left. Eastern delegates diverge from this general rule placing the EL to the left of
their parties.
Delegates are not satisfied with the way democracy functions in their countries, with
dissatisfaction in the 18-24 years age group reaching 100%. The same applies to the EU, but
to a lesser degree, especially in the case of young and the Eastern European delegates. The
Congress body believes that the EU has generally harmed their countries, with Eastern
European delegates having exactly the opposite view.
D. Evaluation of the Party of the European Left by delegates
The majority views in the Congress body regarding the EL discourse is that it is
“anticapitalist”, “alternative” and “transformative”. Delegates believe that the EL has a clear
policy on most policy issues, but a closer inspection of the answers shows significant lack of
information regarding these policies. The same is true with party bodies, where general
positive answers are accompanied by a high percentage of “don’t know” responses. The
body of the 3rd EL Congress does not think that the EL has a significant impact on their
national parties or on the EU policies. Here also the opinion of delegates from Eastern
Europe is different. Delegates view is that the EL should concentrate mainly on the issues of
crisis, unemployment, environment, social welfare and immigration. Finally, most delegates
6 6
prefer more a “looser” than a “stricter” EL structure with those coming from parties of
Eastern Europe divided in two.
Acknowledgments
We wish to express our sincere thanks to:
Alexandros Bistis and Vasilis Filippou who had a leading role in the questionnaire
development and were responsible for the team which did the fieldwork
Stavros Panagiotidis for his assistance in the field work and the data entry
Natassa Theodorakopoulou and the Managing Board of transform! for their valuable
comments during the period of the development of the questionnaire
The EL Executive Board and all EL member parties for the translation of the questionnaire in
different languages
The chairpersons of the Congress for their continuing reminders to delegates to fill the
questionnaire.
Haris Golemis, Vagia Lysikatou
7 7
1. Profile of the delegates
8 8
1.1 Age, marital and parental status
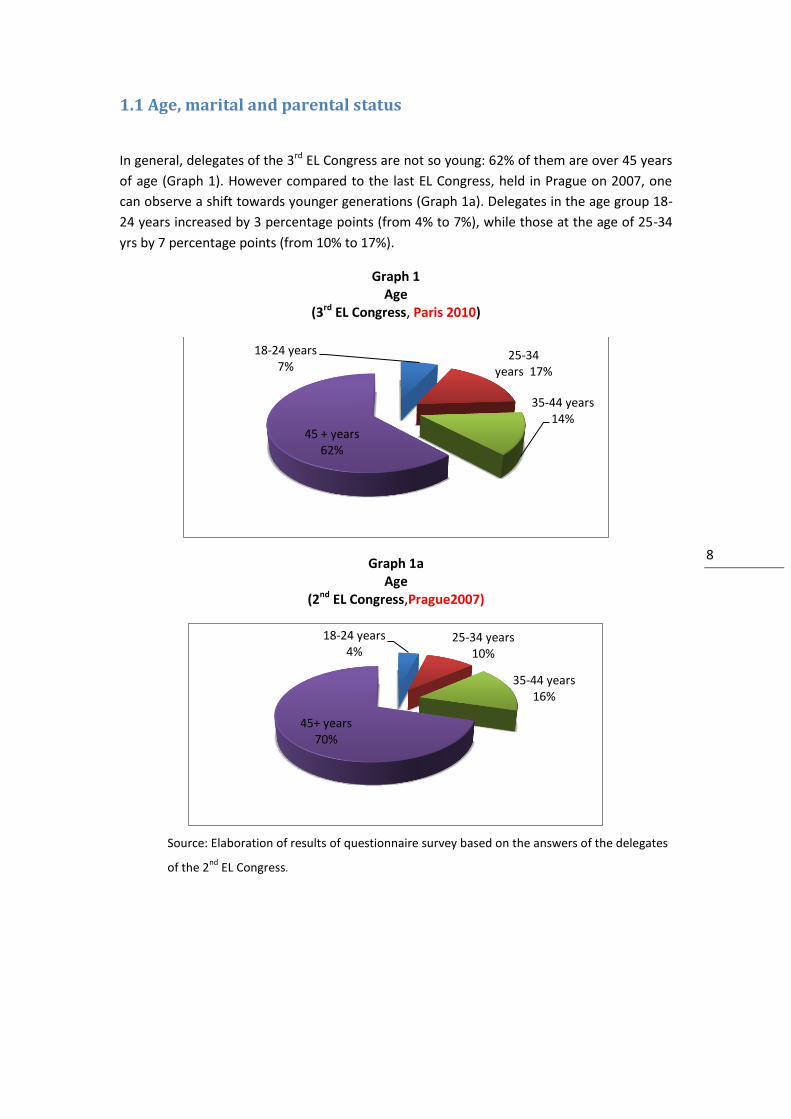
In general, delegates of the 3rd EL Congress are not so young: 62% of them are over 45 years
of age (Graph 1). However compared to the last EL Congress, held in Prague on 2007, one
can observe a shift towards younger generations (Graph 1a). Delegates in the age group 18-
24 years increased by 3 percentage points (from 4% to 7%), while those at the age of 25-34
yrs by 7 percentage points (from 10% to 17%).
Graph 1 Age
(3rd EL Congress, Paris 2010)
Graph 1a Age
(2nd EL Congress,Prague2007)
Source: Elaboration of results of questionnaire survey based on the answers of the delegates
of the 2nd
EL Congress.
18-24 years 7%
25-34 years 17%
35-44 years 14%
45 + years 62%
18-24 years 4%
25-34 years 10%
35-44 years 16%
45+ years 70%
9 9
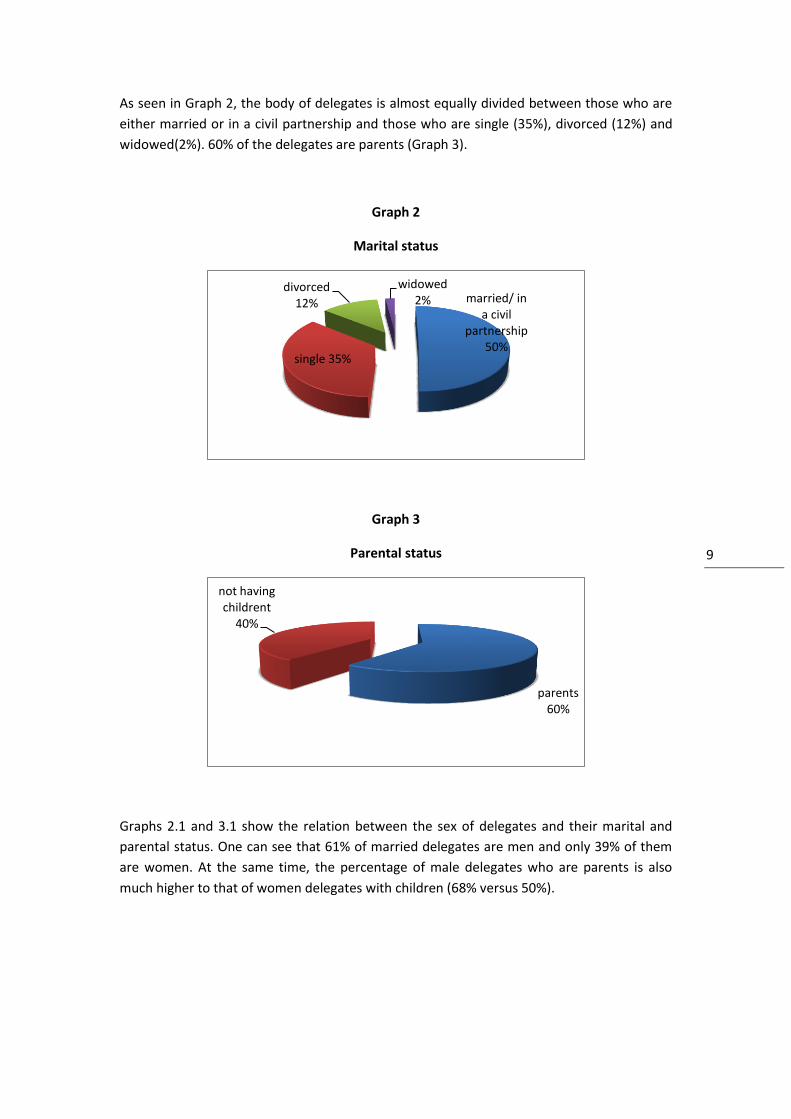
As seen in Graph 2, the body of delegates is almost equally divided between those who are
either married or in a civil partnership and those who are single (35%), divorced (12%) and
widowed(2%). 60% of the delegates are parents (Graph 3).
Graph 2
Marital status
Graph 3
Parental status
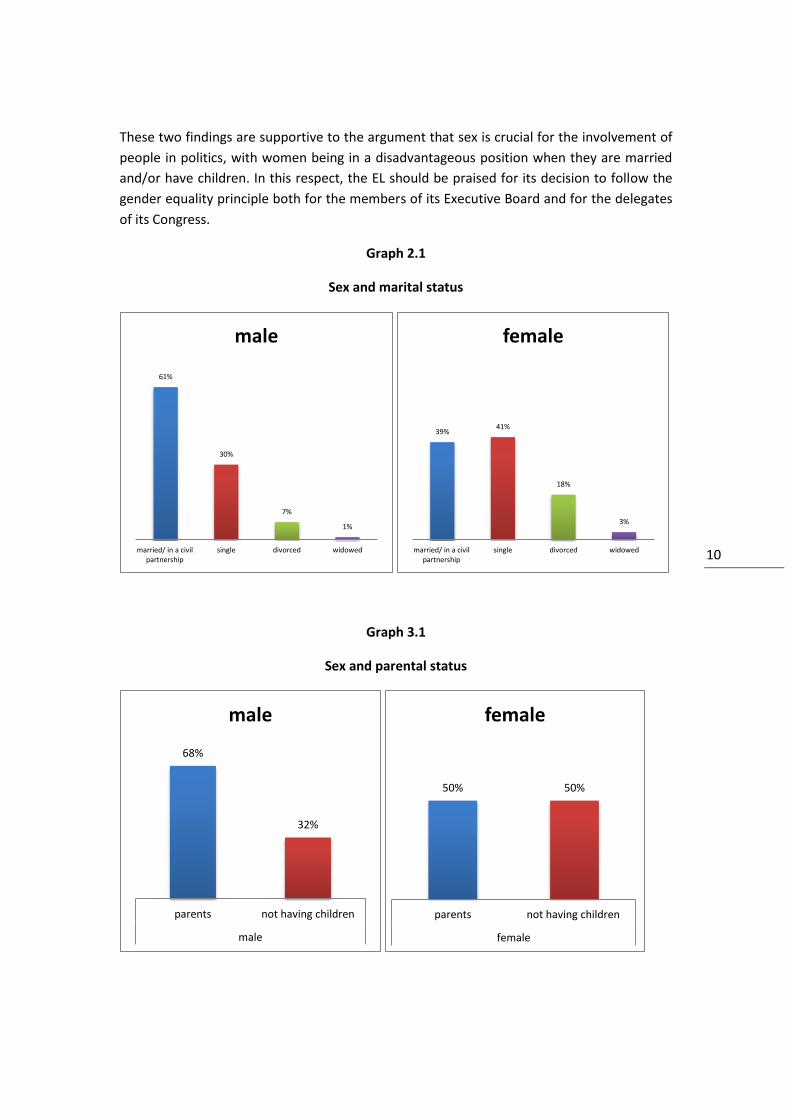
Graphs 2.1 and 3.1 show the relation between the sex of delegates and their marital and
parental status. One can see that 61% of married delegates are men and only 39% of them
are women. At the same time, the percentage of male delegates who are parents is also
much higher to that of women delegates with children (68% versus 50%).
married/ in a civil
partnership 50%
single 35%
divorced 12%
widowed 2%
parents 60%
not having childrent
40%
10 10
These two findings are supportive to the argument that sex is crucial for the involvement of
people in politics, with women being in a disadvantageous position when they are married
and/or have children. In this respect, the EL should be praised for its decision to follow the
gender equality principle both for the members of its Executive Board and for the delegates
of its Congress.
Graph 2.1
Sex and marital status
Graph 3.1
Sex and parental status
61%
30%
7%
1%
married/ in a civil partnership
single divorced widowed
male
39% 41%
18%
3%
married/ in a civil partnership
single divorced widowed
female
68%
32%
parents not having children
male
male
50% 50%
parents not having children
female
female
11 11
1.2 Education, internet use
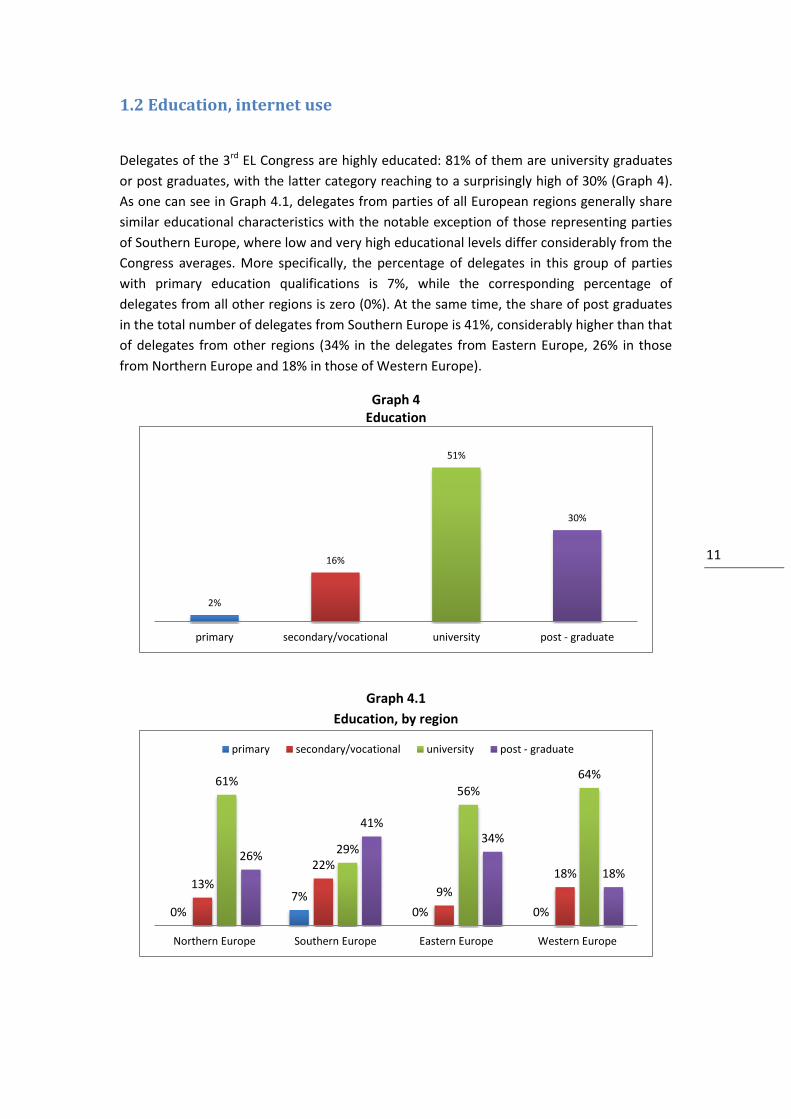
Delegates of the 3rd EL Congress are highly educated: 81% of them are university graduates
or post graduates, with the latter category reaching to a surprisingly high of 30% (Graph 4).
As one can see in Graph 4.1, delegates from parties of all European regions generally share
similar educational characteristics with the notable exception of those representing parties
of Southern Europe, where low and very high educational levels differ considerably from the
Congress averages. More specifically, the percentage of delegates in this group of parties
with primary education qualifications is 7%, while the corresponding percentage of
delegates from all other regions is zero (0%). At the same time, the share of post graduates
in the total number of delegates from Southern Europe is 41%, considerably higher than that
of delegates from other regions (34% in the delegates from Eastern Europe, 26% in those
from Northern Europe and 18% in those of Western Europe).
Graph 4 Education
Graph 4.1
Education, by region
2%
16%
51%
30%
primary secondary/vocational university post - graduate
0% 7%
0% 0%
13%
22%
9%
18%
61%
29%
56%
64%
26%
41% 34%
18%
Northern Europe Southern Europe Eastern Europe Western Europe
primary secondary/vocational university post - graduate
12 12
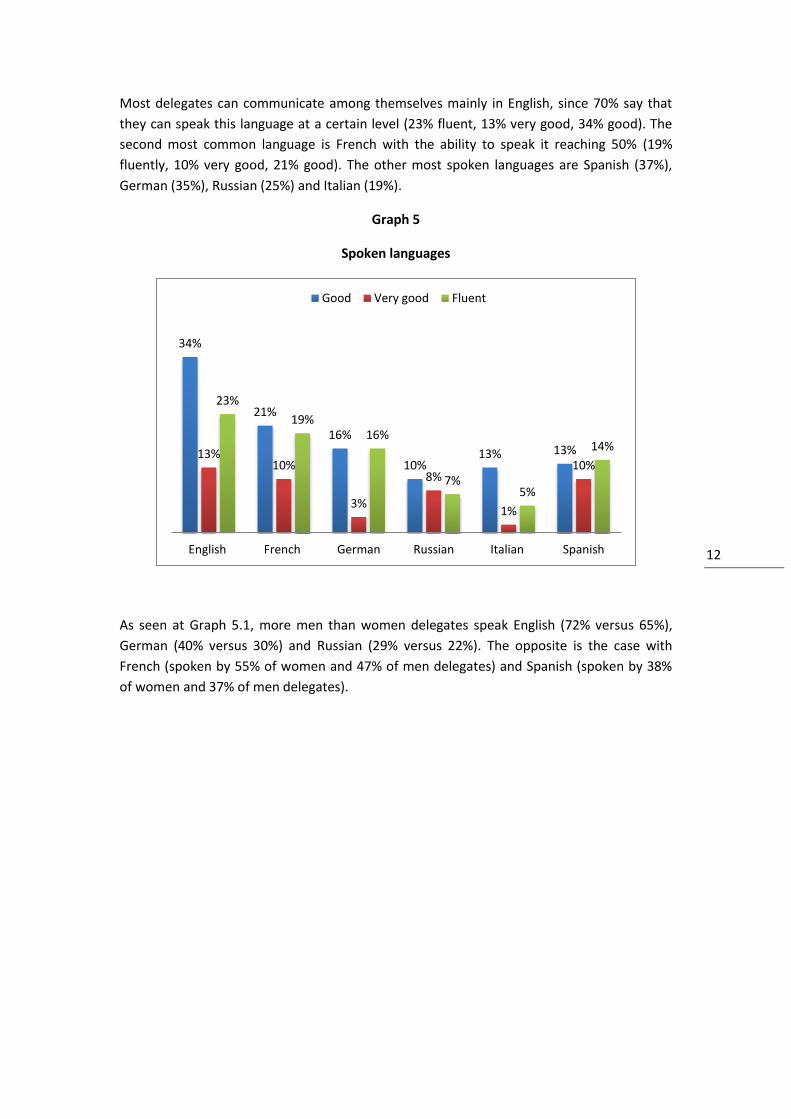
Most delegates can communicate among themselves mainly in English, since 70% say that
they can speak this language at a certain level (23% fluent, 13% very good, 34% good). The
second most common language is French with the ability to speak it reaching 50% (19%
fluently, 10% very good, 21% good). The other most spoken languages are Spanish (37%),
German (35%), Russian (25%) and Italian (19%).
Graph 5
Spoken languages
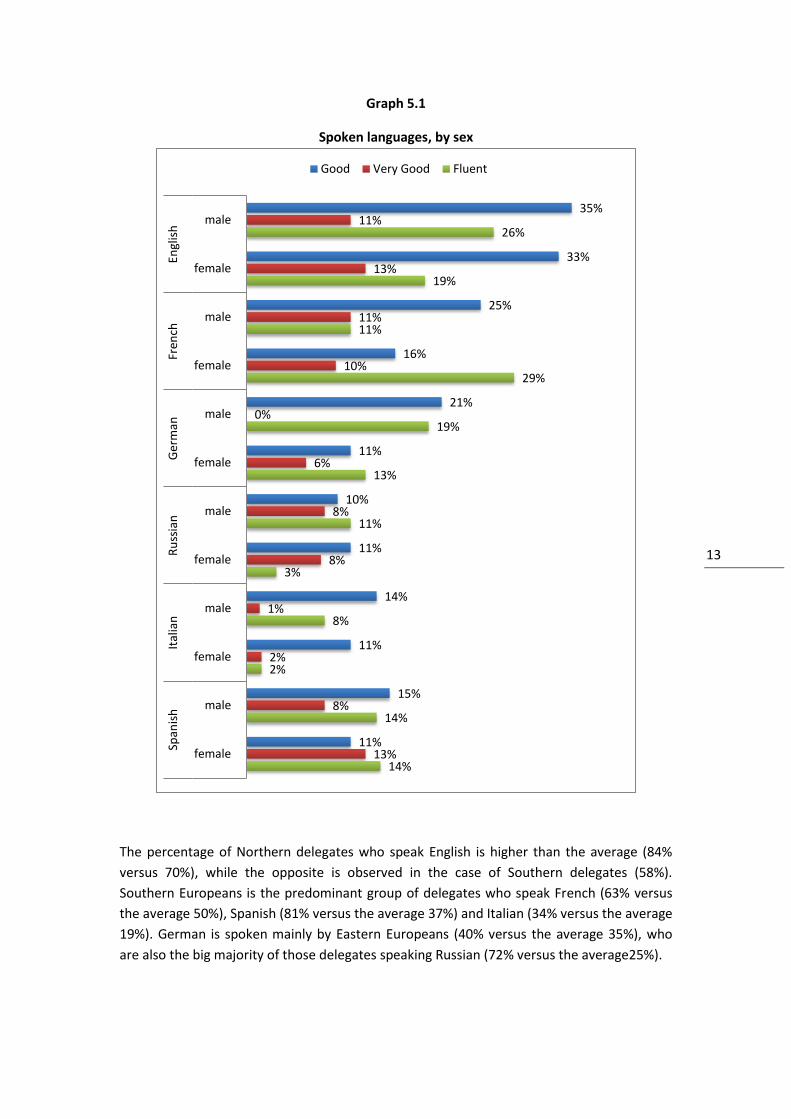
As seen at Graph 5.1, more men than women delegates speak English (72% versus 65%),
German (40% versus 30%) and Russian (29% versus 22%). The opposite is the case with
French (spoken by 55% of women and 47% of men delegates) and Spanish (spoken by 38%
of women and 37% of men delegates).
34%
21%
16%
10% 13% 13% 13%
10%
3%
8%
1%
10%
23%
19% 16%
7% 5%
14%
English French German Russian Italian Spanish
Good Very good Fluent
13 13
Graph 5.1
Spoken languages, by sex
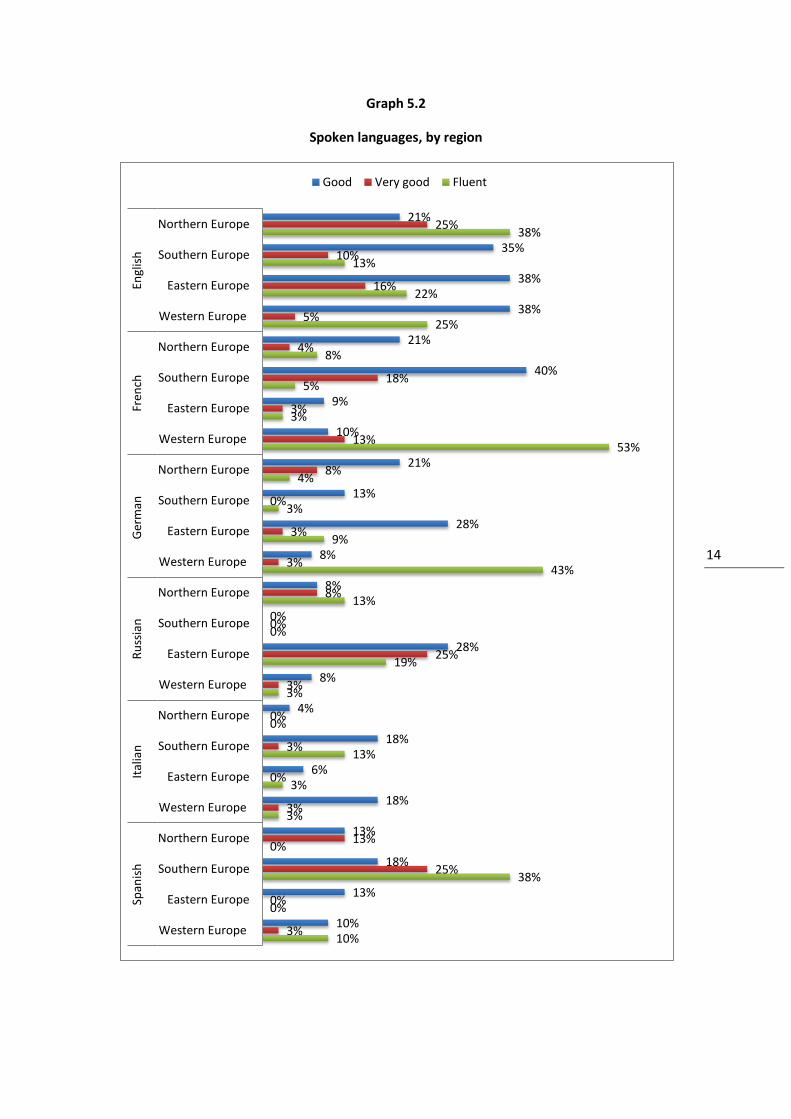
The percentage of Northern delegates who speak English is higher than the average (84%
versus 70%), while the opposite is observed in the case of Southern delegates (58%).
Southern Europeans is the predominant group of delegates who speak French (63% versus
the average 50%), Spanish (81% versus the average 37%) and Italian (34% versus the average
19%). German is spoken mainly by Eastern Europeans (40% versus the average 35%), who
are also the big majority of those delegates speaking Russian (72% versus the average25%).
35%
33%
25%
16%
21%
11%
10%
11%
14%
11%
15%
11%
11%
13%
11%
10%
0%
6%
8%
8%
1%
2%
8%
13%
26%
19%
11%
29%
19%
13%
11%
3%
8%
2%
14%
14%
male
female
male
female
male
female
male
female
male
female
male
female
Engl
ish
Fr
ench
G
erm
an
Ru
ssia
n
Ital
ian
Sp
anis
h
Good Very Good Fluent
14 14
Graph 5.2
Spoken languages, by region
21%
35%
38%
38%
21%
40%
9%
10%
21%
13%
28%
8%
8%
0%
28%
8%
4%
18%
6%
18%
13%
18%
13%
10%
25%
10%
16%
5%
4%
18%
3%
13%
8%
0%
3%
3%
8%
0%
25%
3%
0%
3%
0%
3%
13%
25%
0%
3%
38%
13%
22%
25%
8%
5%
3%
53%
4%
3%
9%
43%
13%
0%
19%
3%
0%
13%
3%
3%
0%
38%
0%
10%
Northern Europe
Southern Europe
Eastern Europe
Western Europe
Northern Europe
Southern Europe
Eastern Europe
Western Europe
Northern Europe
Southern Europe
Eastern Europe
Western Europe
Northern Europe
Southern Europe
Eastern Europe
Western Europe
Northern Europe
Southern Europe
Eastern Europe
Western Europe
Northern Europe
Southern Europe
Eastern Europe
Western Europe
Engl
ish
Fr
ench
G
erm
an
Ru
ssia
n
Ital
ian
Sp
anis
h
Good Very good Fluent
15 15
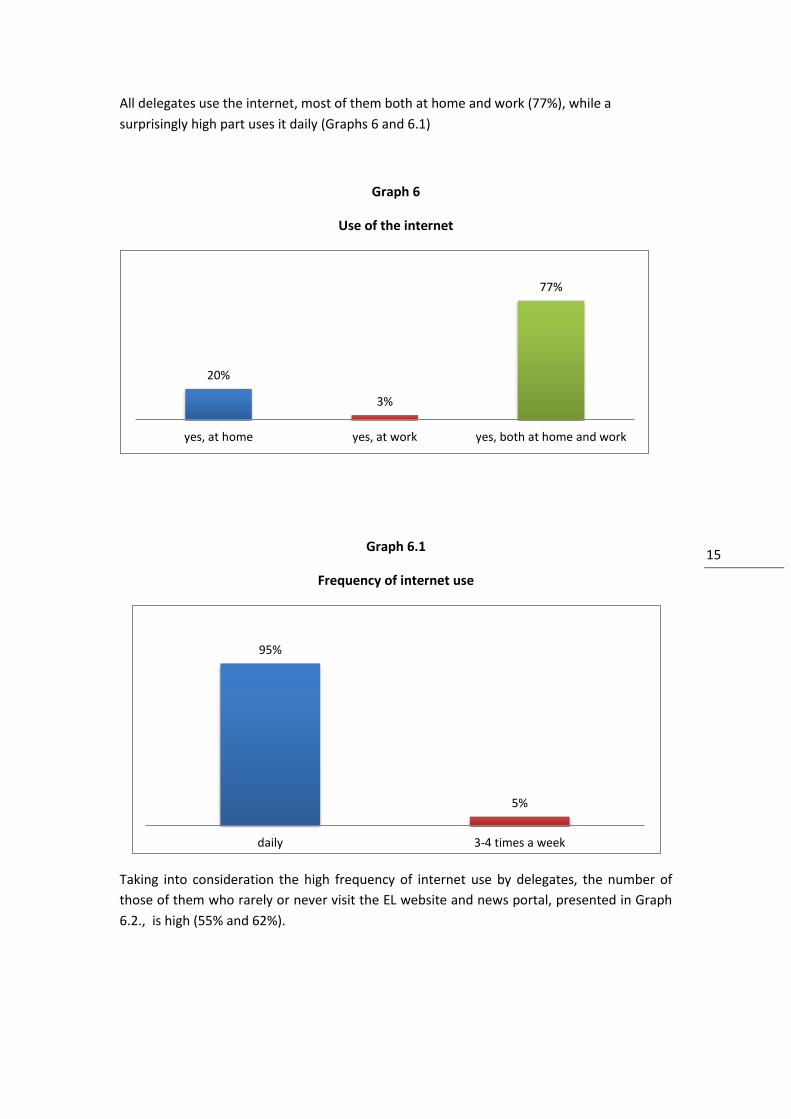
All delegates use the internet, most of them both at home and work (77%), while a
surprisingly high part uses it daily (Graphs 6 and 6.1)
Graph 6
Use of the internet
Graph 6.1
Frequency of internet use
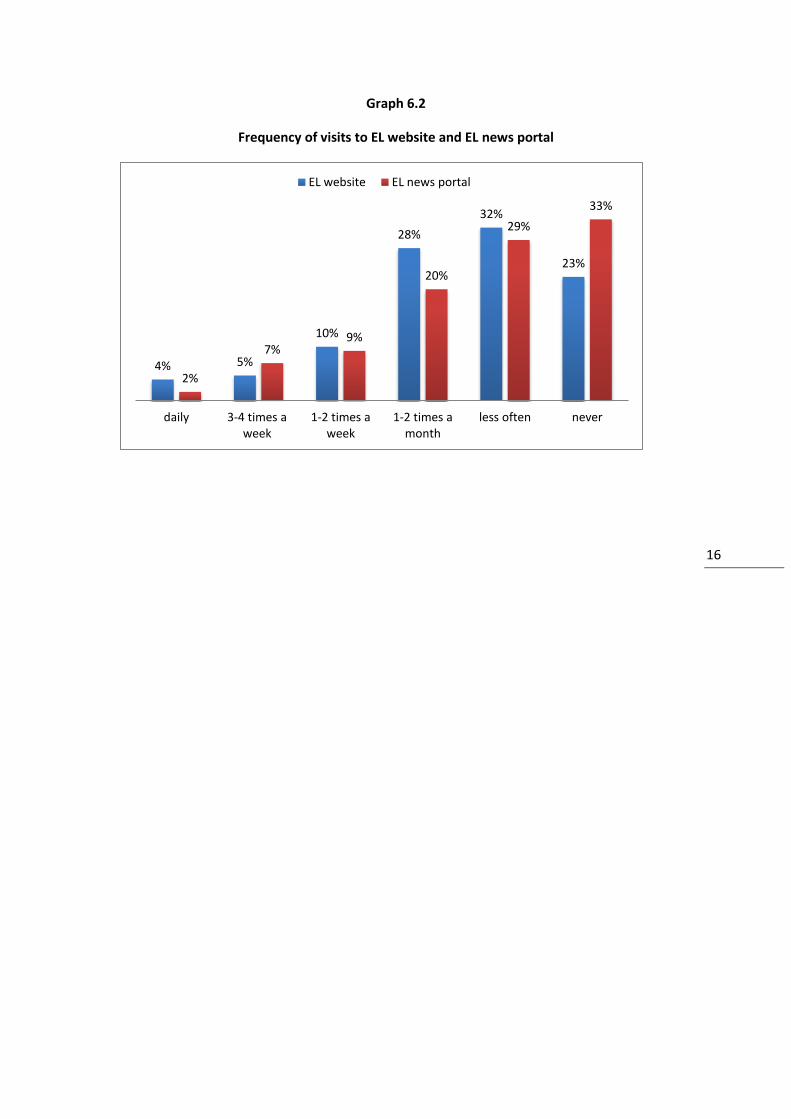
Taking into consideration the high frequency of internet use by delegates, the number of
those of them who rarely or never visit the EL website and news portal, presented in Graph
6.2., is high (55% and 62%).
20%
3%
77%
yes, at home yes, at work yes, both at home and work
95%
5%
daily 3-4 times a week
16 16
Graph 6.2
Frequency of visits to EL website and EL news portal
4% 5%
10%
28%
32%
23%
2%
7% 9%
20%
29%
33%
daily 3-4 times a week
1-2 times a week
1-2 times a month
less often never
EL website EL news portal
17 17
1.3 Occupation, Income
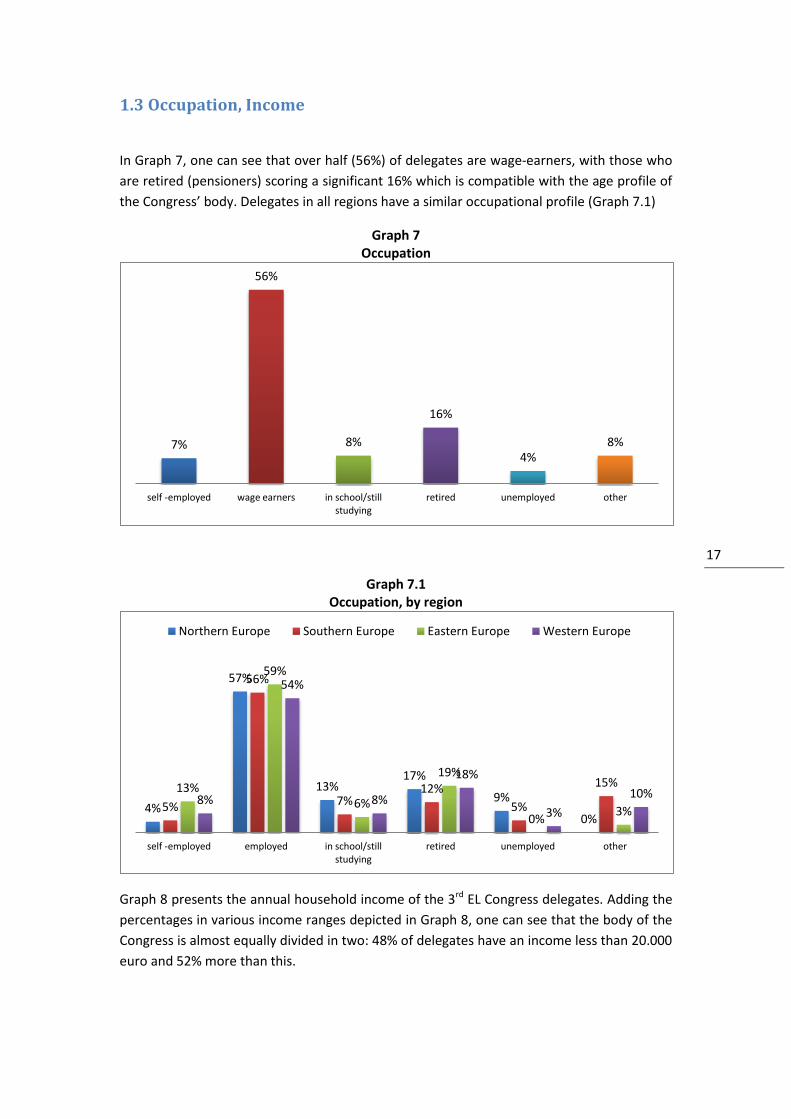
In Graph 7, one can see that over half (56%) of delegates are wage-earners, with those who
are retired (pensioners) scoring a significant 16% which is compatible with the age profile of
the Congress’ body. Delegates in all regions have a similar occupational profile (Graph 7.1)
Graph 7 Occupation
Graph 7.1 Occupation, by region
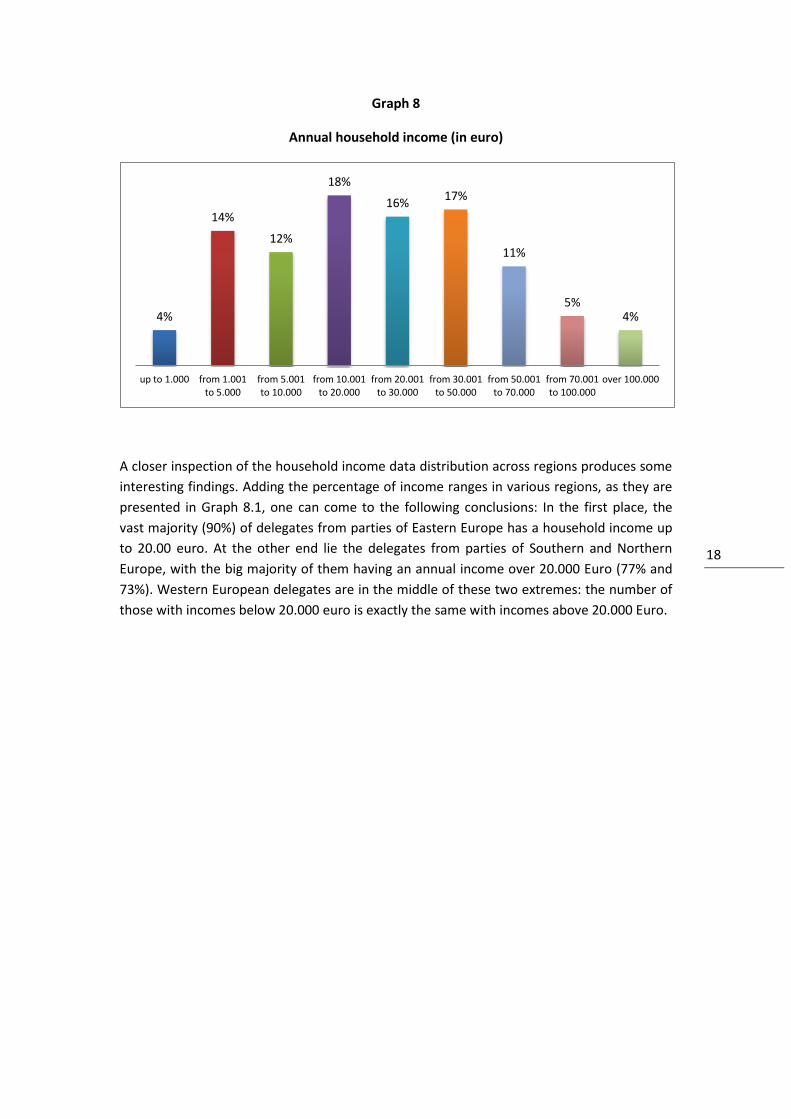
Graph 8 presents the annual household income of the 3rd EL Congress delegates. Adding the
percentages in various income ranges depicted in Graph 8, one can see that the body of the
Congress is almost equally divided in two: 48% of delegates have an income less than 20.000
euro and 52% more than this.
7%
56%
8%
16%
4% 8%
self -employed wage earners in school/still studying
retired unemployed other
4%
57%
13% 17%
9%
0% 5%
56%
7% 12%
5%
15% 13%
59%
6%
19%
0% 3%
8%
54%
8%
18%
3%
10%
self -employed employed in school/still studying
retired unemployed other
Northern Europe Southern Europe Eastern Europe Western Europe
18 18
Graph 8
Annual household income (in euro)
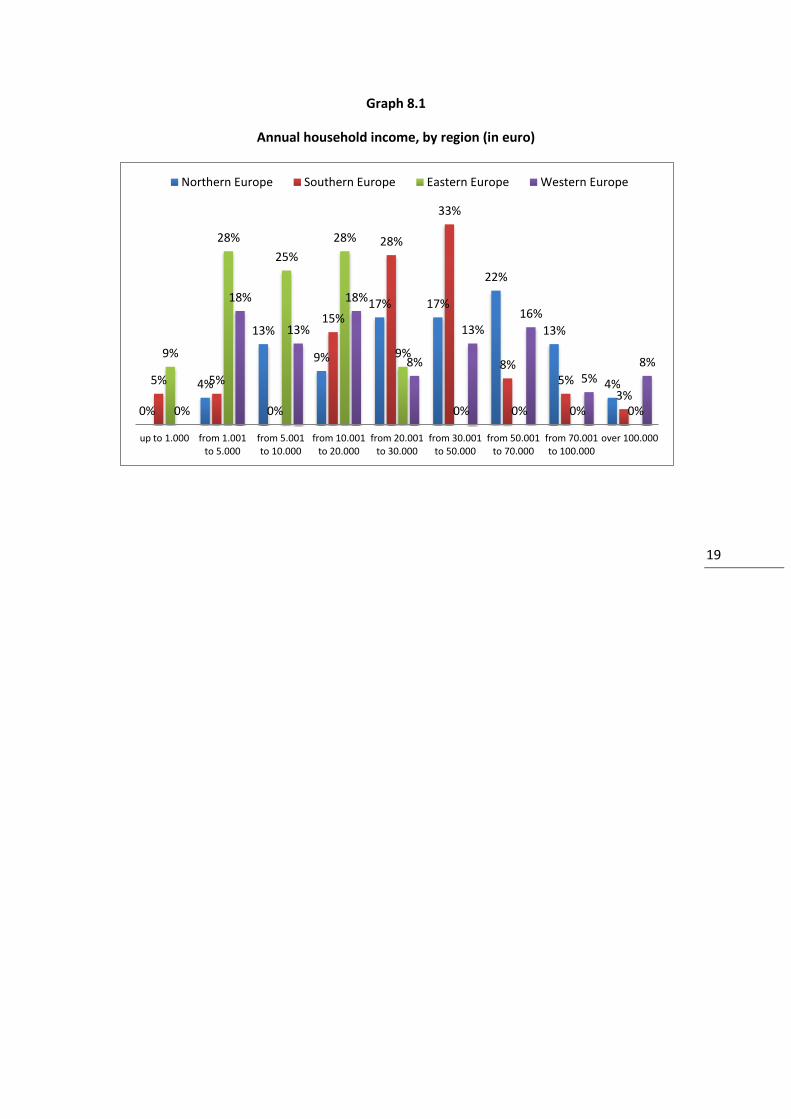
A closer inspection of the household income data distribution across regions produces some
interesting findings. Adding the percentage of income ranges in various regions, as they are
presented in Graph 8.1, one can come to the following conclusions: In the first place, the
vast majority (90%) of delegates from parties of Eastern Europe has a household income up
to 20.00 euro. At the other end lie the delegates from parties of Southern and Northern
Europe, with the big majority of them having an annual income over 20.000 Euro (77% and
73%). Western European delegates are in the middle of these two extremes: the number of
those with incomes below 20.000 euro is exactly the same with incomes above 20.000 Euro.
4%
14%
12%
18%
16% 17%
11%
5% 4%
up to 1.000 from 1.001 to 5.000
from 5.001 to 10.000
from 10.001 to 20.000
from 20.001 to 30.000
from 30.001 to 50.000
from 50.001 to 70.000
from 70.001 to 100.000
over 100.000
19 19
Graph 8.1
Annual household income, by region (in euro)
0%
4%
13%
9%
17% 17%
22%
13%
4% 5% 5%
0%
15%
28%
33%
8% 5%
3%
9%
28%
25%
28%
9%
0% 0% 0% 0% 0%
18%
13%
18%
8%
13% 16%
5% 8%
up to 1.000 from 1.001 to 5.000
from 5.001 to 10.000
from 10.001 to 20.000
from 20.001 to 30.000
from 30.001 to 50.000
from 50.001 to 70.000
from 70.001 to 100.000
over 100.000
Northern Europe Southern Europe Eastern Europe Western Europe
20 20
1.4 Years of national party membership, position in the national
party
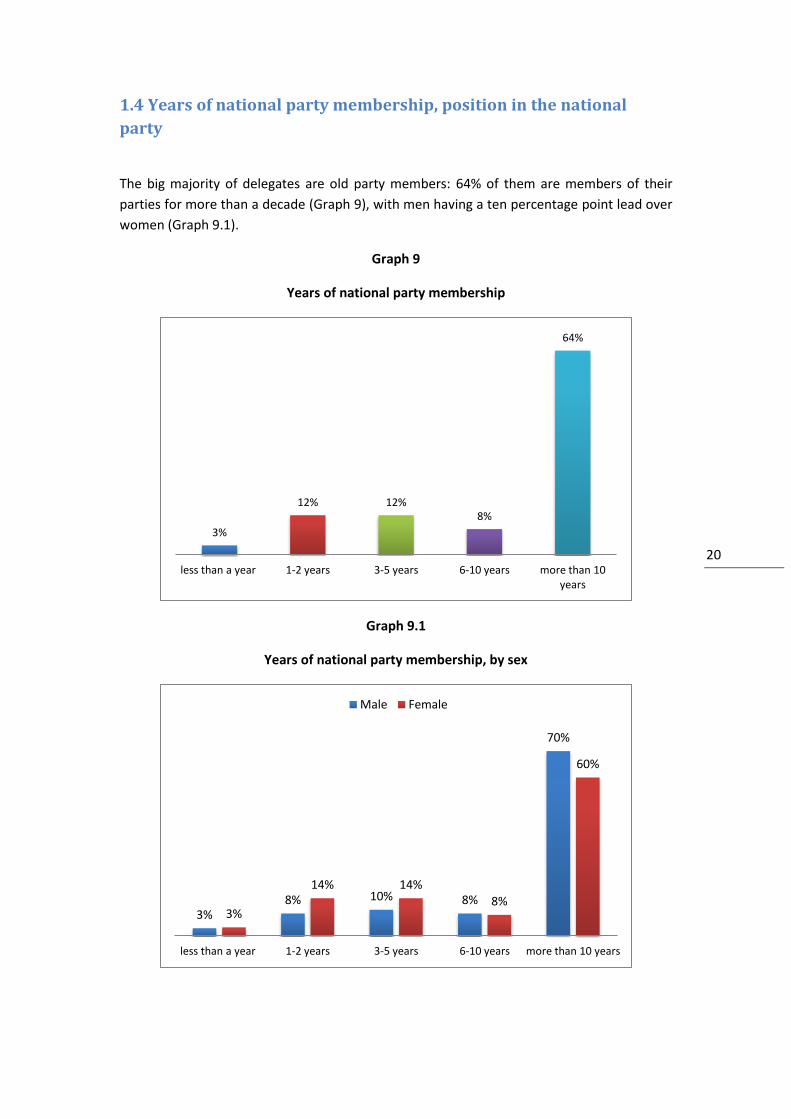
The big majority of delegates are old party members: 64% of them are members of their
parties for more than a decade (Graph 9), with men having a ten percentage point lead over
women (Graph 9.1).
Graph 9
Years of national party membership
Graph 9.1
Years of national party membership, by sex
3%
12% 12% 8%
64%
less than a year 1-2 years 3-5 years 6-10 years more than 10 years
3% 8% 10% 8%
70%
3%
14% 14%
8%
60%
less than a year 1-2 years 3-5 years 6-10 years more than 10 years
Male Female
21 21
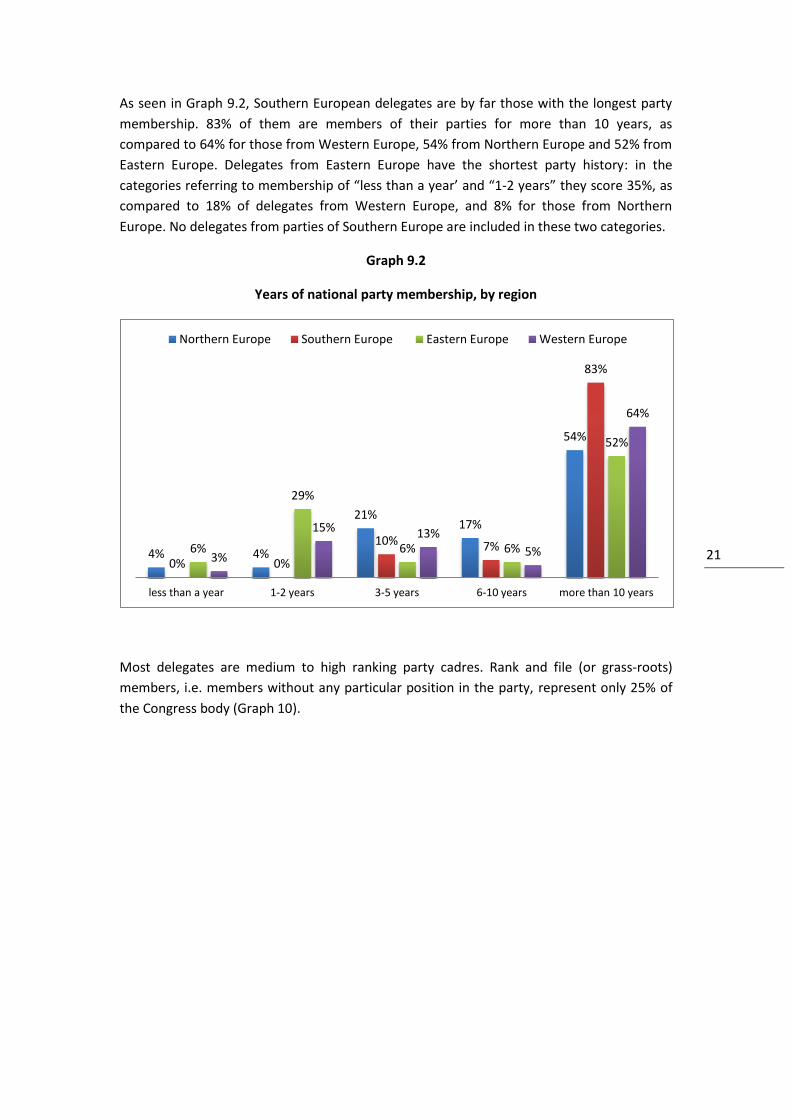
As seen in Graph 9.2, Southern European delegates are by far those with the longest party
membership. 83% of them are members of their parties for more than 10 years, as
compared to 64% for those from Western Europe, 54% from Northern Europe and 52% from
Eastern Europe. Delegates from Eastern Europe have the shortest party history: in the
categories referring to membership of “less than a year’ and “1-2 years” they score 35%, as
compared to 18% of delegates from Western Europe, and 8% for those from Northern
Europe. No delegates from parties of Southern Europe are included in these two categories.
Graph 9.2
Years of national party membership, by region
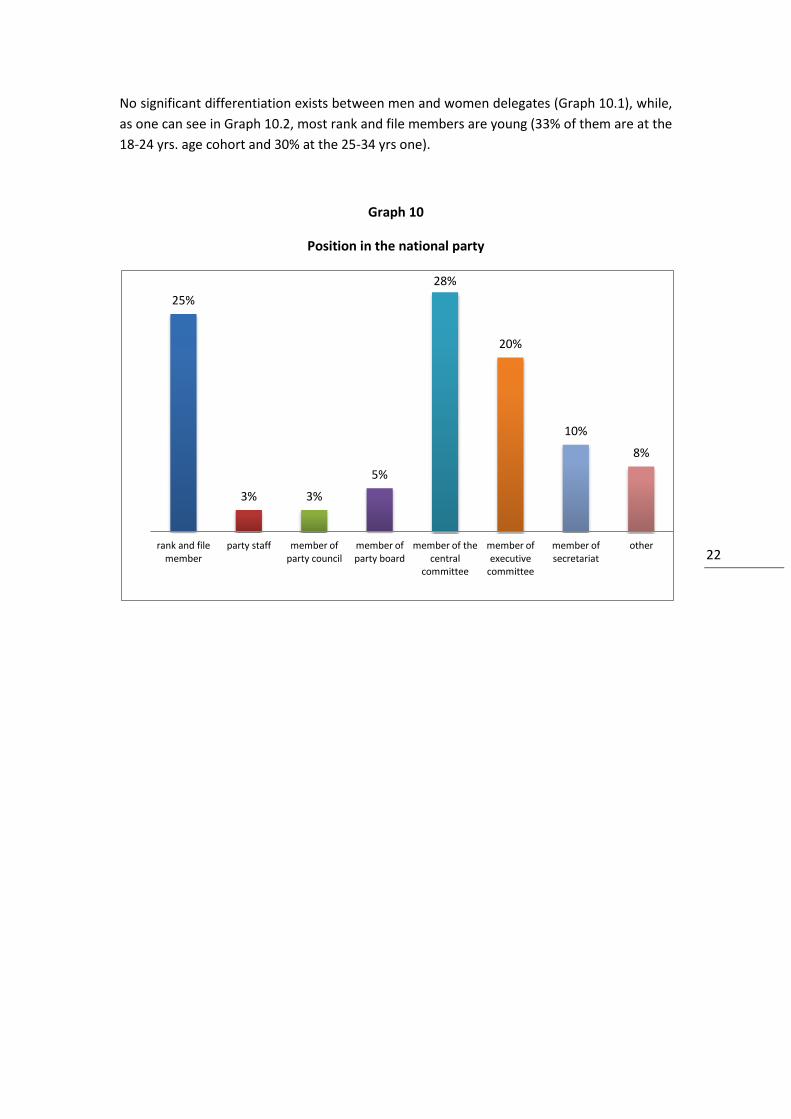
Most delegates are medium to high ranking party cadres. Rank and file (or grass-roots)
members, i.e. members without any particular position in the party, represent only 25% of
the Congress body (Graph 10).
4% 4%
21% 17%
54%
0% 0%
10% 7%
83%
6%
29%
6% 6%
52%
3%
15% 13%
5%
64%
less than a year 1-2 years 3-5 years 6-10 years more than 10 years
Northern Europe Southern Europe Eastern Europe Western Europe
22 22
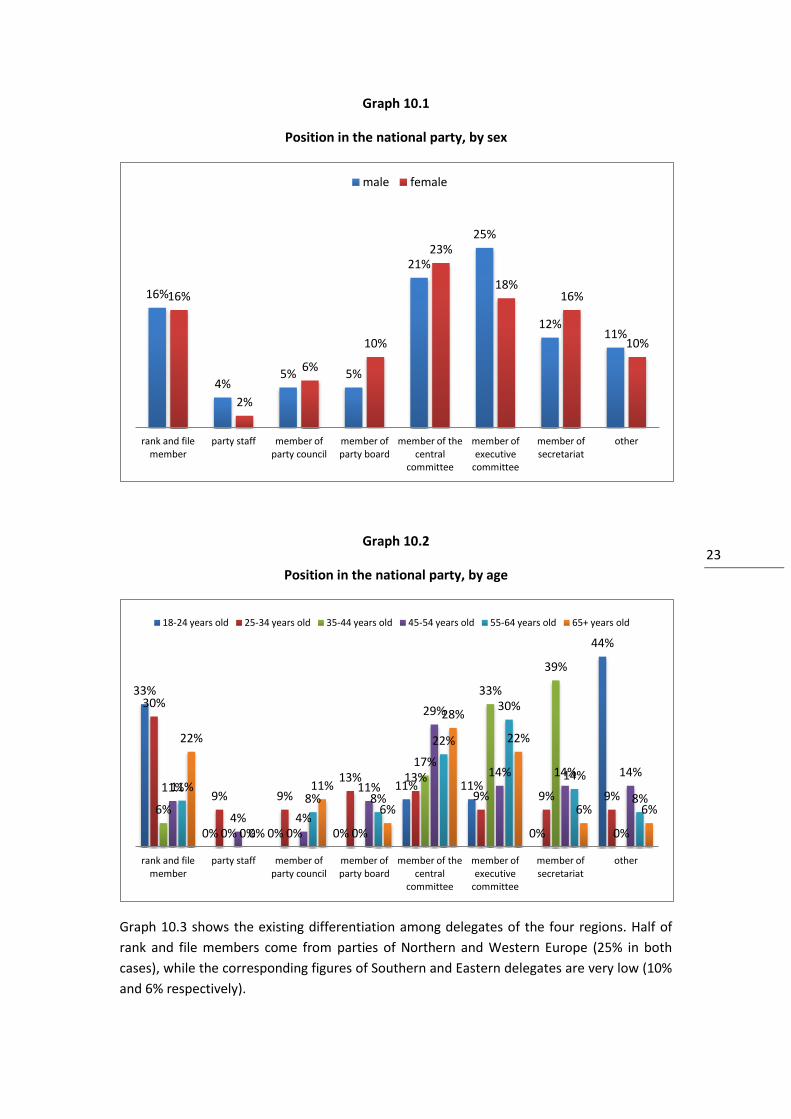
No significant differentiation exists between men and women delegates (Graph 10.1), while,
as one can see in Graph 10.2, most rank and file members are young (33% of them are at the
18-24 yrs. age cohort and 30% at the 25-34 yrs one).
Graph 10
Position in the national party
25%
3% 3%
5%
28%
20%
10%
8%
rank and file member
party staff member of party council
member of party board
member of the central
committee
member of executive
committee
member of secretariat
other
23 23
Graph 10.1
Position in the national party, by sex
Graph 10.2
Position in the national party, by age
Graph 10.3 shows the existing differentiation among delegates of the four regions. Half of
rank and file members come from parties of Northern and Western Europe (25% in both
cases), while the corresponding figures of Southern and Eastern delegates are very low (10%
and 6% respectively).
16%
4% 5% 5%
21%
25%
12% 11%
16%
2%
6%
10%
23%
18% 16%
10%
rank and file member
party staff member of party council
member of party board
member of the central
committee
member of executive
committee
member of secretariat
other
male female
33%
0% 0% 0%
11% 11%
0%
44%
30%
9% 9%
13% 13%
9% 9% 9% 6%
0% 0% 0%
17%
33%
39%
0%
11%
4% 4%
11%
29%
14% 14% 14% 11%
0%
8% 8%
22%
30%
14%
8%
22%
0%
11%
6%
28%
22%
6% 6%
rank and file member
party staff member of party council
member of party board
member of the central
committee
member of executive
committee
member of secretariat
other
18-24 years old 25-34 years old 35-44 years old 45-54 years old 55-64 years old 65+ years old
24 24
Graph 10.3
Position in the national party, by region
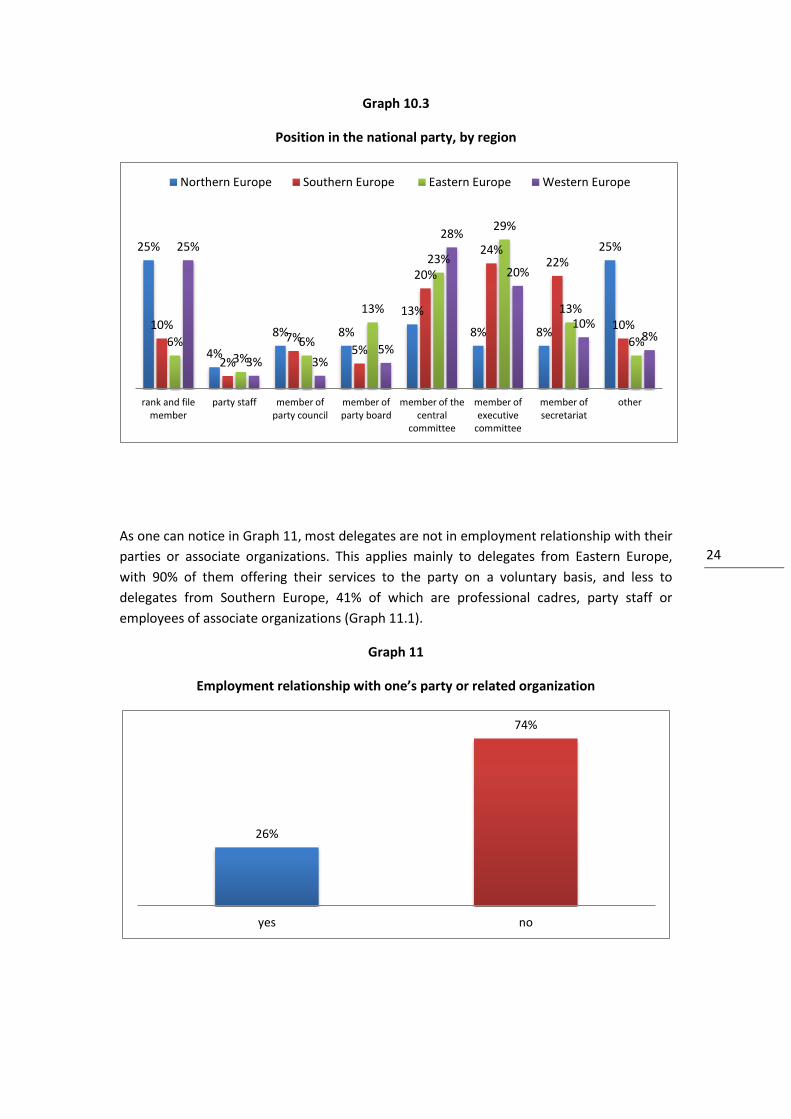
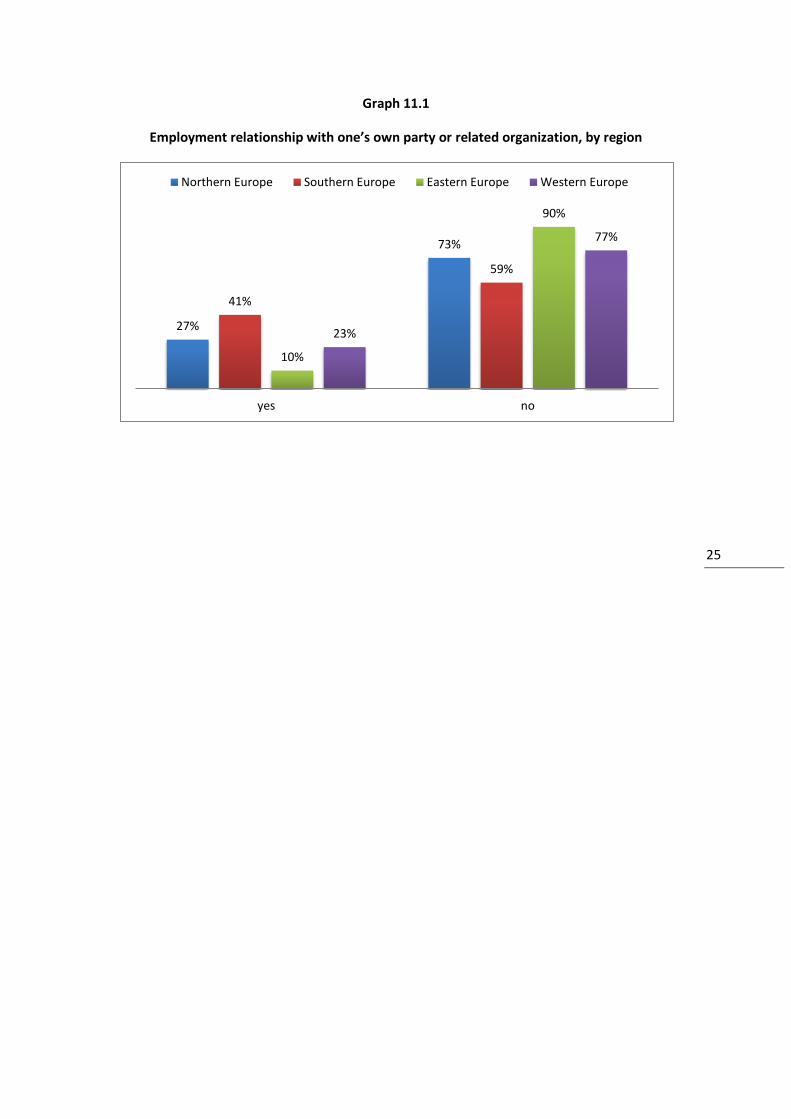
As one can notice in Graph 11, most delegates are not in employment relationship with their
parties or associate organizations. This applies mainly to delegates from Eastern Europe,
with 90% of them offering their services to the party on a voluntary basis, and less to
delegates from Southern Europe, 41% of which are professional cadres, party staff or
employees of associate organizations (Graph 11.1).
Graph 11
Employment relationship with one’s party or related organization
25%
4%
8% 8%
13%
8% 8%
25%
10%
2%
7% 5%
20%
24% 22%
10%
6%
3%
6%
13%
23%
29%
13%
6%
25%
3% 3% 5%
28%
20%
10% 8%
rank and file member
party staff member of party council
member of party board
member of the central
committee
member of executive
committee
member of secretariat
other
Northern Europe Southern Europe Eastern Europe Western Europe
26%
74%
yes no
25 25
Graph 11.1
Employment relationship with one’s own party or related organization, by region
27%
73%
41%
59%
10%
90%
23%
77%
yes no
Northern Europe Southern Europe Eastern Europe Western Europe
26 26
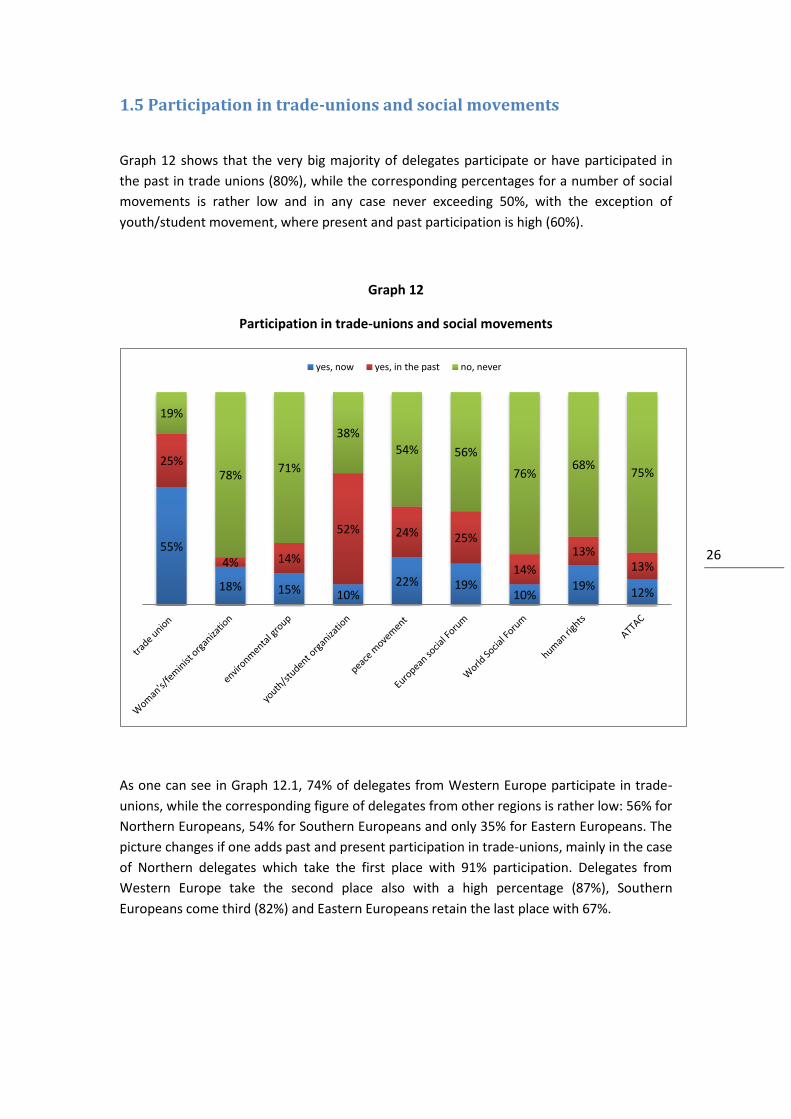
1.5 Participation in trade-unions and social movements
Graph 12 shows that the very big majority of delegates participate or have participated in
the past in trade unions (80%), while the corresponding percentages for a number of social
movements is rather low and in any case never exceeding 50%, with the exception of
youth/student movement, where present and past participation is high (60%).
Graph 12
Participation in trade-unions and social movements
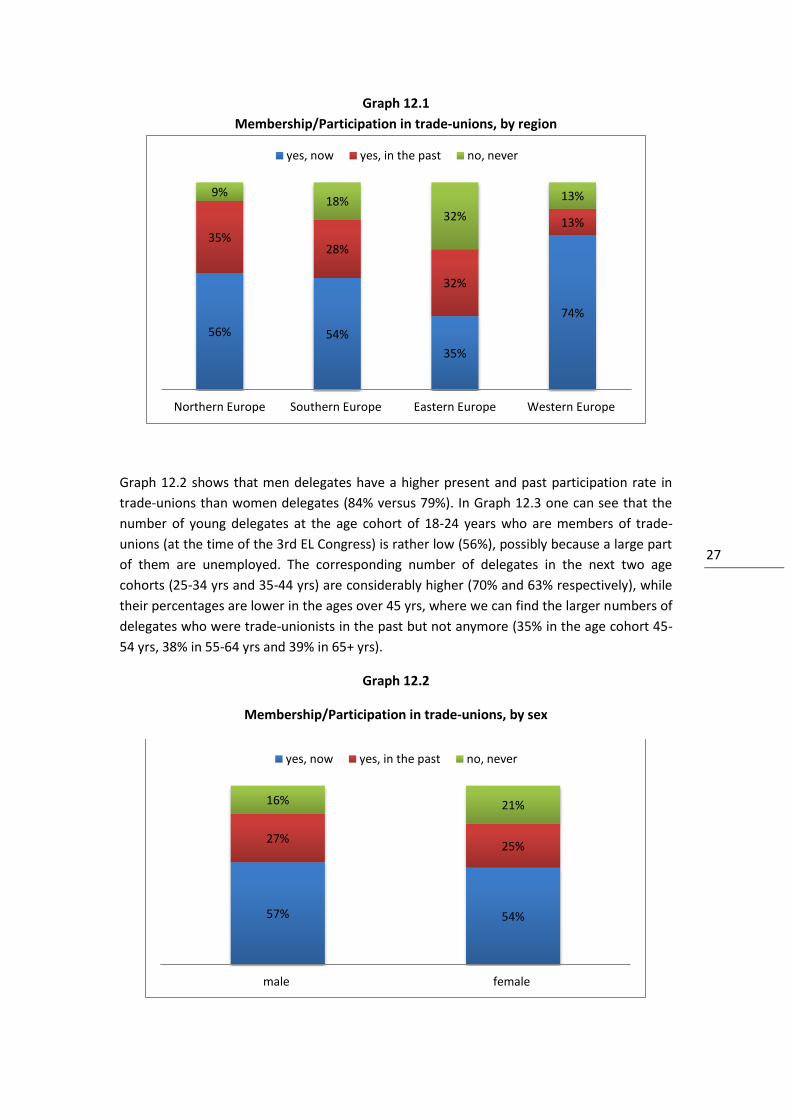
As one can see in Graph 12.1, 74% of delegates from Western Europe participate in trade-
unions, while the corresponding figure of delegates from other regions is rather low: 56% for
Northern Europeans, 54% for Southern Europeans and only 35% for Eastern Europeans. The
picture changes if one adds past and present participation in trade-unions, mainly in the case
of Northern delegates which take the first place with 91% participation. Delegates from
Western Europe take the second place also with a high percentage (87%), Southern
Europeans come third (82%) and Eastern Europeans retain the last place with 67%.
55%
18% 15% 10% 22% 19%
10% 19%
12%
25%
4% 14%
52% 24% 25%
14%
13% 13%
19%
78% 71%
38%
54% 56%
76% 68%
75%
yes, now yes, in the past no, never
27 27
Graph 12.1
Membership/Participation in trade-unions, by region
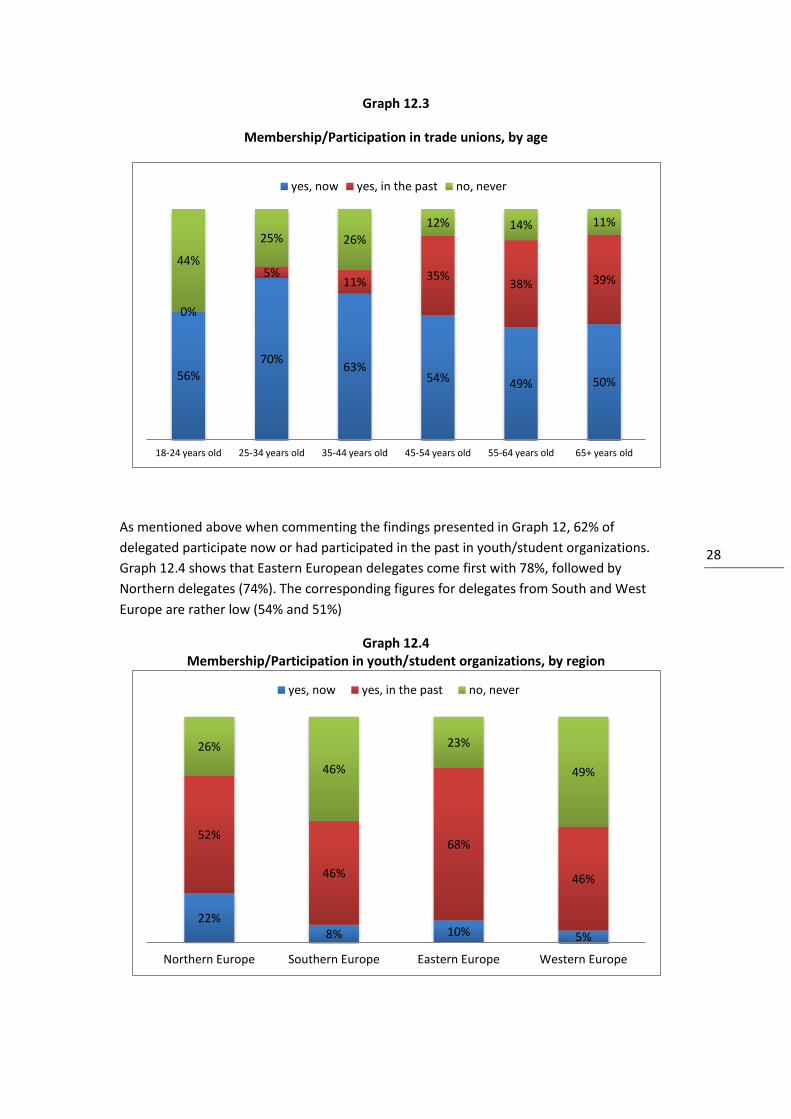
Graph 12.2 shows that men delegates have a higher present and past participation rate in
trade-unions than women delegates (84% versus 79%). In Graph 12.3 one can see that the
number of young delegates at the age cohort of 18-24 years who are members of trade-
unions (at the time of the 3rd EL Congress) is rather low (56%), possibly because a large part
of them are unemployed. The corresponding number of delegates in the next two age
cohorts (25-34 yrs and 35-44 yrs) are considerably higher (70% and 63% respectively), while
their percentages are lower in the ages over 45 yrs, where we can find the larger numbers of
delegates who were trade-unionists in the past but not anymore (35% in the age cohort 45-
54 yrs, 38% in 55-64 yrs and 39% in 65+ yrs).
Graph 12.2
Membership/Participation in trade-unions, by sex
56% 54%
35%
74%
35% 28%
32%
13%
9% 18%
32%
13%
Northern Europe Southern Europe Eastern Europe Western Europe
yes, now yes, in the past no, never
57% 54%
27% 25%
16% 21%
male female
yes, now yes, in the past no, never
28 28
Graph 12.3
Membership/Participation in trade unions, by age
As mentioned above when commenting the findings presented in Graph 12, 62% of
delegated participate now or had participated in the past in youth/student organizations.
Graph 12.4 shows that Eastern European delegates come first with 78%, followed by
Northern delegates (74%). The corresponding figures for delegates from South and West
Europe are rather low (54% and 51%)
Graph 12.4 Membership/Participation in youth/student organizations, by region
56%
70% 63%
54% 49% 50%
0%
5% 11% 35%
38% 39%
44%
25% 26%
12% 14% 11%
18-24 years old 25-34 years old 35-44 years old 45-54 years old 55-64 years old 65+ years old
yes, now yes, in the past no, never
22% 8% 10% 5%
52%
46%
68%
46%
26%
46%
23%
49%
Northern Europe Southern Europe Eastern Europe Western Europe
yes, now yes, in the past no, never
29 29
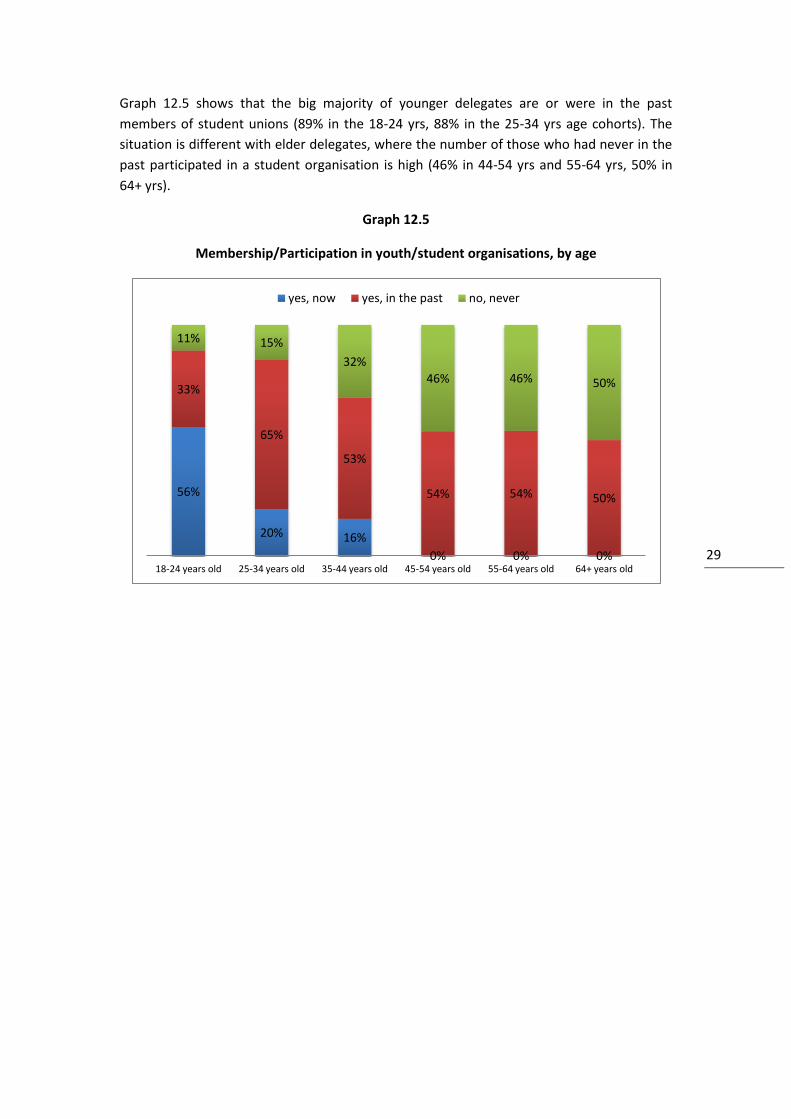
Graph 12.5 shows that the big majority of younger delegates are or were in the past
members of student unions (89% in the 18-24 yrs, 88% in the 25-34 yrs age cohorts). The
situation is different with elder delegates, where the number of those who had never in the
past participated in a student organisation is high (46% in 44-54 yrs and 55-64 yrs, 50% in
64+ yrs).
Graph 12.5
Membership/Participation in youth/student organisations, by age
56%
20% 16%
0% 0% 0%
33%
65%
53%
54% 54% 50%
11% 15%
32%
46% 46% 50%
18-24 years old 25-34 years old 35-44 years old 45-54 years old 55-64 years old 64+ years old
yes, now yes, in the past no, never
30 30
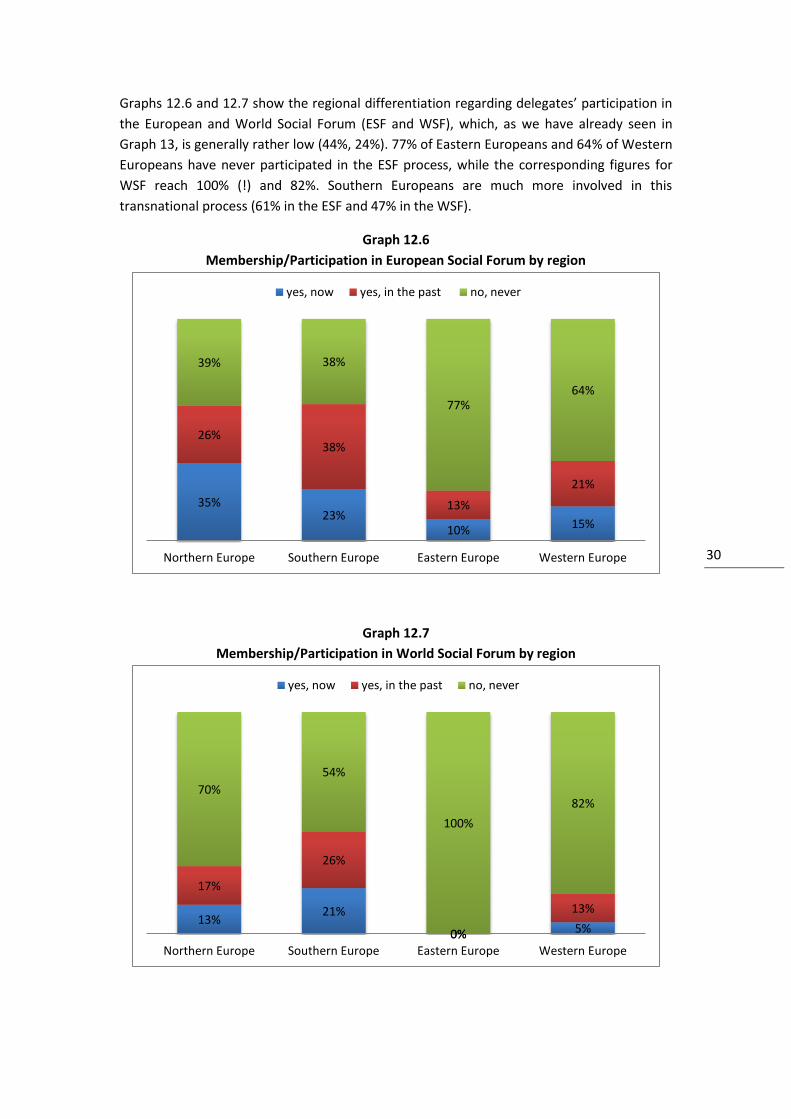
Graphs 12.6 and 12.7 show the regional differentiation regarding delegates’ participation in
the European and World Social Forum (ESF and WSF), which, as we have already seen in
Graph 13, is generally rather low (44%, 24%). 77% of Eastern Europeans and 64% of Western
Europeans have never participated in the ESF process, while the corresponding figures for
WSF reach 100% (!) and 82%. Southern Europeans are much more involved in this
transnational process (61% in the ESF and 47% in the WSF).
Graph 12.6
Membership/Participation in European Social Forum by region
Graph 12.7
Membership/Participation in World Social Forum by region
35% 23%
10% 15%
26% 38%
13%
21%
39% 38%
77% 64%
Northern Europe Southern Europe Eastern Europe Western Europe
yes, now yes, in the past no, never
13% 21%
0% 5%
17%
26%
0%
13%
70%
54%
100%
82%
Northern Europe Southern Europe Eastern Europe Western Europe
yes, now yes, in the past no, never
31 31
2. Values of the delegates
32 32
2.1 Attitude towards immigrants
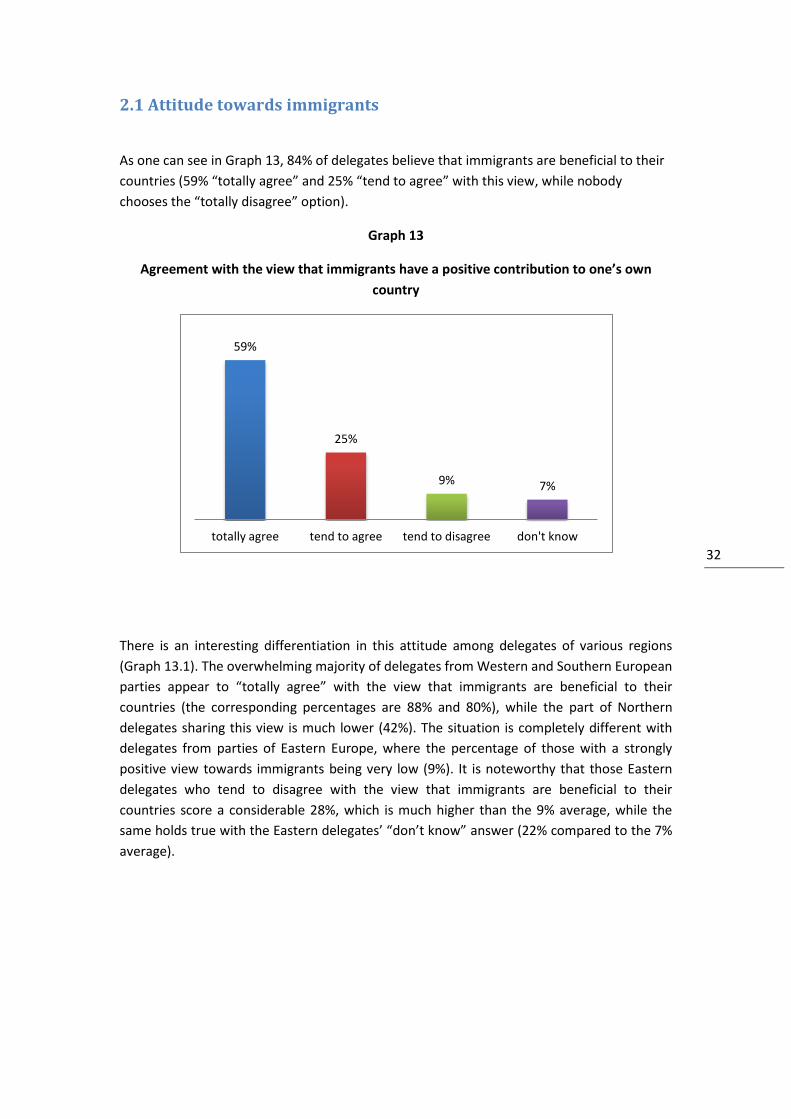
As one can see in Graph 13, 84% of delegates believe that immigrants are beneficial to their
countries (59% “totally agree” and 25% “tend to agree” with this view, while nobody
chooses the “totally disagree” option).
Graph 13
Agreement with the view that immigrants have a positive contribution to one’s own
country
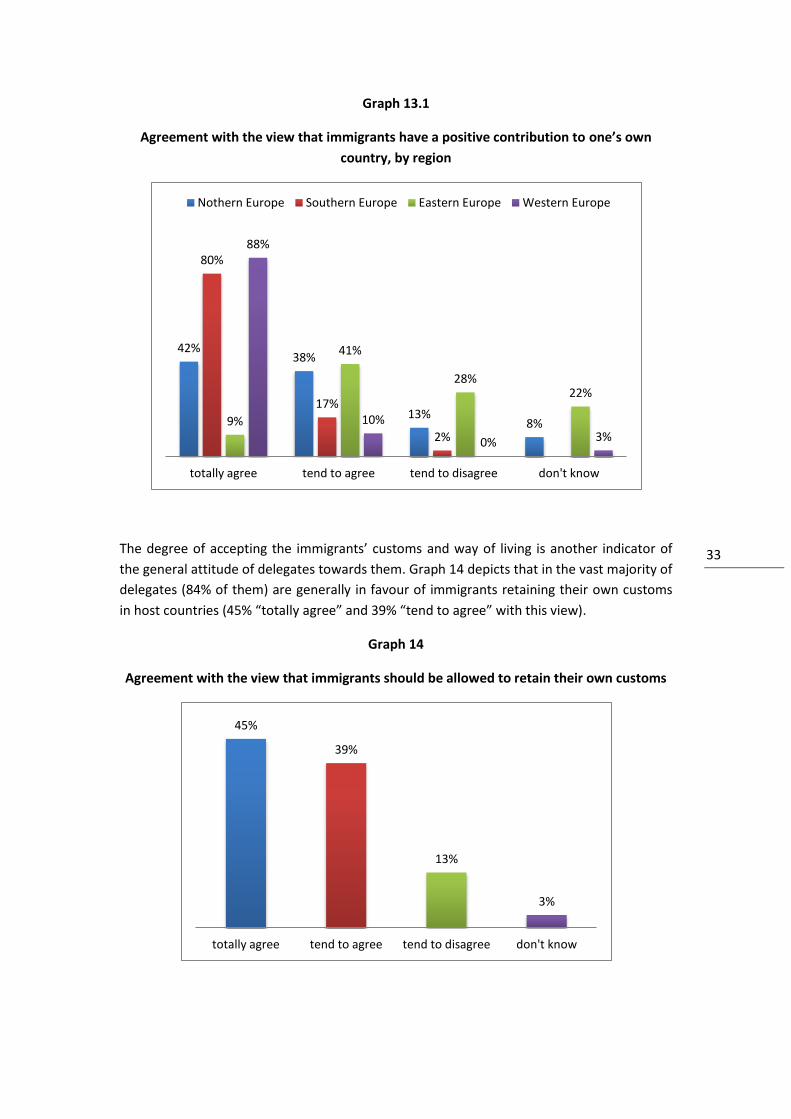
There is an interesting differentiation in this attitude among delegates of various regions
(Graph 13.1). The overwhelming majority of delegates from Western and Southern European
parties appear to “totally agree” with the view that immigrants are beneficial to their
countries (the corresponding percentages are 88% and 80%), while the part of Northern
delegates sharing this view is much lower (42%). The situation is completely different with
delegates from parties of Eastern Europe, where the percentage of those with a strongly
positive view towards immigrants being very low (9%). It is noteworthy that those Eastern
delegates who tend to disagree with the view that immigrants are beneficial to their
countries score a considerable 28%, which is much higher than the 9% average, while the
same holds true with the Eastern delegates’ “don’t know” answer (22% compared to the 7%
average).
59%
25%
9% 7%
totally agree tend to agree tend to disagree don't know
33 33
Graph 13.1
Agreement with the view that immigrants have a positive contribution to one’s own
country, by region
The degree of accepting the immigrants’ customs and way of living is another indicator of
the general attitude of delegates towards them. Graph 14 depicts that in the vast majority of
delegates (84% of them) are generally in favour of immigrants retaining their own customs
in host countries (45% “totally agree” and 39% “tend to agree” with this view).
Graph 14
Agreement with the view that immigrants should be allowed to retain their own customs
42% 38%
13% 8%
80%
17%
2% 9%
41%
28% 22%
88%
10%
0% 3%
totally agree tend to agree tend to disagree don't know
Nothern Europe Southern Europe Eastern Europe Western Europe
45%
39%
13%
3%
totally agree tend to agree tend to disagree don't know
34 34
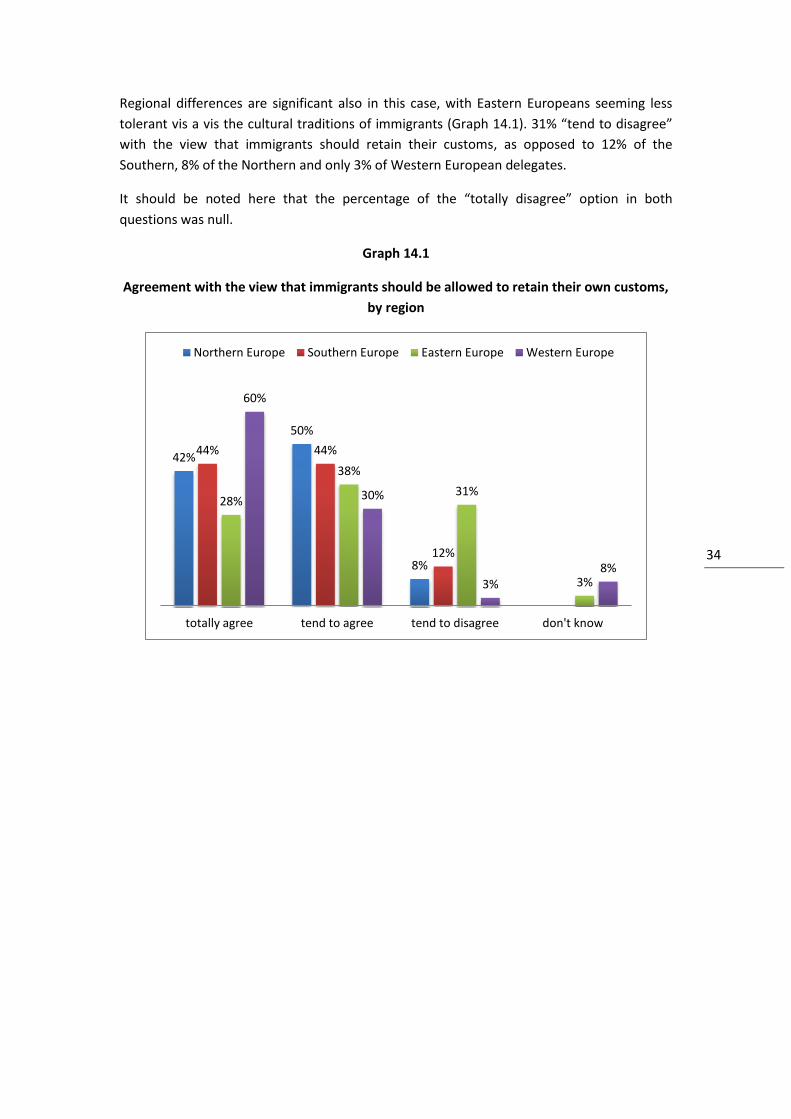
Regional differences are significant also in this case, with Eastern Europeans seeming less
tolerant vis a vis the cultural traditions of immigrants (Graph 14.1). 31% “tend to disagree”
with the view that immigrants should retain their customs, as opposed to 12% of the
Southern, 8% of the Northern and only 3% of Western European delegates.
It should be noted here that the percentage of the “totally disagree” option in both
questions was null.
Graph 14.1
Agreement with the view that immigrants should be allowed to retain their own customs,
by region
42%
50%
8%
44% 44%
12%
28%
38%
31%
3%
60%
30%
3% 8%
totally agree tend to agree tend to disagree don't know
Northern Europe Southern Europe Eastern Europe Western Europe
35 35
2.2 Attitude towards violence
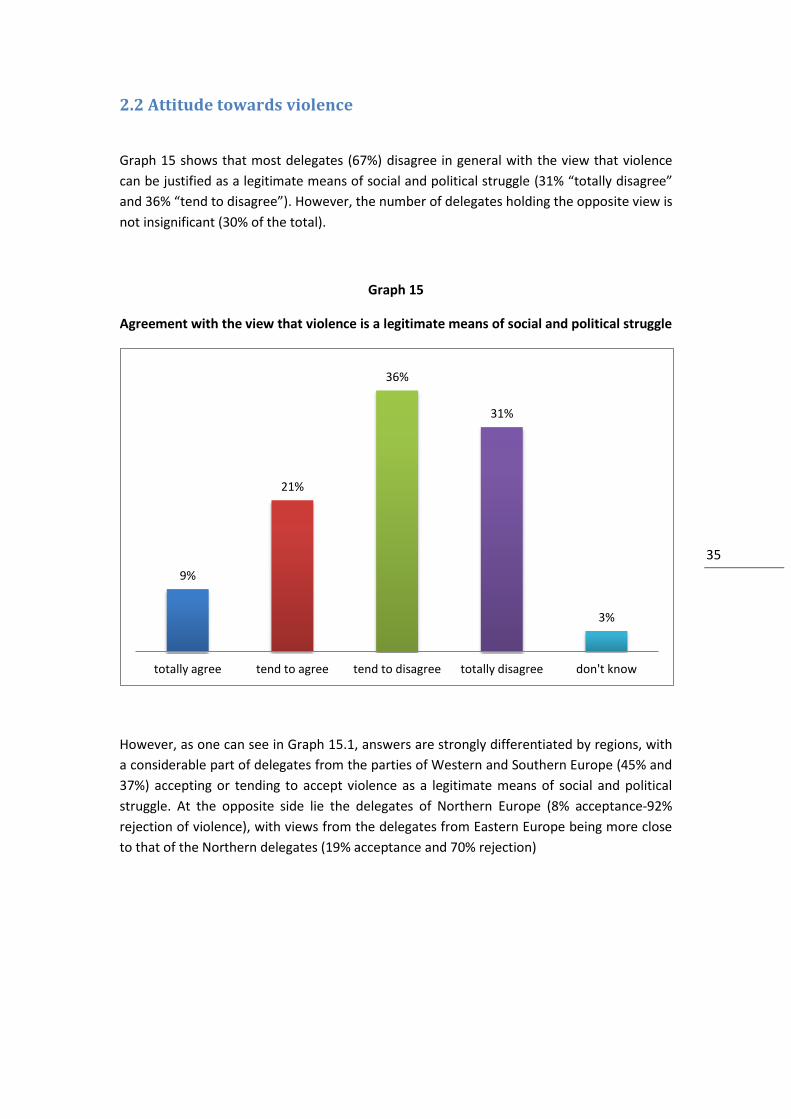
Graph 15 shows that most delegates (67%) disagree in general with the view that violence
can be justified as a legitimate means of social and political struggle (31% “totally disagree”
and 36% “tend to disagree”). However, the number of delegates holding the opposite view is
not insignificant (30% of the total).
Graph 15
Agreement with the view that violence is a legitimate means of social and political struggle
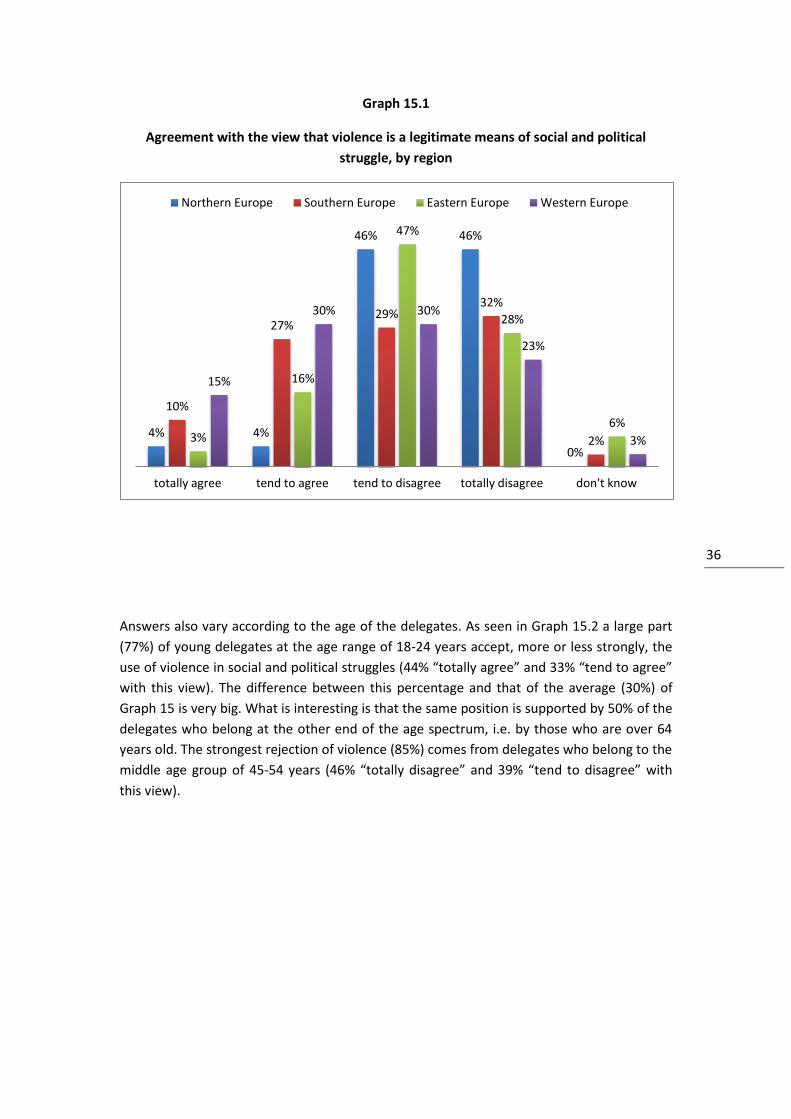
However, as one can see in Graph 15.1, answers are strongly differentiated by regions, with
a considerable part of delegates from the parties of Western and Southern Europe (45% and
37%) accepting or tending to accept violence as a legitimate means of social and political
struggle. At the opposite side lie the delegates of Northern Europe (8% acceptance-92%
rejection of violence), with views from the delegates from Eastern Europe being more close
to that of the Northern delegates (19% acceptance and 70% rejection)
9%
21%
36%
31%
3%
totally agree tend to agree tend to disagree totally disagree don't know
36 36
Graph 15.1
Agreement with the view that violence is a legitimate means of social and political
struggle, by region
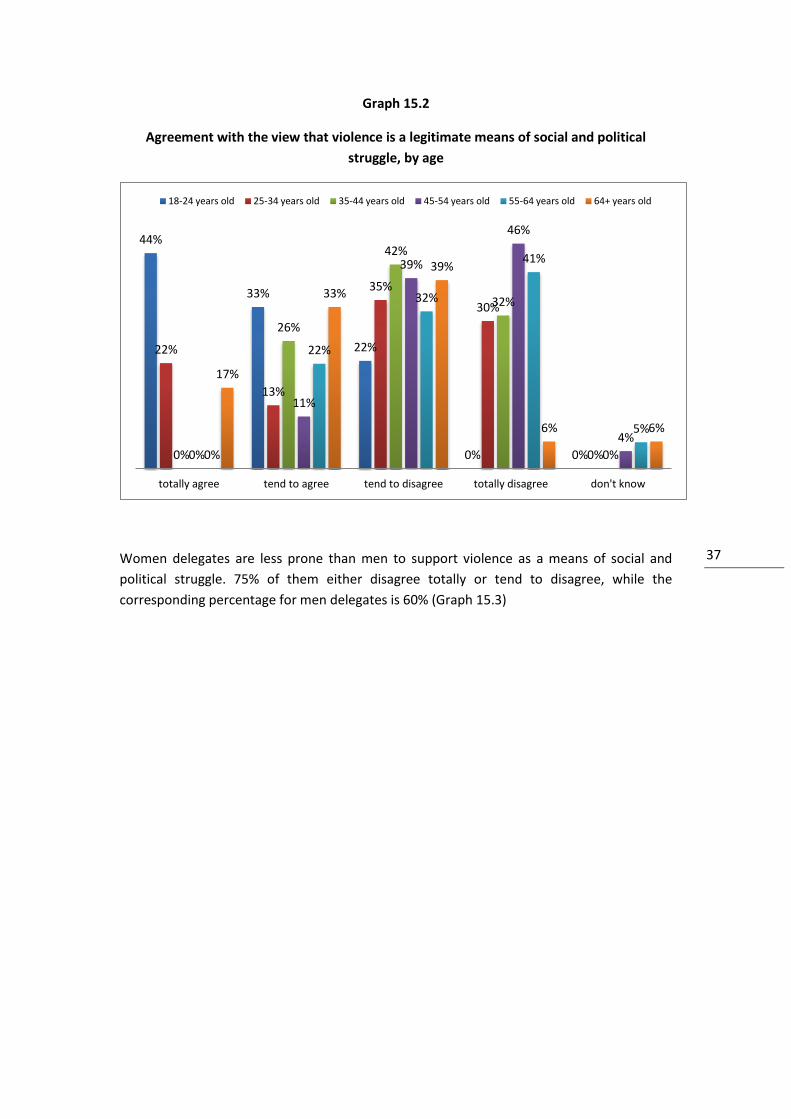
Answers also vary according to the age of the delegates. As seen in Graph 15.2 a large part
(77%) of young delegates at the age range of 18-24 years accept, more or less strongly, the
use of violence in social and political struggles (44% “totally agree” and 33% “tend to agree”
with this view). The difference between this percentage and that of the average (30%) of
Graph 15 is very big. What is interesting is that the same position is supported by 50% of the
delegates who belong at the other end of the age spectrum, i.e. by those who are over 64
years old. The strongest rejection of violence (85%) comes from delegates who belong to the
middle age group of 45-54 years (46% “totally disagree” and 39% “tend to disagree” with
this view).
4% 4%
46% 46%
0%
10%
27% 29%
32%
2% 3%
16%
47%
28%
6%
15%
30% 30%
23%
3%
totally agree tend to agree tend to disagree totally disagree don't know
Northern Europe Southern Europe Eastern Europe Western Europe
37 37
Graph 15.2
Agreement with the view that violence is a legitimate means of social and political
struggle, by age
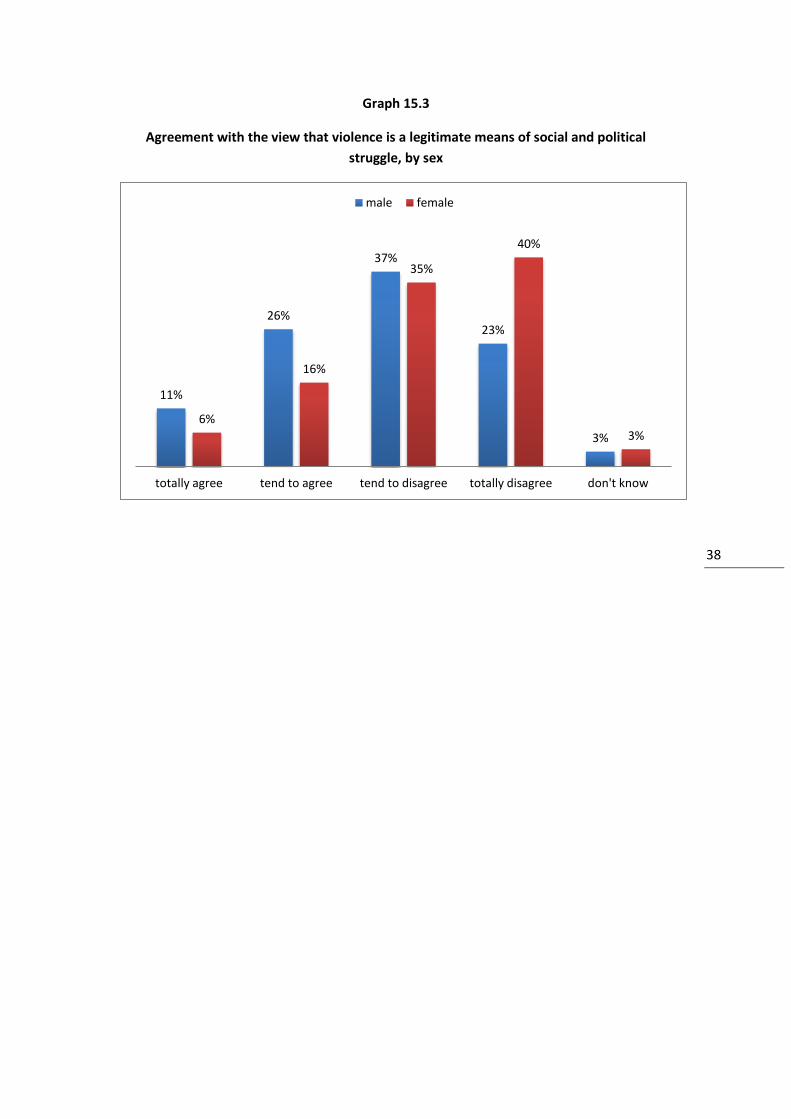
Women delegates are less prone than men to support violence as a means of social and
political struggle. 75% of them either disagree totally or tend to disagree, while the
corresponding percentage for men delegates is 60% (Graph 15.3)
44%
33%
22%
0% 0%
22%
13%
35%
30%
0% 0%
26%
42%
32%
0% 0%
11%
39%
46%
4%
0%
22%
32%
41%
5%
17%
33%
39%
6% 6%
totally agree tend to agree tend to disagree totally disagree don't know
18-24 years old 25-34 years old 35-44 years old 45-54 years old 55-64 years old 64+ years old
38 38
Graph 15.3
Agreement with the view that violence is a legitimate means of social and political
struggle, by sex
11%
26%
37%
23%
3%
6%
16%
35%
40%
3%
totally agree tend to agree tend to disagree totally disagree don't know
male female
39 39
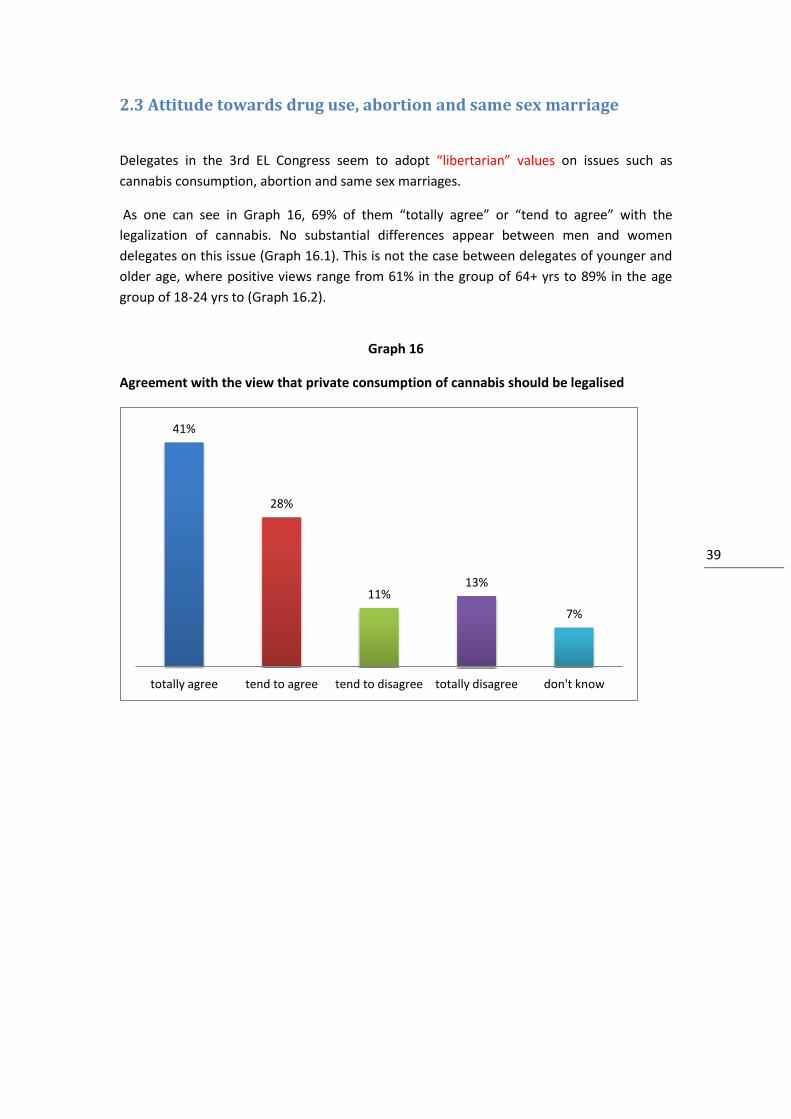
2.3 Attitude towards drug use, abortion and same sex marriage
Delegates in the 3rd EL Congress seem to adopt “libertarian” values on issues such as
cannabis consumption, abortion and same sex marriages.
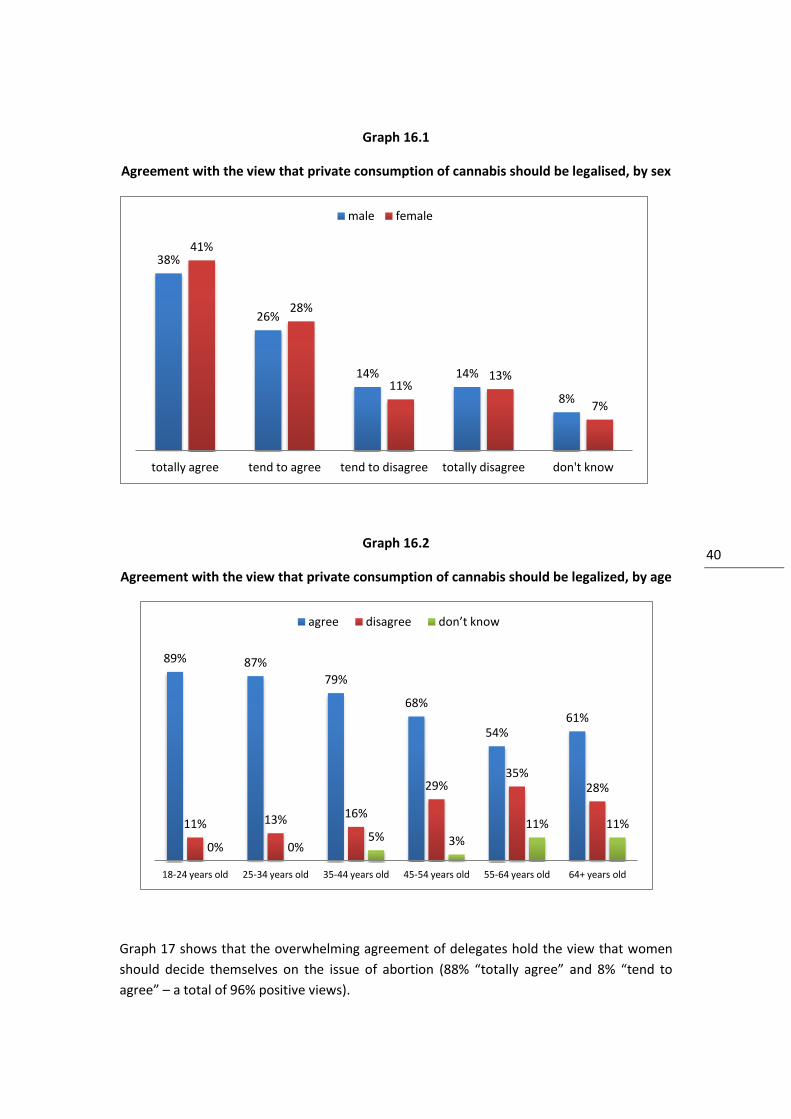
As one can see in Graph 16, 69% of them “totally agree” or “tend to agree” with the
legalization of cannabis. No substantial differences appear between men and women
delegates on this issue (Graph 16.1). This is not the case between delegates of younger and
older age, where positive views range from 61% in the group of 64+ yrs to 89% in the age
group of 18-24 yrs to (Graph 16.2).
Graph 16
Agreement with the view that private consumption of cannabis should be legalised
41%
28%
11% 13%
7%
totally agree tend to agree tend to disagree totally disagree don't know
40 40
Graph 16.1
Agreement with the view that private consumption of cannabis should be legalised, by sex
Graph 16.2
Agreement with the view that private consumption of cannabis should be legalized, by age
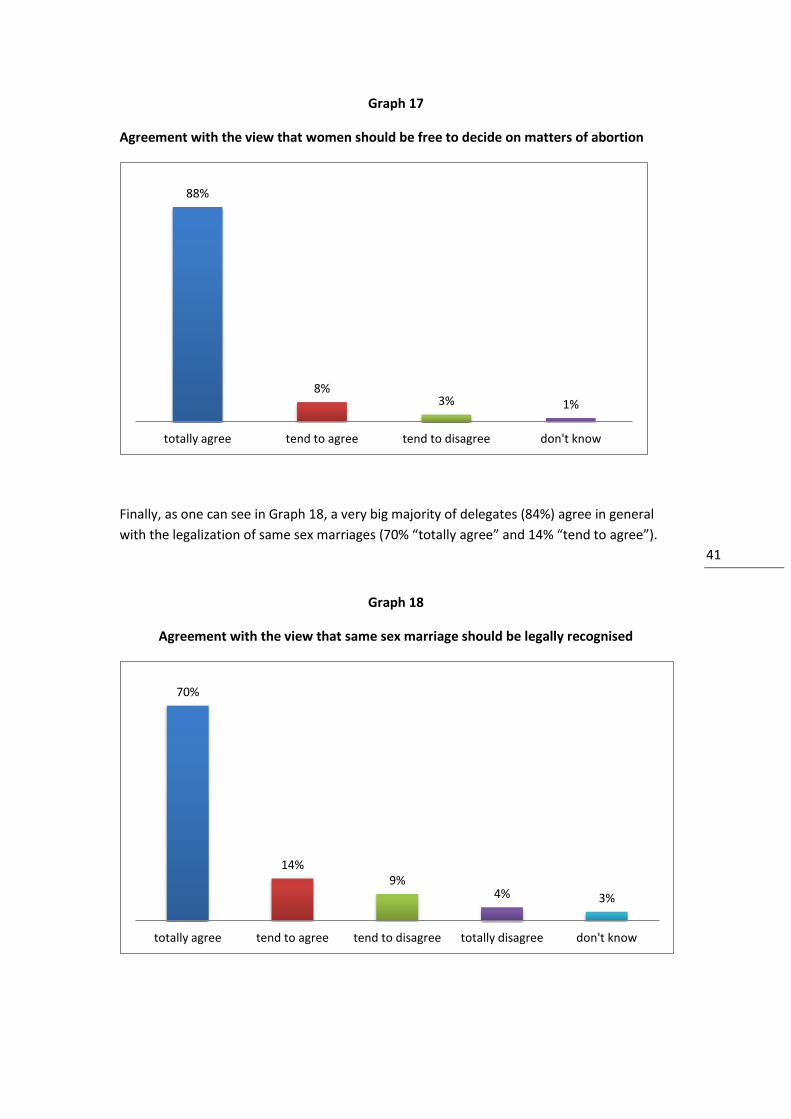
Graph 17 shows that the overwhelming agreement of delegates hold the view that women
should decide themselves on the issue of abortion (88% “totally agree” and 8% “tend to
agree” – a total of 96% positive views).
38%
26%
14% 14%
8%
41%
28%
11% 13%
7%
totally agree tend to agree tend to disagree totally disagree don't know
male female
89% 87%
79%
68%
54% 61%
11% 13% 16%
29% 35%
28%
0% 0% 5% 3%
11% 11%
18-24 years old 25-34 years old 35-44 years old 45-54 years old 55-64 years old 64+ years old
agree disagree don’t know
41 41
Graph 17
Agreement with the view that women should be free to decide on matters of abortion
Finally, as one can see in Graph 18, a very big majority of delegates (84%) agree in general
with the legalization of same sex marriages (70% “totally agree” and 14% “tend to agree”).
Graph 18
Agreement with the view that same sex marriage should be legally recognised
88%
8% 3% 1%
totally agree tend to agree tend to disagree don't know
70%
14% 9%
4% 3%
totally agree tend to agree tend to disagree totally disagree don't know
42 42
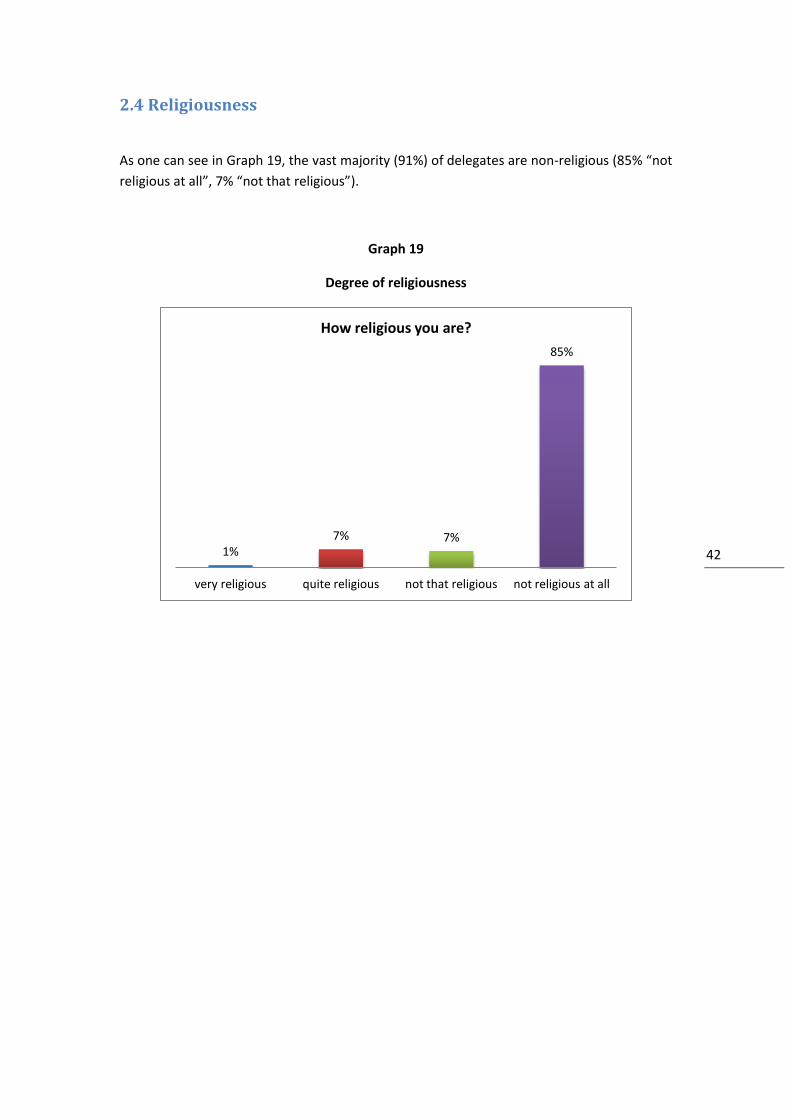
2.4 Religiousness
As one can see in Graph 19, the vast majority (91%) of delegates are non-religious (85% “not
religious at all”, 7% “not that religious”).
Graph 19
Degree of religiousness
1% 7% 7%
85%
very religious quite religious not that religious not religious at all
How religious you are?
43 43
3. Views of the delegates on various issues
44 44
3.1 The economic crisis and its impact on national parties attitude
towards the EU
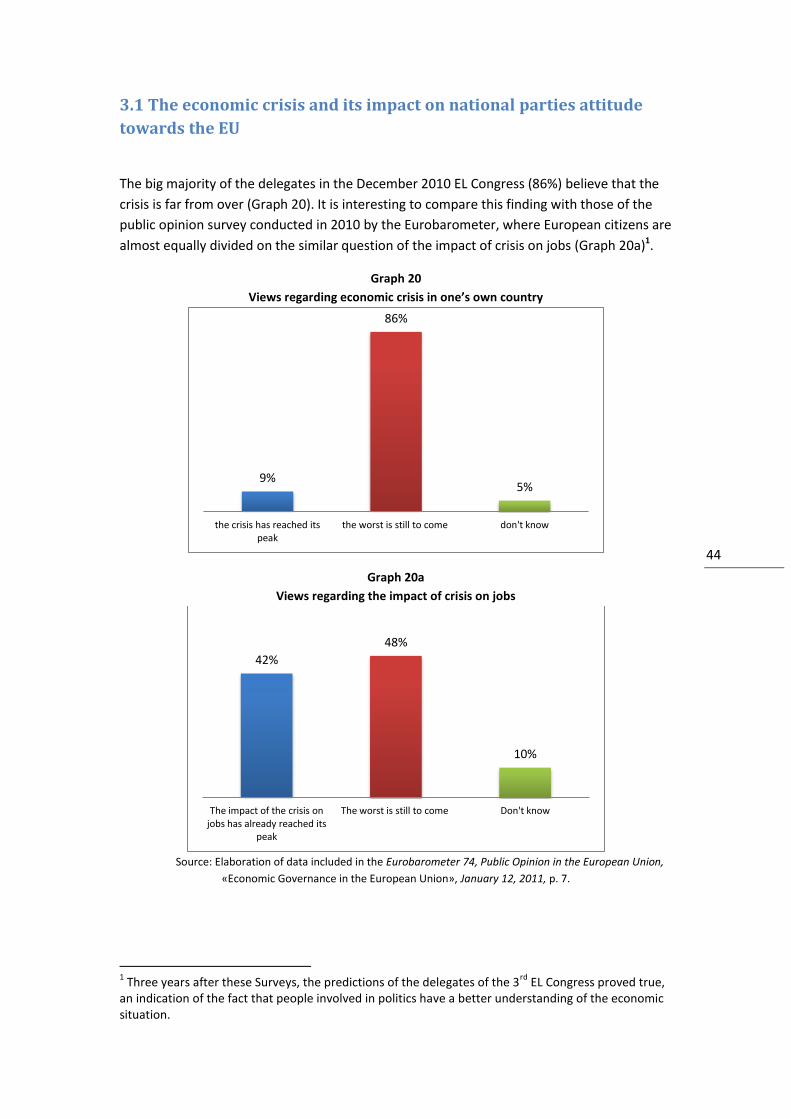
The big majority of the delegates in the December 2010 EL Congress (86%) believe that the
crisis is far from over (Graph 20). It is interesting to compare this finding with those of the
public opinion survey conducted in 2010 by the Eurobarometer, where European citizens are
almost equally divided on the similar question of the impact of crisis on jobs (Graph 20a)1.
Graph 20
Views regarding economic crisis in one’s own country
Graph 20a
Views regarding the impact of crisis on jobs
Source: Elaboration of data included in the Eurobarometer 74, Public Opinion in the European Union,
«Economic Governance in the European Union», January 12, 2011, p. 7.
1 Three years after these Surveys, the predictions of the delegates of the 3
rd EL Congress proved true,
an indication of the fact that people involved in politics have a better understanding of the economic situation.
9%
86%
5%
the crisis has reached its peak
the worst is still to come don't know
42%
48%
10%
The impact of the crisis on jobs has already reached its
peak
The worst is still to come Don't know
45 45
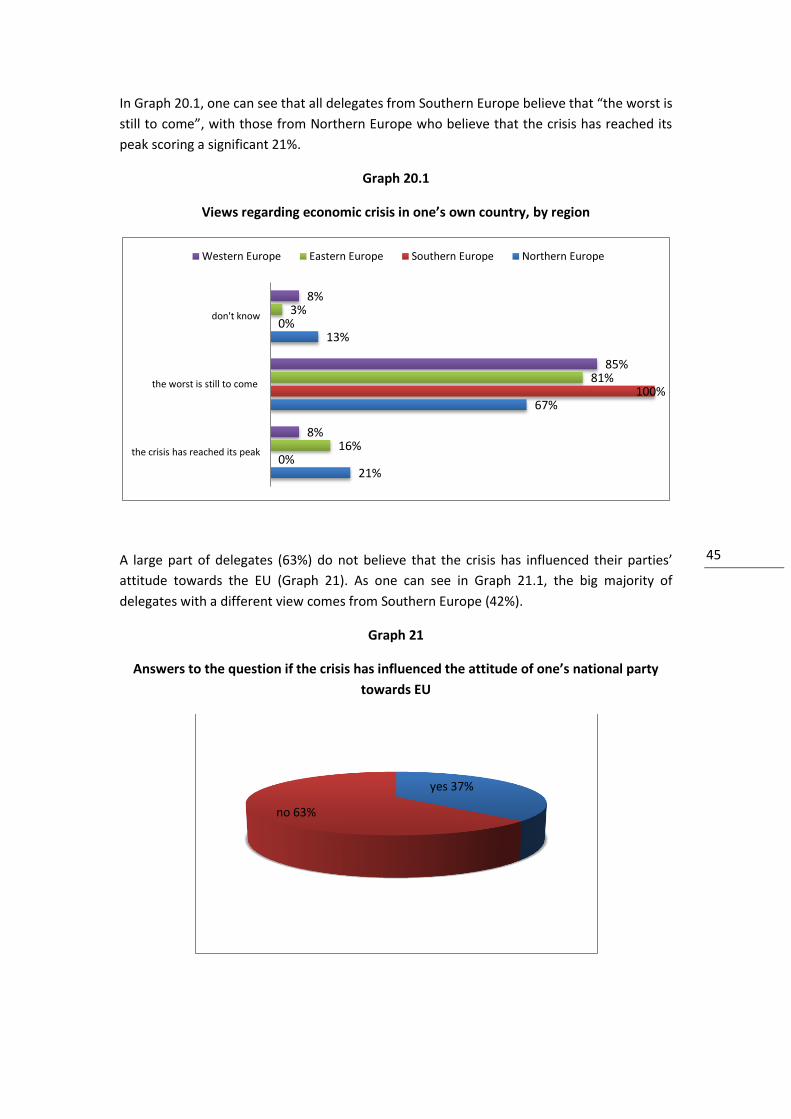
In Graph 20.1, one can see that all delegates from Southern Europe believe that “the worst is
still to come”, with those from Northern Europe who believe that the crisis has reached its
peak scoring a significant 21%.
Graph 20.1
Views regarding economic crisis in one’s own country, by region
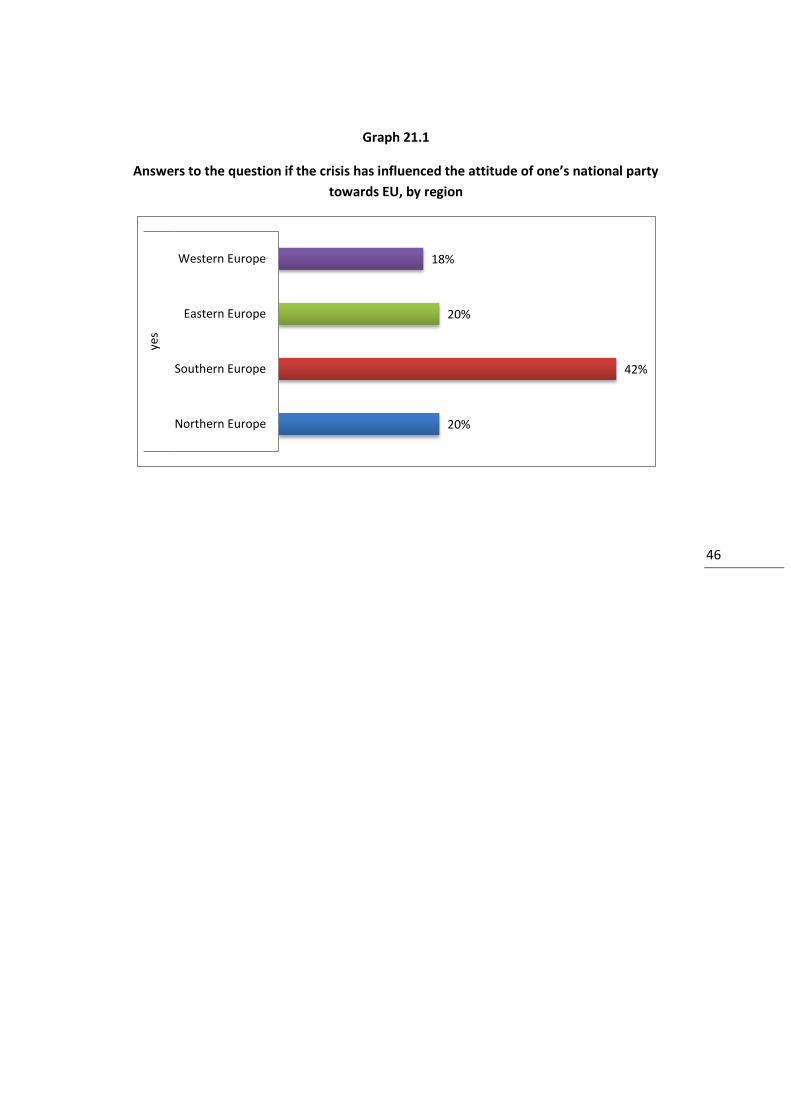
A large part of delegates (63%) do not believe that the crisis has influenced their parties’
attitude towards the EU (Graph 21). As one can see in Graph 21.1, the big majority of
delegates with a different view comes from Southern Europe (42%).
Graph 21
Answers to the question if the crisis has influenced the attitude of one’s national party
towards EU
21%
67%
13%
0%
100%
0%
16%
81%
3%
8%
85%
8%
the crisis has reached its peak
the worst is still to come
don't know
Western Europe Eastern Europe Southern Europe Northern Europe
yes 37%
no 63%
46 46
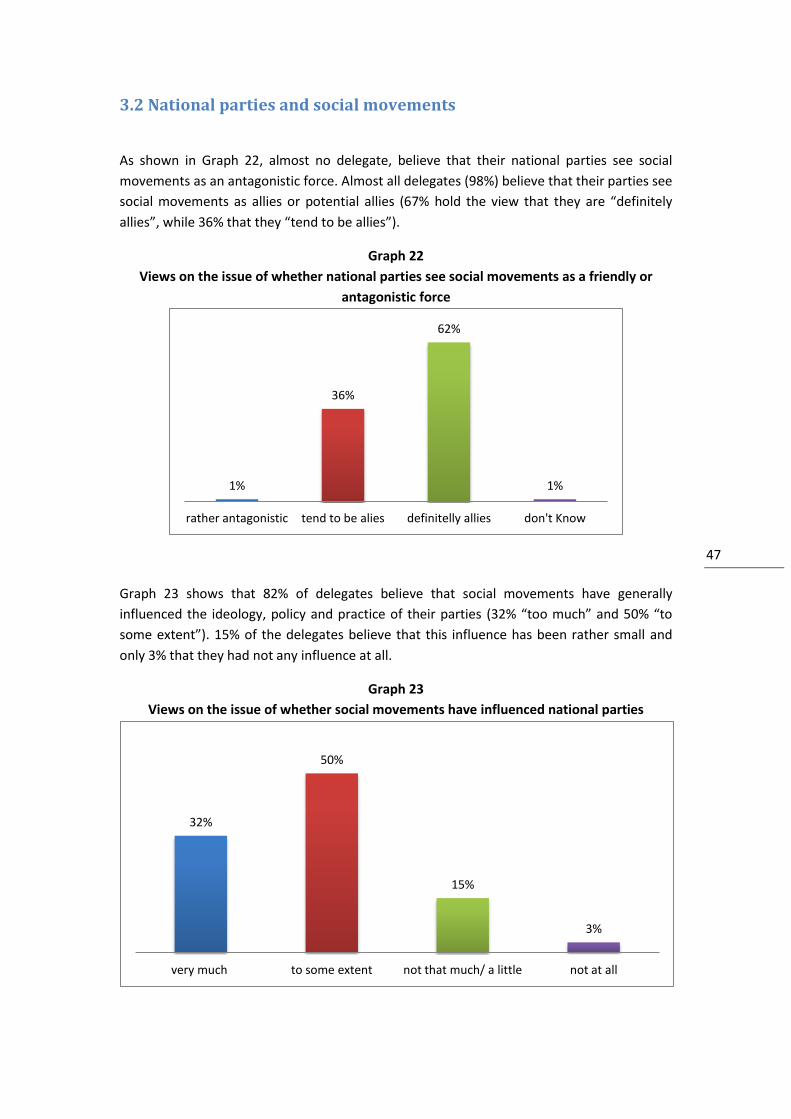
Graph 21.1
Answers to the question if the crisis has influenced the attitude of one’s national party
towards EU, by region
20%
42%
20%
18%
Northern Europe
Southern Europe
Eastern Europe
Western Europe
yes
47 47
3.2 National parties and social movements
As shown in Graph 22, almost no delegate, believe that their national parties see social
movements as an antagonistic force. Almost all delegates (98%) believe that their parties see
social movements as allies or potential allies (67% hold the view that they are “definitely
allies”, while 36% that they “tend to be allies”).
Graph 22
Views on the issue of whether national parties see social movements as a friendly or
antagonistic force
Graph 23 shows that 82% of delegates believe that social movements have generally
influenced the ideology, policy and practice of their parties (32% “too much” and 50% “to
some extent”). 15% of the delegates believe that this influence has been rather small and
only 3% that they had not any influence at all.
Graph 23
Views on the issue of whether social movements have influenced national parties
1%
36%
62%
1%
rather antagonistic tend to be alies definitelly allies don't Know
32%
50%
15%
3%
very much to some extent not that much/ a little not at all
48 48
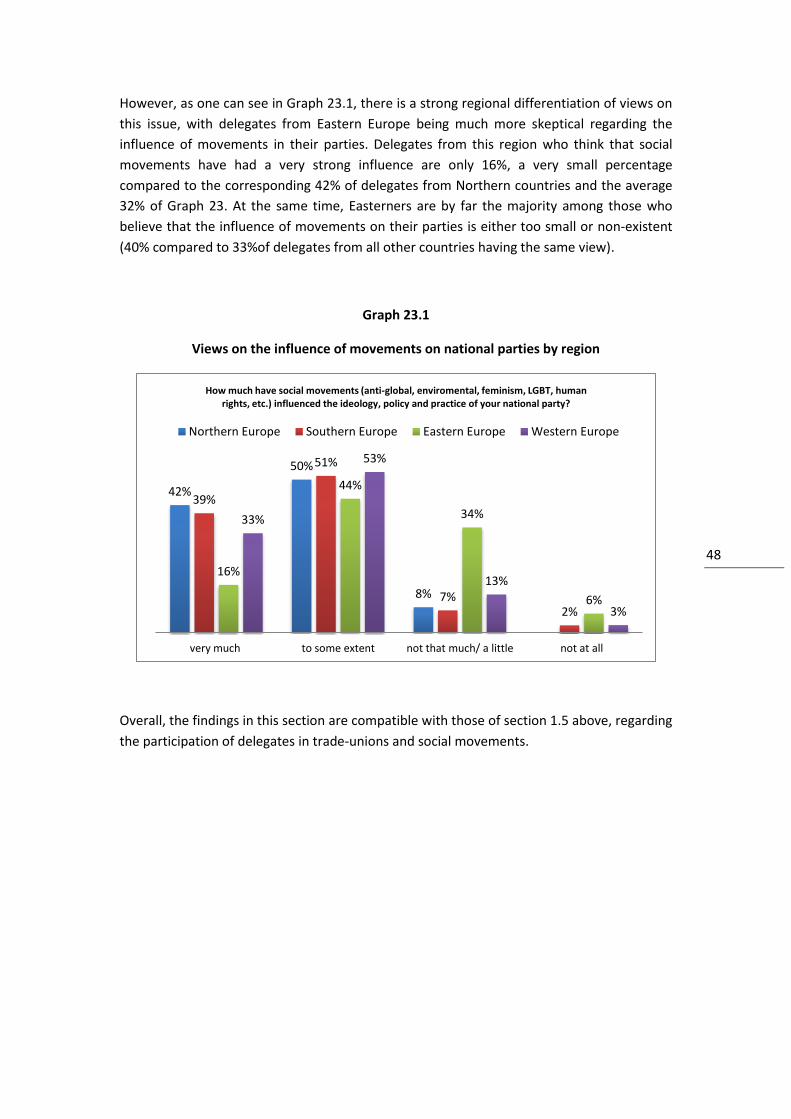
However, as one can see in Graph 23.1, there is a strong regional differentiation of views on
this issue, with delegates from Eastern Europe being much more skeptical regarding the
influence of movements in their parties. Delegates from this region who think that social
movements have had a very strong influence are only 16%, a very small percentage
compared to the corresponding 42% of delegates from Northern countries and the average
32% of Graph 23. At the same time, Easterners are by far the majority among those who
believe that the influence of movements on their parties is either too small or non-existent
(40% compared to 33%of delegates from all other countries having the same view).
Graph 23.1
Views on the influence of movements on national parties by region
Overall, the findings in this section are compatible with those of section 1.5 above, regarding
the participation of delegates in trade-unions and social movements.
42%
50%
8%
39%
51%
7% 2%
16%
44%
34%
6%
33%
53%
13%
3%
very much to some extent not that much/ a little not at all
How much have social movements (anti-global, enviromental, feminism, LGBT, human rights, etc.) influenced the ideology, policy and practice of your national party?
Northern Europe Southern Europe Eastern Europe Western Europe
49 49
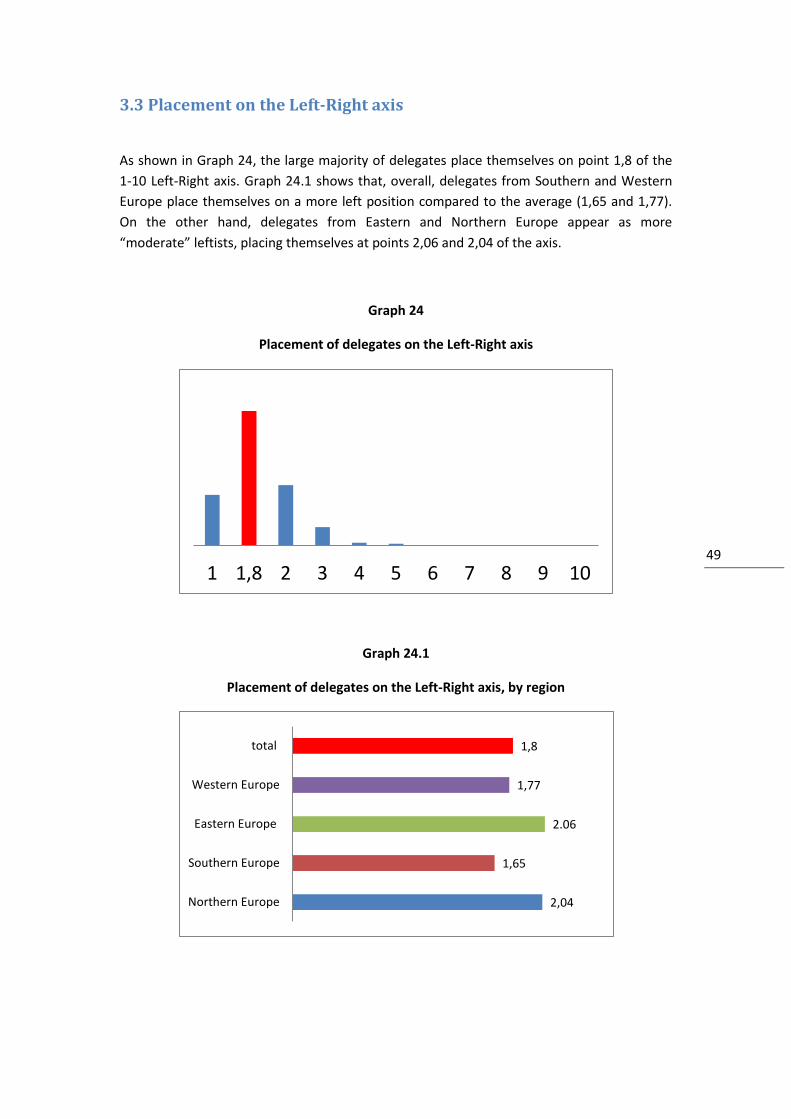
3.3 Placement on the Left-Right axis
As shown in Graph 24, the large majority of delegates place themselves on point 1,8 of the
1-10 Left-Right axis. Graph 24.1 shows that, overall, delegates from Southern and Western
Europe place themselves on a more left position compared to the average (1,65 and 1,77).
On the other hand, delegates from Eastern and Northern Europe appear as more
“moderate” leftists, placing themselves at points 2,06 and 2,04 of the axis.
Graph 24
Placement of delegates on the Left-Right axis
Graph 24.1
Placement of delegates on the Left-Right axis, by region
1 1,8 2 3 4 5 6 7 8 9 10
2,04
1,65
2.06
1,77
1,8
Northern Europe
Southern Europe
Eastern Europe
Western Europe
total
50 50
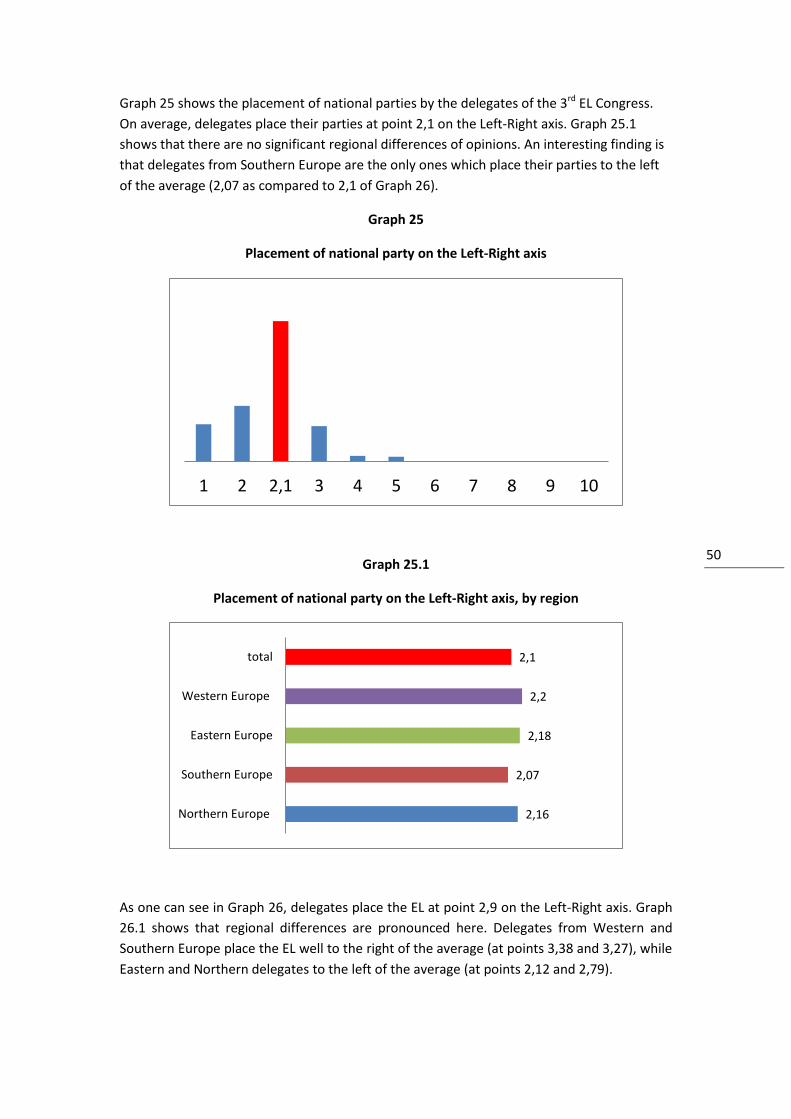
Graph 25 shows the placement of national parties by the delegates of the 3rd EL Congress.
On average, delegates place their parties at point 2,1 on the Left-Right axis. Graph 25.1
shows that there are no significant regional differences of opinions. An interesting finding is
that delegates from Southern Europe are the only ones which place their parties to the left
of the average (2,07 as compared to 2,1 of Graph 26).
Graph 25
Placement of national party on the Left-Right axis
Graph 25.1
Placement of national party on the Left-Right axis, by region
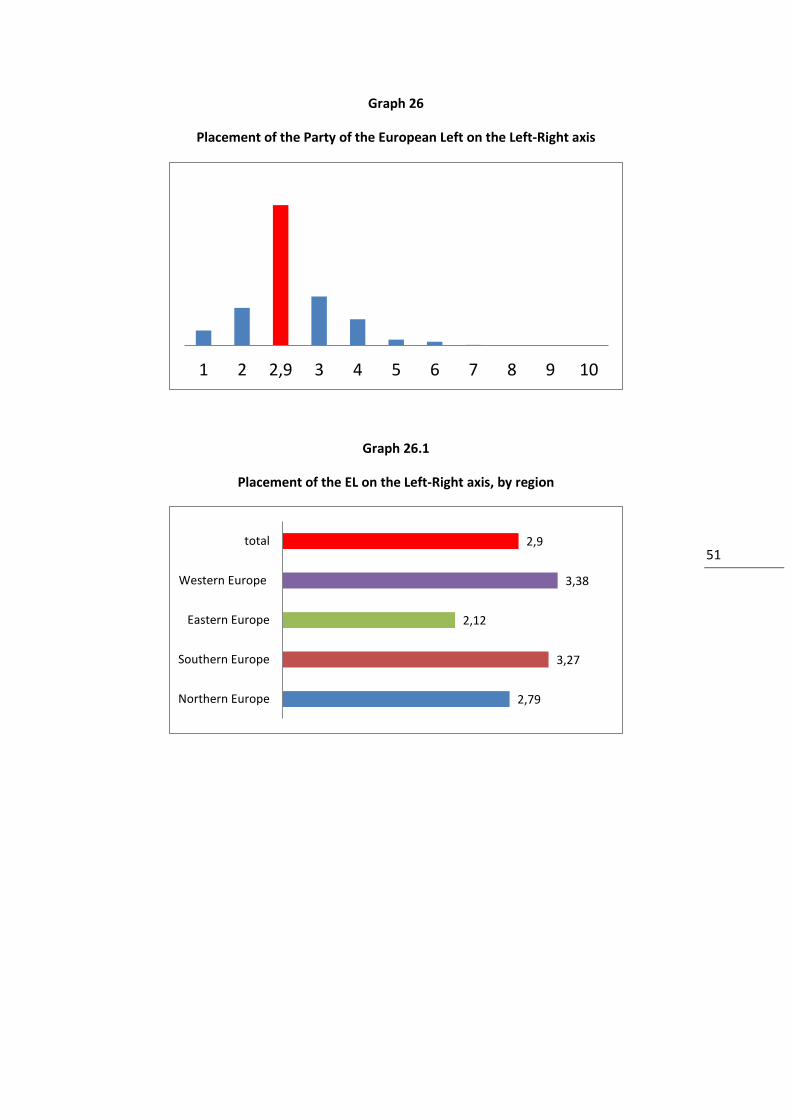
As one can see in Graph 26, delegates place the EL at point 2,9 on the Left-Right axis. Graph
26.1 shows that regional differences are pronounced here. Delegates from Western and
Southern Europe place the EL well to the right of the average (at points 3,38 and 3,27), while
Eastern and Northern delegates to the left of the average (at points 2,12 and 2,79).
1 2 2,1 3 4 5 6 7 8 9 10
2,16
2,07
2,18
2,2
2,1
Northern Europe
Southern Europe
Eastern Europe
Western Europe
total
51 51
Graph 26
Placement of the Party of the European Left on the Left-Right axis
Graph 26.1
Placement of the EL on the Left-Right axis, by region
1 2 2,9 3 4 5 6 7 8 9 10
2,79
3,27
2,12
3,38
2,9
Northern Europe
Southern Europe
Eastern Europe
Western Europe
total
52 52
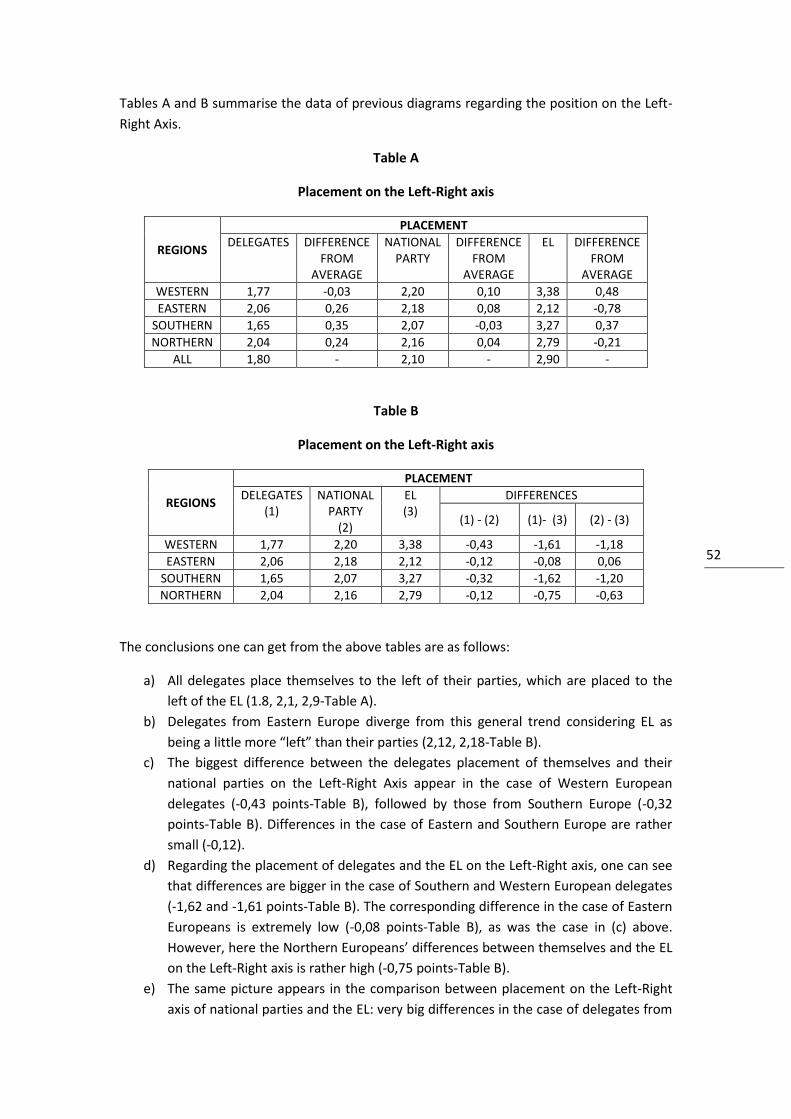
Tables A and B summarise the data of previous diagrams regarding the position on the Left-
Right Axis.
Table A
Placement on the Left-Right axis
REGIONS
PLACEMENT
DELEGATES DIFFERENCE FROM
AVERAGE
NATIONAL PARTY
DIFFERENCE FROM
AVERAGE
EL DIFFERENCE FROM
AVERAGE
WESTERN 1,77 -0,03 2,20 0,10 3,38 0,48
EASTERN 2,06 0,26 2,18 0,08 2,12 -0,78
SOUTHERN 1,65 0,35 2,07 -0,03 3,27 0,37
NORTHERN 2,04 0,24 2,16 0,04 2,79 -0,21
ALL 1,80 - 2,10 - 2,90 -
Table B
Placement on the Left-Right axis
REGIONS
PLACEMENT
DELEGATES (1)
NATIONAL PARTY
(2)
EL (3)
DIFFERENCES
(1) - (2) (1)- (3) (2) - (3)
WESTERN 1,77 2,20 3,38 -0,43 -1,61 -1,18
EASTERN 2,06 2,18 2,12 -0,12 -0,08 0,06
SOUTHERN 1,65 2,07 3,27 -0,32 -1,62 -1,20
NORTHERN 2,04 2,16 2,79 -0,12 -0,75 -0,63
Τhe conclusions one can get from the above tables are as follows:
a) All delegates place themselves to the left of their parties, which are placed to the
left of the EL (1.8, 2,1, 2,9-Table A).
b) Delegates from Eastern Europe diverge from this general trend considering EL as
being a little more “left” than their parties (2,12, 2,18-Table B).
c) The biggest difference between the delegates placement of themselves and their
national parties on the Left-Right Axis appear in the case of Western European
delegates (-0,43 points-Table B), followed by those from Southern Europe (-0,32
points-Table B). Differences in the case of Eastern and Southern Europe are rather
small (-0,12).
d) Regarding the placement of delegates and the EL on the Left-Right axis, one can see
that differences are bigger in the case of Southern and Western European delegates
(-1,62 and -1,61 points-Table B). The corresponding difference in the case of Eastern
Europeans is extremely low (-0,08 points-Table B), as was the case in (c) above.
However, here the Northern Europeans’ differences between themselves and the EL
on the Left-Right axis is rather high (-0,75 points-Table B).
e) The same picture appears in the comparison between placement on the Left-Right
axis of national parties and the EL: very big differences in the case of delegates from
53 53
Southern and Western European parties (-1,20 and -1,18 points-Table B), relatively
big in the case of Northern (-0,63 points-Table B) delegates and almost no difference
in Eastern Europeans (0,06 points-Table B).
54 54
3.4 National and European identity
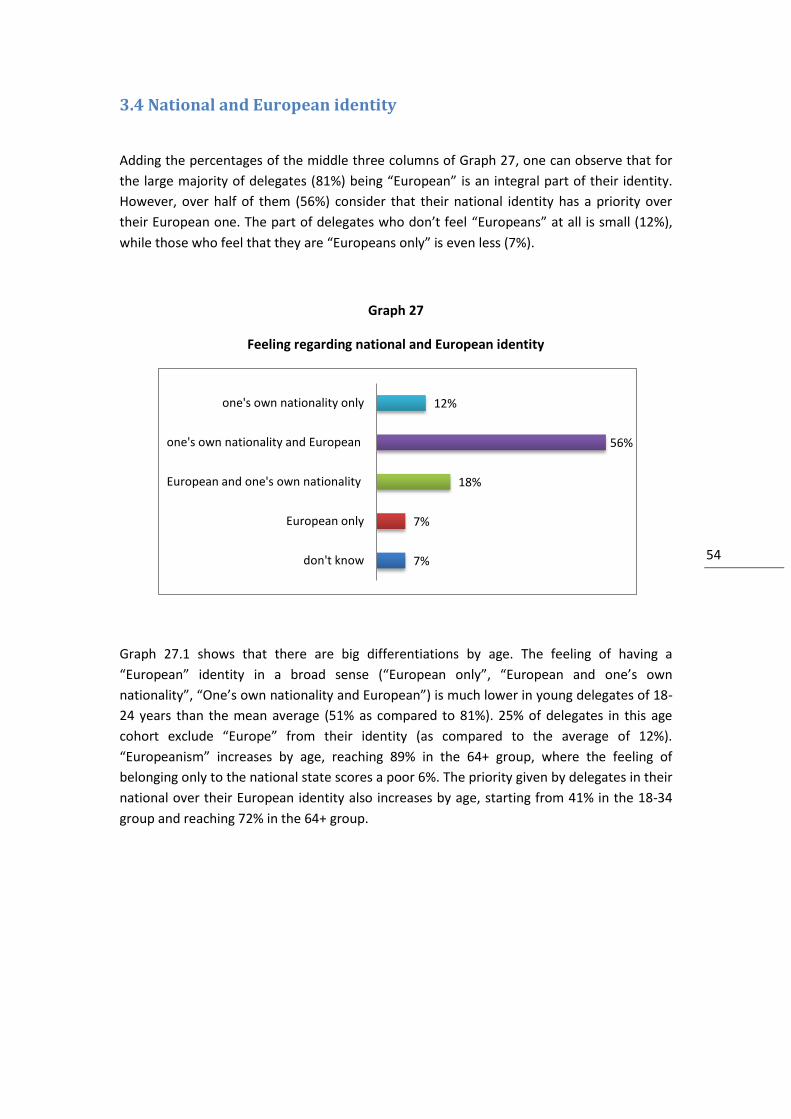
Adding the percentages of the middle three columns of Graph 27, one can observe that for
the large majority of delegates (81%) being “European” is an integral part of their identity.
However, over half of them (56%) consider that their national identity has a priority over
their European one. The part of delegates who don’t feel “Europeans” at all is small (12%),
while those who feel that they are “Europeans only” is even less (7%).
Graph 27
Feeling regarding national and European identity
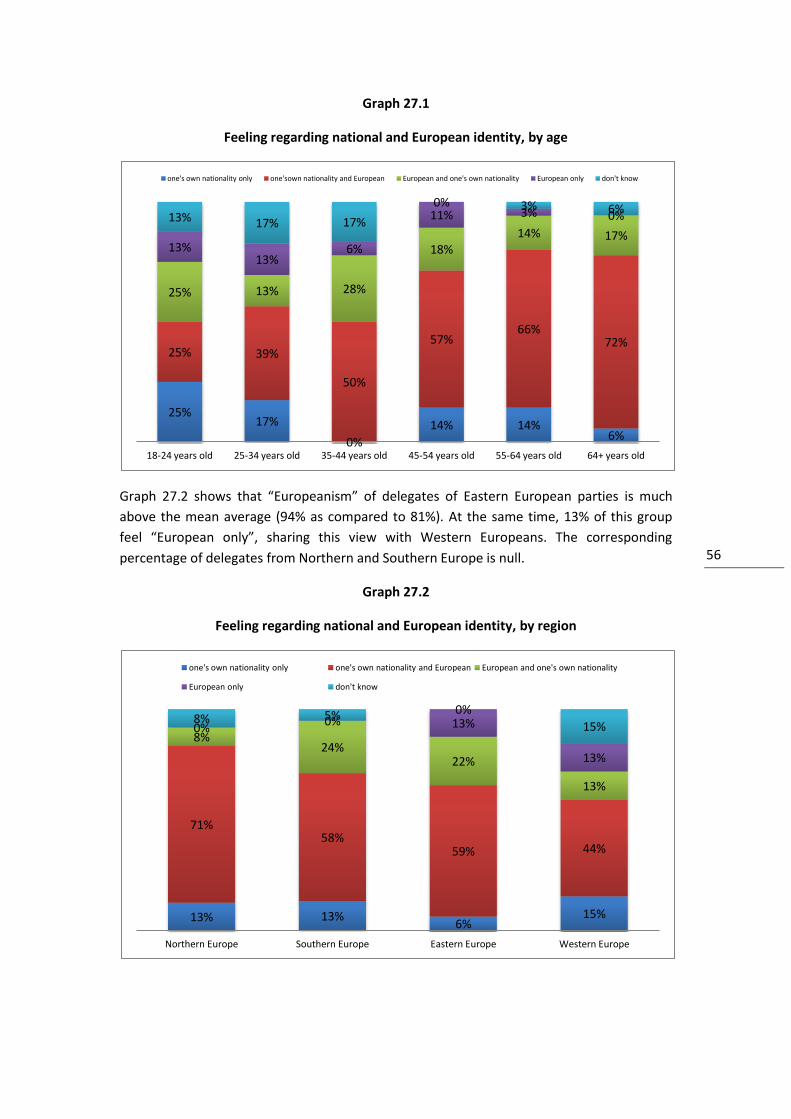
Graph 27.1 shows that there are big differentiations by age. The feeling of having a
“European” identity in a broad sense (“European only”, “European and one’s own
nationality”, “One’s own nationality and European”) is much lower in young delegates of 18-
24 years than the mean average (51% as compared to 81%). 25% of delegates in this age
cohort exclude “Europe” from their identity (as compared to the average of 12%).
“Europeanism” increases by age, reaching 89% in the 64+ group, where the feeling of
belonging only to the national state scores a poor 6%. The priority given by delegates in their
national over their European identity also increases by age, starting from 41% in the 18-34
group and reaching 72% in the 64+ group.
7%
7%
18%
56%
12%
don't know
European only
European and one's own nationality
one's own nationality and European
one's own nationality only
55 55
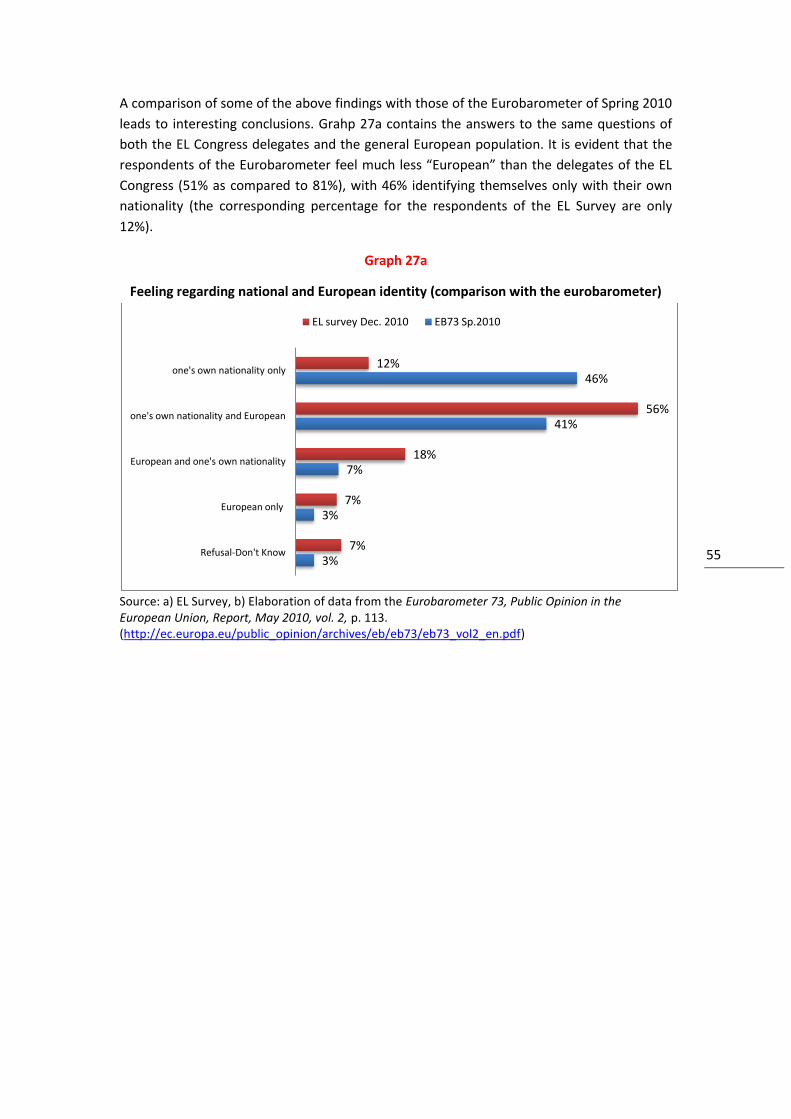
A comparison of some of the above findings with those of the Eurobarometer of Spring 2010
leads to interesting conclusions. Grahp 27a contains the answers to the same questions of
both the EL Congress delegates and the general European population. It is evident that the
respondents of the Eurobarometer feel much less “European” than the delegates of the EL
Congress (51% as compared to 81%), with 46% identifying themselves only with their own
nationality (the corresponding percentage for the respondents of the EL Survey are only
12%).
Graph 27a
Feeling regarding national and European identity (comparison with the eurobarometer)
Source: a) EL Survey, b) Elaboration of data from the Eurobarometer 73, Public Opinion in the European Union, Report, May 2010, vol. 2, p. 113. (http://ec.europa.eu/public_opinion/archives/eb/eb73/eb73_vol2_en.pdf)
3%
3%
7%
41%
46%
7%
7%
18%
56%
12%
Refusal-Don't Know
European only
European and one's own nationality
one's own nationality and European
one's own nationality only
EL survey Dec. 2010 EB73 Sp.2010
56 56
Graph 27.1
Feeling regarding national and European identity, by age
Graph 27.2 shows that “Europeanism” of delegates of Eastern European parties is much
above the mean average (94% as compared to 81%). At the same time, 13% of this group
feel “European only”, sharing this view with Western Europeans. The corresponding
percentage of delegates from Northern and Southern Europe is null.
Graph 27.2
Feeling regarding national and European identity, by region
25% 17%
0%
14% 14% 6%
25% 39%
50%
57% 66%
72%
25% 13% 28%
18% 14% 17%
13% 13%
6%
11% 3% 0% 13% 17% 17%
0% 3% 6%
18-24 years old 25-34 years old 35-44 years old 45-54 years old 55-64 years old 64+ years old
one's own nationality only one'sown nationality and European European and one's own nationality European only don't know
13% 13% 6%
15%
71% 58%
59% 44%
8% 24%
22%
13%
0% 0% 13%
13%
8% 5% 0%
15%
Northern Europe Southern Europe Eastern Europe Western Europe
one's own nationality only one's own nationality and European European and one's own nationality
European only don't know
57 57
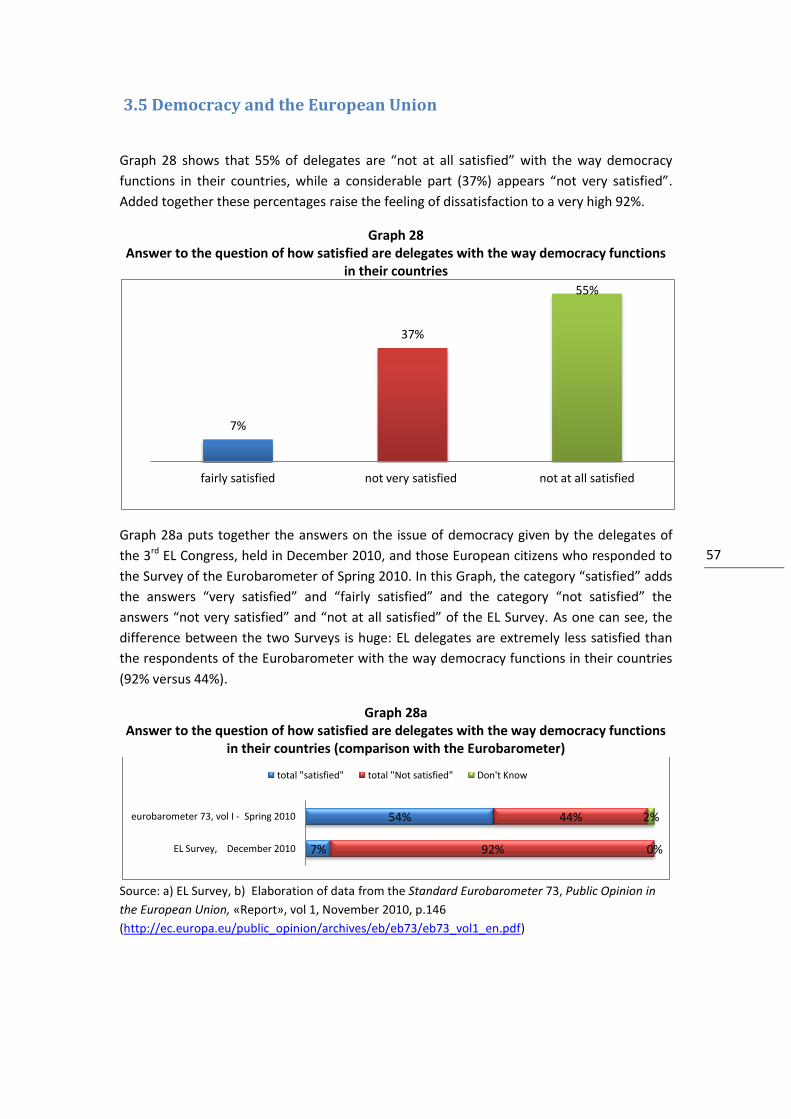
3.5 Democracy and the European Union
Graph 28 shows that 55% of delegates are “not at all satisfied” with the way democracy
functions in their countries, while a considerable part (37%) appears “not very satisfied”.
Added together these percentages raise the feeling of dissatisfaction to a very high 92%.
Graph 28 Answer to the question of how satisfied are delegates with the way democracy functions
in their countries
Graph 28a puts together the answers on the issue of democracy given by the delegates of
the 3rd EL Congress, held in December 2010, and those European citizens who responded to
the Survey of the Eurobarometer of Spring 2010. In this Graph, the category “satisfied” adds
the answers “very satisfied” and “fairly satisfied” and the category “not satisfied” the
answers “not very satisfied” and “not at all satisfied” of the EL Survey. As one can see, the
difference between the two Surveys is huge: EL delegates are extremely less satisfied than
the respondents of the Eurobarometer with the way democracy functions in their countries
(92% versus 44%).
Graph 28a Answer to the question of how satisfied are delegates with the way democracy functions
in their countries (comparison with the Eurobarometer)
Source: a) EL Survey, b) Elaboration of data from the Standard Eurobarometer 73, Public Opinion in
the European Union, «Report», vol 1, November 2010, p.146
(http://ec.europa.eu/public_opinion/archives/eb/eb73/eb73_vol1_en.pdf)
7%
37%
55%
fairly satisfied not very satisfied not at all satisfied
7%
54%
92%
44%
0%
2%
EL Survey, December 2010
eurobarometer 73, vol I - Spring 2010
total "satisfied" total "Not satisfied" Don't Know
58 58
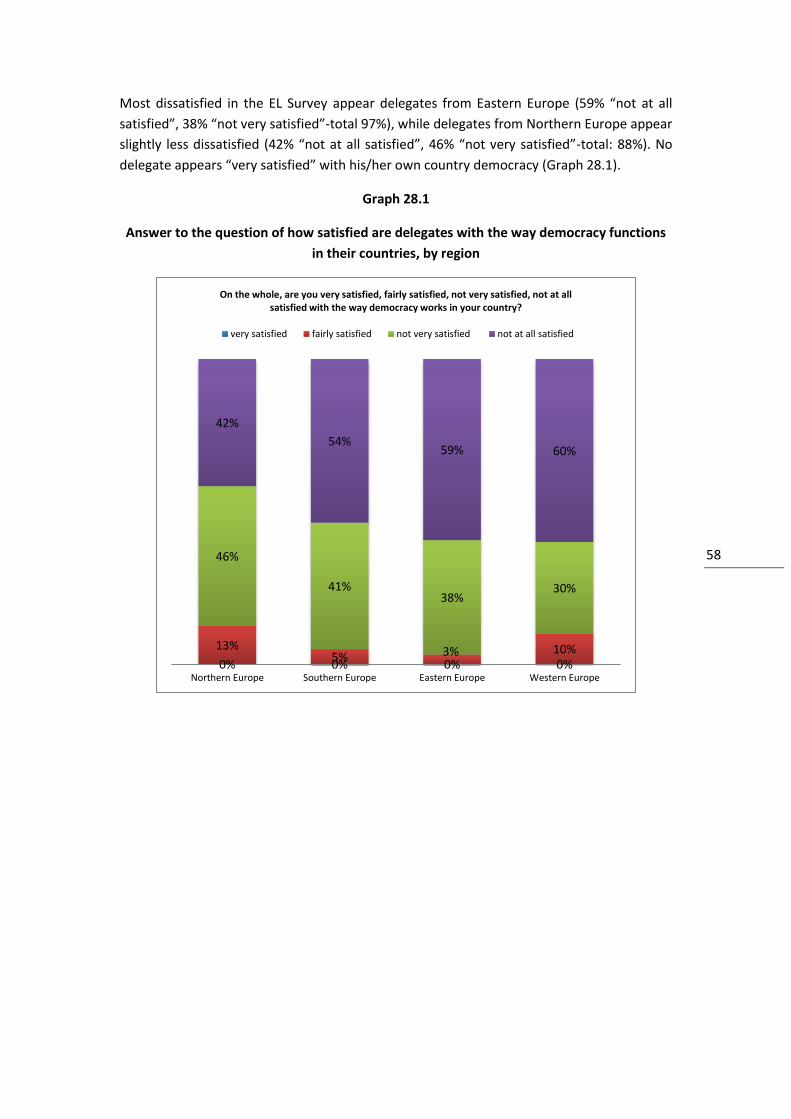
Most dissatisfied in the EL Survey appear delegates from Eastern Europe (59% “not at all
satisfied”, 38% “not very satisfied”-total 97%), while delegates from Northern Europe appear
slightly less dissatisfied (42% “not at all satisfied”, 46% “not very satisfied”-total: 88%). No
delegate appears “very satisfied” with his/her own country democracy (Graph 28.1).
Graph 28.1
Answer to the question of how satisfied are delegates with the way democracy functions
in their countries, by region
0% 0% 0% 0%
13% 5% 3% 10%
46%
41% 38%
30%
42%
54% 59% 60%
Northern Europe Southern Europe Eastern Europe Western Europe
On the whole, are you very satisfied, fairly satisfied, not very satisfied, not at all satisfied with the way democracy works in your country?
very satisfied fairly satisfied not very satisfied not at all satisfied
59 59
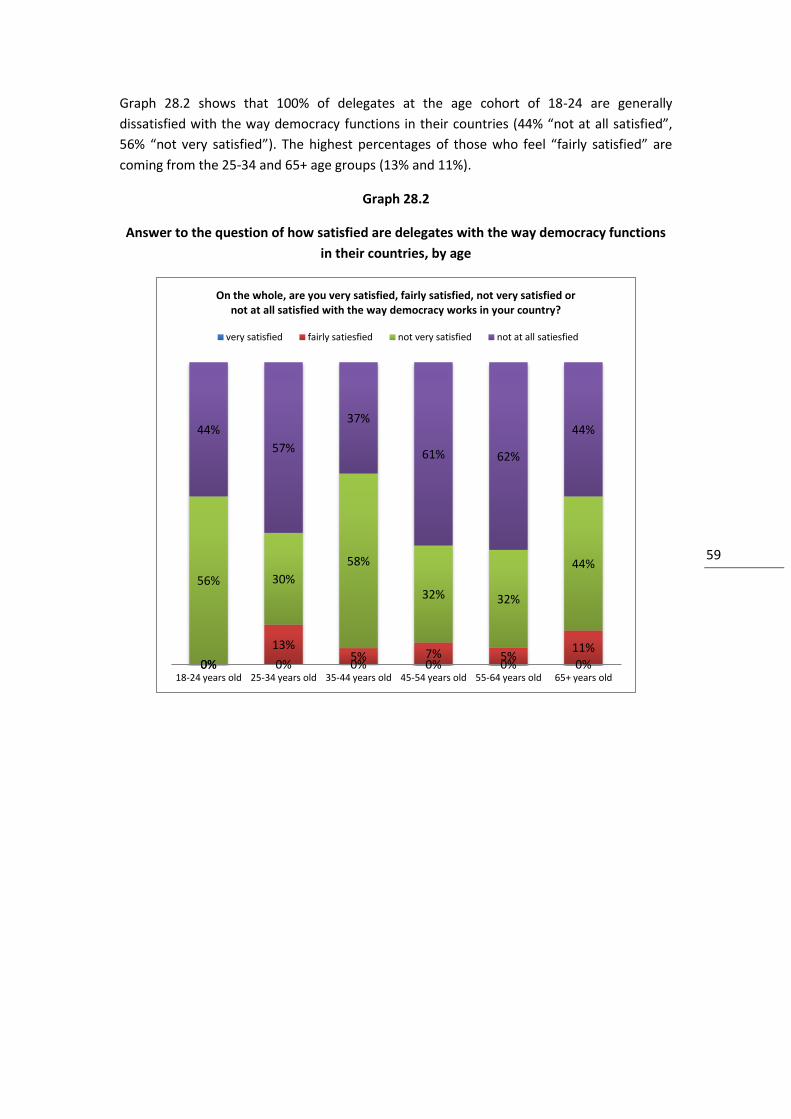
Graph 28.2 shows that 100% of delegates at the age cohort of 18-24 are generally
dissatisfied with the way democracy functions in their countries (44% “not at all satisfied”,
56% “not very satisfied”). The highest percentages of those who feel “fairly satisfied” are
coming from the 25-34 and 65+ age groups (13% and 11%).
Graph 28.2
Answer to the question of how satisfied are delegates with the way democracy functions
in their countries, by age
0% 0% 0% 0% 0% 0% 0%
13% 5% 7% 5%
11%
56% 30%
58%
32% 32%
44%
44%
57%
37%
61% 62%
44%
18-24 years old 25-34 years old 35-44 years old 45-54 years old 55-64 years old 65+ years old
On the whole, are you very satisfied, fairly satisfied, not very satisfied or not at all satisfied with the way democracy works in your country?
very satisfied fairly satiesfied not very satisfied not at all satiesfied
60 60
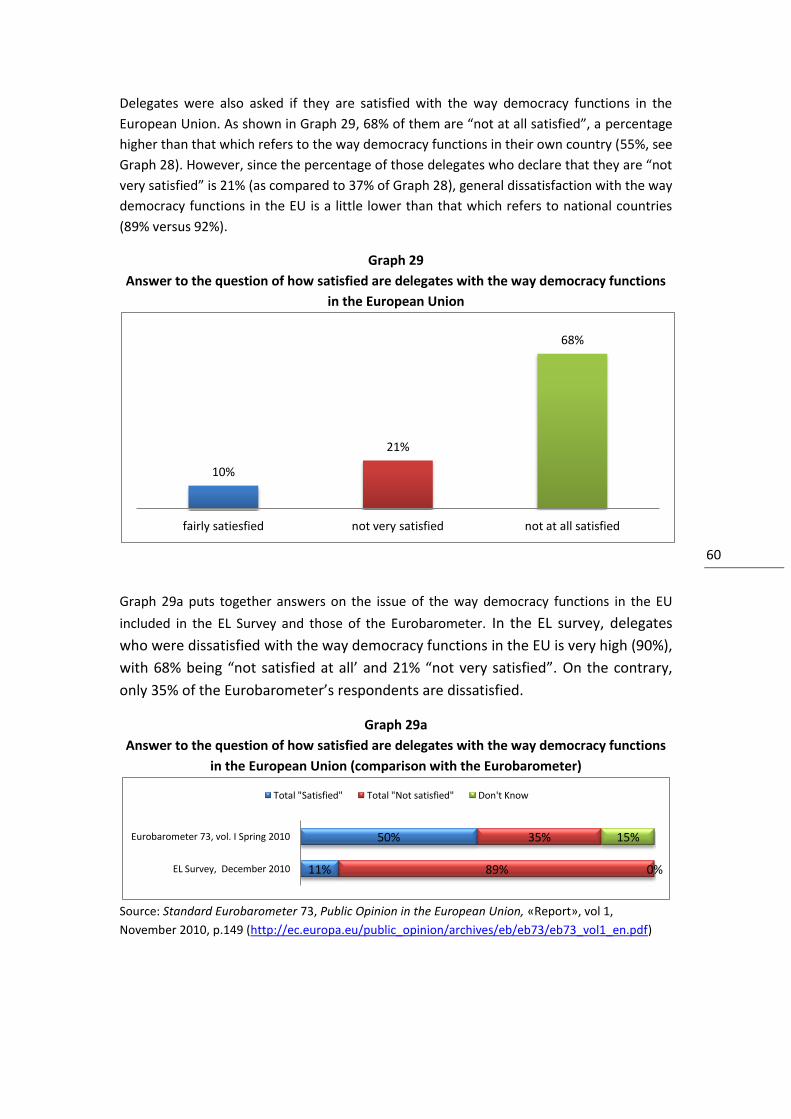
Delegates were also asked if they are satisfied with the way democracy functions in the
European Union. As shown in Graph 29, 68% of them are “not at all satisfied”, a percentage
higher than that which refers to the way democracy functions in their own country (55%, see
Graph 28). However, since the percentage of those delegates who declare that they are “not
very satisfied” is 21% (as compared to 37% of Graph 28), general dissatisfaction with the way
democracy functions in the EU is a little lower than that which refers to national countries
(89% versus 92%).
Graph 29
Answer to the question of how satisfied are delegates with the way democracy functions
in the European Union
Graph 29a puts together answers on the issue of the way democracy functions in the EU
included in the EL Survey and those of the Eurobarometer. In the EL survey, delegates
who were dissatisfied with the way democracy functions in the EU is very high (90%),
with 68% being “not satisfied at all’ and 21% “not very satisfied”. On the contrary,
only 35% of the Eurobarometer’s respondents are dissatisfied.
Graph 29a
Answer to the question of how satisfied are delegates with the way democracy functions
in the European Union (comparison with the Eurobarometer)
Source: Standard Eurobarometer 73, Public Opinion in the European Union, «Report», vol 1,
November 2010, p.149 (http://ec.europa.eu/public_opinion/archives/eb/eb73/eb73_vol1_en.pdf)
10%
21%
68%
fairly satiesfied not very satisfied not at all satisfied
11%
50%
89%
35%
0%
15%
EL Survey, December 2010
Eurobarometer 73, vol. I Spring 2010
Total "Satisfied" Total "Not satisfied" Don't Know
61 61
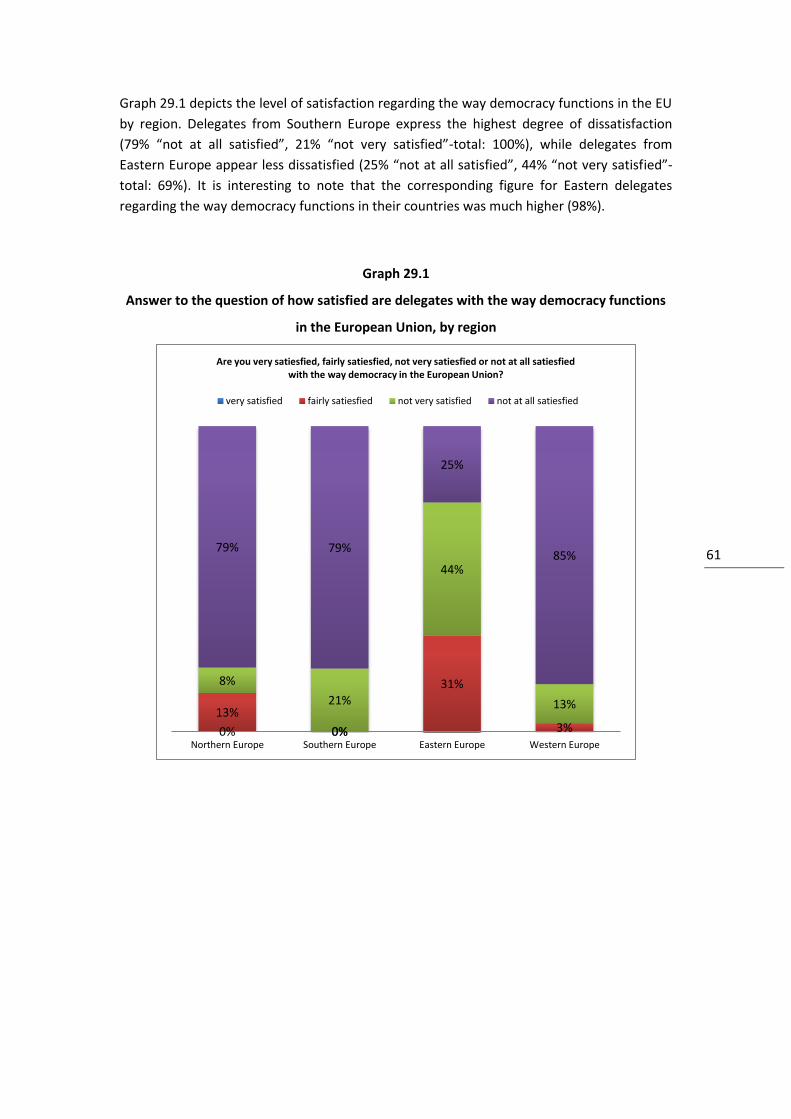
Graph 29.1 depicts the level of satisfaction regarding the way democracy functions in the EU
by region. Delegates from Southern Europe express the highest degree of dissatisfaction
(79% “not at all satisfied”, 21% “not very satisfied”-total: 100%), while delegates from
Eastern Europe appear less dissatisfied (25% “not at all satisfied”, 44% “not very satisfied”-
total: 69%). It is interesting to note that the corresponding figure for Eastern delegates
regarding the way democracy functions in their countries was much higher (98%).
Graph 29.1
Answer to the question of how satisfied are delegates with the way democracy functions
in the European Union, by region
0% 0%
13%
0%
31%
3%
8%
21%
44%
13%
79% 79%
25%
85%
Northern Europe Southern Europe Eastern Europe Western Europe
Are you very satiesfied, fairly satiesfied, not very satiesfied or not at all satiesfied with the way democracy in the European Union?
very satisfied fairly satiesfied not very satisfied not at all satiesfied
62 62
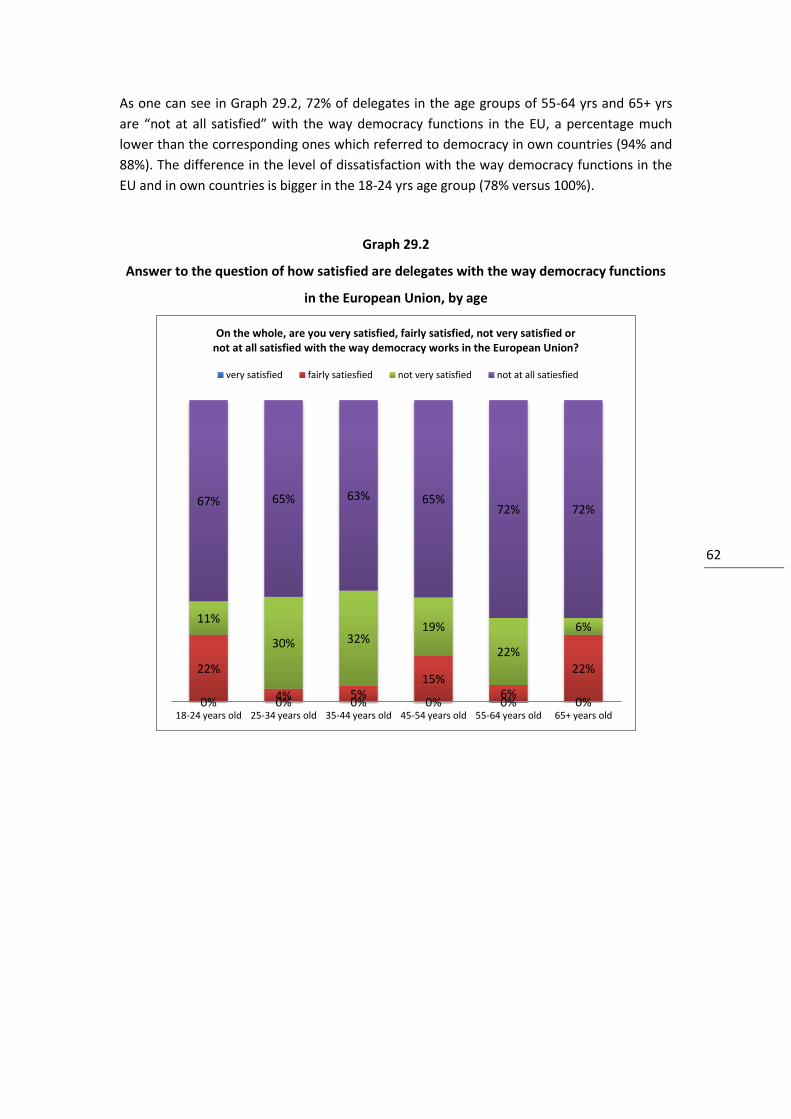
As one can see in Graph 29.2, 72% of delegates in the age groups of 55-64 yrs and 65+ yrs
are “not at all satisfied” with the way democracy functions in the EU, a percentage much
lower than the corresponding ones which referred to democracy in own countries (94% and
88%). The difference in the level of dissatisfaction with the way democracy functions in the
EU and in own countries is bigger in the 18-24 yrs age group (78% versus 100%).
Graph 29.2
Answer to the question of how satisfied are delegates with the way democracy functions
in the European Union, by age
0% 0% 0% 0% 0% 0%
22%
4% 5% 15%
6%
22%
11%
30% 32% 19%
22%
6%
67% 65% 63% 65% 72% 72%
18-24 years old 25-34 years old 35-44 years old 45-54 years old 55-64 years old 65+ years old
On the whole, are you very satisfied, fairly satisfied, not very satisfied or not at all satisfied with the way democracy works in the European Union?
very satisfied fairly satiesfied not very satisfied not at all satiesfied
63 63
3.6 Impact of EU membership
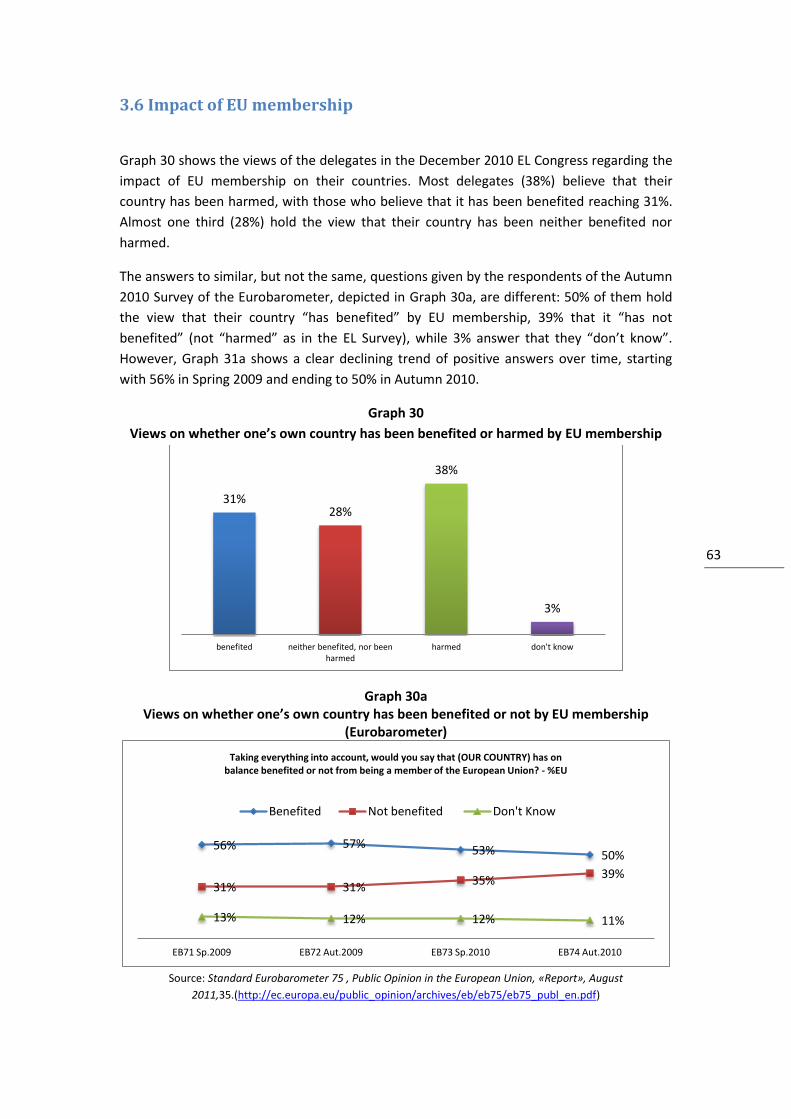
Graph 30 shows the views of the delegates in the December 2010 EL Congress regarding the
impact of EU membership on their countries. Most delegates (38%) believe that their
country has been harmed, with those who believe that it has been benefited reaching 31%.
Almost one third (28%) hold the view that their country has been neither benefited nor
harmed.
The answers to similar, but not the same, questions given by the respondents of the Autumn
2010 Survey of the Eurobarometer, depicted in Graph 30a, are different: 50% of them hold
the view that their country “has benefited” by EU membership, 39% that it “has not
benefited” (not “harmed” as in the EL Survey), while 3% answer that they “don’t know”.
However, Graph 31a shows a clear declining trend of positive answers over time, starting
with 56% in Spring 2009 and ending to 50% in Autumn 2010.
Graph 30
Views on whether one’s own country has been benefited or harmed by EU membership
Graph 30a Views on whether one’s own country has been benefited or not by EU membership
(Eurobarometer)
Source: Standard Eurobarometer 75 , Public Opinion in the European Union, «Report», August
2011,35.(http://ec.europa.eu/public_opinion/archives/eb/eb75/eb75_publ_en.pdf)
31% 28%
38%
3%
benefited neither benefited, nor been harmed
harmed don't know
56% 57% 53% 50%
31% 31% 35%
39%
13% 12% 12% 11%
EB71 Sp.2009 EB72 Aut.2009 EB73 Sp.2010 EB74 Aut.2010
Taking everything into account, would you say that (OUR COUNTRY) has on balance benefited or not from being a member of the European Union? - %EU
Benefited Not benefited Don't Know
64 64
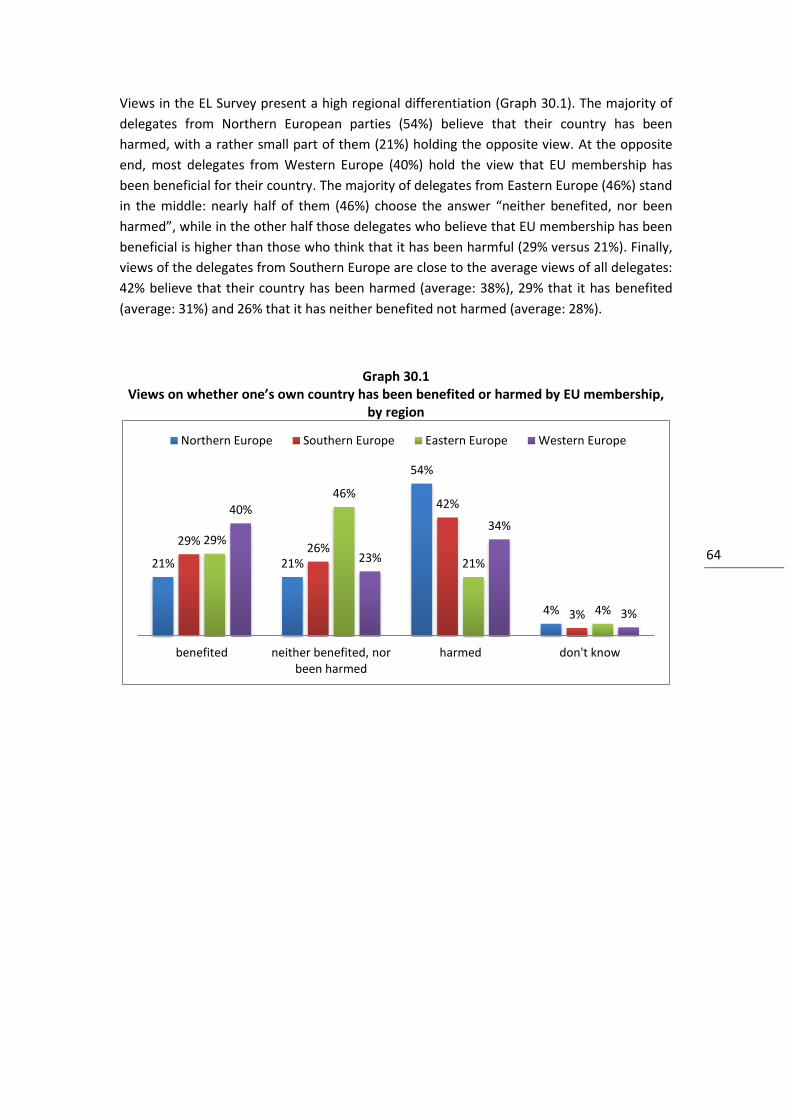
Views in the EL Survey present a high regional differentiation (Graph 30.1). The majority of
delegates from Northern European parties (54%) believe that their country has been
harmed, with a rather small part of them (21%) holding the opposite view. At the opposite
end, most delegates from Western Europe (40%) hold the view that EU membership has
been beneficial for their country. The majority of delegates from Eastern Europe (46%) stand
in the middle: nearly half of them (46%) choose the answer “neither benefited, nor been
harmed”, while in the other half those delegates who believe that EU membership has been
beneficial is higher than those who think that it has been harmful (29% versus 21%). Finally,
views of the delegates from Southern Europe are close to the average views of all delegates:
42% believe that their country has been harmed (average: 38%), 29% that it has benefited
(average: 31%) and 26% that it has neither benefited not harmed (average: 28%).
Graph 30.1 Views on whether one’s own country has been benefited or harmed by EU membership,
by region
21% 21%
54%
4%
29% 26%
42%
3%
29%
46%
21%
4%
40%
23%
34%
3%
benefited neither benefited, nor been harmed
harmed don't know
Northern Europe Southern Europe Eastern Europe Western Europe
65 65
4. Evaluation of the Party of the European Left by the
delegates
66 66
4.1Discourse
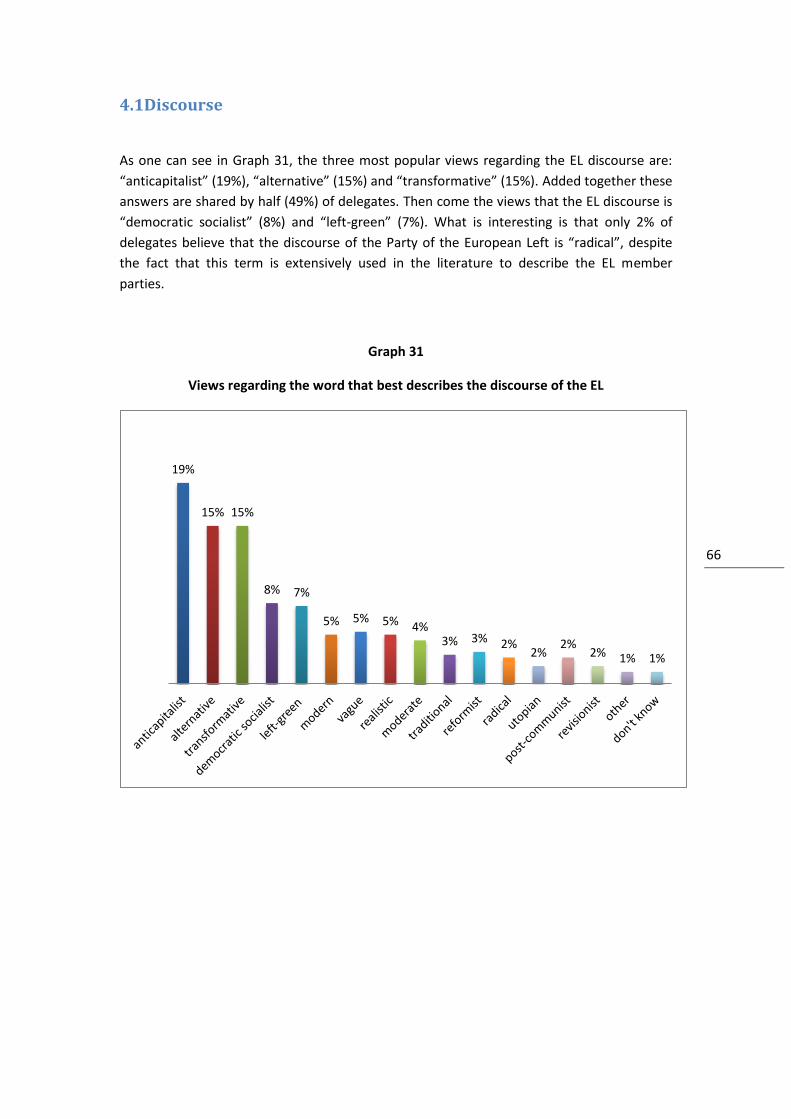
As one can see in Graph 31, the three most popular views regarding the EL discourse are:
“anticapitalist” (19%), “alternative” (15%) and “transformative” (15%). Added together these
answers are shared by half (49%) of delegates. Then come the views that the EL discourse is
“democratic socialist” (8%) and “left-green” (7%). What is interesting is that only 2% of
delegates believe that the discourse of the Party of the European Left is “radical”, despite
the fact that this term is extensively used in the literature to describe the EL member
parties.
Graph 31
Views regarding the word that best describes the discourse of the EL
19%
15% 15%
8% 7%
5% 5% 5% 4% 3% 3% 2%
2% 2%
2% 1% 1%
67 67
4.2 Policies
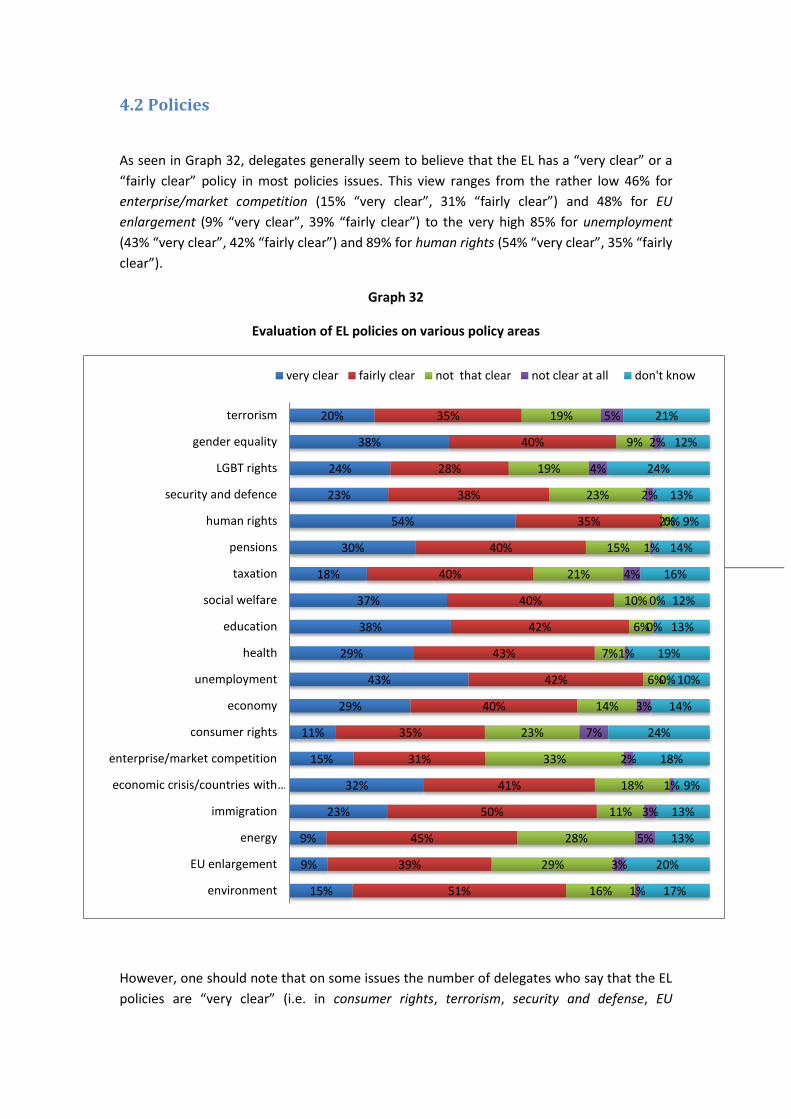
As seen in Graph 32, delegates generally seem to believe that the EL has a “very clear” or a
“fairly clear” policy in most policies issues. This view ranges from the rather low 46% for
enterprise/market competition (15% “very clear”, 31% “fairly clear”) and 48% for EU
enlargement (9% “very clear”, 39% “fairly clear”) to the very high 85% for unemployment
(43% “very clear”, 42% “fairly clear”) and 89% for human rights (54% “very clear”, 35% “fairly
clear”).
Graph 32
Evaluation of EL policies on various policy areas
However, one should note that on some issues the number of delegates who say that the EL
policies are “very clear” (i.e. in consumer rights, terrorism, security and defense, EU
15%
9%
9%
23%
32%
15%
11%
29%
43%
29%
38%
37%
18%
30%
54%
23%
24%
38%
20%
51%
39%
45%
50%
41%
31%
35%
40%
42%
43%
42%
40%
40%
40%
35%
38%
28%
40%
35%
16%
29%
28%
11%
18%
33%
23%
14%
6%
7%
6%
10%
21%
15%
2%
23%
19%
9%
19%
1%
3%
5%
3%
1%
2%
7%
3%
0%
1%
0%
0%
4%
1%
0%
2%
4%
2%
5%
17%
20%
13%
13%
9%
18%
24%
14%
10%
19%
13%
12%
16%
14%
9%
13%
24%
12%
21%
environment
EU enlargement
energy
immigration
economic crisis/countries with …
enterprise/market competition
consumer rights
economy
unemployment
health
education
social welfare
taxation
pensions
human rights
security and defence
LGBT rights
gender equality
terrorism
very clear fairly clear not that clear not clear at all don't know

68 68
enlargement, energy etc) is rather low. If this finding is combined with the number of the
“don’t know” answers, one could come to the conclusion that the policies of the EL in these
issues are not adequately known to the delegates of the 3rd EL Congress. Taking into
consideration the fact that, according to other findings of the Survey, these delegates in
their big majority are high ranking parties’ cadres, it almost sure that the EL policies on these
issues are even less known to the general public of various European countries.
69 69
4.3 Party bodies
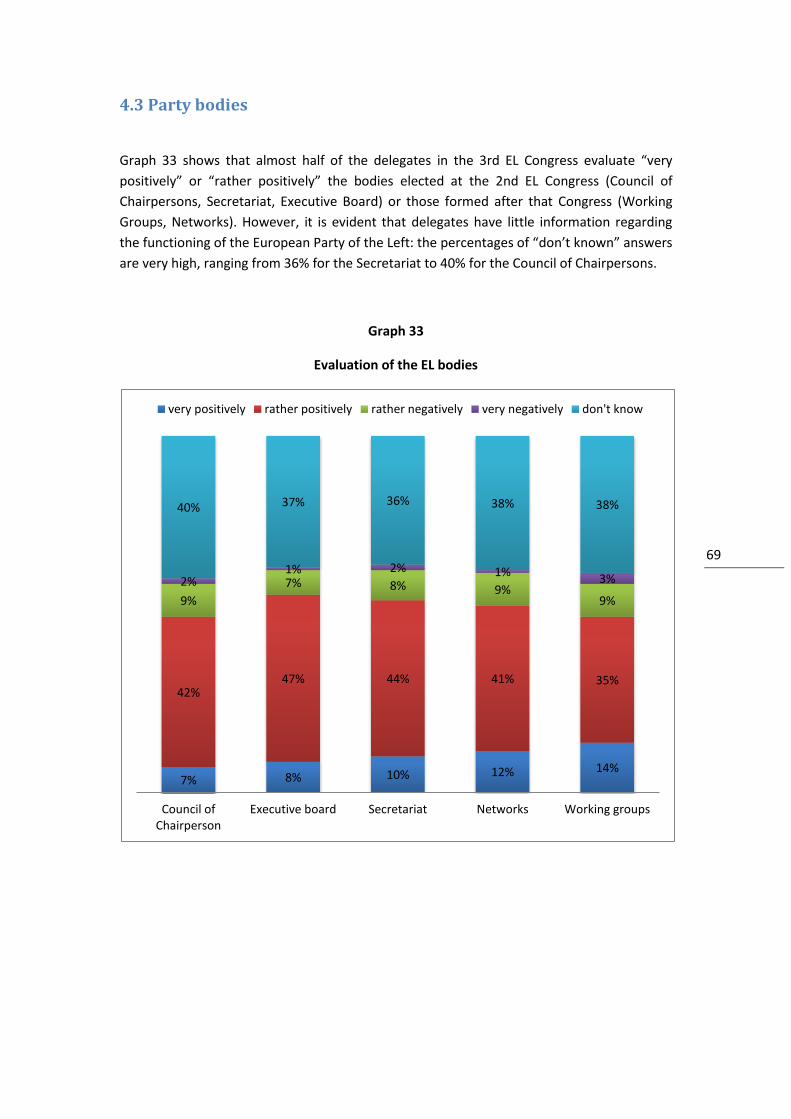
Graph 33 shows that almost half of the delegates in the 3rd EL Congress evaluate “very
positively” or “rather positively” the bodies elected at the 2nd EL Congress (Council of
Chairpersons, Secretariat, Executive Board) or those formed after that Congress (Working
Groups, Networks). However, it is evident that delegates have little information regarding
the functioning of the European Party of the Left: the percentages of “don’t known” answers
are very high, ranging from 36% for the Secretariat to 40% for the Council of Chairpersons.
Graph 33
Εvaluation of the EL bodies
7% 8% 10% 12% 14%
42% 47% 44% 41% 35%
9%
7% 8% 9% 9%
2% 1% 2% 1%
3%
40% 37% 36% 38% 38%
Council of Chairperson
Executive board Secretariat Networks Working groups
very positively rather positively rather negatively very negatively don't know
70 70
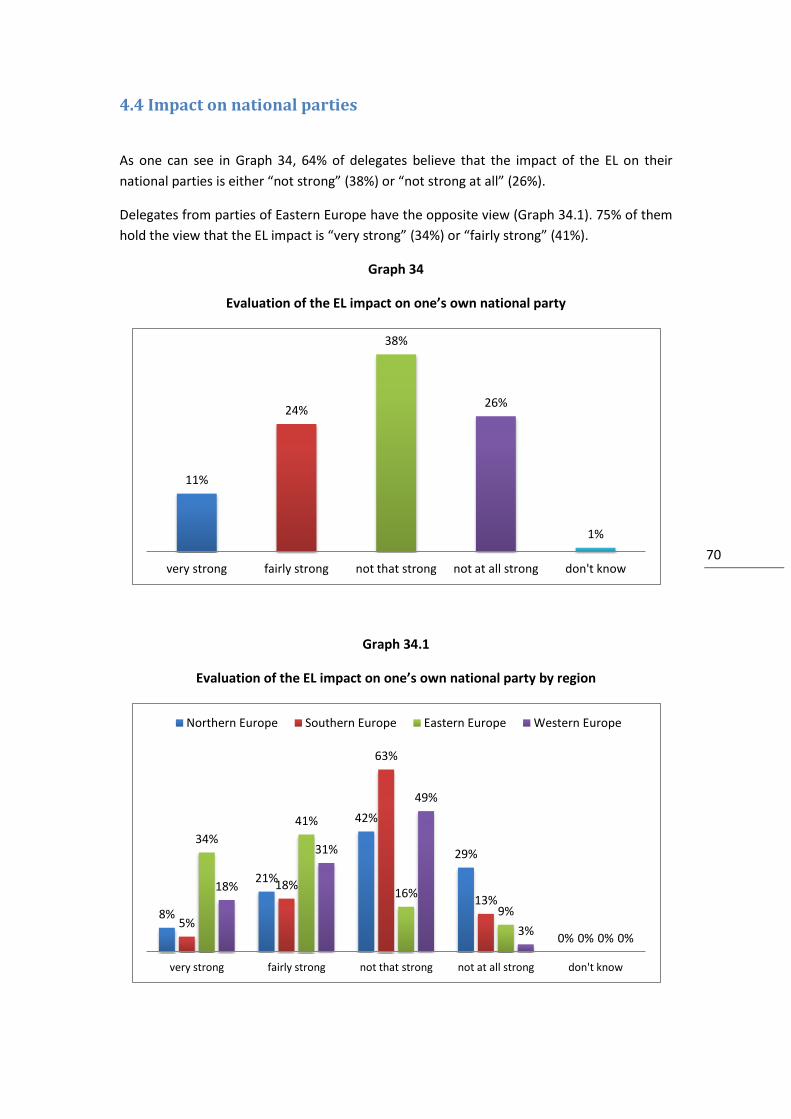
4.4 Impact on national parties
As one can see in Graph 34, 64% of delegates believe that the impact of the EL on their
national parties is either “not strong” (38%) or “not strong at all” (26%).
Delegates from parties of Eastern Europe have the opposite view (Graph 34.1). 75% of them
hold the view that the EL impact is “very strong” (34%) or “fairly strong” (41%).
Graph 34
Εvaluation of the EL impact on one’s own national party
Graph 34.1
Εvaluation of the EL impact on one’s own national party by region
11%
24%
38%
26%
1%
very strong fairly strong not that strong not at all strong don't know
8%
21%
42%
29%
0% 5%
18%
63%
13%
0%
34%
41%
16%
9%
0%
18%
31%
49%
3% 0%
very strong fairly strong not that strong not at all strong don't know
Northern Europe Southern Europe Eastern Europe Western Europe
71 71
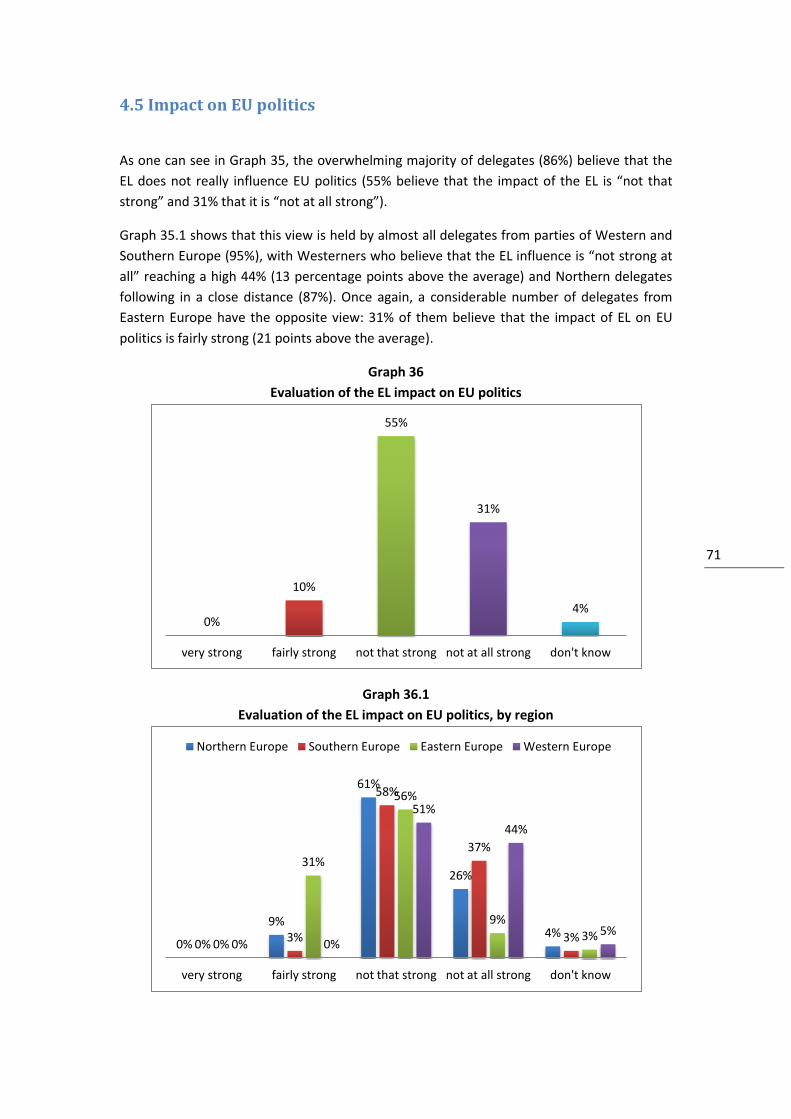
4.5 Impact on EU politics
As one can see in Graph 35, the overwhelming majority of delegates (86%) believe that the
EL does not really influence EU politics (55% believe that the impact of the EL is “not that
strong” and 31% that it is “not at all strong”).
Graph 35.1 shows that this view is held by almost all delegates from parties of Western and
Southern Europe (95%), with Westerners who believe that the EL influence is “not strong at
all” reaching a high 44% (13 percentage points above the average) and Northern delegates
following in a close distance (87%). Once again, a considerable number of delegates from
Eastern Europe have the opposite view: 31% of them believe that the impact of EL on EU
politics is fairly strong (21 points above the average).
Graph 36
Evaluation of the EL impact on EU politics
Graph 36.1
Evaluation of the EL impact on EU politics, by region
0%
10%
55%
31%
4%
very strong fairly strong not that strong not at all strong don't know
0%
9%
61%
26%
4% 0%
3%
58%
37%
3% 0%
31%
56%
9% 3%
0% 0%
51%
44%
5%
very strong fairly strong not that strong not at all strong don't know
Northern Europe Southern Europe Eastern Europe Western Europe

72 72
4.6 Impact on the campaign for the European elections
As one can see in Graph 36, more than half (52%) of delegates hold the view that the EL was
generally helpful to the campaign of their parties in the 2009 European elections (37% “fairly
helpful”, but only 15% “very helpful”). The big majority of delegates from parties of Eastern
Europe have a much more positive view on the usefulness of EL documents for the European
Parliament electoral campaign: 41% of them believe that the documents were “very helpful”
and 41% “fairly helpful” (Graph 36.1).
Graph 36
Evaluation of the impact of the EL documents on the campaign for the European elections
Graph 36.1
Evaluation of the impact of the EL documents on the campaign for the European elections,
by region
15%
37%
30%
6%
12%
very helpful fairly helpful not that helpful not at all helpful don't know
9%
17%
35%
4%
35%
5%
45%
38%
8% 5%
41% 41%
15%
4% 0%
8%
36% 33%
8%
14%
very helpful fairly helpful not that helpful not at all helpful don't know
Northern Europe Southern Europe Eastern Europe Western Europe
73 73
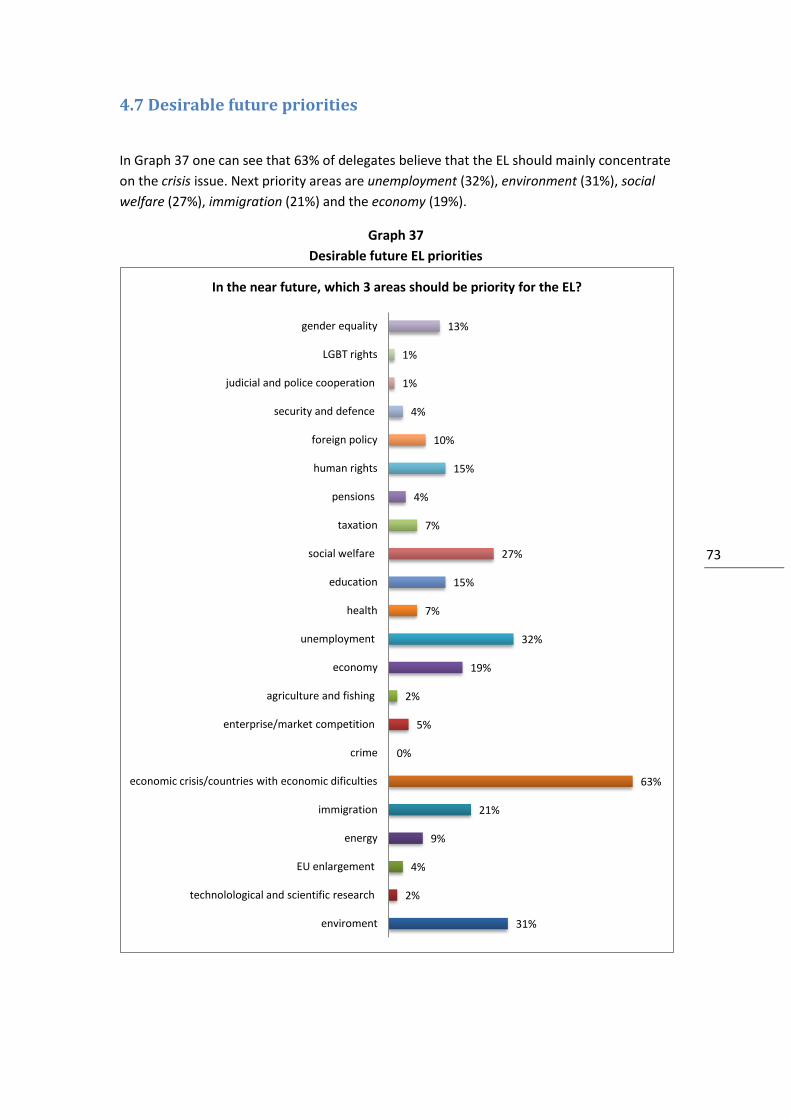
4.7 Desirable future priorities
In Graph 37 one can see that 63% of delegates believe that the EL should mainly concentrate
on the crisis issue. Next priority areas are unemployment (32%), environment (31%), social
welfare (27%), immigration (21%) and the economy (19%).
Graph 37
Desirable future EL priorities
31%
2%
4%
9%
21%
63%
0%
5%
2%
19%
32%
7%
15%
27%
7%
4%
15%
10%
4%
1%
1%
13%
enviroment
technolological and scientific research
EU enlargement
energy
immigration
economic crisis/countries with economic dificulties
crime
enterprise/market competition
agriculture and fishing
economy
unemployment
health
education
social welfare
taxation
pensions
human rights
foreign policy
security and defence
judicial and police cooperation
LGBT rights
gender equality
In the near future, which 3 areas should be priority for the EL?
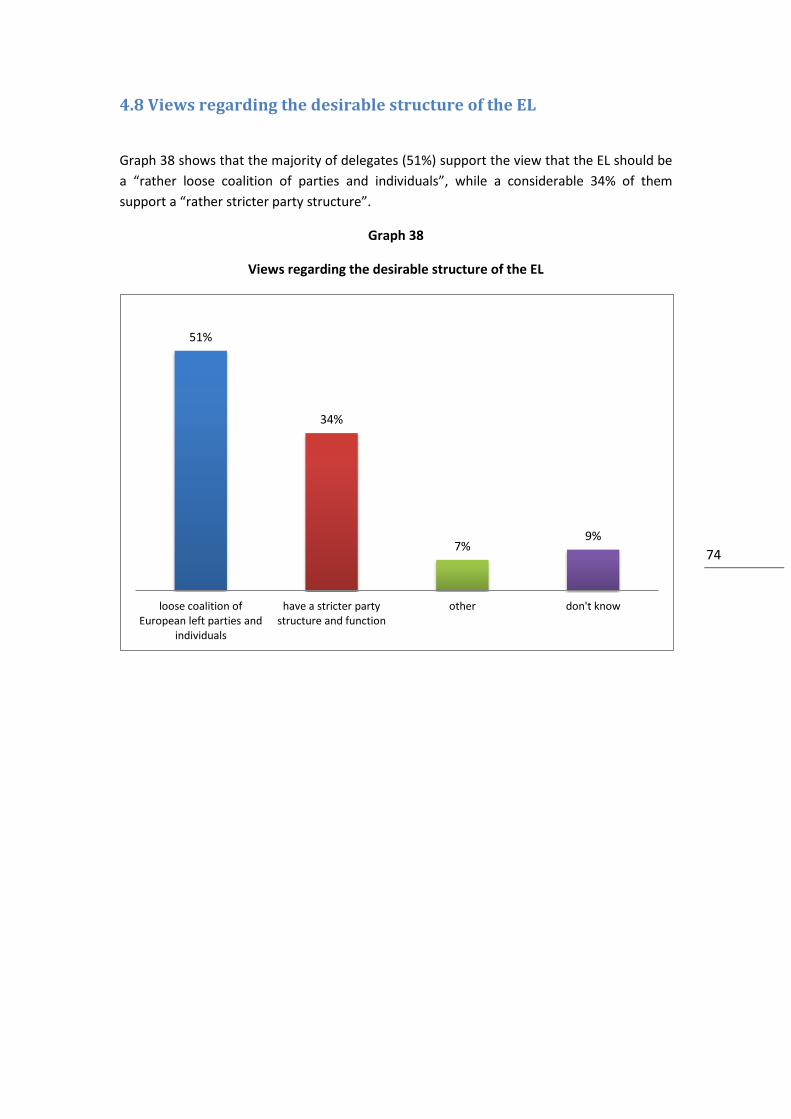
74 74
4.8 Views regarding the desirable structure of the EL
Graph 38 shows that the majority of delegates (51%) support the view that the EL should be
a “rather loose coalition of parties and individuals”, while a considerable 34% of them
support a “rather stricter party structure”.
Graph 38
Views regarding the desirable structure of the EL
51%
34%
7% 9%
loose coalition of European left parties and
individuals
have a stricter party structure and function
other don't know
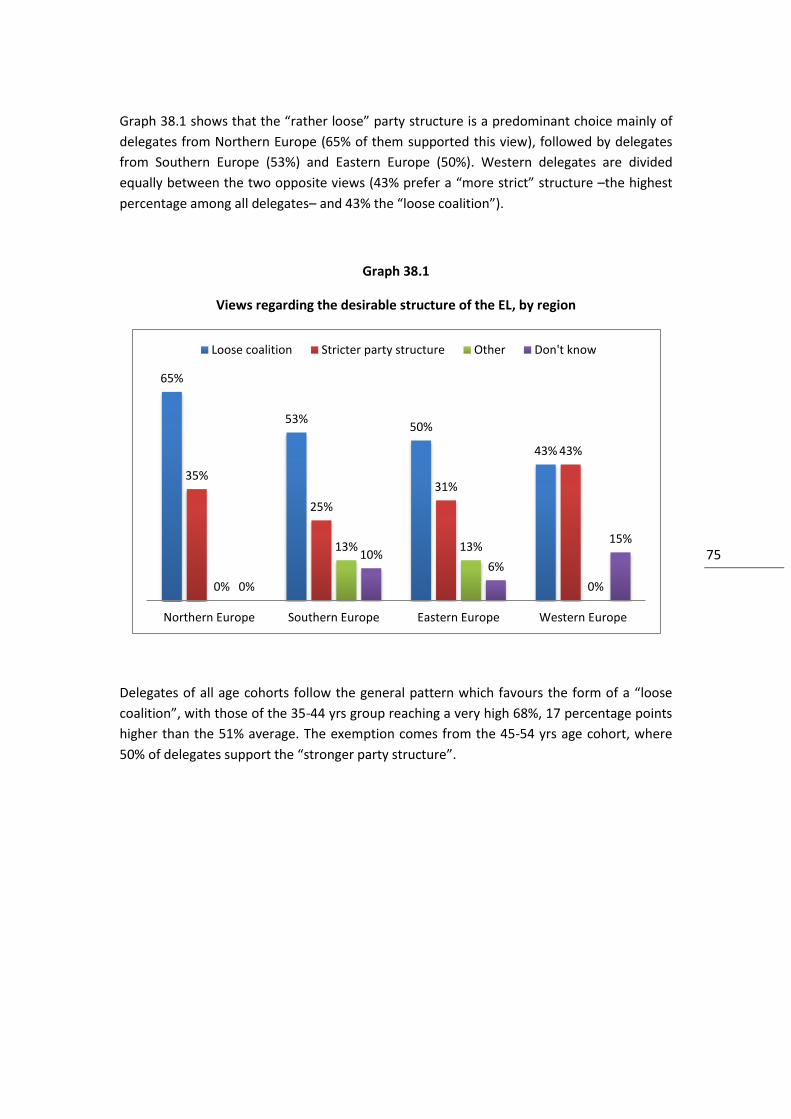
75 75
Graph 38.1 shows that the “rather loose” party structure is a predominant choice mainly of
delegates from Northern Europe (65% of them supported this view), followed by delegates
from Southern Europe (53%) and Eastern Europe (50%). Western delegates are divided
equally between the two opposite views (43% prefer a “more strict” structure –the highest
percentage among all delegates– and 43% the “loose coalition”).
Graph 38.1
Views regarding the desirable structure of the EL, by region
Delegates of all age cohorts follow the general pattern which favours the form of a “loose
coalition”, with those of the 35-44 yrs group reaching a very high 68%, 17 percentage points
higher than the 51% average. The exemption comes from the 45-54 yrs age cohort, where
50% of delegates support the “stronger party structure”.
65%
53% 50%
43%
35%
25%
31%
43%
0%
13% 13%
0% 0%
10% 6%
15%
Northern Europe Southern Europe Eastern Europe Western Europe
Loose coalition Stricter party structure Other Don't know
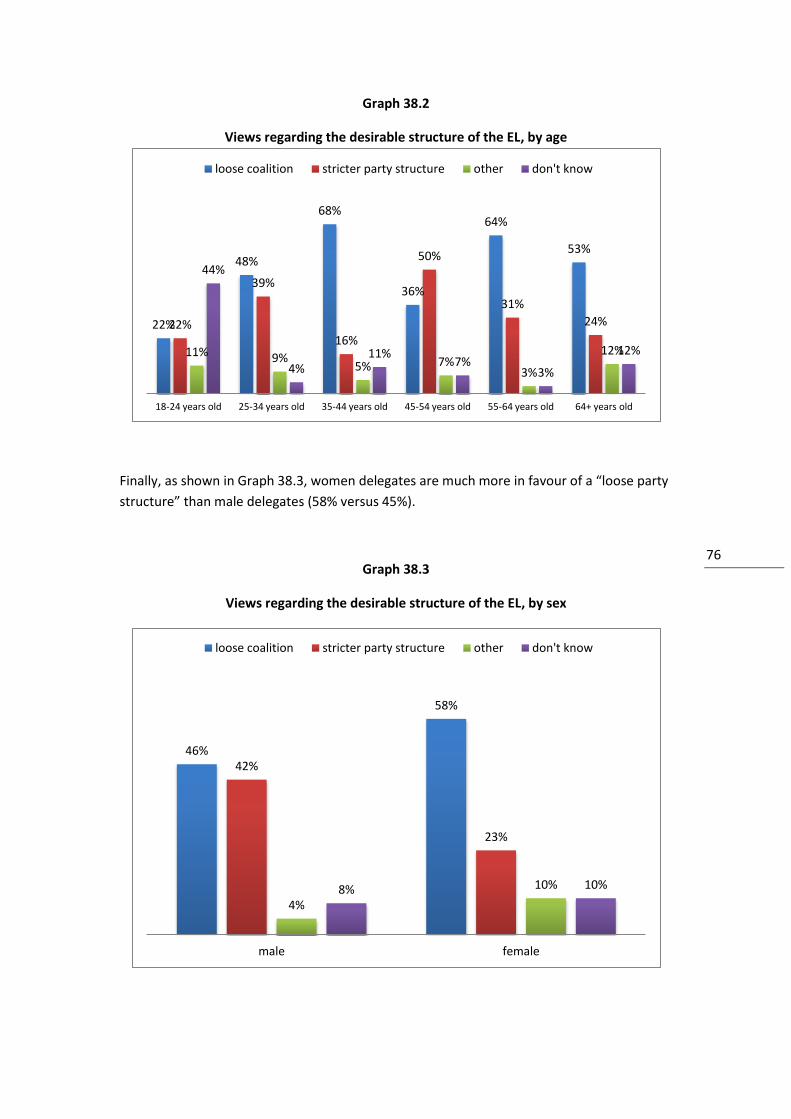
76 76
Graph 38.2
Views regarding the desirable structure of the EL, by age
Finally, as shown in Graph 38.3, women delegates are much more in favour of a “loose party
structure” than male delegates (58% versus 45%).
Graph 38.3
Views regarding the desirable structure of the EL, by sex
22%
48%
68%
36%
64%
53%
22%
39%
16%
50%
31%
24%
11% 9% 5% 7%
3%
12%
44%
4% 11%
7% 3%
12%
18-24 years old 25-34 years old 35-44 years old 45-54 years old 55-64 years old 64+ years old
loose coalition stricter party structure other don't know
46%
58%
42%
23%
4%
10% 8% 10%
male female
loose coalition stricter party structure other don't know

77 77
Appendix
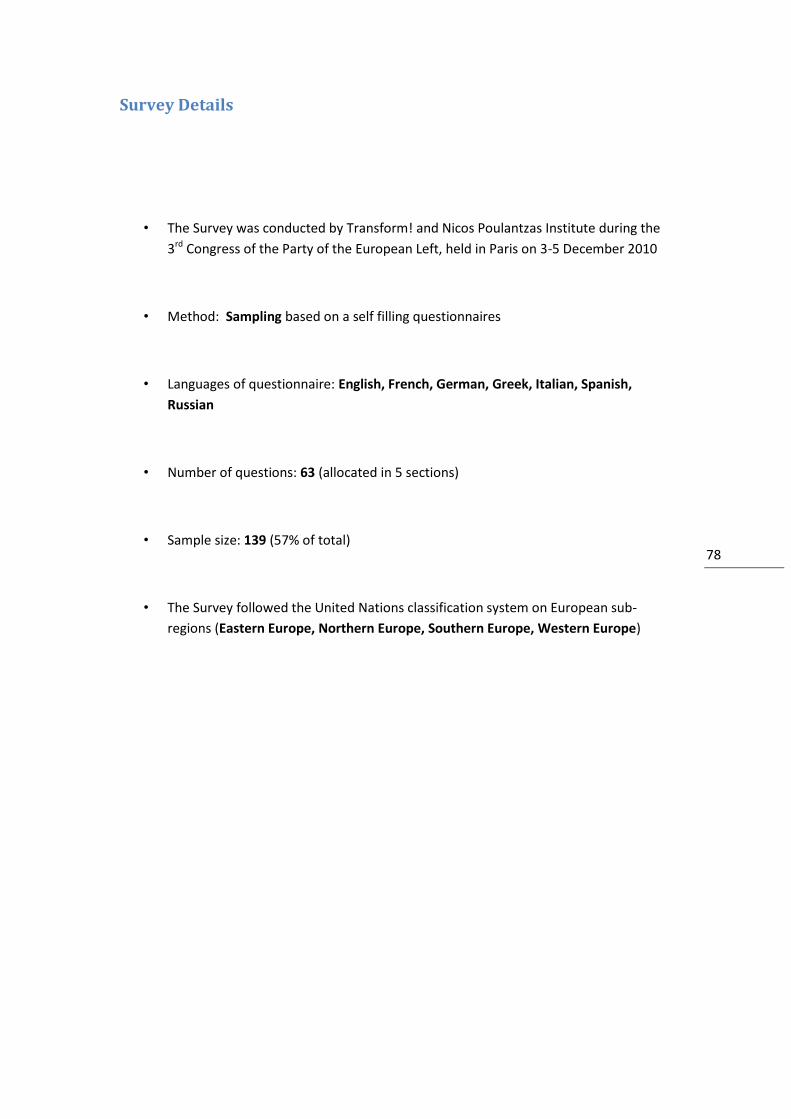
78 78
Survey Details
• The Survey was conducted by Transform! and Nicos Poulantzas Institute during the
3rd Congress of the Party of the European Left, held in Paris on 3-5 December 2010
• Method: Sampling based on a self filling questionnaires
• Languages of questionnaire: English, French, German, Greek, Italian, Spanish,
Russian
• Number of questions: 63 (allocated in 5 sections)
• Sample size: 139 (57% of total)
• The Survey followed the United Nations classification system on European sub-
regions (Eastern Europe, Northern Europe, Southern Europe, Western Europe)
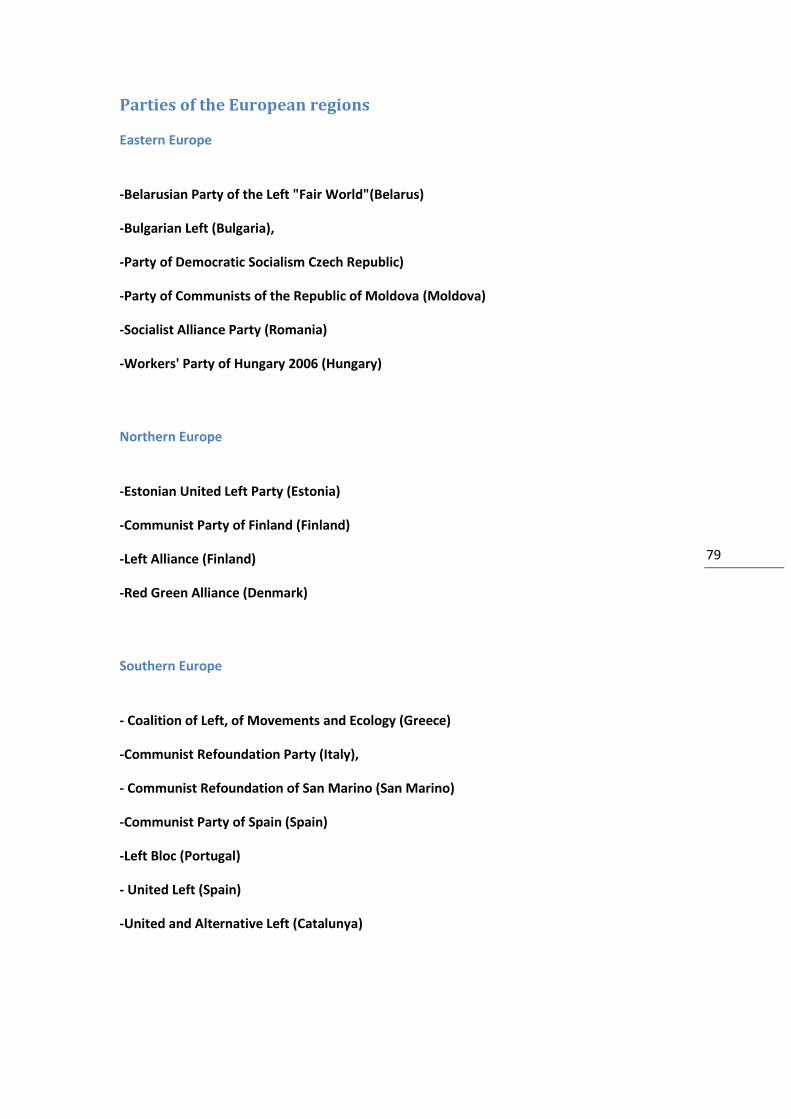
79 79
Parties of the European regions
Eastern Europe
-Belarusian Рarty of the Left "Fair World"(Belarus)
-Bulgarian Left (Bulgaria),
-Party of Democratic Socialism Czech Republic)
-Party of Communists of the Republic of Moldova (Moldova)
-Socialist Alliance Party (Romania)
-Workers' Party of Hungary 2006 (Hungary)
Northern Europe
-Estonian United Left Party (Estonia)
-Communist Party of Finland (Finland)
-Left Alliance (Finland)
-Red Green Alliance (Denmark)
Southern Europe
- Coalition of Left, of Movements and Ecology (Greece)
-Communist Refoundation Party (Italy),
- Communist Refoundation of San Marino (San Marino)
-Communist Party of Spain (Spain)
-Left Bloc (Portugal)
- United Left (Spain)
-United and Alternative Left (Catalunya)
80 80
Western Europe
-Communist Party of Austria (Austria)
-Communist Party of Belgium-Wallonia/Brussels (Belgium)
-Communist Party of Belgium-Flanders (Belgium)
-French Communist Party (France)
-Labour Party of Switzerland (Switzerland)
-The Left (Germany)
-The Left (Luxemburg)
-Unitary Left (France)

81 81
Questionnaire
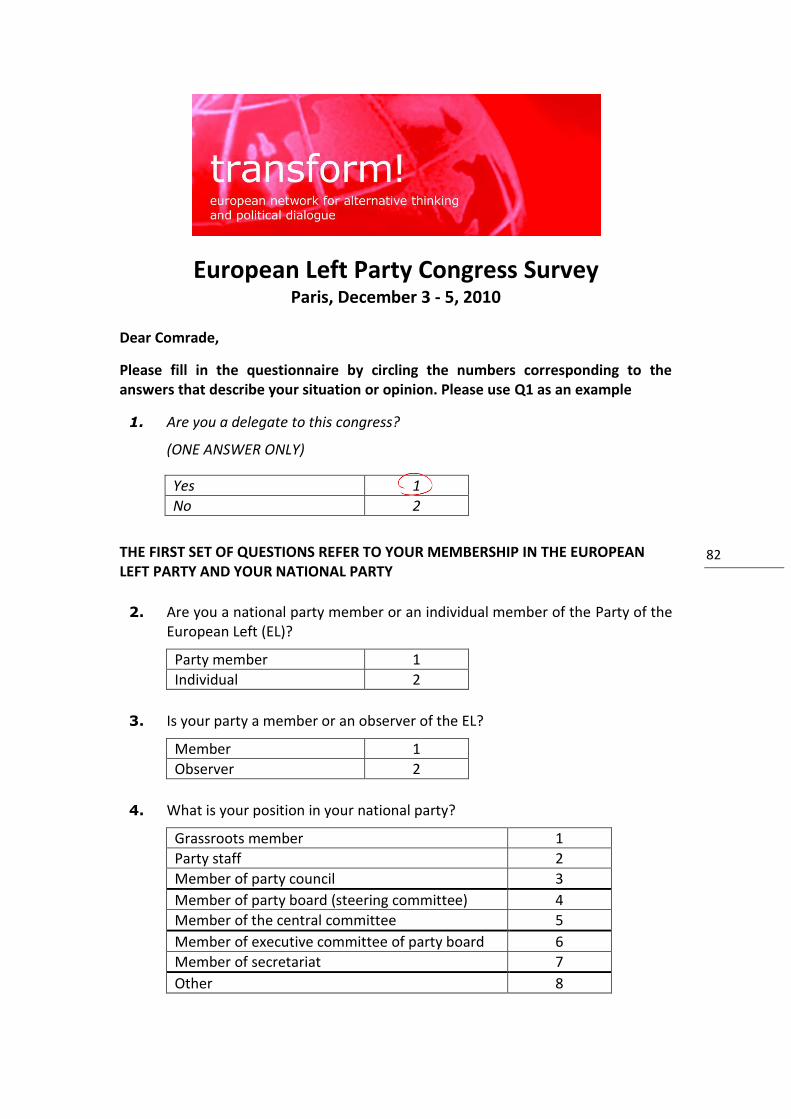
82 82
European Left Party Congress Survey Paris, December 3 - 5, 2010
Dear Comrade,
Please fill in the questionnaire by circling the numbers corresponding to the answers that describe your situation or opinion. Please use Q1 as an example
1. Are you a delegate to this congress?
(ONE ANSWER ONLY)
Yes 1
No 2
THE FIRST SET OF QUESTIONS REFER TO YOUR MEMBERSHIP IN THE EUROPEAN LEFT PARTY AND YOUR NATIONAL PARTY
2. Are you a national party member or an individual member of the Party of the European Left (EL)?
Party member 1
Individual 2
3. Is your party a member or an observer of the EL?
Member 1
Observer 2
4. What is your position in your national party?
Grassroots member 1
Party staff 2
Member of party council 3
Member of party board (steering committee) 4
Member of the central committee 5
Member of executive committee of party board 6
Member of secretariat 7
Other 8
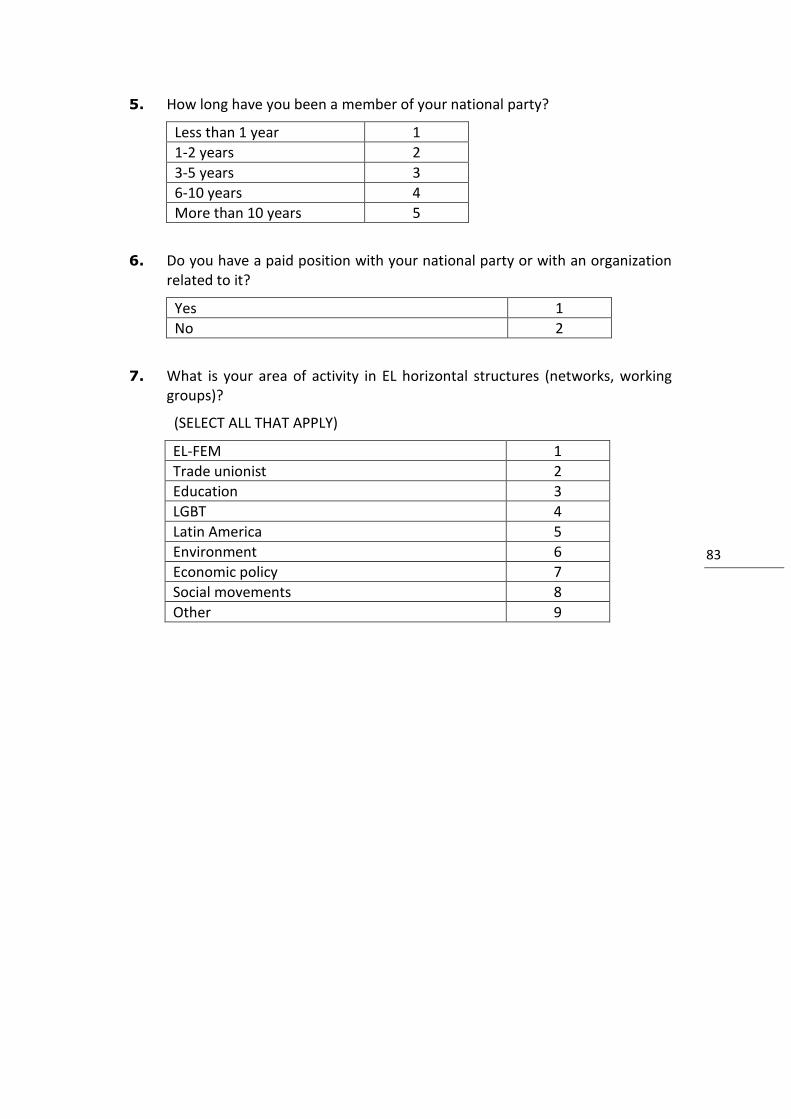
83 83
5. How long have you been a member of your national party?
Less than 1 year 1
1-2 years 2
3-5 years 3
6-10 years 4
More than 10 years 5
6. Do you have a paid position with your national party or with an organization related to it?
Yes 1
No 2
7. What is your area of activity in EL horizontal structures (networks, working groups)?
(SELECT ALL THAT APPLY)
EL-FEM 1
Trade unionist 2
Education 3
LGBT 4
Latin America 5
Environment 6
Economic policy 7
Social movements 8
Other 9
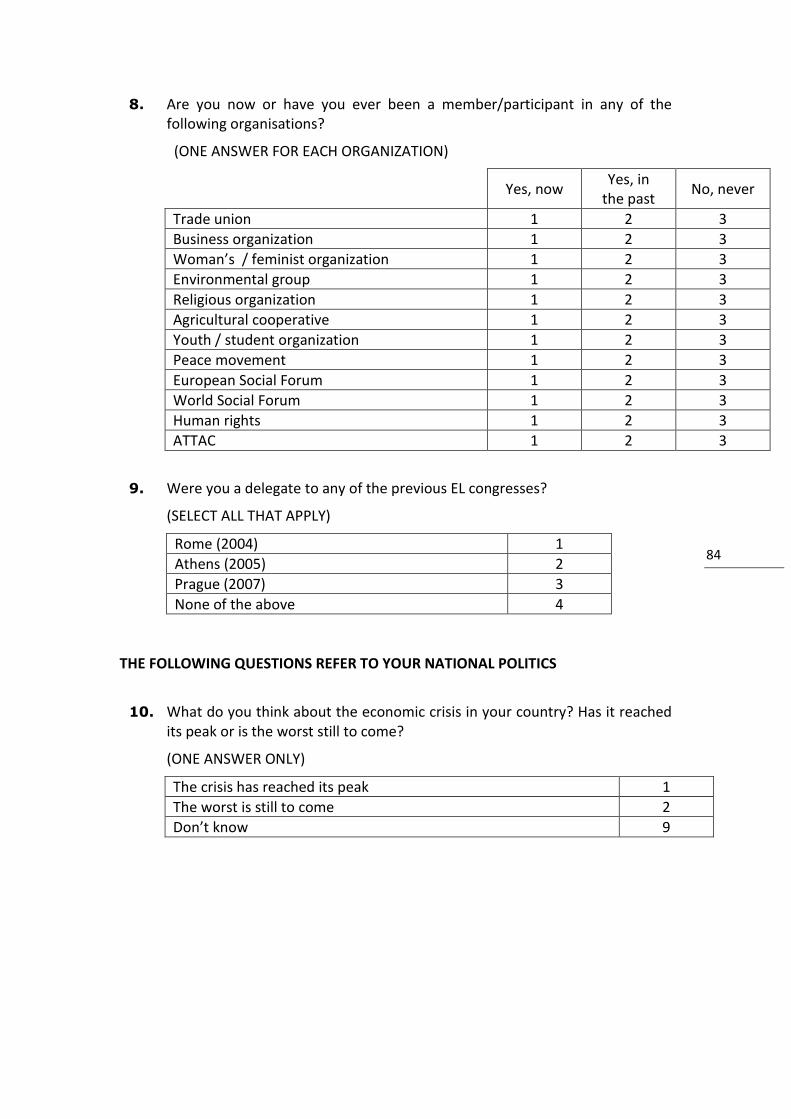
84 84
8. Are you now or have you ever been a member/participant in any of the following organisations?
(ONE ANSWER FOR EACH ORGANIZATION)
Yes, now
Yes, in the past
No, never
Trade union 1 2 3
Business organization 1 2 3
Woman’s / feminist organization 1 2 3
Environmental group 1 2 3
Religious organization 1 2 3
Agricultural cooperative 1 2 3
Youth / student organization 1 2 3
Peace movement 1 2 3
European Social Forum 1 2 3
World Social Forum 1 2 3
Human rights 1 2 3
ATTAC 1 2 3
9. Were you a delegate to any of the previous EL congresses?
(SELECT ALL THAT APPLY)
Rome (2004) 1
Athens (2005) 2
Prague (2007) 3
None of the above 4
THE FOLLOWING QUESTIONS REFER TO YOUR NATIONAL POLITICS
10. What do you think about the economic crisis in your country? Has it reached its peak or is the worst still to come?
(ONE ANSWER ONLY)
The crisis has reached its peak 1
The worst is still to come 2
Don’t know 9
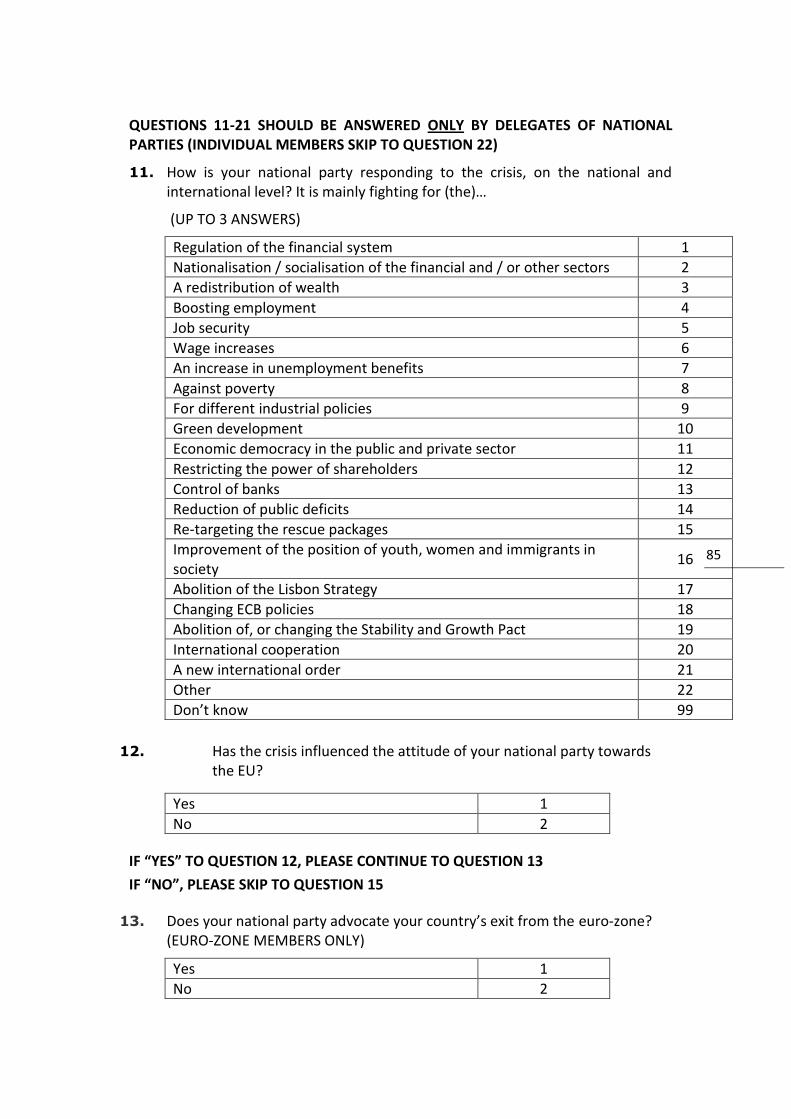
85 85
QUESTIONS 11-21 SHOULD BE ANSWERED ONLY BY DELEGATES OF NATIONAL PARTIES (INDIVIDUAL MEMBERS SKIP TO QUESTION 22)
11. How is your national party responding to the crisis, on the national and international level? It is mainly fighting for (the)…
(UP TO 3 ANSWERS)
Regulation of the financial system 1
Nationalisation / socialisation of the financial and / or other sectors 2
A redistribution of wealth 3
Boosting employment 4
Job security 5
Wage increases 6
An increase in unemployment benefits 7
Against poverty 8
For different industrial policies 9
Green development 10
Economic democracy in the public and private sector 11
Restricting the power of shareholders 12
Control of banks 13
Reduction of public deficits 14
Re-targeting the rescue packages 15
Improvement of the position of youth, women and immigrants in society
16
Abolition of the Lisbon Strategy 17
Changing ECB policies 18
Abolition of, or changing the Stability and Growth Pact 19
International cooperation 20
A new international order 21
Other 22
Don’t know 99
12. Has the crisis influenced the attitude of your national party towards the EU?
Yes 1
No 2
IF “YES” TO QUESTION 12, PLEASE CONTINUE TO QUESTION 13
IF “NO”, PLEASE SKIP TO QUESTION 15
13. Does your national party advocate your country’s exit from the euro-zone? (EURO-ZONE MEMBERS ONLY)
Yes 1
No 2

86 86
14. Does your national party propose your country’s exit from the European Union? (EU MEMBERS ONLY)
Yes 1
No 2
15. Do you think of this economic crisis as an opportunity or as a threat to your national party’s dynamics, influence, etc.
(ONE ANSWER ONLY)
Definitely an opportunity 1
In part an opportunity 2
In part a threat 3
Definitely a threat 4
Don’t know 9
IF YOU THINK OF ECONOMIC CRISIS AS AN OPPORTUNITY, PLEASE CONTINUE TO QUESTION 16
IF YOU THINK OF ECONOMIC CRISIS AS A THREAT, PLEASE SKIP TO QUESTION 17
16. Which of the following opportunities is very likely to present itself for your national party within the near future?
(SELECT ALL THAT APPLY)
Gain voters / Increase parliamentary strength 1
Widen political audience 2
Recruit new members 3
Influence local authorities 4
Other 5
None of the above 6
17. Does your national party believe in the transformation of society (by superseding/replacing capitalism)?
Yes 1
No 2
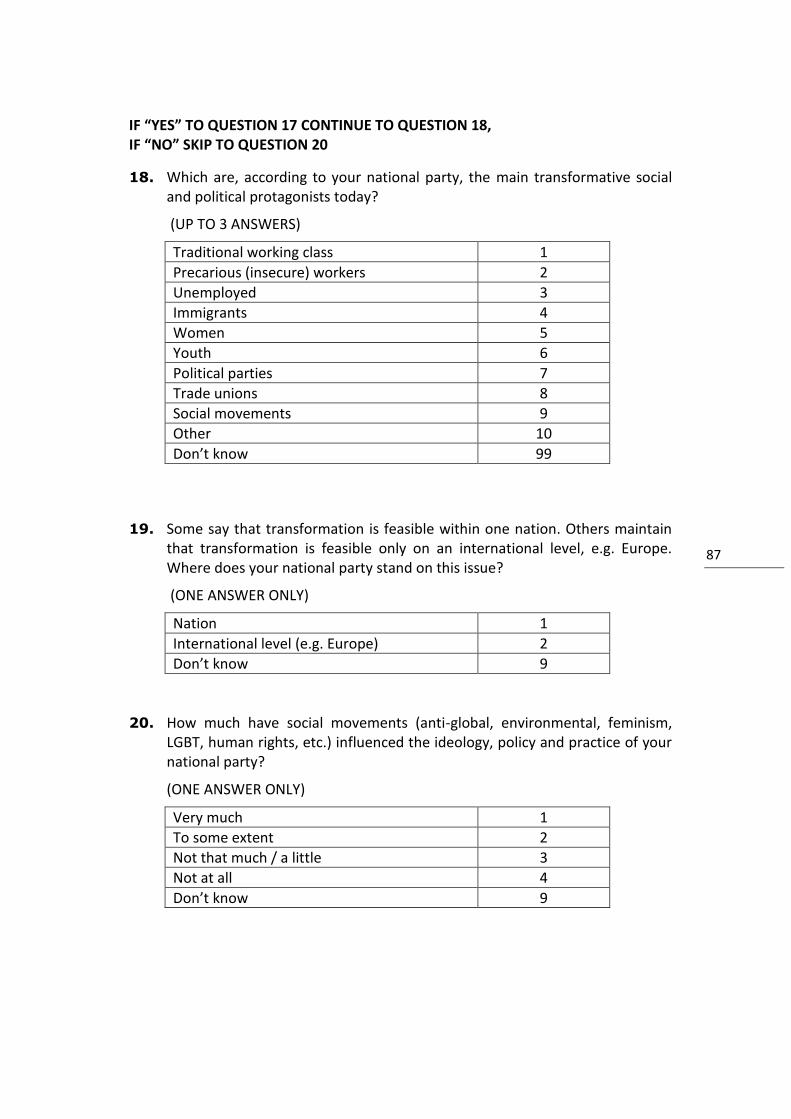
87 87
IF “YES” TO QUESTION 17 CONTINUE TO QUESTION 18, IF “NO” SKIP TO QUESTION 20
18. Which are, according to your national party, the main transformative social and political protagonists today?
(UP TO 3 ANSWERS)
Traditional working class 1
Precarious (insecure) workers 2
Unemployed 3
Immigrants 4
Women 5
Youth 6
Political parties 7
Trade unions 8
Social movements 9
Other 10
Don’t know 99
19. Some say that transformation is feasible within one nation. Others maintain that transformation is feasible only on an international level, e.g. Europe. Where does your national party stand on this issue?
(ONE ANSWER ONLY)
Nation 1
International level (e.g. Europe) 2
Don’t know 9
20. How much have social movements (anti-global, environmental, feminism, LGBT, human rights, etc.) influenced the ideology, policy and practice of your national party?
(ONE ANSWER ONLY)
Very much 1
To some extent 2
Not that much / a little 3
Not at all 4
Don’t know 9
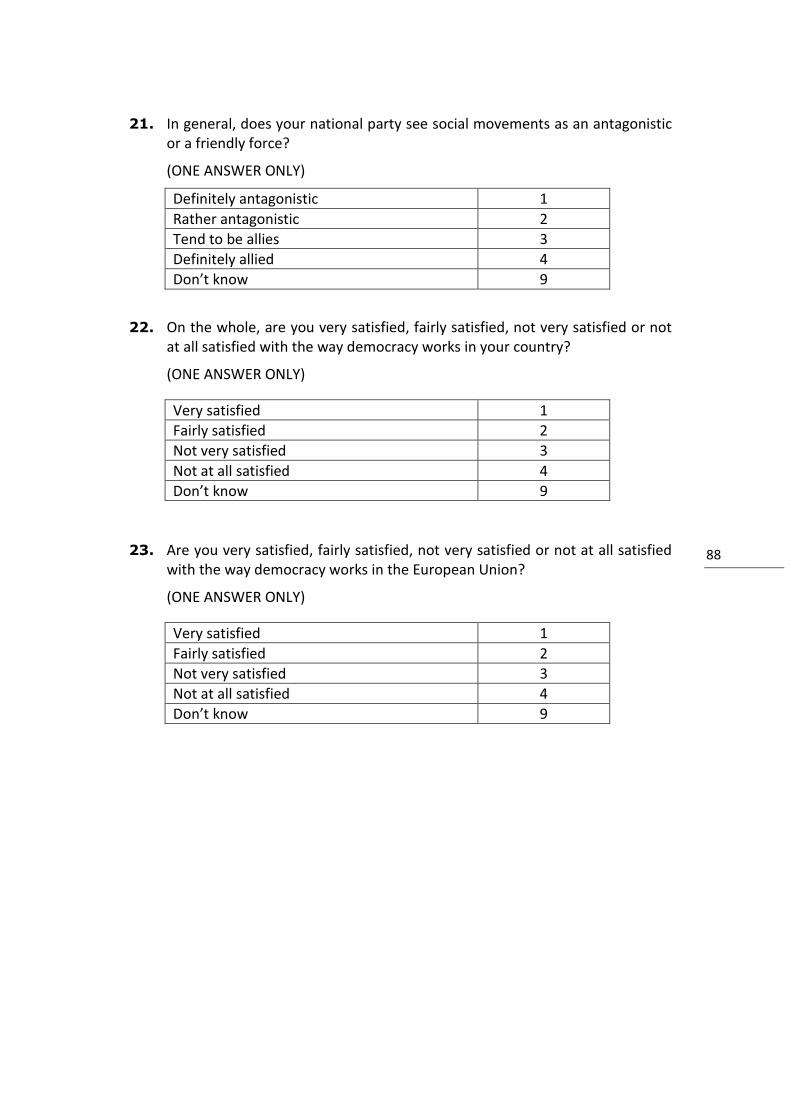
88 88
21. In general, does your national party see social movements as an antagonistic
or a friendly force?
(ONE ANSWER ONLY)
Definitely antagonistic 1
Rather antagonistic 2
Tend to be allies 3
Definitely allied 4
Don’t know 9
22. On the whole, are you very satisfied, fairly satisfied, not very satisfied or not at all satisfied with the way democracy works in your country?
(ONE ANSWER ONLY)
Very satisfied 1
Fairly satisfied 2
Not very satisfied 3
Not at all satisfied 4
Don’t know 9
23. Are you very satisfied, fairly satisfied, not very satisfied or not at all satisfied
with the way democracy works in the European Union?
(ONE ANSWER ONLY)
Very satisfied 1
Fairly satisfied 2
Not very satisfied 3
Not at all satisfied 4
Don’t know 9
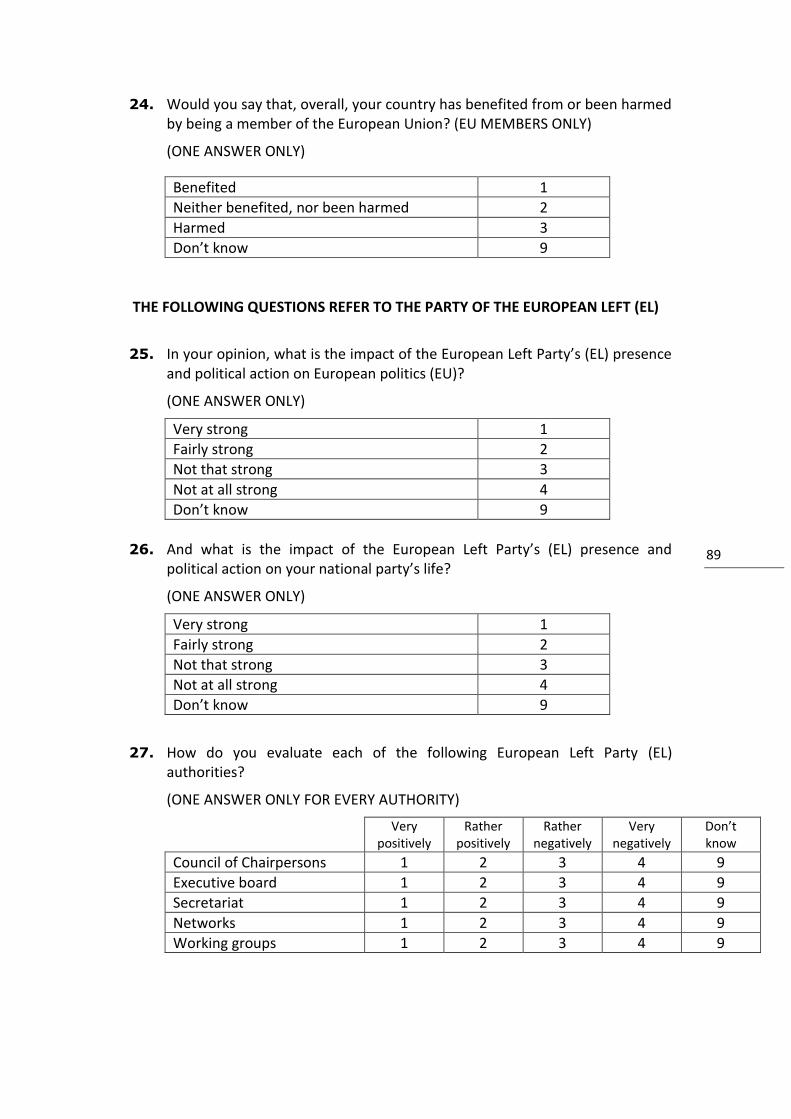
89 89
24. Would you say that, overall, your country has benefited from or been harmed by being a member of the European Union? (EU MEMBERS ONLY)
(ONE ANSWER ONLY)
Benefited 1
Neither benefited, nor been harmed 2
Harmed 3
Don’t know 9
THE FOLLOWING QUESTIONS REFER TO THE PARTY OF THE EUROPEAN LEFT (EL)
25. In your opinion, what is the impact of the European Left Party’s (EL) presence and political action on European politics (EU)?
(ONE ANSWER ONLY)
Very strong 1
Fairly strong 2
Not that strong 3
Not at all strong 4
Don’t know 9
26. And what is the impact of the European Left Party’s (EL) presence and
political action on your national party’s life?
(ONE ANSWER ONLY)
Very strong 1
Fairly strong 2
Not that strong 3
Not at all strong 4
Don’t know 9
27. How do you evaluate each of the following European Left Party (EL) authorities?
(ONE ANSWER ONLY FOR EVERY AUTHORITY)
Very
positively Rather
positively Rather
negatively Very
negatively Don’t know
Council of Chairpersons 1 2 3 4 9
Executive board 1 2 3 4 9
Secretariat 1 2 3 4 9
Networks 1 2 3 4 9
Working groups 1 2 3 4 9
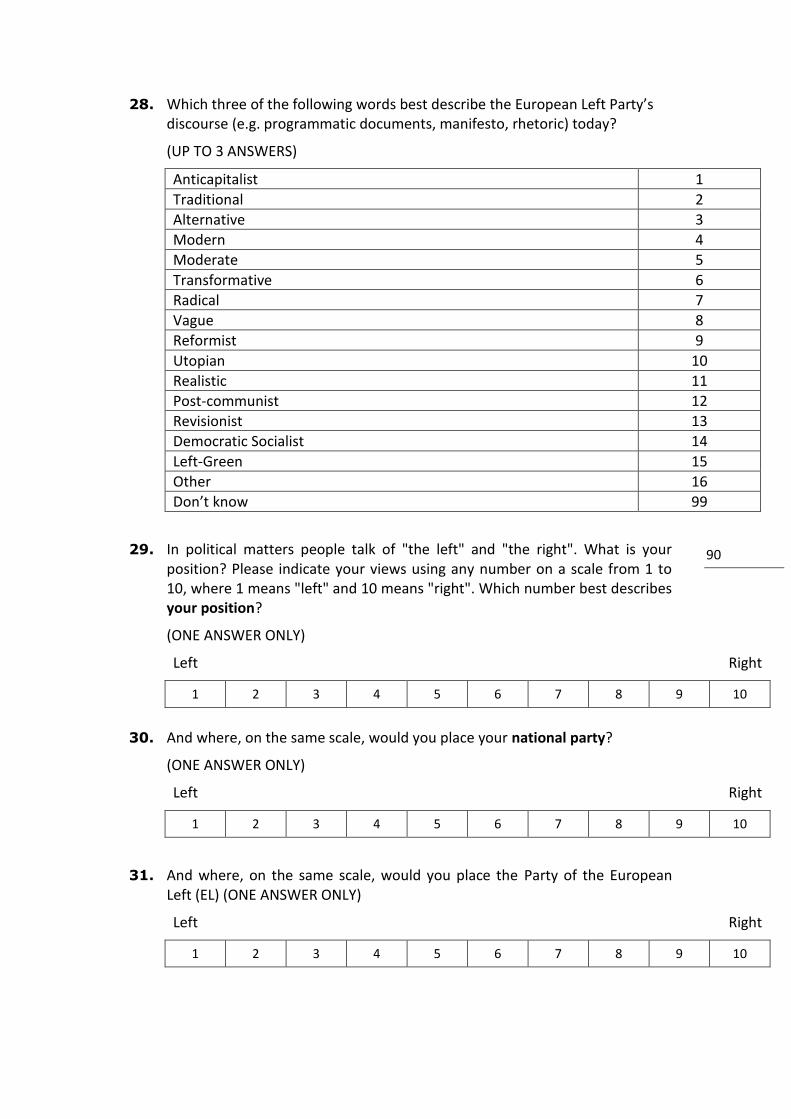
90 90
28. Which three of the following words best describe the European Left Party’s discourse (e.g. programmatic documents, manifesto, rhetoric) today?
(UP TO 3 ANSWERS)
Anticapitalist 1
Traditional 2
Alternative 3
Modern 4
Moderate 5
Transformative 6
Radical 7
Vague 8
Reformist 9
Utopian 10
Realistic 11
Post-communist 12
Revisionist 13
Democratic Socialist 14
Left-Green 15
Other 16
Don’t know 99
29. In political matters people talk of "the left" and "the right". What is your position? Please indicate your views using any number on a scale from 1 to 10, where 1 means "left" and 10 means "right". Which number best describes your position?
(ONE ANSWER ONLY)
Left Right
1 2 3 4 5 6 7 8 9 10
30. And where, on the same scale, would you place your national party?
(ONE ANSWER ONLY)
Left Right
1 2 3 4 5 6 7 8 9 10
31. And where, on the same scale, would you place the Party of the European Left (EL) (ONE ANSWER ONLY)
Left Right
1 2 3 4 5 6 7 8 9 10
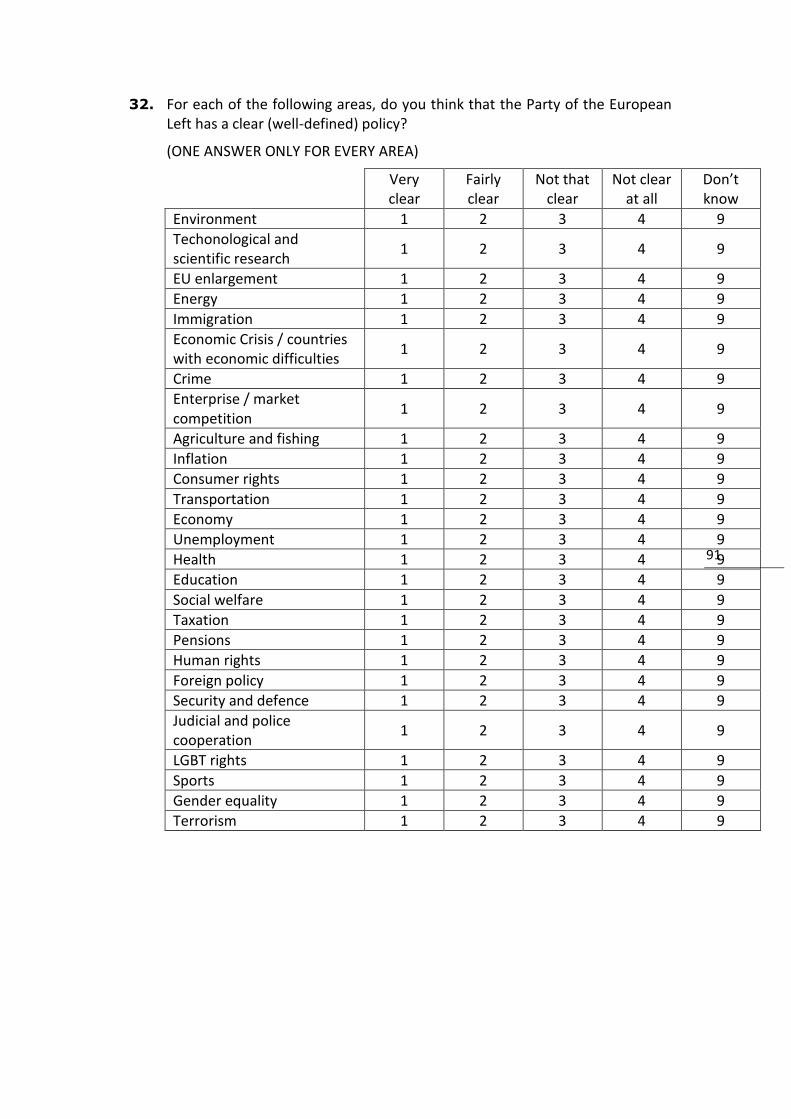
91 91
32. For each of the following areas, do you think that the Party of the European Left has a clear (well-defined) policy?
(ONE ANSWER ONLY FOR EVERY AREA)
Very clear
Fairly clear
Not that clear
Not clear at all
Don’t know
Environment 1 2 3 4 9
Techonological and scientific research
1 2 3 4 9
EU enlargement 1 2 3 4 9
Energy 1 2 3 4 9
Immigration 1 2 3 4 9
Economic Crisis / countries with economic difficulties
1 2 3 4 9
Crime 1 2 3 4 9
Enterprise / market competition
1 2 3 4 9
Agriculture and fishing 1 2 3 4 9
Inflation 1 2 3 4 9
Consumer rights 1 2 3 4 9
Transportation 1 2 3 4 9
Economy 1 2 3 4 9
Unemployment 1 2 3 4 9
Health 1 2 3 4 9
Education 1 2 3 4 9
Social welfare 1 2 3 4 9
Taxation 1 2 3 4 9
Pensions 1 2 3 4 9
Human rights 1 2 3 4 9
Foreign policy 1 2 3 4 9
Security and defence 1 2 3 4 9
Judicial and police cooperation
1 2 3 4 9
LGBT rights 1 2 3 4 9
Sports 1 2 3 4 9
Gender equality 1 2 3 4 9
Terrorism 1 2 3 4 9
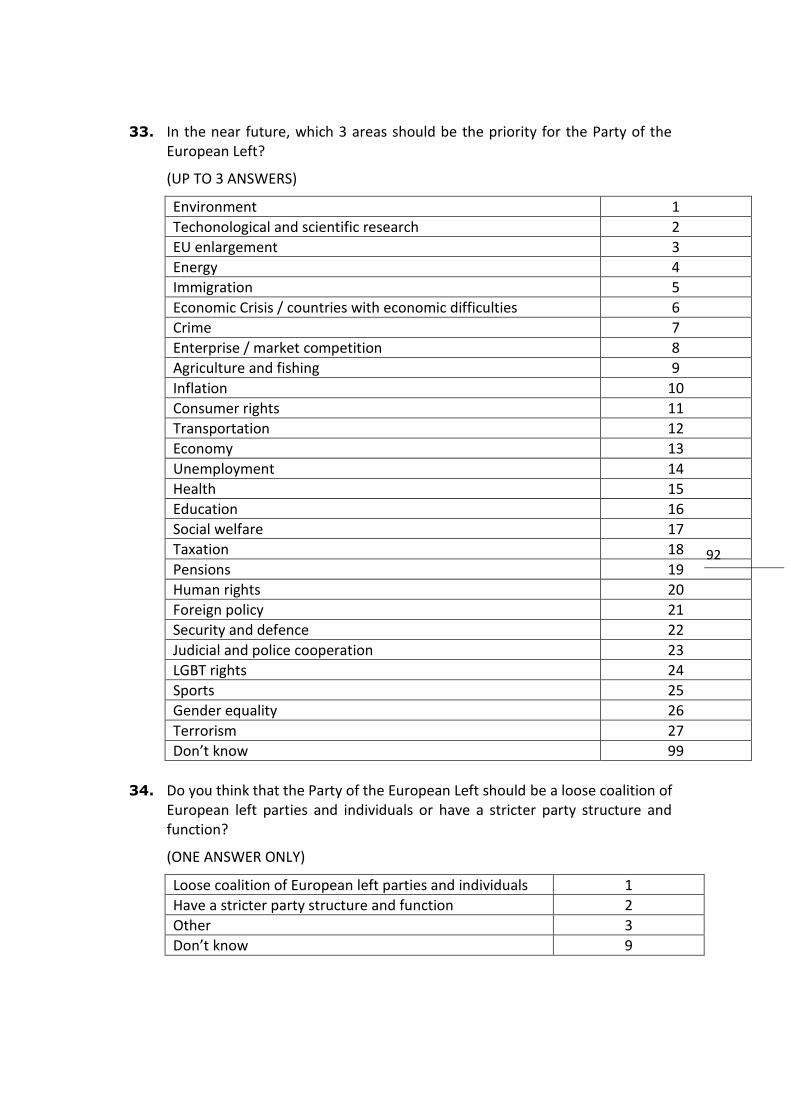
92 92
33. In the near future, which 3 areas should be the priority for the Party of the European Left?
(UP TO 3 ANSWERS)
Environment 1
Techonological and scientific research 2
EU enlargement 3
Energy 4
Immigration 5
Economic Crisis / countries with economic difficulties 6
Crime 7
Enterprise / market competition 8
Agriculture and fishing 9
Inflation 10
Consumer rights 11
Transportation 12
Economy 13
Unemployment 14
Health 15
Education 16
Social welfare 17
Taxation 18
Pensions 19
Human rights 20
Foreign policy 21
Security and defence 22
Judicial and police cooperation 23
LGBT rights 24
Sports 25
Gender equality 26
Terrorism 27
Don’t know 99
34. Do you think that the Party of the European Left should be a loose coalition of
European left parties and individuals or have a stricter party structure and function?
(ONE ANSWER ONLY)
Loose coalition of European left parties and individuals 1
Have a stricter party structure and function 2
Other 3
Don’t know 9
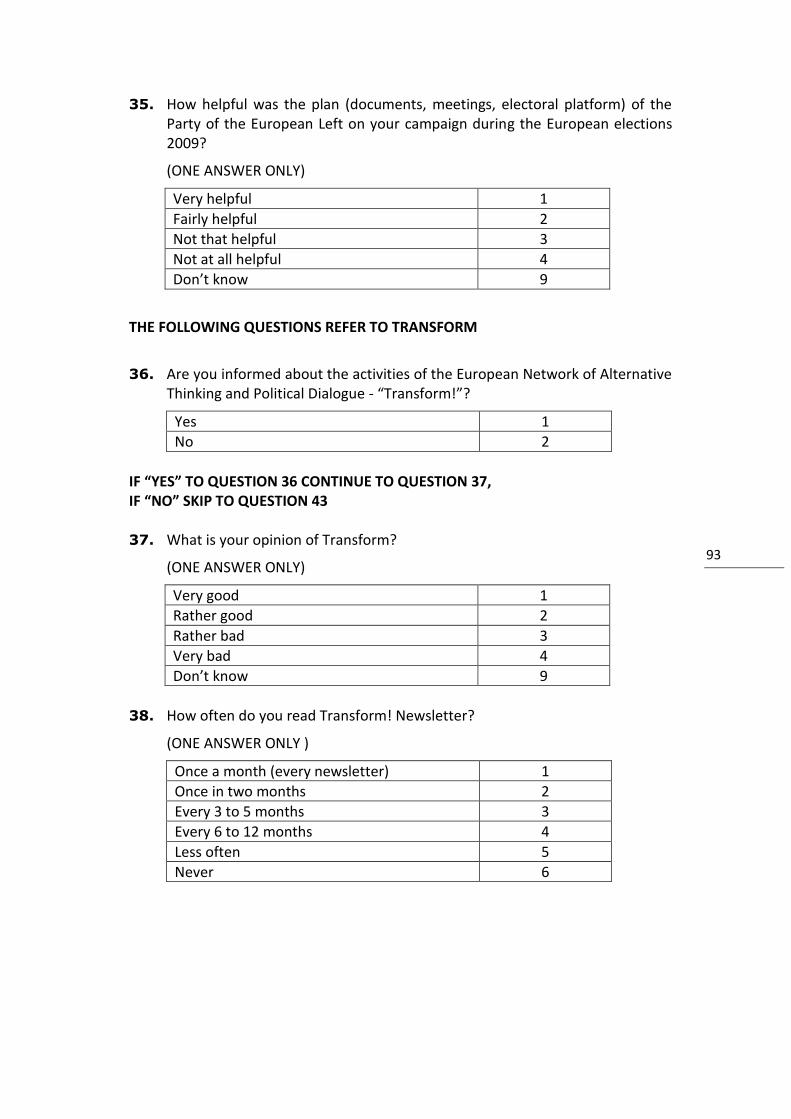
93 93
35. How helpful was the plan (documents, meetings, electoral platform) of the Party of the European Left on your campaign during the European elections 2009?
(ONE ANSWER ONLY)
Very helpful 1
Fairly helpful 2
Not that helpful 3
Not at all helpful 4
Don’t know 9
THE FOLLOWING QUESTIONS REFER TO TRANSFORM
36. Are you informed about the activities of the European Network of Alternative
Thinking and Political Dialogue - “Transform!”?
Yes 1
No 2
IF “YES” TO QUESTION 36 CONTINUE TO QUESTION 37, IF “NO” SKIP TO QUESTION 43 37. What is your opinion of Transform?
(ONE ANSWER ONLY)
Very good 1
Rather good 2
Rather bad 3
Very bad 4
Don’t know 9
38. How often do you read Transform! Newsletter?
(ONE ANSWER ONLY )
Once a month (every newsletter) 1
Once in two months 2
Every 3 to 5 months 3
Every 6 to 12 months 4
Less often 5
Never 6
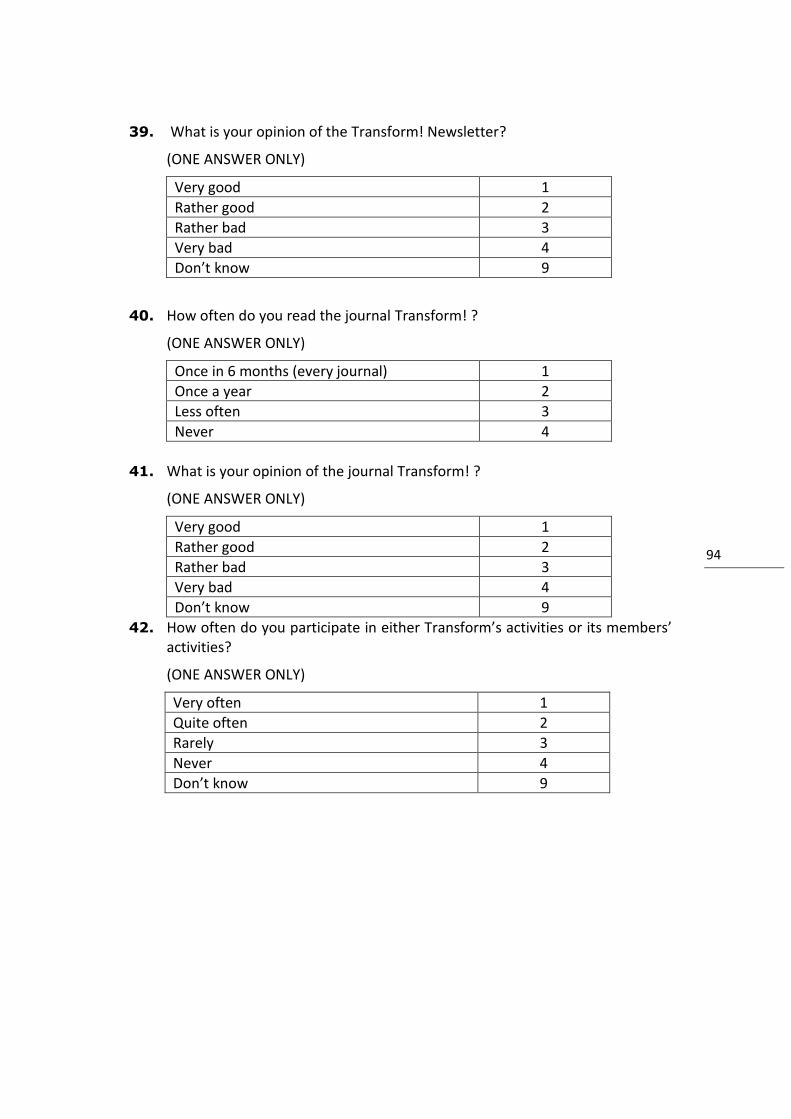
94 94
39. What is your opinion of the Transform! Newsletter?
(ONE ANSWER ONLY)
Very good 1
Rather good 2
Rather bad 3
Very bad 4
Don’t know 9
40. How often do you read the journal Transform! ?
(ONE ANSWER ONLY)
Once in 6 months (every journal) 1
Once a year 2
Less often 3
Never 4
41. What is your opinion of the journal Transform! ?
(ONE ANSWER ONLY)
Very good 1
Rather good 2
Rather bad 3
Very bad 4
Don’t know 9
42. How often do you participate in either Transform’s activities or its members’ activities?
(ONE ANSWER ONLY)
Very often 1
Quite often 2
Rarely 3
Never 4
Don’t know 9

95 95
THE FOLLOWING FEW QUESTIONS REFER TO PERSONAL VALUES
43. For each of the following propositions, please indicate if you totally agree, tend to agree, tend to disagree, or totally disagree.
(ONE ANSWER ONLY IN EVERY PROPOSITION)
Totally agree
Tend to agree
Tend to disagre
e
Totally disagre
e
Don’t know
Immigrants should be allowed to retain their own customs
1 2 3 4 9
Same-sex marriages should be allowed by law
1 2 3 4 9
Major public services and industries ought to be publicly owned
1 2 3 4 9
Women should be free to decide on matters of abortion
1 2 3 4 9
Schools must teach children to obey authority
1 2 3 4 9
Economic growth must be a priority, even if it affects the environment
1 2 3 4 9
Personal consumption of cannabis should be legalised
1 2 3 4 9
Immigrants contribute a lot to my country
1 2 3 4 9
Central planning is the best guarantee for economic prosperity
1 2 3 4 9
Violence can be justified as a means of social and political struggle
1 2 3 4 9
Religion in my country is very important
1 2 3 4 9
44. How do you see yourself? In terms of “Your nationality” only (e.g. French,
Danish, German, Portuguese), both in terms of “Your nationality” and as as European, European and in terms of “Your nationality”, or a European only?
(ONE ANSWER ONLY)
(Your nationality) only 1
(Your nationality) and European 2
European and (your nationality) 3
European only 4
Don’t know 9
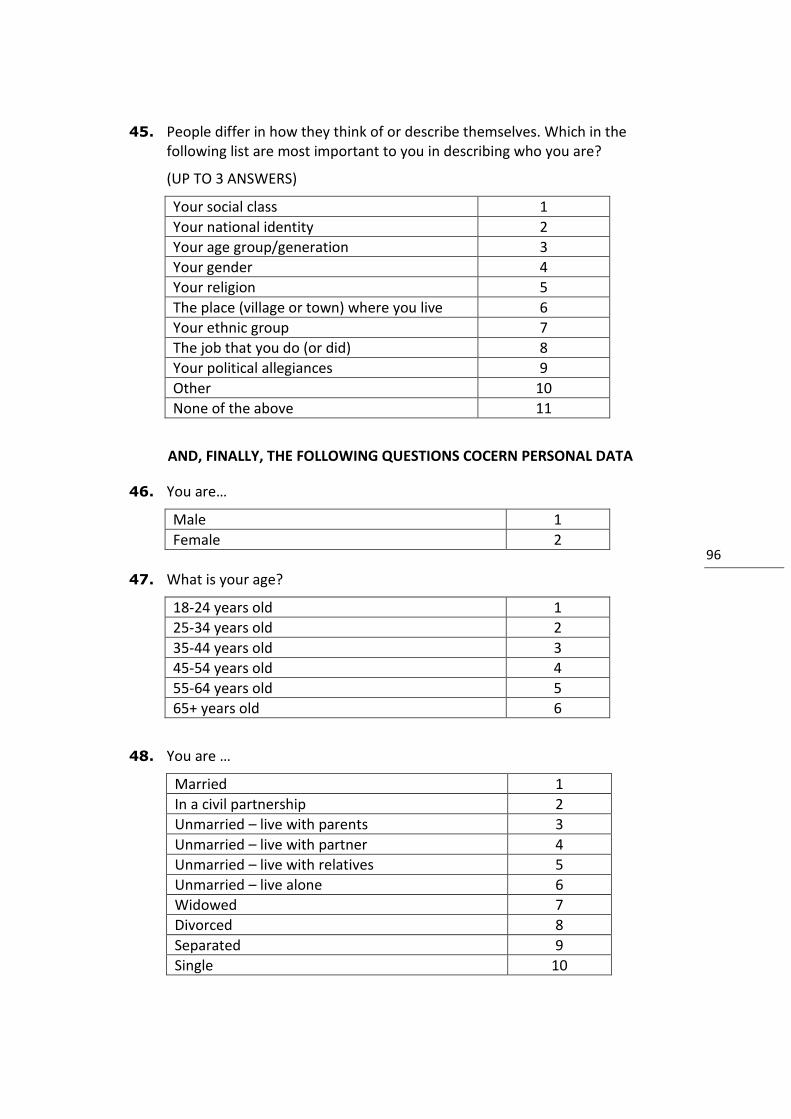
96 96
45. People differ in how they think of or describe themselves. Which in the following list are most important to you in describing who you are?
(UP TO 3 ANSWERS)
Your social class 1
Your national identity 2
Your age group/generation 3
Your gender 4
Your religion 5
The place (village or town) where you live 6
Your ethnic group 7
The job that you do (or did) 8
Your political allegiances 9
Other 10
None of the above 11
AND, FINALLY, THE FOLLOWING QUESTIONS COCERN PERSONAL DATA
46. You are…
Male 1
Female 2
47. What is your age?
18-24 years old 1
25-34 years old 2
35-44 years old 3
45-54 years old 4
55-64 years old 5
65+ years old 6
48. You are …
Married 1
In a civil partnership 2
Unmarried – live with parents 3
Unmarried – live with partner 4
Unmarried – live with relatives 5
Unmarried – live alone 6
Widowed 7
Divorced 8
Separated 9
Single 10
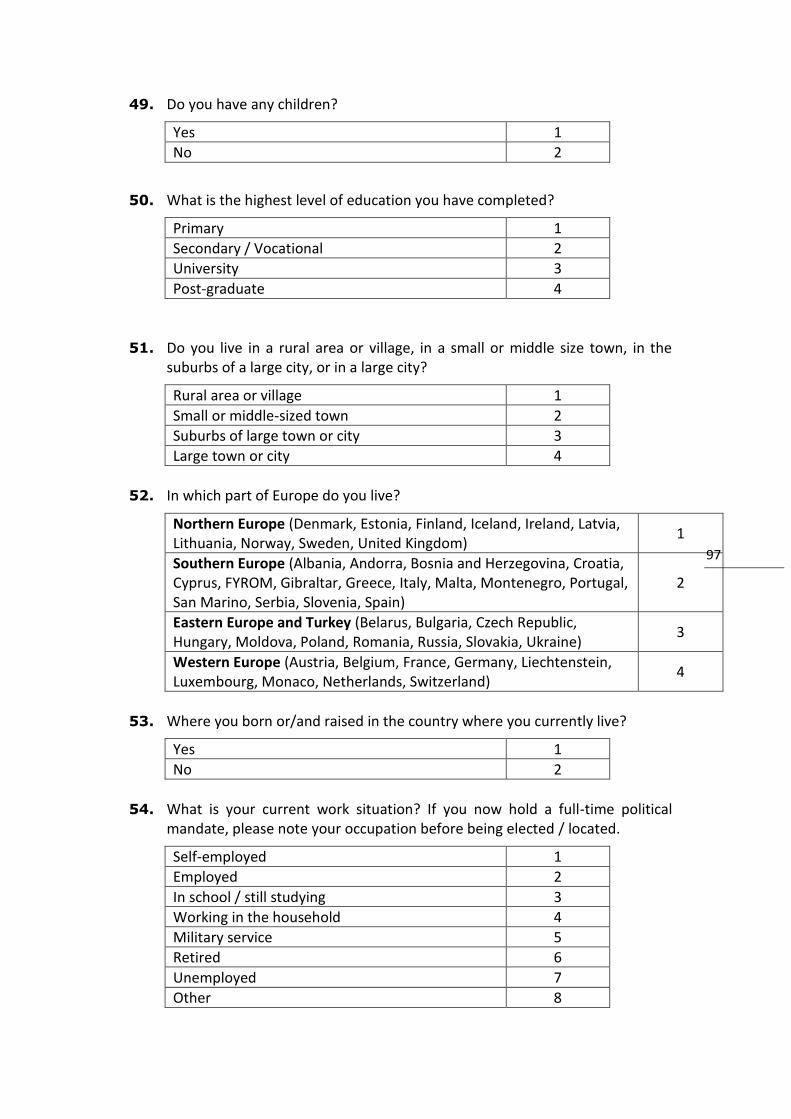
97 97
49. Do you have any children?
Yes 1
No 2
50. What is the highest level of education you have completed?
Primary 1
Secondary / Vocational 2
University 3
Post-graduate 4
51. Do you live in a rural area or village, in a small or middle size town, in the
suburbs of a large city, or in a large city?
Rural area or village 1
Small or middle-sized town 2
Suburbs of large town or city 3
Large town or city 4
52. In which part of Europe do you live?
Northern Europe (Denmark, Estonia, Finland, Iceland, Ireland, Latvia, Lithuania, Norway, Sweden, United Kingdom)
1
Southern Europe (Albania, Andorra, Bosnia and Herzegovina, Croatia, Cyprus, FYROM, Gibraltar, Greece, Italy, Malta, Montenegro, Portugal, San Marino, Serbia, Slovenia, Spain)
2
Eastern Europe and Turkey (Belarus, Bulgaria, Czech Republic, Hungary, Moldova, Poland, Romania, Russia, Slovakia, Ukraine)
3
Western Europe (Austria, Belgium, France, Germany, Liechtenstein, Luxembourg, Monaco, Netherlands, Switzerland)
4
53. Where you born or/and raised in the country where you currently live?
Yes 1
No 2
54. What is your current work situation? If you now hold a full-time political
mandate, please note your occupation before being elected / located.
Self-employed 1
Employed 2
In school / still studying 3
Working in the household 4
Military service 5
Retired 6
Unemployed 7
Other 8
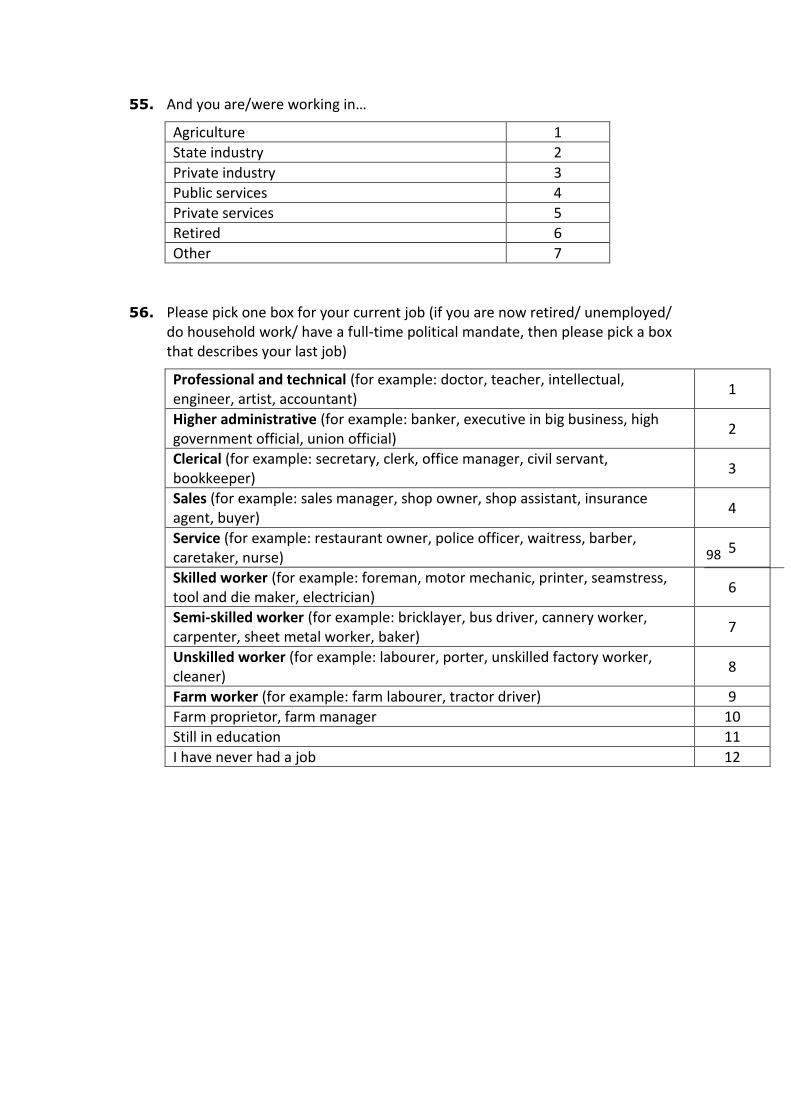
98 98
55. And you are/were working in…
Agriculture 1
State industry 2
Private industry 3
Public services 4
Private services 5
Retired 6
Other 7
56. Please pick one box for your current job (if you are now retired/ unemployed/
do household work/ have a full-time political mandate, then please pick a box that describes your last job)
Professional and technical (for example: doctor, teacher, intellectual, engineer, artist, accountant)
1
Higher administrative (for example: banker, executive in big business, high government official, union official)
2
Clerical (for example: secretary, clerk, office manager, civil servant, bookkeeper)
3
Sales (for example: sales manager, shop owner, shop assistant, insurance agent, buyer)
4
Service (for example: restaurant owner, police officer, waitress, barber, caretaker, nurse)
5
Skilled worker (for example: foreman, motor mechanic, printer, seamstress, tool and die maker, electrician)
6
Semi-skilled worker (for example: bricklayer, bus driver, cannery worker, carpenter, sheet metal worker, baker)
7
Unskilled worker (for example: labourer, porter, unskilled factory worker, cleaner)
8
Farm worker (for example: farm labourer, tractor driver) 9
Farm proprietor, farm manager 10
Still in education 11
I have never had a job 12
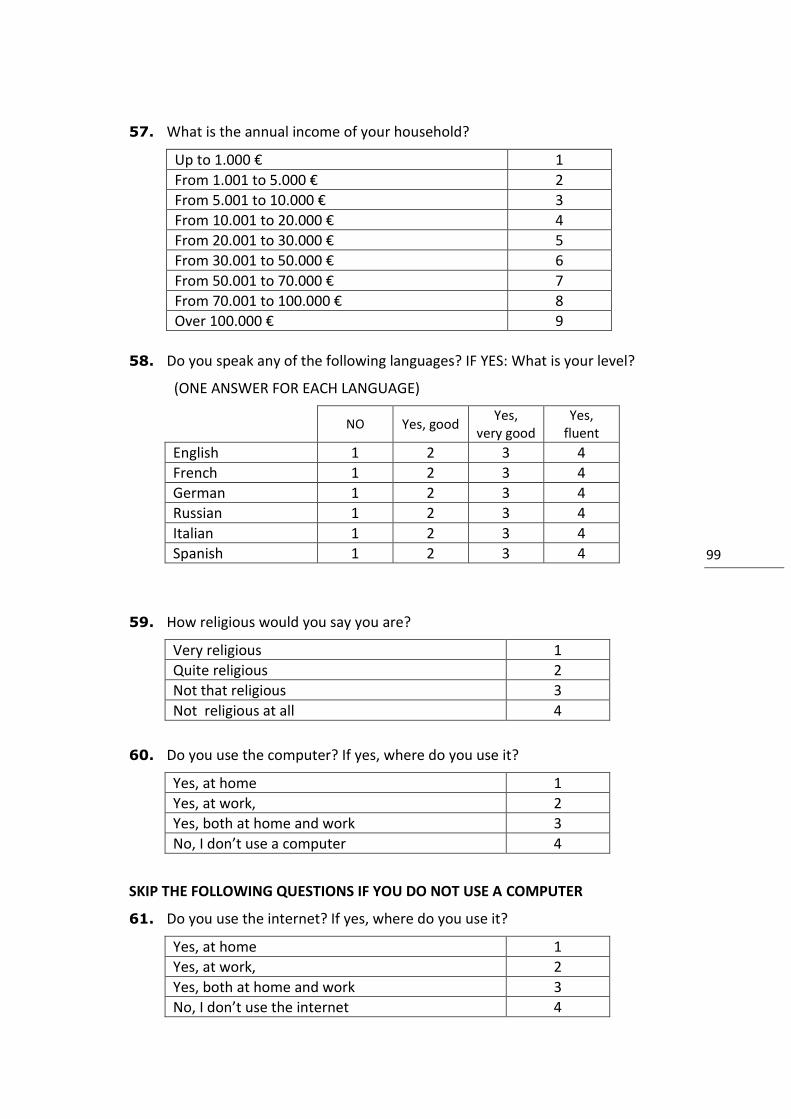
99 99
57. What is the annual income of your household?
Up to 1.000 € 1
From 1.001 to 5.000 € 2
From 5.001 to 10.000 € 3
From 10.001 to 20.000 € 4
From 20.001 to 30.000 € 5
From 30.001 to 50.000 € 6
From 50.001 to 70.000 € 7
From 70.001 to 100.000 € 8
Over 100.000 € 9
58. Do you speak any of the following languages? IF YES: What is your level?
(ONE ANSWER FOR EACH LANGUAGE)
NO Yes, good
Yes, very good
Yes, fluent
English 1 2 3 4
French 1 2 3 4
German 1 2 3 4
Russian 1 2 3 4
Italian 1 2 3 4
Spanish 1 2 3 4
59. How religious would you say you are?
Very religious 1
Quite religious 2
Not that religious 3
Not religious at all 4
60. Do you use the computer? If yes, where do you use it?
Yes, at home 1
Yes, at work, 2
Yes, both at home and work 3
No, I don’t use a computer 4
SKIP THE FOLLOWING QUESTIONS IF YOU DO NOT USE A COMPUTER
61. Do you use the internet? If yes, where do you use it?
Yes, at home 1
Yes, at work, 2
Yes, both at home and work 3
No, I don’t use the internet 4
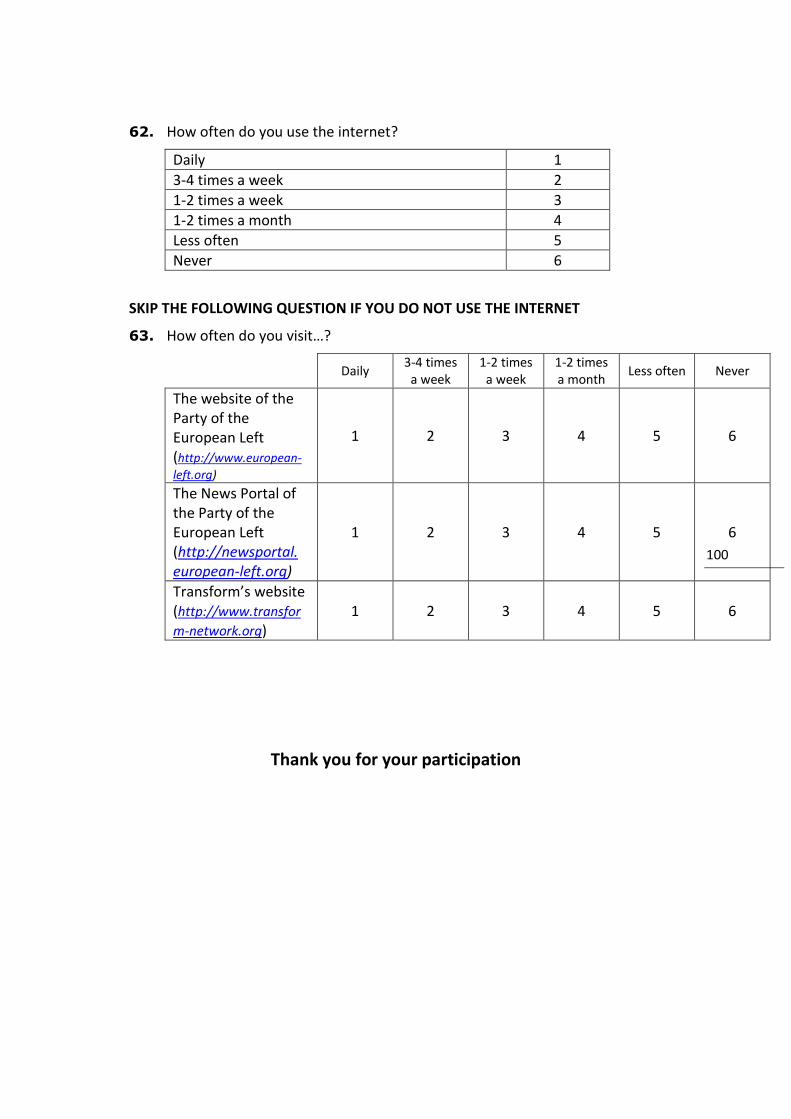
100 100
62. How often do you use the internet?
Daily 1
3-4 times a week 2
1-2 times a week 3
1-2 times a month 4
Less often 5
Never 6
SKIP THE FOLLOWING QUESTION IF YOU DO NOT USE THE INTERNET
63. How often do you visit…?
Daily 3-4 times
a week 1-2 times
a week 1-2 times a month
Less often Never
The website of the Party of the European Left (http://www.european-
left.org)
1 2 3 4 5 6
The News Portal of the Party of the European Left (http://newsportal. european-left.org)
1 2 3 4 5 6
Transform’s website (http://www.transfor
m-network.org) 1 2 3 4 5 6
Thank you for your participation