quarterly results presentation 3q 2015
TRANSCRIPT
Quarterly results presentation
3Q 2015
2 November 2015
2 de 28 / November 2015
53
38
26
185
200
0
138
205
222
144
128
47
COLOUR
SCHEME
206
201
161
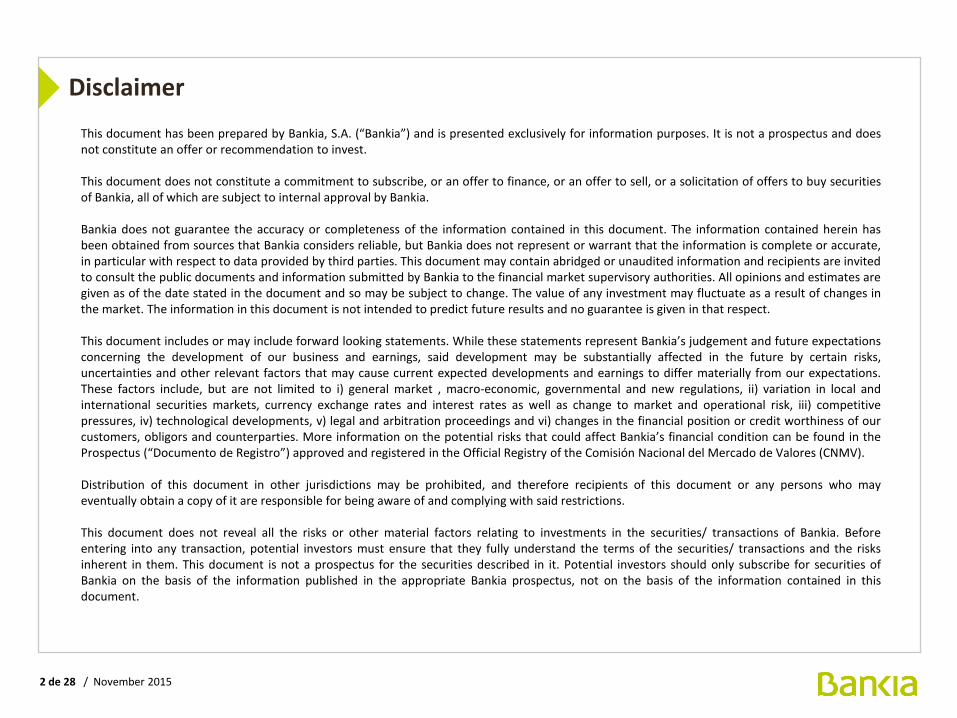
Disclaimer
This document has been prepared by Bankia, S.A. (“Bankia”) and is presented exclusively for information purposes. It is not a prospectus and does not constitute an offer or recommendation to invest.
This document does not constitute a commitment to subscribe, or an offer to finance, or an offer to sell, or a solicitation of offers to buy securities of Bankia, all of which are subject to internal approval by Bankia.
Bankia does not guarantee the accuracy or completeness of the information contained in this document. The information contained herein has been obtained from sources that Bankia considers reliable, but Bankia does not represent or warrant that the information is complete or accurate, in particular with respect to data provided by third parties. This document may contain abridged or unaudited information and recipients are invited to consult the public documents and information submitted by Bankia to the financial market supervisory authorities. All opinions and estimates are given as of the date stated in the document and so may be subject to change. The value of any investment may fluctuate as a result of changes in the market. The information in this document is not intended to predict future results and no guarantee is given in that respect.
This document includes or may include forward looking statements. While these statements represent Bankia’s judgement and future expectations concerning the development of our business and earnings, said development may be substantially affected in the future by certain risks, uncertainties and other relevant factors that may cause current expected developments and earnings to differ materially from our expectations. These factors include, but are not limited to i) general market , macro-economic, governmental and new regulations, ii) variation in local and international securities markets, currency exchange rates and interest rates as well as change to market and operational risk, iii) competitive pressures, iv) technological developments, v) legal and arbitration proceedings and vi) changes in the financial position or credit worthiness of our customers, obligors and counterparties. More information on the potential risks that could affect Bankia’s financial condition can be found in the Prospectus (“Documento de Registro”) approved and registered in the Official Registry of the Comisión Nacional del Mercado de Valores (CNMV).
Distribution of this document in other jurisdictions may be prohibited, and therefore recipients of this document or any persons who may eventually obtain a copy of it are responsible for being aware of and complying with said restrictions.
This document does not reveal all the risks or other material factors relating to investments in the securities/ transactions of Bankia. Before entering into any transaction, potential investors must ensure that they fully understand the terms of the securities/ transactions and the risks inherent in them. This document is not a prospectus for the securities described in it. Potential investors should only subscribe for securities of Bankia on the basis of the information published in the appropriate Bankia prospectus, not on the basis of the information contained in this document.
3 de 28 / November 2015
53
38
26
185
200
0
138
205
222
144
128
47
COLOUR
SCHEME
206
201
161
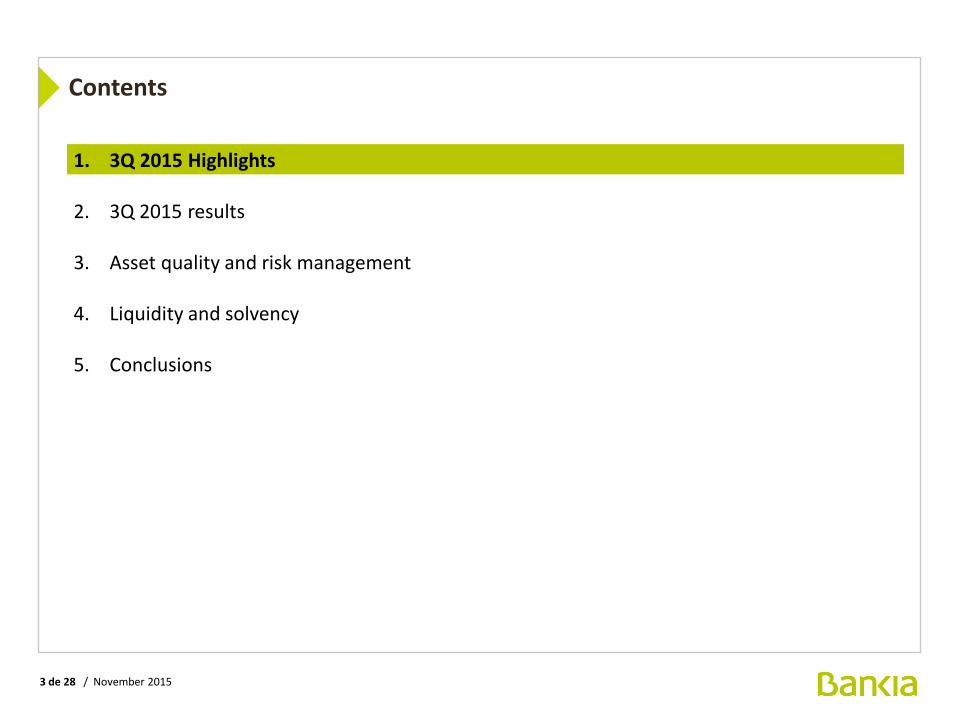
Contents
1. 3Q 2015 Highlights
2. 3Q 2015 results
3. Asset quality and risk management
4. Liquidity and solvency
5. Conclusions
4 de 28 / November 2015
53
38
26
185
200
0
138
205
222
144
128
47
COLOUR
SCHEME
206
201
161
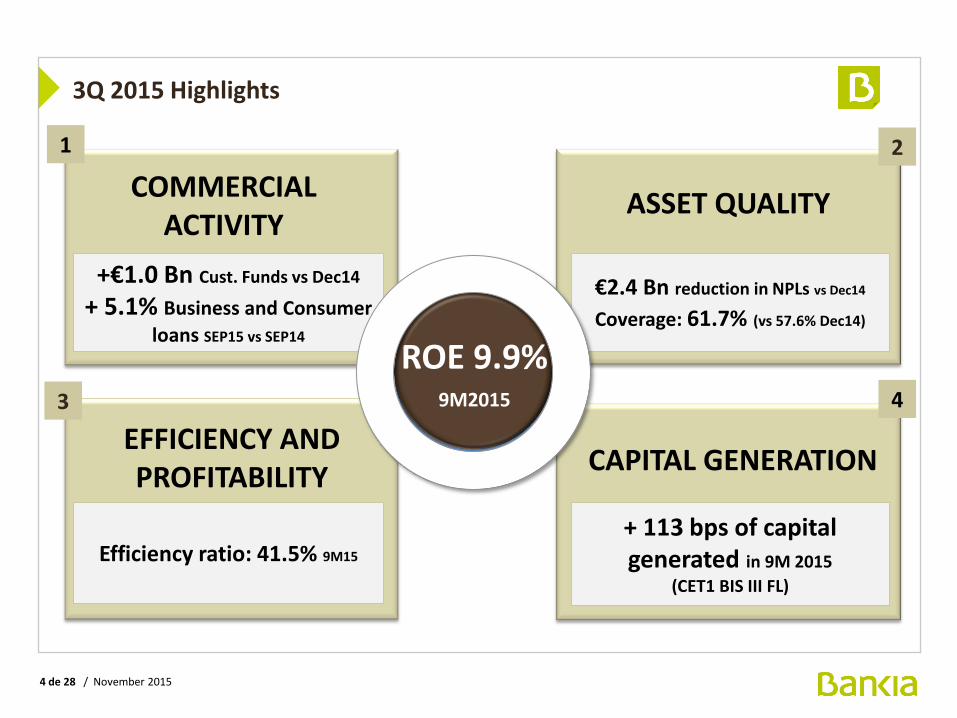
3Q 2015 Highlights
+€1.0 Bn Cust. Funds vs Dec14
+ 5.1% Business and Consumer
loans SEP15 vs SEP14
1
4
CAPITAL GENERATION
COMMERCIAL ACTIVITY
+ 113 bps of capital generated in 9M 2015
(CET1 BIS III FL)
3
2
EFFICIENCY AND PROFITABILITY
Efficiency ratio: 41.5% 9M15
€2.4 Bn reduction in NPLs vs Dec14
Coverage: 61.7% (vs 57.6% Dec14)
ASSET QUALITY
ROE 9.9% 9M2015
5 de 28 / November 2015
53
38
26
185
200
0
138
205
222
144
128
47
COLOUR
SCHEME
206
201
161
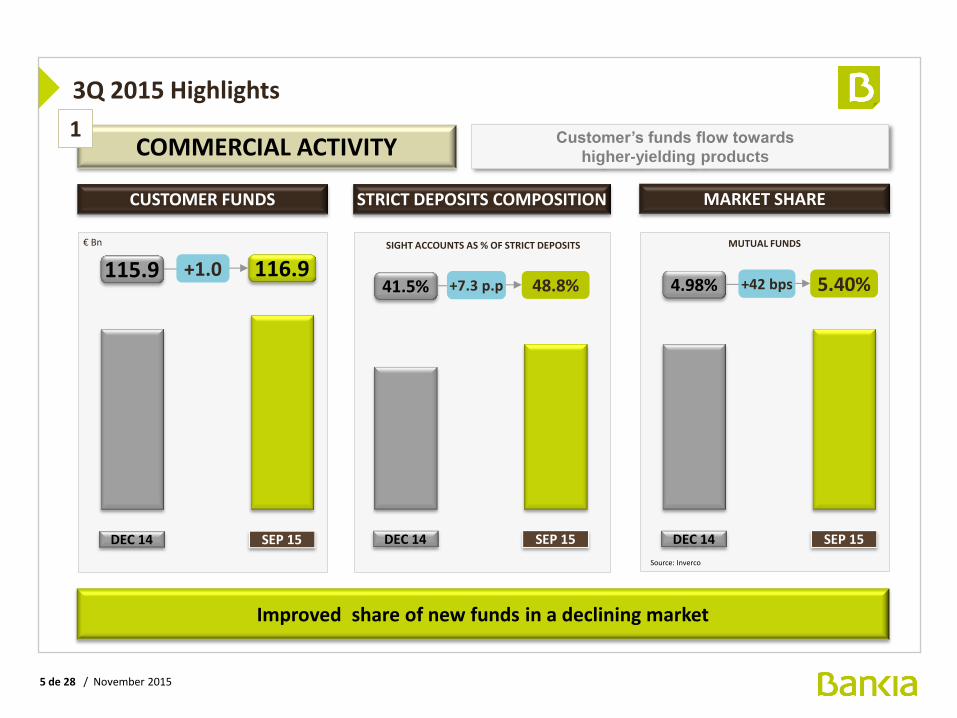
COMMERCIAL ACTIVITY 1 Customer’s funds flow towards
higher-yielding products
CUSTOMER FUNDS
Improved share of new funds in a declining market
115.9 116.9
€ Bn
+1.0
STRICT DEPOSITS COMPOSITION
SIGHT ACCOUNTS AS % OF STRICT DEPOSITS
MARKET SHARE
DEC 14
4.98%
SEP 15
5.40% +42 bps
DEC 14
41.5%
SEP 15
48.8% +7.3 p.p
MUTUAL FUNDS
DEC 14 SEP 15
Source: Inverco
3Q 2015 Highlights
6 de 28 / November 2015
53
38
26
185
200
0
138
205
222
144
128
47
COLOUR
SCHEME
206
201
161
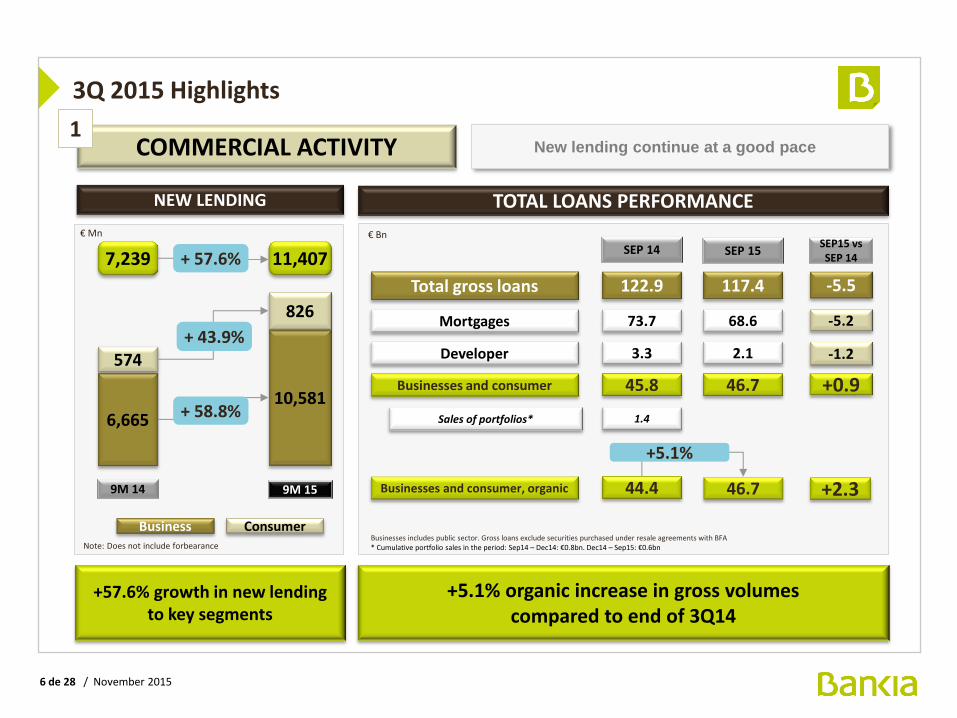
New lending continue at a good pace
+5.1% organic increase in gross volumes compared to end of 3Q14
TOTAL LOANS PERFORMANCE
COMMERCIAL ACTIVITY 1
+57.6% growth in new lending to key segments
Total gross loans 117.4
Mortgages 68.6
SEP 15
122.9
73.7
SEP 14
Developer 2.1 3.3
-5.5
-5.2
SEP15 vs SEP 14
-1.2
Businesses and consumer 46.7 45.8 +0.9
Sales of portfolios* 1.4
Businesses includes public sector. Gross loans exclude securities purchased under resale agreements with BFA * Cumulative portfolio sales in the period: Sep14 – Dec14: €0.8bn. Dec14 – Sep15: €0.6bn
Businesses and consumer, organic +2.3 44.4 46.7
€ Bn
NEW LENDING
€ Mn
7,239
6,665
9M 14 9M 15
11,407
574
10,581
826
+ 57.6%
Business Consumer
+ 58.8%
+ 43.9%
Note: Does not include forbearance
+5.1%
3Q 2015 Highlights
7 de 28 / November 2015
53
38
26
185
200
0
138
205
222
144
128
47
COLOUR
SCHEME
206
201
161
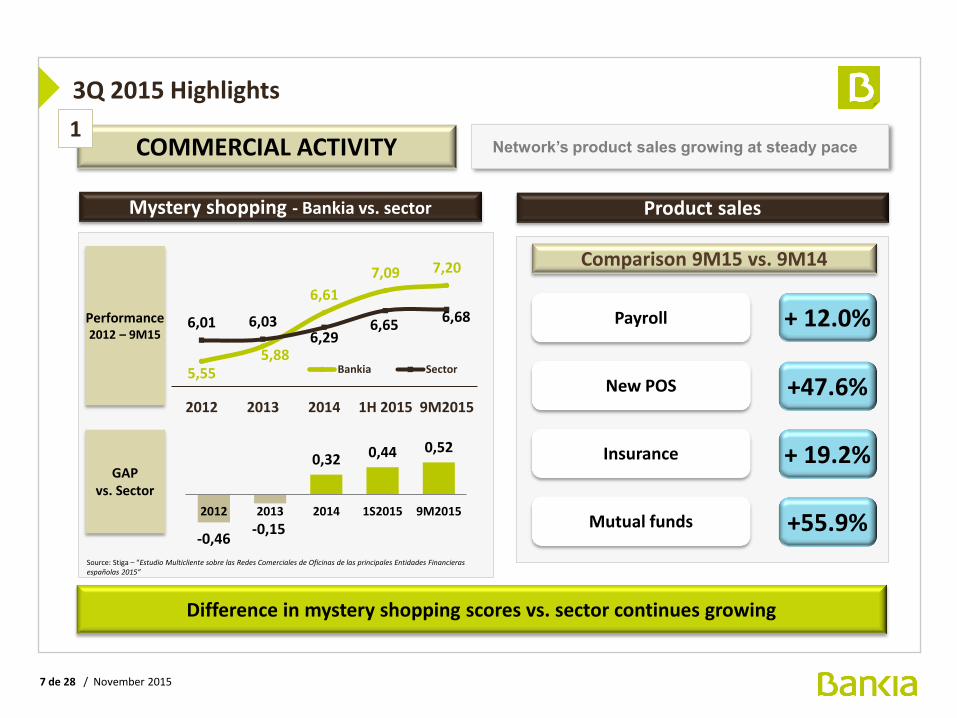
COMMERCIAL ACTIVITY 1
Difference in mystery shopping scores vs. sector continues growing
Mystery shopping - Bankia vs. sector Product sales
Payroll + 12.0%
Comparison 9M15 vs. 9M14
New POS +47.6%
Insurance + 19.2%
Mutual funds +55.9%
Network’s product sales growing at steady pace
GAP vs. Sector
Performance 2012 – 9M15
Source: Stiga – “Estudio Multicliente sobre las Redes Comerciales de Oficinas de las principales Entidades Financieras españolas 2015”
5,55 5,88
6,61
7,09 7,20
6,01 6,03 6,29
6,65 6,68
2012 2013 2014 1H 2015 9M2015
Bankia Sector
-0,46 -0,15
0,32 0,44 0,52
2012 2013 2014 1S2015 9M2015
3Q 2015 Highlights
8 de 28 / November 2015
53
38
26
185
200
0
138
205
222
144
128
47
COLOUR
SCHEME
206
201
161
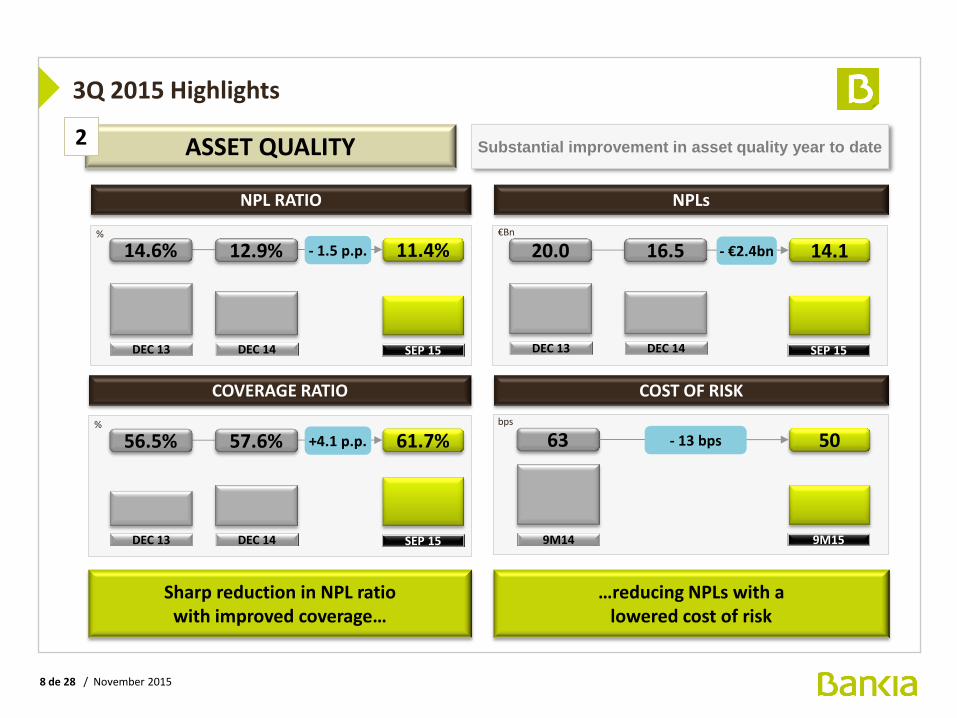
Sharp reduction in NPL ratio with improved coverage…
…reducing NPLs with a lowered cost of risk
ASSET QUALITY 2
NPL RATIO
%
DEC 13
14.6%
SEP 15
11.4% - 1.5 p.p.
COST OF RISK
bps
NPLs
Substantial improvement in asset quality year to date
COVERAGE RATIO
%
DEC 13
56.5%
SEP 15
61.7% +4.1 p.p.
€Bn
SEP 15
14.1
DEC 13
20.0 - €2.4bn
9M14
63
9M15
50 - 13 bps
DEC 14
12.9%
DEC 14
57.6%
DEC 14
16.5
3Q 2015 Highlights
9 de 28 / November 2015
53
38
26
185
200
0
138
205
222
144
128
47
COLOUR
SCHEME
206
201
161
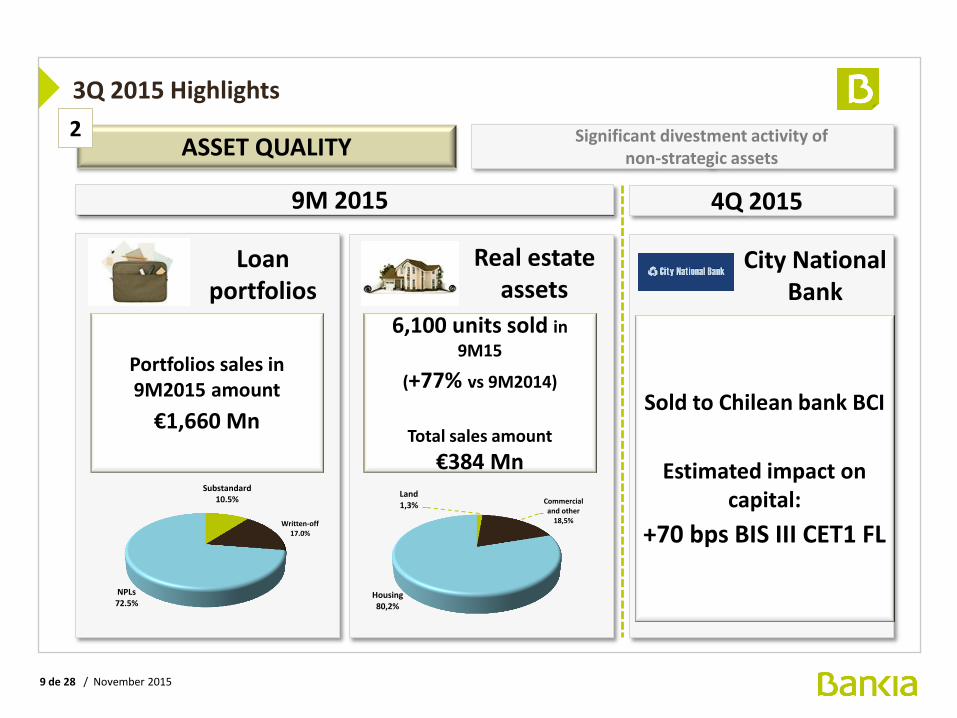
Significant divestment activity of non-strategic assets
City National Bank
Loan portfolios
Real estate assets
Sold to Chilean bank BCI
Estimated impact on capital:
+70 bps BIS III CET1 FL
Portfolios sales in 9M2015 amount
€1,660 Mn
6,100 units sold in
9M15
(+77% vs 9M2014)
Total sales amount
€384 Mn
ASSET QUALITY 2
9M 2015 4Q 2015
Land 1,3% Commercial
and other 18,5%
Housing 80,2%
Written-off 17.0%
NPLs 72.5%
Substandard 10.5%
3Q 2015 Highlights
10 de 28 / November 2015
53
38
26
185
200
0
138
205
222
144
128
47
COLOUR
SCHEME
206
201
161
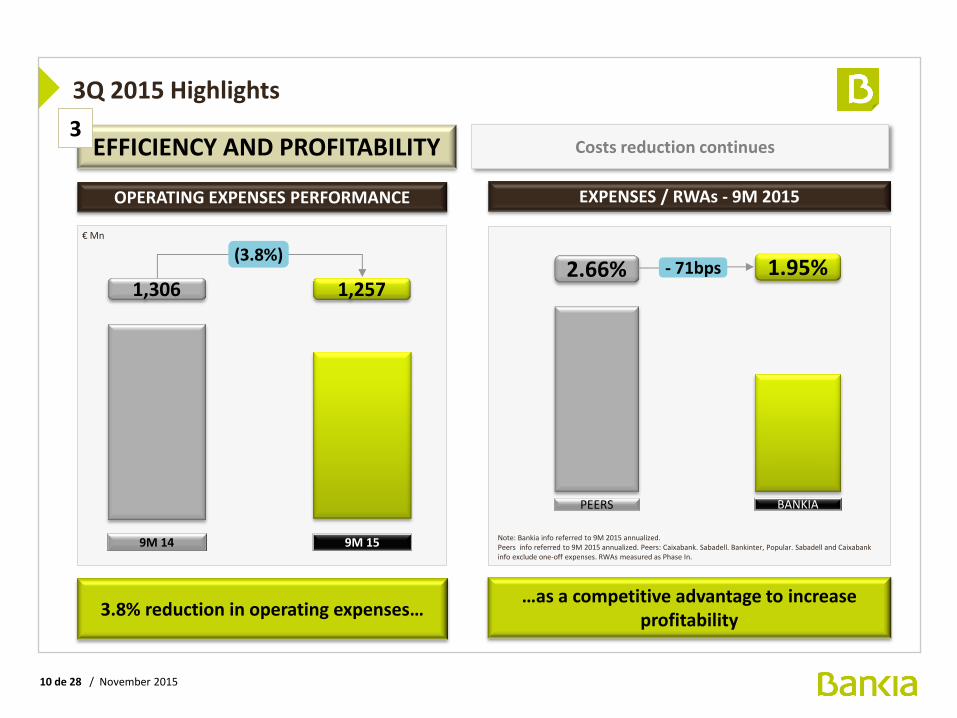
Costs reduction continues
3.8% reduction in operating expenses… …as a competitive advantage to increase
profitability
9M 14 9M 15
1,306 1,257
EXPENSES / RWAs - 9M 2015
(3.8%) € Mn
OPERATING EXPENSES PERFORMANCE
EFFICIENCY AND PROFITABILITY 3
PEERS
2.66%
BANKIA
1.95%
Note: Bankia info referred to 9M 2015 annualized. Peers info referred to 9M 2015 annualized. Peers: Caixabank. Sabadell. Bankinter, Popular. Sabadell and Caixabank info exclude one-off expenses. RWAs measured as Phase In.
- 71bps
3Q 2015 Highlights
11 de 28 / November 2015
53
38
26
185
200
0
138
205
222
144
128
47
COLOUR
SCHEME
206
201
161
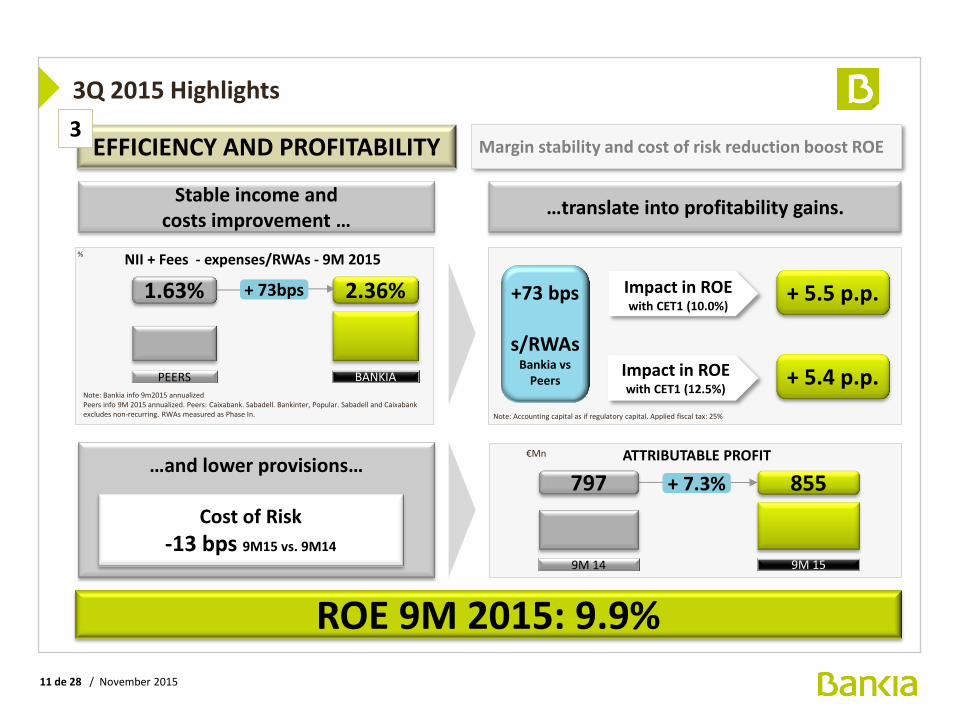
Margin stability and cost of risk reduction boost ROE
ROE 9M 2015: 9.9%
EFFICIENCY AND PROFITABILITY 3
%
Note: Bankia info 9m2015 annualized
Peers info 9M 2015 annualized. Peers: Caixabank. Sabadell. Bankinter, Popular. Sabadell and Caixabank excludes non-recurring. RWAs measured as Phase In.
PEERS
1.63%
BANKIA
2.36%
NII + Fees - expenses/RWAs - 9M 2015
ATTRIBUTABLE PROFIT
9M 14
797
9M 15
855 + 7.3%
€Mn
Cost of Risk
-13 bps 9M15 vs. 9M14
…and lower provisions…
+73 bps
s/RWAs Bankia vs
Peers
+ 5.5 p.p. Impact in ROE with CET1 (10.0%)
Impact in ROE with CET1 (12.5%)
+ 5.4 p.p.
Note: Accounting capital as if regulatory capital. Applied fiscal tax: 25%
+ 73bps
3Q 2015 Highlights
Stable income and costs improvement …
…translate into profitability gains.
12 de 28 / November 2015
53
38
26
185
200
0
138
205
222
144
128
47
COLOUR
SCHEME
206
201
161
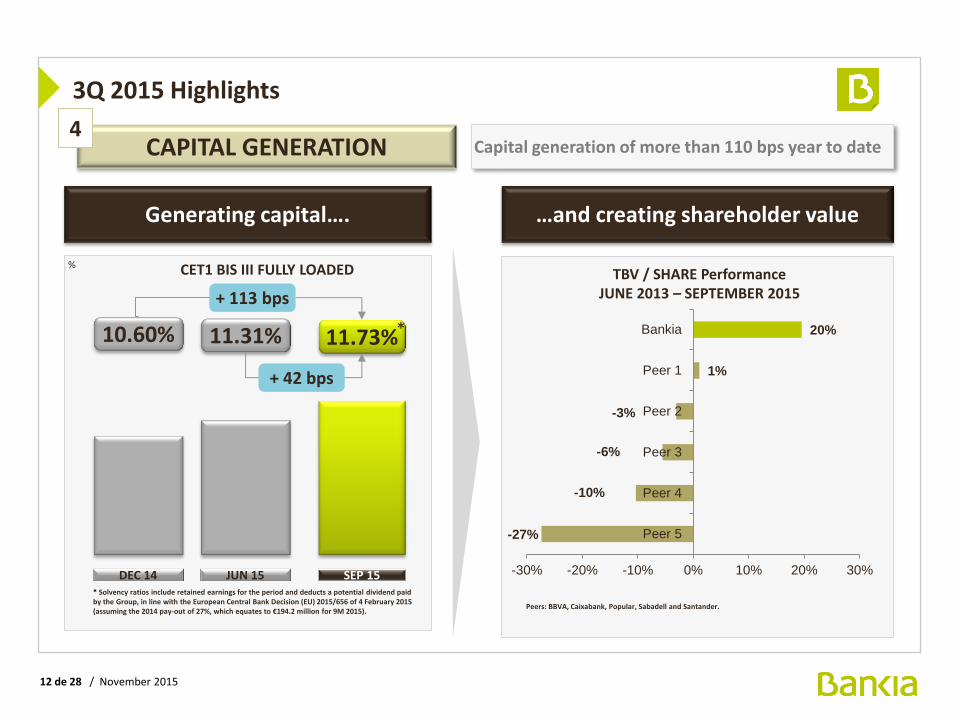
Generating capital….
CET1 BIS III FULLY LOADED
JUN 15
11.31%
SEP 15
11.73%
+ 113 bps
%
*
* Solvency ratios include retained earnings for the period and deducts a potential dividend paid by the Group, in line with the European Central Bank Decision (EU) 2015/656 of 4 February 2015 (assuming the 2014 pay-out of 27%, which equates to €194.2 million for 9M 2015).
…and creating shareholder value
CAPITAL GENERATION 4
Capital generation of more than 110 bps year to date
DEC 14
10.60%
+ 42 bps
-27%
-10%
-6%
-3%
1%
20%
-30% -20% -10% 0% 10% 20% 30%
Peer 5
Peer 4
Peer 3
Peer 2
Peer 1
Bankia
Peers: BBVA, Caixabank, Popular, Sabadell and Santander.
TBV / SHARE Performance JUNE 2013 – SEPTEMBER 2015
3Q 2015 Highlights
13 de 28 / November 2015
53
38
26
185
200
0
138
205
222
144
128
47
COLOUR
SCHEME
206
201
161
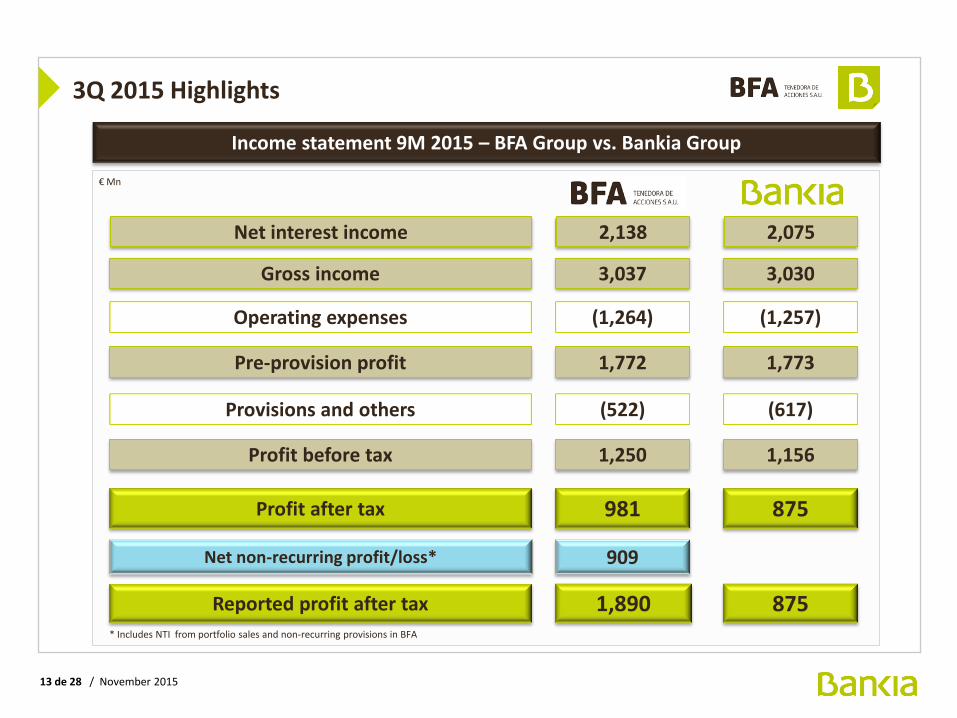
Gross income 3,030 3,037
Operating expenses (1,257) (1,264)
Profit before tax 1,156 1,250
(617) Provisions and others (522)
1,773 1,772 Pre-provision profit
Profit after tax 875 981
Income statement 9M 2015 – BFA Group vs. Bankia Group
Net non-recurring profit/loss* 909
Reported profit after tax 875 1,890
€ Mn
* Includes NTI from portfolio sales and non-recurring provisions in BFA
Net interest income 2,075 2,138
3Q 2015 Highlights
14 de 28 / November 2015
53
38
26
185
200
0
138
205
222
144
128
47
COLOUR
SCHEME
206
201
161
Contents
1. 3Q 2015 Highlights
2. 3Q 2015 results
3. Asset quality and risk management
4. Liquidity and solvency
5. Conclusions
15 de 28 / November 2015
53
38
26
185
200
0
138
205
222
144
128
47
COLOUR
SCHEME
206
201
161
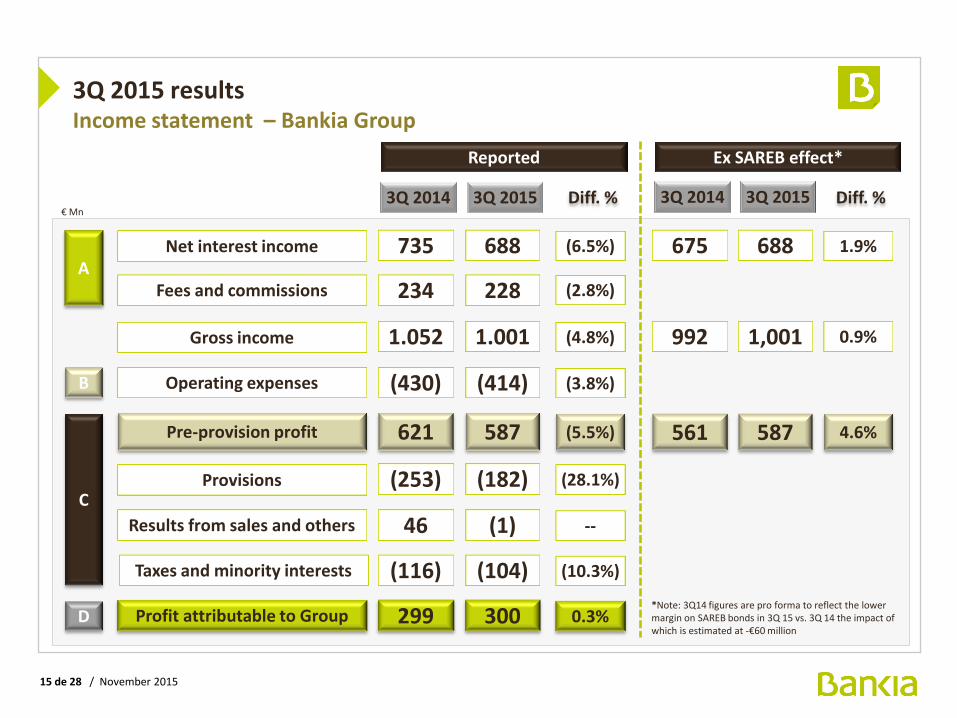
3Q 2015 results Income statement – Bankia Group
A
B
C
Net interest income
Gross income
Operating expenses
Pre-provision profit
D
€ Mn
Fees and commissions
Provisions
3Q 2014
735
1.052
(430)
621
3Q 2015
688
1.001
(414)
587
234 228
(253) (182)
Diff. %
(6.5%)
(4.8%)
(3.8%)
(5.5%)
(2.8%)
(28.1%)
Profit attributable to Group
Results from sales and others
Taxes and minority interests
299 300
46 (1)
(116) (104)
0.3%
--
(10.3%)
Reported
3Q 2014
675
992
561
3Q 2015
688
1,001
587
Diff. %
1.9%
0.9%
4.6%
Ex SAREB effect*
*Note: 3Q14 figures are pro forma to reflect the lower margin on SAREB bonds in 3Q 15 vs. 3Q 14 the impact of which is estimated at -€60 million
16 de 28 / November 2015
53
38
26
185
200
0
138
205
222
144
128
47
COLOUR
SCHEME
206
201
161
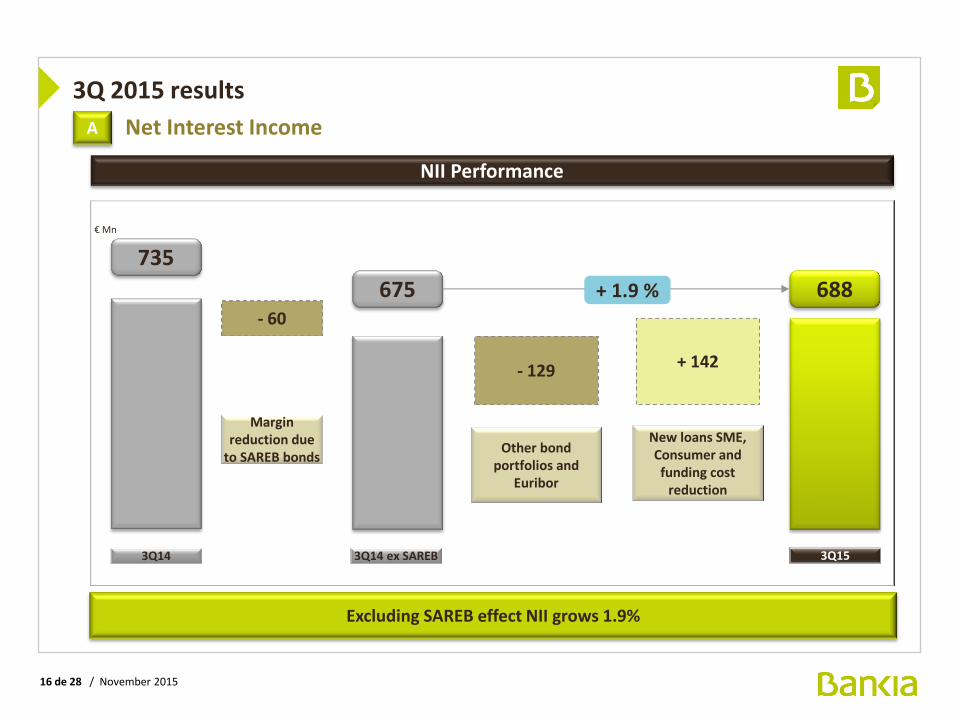
NII Performance
€ Mn
3Q14
735
Excluding SAREB effect NII grows 1.9%
3Q15
688
Margin reduction due
to SAREB bonds
- 60
Other bond portfolios and
Euribor
- 129
New loans SME, Consumer and funding cost
reduction
+ 142
675
3Q14 ex SAREB
+ 1.9 %
A Net Interest Income
3Q 2015 results
17 de 28 / November 2015
53
38
26
185
200
0
138
205
222
144
128
47
COLOUR
SCHEME
206
201
161
3Q 2015 results
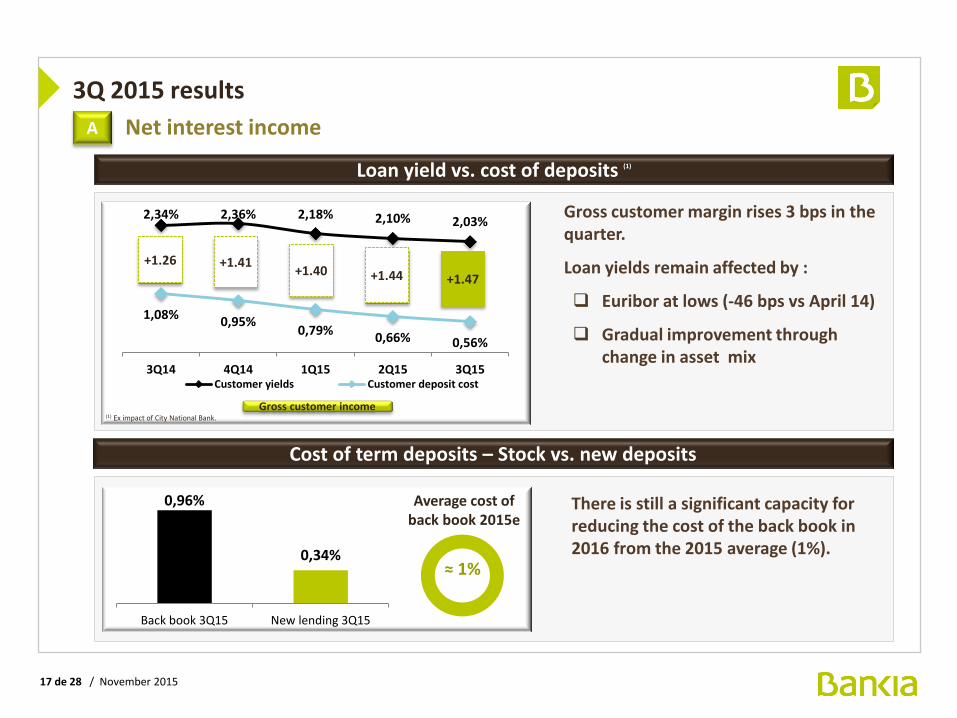
A Net interest income
(1) Ex impact of City National Bank.
Gross customer income
Gross customer margin rises 3 bps in the quarter.
Loan yields remain affected by :
Euribor at lows (-46 bps vs April 14)
Gradual improvement through change in asset mix
There is still a significant capacity for reducing the cost of the back book in 2016 from the 2015 average (1%).
≈ 1%
Average cost of back book 2015e
Loan yield vs. cost of deposits (1)
Cost of term deposits – Stock vs. new deposits
0,96%
0,34%
Back book 3Q15 New lending 3Q15
2,03% 2,10% 2,18% 2,36% 2,34%
0,56% 0,66% 0,79%
0,95% 1,08%
3Q152Q151Q154Q143Q14Customer yields Customer deposit cost
+1.26 +1.41 +1.40 +1.44 +1.47
18 de 28 / November 2015
53
38
26
185
200
0
138
205
222
144
128
47
COLOUR
SCHEME
206
201
161
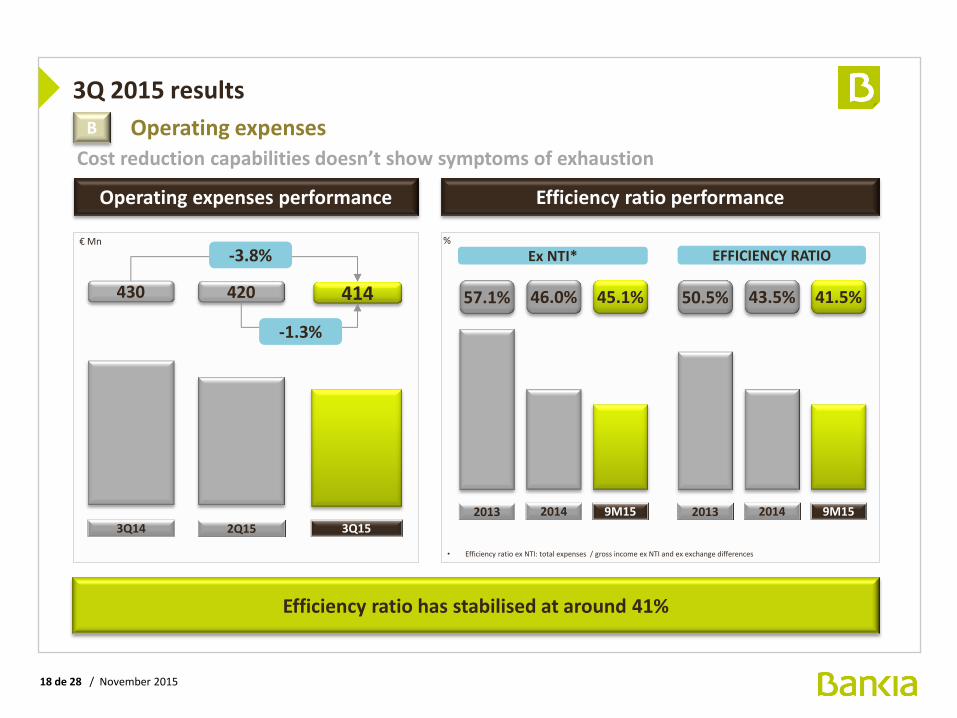
Operating expenses performance
3Q 2015 results
€ Mn
Efficiency ratio has stabilised at around 41%
Operating expenses
%
Efficiency ratio performance
9M15
45.1%
Cost reduction capabilities doesn’t show symptoms of exhaustion
B
• Efficiency ratio ex NTI: total expenses / gross income ex NTI and ex exchange differences
3Q14
430
3Q15
414
-3.8% Ex NTI* EFFICIENCY RATIO
2Q15
420
2014
46.0%
2013
57.1%
9M15
41.5%
2014
43.5%
2013
50.5%
-1.3%
19 de 28 / November 2015
53
38
26
185
200
0
138
205
222
144
128
47
COLOUR
SCHEME
206
201
161
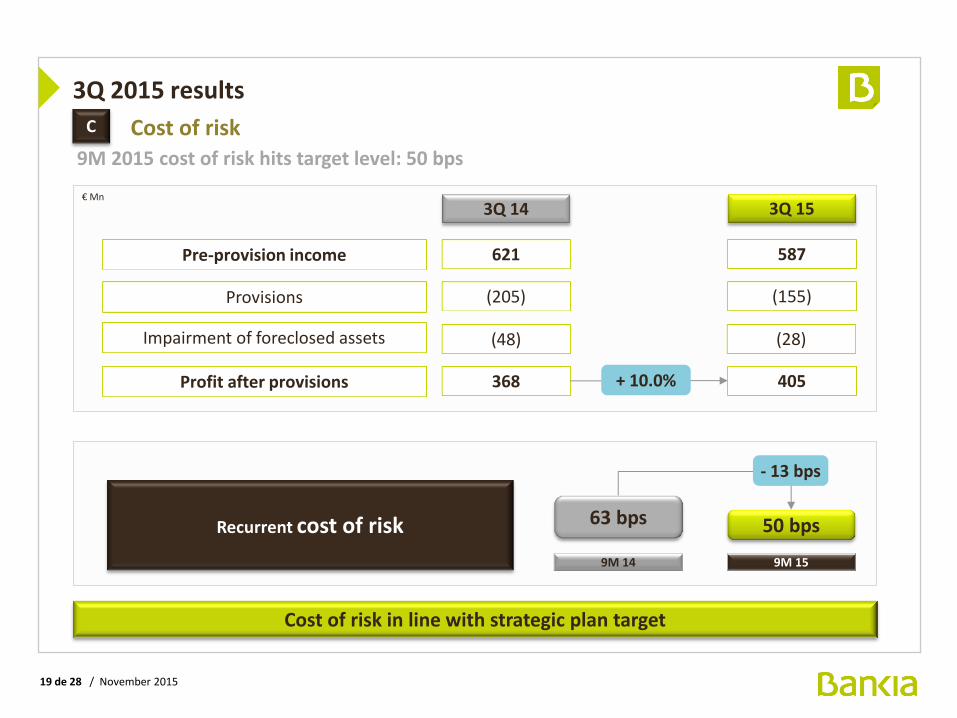
3Q 2015 results Cost of risk
Cost of risk in line with strategic plan target
Pre-provision income
Provisions
€ Mn
621
(205)
3Q 14
Profit after provisions 368
587
(155)
3Q 15
405
Impairment of foreclosed assets (48) (28)
Recurrent cost of risk
9M 15
50 bps
- 13 bps
9M 14
63 bps
9M 2015 cost of risk hits target level: 50 bps
C
+ 10.0%
20 of 28 / November 2015
53
38
26
185
200
0
138
205
222
144
128
47
COLOUR
SCHEME
206
201
161
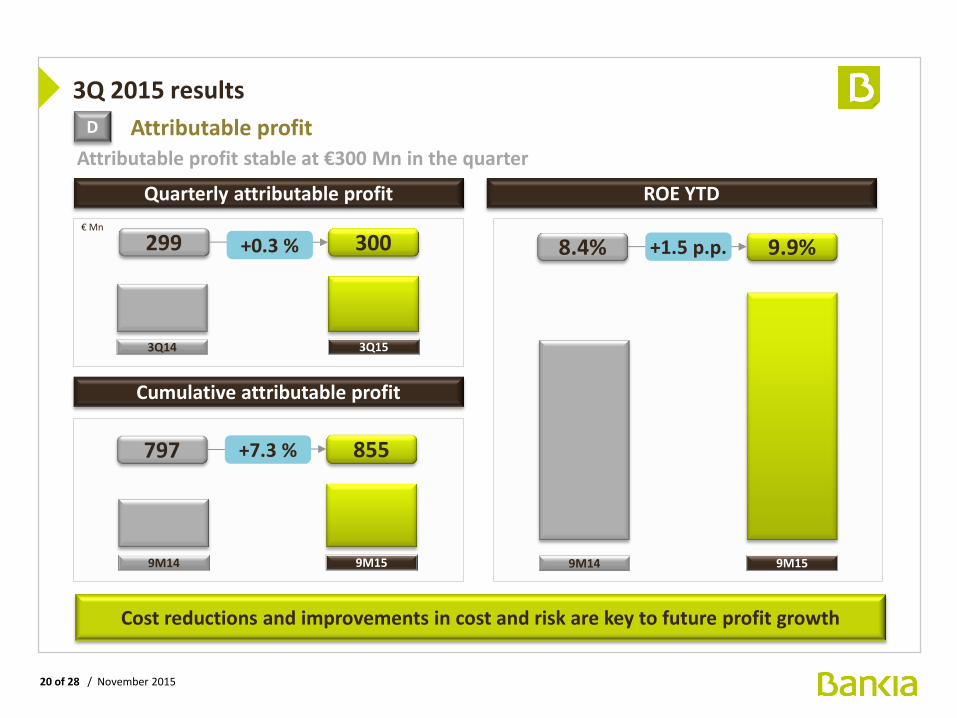
Attributable profit stable at €300 Mn in the quarter
3Q 2015 results Attributable profit
Quarterly attributable profit
€ Mn
Cost reductions and improvements in cost and risk are key to future profit growth
3Q15
300
D
3Q14
299 +0.3 %
ROE YTD
9M15
9.9%
9M14
8.4% +1.5 p.p.
Cumulative attributable profit
9M15
855
9M14
797 +7.3 %
21 of 28 / November 2015
53
38
26
185
200
0
138
205
222
144
128
47
COLOUR
SCHEME
206
201
161
Contents
1. Highlights of the quarter
2. 3Q 2015 results
3. Asset quality and risk management
4. Liquidity and solvency
5. Conclusions

22 of 28 / November 2015
53
38
26
185
200
0
138
205
222
144
128
47
COLOUR
SCHEME
206
201
161
Asset quality and risk management Credit quality Significant reduction in NPLs in 3Q15
Reduction in NPLs was €1.2bn in the quarter while coverage continues to increase
NPLs and coverage ratio
€ Bn / %
NPLs performance
€ Bn
NPLs Dec 2014
+ Gross additions
- Recoveries
- Write-offs
NPLs Sep 2015
Net additions
16.5
+ 2.5
- 3.5
- 0.2
14.1
- 1.0
Total reduction
- 2.4
- Sales - 1.2
12.9%
11.4%
NPL ratio
-1.5 p.p.
14.6% 12.9% 12.2% 11.4%
NPL ratio NPL ratio € Bn
20.0 16.5 15.3 14.1
56.5% 57.6%
60.6% 61.7%
45,0%
47,0%
49,0%
51,0%
53,0%
55,0%
57,0%
59,0%
61,0%
6,0
11,0
16,0
21,0
26,0
31,0
36,0
DEC13 DEC14 JUN15 SEP15
NPLs Coverage ratio
23 of 28 / November 2015
53
38
26
185
200
0
138
205
222
144
128
47
COLOUR
SCHEME
206
201
161
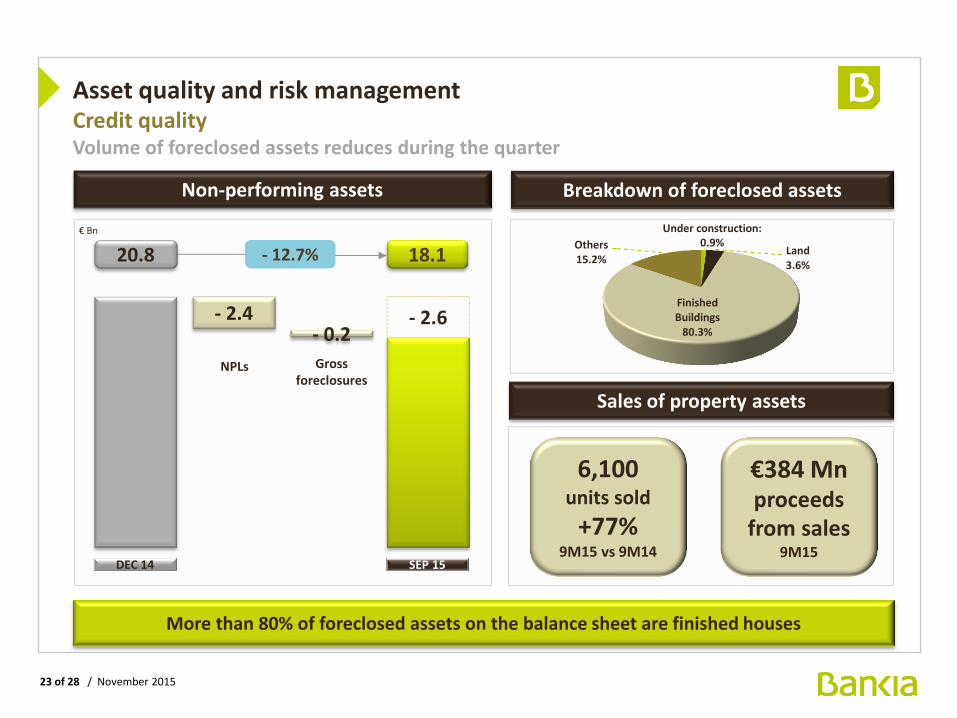
Asset quality and risk management Credit quality Volume of foreclosed assets reduces during the quarter
Sales of property assets
Non-performing assets
€ Bn
DEC 14
20.8
SEP 15
18.1 - 12.7%
More than 80% of foreclosed assets on the balance sheet are finished houses
- 2.4
Land 3.6%
Finished Buildings
80.3%
Others 15.2%
Breakdown of foreclosed assets
Under construction: 0.9%
€384 Mn proceeds
from sales 9M15
6,100 units sold
+77% 9M15 vs 9M14
- 0.2
NPLs Gross foreclosures
- 2.6
24 of 28 / November 2015
53
38
26
185
200
0
138
205
222
144
128
47
COLOUR
SCHEME
206
201
161
Contents
1. Highlights of the quarter
2. 3Q 2015 results
3. Asset quality and risk management
4. Liquidity and solvency
5. Conclusions
25 of 28 / November 2015
53
38
26
185
200
0
138
205
222
144
128
47
COLOUR
SCHEME
206
201
161
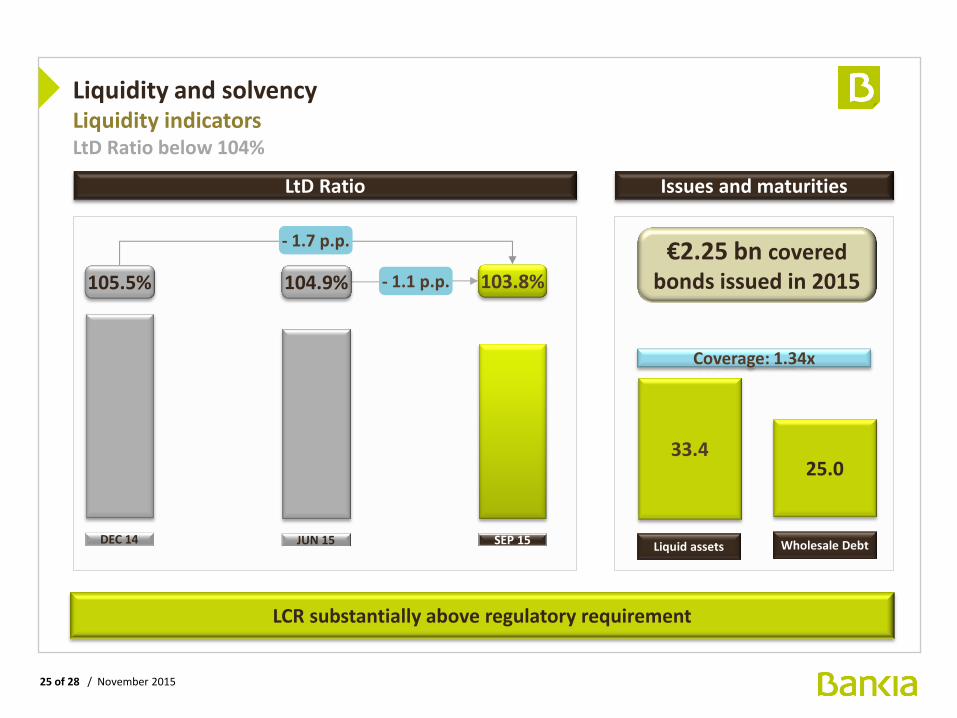
Issues and maturities
Liquidity and solvency Liquidity indicators LtD Ratio below 104%
LCR substantially above regulatory requirement
LtD Ratio
33.4 25.0
Liquid assets Wholesale Debt
€2.25 bn covered bonds issued in 2015
Coverage: 1.34x
DEC 14
105.5%
SEP 15
103.8% - 1.1 p.p.
JUN 15
104.9%
- 1.7 p.p.
26 of 28 / November 2015
53
38
26
185
200
0
138
205
222
144
128
47
COLOUR
SCHEME
206
201
161
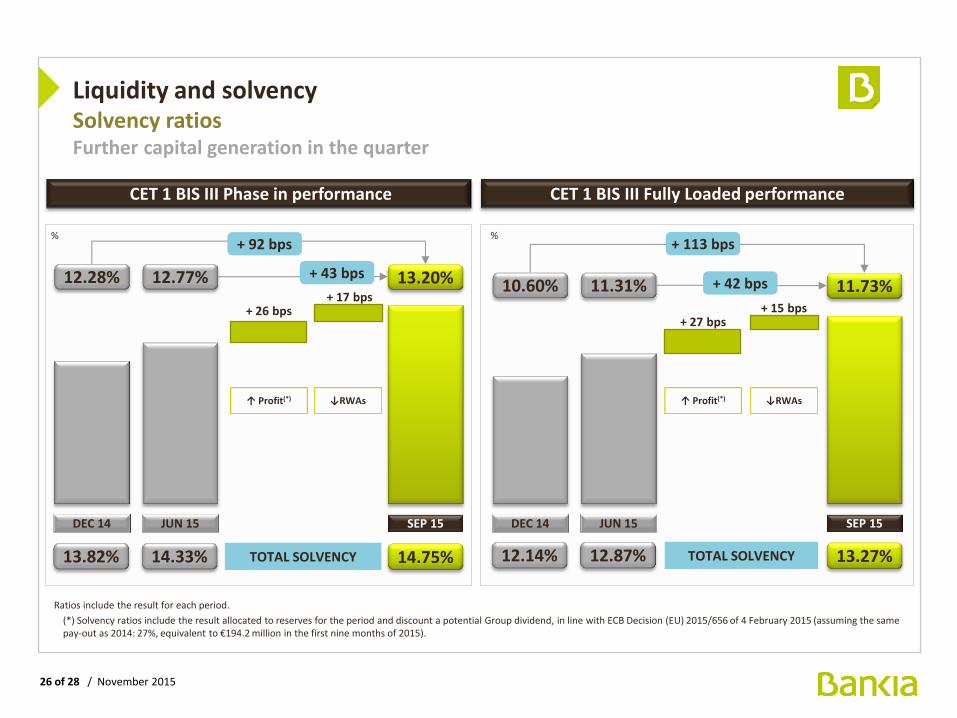
Liquidity and solvency Solvency ratios Further capital generation in the quarter
CET 1 BIS III Phase in performance
SEP 15
13.20%
14.75% TOTAL SOLVENCY
DEC 14
12.28%
13.82%
% + 92 bps
CET 1 BIS III Fully Loaded performance
+ 26 bps
↑ Profit(*) ↓RWAs
+ 17 bps
Ratios include the result for each period.
(*) Solvency ratios include the result allocated to reserves for the period and discount a potential Group dividend, in line with ECB Decision (EU) 2015/656 of 4 February 2015 (assuming the same pay-out as 2014: 27%, equivalent to €194.2 million in the first nine months of 2015).
JUN 15
12.77%
14.33%
SEP 15
11.73%
13.27% TOTAL SOLVENCY
DEC 14
10.60%
12.14%
% + 113 bps
+ 27 bps
↑ Profit(*) ↓RWAs
+ 15 bps
JUN 15
11.31%
12.87%
+ 43 bps + 42 bps
27 of 28 / November 2015
53
38
26
185
200
0
138
205
222
144
128
47
COLOUR
SCHEME
206
201
161
Contents
1. Highlights of the quarter
2. 3Q 2015 results
3. Asset quality and risk management
4. Liquidity and solvency
5. Conclusions
28 of 28 / November 2015
53
38
26
185
200
0
138
205
222
144
128
47
COLOUR
SCHEME
206
201
161
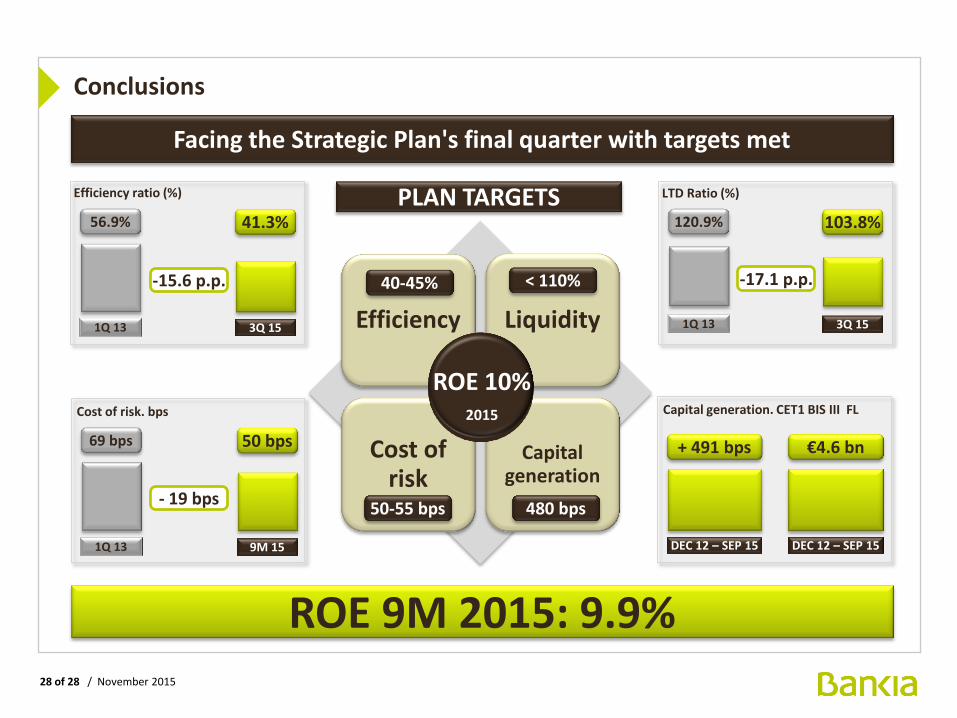
Conclusions
Facing the Strategic Plan's final quarter with targets met
Cost of risk. bps
9M 15
50 bps
1Q 13
69 bps
- 19 bps
Efficiency Liquidity
Cost of risk
Capital generation
Efficiency ratio (%)
3Q 15
41.3%
1Q 13
56.9%
-15.6 p.p.
Capital generation. CET1 BIS III FL
€4.6 bn
DEC 12 – SEP 15
+ 491 bps
LTD Ratio (%)
3Q 15
103.8%
1Q 13
120.9%
ROE 9M 2015: 9.9%
-17.1 p.p.
DEC 12 – SEP 15
PLAN TARGETS
ROE 10% 2015
40-45% < 110%
50-55 bps 480 bps