quantitative trait loci for quality and agronomic traits in two advanced backcross populations in...
TRANSCRIPT
Quantitative trait loci for quality and agronomic traits in two advancedbackcross populations in oat (Avena sativa L.)M A T T H I A S H . H E R R M A N N
1,5, J I A N Z H O N G Y U2, S T E F F E N B E U C H
3 and W I L H E L M E . W E B E R4
1Institute for Breeding Research on Agricultural Crops, Julius K€uhn-Institut, Federal Research Centre for Cultivated Plants, Rudolf-Schick-Platz 3a, OT Gross L€usewitz, D-18190, Sanitz, Germany; 2Department of Molecular Biology and Genetics, Howard HughesMedical Institute, Johns Hopkins University School of Medicine, Baltimore, MD 21205, USA; 3Nordsaat Saatzucht GmbH, SaatzuchtGranskevitz, Granskevitz 3, D-18569, Granskevitz/R€ugen, Germany; 4Institute of Agricultural and Nutritional Sciences, Martin-Luther-University Halle-Wittenberg, Julius-K€uhn-Street, 25, 06099, Halle, Germany; 5Corresponding author, E-mail: [email protected]
With 3 figures and 5 tables
Received March 15, 2013/Accepted March 10, 2014Communicated by H. B€urstmayr
AbstractUsing the advanced backcross quantitative trait loci (AB-QTL) strategy,we successfully transferred and mapped valuable allelic variants from thehigh b-glucan (BG) accession IAH611 (PI 502955), into the genome ofcultivar ‘Iltis’. By backcrossing one BC1F1 plant to ‘Iltis’, we developedtwo BC2F2-6 populations A and B, comprising 98 and 72 F2-individuals,respectively. Genotyping of BC2F2 individuals with predominantly AFLPmarkers resulted in 12 linkage groups with a map size of 455.4 cM forPopulation A and 11 linkage groups with a map size of 313.5 cM forPopulation B. Both populations were grown at three sites in Germanyover a three-year period. Individuals were then phenotyped for 13 traitsincluding grain yield (YD) and b-glucan content (BG). QTL analysis viastepwise regression detected a total of 33 QTLs, most of which wereclustered in three linkage groups. Two dense linkage groups A1 and B13were found to be putatively homologous to groups KO_6 and KO_11 ofthe ‘Kanota’/‘Ogle’ map, respectively.
Key words: Avena sativa — quantitative trait loci (QTL)analysis — b-glucan — grain yield — heading — QTL cluster
Despite the high nutritional quality of oat (Avena sativa), the cul-tivation area of oats has faced a steady decline in Germany overthe past three decades. This is mainly due to a decreasing marketdemand and the fact that oat provides lower economic returnswhen compared to other crops. The shrinking cultivation area hasled to a further decline in oat breeding investment, as well as adecreased competitiveness with other crops. To stop thesedeclines, development of oat varieties with higher, stable yieldand improved feed or food quality is required. The nutritionalquality of oat is related to its soluble fibre content. Fibre is com-posed primarily of (1?3), (1?4)-b-D-glucan (b-glucan, BG), acompound associated with hypocholesterolemic and glycaemiceffects (Welch 1990, Wood 2007). A multitude of interventionstudies has led to health claims that are related to BG of oats orbarley products (FDA, 1997, European Commission, 2011); how-ever, in contrast to its positive effects on human diets, BG hasbeen found to reduce feed efficiency in young chicks and pigs(Schrickel et al. 1992). Due to the varying effects of BG content,the idea has emerged to develop cultivars with specific trait com-positions. The genetic variability for BG content in the genusAvena has been investigated in several studies (Welch and Lloyd1989, Peterson 1991, Lim et al. 1992, Miller et al. 1993a,b, Baurand Geisler 1996, Hampshire 2004). A range of 2.2 to 11.3% BGof groat dry weight was found, with highest concentration of BGin A. atlantica (Peterson et al. 1996, Welch et al. 2000). Thereare several methods for BG measurement. Indirect methods such
as viscosity measurements (Chernyshova et al. 2007), immuno-sorbent methods (Rampitsch et al. 2006) or NIRS (Ames et al.2006) are preferentially applied for the development of oat culti-vars with high or low b-glucan. To assist further with the selec-tion of b-glucan and other traits, it would be desirable to developmolecular assays. DNA markers linked to target traits have beenused widely in many crops. Although oat breeding research lagsbehind that of cash crops, a series of molecular markers and mapshave and are continuously being developed for oats (O’Don-oughue et al. 1992, 1995, Jin et al. 2000, Li et al. 2000, Pal et al.2002, Wight et al. 2003, Becher 2007, Tinker et al. 2009, Oliveret al. 2010, 2013). Additionally, several studies have successfullymapped quality traits such as BG (Kianian et al. 1999, 2000,Groh et al. 2001, Orr and Molnar 2008, Tanhuanp€a€a et al. 2010,2012, Newell et al. 2012).In many breeding programmes, unadapted germplasm or wild
progenitors are used as donors for specific alleles. To recovervaluable hidden alleles from wild species or gene bank acces-sions, Tanksley and Nelson (1996) proposed a strategy calledadvanced backcross QTL (AB-QTL) analysis. The AB-QTLstrategy postpones the QTL analysis and detection until latergenerations of a backcrossing programme, which reduces the fre-quency of deleterious alleles from the exotic donor and the num-ber of epistatic effects related to exotic donor alleles. UsingAB-QTL, the majority of unfavourable alleles from an exoticparent can be eliminated via selection of plants prior to back-crossing and QTL analysis (Tanksley et al. 1996). QTLsdetected by the AB-QTL strategy can be used for fine mapping,marker-assisted selection (MAS) and pyramiding of genes (Col-lard and Mackill 2008, Gupta et al. 2009). MAS is favourablefor traits which are expensive to measure or not assessable bythe conventional breeding process. Oat b-glucan is considered acandidate for MAS due to the high costs of chemical analysisand low precision of other methods.The objectives of the present study were to detect and map
favourable alleles for b-glucan and further agronomical and qual-ity traits from an exotic oat accession and to develop advancedbreeding lines with high b-glucan content.
Materials and MethodsPlant materials and trait assessment: The development of two AB-QTL populations was initiated by evaluating and identifying parentswith high b-glucan content for a crossing programme. Two accessions,known to have high b-glucan content, IAH611-447 (PI 502955),abbreviated IAH611 and PA8290-5869 (Tables S1 and S3) obtained
Plant Breeding, 133, 588–601 (2014) doi:10.1111/pbr.12188© 2014 Blackwell Verlag GmbH
from Dr. H. E. Bockelman, USDA, were crossed with four oat cultivars(Table S2). Each F1 was backcrossed twice with the correspondingcultivar to obtain BC2 plants; however, not all crosses were successful.To find the most promising cross for QTL analysis, 27 BC1F2 families,each based on one selfed BC1 plant, were field-tested together withthirty-nine oat cultivars and GenBank accessions during the 2000growing season in Granskevitz and Groß L€usewitz. For the majority ofcultivars at both sites, an enzymatic assay (McCleary and Glennie-Holmes 1985) was used to test for b-glucan with harvested grain fromone replication. For the 27 BC1F2-entries, only the grain harvested atGranskevitz (Table S2) out of one replication was analysed. Two BC2
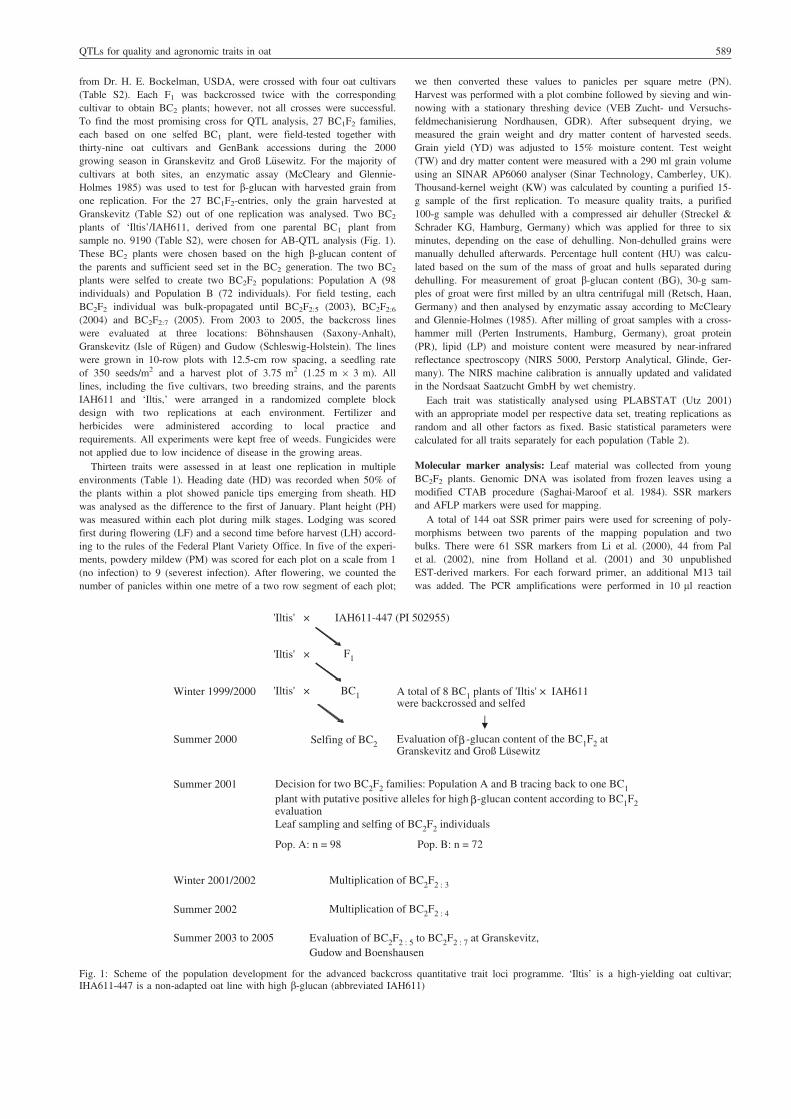
plants of ‘Iltis’/IAH611, derived from one parental BC1 plant fromsample no. 9190 (Table S2), were chosen for AB-QTL analysis (Fig. 1).These BC2 plants were chosen based on the high b-glucan content ofthe parents and sufficient seed set in the BC2 generation. The two BC2
plants were selfed to create two BC2F2 populations: Population A (98individuals) and Population B (72 individuals). For field testing, eachBC2F2 individual was bulk-propagated until BC2F2:5 (2003), BC2F2:6(2004) and BC2F2:7 (2005). From 2003 to 2005, the backcross lineswere evaluated at three locations: B€ohnshausen (Saxony-Anhalt),Granskevitz (Isle of R€ugen) and Gudow (Schleswig-Holstein). The lineswere grown in 10-row plots with 12.5-cm row spacing, a seedling rateof 350 seeds/m2 and a harvest plot of 3.75 m2 (1.25 m 9 3 m). Alllines, including the five cultivars, two breeding strains, and the parentsIAH611 and ‘Iltis,’ were arranged in a randomized complete blockdesign with two replications at each environment. Fertilizer andherbicides were administered according to local practice andrequirements. All experiments were kept free of weeds. Fungicides werenot applied due to low incidence of disease in the growing areas.
Thirteen traits were assessed in at least one replication in multipleenvironments (Table 1). Heading date (HD) was recorded when 50% ofthe plants within a plot showed panicle tips emerging from sheath. HDwas analysed as the difference to the first of January. Plant height (PH)was measured within each plot during milk stages. Lodging was scoredfirst during flowering (LF) and a second time before harvest (LH) accord-ing to the rules of the Federal Plant Variety Office. In five of the experi-ments, powdery mildew (PM) was scored for each plot on a scale from 1(no infection) to 9 (severest infection). After flowering, we counted thenumber of panicles within one metre of a two row segment of each plot;
we then converted these values to panicles per square metre (PN).Harvest was performed with a plot combine followed by sieving and win-nowing with a stationary threshing device (VEB Zucht- und Versuchs-feldmechanisierung Nordhausen, GDR). After subsequent drying, wemeasured the grain weight and dry matter content of harvested seeds.Grain yield (YD) was adjusted to 15% moisture content. Test weight(TW) and dry matter content were measured with a 290 ml grain volumeusing an SINAR AP6060 analyser (Sinar Technology, Camberley, UK).Thousand-kernel weight (KW) was calculated by counting a purified 15-g sample of the first replication. To measure quality traits, a purified100-g sample was dehulled with a compressed air dehuller (Streckel &Schrader KG, Hamburg, Germany) which was applied for three to sixminutes, depending on the ease of dehulling. Non-dehulled grains weremanually dehulled afterwards. Percentage hull content (HU) was calcu-lated based on the sum of the mass of groat and hulls separated duringdehulling. For measurement of groat b-glucan content (BG), 30-g sam-ples of groat were first milled by an ultra centrifugal mill (Retsch, Haan,Germany) and then analysed by enzymatic assay according to McClearyand Glennie-Holmes (1985). After milling of groat samples with a cross-hammer mill (Perten Instruments, Hamburg, Germany), groat protein(PR), lipid (LP) and moisture content were measured by near-infraredreflectance spectroscopy (NIRS 5000, Perstorp Analytical, Glinde, Ger-many). The NIRS machine calibration is annually updated and validatedin the Nordsaat Saatzucht GmbH by wet chemistry.
Each trait was statistically analysed using PLABSTAT (Utz 2001)with an appropriate model per respective data set, treating replications asrandom and all other factors as fixed. Basic statistical parameters werecalculated for all traits separately for each population (Table 2).
Molecular marker analysis: Leaf material was collected from youngBC2F2 plants. Genomic DNA was isolated from frozen leaves using amodified CTAB procedure (Saghai-Maroof et al. 1984). SSR markersand AFLP markers were used for mapping.
A total of 144 oat SSR primer pairs were used for screening of poly-morphisms between two parents of the mapping population and twobulks. There were 61 SSR markers from Li et al. (2000), 44 from Palet al. (2002), nine from Holland et al. (2001) and 30 unpublishedEST-derived markers. For each forward primer, an additional M13 tailwas added. The PCR amplifications were performed in 10 ll reaction
'Iltis' ×
BC1'Iltis' ×
IAH611-447 (PI 502955)
'Iltis' × F1
Selfing of BC2
Winter 1999/2000
Summer 2000
Winter 2001/2002 Multiplication of BC2F2 : 3
Evaluation of -glucan content of the BC1F2 at Granskevitz and Groß Lüsewitz
Decision for two BC2F2 families: Population A and B tracing back to one BC1plant with putative positive alleles for high -glucan content according to BC1F2evaluation Leaf sampling and selfing of BC2F2 individuals
Summer 2001
A total of 8 BC1 plants of 'Iltis' × IAH611 were backcrossed and selfed
Summer 2002
Summer 2003 to 2005
Multiplication of BC2F2 : 4
Evaluation of BC2F2 : 5 to BC2F2 : 7 at Granskevitz, Gudow and Boenshausen
Pop. A: n = 98 Pop. B: n = 72
β
β
Fig. 1: Scheme of the population development for the advanced backcross quantitative trait loci programme. ‘Iltis’ is a high-yielding oat cultivar;IHA611-447 is a non-adapted oat line with high b-glucan (abbreviated IAH611)
QTLs for quality and agronomic traits in oat 589
mixes containing: 20 ng of template DNA, 0.5 pmol of each forward pri-mer, 5 pmol of each reverse primer, 5 pmol of M13 primer labelled withan infrared fluorescent dye (IRD 700), 0.25 U of HotStar Taq DNApolymerase and 19 HotStar Taq PCR buffer (QIAGENE GmbH, Hilden,Germany), and 0.2 mM of dNTPs. The PCR was carried out on a PeltierThermal Cycler PTC-200 (MJ Research, Waltham, MA, USA) using a‘Touchdown’ PCR profile: started with an initial denaturation at 95°Cfor 15 min, followed by 20 cycles of 1 min at 94°C, 1 min at 65°C,1 min at 72°C. Annealing temperatures were progressively decreased by0.5°C each cycle to 55°C. PCR continued for 23 additional cycles of1 min at 94°C, 1 min at 55°C, 1 min at 72°C with a final elongationstep of 72°C for 10 min. PCR products were separated on an automatedlaser fluorescence (ALF) sequencer (Pharmacia Biotech) using a KBPlus6.5% gel matrix (LI-COR GmbH, Bad Homburg, Germany) at 1500 V,60 mA, 30 W and 50°C. Fragment sizes were calculated using the Frag-ment Analyser version 1.00 program (Pharmacia Biotech) by comparisonwith the external size standards.
AFLP analysis was conducted as described by Vos et al. (1995) withmodifications. A total of 500 ng genomic DNA was digested with EcoRIand MseI. EcoRI and MseI adapters were ligated to the restriction frag-ments. The ligation mixture was diluted to 1:10. Preselective amplifica-tion was performed using primers with one additional nucleotide(EcoRI+A, MseI+C). Selective amplification was performed using primerswith three additional nucleotides. Each of the EcoRI selective primerswas labelled with an infrared fluorescent dye (IRD 700 or IRD 800). Atotal of 256 primer pair combinations were employed for screening. Theselective amplification products were detected on an LI-COR automatedsequencer (LI-COR, Lincoln, Nebraska) using a KBPlus 6.5% gel matrix(LI-COR GmbH, Bad Homburg, Germany) at 1500 V, 40 mA, 25 W and45°C. The AFLP loci were named based on a combination of the standardprimer nomenclature (http://wheat.pw.usda.gov/ggpages/keygeneAFLPs.html) followed by a number which referred to the specific polymorphism.
Linkage maps were constructed separately for Populations A and Bwith the JoinMap 3.0 programme (Van Ooijen and Voorrips 2001). AnLOD score of 3.0 was established to consider significant linkage, and theKosambi mapping function (Kosambi 1944) was used to convert recom-bination fractions into centiMorgans (cM). To enable comparison withthe reference map, those markers segregating in ‘Iltis’/IAH611 popula-tions were screened for polymorphism between ‘Kanota’ and ‘Ogle’. The
‘Kanota’/‘Ogle’ map was constructed with genotypes of 96 RIL, 353markers compiled from Siripoonwiwat et al. (1996) and Becher (2007),and AFLP markers found to be polymorphic between ‘Kanota’ and‘Ogle’ (Table S4).
QTL mapping: QTL mapping was first performed with PLABQTL (Utzand Melchinger 2006). Due to inconclusive cofactor selection withPLABQTL procedures, we performed QTL mapping by usingPLABMQTL (Utz 2011) with a scanning interval of 1 cM and a modelconsidering only additive effects. In contrast to its predecessorPLABQTL, PLABMQTL yields more conservative CIM results usingstepwise regression, and either the Bayesian information criterion (BIC)or modified BIC (mBIC) (Baierl et al. 2006) for cofactor selection.Using PLABMQTL, initial interval mapping was performed, followed bya second run with the cov SEL command, and then a final run with theparameter statement PenIC = 2 for mBIC. Although the mBIC runselects the proper cofactors in most cases, cofactor selection was revisedin the final CIM run; cofactors in linkage groups without QTLs and co-factors with high negative logarithm -lg(P) within the Single MarkerRegression File were omitted. Each run was additionally extended by apermutation test to find the LOD threshold for a QTL in the specificdata. The LOD thresholds applied did not exceed an experiment-wiseerror of alpha = 0.25. To reduce bias in estimates of QTL phenotypicand genotypic variance, a fivefold cross-validation run was conductedwith 1000 splits.
To designate QTLs, the nomenclature for wheat gene symbols (http://wheat.pw.usda.gov/ggpages/wgc/98) was adopted by first naming thelinkage groups of each subpopulation (A1 to A12 and B1 to B16) andthen adding the cumulative number of QTLs for each trait after the traitsymbol. We used MapChart 2.2 (Voorrips 2006) for joint visualizationof linkage groups and QTLs.
ResultsPhenotypic evaluation of AB-QTL populations
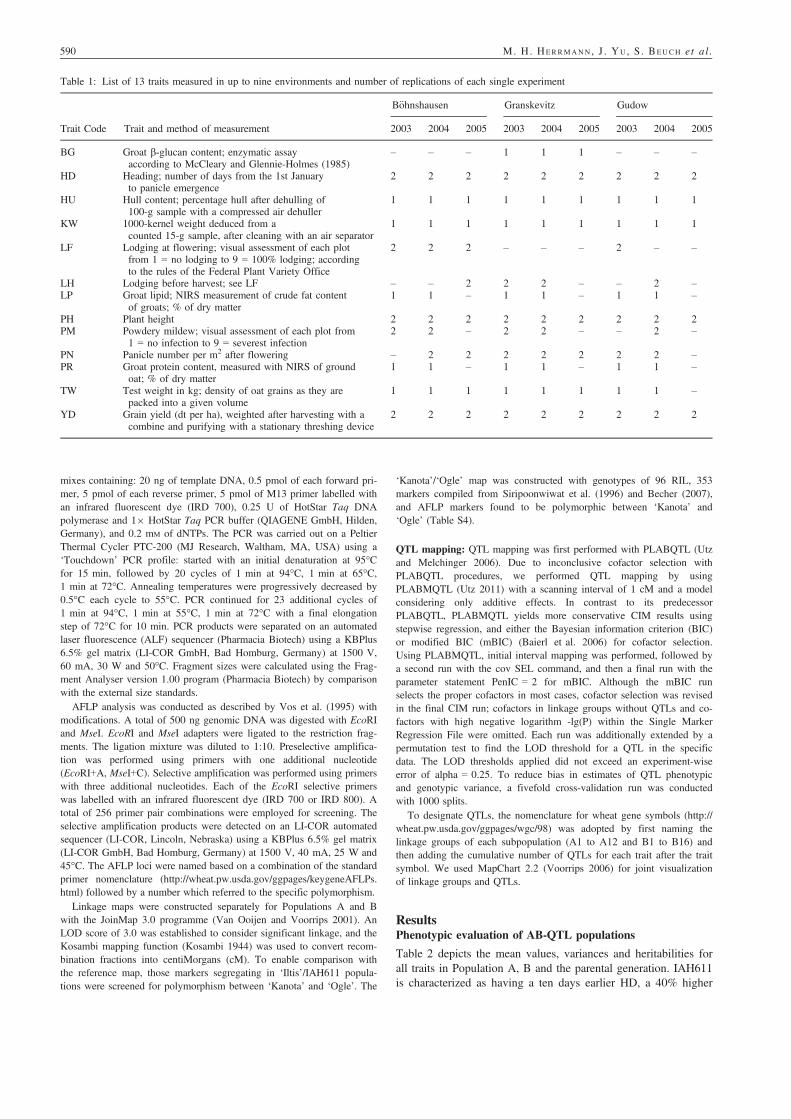
Table 2 depicts the mean values, variances and heritabilities forall traits in Population A, B and the parental generation. IAH611is characterized as having a ten days earlier HD, a 40% higher
Table 1: List of 13 traits measured in up to nine environments and number of replications of each single experiment
Trait Code Trait and method of measurement
B€ohnshausen Granskevitz Gudow
2003 2004 2005 2003 2004 2005 2003 2004 2005
BG Groat b-glucan content; enzymatic assayaccording to McCleary and Glennie-Holmes (1985)
– – – 1 1 1 – – –
HD Heading; number of days from the 1st Januaryto panicle emergence
2 2 2 2 2 2 2 2 2
HU Hull content; percentage hull after dehulling of100-g sample with a compressed air dehuller
1 1 1 1 1 1 1 1 1
KW 1000-kernel weight deduced from acounted 15-g sample, after cleaning with an air separator
1 1 1 1 1 1 1 1 1
LF Lodging at flowering; visual assessment of each plotfrom 1 = no lodging to 9 = 100% lodging; accordingto the rules of the Federal Plant Variety Office
2 2 2 – – – 2 – –
LH Lodging before harvest; see LF – – 2 2 2 – – 2 –LP Groat lipid; NIRS measurement of crude fat content
of groats; % of dry matter1 1 – 1 1 – 1 1 –
PH Plant height 2 2 2 2 2 2 2 2 2PM Powdery mildew; visual assessment of each plot from
1 = no infection to 9 = severest infection2 2 – 2 2 – – 2 –
PN Panicle number per m2 after flowering – 2 2 2 2 2 2 2 –PR Groat protein content, measured with NIRS of ground
oat; % of dry matter1 1 – 1 1 – 1 1 –
TW Test weight in kg; density of oat grains as they arepacked into a given volume
1 1 1 1 1 1 1 1 –
YD Grain yield (dt per ha), weighted after harvesting with acombine and purifying with a stationary threshing device
2 2 2 2 2 2 2 2 2
590 M. H. HERRMANN , J . YU , S . BEUCH e t a l .
BG and PN, a greater tendency to lodge, and a 35% lower grainyield (YD) compared with ‘Iltis’. No significant differencesbetween parents were found for hull content (HU), kernel weight(KW), lipid content (LP), powdery mildew infection (PM) orprotein content (PR).For YD, PM, LH, HD and BG, the means for both popula-
tions were within the range of the two parents; however, forYD, PN, LF and PR, population means shifted towards those ofthe cultivar ‘Iltis’, as expected after two backcrosses. Addition-ally, significant skewness towards ‘Iltis’ was found in both pop-ulations for YD and PN. Considering range, no line reached thevalue of IHA611 for LF, LH, PN, PR, BG, HD, TW or YD.Phenotypic correlation coefficients between traits were calcu-
lated for the results of three years at Granskevitz, the site whereharvest was chemically analysed for BG. Correlation coefficientswere calculated for the replication used for BG analysis. Thus,only 12 traits are included (Table 3). Considering BG, positivecorrelations were found to KW, PM, PN, PR and TW, for whichthe latter two are useful from the viewpoint of breeding. Further-more, the negative correlation between BG and HU or LP showsthat there are lines with high BG but low HU or LP and viceversa, which are valuable trait combinations. The negative corre-lation between BG and YD, however, indicates that it will bechallenging to develop lines with high grain yield and high BGcontent (Table 3). Genotype-by-environment interactions (GE)were analysed only for those traits with replications inside ofsingle experiments. In six of seven traits, the GE are significant(Table 2), but lower than the main effects of genotype and envi-ronment (year and site, results not shown). Therefore, the use ofmean values is justifiable.
Marker polymorphism and map development
Among 144 oat SSR primer pairs, 24 gave polymorphic bandsbetween the two parents ‘Iltis’ and IHA611. However, only fiveof these primer pairs were polymorphic in Population A, and sixin Population B. For the 256 AFLP primer combinations, 450polymorphic bands were found between the two parents ‘Iltis’and IHA611, with an average of about two polymorphic bandsper primer combination. 105 of 450 markers segregated in Popu-lation A, 212 in Population B and 64 markers were commonbetween both populations. Among the AFLP markers scored, 18were codominant markers in Population A, and 21 were codomi-nant markers in Population B. 49 of 110 dominant AFLP allelescame from the parent IHA611, and the remaining from ‘Iltis’.None of the markers mapped showed distorted segregation.Linkage analysis with 110 marker loci (five SSR and 105
AFLP) in Population A resulted in 12 linkage groups with 106loci. Analysis in Population B with 218 marker loci (six SSRand 212 AFLP) resulted in 11 linkage groups with 195 loci.The linkage groups together had a total map size of 455.4 cMand 313.5 cM. The average distance between markers was4.6 cM in Population A and 1.7 cM in Population B (Table 4).Among the 12 linkage groups of Population A, seven wereassigned to groups from Population B by common markers(Fig. 2). The remaining unique groups are shown in Fig. 3a forPopulation A and in Fig. 3b for Population B. For 11 AFLPmarkers and AM0003, mapping was additionally successful inthe ‘Kanota’/‘Ogle’ map. In this map, 38 linkage groups weredeveloped, of which two could be aligned to KO_6 in the con-sensus map of Tinker et al. (2009). These two linkage groupsare shown in Fig. 2a as KO_6(a) and KO_6(b), together withthe putatively homologous linkage groups A1 and B1 and theT
able
2:Meantraitvalues,standard
deviation,
heritability(h
2),coefficientof
variation(CV),skew
ness,minim
umandmaxim
umvalues
ofpopulatio
nsA
andBandparents
Populatio
nA
Populatio
nB
Parental
mean2
Trait
Mean
Std.
dev.
h2CV
Skew
.1Min.
Max.
GE3
Mean
Std.
dev.
h2CV
Skew
.1Min.
Max.
GE3
IAH611
‘Iltis’
BG
4.44
0.18
52.0
4.07
0.46+
4.1
5.0
ne4.79
0.21
72.6
4.42
0.03
4.3
5.3
ne6.0
4.2*
HD
166.39
2.08
98.9
1.25
0.06
162.7
170.4
**16
5.38
2.40
99.2
1.45
0.70*
161.3
172.0
**15
7.8
167.2*
HU
30.79
1.19
82.4
3.87
�0.08
27.9
33.8
ne30
.63
1.33
81.1
4.35
0.10
27.8
33.9
ne31
.231
.0KW
33.36
1.43
89.0
4.28
0.61*
30.8
37.2
ne35
.32
1.79
90.1
5.07
�0.12
31.9
39.3
ne32
.534
.9LF
1.82
0.56
30.2
30.99
0.70**
1.0
3.4
*2.54
0.73
50.0
28.77
0.38
1.0
4.6
*7.1
2.8*
LH
3.59
0.58
29.2
16.12
�0.22
2.1
5.0
**4.09
0.66
56.6
16.08
�0.29
2.5
5.5
**6.9
3.1*
LP
7.69
0.26
80.8
3.34
�0.08
7.1
8.4
ne7.94
0.34
88.0
4.28
0.31
7.3
8.9
ne8.7
8.2
PH11
3.00
5.09
95.5
4.50
�1.11**
100.6
121.1
**11
9.79
6.86
97.1
5.73
�0.84**
103.1
131.4
**11
5.9
110.9*
PM4.60
0.57
75.0
12.47
0.60*
3.7
5.9
**4.51
0.68
84.0
15.02
0.88**
3.1
6.3
*4.3
4.7
PN46
8.88
26.53
42.8
5.66
0.98**
413.7
578.9
ns46
2.17
24.24
35.4
5.25
0.98**
423.4
549.7
ns67
1.4
474.3*
PR16
.44
0.77
77.2
4.67
0.89**
15.1
18.7
ne16
.49
0.65
72.9
3.93
0.39
15.3
18.0
ne19
.817
.4TW
54.84
1.02
85.9
1.86
0.40+
52.8
57.1
ne55
.84
1.00
82.8
1.80
0.31
53.6
58.0
ne49
.954
.5*
YD
70.19
3.72
88.2
5.30
�0.83**
59.0
76.5
**69
.37
3.31
86.2
4.78
�0.82**
61.0
75.4
**47
.173
.2*
1 Negativeskew
ness
indicatesashiftinto
thedirectionof
theparent
with
higher
meanvalue,
underlined
=skew
edto
‘Iltis’.
2 Meanvalues
of‘Iltis’
andIA
H61
1arecomparedby
pairwiset-testat
P=0.05
.3 G
enotype-by-environmentinteraction:
ne,notestim
ated;ns,notsignificant.
*Significant
atP=0.05
.**
Sign
ificantat
P=0.01
.
QTLs for quality and agronomic traits in oat 591
QTLs found. As depicted in Fig. 2a, A1 shared four markerswith KO_6(a) and B1 shared one marker with KO_6(a) andtwo with KO_6(b). A1 and B1 had 28 common markers(Table 4). In the consensus map of Tinker et al. (2009), theinterval on KO_6 between ISU1146A (48 cM) and BCD1872B(67 cM) was filled with five markers, not involved in our mapcalculation. Three AFLPs belonging to group B13 weremapped in KO_11, and three markers belonging to A11 andB11 were mapped in KO_36. A comparison of framework mar-ker positions on KO linkage groups of this study with positionsin the map of Tinker et al. (2009) is facilitated by depictingmarker positions of both maps in Fig. 2a–c. The marker orderon KO_6, KO_11 and KO_36 is very similar in both maps,and differences are explainable by different sets of markersinvolved. Most of the paired linkage groups enclose severalmarker clusters.
QTL analysis
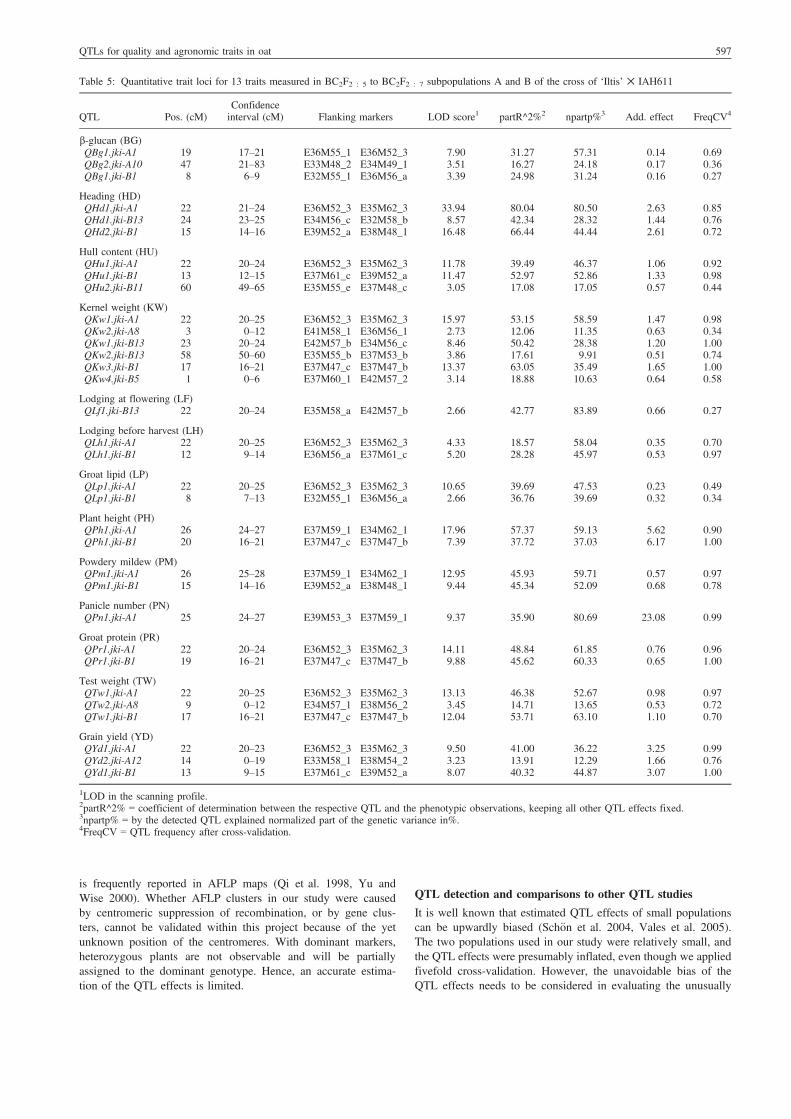
For all traits studied, a total of 33 QTLs were detected in Popu-lations A and B (Table 5), mainly clustered on linkage groupsA1, B1 and B13.
b-Glucan content (BG)QTLs for BG were detected on linkage groups A1, A10 and B1.Most influential was QBg1.jki-A1, explaining 31% of the pheno-typic and 57% of the genotypic variance (Table 5). As linkagegroups A1 and B1 are homologous, it is likely thatQBg1.jki-A1 andQBg1.jki-B1 cover the same introgressed segment from IAH611(Fig. 2). There was a positive additive effect of the QTL QBg2.jki-A10, indicating the ‘Iltis’ allele increases BG at this locus.
Heading (HD)Heading QTLs were detected on A1, B1 and B13. All threeQTLs are highly significant with LODs of 8.57–33.9, explaining42.3–80% of the phenotypic variance and 28.3–80.5% of geno-typic variance. The additive effects were positive, indicatingdecreasing effects of IAH611 alleles. In breeding programmespreferring early cultivars, the IAH611 alleles for the three QTLsare useful loci for MAS.
Hull content (HU)Three QTLs were found for HU in both Population A and B(Table 5). Among these QTLs, QHu1.jki-A1 and Qhu1.jki-B1were characterized by highest partial R^2 and highest LOD scoresof 11.8 and 11.5, respectively. Both QTLs had positive additiveeffects, whereas the minor QTL Qhu2.jki-B11 showed a negativeadditive effect. The IAH611 alleles of QHu1.jki-A1 and Qhu1.jki-B1 lowered the hull content and are therefore useful for MAS.
Kernel weight (KW)For KW, two QTLs were detected in Population A and four inPopulation B. The most influential QTLs were QKw1.jki-A1,QKw1.jki-B13 and QKw3.jki-B1 (Table 5), explaining 53.2%,50.4% and 63.1% of the phenotypic and 58.6%, 28.4% and 35.5%of the genotypic variances, respectively. The additive effects ofthe main influential QTLs were negative, indicating higher meansof progeny with the IHA611 allele. On linkage group B13, twoQTLs with contrary additive effects were detected.
Lodging at flowering (LF) and lodging before harvest (LH)For LF, the QTL QLf1.jki-B13 was found, with a negative additiveeffect, indicating a more severe lodging in progeny with theIAH611 allele. For LH, the two QTLs QLh1.jki-A1 and QLh1.jki-B1 were found. The positive additive effects were caused byhigher lodging scores of the progeny with alleles from ‘Iltis’,
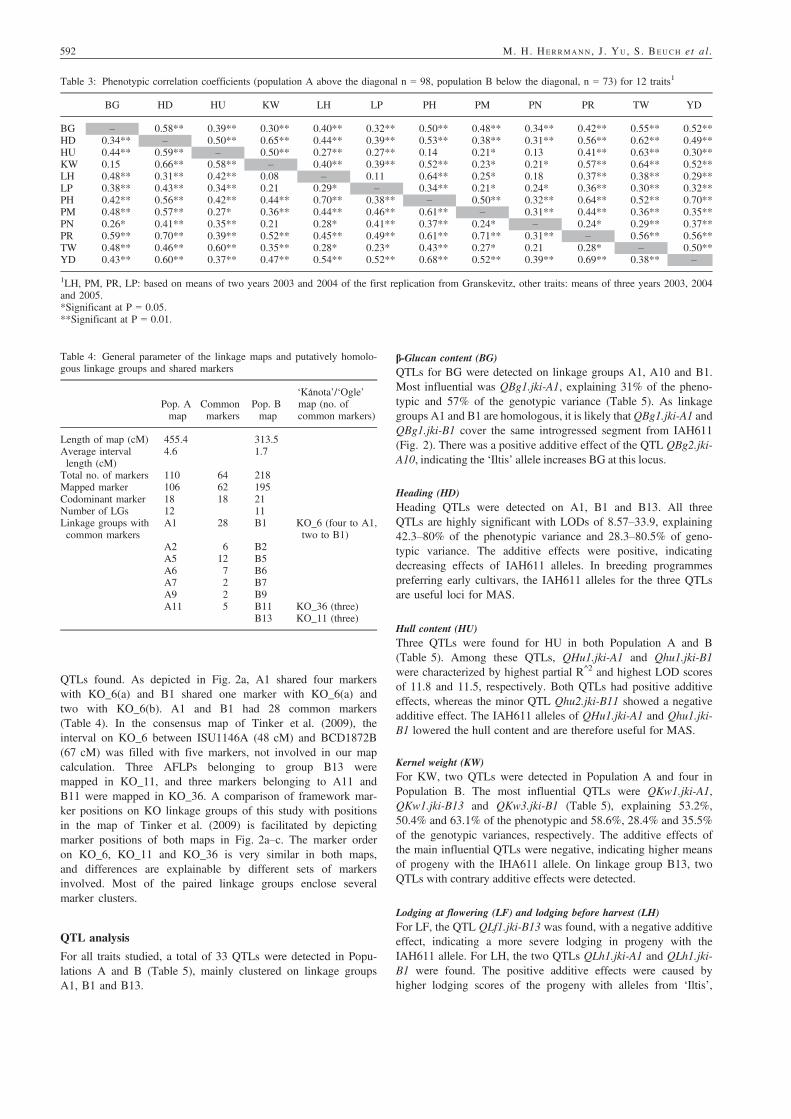
Table 3: Phenotypic correlation coefficients (population A above the diagonal n = 98, population B below the diagonal, n = 73) for 12 traits1
BG HD HU KW LH LP PH PM PN PR TW YD
BG – �0.58** �0.39** 0.30** �0.40** �0.32** �0.50** 0.48** 0.34** 0.42** 0.55** �0.52**HD �0.34** – 0.50** �0.65** 0.44** 0.39** 0.53** �0.38** �0.31** �0.56** �0.62** 0.49**HU �0.44** 0.59** – �0.50** 0.27** 0.27** 0.14 �0.21* �0.13 �0.41** �0.63** 0.30**KW 0.15 �0.66** �0.58** – �0.40** �0.39** �0.52** 0.23* 0.21* 0.57** 0.64** �0.52**LH �0.48** 0.31** 0.42** �0.08 – 0.11 0.64** �0.25* �0.18 �0.37** �0.38** 0.29**LP �0.38** 0.43** 0.34** �0.21 0.29* – 0.34** �0.21* �0.24* �0.36** �0.30** 0.32**PH �0.42** 0.56** 0.42** �0.44** 0.70** 0.38** – �0.50** �0.32** �0.64** �0.52** 0.70**PM 0.48** �0.57** �0.27* 0.36** �0.44** �0.46** �0.61** – 0.31** 0.44** 0.36** �0.35**PN 0.26* �0.41** �0.35** 0.21 �0.28* �0.41** �0.37** 0.24* – 0.24* 0.29** �0.37**PR 0.59** �0.70** �0.39** 0.52** �0.45** �0.49** �0.61** 0.71** 0.31** – 0.56** �0.56**TW 0.48** �0.46** �0.60** 0.35** �0.28* �0.23* �0.43** 0.27* 0.21 0.28* – �0.50**YD �0.43** 0.60** 0.37** �0.47** 0.54** 0.52** 0.68** �0.52** �0.39** �0.69** �0.38** –
1LH, PM, PR, LP: based on means of two years 2003 and 2004 of the first replication from Granskevitz, other traits: means of three years 2003, 2004and 2005.*Significant at P = 0.05.**Significant at P = 0.01.
Table 4: General parameter of the linkage maps and putatively homolo-gous linkage groups and shared markers
Pop. Amap
Commonmarkers
Pop. Bmap
‘‘Kanota’/‘Ogle’map (no. ofcommon markers)
Length of map (cM) 455.4 313.5Average intervallength (cM)
4.6 1.7
Total no. of markers 110 64 218Mapped marker 106 62 195Codominant marker 18 18 21Number of LGs 12 11Linkage groups withcommon markers
A1 28 B1 KO_6 (four to A1,two to B1)
A2 6 B2A5 12 B5A6 7 B6A7 2 B7A9 2 B9A11 5 B11 KO_36 (three)
B13 KO_11 (three)
592 M. H. HERRMANN , J . YU , S . BEUCH e t a l .
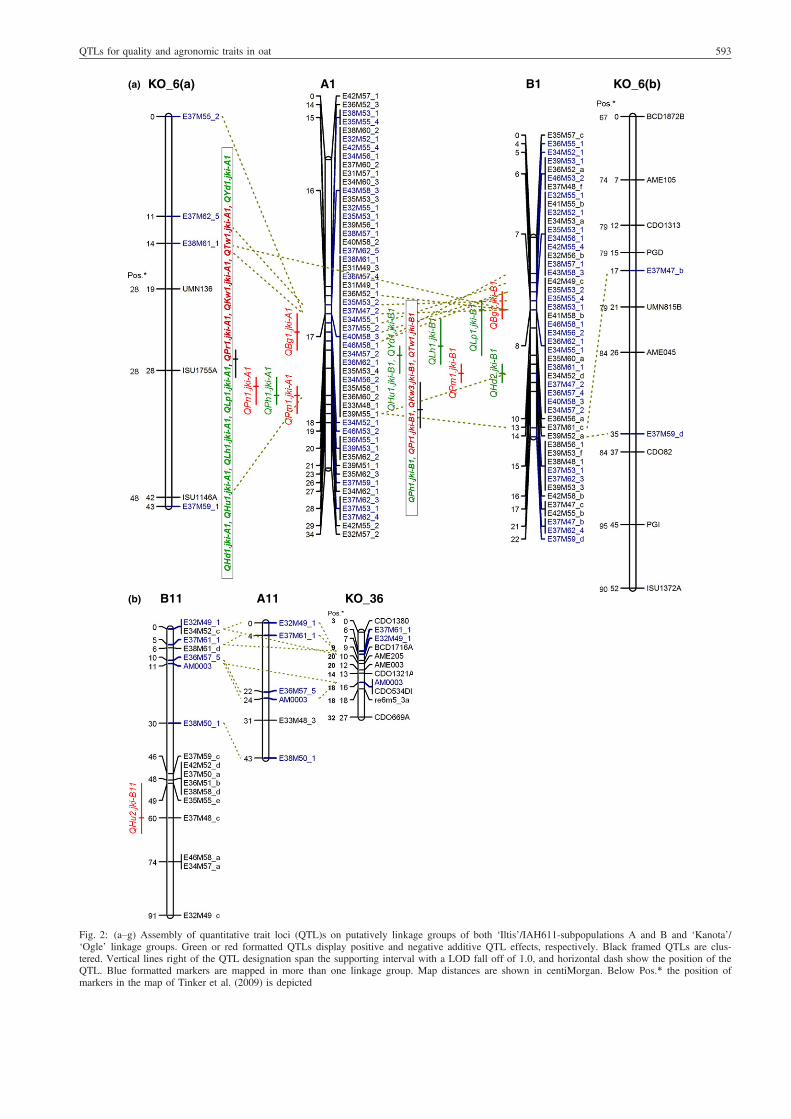
(a) KO_6(a) KO_6(b)A1 B1
(b) B11 A11 KO_36
Fig. 2: (a–g) Assembly of quantitative trait loci (QTL)s on putatively linkage groups of both ‘Iltis’/IAH611-subpopulations A and B and ‘Kanota’/‘Ogle’ linkage groups. Green or red formatted QTLs display positive and negative additive QTL effects, respectively. Black framed QTLs are clus-tered. Vertical lines right of the QTL designation span the supporting interval with a LOD fall off of 1.0, and horizontal dash show the position of theQTL. Blue formatted markers are mapped in more than one linkage group. Map distances are shown in centiMorgan. Below Pos.* the position ofmarkers in the map of Tinker et al. (2009) is depicted
QTLs for quality and agronomic traits in oat 593
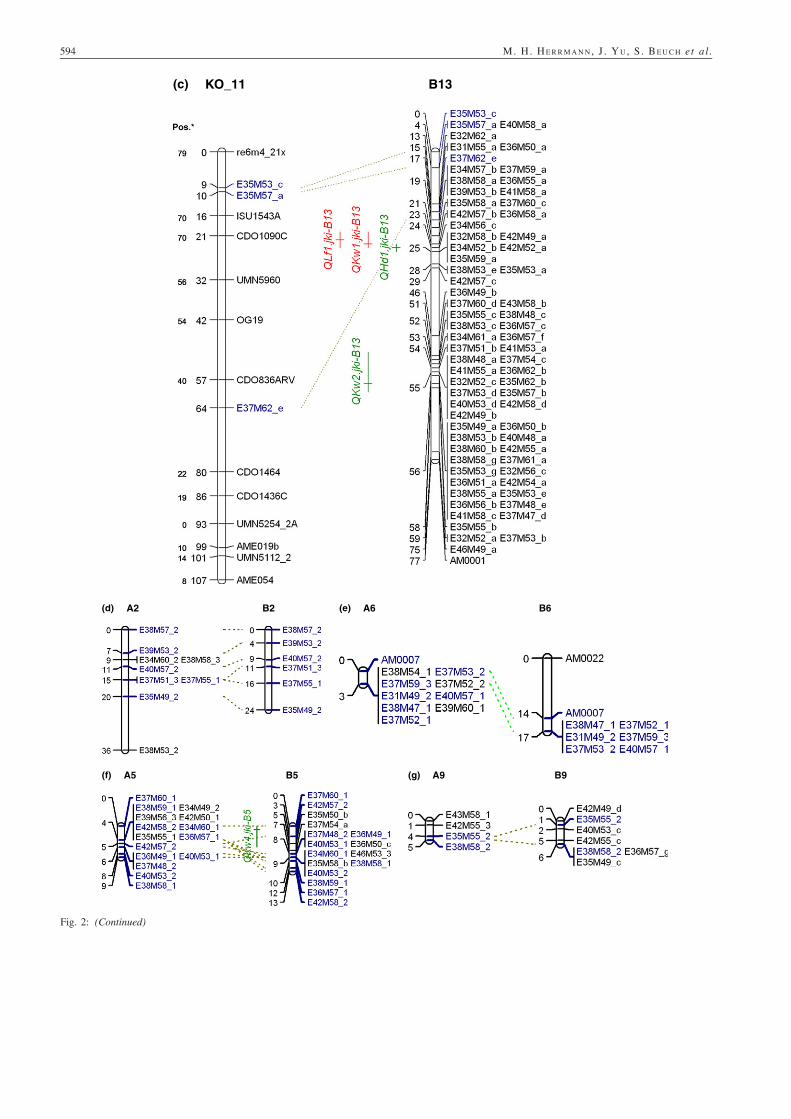
(c) KO_11 B13
(d) A2 B2 (e)
(g)(f)
A6 B6
A5 B5 A9 B9
Fig. 2: (Continued)
594 M. H. HERRMANN , J . YU , S . BEUCH e t a l .
although the LH score of ‘Iltis’ was half as high as LH of IAH611(Table 2). QTLs for LF and LH were not on the same linkagegroups, which suggests that different genes account for both traits.
Groat lipid (LP)For groat lipid content, one QTL was detected in each of thetwo populations, probably related to the same IAH611 introgres-sion in both populations (Table 5). The QTLs QLp1.jki-A1 andQLp1.jki-B1 explained 39.7% and 36.8% of the phenotypic and47.5% and 39.7% of the genotypic variances, respectively. Theadditive effects were positive, indicating lipid increasing effectsby the ‘Iltis’ allele.
Plant height (PH)The two QTLs QPh1.jki-A1 and QPh1.jki-B1 for plant heightexplained 57.4% and 37.7% of the phenotypic and 59.1% and37.0% of the genotypic variances, respectively. The ‘Iltis’ allelesincreased PH (add. eff. 5.6–6.2 cm) and the IAH611 allelereduced PH, which may reduce lodging or improve harvest index.
Powdery mildew (PM)QTLs for PM were detected on A1 and B1. QPm1.jki-A1 andQPm1.jki-B1 each explained about 45% of phenotypic variance,and 59.7% and 52.1% of the genotypic variance, respectively.The IAH611 alleles increased the infection level.
Panicle number (PN)For this trait with low heritability, the QTL QPn1.jki-A1 wasfound. It displayed a negative additive effect as a result of higherpanicle numbers per m2 of progeny with the IHA611 allele. TheQTL detected explained 35.9% of phenotypic and 80.7% of thegenotypic variance.
Groat protein (PR)There are two QTLs detected for PR, QPr1.jki-A1 and QPr1.jki-B1, presumably belonging to the same region of the homologousgroups A1 and B1. The QTLs explained 48.8% and 45.6% ofphenotypic and about 61% of the genotypic variance. TheIAH611 alleles caused an increase in PR indicated by negativeadditive effects.
Test weight (TW)Three QTLs were detected for test weight. QTw1.jki-A1,QTw2.jki-A8 and QTw1.jki-B1 explaining 46.4%, 14.7% and53.7% of the phenotypic and 52.7%, 13.7% and 63.1% of thegenotypic variances, respectively. The IAH611 alleles increasedTW and are considered valuable for selection.
Grain yield (Yd)In grain yield, two QTLs were detected in Population A and onewas detected in Population B. The most influential QTLs wereQYd1.jki-A1 and QYd1.jki-B1, explaining 41% and 40.3% of thephenotypic and 36.2% and 44.9% of the genotypic variance. Theleast effective QTL QYd2.jki-A12 showed negative additiveeffects, whereas the other two displayed positive effects. Ergo,yield enhancing alleles came from both parents.
QTL cluster
QTL clusters for several traits in both maps, mainly on linkagegroups A1, B1 and B13 and A8 (Figs 2 and 3) were detected.
On A1 at position 22 cM, the QTLs QHd1.jki-A1, QHu1.jki-A1,QKw1.jki-A1, QLh1.jki-A1, QLp1.jki-A1, QPr1.jki-A1, QTw1.jki-A1 and QYd1.jki-A1 were clustered. On B1 at position 8 cM,QTLs QBg1.jki-B1 and QLp1.jki-B1 are clustered, and in theregion from 16 to 21 cM, QKw3.jki-B1, QTw1.jki-B1, QPr1.jki-B1 and QPh1.jki-B1 are clustered. On linkage group B13, QTLsfor HD, KW and LF are clustered in the region of 22–24 cM.
DiscussionPopulations and phenotyping
To our knowledge, this is the first AB-QTL-study publishedabout oat, but comparison with studies of other self-pollinatingcrops such as barley (Pillen et al. 2003), wheat (Huang et al.2003, Narasimhamoorthy et al. 2006, Kunert et al. 2007,Buerstmayr et al. 2011) or rice (Li et al. 2004, Thomson et al.2006) is reasonable. During population development for anAB-QTL-programme, the selection and number of BC1 plantsfor the next backcrossing are crucial, because the extent of thetransferred exotic chromosomal segments to the next generationis fixed at this step. We used one BC1 plant selected forb-glucan, and two BC2 plants to develop Populations A and B.Therefore, in our study, only a part of the oat genome wasscanned for QTLs from the donor line IAH611. Despite the factthat the BC2 plants contained only a partial representation of theIAH611 genome, we found a strong segregation in all traits,even in those with small differences between the parents.The levels of BG and HD in IAH611 were higher than those
in all BC progeny that were tested. This suggests that someIAH611 alleles for these traits were not within the 37.5% of thetransferred genome or that there were epistatic interactions withloci outside of this region. An additional reason may be that seg-regation was still occurring within each of the BC2F2 progeny,leading to some heterogeneity in the BC2F2 : 5 to BC2F2 : 7
lines and a levelling of phenotypic values. Conversely, for YD,PN, LF and LH, a favourable transgressive variation within thepopulations was established.In previous results (Holthaus et al. 1996, Cervantes-Martinez
et al. 2002, Peterson et al. 2005), phenotypic correlationsbetween BG and other traits were inconsistent and strongly influ-enced by the population analysed. Considering the negative cor-relation between YD and BG, a large population is necessary toobtain a sufficiently high frequency of progeny with favourabletrait combinations. However, Cervantes-Martinez et al. (2002)and Chernyshova et al. (2007) concluded that a low negativecorrelation between grain yield and BG content was not a seri-ous obstacle to the selection of lines combining high levels ofboth traits. Beneficial trait combinations of high BG and highTW, and high PR, but low HU or LP occurs frequentlywithin the two populations, indicated by significant correlationcoefficients. In contrast to populations studied by Peterson et al.(2005) but in accordance with Welch and Lloyd (1989) orCervantes-Martinez et al. (2002), the correlation between BGand LP was negative in this study. Both traits are controlled byco-located major QTLs on KO_6 and KO_11, and further minorQTLs (Kianian et al. 1999, 2000). Within the material studied,the highest correlation coefficients were found between yieldand plant height, and yield and protein content. The latter isconsistent with numerous studies in cereals (Simmonds 1995).Mapping of underlying genes or QTLs is one strategic step todevelop lines with elevated yield and high protein content(Blanco et al. 2012, Bogard et al. 2013).
QTLs for quality and agronomic traits in oat 595
Genotyping and maps
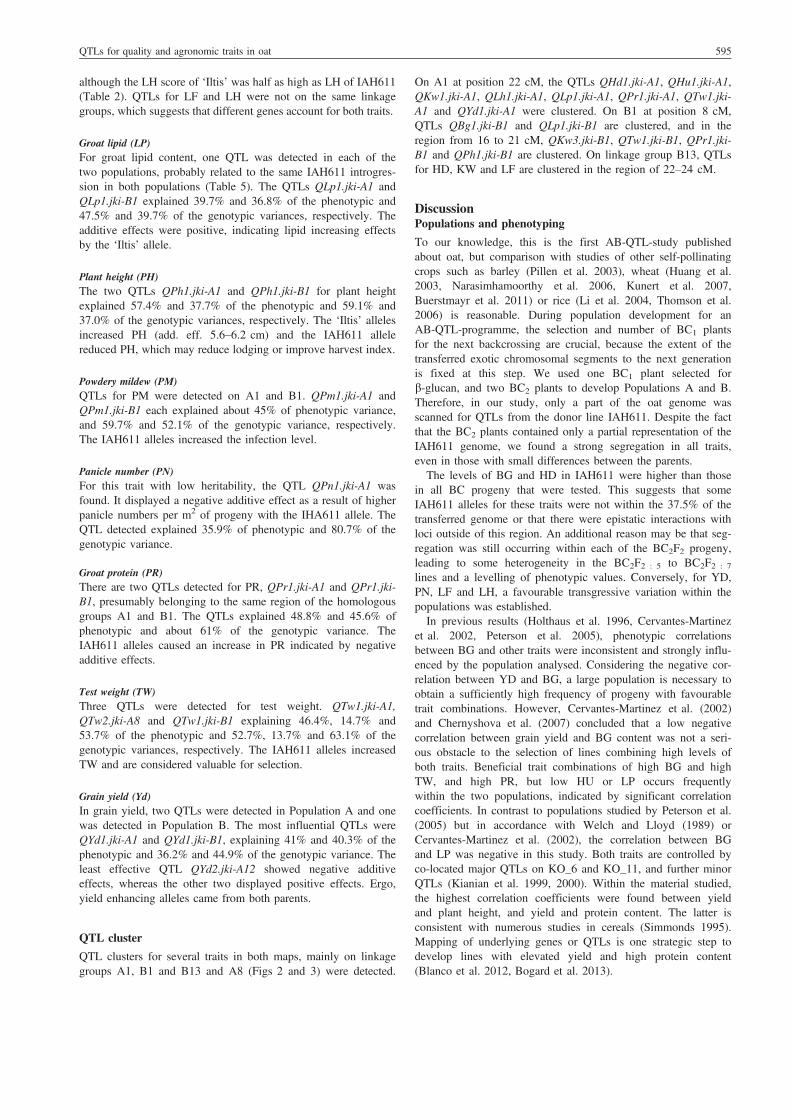
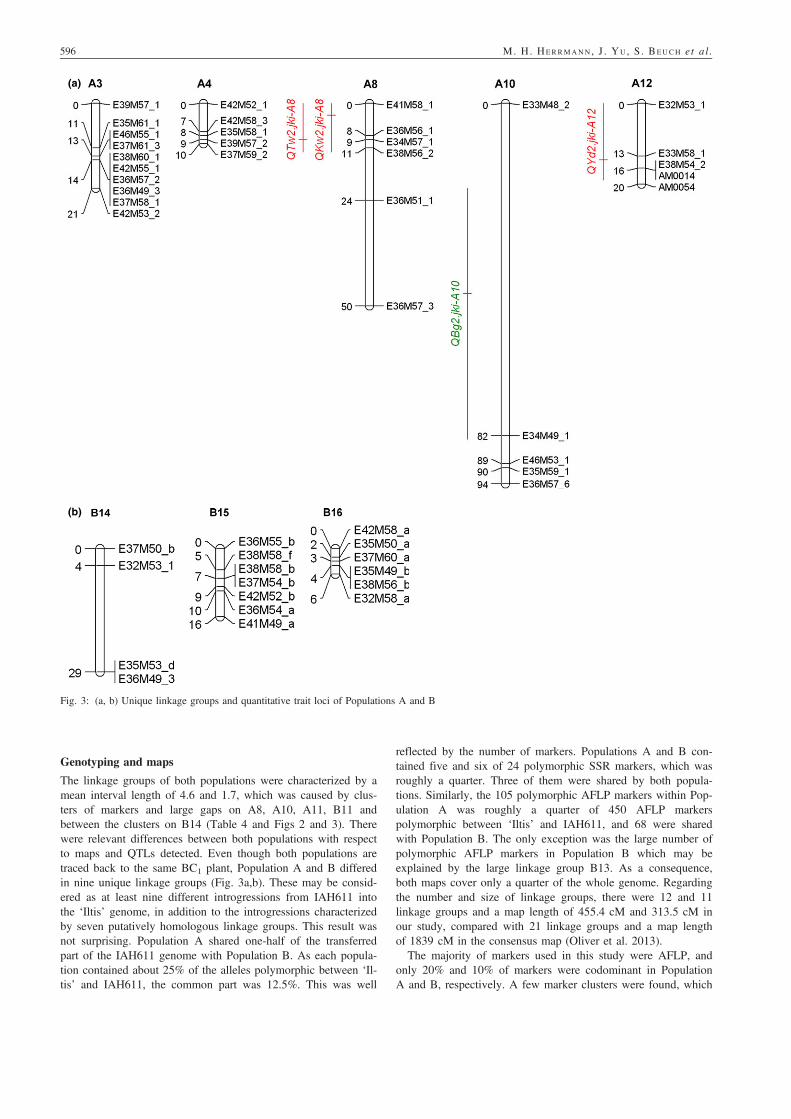
The linkage groups of both populations were characterized by amean interval length of 4.6 and 1.7, which was caused by clus-ters of markers and large gaps on A8, A10, A11, B11 andbetween the clusters on B14 (Table 4 and Figs 2 and 3). Therewere relevant differences between both populations with respectto maps and QTLs detected. Even though both populations aretraced back to the same BC1 plant, Population A and B differedin nine unique linkage groups (Fig. 3a,b). These may be consid-ered as at least nine different introgressions from IAH611 intothe ‘Iltis’ genome, in addition to the introgressions characterizedby seven putatively homologous linkage groups. This result wasnot surprising. Population A shared one-half of the transferredpart of the IAH611 genome with Population B. As each popula-tion contained about 25% of the alleles polymorphic between ‘Il-tis’ and IAH611, the common part was 12.5%. This was well
reflected by the number of markers. Populations A and B con-tained five and six of 24 polymorphic SSR markers, which wasroughly a quarter. Three of them were shared by both popula-tions. Similarly, the 105 polymorphic AFLP markers within Pop-ulation A was roughly a quarter of 450 AFLP markerspolymorphic between ‘Iltis’ and IAH611, and 68 were sharedwith Population B. The only exception was the large number ofpolymorphic AFLP markers in Population B which may beexplained by the large linkage group B13. As a consequence,both maps cover only a quarter of the whole genome. Regardingthe number and size of linkage groups, there were 12 and 11linkage groups and a map length of 455.4 cM and 313.5 cM inour study, compared with 21 linkage groups and a map lengthof 1839 cM in the consensus map (Oliver et al. 2013).The majority of markers used in this study were AFLP, and
only 20% and 10% of markers were codominant in PopulationA and B, respectively. A few marker clusters were found, which
(a)
(b)
Fig. 3: (a, b) Unique linkage groups and quantitative trait loci of Populations A and B
596 M. H. HERRMANN , J . YU , S . BEUCH e t a l .
is frequently reported in AFLP maps (Qi et al. 1998, Yu andWise 2000). Whether AFLP clusters in our study were causedby centromeric suppression of recombination, or by gene clus-ters, cannot be validated within this project because of the yetunknown position of the centromeres. With dominant markers,heterozygous plants are not observable and will be partiallyassigned to the dominant genotype. Hence, an accurate estima-tion of the QTL effects is limited.
QTL detection and comparisons to other QTL studies
It is well known that estimated QTL effects of small populationscan be upwardly biased (Sch€on et al. 2004, Vales et al. 2005).The two populations used in our study were relatively small, andthe QTL effects were presumably inflated, even though we appliedfivefold cross-validation. However, the unavoidable bias of theQTL effects needs to be considered in evaluating the unusually
Table 5: Quantitative trait loci for 13 traits measured in BC2F2 : 5 to BC2F2 : 7 subpopulations A and B of the cross of ‘Iltis’ ✕ IAH611
QTL Pos. (cM)Confidenceinterval (cM) Flanking markers LOD score1 partR^2%2 npartp%3 Add. effect FreqCV4
b-glucan (BG)QBg1.jki-A1 19 17–21 E36M55_1 E36M52_3 7.90 31.27 57.31 �0.14 0.69QBg2.jki-A10 47 21–83 E33M48_2 E34M49_1 3.51 16.27 24.18 0.17 0.36QBg1.jki-B1 8 6–9 E32M55_1 E36M56_a 3.39 24.98 31.24 �0.16 0.27
Heading (HD)QHd1.jki-A1 22 21–24 E36M52_3 E35M62_3 33.94 80.04 80.50 2.63 0.85QHd1.jki-B13 24 23–25 E34M56_c E32M58_b 8.57 42.34 28.32 1.44 0.76QHd2.jki-B1 15 14–16 E39M52_a E38M48_1 16.48 66.44 44.44 2.61 0.72
Hull content (HU)QHu1.jki-A1 22 20–24 E36M52_3 E35M62_3 11.78 39.49 46.37 1.06 0.92QHu1.jki-B1 13 12–15 E37M61_c E39M52_a 11.47 52.97 52.86 1.33 0.98QHu2.jki-B11 60 49–65 E35M55_e E37M48_c 3.05 17.08 17.05 �0.57 0.44
Kernel weight (KW)QKw1.jki-A1 22 20–25 E36M52_3 E35M62_3 15.97 53.15 58.59 �1.47 0.98QKw2.jki-A8 3 0–12 E41M58_1 E36M56_1 2.73 12.06 11.35 �0.63 0.34QKw1.jki-B13 23 20–24 E42M57_b E34M56_c 8.46 50.42 28.38 �1.20 1.00QKw2.jki-B13 58 50–60 E35M55_b E37M53_b 3.86 17.61 9.91 0.51 0.74QKw3.jki-B1 17 16–21 E37M47_c E37M47_b 13.37 63.05 35.49 �1.65 1.00QKw4.jki-B5 1 0–6 E37M60_1 E42M57_2 3.14 18.88 10.63 0.64 0.58
Lodging at flowering (LF)QLf1.jki-B13 22 20–24 E35M58_a E42M57_b 2.66 42.77 83.89 �0.66 0.27
Lodging before harvest (LH)QLh1.jki-A1 22 20–25 E36M52_3 E35M62_3 4.33 18.57 58.04 0.35 0.70QLh1.jki-B1 12 9–14 E36M56_a E37M61_c 5.20 28.28 45.97 0.53 0.97
Groat lipid (LP)QLp1.jki-A1 22 20–25 E36M52_3 E35M62_3 10.65 39.69 47.53 0.23 0.49QLp1.jki-B1 8 7–13 E32M55_1 E36M56_a 2.66 36.76 39.69 0.32 0.34
Plant height (PH)QPh1.jki-A1 26 24–27 E37M59_1 E34M62_1 17.96 57.37 59.13 5.62 0.90QPh1.jki-B1 20 16–21 E37M47_c E37M47_b 7.39 37.72 37.03 6.17 1.00
Powdery mildew (PM)QPm1.jki-A1 26 25–28 E37M59_1 E34M62_1 12.95 45.93 59.71 �0.57 0.97QPm1.jki-B1 15 14–16 E39M52_a E38M48_1 9.44 45.34 52.09 �0.68 0.78
Panicle number (PN)QPn1.jki-A1 25 24–27 E39M53_3 E37M59_1 9.37 35.90 80.69 �23.08 0.99
Groat protein (PR)QPr1.jki-A1 22 20–24 E36M52_3 E35M62_3 14.11 48.84 61.85 �0.76 0.96QPr1.jki-B1 19 16–21 E37M47_c E37M47_b 9.88 45.62 60.33 �0.65 1.00
Test weight (TW)QTw1.jki-A1 22 20–25 E36M52_3 E35M62_3 13.13 46.38 52.67 �0.98 0.97QTw2.jki-A8 9 0–12 E34M57_1 E38M56_2 3.45 14.71 13.65 �0.53 0.72QTw1.jki-B1 17 16–21 E37M47_c E37M47_b 12.04 53.71 63.10 �1.10 0.70
Grain yield (YD)QYd1.jki-A1 22 20–23 E36M52_3 E35M62_3 9.50 41.00 36.22 3.25 0.99QYd2.jki-A12 14 0–19 E33M58_1 E38M54_2 3.23 13.91 12.29 �1.66 0.76QYd1.jki-B1 13 9–15 E37M61_c E39M52_a 8.07 40.32 44.87 3.07 1.00
1LOD in the scanning profile.2partR^2% = coefficient of determination between the respective QTL and the phenotypic observations, keeping all other QTL effects fixed.3npartp% = by the detected QTL explained normalized part of the genetic variance in%.4FreqCV = QTL frequency after cross-validation.
QTLs for quality and agronomic traits in oat 597
high portions of genotypic and phenotypic variances explained bythe QTLs. Comparing final QTL results (Table 5) with QTLsdetected by initial SIM runs (results not shown) with PLABQTLshows only QTLs most stable over environments remained aftermBIC runs. For this reason, and because of the reduced genomecoverage in the BC2, the number of QTLs for quantitative traitssuch as YD, PR or BG was low compared with some other stud-ies. An estimation of QTLs for each environment via SIM in PLA-BQTL yielded additional QTLs of minor effects in most traits(results not shown), which we do not consider to be relevant forapplication in oat improvement.Some of the QTLs identified in this work possibly showed
homology with previously detected QTLs. The locus Xcdo82 onKO_6 is linked to a QTL for BG (Kianian et al. 2000), locatedvery close to E37M59_d at linkage group KO_6b and B1, 14 cMdistal from QBg1.jki-B1. Furthermore, QTLs for HD, PH and YDwere clustered on KO_6 (Beer et al. 1997), similar to the linkagegroups A1 and B1. According to Siripoonwiwat et al. (1996),Holland et al. (2002) and Nava et al. (2012), two of four majorQTL regions for flowering-time or genes for vernalizationresponse are mapped on KO_6 and KO_11. The QTL regions forHD on A1, B1 and B13 in this study are probably homologous tothose on KO_6 and KO_11, respectively. On linkage groupKO_11 and its homologous OM3 of the Ogle 9 ‘MAM17-5’map (Zhu and Kepler 2003), important QTLs for BG, PR, LP,TW, HD, PH, LH and YD were mapped (Kianian et al. 2000)and confirmed for LP by Hizbai et al. (2012). In our study, onlyQTLs for HD, KW and LF on B13 were detected. Zhu et al.(2004), and Kianian et al. (1999) found co-located QTLs for pro-tein and oil on OM3 and its homologous KO_11, respectively,whereas in this study no respective QTLs were detected withPLABMQTL. In initial runs of SIM in PLABQTL, BG, PR andLP-QTLs were detected on B13. Thus, the Bayesian informationcriterion applied in the runs with PLABMQTL may have beentoo conservative, as has been already indicated by Utz (2011) anddemonstrated by Piepho and Gauch (2001). On the other hand,for small-sized QTL populations (like ours), Utz recommends amore conservative method (personal communication). For linkagegroups A11 and B11, putatively homologous to KO_36, the onlyQTL detected was for HU on the distal part of B11.In this study, most QTLs were co-located with others in a few
clusters on four linkage groups. QTL clustering was often foundin QTL studies and may be caused by pleiotropic genes or tightlinkage of different genes (Siripoonwiwat et al. 1996, Cai andMorishima 2002, Juenger et al. 2005, Gu et al. 2012). Fine map-ping and sequencing of QTL regions enabled a better insightinto the molecular composition of QTLs. Pleiotropic genes havebeen suggested to be the cause of QTL clusters in Avena barba-ta (Latta and Gardner 2009), in tomato (Frary et al. 2004), inrice (Fan et al. 2006, Xue et al. 2008, Ding et al. 2011, Shenet al. 2011, Wang et al. 2012), in Brassica napus (Shi et al.2009) and in maize (Huang et al. 2010). Alternatively, severalfine mapping studies have revealed clusters of different genes orsub-QTLs underlying major QTLs (Thomson et al. 2006, Kho-waja et al. 2009, Zhou et al. 2010). In this study, it remainsunknown whether pleiotropic genes, tightly linked sub-QTLs, ora combination of both were responsible for the clusters.In AB-QTL studies in wheat (Huang et al. 2003, Kunert
et al. 2007) and barley (Pillen et al. 2003), the exotic alleles in34–60% of the QTLs displayed positive effects. In our study,valuable alleles from IAH611 were detected in BG, HD, LPand PR as expected considering the phenotypic values of thisoat line. But further unexpected favourable QTL alleles were
found, such as the ‘Iltis’ allele of QTL QBg2.jki-A10, the IAH611allele of QTL QYd2.jki-A12 with a yield increasing effect, andfour QTLs for KW showing negative additive effects. Only a partof the IAH611 genome could be analysed, but this part of thegenome contained valuable alleles in QTLs of 6 of 13 traits. Thisis in agreement with findings in studies of other crops which con-cluded (Grandillo and Tanksley 2006) that valuable hidden allelescan be found in high frequencies by AB-QTL analysis.In summary, the AB-QTL method applied here has identified
valuable alleles contributed by the GenBank accession IAH611in two small QTL populations, and new breeding strains havebeen developed with valuable trait combinations. To overcomethe linkage drag associated with IAH611 introgressions, furtherbackcrossings and larger segregating populations must be devel-oped. Additionally, more cost-effective and polymorphic molecu-lar markers are needed to assist backcrossing. Recent markertechnologies such as SNP detection via genotyping-by-sequenc-ing (GBS) are expected to meet this requirement.
Acknowledgments
This research was funded by the BMBF (Federal Ministry of Educationand Research). We sincerely thank C. Wight and N. Tinker (Agricultureand Agri-Food Canada, Ottawa, Ontario) for providing the KO popula-tion and mapping data, P. Wehling and B. Hackauf for supporting theproject, and H. F. Utz (University of Hohenheim) for providing the soft-ware and helpful comments in QTL mapping with PLABMQTL.
ReferencesAmes, N., C. Rhymer, and J. Mitchell-Fetch, 2006: Near-Infrared Reflec-tance Spectroscopy for the determination of fiber in oats. AmericanOat Workers Conference, Fargo, ND, USA, poster.
Baierl, A., M. Bogdan, F. Frommlet, and A. Futschik, 2006: On locatingmultiple interacting quantitative trait loci in intercross designs. Genet-ics 173, 1693—1703.
Baur, S. K., and G. Geisler, 1996: Variability of the b-glucan content inoat caryopsis of 132 cultivated-oat genotypes and 39 wild-oat geno-types. J. Agron. Crop Sci. 176, 151—157.
Becher, R., 2007: EST-derived microsatellites as a rich source of molecu-lar markers for oats. Plant Breeding 126, 274—278.
Beer, S. C., W. Siripoonwiwat, E. O’Donoughue, D. Matthews, and M.E. Sorrells, 1997: Associations between molecular markers and quanti-tative traits in an oat germplasm pool: can we infer linkages? J AgricGenomics, vol 2, article 3. published with permission from CAB Inter-national. Full text available from http://www.cabi-publishing.org/JAG.
Blanco, A., G. Mangini, A. Giancaspro, S. Giove, P. Colasuonno, R.Simeone, A. Signorile, P. Vita, A. M. Mastrangelo, L. Cattivelli, andA. Gadaleta, 2012: Relationships between grain protein content andgrain yield components through quantitative trait locus analyses in arecombinant inbred line population derived from two elite durumwheat cultivars. Mol. Breeding 30, 79—92.
Bogard, M. V., P. Allard, E. Martre, J. W. Heumez, S. Snape, S. Orford,O. Griffiths, J. Gaju, J. Foulkes, and J. Gouis, 2013: Identifying wheatgenomic regions for improving grain protein concentration indepen-dently of grain yield using multiple inter-related populations. Mol.Breeding 31, 587—599.
Buerstmayr, M., M. Lemmens, B. Steiner, and H. Buerstmayr, 2011:Advanced backcross QTL mapping of resistance to Fusarium headblight and plant morphological traits in a Triticum macha X T. aes-tivum population Theor. Appl. Genet. 123, 293—306.
Cai, H. W., and H. Morishima, 2002: QTL clusters reflect character associ-ations in wild and cultivated rice. Theor. Appl. Genet. 104, 1217—1228.
Cervantes-Martinez, C. T., K. J. Frey, P. J. White, D. M. Wesenberg,and J. B. Holland, 2002: Correlated responses to selection for greaterb-glucan content in two oat populations. Crop Sci. 42, 730—738.
598 M. H. HERRMANN , J . YU , S . BEUCH e t a l .
Chernyshova, A. A., P. J. White, M. P. Scott, and J. Jannink, 2007:Selection for nutritional function and agronomic performance in oat.Crop Sci. 47, 2330—2339.
Collard, B. C., and D. J. Mackill, 2008: Marker-assisted selection: anapproach for precision plant breeding in the twenty-first century. Phil.Trans. R. Soc. B. 363, 557—572.
Ding, X., X. Li, and L. Xiong, 2011: Evaluation of near-isogenic linesfor drought resistance QTL and fine mapping of a locus affecting flagleaf width, spikelet number, and root volume in rice. Theor. Appl.Genet. 123, 815—826.
European Commission, 2011: Commission Regulation (EU) No 1160/2011 of 14 November 2011 on the authorisation and refusal of authori-sation of certain health claims made on foods and referring to the reduc-tion of disease risk, Official Journal of the European Union, L 296/26.
Fan, C. C., Y. Z. Xing, H. L. Mao, T. T. Lu, B. Han, C. G. Xu, X. H.Li, and Q. F. Zhang, 2006: GS3, a major QTL for grain length andweight and minor QTL for grain width and thickness in rice, encodesa putative transmembrane protein. Theor. Appl. Genet. 112, 1164—1171.
FDA, 1997: 21 CFR Part 101. Food labeling, health claims: soluble die-tary fiber from certain foods and coronary heart disease. Fed. Reg. 62,3584—3601.
Frary, A., L. A. Fritz, and S. D. Tanksley, 2004: A comparative study ofthe genetic bases of natural variation in tomato leaf, sepal, and petalmorphology. Theor. Appl. Genet. 109, 523—533.
Grandillo, S., and S. D. Tanksley, 2006: Advanced backcross QTLanalysis: results and perspectives. In: R. Tuberosa, R. L. Phillips, andM. Gale (eds), Proceedings of the International Congress ‘In the Wakeof the Double Helix: From the Green Revolution to the Gene Revolu-tion’, 27–31 May 2003, , 115—132. Bologna, Italy
Groh, S., S. F. Kianian, R. L. Phillips, H. W. Rines, D. D. Stuthman, D.M. Wesenburg, and R. G. Fulcher, 2001: Analysis of factors influenc-ing milling yield and their association to other traits by QTL analysisin two hexaploid oat populations. Theor. Appl. Genet. 103, 9—18.
Gu, J., X. Yin, P. C. Struik, T. J. Stomph, and H. Wang, 2012: Usingchromosome introgression lines to map quantitative trait loci for pho-tosynthesis parameters in rice (Oryza sativa L.) leaves under droughtand well-watered field conditions. J. Exp. Bot. 63, 455—469.
Gupta, P. K., J. Kumar, R. R. Mir, and A. Kumar, 2009: Marker-assistedselection as a component of conventional plant breeding. Plant BreedRev. 33, 145—217.
Hampshire J., 2004: Variation in the content of nutrients in oats and itsrelevance for the production of cereal products. In: P. Peltonen-Sainio,and M. Topi-Hulmi (eds), Proceedings of the 7th International OatConference. Helsinki, Finland, p. 26. Jokioinen, MTT AgrifoodResearch Finland, Agrifood Research Reports 51.
Hizbai, B. T., K. M. Gardner, C. P. Wight, R. K. Dhanda, S. J. Molnar,D. Johnson, J. Fr�egeau-Reid, W. Yan, B. G. Rossnagel, J. B. Holland,and N. A. Tinker, 2012: Quantitative trait loci affecting oil content, oilcomposition, and other agronomically important traits in oat. PlantGen. 5, 164—175. doi:10.3835/plantgenome2012.07.0015.
Holland, J. B., S. J. Helland, N. Sharopova, and D. C. Rhyne, 2001:Polymorphism of PCR-based markers targeting exons, introns, pro-moter regions, and SSRs in maize and introns and repeat sequences inoat. Genome 44, 1065—1076.
Holland, J. B., V. A. Portyanko, D. L. Hoffman, and M. Lee, 2002:Genomic regions controlling vernalization and photoperiod responsesin oat. Theor. Appl. Genet. 105, 113—126.
Holthaus, J. F., J. B. Holland, P. J. White, and K. J. Frey, 1996: Inheri-tance of b-glucan content of oat grain. Crop Sci. 36, 567—572.
Huang, X. Q., H. C€oster, M. W. Ganal, and M. S. R€oder, 2003:Advanced backcross QTL analysis for the identification of quantitativetrait loci alleles from wild relatives of wheat (Triticum aestivum L.).Theor. Appl. Genet. 106, 1379—1389.
Huang, Y. F., D. Madur, V. Combes, C. L. Ky, D. Coubriche, P. Jamin,S. Jouanne, F. Dumas, E. Bouty, P. Bertin, A. Charcosset, andL. Moreau, 2010: The genetic architecture of grain yield and relatedtraits in Zea maize L. revealed by comparing intermated and conven-tional populations. Genetics 186, 395—404.
Jin, H., L. L. Domier, X. J. Shen, and F. L. Kolb, 2000: CombinedAFLP and RFLP mapping in two hexaploid oat recombinant inbredpopulations. Genome 43, 94—101.
Juenger, T., J. M. P�erez-P�erez, S. Bernal, and J. L. Micol, 2005: Quanti-tative trait loci mapping of floral and leaf morphology traits in Arabid-opsis thaliana: evidence for modular genetic architecture. Evol. Dev.7, 259—271.
Khowaja, F. S., G. J. Norton, B. Courtois, and A. H. Price, 2009:Improved resolution in the position of drought-related QTLs in a sin-gle mapping population of rice by meta-analysis. BMC Genomics 10,276. doi:10.1186/1471-2164-10-276.
Kianian, S. F., M. A. Egli, R. L. Phillips, H. W. Rines, D. A. Somers,B. G. Gengenbach, F. H. Webster, S. M. Livingston, S. Groh, L. S.O’Donoughue, M. E. Sorrells, D. M. Wesenberg, D. D. Stuthman, andR. G. Fulcher, 1999: Association of a major groat oil content QTLand an acetyl-CoA carboxylase gene in oat. Theor. Appl. Genet. 98,884—894.
Kianian, S. F., R. L. Phillips, H. W. Rines, R. G. Fulcher, F. H. Webster,and D. D. Stuthman, 2000: Quantitative trait loci influencing b-glucancontent in oat (Avena sativa, 2n = 6x = 42). Theor. Appl. Genet. 101,1039—1048.
Kosambi, D. D., 1944: The estimation of map distances from recombina-tion values. Ann. Eugen. 12, 172—175.
Kunert, A., A. A. Naz, O. Dedeck, K. Pillen, and J. L�eon, 2007: AB-QTL analysis in winter wheat: I. Synthetic hexaploid wheat (T. turgi-dum ssp dicoccoides ✕ T. tauschii) as a source of favourablealleles for milling and baking quality traits. Theor. Appl. Genet. 115,683—695.
Latta, R. G., and K. M. Gardner, 2009: Natural selection on pleiotropicquantitative trait loci affecting a life history trade-off in Avena barba-ta. Evolution 63, 2153—2163.
Li, C. D., B. G. Rossnagel, and G. J. Scoles, 2000: The development ofoat microsatellite markers and their use in identifying relationshipsamong Avena species and oat cultivars. Theor. Appl. Genet. 101,1259—1268.
Li, J., J. Xiao, S. Grandillo, L. Jiang, Y. Wan, Q. Deng, L. Yuan, and S.McCouch, 2004: QTL detection for rice grain quality traits usingan interspecific back cross population derived from cultivatedAsian (O. sativa L.) and African (O. glaberrima S.) rice. Genome 47,697—704.
Lim, H. S., P. J. White, and K. J. Frey, 1992: Genotypic effects onb-glucan content of oat lines grown in two consecutive years. CerealChem. 69, 262—265.
McCleary, B. V., and M. Glennie-Holmes, 1985: Enzymic quantification of(1–3), (1–4)-b-D-glucan in barley and malt. J. Inst. Brew 91, 285—295.
Miller, S. S., D. J. Vincent, J. Weisz, and R. G. Fulcher, 1993a: Oat b-glucan: an evaluation of eastern Canadian cultivars and unregisteredlines. Can. J. Plant Sci. 73, 429—436.
Miller, S. S., P. J. Wood, L. N. Pietrzak, and R. G. Fulcher, 1993b:Mixed linkage b-glucan, protein content, and kernel weight in Avenaspecies. Cereal Chem. 70, 231—233.
Narasimhamoorthy, B., B. S. Gill, A. K. Fritz, J. C. Nelson, and G. L.Brown-Guedira, 2006: Advanced backcross QTL analysis of a hardwinter wheat 9 synthetic wheat population. Theor. Appl. Genet. 112,787—796.
Nava, I. C., C. P. Wight, M. T. Pacheco, L. C. Federizzi, and N. A.Tinker, 2012: Tagging and mapping candidate loci for vernalizationand lower initiation in hexaploid oat. Mol. Breeding 30, 1295—1312.
Newell, M. A., F. G. Asoro, M. P. Scott, P. J. White, W. D. Beavis, andJ. L. Jannink, 2012: Genome-wide association study for oat (Avena sa-tiva L.) b-glucan concentration using germplasm of worldwide origin.Theor. Appl. Genet. 125, 1687—1696.
O’Donoughue, L. S., Z. Wang, M. Röder, B. Kneen, M. Leggett, M. E.Sorrells, and S. D. Tanksley, 1992: An RFLP linkage map of oatsbased on a cross between two diploid taxa (Avena atlantica 9
A. hirtula). Genome 35, 765—771.O’Donoughue, L. S., S. F. Kianian, P. J. Rayapati, G. A. Penner, M. E.Sorrells, S. D. Tanksley, R. L. Phillips, H. W. Rines, M. Lee, G. Fe-
QTLs for quality and agronomic traits in oat 599
dak, S. J. Molnar, D. Hoffman, C. A. Salas, B. Wu, E. Autrique, andA. Van Deynze, 1995: A molecular linkage map of cultivated oat.Genome 38, 368—380.
Oliver, R. E., D. E. Obert, G. Hu, J. M. Bonman, E. O’Leary-Jepsen,and E. W. Jackson, 2010: Development of oat-based markers frombarley and wheat microsatellites. Genome 53, 458—471.
Oliver, R. E., N. A. Tinker, G. R. Lazo, S. Chao, E. N. Jellen, M. L.Carson, H. W. Rines, D. E. Obert, J. D. Lutz, I. Shackelford, A. B.Korol, Ch. P. Wight, K. M. Gardner, J. Hattori, A. D. Beattie, Å.Bjørnstad, J. M. Bonman, J.-L. Jannink, M. E. Sorrells, G. L. Brown-Guedira, J. W. Mitchell Fetch, St. A. Harrison, C. J. Howarth, A. Ibra-him, F. L. Kolb, M. S. McMullen, J. P. Murphy, H. W. Ohm, B. G.Rossnagel, W. Yan, K. J. Miclaus, J. Hiller, P. J. Maughan, R. R.Redman Hulse, J. M. Anderson, E. Islamovic, and E. W. Jackson,2013: SNP discovery and chromosome anchoring provide the firstphysically-anchored hexaploid oat map and reveal synteny with modelspecies. PLoS ONE 8, e58068. doi:10.1371/journal.pone.0058068.
Orr, W., and S. J. Molnar, 2008: Development of PCR-based SCAR andCAPS markers linked to b-glucan and protein content QTL regions inoat. Genome 51, 421—425.
Pal, N., J. S. Sandhu, L. L. Domier, and F. L. Kolb, 2002: Developmentand characterization of microsatellite and RFLP-derived PCR markersin oat. Crop Sci. 42, 912—918.
Peterson, D. M., 1991: Genotype and environment effects on oat b-glu-can concentration. Crop Sci. 31, 1517—1520.
Peterson, D. M., D. E. Wesenberg, H. E. Bockelman, K. D. Gilchrist,and L. L. Herrin, 1996: Quality trait evaluation in oat and barleygermplasm from the USDA-ARS National Small Grains Collection. In:Proceedings V. International Oat Conference and VII. InternationalBarley Genetics Symposium. Jul. 30 - Aug. 6, 1996; Vol. 1, PosterSession, 206–208.
Peterson, D. M., D. E. Wesenberg, D. E. Burrup, and C. A. Erickson, 2005:Relationships among agronomic traits and grain composition inoat genotypes grown in different environments. Crop Sci. 45, 1249—1255.
Piepho, H.-P., and H. G. Gauch, 2001: Marker pair selection for map-ping quantitative trait loci. Genetics 157, 433—444.
Pillen, K., A. Zacharias, and J. L�eon, 2003: Advanced backcross QTLanalysis in barley (Hordeum vulgare L.). Theor. Appl. Genet. 107,340—352.
Qi, X., P. Stam, and P. Lindhout, 1998: Use of locus-specific AFLPmarkers to construct a high-density molecular map in barley. Theor.Appl. Genet. 96, 376—384.
Rampitsch, C., B. Bizimungu, N. Ames, and L. Rothwell, 2006: Earlygeneration b-glucan selection in oat using a monoclonal antibody-based enzyme-linked immunosorbent assay. Cereal Chem. J. 83,510—512.
Saghai-Maroof, M. A., K. M. Soliman, R. A. Jorgensen, and R. W. Al-lard, 1984: Ribosomal DNA spacer-length polymorphism in barley:Mendelian inheritance, chromosomal locations and population dynam-ics. Proc. Natl Acad. Sci. USA 81, 8014—8018.
Sch€on, C. C., H. F. Utz, S. Groh, B. Truberg, S. Openshaw, and A. E.Melchinger, 2004: Quantitative trait locus mapping based on resam-pling in a vast maize testcross experiment and its relevance to quan-titative genetics for complex traits. Genetics 167, 485—498.
Schrickel, D. J., V. D. Burrows, and J. A. Ingemansen, 1992: Harvesting,storing, and feeding of oat. In: H. G. Marshall, and M. E. Sorrells(eds), Oat Science and Technology. Monograph 33, Agronomy series,223—245. ASA and CSSA, Madison
Shen, B., W. D. Yu, J. H. Du, Y. Y. Fan, J. R. Wu, and J. Y. Zhuang,2011: Validation and dissection of quantitative trait loci for leaf traitsin interval RM4923-RM402 on the short arm of rice chromosome 6. J.Genet. 90, 39—44.
Shi, J., R. Li, D. Qiu, C. Jiang, Y. Long, C. Morgan, I. Bancroft, J.Zhao, and J. Meng, 2009: Unraveling the complex trait of crop yieldwith quantitative trait loci mapping in Brassica napus. Genetics 182,851—861.
Simmonds, N. W., 1995: The relation between yield and protein in cerealgrain. J. Sci. Food Agric. 67, 309—315.
Siripoonwiwat, W., L. S. O’Donoughue, D. Wesenberg, D. L. Hoffman,J. F. Barbosa-Nieto, and M. E. Sorrells, 1996: Chromosomal regionsassociated with quantitative traits in oat. J. Quant. Trait Loci 2, 3.
Tanhuanp€a€a, P., O. Manninen, and E. Kiviharju, 2010: QTLs for impor-tant breeding characteristics in the doubled haploid oat progeny.Genome 53, 482—493.
Tanhuanp€a€a, P., O. Manninen, A. Beattie, P. Eckstein, G. Scoles, B.Rossnagel, and E. Kiviharju, 2012: An updated doubled haploid oatlinkage map and QTL mapping of agronomic and grain quality traitsfrom Canadian field trials. Genome 55, 289—301.
Tanksley, S. D., and C. L. Nelson, 1996: Advanced backcross QTLanalysis: a method for the simultaneous discovery and transfer of valu-able QTLs from unadapted germplasm into elite breeding lines. Theor.Appl. Genet. 92, 191—203.
Tanksley, S. D., S. Grandillo, T. M. Fulton, D. Zamir, Y. Eshed, V. Pet-iard, J. Lopez, and T. Beck-Bunn, 1996: Advanced backcross QTLanalysis in a cross between an elite processing line of tomato and itswild relative L. pimpinellifolium. Theor. Appl. Genet. 92, 213—224.
Thomson, M. J., J. D. Edwards, E. M. Septiningsih, S. E. Harrington, andS. R. McCouch, 2006: Substitution mapping of dth1.1, a flowering-time quantitative trait locus (QTL) associated with transgressive varia-tion in rice, reveals multiple sub-QTL. Genetics 172, 2501—2514.
Tinker, N. A., A. Kilian, C. P. Wight, K. Heller-Uszynska, P. Wenzyl,H. W. Rines, �A. Bjørnstad, C. J. Howarth, J. L. Jannink, J. M. Ander-son, B. G. Rossnagel, D. D. Stuthman, M. E. Sorrells, E. W. Jackson,S. Tuvesson, F. L. Kolb, O. Olsson, L. C. Federizzi, M. L. Carson, H.W. Ohm, S. J. Molnar, G. J. Scoles, P. E. Eckstein, M. J. Bonman, A.Ceplitis, and T. Langdon, 2009: New DArT markers for oat provideenhanced map coverage and global germplasm characterization. BMCGenomics 10, 39.
Utz, H. F., 2001: PLABSTAT: A Computer Program for StatisticalAnalysis of Plant Breeding Experiments, Version 2P. Institute of PlantBreeding, Seed Science, and Population Genetics, University ofHohenheim, Stuttgart, Germany.
Utz, H. F., 2011: PLABMQTL - Software for meta-QTL analysis withcomposite interval mapping. Version 0.9. Institute of Plant Breeding,Seed Science, and Population Genetics, University of Hohenheim.
Utz, H. F., and A. E. Melchinger, 2006: PLABQTL, a computer programto map QTL, version 1.2, 2006-06-01 Institute of Plant Breeding, SeedScience, and Population Genetics, University of Hohenheim, D-70593Stuttgart, Germany.
Vales, M. I., C. C. Sch€on, F. Capettini, X. M. Chen, A. E. Corey, D. E.Mather, C. C. Mundt, K. L. Richardson, J. S. Sandoval-Islas, H. F.Utz, and P. M. Hayes, 2005: Effect of population size on the estima-tion of QTL: a test using resistance to barley stripe rust. Theor. Appl.Genet. 111, 1260—1270.
Van Ooijen, J. W., and R. E. Voorrips, 2001: JoinMap version 3.0, soft-ware for the calculation of genetic linkage maps. Plant Research Inter-national, Wageningen.
Voorrips, R. E., 2006: MapChart 2.2: software for the graphical presenta-tion of linkage maps and QTLs. Plant Research International,Wageningen.
Vos, P., R. Hogers, M. Bleeker, M. Reijans, T. van de Lee, M. Horens,A. Frijters, J. Pot, J. Peleman, M. Kuiper, and M. Zabeau, 1995:AFLP: a new technique for DNA fingerprinting. Nucleic Acids Res.23, 4407—4414.
Wang, P., G. L. Zhou, K. H. Cui, Z. K. Li, and S. B. Yu, 2012: Clus-tered QTL for source leaf size and yield traits in rice (Oryza sativaL.). Mol. Breed. 29, 99—113.
Welch, R. W., 1990: Hypocholesterolaemic and other responses to oatbran intake in humans. Proc. Nutr. Soc. 49, 50.
Welch, R. W., and J. D. Lloyd, 1989: Kernel (1?3), (1?4)-b-D-glucancontent of oat genotypes. J. Cereal Sci. 9, 35—40.
Welch, R. W., J. C. W. Brown, and J. M. Leggett, 2000: Interspecificand intraspecific variation in grain and groat characteristics of wild oat(Avena) Species: very high groat (1?3), (1?4)-b-D-glucan in anAvena atlantica genotype. J. Cereal Sci. 31, 273—279.
Wight, C. P., N. A. Tinker, S. F. Kianian, M. E. Sorrells, L. S. O’Don-oughue, D. L. Hoffman, S. Groh, G. J. Scoles, C. D. Li, F. H. Web-
600 M. H. HERRMANN , J . YU , S . BEUCH e t a l .
ster, R. L. Phillips, H. W. Rines, S. M. Livingston, K. C. Armstrong,G. Fedak, and S. J. Molnar, 2003: A molecular marker map in ‘Kano-ta’ x ‘Ogle’ hexaploid oat (Avena spp.) enhanced by additional mark-ers and a robust framework. Genome 46, 28—47.
Wood, P. J., 2007: Cereal b-glucans in diet and health. J. Cereal Sci. 46,230—238.
Xue, W., Y. Xing, X. Weng, Y. Zhao, W. Tang, L. Wang, H. Zhou, S.Yu, C. Xu, X. Li, and Q. Zhang, 2008: Natural variation in Ghd7 isan important regulator of heading date and yield potential in rice. Nat.Genet. 40, 761—767.
Yu, G. X., and R. P. Wise, 2000: An anchored AFLP- and retrotranspo-son-based map of diploid Avena. Genome 43, 736—749.
Zhou, L., Y. W. Zeng, W. W. Zheng, B. Tang, S. M. Yang, H. L.Zhang, J. J. Li, and Z. C. Li, 2010: Fine mapping a QTL qCTB7 forcold tolerance at the booting stage on rice chromosome 7 using anear-isogenic line. Theor. Appl. Genet. 121, 895—905.
Zhu, S., and H. F. Kaeppler, 2003: A genetic linkage map for hexaploid,cultivated oat (Avena sativa L.) based on an intraspecific cross ‘Ogle/MAM17-5’. Theor. Appl. Genet. 107, 26—35.
Zhu, S., B. G. Rossnagel, and H. F. Kaeppler, 2004: Genetic analysis ofquantitative trait loci for groat protein and oil content in oat. Crop Sci.44, 254—260.
Supporting InformationAdditional Supporting Information may be found in the online version ofthis article:Table S1. Mean b-glucan content (BG) of oat cultivars and accessionsgrown at Granskevitz and Grob L€usewitz in 2000Table S2. Mean b-glucan content (BG) of BC1F2 and parental cultivarsgrown at Granskevitz in 2000Table S3. Mean BG values of oat cultivars and accessions based ongrowing at Granskevitz and Groß L€usewitz from 2001 to 2003 (LSD5% = 0.24)Table S4. 96 RIL of the ‘Kanota’/‘Ogle’ cross and 353 marker data,compiled from Siripoonwiwat et al. (1996) and Becher (2007), andAFLP markers polymorphic between ‘Kanota’ and ‘Ogle’
QTLs for quality and agronomic traits in oat 601