quantitative structure activity relationships for substituted naloxone benzoylhydrazones....
TRANSCRIPT

Quantitative Structure Activity Relationships for SubstitutedNaloxone Benzoylhydrazones. 40-substituted NaloxoneBenzoylhydrazones
Marvin Charton*1, Grazyna R. Ciszewska2, James Ginos2, Kelly M. Standifer2, Andrew I. Brooks2, George P. Brown2, Jennifer P.
Ryan-Moro2 and Gavril W. Pasternak*2,3
1Department of Chemistry, Pratt Institut, Brooklyn, NY; 2The Cotzias Laboratory of Neuro-Oncology, Memorial Sloan-Kettering Cancer
Center; 3Departments of Neurology and of Neuroscience and Pharmacology, Cornell U. Medical College, New York, NY
Abstract
Quantitative structure activity relationships (QSAR) were
determined for the Ki values measured for the interaction of
40-substituted naloxone benzoylhydrazones with k1, k3, m1,
m2, and d receptors. Based on a comparison of the estimated
and observed values of Ki for two groups which were not in
the data sets used to obtain the initial QSAR the latter give
very satisfactory estimates for all but the d receptor. The
validity of the QSAR are further supported by a comparison
of the observed and calculated orders of Ki values for these
two groups. The effects of the 40 substituent on Ki are
similar for the m1 and m2 receptors. No other similarities
were observed. The results suggest that substituents of the
type CH2Z and NHZ where Z has large values of the
localized electrical effect parameter, s1, should exhibit a
ratio of Ki(k3) to Ki(k1) greater than 30. This is supported by
the result for the acetylamino group. For all receptors but dand possibly k3 the 40 substituent seems to be binding to a
hydrophobic region of the molecular framework through
Van der Waals interactions. The segmental parameteriza-
tion seems to be a better choice for the representation of
steric effects than a monoparametric parameterization. The
intermolecular force model is a useful alternative to the
Hansch-Fujita model. The QSAR are reliable for all but the
d receptor where the results are very uncertain.
Quant. Struct.-Act. Relat., 17 (1998) # WILEY-VCH Verlag GmbH, D-69469 Weinheim 0931-8771/98/0204±0109 $17.50+.50/0 109
QSAR for 40-substituted Naloxone Benzoylhydrazones QSAR
1 Introduction
The synthesis and characterization of substituted benzoyl-
hydrazones 2 of naloxone, 1, and their binding af®nities for
the m1, m2, d, k1, and k3 receptors were reported elsewhere
[1]. QSAR developed for these binding af®nities (Ki values)
are reported here.
The Hansch model [2±4] for QSAR is:
log ba � T 1tX � T 2t2X � rsX � AaX � SuX � Bo �1�
* To receive all correspondence
Key words: QSAR, 40-substituted naloxone benzoylhydrazones,
receptor site, receptor molecule, substituent binding effect,
substituent-receptor interaction, steric effects, segmental method,
intermolecular force model.
Abbreviations: VdW, Van der Waals.

where t is a transport parameter, s a Hammett type
electrical effect parameter, u is a steric effect parameter, and
a a polarizability parameter. Typical transport parameters
include log P (P is the 1-octanol=water partition coef®-
cient), p (de®ned as the difference between log PX and log
PH), and log k 0 (k 0 is the capacity factor determined from
high performance liquid chromatography). All of these are
composite parameters that include polarizability, electrical
effects, dipole moment, hydrogen bonding, ionic charge if
any, and steric effects. The Hammett s constant is a
composite electrical effect parameter [5]:
sX � lslX � dsdX � rseX � h �2�
where sl represents the localized (®eld) electrical effect, sd
the intrinsic delocalized (resonance) electrical effect, and se
the sensitivity to electronic demand. The polarizability
parameter a is de®ned as the difference between the group
molar refractivities of X and H divided by 100. The steric
parameter u is de®ned as the difference between the Van der
Waals radii of X and H [6]. The equation used to correlate
the log Ki values was obtained by substituting Eq. 2 in Eq.
1, using p as the transport parameter, and introducing a term
in the bond moment of the X-C(sp2) bond. The parameter mused is actually the dipole moment of PhX. The hydrogen
bonding parameters are nH, the number of OH or NH bonds
in X; and nn, the number of lone pairs on N or O atoms in X
[7]. The resulting correlation equation is:
log KiX � LslX � DsdX � RseX �MmX
� H1nHX � H2nnX � AaX � SyX � Bo �3�
2 Method and Results
The data were correlated with Eqs. 1 and 3 or relationships
derived from them by means of multiple linear regression
analysis. The substituent constants used in this work are
reported in Table 1.
The correlation matrix (values of the zeroth order partial
correlation coef®cients) for Eq. 3 is given in Table 2, that
for Eq. 8 is set forth in Table 3. The regression equations
reported are those which gave the best statistics. The
statistics reported are: 100R2, percent of the data accounted
for by the regression equation; A100R2, percent of the data
accounted for by the regression equation adjusted for the
number of independent variables, F, a test for the
signi®cance of the regression coef®cients and a measure
of the goodness of ®t; Sai, standard errors of the regression
coef®cients; Sest, standard error of the estimate; So, standard
error of the estimate divided by the root mean square of the
data. The Sai are given in parentheses after the regression
coef®cients in the regression equation, the other statistics
are reported beneath the regression equation.
Correlation of the log K i values for the k1 receptor with Eq.
3 gave:
Ki�k1�X � 5:36��1:22�slX � 1:91��0:631�sdX 12:9��3:73�seX
� 2:62��1:13�aX ÿ 0:967��0:276�mX ÿ 0:146��0:261��4�
n � 20 100R2 � 66:39 A100R2 � 57:42
Sest � 0:366 So � 0:693 F � 5:530�99:0�
Eq. 4 is signi®cant.
The correlation of log K i for the k3 receptor with Eq. 1
gave:
log Ki�k3�X � ÿ0:378��0:0744�pX � 5:75��1:12�aX
� 0:292��0:0901� �5�n � 20 100R2 � 62:01 A100R2 � 59:90
Sest � 0:209 So � 0:669 F � 13:87�99:9�
Again, the equation is signi®cant.
Correlation of the log K i values for the m1 receptor with Eq.
3 gave:
log Ki�m1�X � ÿ 0:562��0:372�slX � 1:33��0:542�aX
� 0:126��0:0711�mX ÿ 0:381��0:100� �6�n � 20 100R2 � 44:97 A100R2 � 38:50
Sest � 0:185 So � 0:829 F � 4:359�95:0�
Though Eq. 6 is signi®cant the ®t is only fair.
Correlation of the log Ki values for the m2 receptor with Eq.
1 gave:
Ki�m2�X � ÿ 0:205��0:0630�pX � 3:28��0:997�aX
� 0:555��0:221�yX ÿ 0:248��0:108� �7�n � 20 100R2 � 65:61 A100R2 � 61:57
Sest � 0:175 So � 0:657 F � 10:18�99:9�
Eq. 7 is signi®cant but dif®cult to interpret due to
collinearities among the variables. In order to obtain further
insight into the nature of the steric effect the data were
correlated with the equation:
log Ki � LslX � DsdX � RseX �MmX � AaX � H1nHX
� H2nnX � S1y1X � S2y2X � S3y3X � Bo �8�
in which the monoparametric steric term has been replaced
by the segmental method of steric effect parameterization
[8, 9]. In this method each atom of the longest chain in the
Marvin Charton et al.QSAR
110 Quant. Struct.-Act. Relat., 17 (1998)

Table 1. Parameter values used in the correlations.
X p p2 sl sd se m a
H 0 0 0 0 0 0 0
Br 0.81 0.74 0.47 7 0.27 7 0.018 1.70 0.079
Cl 0.71 0.50 0.47 7 0.28 7 0.011 1.70 0.050
NO2 7 0.28 0.078 0.67 0.18 7 0.077 4.28 0.063
OH 7 0.67 0.45 0.35 7 0.57 7 0.044 1.40 0.018
NH2 7 1.23 1.51 0.17 7 0.68 7 0.13 1.49 0.044
CN 7 0.57 0.32 0.57 0.12 7 0.055 4.14 0.053
I 1.12 1.15 0.40 7 0.20 7 0.057 1.71 0.129
F 0.14 0.02 0.54 7 0.48 0.041 1.66 7 0.001
OMe 7 0.02 0 0.30 7 0.55 7 0.064 1.36 0.068
Me 0.56 0.31 7 0.01 7 0.14 7 0.030 0.37 0.046
Et 1.02 1.04 7 0.01 7 0.12 7 0.036 0.37 0.093
iPr 1.53 2.34 0.01 7 0.15 7 0.040 0.40 0.140
Bu 2.13 4.54 7 0.01 7 0.15 7 0.036 0.37 0.186
tBu 1.98 3.92 7 0.01 7 0.15 7 0.036 0.52 0.186
Hx 3.14 9.86 7 0.01 7 0.14 7 0.036 0.37 0.276
Hp 3.65 13.3 7 0.01 7 0.14 7 0.036 0.37 0.322
cHx 2.51 6.30 0.00 7 0.14 7 0.036 0.37 0.257
CH2NH2 7 1.04 1.08 0.06 7 0.11 7 0.018 1.38 0.081
NHMe 7 0.47 0.22 0.13 7 0.67 7 0.18 1.77 0.093
X nH nn u u1 u2 u3
H 0 0 0 0 0 0
Br 0 0 0.65 0.65 0 0
Cl 0 0 0.55 0.55 0 0
NO2 0 4 0.35 0.35 0.32 0
OH 1 2 0.32 0.32 0 0
NH2 2 1 0.35 0.40 0 0
CN 0 1 0.40 0.40 0.40 0
I 0 0 0.78 0.78 0 0
F 0 0 0.27 0.27 0 0
OMe 0 2 0.36 0.32 0.52 0
Me 0 0 0.52 0.52 0 0
Et 0 0 0.56 0.52 0.52 0
iPr 0 0 0.76 0.76 0.52 0
Bu 0 0 0.68 0.52 0.52 0.52
tBu 0 0 1.24 1.24 0.52 0
Hx 0 0 0.73 0.52 0.52 0.52
Hp 0 0 0.73 0.52 0.52 0.52
cHx 0 0 0.87 0.76 0.52 0
CH2NH2 2 2 0.55 0.52 0.35 0
NHMe 1 1 0.39 0.35 0.52 0
Values of parameters are from: p, Hansch, C., Leo, A. Substituent Constants for Correlation Analysis in Chemistry and Biology, Wiley, New York 1979; sl,
sd, se, ref. 2; a, Charton, M. In The Chemistry of Sulfenic Acids, Esters and Derivatives, S. Patai (Ed.), Wiley, New York 1990, pp. 657±700; u, u1, u2, u3,
ref. 3; m, McClellan, A.L. Tables of Experimental Dipole Moments, W.H. Freeman, San Francisco 1963, McClellan, A.L. Tables of Experimental Dipole
Moments, Vol. 2, Rahara Enterprises, El Cerrito, Cal. 1974.
Table 2. Correlation matrix for Eq. 3.
sl sd se a nH nn u p p2 m
1 0.026 0.032 0.522 0.095 0.515 0.363 0.478 0.499 0.859 sl
1 0.393 0.238 0.475 0.016 0.205 0.310 0.185 0.153 sd
1 0.032 0.438 0.404 0.064 0.285 0.081 0.272 se
1 0.255 0.335 0.727 0.885 0.926 0.405 a1 0.260 0.246 0.589 0.187 0.081 nH
1 0.411 0.538 0.337 0.685 nn
1 0.691 0.525 0.315 u1 0.845 0.542 p
1 0.431 p2
1 m
QSAR for 40-substituted Naloxone Benzoylhydrazones QSAR
Quant. Struct.-Act. Relat., 17 (1998) 111

substituent together with the atoms attached to it constitutes
a segment for which a separate parameter of same type as uis used. Eq. 8 is an form of the intermolecular force (IMF)
equation. The correlation matrix for Eq. 8 is given in Table
3. The equation obtained is:
log Ki�m2�X � ÿ 0:885��0:337�slX � 0:166��0:0645�mX
� 2:69��0:647�aX ÿ 0:898��0:288�u3X
� 0:00550��0:0928� �9�
n � 20 100R2 � 70:65 A100R2 � 65:15
Sest � 0:167 So � 0:626 F � 9:027�99:9�
Again Eq. 9 is signi®cant.
Correlation of the K i values for the m1 receptor with Eq. 8
gave best results on exclusion of the value for naloxone 4-
cyclohexylbenzoylhydrazone.
Ki�m1�X � ÿ0:655��0:248�slX � 0:500��0:172�y3X
� 0:152��0:0496�mX ÿ 0:325��0:0530� �10�
n � 19 100R2 � 56:73 A100R2 � 51:32
Sest � 0:130 So � 0:740 F � 6:556�99:5�
Correlation of the log K i values for the d receptor with Eq. 1
did not give a signi®cant result until the K i value for
X�OH was excluded. The regression equation is:
log Ki�d�X � ÿ 0:242��0:0907�pX ÿ 0:0940��0:0340�p2X
� 1:03��0:0792� �11�
n � 19 100R2 � 33:40 A100R2 � 29:49
Sest � 0:283 So � 0:888 F � 4:03�95:0�
The results are very poor and barely signi®cant. K i for this
receptor seems to be independent of 40-substitution.
The percent contribution, Ci, of each independent variable
in the regression equation is useful in discussing the results
[7]. Ci is written as:
Ci �100aixiPmiÿ1
aixi
�12�
where ai is the regression coef®cient of the i-th independent
variable and xi is its value for some reference group. A
hypothetical reference group was de®ned for which:
sl � sd � m � nH � nn � p � y � y1 � y2 � y3 � 1;
se � 0:1; a � 0:2:
Values of Ci for each receptor are set forth in Table 4.
Inspection of these values shows that substituent effect
composition on the Ki values is similar for the m1 and m2
receptors. The values of the coef®cients of sl and m are not
signi®cantly different. In view of the collinearity of a and u3
the lack of dependence of the m1 set on a and the difference
in sign of the coef®cient of u3 in the two sets is not
unreasonable.
Values of log Kio and log Kic, the observed and calculated
values of log Ki respectively, and of D log Ki, the difference
between the observed and calculated values of log Ki, are
given in Table 5. The D log Ki values show that there is
generally reasonable agreement between calculated and
observed values of log Ki. Also given in Table 5 is the range
of the data set which is de®ned as the difference between
the largest and the smallest data points in the set. The range
provides a measure of the sensitivity of the log Kio values to
structural effects.
The validity of the QSAR was tested by the classical
method of predicting bioactivities for compounds that have
not been studied, then determining the experimental values,
and comparing predicted and observed values. This is a very
good test of predictability, particularly if the substituents
chosen for study are very different from those used to obtain
the original QSAR. In Table 6 calculated values are given
Table 3. Correlation matrix for Eq. 8.
sl sd se a nH nn u1 u2 u3 m
1 0.026 0.032 0.522 0.095 0.515 0.247 0.448 0.384 0.859 sl
1 0.393 0.238 0.475 0.016 0.183 0.222 0.159 0.153 sd
1 0.032 0.438 0.404 0.063 0.253 0.084 0.272 se
1 0.255 0.335 0.531 0.657 0.711 0.405 a1 0.260 0.206 0.163 0.197 0.081 nH
1 0.362 0.028 0.247 0.685 nn
1 0.318 0.015 0.218 u1
1 0.405 0.149 u2
1 0.337 u3
1 m
Marvin Charton et al.QSAR
112 Quant. Struct.-Act. Relat., 17 (1998)

for a number of substituents for which no experimental
determinations were carried out when the ®rst QSAR
models were developed. The parameter values used for
these calculations are reported in Table 7. The results in
Table 6 suggested that substituents of the type CH2Z and
NHZ where Z has a large value of the localized electrical
effect parameter, sl, should exhibit a ratio of Ki(k3) to
Ki(k1) greater than 30. To test these predictions Ki values
were determined for the SO2NH2 and the NHAc groups for
all receptors. These values are also reported in Table 6. It is
important to note that the SO2NH2 and NHAc groups are
very different structurally from the groups used to obtain
the original QSAR. There is no group comparable to the
SO2NH2 group in the original data set. Though NHR groups
(R�H or Me) are present. They differ greatly from the
NHAc group. The latter has a much more acidic NH bond, a
much less basic N atom, and a carbonyl group. Clearly these
two substituents should provide a good test of QSAR
validity. The quality of our QSAR as estimators of Ki can be
judged from the magnitude of f the absolute value of the
ratio of D log Ki to Sest, the standard error of the estimate for
the QSAR equation. When f< 2 the estimate is good, when
2<f< 3 the estimate is acceptable, and when f> 3 the
estimate is unacceptable. Values of D log Ki and f for the
SO2NH2 and NHAc groups are given in Table 8. The results
for the k3, m1, m2, and d receptors are very satisfactory.
Those for the k1 receptor are poor.
A second test of QSAR reliability is whether they can
predict the order of the Ki values for the receptors. The
predicted and observed orders are for SO2NH2
OBSERVED d > k3 > m2 > m1 > k1
CALCULATED d > k3 > m2 > m1 � k1
and for NHAc
OBSERVED k3 > d > m2 > m1 > k1
CALCULATED k3 > d� m2 > m1 �> k1
The observed and calculated orders are in good agreement,
supporting the validity of the QSAR.
The inclusion of the NHAc and SO2NH2 data points in the
correlations was examined. For the k1 receptor the best
regression equation (obtained on exclusion of the Ki value
for NHAc) is:
Ki�k1�X � 4:18��0:989�slX � 1:57��0:617�sdX
ÿ 10:1��2:95�seX � 2:83��1:18�aX
ÿ 0:665��0:203�mX ÿ 0:258��0:262� �40�
n � 21 100R2 � 60:80 A100R2 � 50:99
Sest � 0:383 So � 0:741 F � 4:652�99:0�
The coef®cients in Eq. 40 are not signi®cantly different from
those in Eq. 4 though the goodness of ®t is poorer. A plot of
log Ki calculated from both Eq. 4 and Eq. 40 versus log Ki
observed is given in Figure 1. A comparison of the
substituent effect composition for these equations is given
in Figure 2.
For the k3 receptor the best equation is:
log Ki�k3�X � ÿ 0:328��0:0559�pX � 6:02��0:952�aX
ÿ 0:440��0:116�y� 0:466��0:0913� �50�
n � 22 100R2 � 72:20 A100R2 � 69:27
Sest � 0:211 So � 0:583 F � 15:58�99:9�
The coef®cients of p and a in Eq. 50 are essentially
unchanged from those of Eq. 5. There is a new term in the
steric parameter u and the goodness of ®t is improved. A
plot of log Ki calculated from both Eq. 5 and Eq. 50 versus
log Ki observed is given in Figure 3. A comparison of the
substituent effect composition for these equations is given
in Figure 4.
Table 4. Values of Ci.
Set Eq. sl sd se nH nH a u u1 u2 u3 p p2 m
k1 4 53.3 19.0 12.8 0 0 5.21 0 nd nd nd 0 0 9.63
40 52.3 19.7 12.8 0 0 7.09 0 nd nd nd 0 0 8.32
k3 5 0 0 0 0 0 75.3 0 nd nd nd 24.7 0 0
50 0 0 0 0 0 61.1 16.6 nd nd nd 22.3 0 0
m1 10 50.1 0 0 0 0 0 nd 0 0 38.3 nd nd 11.6
100 47.5 0 0 0 0 0 nd 0 0 41.6 nd nd 11.0
m2 9 35.7 0 0 0 0 21.7 nd 0 0 36.1 nd nd 6.66
90 34.6 0 0 0 0 22.1 nd 0 0 36.9 nd nd 6.33
d 11 0 0 0 0 0 0 0 nd nd nd 71.9 28.1 0
110 0 0 0 52.9 21.5 0 0 nd nd nd 25.6 0 0
Sets k1, k3, and d were correlated with Eq. 3 (regression Eqs. 4, 40, 5, 50, 11, and 110). Sets m1 and m2 were correlated with Eq. 8 (regression Eqs. 9, 90, 10,
and 100). nd� not determined. Values in boldface are for nonpolar parameters, values in italics are for the composite parameters p and p2.
QSAR for 40-substituted Naloxone Benzoylhydrazones QSAR
Quant. Struct.-Act. Relat., 17 (1998) 113

Table 5. Values of log Kio, log Kic, D log Ki, and the range of the data set.
Equation, Receptor 4,40(k1) 5,50(k3) 10,100(m1)
X log Kio log Kic D log Ki log Kio log Kic D log Ki log Kio log Kic D log Ki
H 7 0.222 7 0.146 7 0.076 7 0.046 0.292 7 0.338 7 0.523 7 0.325 7 0.198
7 0.258 0.036 0.466 7 0.511 7 0.319 7 0.204
Br 1.097 0.650 0.447 0.380 0.440 7 0.060 7 0.301 7 0.374 0.073
0.557 0.540 0.391 7 0.010 7 0.363 0.062
Cl 0.987 0.465 0.522 0.447 0.311 0.136 7 0.301 7 0.374 0.073
0.388 0.595 0.293 0.154 7 0.363 0.062
NO2 0.863 0.803 0.061 0.663 0.760 7 0.097 7 0.155 7 0.113 7 0.042
0.937 7 0.073 0.783 7 0.121 7 0.134 7 0.021
OH 7 0.523 7 0.102 7 0.421 1.076 0.649 0.427 7 0.155 7 0.341 0.186
7 0.126 7 0.397 0.653 0.422 7 0.334 0.179
NH2 7 0.046 7 0.191 0.145 1.041 1.010 0.031 7 0.097 7 0.209 0.113
0.166 0.119 0.980 0.061 7 0.218 0.121
CN 7 0.222 7 0.021 7 0.200 0.914 0.812 0.101 7 0.046 7 0.069 0.023
0.266 7 0.488 0.796 0.118 7 0.095 0.049
I 0.580 1.031 7 0.451 0.276 0.610 7 0.334 7 0.398 7 0.327 7 0.071
0.905 7 0.325 0.533 7 0.256 7 0.322 7 0.076
F 7 0.444 7 0.306 7 0.138 0.199 0.234 7 0.035 7 0.538 7 0.426 7 0.112
7 0.279 7 0.165 0.296 7 0.097 7 0.409 7 0.129
OMe 7 0.046 0.095 7 0.140 0.695 0.691 0.004 7 0.432 7 0.314 7 0.117
0.068 7 0.114 0.724 7 0.029 7 0.311 7 0.121
Me 0.134 7 0.319 0.452 0.576 0.345 0.231 7 0.097 7 0.262 0.165
7 0.332 0.466 0.331 0.245 7 0.264 0.167
Et 7 0.237 7 0.081 7 0.156 0.574 0.441 0.133 7 0.060 7 0.262 0.201
7 0.106 7 0.130 0.446 0.128 7 0.264 0.204
iPr 7 0.013 0.115 7 0.128 0.540 0.519 0.022 7 0.310 7 0.270 7 0.040
0.084 7 0.097 0.474 0.067 7 0.272 7 0.038
Bu 7 0.301 0.105 7 0.406 0.595 0.556 0.039 7 0.114 7 0.002 7 0.112
0.110 7 0.411 0.589 0.006 7 0.002 7 0.112
tBu 7 0.523 7 0.040 7 0.481 0.301 0.613 7 0.312 7 0.398 7 0.239 7 0.159
0.010 7 0.533 0.392 7 0.091 7 0.244 7 0.154
Hx 0.356 0.360 0.004 0.568 0.692 7 0.124 0.076 7 0.002 0.077
0.381 7 0.025 0.778 7 0.210 7 0.002 0.077
Hp 0.662 0.480 0.181 0.909 0.764 0.145 0.033 7 0.002 0.035
0.511 0.151 0.888 0.021 7 0.002 0.035
cHx 0.749 0.364 0.385 1.067 0.821 0.246
0.369 0.380 0.809 0.259
CH2NH2 7 0.658 7 0.926 0.269 1.046 1.151 7 0.105 7 0.167 7 0.154 7 0.013
7 0.686 0.029 1.057 7 0.011 7 0.170 7 0.002
NHMe 0.255 0.114 0.141 0.894 1.005 7 0.111 7 0.222 7 0.141 7 0.081
0.143 0.112 1.009 7 0.115 7 0.158 7 0.064
SO2NH2 0.009 7 0.319 0.328 1.166 1.268 7 0.102 0.117 0.112 0.005
NHAc 1.494 1.421 0.073 0.093 0.140 0.005
Range 1.755 1.122 0.613
Equation, Receptor 9,90(m2) 11,110(d)
X log Kio log Kic D log d Ki log Kio log Kic D log d Ki
H 7 0.097 0.006 7 0.102 0.857 1.030 7 0.172
7 0.011 7 0.108 0.851 0.006
Br 7 0.097 0.084 7 0.181 1.061 0.904 0.157
0.089 7 0.186 0.942 0.118
Cl 0.079 0.006 0.073 1.267 0.905 0.362
0.011 0.068 0.931 0.336
NO2 0.204 0.292 7 0.088 1.352 1.105 0.247
0.275 7 0.071 1.197 0.155
OH 0.079 7 0.024 0.103
7 0.020 0.099
NH2 0.398 0.221 0.177 1.294 1.470 7 0.175
0.216 0.182 1.271 0.024
(continued )
Marvin Charton et al.QSAR
114 Quant. Struct.-Act. Relat., 17 (1998)

Table 6. Values of Ki for groups not included in the correlations.
Equation (Receptor) 4(k1) 5(k3) 10(m1) 9(m2) 11(d)
X Ki
CH2Cl 0.0119 5.94 1.14 4.45 9.81
CO2Et 17.2 16.3 0.575 3.08 10.4
OCF3 0.574 1.95 0.676 0.761 7.59
SO2CF3 7.49 5.79 0.789 2.79 8.42
SOMe 0.491 41.6 0.844 3.39 44.5
N3 83.9 4.44 0.427 0.656 8.68
CH2CN 0.00939 10.7 1.84 1.92 15.8
CH2Br 0.0156 5.09 1.13 5.23 7.89
CF3 0.833 1.55 0.704 1.71 7.76
NHAc 0.0363 28.7 1.67 2.93 22.6
0.90 31.20 1.24 6.96 13.60
NHCO2Me 0.117 21.0 1.63 3.16 13.6
NHCONH2 0.0116 31.8 2.19 3.68 31.9
NHSO2Me 1.01 46.7 1.82 3.51 28.0
SO2NH2 0.111 42.6 1.47 5.91 60.7
1.02 14.65 1.31 5.11 32.62
SCN 0.812 7.08 1.14 1.22 8.85
SF5 3.28 2.18 0.648 1.97 7.50
OSO2Me 0.852 28.0 1.12 1.75 20.7
Values in bold face were experimentally determined.
Table 5. (Continued )
Equation, Receptor 4,40(k1) 5,50(k3) 10,100(m1)
X log Kio log Kic D log Ki log Kio log Kic D log Ki log Kio log Kic D log Ki
CN 0.398 0.330 0.068 1.076 1.198 0.122
0.311 0.087 0.882 0.194
I 0.377 0.282 0.094 0.530 0.868 7 0.337
0.284 0.011 0.977 7 0.447
F 7 0.180 7 0.200 0.020 0.638 0.998 7 0.359
7 0.191 0.011 0.867 7 0.229
OMe 0.097 0.149 7 0.052 1.157 1.035 0.122
0.151 7 0.054 1.038 0.119
Me 0.255 0.200 0.056 1.117 0.924 0.193
0.200 0.055 0.914 0.202
Et 0.274 0.326 7 0.052 0.415 0.881 7 0.466
0.326 7 0.052 0.737 7 0.322
iPr 0.182 0.440 7 0.258 1.193 0.881 0.311
0.441 7 0.259 1.023 0.170
Bu 0.158 0.110 0.049 0.662 0.943 7 0.282
0.110 0.048 1.093 7 0.429
tBu 0.672 0.602 0.070 1.079 0.921 0.158
0.600 0.072 1.074 0.006
Hx 0.551 0.352 0.199 1.389 1.201 0.187
0.352 0.199 1.204 0.185
Hp 0.228 0.476 7 0.248 1.210 1.403 7 0.193
0.476 7 0.248 1.261 7 0.051
cHx 0.945 0.759 0.186 1.189 1.018 0.171
0.759 0.186 1.132 0.056
CH2NH2 0.544 0.399 0.145 1.763 1.383 0.380
0.391 0.153 1.292 0.471
NHMe 0.176 0.434 7 0.258 0.981 1.164 7 0.183
0.424 7 0.248 1.125 7 0.143
SO2NH2 0.708 0.734 7 0.026 1.513 1.582 7 0.068
NHAc 0.843 0.845 7 0.002 1.133 1.488 7 0.354
Range 1.125 1.348
Values in boldface are for Eqs. 40, 50, 90, 100, and 110.
QSAR for 40-substituted Naloxone Benzoylhydrazones QSAR
Quant. Struct.-Act. Relat., 17 (1998) 115

Table 7. Parameter values used to estimate the Ki values in Table 6.
X p p2 a sl sd se m u3
N3 0.46 0.21 0.092 0.43 7 0.27 7 0.12 1.56 0.35
CH2CN 7 0.57 0.32 0.091 0.20 7 0.01 7 0.011 3.43 0.40
CH2Br 0.79 0.62 0.124 0.20 7 0.08 7 0.026 3.35 0
CH2Cl 0.17 0.03 0.095 0.17 7 0.06 7 0.024 3.24 0
CF3 0.88 0.77 0.040 0.40 0.13 7 0.026 2.86 0
CO2Et 0.06 0 0.164 0.30 0.18 7 0.064 1.849 0
OCF3 1.04 1.08 0.068 0.51 7 0.30 0.014 2.33 0.27
OSO2Me 7 0.88 0.77 0.143 0.55 7 0.23 7 0.065 3.77 0.32
NHAc 7 0.97 0.94 0.139 0.28 7 0.35 7 0.088 3.75 0.32
NHCO2Me 7 0.37 0.14 0.155 0.28 7 0.42 7 0.13 3.69 0.32
NHCONH2 7 1.30 1.69 0.125 0.23 7 0.45 7 0.13 4.31 0.32
NHSO2Me 7 1.18 1.39 0.162 0.42 7 0.21 7 0.18 4.60 0.32
SCN 0.41 0.17 0.124 0.56 7 0.15 7 0.040 3.62 0.40
SOMe 7 1.58 2.50 0.127 0.54 7 0.01 7 0.037 3.98 0
SO2NH2 7 1.82 3.31 0.113 0.44 0.23 7 0.082 5.13 0
S02CF3 0.55 0.30 0.118 0.71 0.29 7 0.056 4.52 0
SF5 1.23 1.51 0.089 0.59 0.04 7 0.040 3.44 0
Table 8. Values of DKi and f for SO2NH2 and NHAc.
Receptors
X k1 k3 m1 m2 d
SO2NH2 D log Ki 0.947 7 0.463 7 0.0493 7 0.0632 7 0.269
f 2.59 2.22 0.356 0.378 0.951
NHAc D log Ki 1.395 0.0362 7 0.128 0.376 7 0.220
f 3.81 0.173 0.985 2.25 0.777
Figure 1. Plot of log Ki, calculated from Eqs. 4 and 40against log Ki, observed.
Marvin Charton et al.QSAR
116 Quant. Struct.-Act. Relat., 17 (1998)

The best equation for the m1 receptor was again obtained on
the exclusion of the Ki value for 40-cyclohexyl NBH, it is:
logKi�m1�X � ÿ 0:577��0:177�slX � 0:505��0:163�y3X
� 0:134��0:0262�mX ÿ 0:319��0:0480� �100�
n � 21 100R2 � 66:92 A100R2 � 63:24
Sest � 0:123 So � 0:639 F � 11:46�99:9�
Again, there is no signi®cant difference between the
coef®cients of Eqs. 10 and 100 though the goodness of ®t
is better in the latter equation. A plot of log Ki calculated
from both Eq. 10 and Eq. 100 versus log Ki observed is
given in Figure 5. A comparison of the substituent effect
composition for these equations is given in Figure 6. We are
unable at the present time to account for the peculiar
behavior of the cyclohexyl group. As it was not an outlier in
the case of the other receptors it may be characteristic of the
Figure 2. Substituent effect composition forthe k1 receptor.
Figure 3. Plot of log K, calculated from Eqs.5 and 50 against log Ki, observed.
QSAR for 40-substituted Naloxone Benzoylhydrazones QSAR
Quant. Struct.-Act. Relat., 17 (1998) 117
m1 receptor or due to an error in the determination of Ki that
we have not been able to correct.
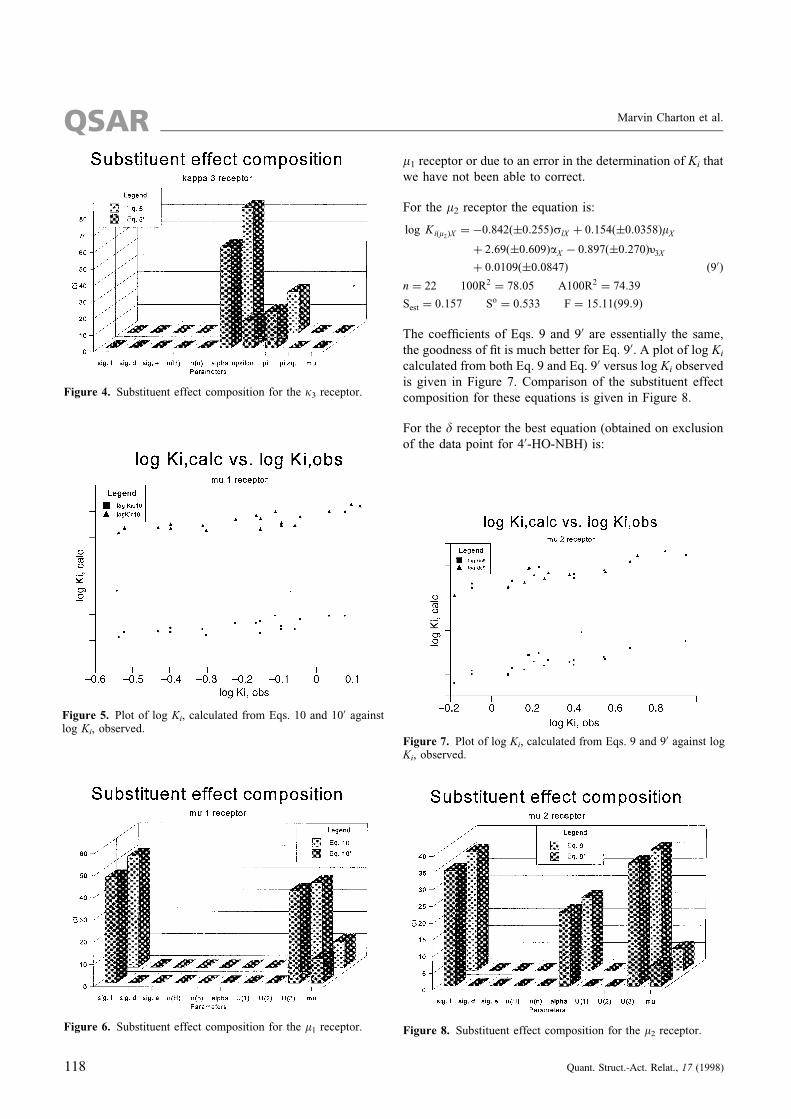
For the m2 receptor the equation is:
log Ki�m2�X � ÿ0:842��0:255�slX � 0:154��0:0358�mX
� 2:69��0:609�aX ÿ 0:897��0:270�y3X
� 0:0109��0:0847� �90�n � 22 100R2 � 78:05 A100R2 � 74:39
Sest � 0:157 So � 0:533 F � 15:11�99:9�
The coef®cients of Eqs. 9 and 90 are essentially the same,
the goodness of ®t is much better for Eq. 90. A plot of log Ki
calculated from both Eq. 9 and Eq. 90 versus log Ki observed
is given in Figure 7. Comparison of the substituent effect
composition for these equations is given in Figure 8.
For the d receptor the best equation (obtained on exclusion
of the data point for 40-HO-NBH) is:
Figure 5. Plot of log Ki, calculated from Eqs. 10 and 100 againstlog Ki, observed.
Figure 7. Plot of log Ki, calculated from Eqs. 9 and 90 against logKi, observed.
Figure 4. Substituent effect composition for the k3 receptor.
Figure 6. Substituent effect composition for the m1 receptor. Figure 8. Substituent effect composition for the m2 receptor.
Marvin Charton et al.QSAR
118 Quant. Struct.-Act. Relat., 17 (1998)
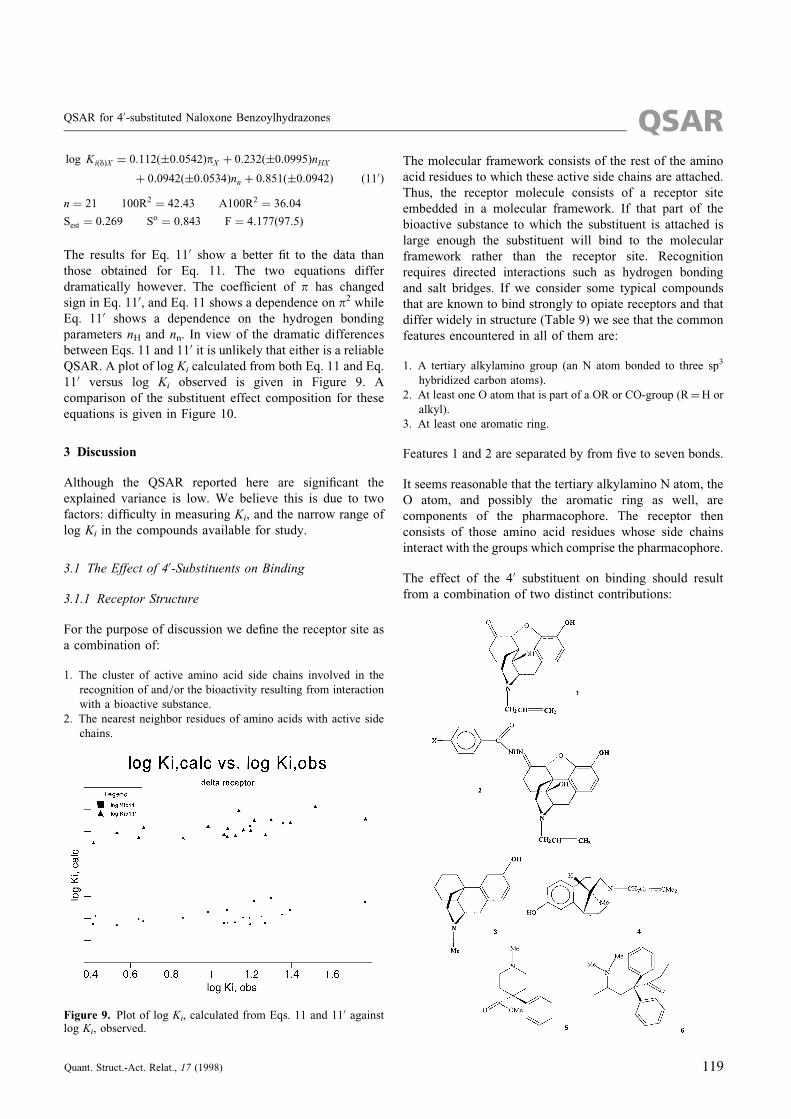
log Ki�d�X � 0:112��0:0542�pX � 0:232��0:0995�nHX
� 0:0942��0:0534�nn � 0:851��0:0942� �110�n � 21 100R2 � 42:43 A100R2 � 36:04
Sest � 0:269 So � 0:843 F � 4:177�97:5�
The results for Eq. 110 show a better ®t to the data than
those obtained for Eq. 11. The two equations differ
dramatically however. The coef®cient of p has changed
sign in Eq. 110, and Eq. 11 shows a dependence on p2 while
Eq. 110 shows a dependence on the hydrogen bonding
parameters nH and nn. In view of the dramatic differences
between Eqs. 11 and 110 it is unlikely that either is a reliable
QSAR. A plot of log Ki calculated from both Eq. 11 and Eq.
110 versus log Ki observed is given in Figure 9. A
comparison of the substituent effect composition for these
equations is given in Figure 10.
3 Discussion
Although the QSAR reported here are signi®cant the
explained variance is low. We believe this is due to two
factors: dif®culty in measuring Ki, and the narrow range of
log Ki in the compounds available for study.
3.1 The Effect of 40-Substituents on Binding
3.1.1 Receptor Structure
For the purpose of discussion we de®ne the receptor site as
a combination of:
1. The cluster of active amino acid side chains involved in the
recognition of and=or the bioactivity resulting from interaction
with a bioactive substance.
2. The nearest neighbor residues of amino acids with active side
chains.
The molecular framework consists of the rest of the amino
acid residues to which these active side chains are attached.
Thus, the receptor molecule consists of a receptor site
embedded in a molecular framework. If that part of the
bioactive substance to which the substituent is attached is
large enough the substituent will bind to the molecular
framework rather than the receptor site. Recognition
requires directed interactions such as hydrogen bonding
and salt bridges. If we consider some typical compounds
that are known to bind strongly to opiate receptors and that
differ widely in structure (Table 9) we see that the common
features encountered in all of them are:
1. A tertiary alkylamino group (an N atom bonded to three sp3
hybridized carbon atoms).
2. At least one O atom that is part of a OR or CO-group (R�H or
alkyl).
3. At least one aromatic ring.
Features 1 and 2 are separated by from ®ve to seven bonds.
It seems reasonable that the tertiary alkylamino N atom, the
O atom, and possibly the aromatic ring as well, are
components of the pharmacophore. The receptor then
consists of those amino acid residues whose side chains
interact with the groups which comprise the pharmacophore.
The effect of the 40 substituent on binding should result
from a combination of two distinct contributions:
Figure 9. Plot of log Ki, calculated from Eqs. 11 and 110 againstlog Ki, observed.
QSAR for 40-substituted Naloxone Benzoylhydrazones QSAR
Quant. Struct.-Act. Relat., 17 (1998) 119

1. The substituent could exert an electrical effect on the strength
of hydrogen bonding between the receptor site and hydrogen
acceptor atoms (N, O) of the naloxone moiety, and its two OH
groups, though this effect is likely to be very small due to the
large distance involved [10]. It may also have a small effect
on H acceptor bonding by the acylhydrazone group
(�NÿNH(C�O)ÿC6H4Xÿ40) at O or N, and H donor bonding
at NH, again due to distance. Substituent effects on hydrogen
bonding are inherently small. Finally, it may effect H acceptor
bonding to the benzene ring of the acylhydrazone group as
well.
2. The substituent may bind directly to the receptor site or more
probably the molecular framework by intermolecular forces
including hydrogen bonding and Van der Waals (VdW)
interactions. The latter require a dependence on a and m.
We now consider the results for the individual receptors.
3.2 The k1 Receptor
The ®nal QSAR for the k1 receptor (Eq. 90) shows a large
dependence on the electrical effect parameters sl, sd, and se
as is shown by the Ci values in Table 4. This is in accord
with an effect of the 40 substituent on the hydrogen bonding
of the naloxone acylhydrazone moiety. The small but
signi®cant dependence on m and a suggests binding of the 40
substituent to the receptor or the molecular framework due
to VdW interactions. A number of the substituents studied
in our data sets are capable of hydrogen bonding, including
the NH2, CH2NH2, NHAc, SO2NH2, OH, NHMe, NO2, and
OMe groups. If hydrogen bonding were involved in the
binding of the 40 substituents we should observe a
dependence on the nH and nn parameters. As no such
dependence is found we may conclude that hydrogen
bonding by the substituent is not involved and therefore the
40 substituents are binding to a hydrophobic region of either
receptor site or molecular framework.
3.3 The k3 Receptor
The ®nal QSAR for the k3 receptor (Eq. 50) shows a large
dependence on a, some dependence on p, and a small
dependence on u. The p parameter is itself a composite
parameter and is a function of electrical effects, polariz-
ability, dipole moment, and the hydrogen bonding para-
meters. It seems likely that there is little or no effect of the
40 substituent on hydrogen bonding in the rest of the
substrate but in view of the composite nature of the pparameter this is not certain. The effect of the 40 substituent
on binding is probably the result of VdW interactions and
possibly hydrogen bonding as well with the receptor site
and=or the molecular framework.
3.4 The m1 Receptor
The ®nal QSAR obtained for the m1 receptor (Eq. 100) is
shown by the Ci values of Table 4 to have a large
dependence on sl, it depends on u3 and m as well. Due to the
strong collinearity between u3 and a it is uncertain whether
this is due to a steric effect, to polarizability, or both. The
dependence on sl suggests that the 40 substituent may be
Figure 10. Substituent effect composition for the d receptor.
Table 9. Typical compounds that bind strongly to opiate receptors.
Structural Features
Compound Tertiary alkylamino group Oxygen atom functional groups nba Benzenoid ring
Levorphanol, 3 Yes OH 7 Yes
Pentazocine, 4 Yes OH 7 Yes
Meperidine, 5 Yes C�O 5 Yes
Methadone, 6 Yes C�O 5 Yes
Naloxoneb, 1 Yes OH, C�O, CÿOÿC 7, 6, 5 Yes
Naloxone benzoylhydrazoneb, 2 Yes OH, CÿOÿC 7, 5 Yes
All of the OH groups listed in the Table are phenolic. a The number of bonds between the oxygen and the nitrogen atoms. b These compounds have an
alcoholic OH group as well as a phenolic OH group.
Marvin Charton et al.QSAR
120 Quant. Struct.-Act. Relat., 17 (1998)

exerting an effect on hydrogen bonding to the acylhydra-
zone group. The dependence on the dipole moment and
possible dependence on polarizability suggest that the
substituent is probably involved in binding to the receptor
site and=or the molecular framework by VdW interactions.
The absence of any dependence on the hydrogen bonding
parameters suggests that the binding of the substituent is to
a hydrophobic region of the receptor or molecular frame-
work.
3.5 The m2 Receptor
The ®nal QSAR (Eq. 90) is similar to that for the m1
receptor, the major difference being that Eq. 90 shows a
dependence on a whereas Eq. 100 does not. Again, there is a
possible effect of the 40 substituent on the hydrogen bonding
to the naloxone moiety and=or the acylhydrazone group,
and the substituent is binding directly to the receptor site or
the molecular framework by VdW interactions without
hydrogen bonding, indicative of interaction with a hydro-
phobic region.
3.6 The d Receptor
The ®nal QSAR (Eq. 110) shows a dependence on the
hydrogen bonding parameters which suggests that the 40
substituent is binding directly to the receptor site or
molecular framework largely by hydrogen bonding with a
smaller contribution from VdW interactions. The 40
substituent should therefore be interacting with a hydro-
philic area of the receptor site or framework. The 40
substituent seems to have no discernible effect on hydrogen
bonding to the naloxone moiety or to the acylhydrazone
group. In view of the lack of reliability of Eq. 110 these
inferences are tentative at best.
3.7 The Binding Site of the 40-substituent
The comments below are speculative. As was noted above
recognition and subsequent binding of naloxone derivatives
to an opiate receptor most probably involves hydrogen
bonding to the O and N atoms of the pharmacaphore. It is
quite likely that the 40 substituent projects out past the
receptor site and that with the possible exception of the dreceptor the substituent itself is binding to a hydrophobic
part of the molecular framework in which the receptor sites
are embedded.
4 Conclusion
QSAR for binding af®nities of 40-substituted nalaxone
benzoylhydrazones with the m1, m2, k1, k3, and d opiate
receptors were obtained. Those for the m1 and m2 receptors
are very similar. No other close similarities are found
among the QSAR. For all of the receptors but d and possibly
k3 the 40 substituent seems to be binding to a hydrophobic
region through VdW interactions. There is an effect of the
40 substituent on hydrogen bonding to the acylhydrazone
group in the case of the k1 receptor, and probably in the
case of the m1, and m2 as well. The QSAR are considered
reliable for all but the d receptor where the results are
considered uncertain.
Acknowledgment
The work was supported, in part, by a research grant
(DA06241) and a Research Scientist Award (DA00220) to
GWP from the National Institute on Drug Abuse and a core
grant from the National Cancer Institute (CA08748) to
MSKCC.
5 References
[1] Ciszewska, G.R., Ginos, J.A., Charton, M., Standifer, K.M.,Brooks, A.I., Brown, G.P., Ryan-Moro, J.P., Berzetei-Gurske, I., Toll, L. and Pasternak, G.W., Synapse 24, 193±201 (1996).
[2] Martin, Y.C., Quantitative Drug Design, Dekker, New York1978.
[3] Franke, R., Theoretical Drug Design Methods, Akademie-Verlag, Berlin 1984.
[4] Hansch C. and Leo, A., Exploring QSAR. Fundamentals andApplications in Chemistry and Biology, Vol. 1, Amer. Chem.Soc. Washington, D. C. 1995.
[5] Charton, M., Prog. Phys. Org. Chem. 16, 287±315 (1987).Note that the coef®cients of the pure parameters sl, sd, andse are lower case in equations relating them to compositeelectrical effect parameters and upper case in all otherrelationships.
[6] Charton, M., Topics in Current Chem. 114, 57±91 (1983).[7] Charton, M., Prog. Phys. Org. Chem. 18, 163±284 (1990).[8] Charton, M., Stud. Org. Chem. 42, 629±687 (1992).[9] Charton, M., Proceedings of the 5th International Symposium
on Pharmaceutical Sciences, J. Fac. Pharm. Ankara Univ.,OÈ zden, S., CË os;kun, M., BuÈyuÈkbingoÈl, E., Onur, F. andTarimji, N. (Eds.) Ankara, 1997 (1997), pp. 146±163.
[10] Charton, M. unpublished results on the variation of theelectrical effect with distance in the hydrogen bonding ofXGCN, data from Berthelot, M., Helbert, M., Laurence, C.and Le Questel, J.-Y. J. Phys. Org. Chem. 6, 302±306 (1993).
Received on October 6, 1997; accepted on December 5, 1997
QSAR for 40-substituted Naloxone Benzoylhydrazones QSAR
Quant. Struct.-Act. Relat., 17 (1998) 121