quantitative method for comparing soil maps and cartograms
TRANSCRIPT

ISSN 0147�6874, Moscow University Soil Science Bulletin, 2011, Vol. 66, No. 3, pp. 83–85. © Allerton Press, Inc., 2011.Original Russian Text © V.P. Samsonova, Yu.L. Meshalkina, 2011, published in Vestnik Moskovskogo Universiteta. Pochvovedenie, 2011, No. 3, pp. 3–5.
83
INTRODUCTION
The practical and scientific tasks of soil, ecolog�ical, and agrochemical research almost alwaysentail analysis and comparison of various carto�graphic sources. The wide distribution of geoinfor�mation systems and increase in the accessibility ofdata on remote sensing, on the one hand, make thistask simpler and, on the other hand, increase itsurgency. The same territory can undergo severalsurveys carried out with different purposes. Themaps obtained as a result reflect not only the naturalproperties of an object, but also the ideas ofresearchers about the structure of the soil cover, aswell as methods of studies. All this can be taken intoaccount if the qualitative comparison of maps orcartograms is performed.
The work Estimating the Mathematical Accuracy ofSoil Maps considered by most scientists occupied withdigital soil cartography as classical was published byD.G. Rossitter [2001] in 2001. This work discussesquestions related with what “agreement between amap and reality” means. In this article we will use onlytwo of the suggested characteristics to compare mapsand maps.
Let us suppose that two maps of some territory havebeen made according to the same classification, but bytwo different groups of researchers. These maps can becompared using the overall accuracy coefficient A0 andκ index [Rossitter, 2001; Skidmore, 1999].
It is necessary to place N points in each map ran�domly or using a regular gride and to determine theclass of the value marked in each cartogram. Subse�quently, it is necessary to count the number of casesfor each combination of classes. Let us suppose thatthe results of the research are gathered together to
the so�called confusion matrix (Table 1). In thiscase, the names of classes distinguished by the firstgroup are written along one of the matrix axes andthose distinguished by the second group are writtenalong the second one. Therefore, xkl is the numberof points (profile) simultaneously related by the firstgroup to the class k and by the second group to theclass l. The grey color marks the main diagonal ofthe table showing the situations wherein the resultsobtained by both groups coincide. The extradiago�nal elements correspond to the cases of noncoinci�dence. The sum of the values of diagonal elements(xii) reflects the total number of identically classi�fied points, and its ratio to the number of comparedpoints N is called overall accuracy (or the overallaccuracy coefficient) and is usually given in percent�age terms:
Quantitative Method for Comparing Soil Maps and CartogramsV. P. Samsonovaa and Yu. L. Meshalkinab
a Department of General Agriculture, Moscow State University, Moscow, Russiatel. number: 8(495)�939�35�24; e�mail: [email protected]
b Department of General Agriculture, Moscow State University, Moscow, Russiatel. number 8(495)�939�35�24; e�mail: [email protected]
Received January 12, 2011
Abstract—This paper describes how the overall accuracy coefficient and kappa index are used to estimate thesimilarity of soil maps. Comparison of two detailed maps built by two independent groups of researchers hasshown their coinciding by only 60%. The causes of this noncoincidence are discussed.
Keywords: overall accuracy coefficient, kappa index, kappa, map accuracy, uncertainty of mapping,agrogrey soils.
DOI: 10.3103/S0147687411030082
Table 1. Theoretical confusion matrics showing the resultsof the classification of the same profiles by two groups ofresearchers
Classes distinguished by the second group
Sum
1 2 3 4
Classes distin�guishedby the first group
1 x11 x12 x13 x14 x1+
2 x21 x22 x23 x24 x2+
3 x31 x32 x33 x34 x3+
4 x41 x42 x43 x44 x4+
Sum x+1 x+2 x+3 x+4 N

84
MOSCOW UNIVERSITY SOIL SCIENCE BULLETIN Vol. 66 No. 3 2011
SAMSONOVA, MESHALKINA
where
The kappa index takes into account that the coin�cidence of two maps can be determined by random�ness. For example, two soil types are distributed in agiven territory; one of them occupies 80% of the area,and the other occupies 20%. Then, the probability thatboth groups will randomly discover soil 1 and soil 2 inthe same place is 0.8 × 0.8 = 0.64 and 0.2 × 0.2 =0.04, respectively. That is, the probability that bothgroups will find similar soils in the same points is0.64 + 0.04 = 0.68. Let us designate it as θ2:
If we suppose that the coincidence in the results ofclassification by two groups can be random or nonran�dom, then 1 – θ2 is the probability of the nonrandomcoincidence of two maps.
The kappa index is assigned as
It is equal 1 if the coincidence of two maps is com�plete (randomness is absent); it is zero if θ1 coincideswith θ2 and the coincidence of two maps is observed tobe purely random. In most cases this index is in therange from 0 to 1 and shows how closely the maps aresimilar. If kappa is less than zero, then the disagree�ment is greater than that could arise randomly.
The goal of this work was to use the κ index andoverall accuracy coefficient to compare the results ofsoil research pursued in the same territory by twogroups of soil scientists.
A0 θ1
xii
i 0=
r
∑
N���������� pii,
i 0=
r
∑= = =
pklxkl
N����.=
θ2xi+x+i
N2�����������
i 1=
r
∑ .=
κθ1 θ2–1 θ2–������������� .=
OBJECTS AND METHODS OF RESEARCH
This problem was studied by means of the exampleof anthropogenically changed soils in the BryanskOpolie . Agrogrey soils are the major type of soils here.In many places the soil cover is damaged owing to con�tinuous processing, erosion, and melioration.
The land area of 72 ha relating to the group of thetypological sites in the Bryansk Opolie was investi�gated. Old maps show that this territory has beentilled for more than 150 years. According to the 1 :25000�scale map of 1980, two groups of soils are dis�tinguished here: the general homogenous backgroundof grey soils contains more than 20 bushed depressionswith a size from 0.5 to 1 ha, where grey forest gleyedsoils are noted. Immediately after 1980, the depres�sions were stubbed out and ploughed and the territorywas partially leveled. However, closed depressions witha depth of 2–4 m and diameter of 40–50 m areobserved here at present, which results in strong spatialheterogeneity and erosive processes.
Fifty�eight cuts were laid in different relief posi�tion. The diagnostics of their soils was carried out bytwo independent groups of researchers according tothe soil classification of Russia [Classification andDiagnostics of Russian Soils, 2004].
RESULTS OF RESEARCH AND THEIR DISCUSSION
Analyzing the morphological properties of soils incuts has shown that the land contains soils trans�formed by melioration, agricultural processing, anderosion to a varied extent, in addition to the typicalagrogrey soils. Four soil classes relating to differentsections of the Russian soil classification have beendistinguished. The soils of the first and second classrelate to the type of full�profile agrogrey soils: theformer correspond to the subtype of “typical” soils; forthe latter, the diagnostic sign is the presence of the sec�ond humic layer, and they relate to the correspondingsubtype. The third and fourth classes include soils withthe profile damaged to a varied extent. If the clayey�illuvial layer has completely or partially persisted in theprofile (i.e., the soils could be related to the clayey�illuvial agroabrasems according to the modern classi�fication), then the soils correspond to the third class.If the plough layer has been formed as a result of theanthropogenic impact at the expense of the lower partof the profile or soil�forming rock (i.e., the soils couldbe related to the typical agroabrasems), then they havebeen joined into the fourth class. Both groups ofresearchers have agreed with this division of soils intoclassification classes.
Table 2, analogously to Table 1, has been composedaccording to the results of the research. Based on this
Table 2. Confusion matrics filled as a result of the indepen�dent research of the same cuts by two groups of soil scien�tists. The number of cuts related by both groups to the sameclass is indicated along the main diagonal
Classes distinguished by the sec�ond group Sum
1 2 3 4
Classes distin�guishedby the first group
1 19 5 0 0 24
2 1 8 3 2 14
3 3 0 4 6 13
4 0 0 1 6 7
Sum 23 13 8 14 58
Note: The overall accuracy A0 = 0.638; κ = 0.498; σκ
= 0.085; theconfidence interval for κ is (0.331–0.665).
MOSCOW UNIVERSITY SOIL SCIENCE BULLETIN Vol. 66 No. 3 2011
QUANTITATIVE METHOD FOR COMPARING SOIL MAPS AND CARTOGRAMS 85
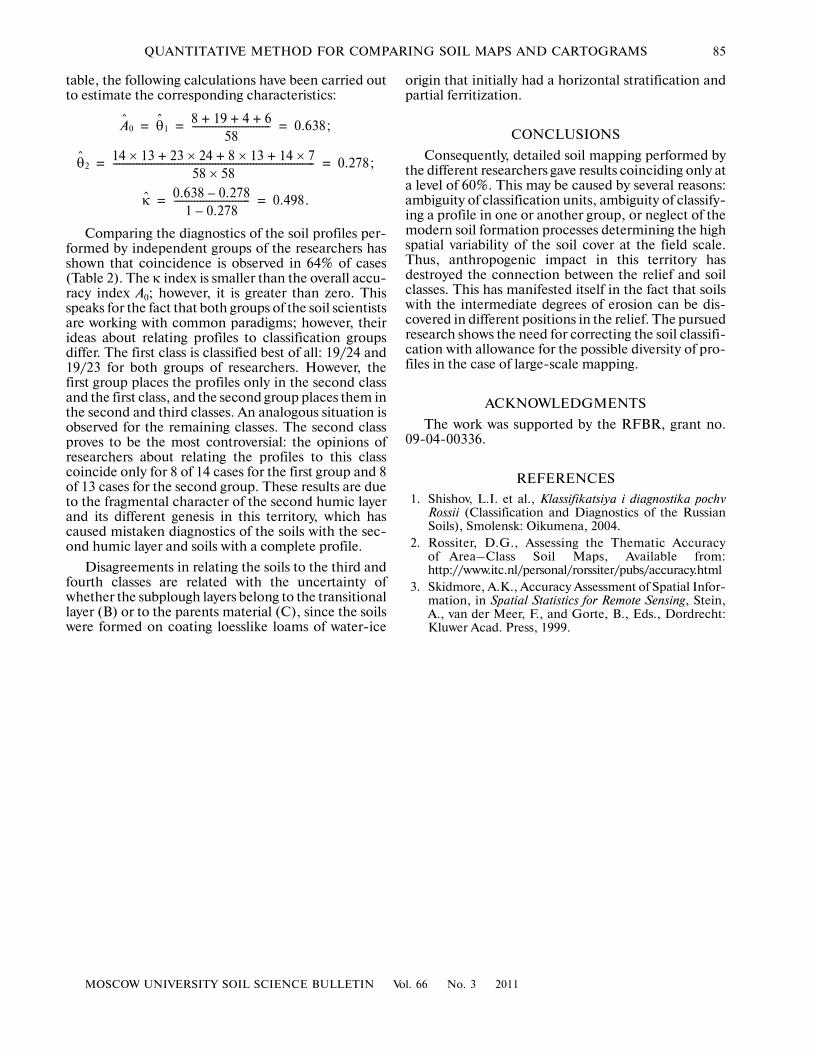
table, the following calculations have been carried outto estimate the corresponding characteristics:
Comparing the diagnostics of the soil profiles per�formed by independent groups of the researchers hasshown that coincidence is observed in 64% of cases(Table 2). The κ index is smaller than the overall accu�racy index A0; however, it is greater than zero. Thisspeaks for the fact that both groups of the soil scientistsare working with common paradigms; however, theirideas about relating profiles to classification groupsdiffer. The first class is classified best of all: 19/24 and19/23 for both groups of researchers. However, thefirst group places the profiles only in the second classand the first class, and the second group places them inthe second and third classes. An analogous situation isobserved for the remaining classes. The second classproves to be the most controversial: the opinions ofresearchers about relating the profiles to this classcoincide only for 8 of 14 cases for the first group and 8of 13 cases for the second group. These results are dueto the fragmental character of the second humic layerand its different genesis in this territory, which hascaused mistaken diagnostics of the soils with the sec�ond humic layer and soils with a complete profile.
Disagreements in relating the soils to the third andfourth classes are related with the uncertainty ofwhether the subplough layers belong to the transitionallayer (B) or to the parents material (C), since the soilswere formed on coating loesslike loams of water�ice
origin that initially had a horizontal stratification andpartial ferritization.
CONCLUSIONS
Consequently, detailed soil mapping performed bythe different researchers gave results coinciding only ata level of 60%. This may be caused by several reasons:ambiguity of classification units, ambiguity of classify�ing a profile in one or another group, or neglect of themodern soil formation processes determining the highspatial variability of the soil cover at the field scale.Thus, anthropogenic impact in this territory hasdestroyed the connection between the relief and soilclasses. This has manifested itself in the fact that soilswith the intermediate degrees of erosion can be dis�covered in different positions in the relief. The pursuedresearch shows the need for correcting the soil classifi�cation with allowance for the possible diversity of pro�files in the case of large�scale mapping.
ACKNOWLEDGMENTS
The work was supported by the RFBR, grant no.09�04�00336.
REFERENCES
1. Shishov, L.I. et al., Klassifikatsiya i diagnostika pochvRossii (Classification and Diagnostics of the RussianSoils), Smolensk: Oikumena, 2004.
2. Rossiter, D.G., Assessing the Thematic Accuracyof Area–Class Soil Maps, Available from:http://www.itc.nl/personal/rorssiter/pubs/accuracy.html
3. Skidmore, A.K., Accuracy Assessment of Spatial Infor�mation, in Spatial Statistics for Remote Sensing, Stein,A., van der Meer, F., and Gorte, B., Eds., Dordrecht:Kluwer Acad. Press, 1999.
A0 θ18 19 4 6+ + +
58��������������������������� 0.638;= = =
θ214 13× 23 24 8 13 14 7×+×+×+
58 58��������������������������������������������������������������������� 0.278;= =
κ0.638 0.278–
1 0.278–�������������������������� 0.498.= =